
Influence of Y Doping on Catalytic Activity of CeO2, MnOx, and CeMnOx Catalysts for Selective Catalytic Reduction of NO by NH3
 , , , , , , and
Abstract
:
1. Introduction
2. Results and Discussion
2.1. Textural Characteristics
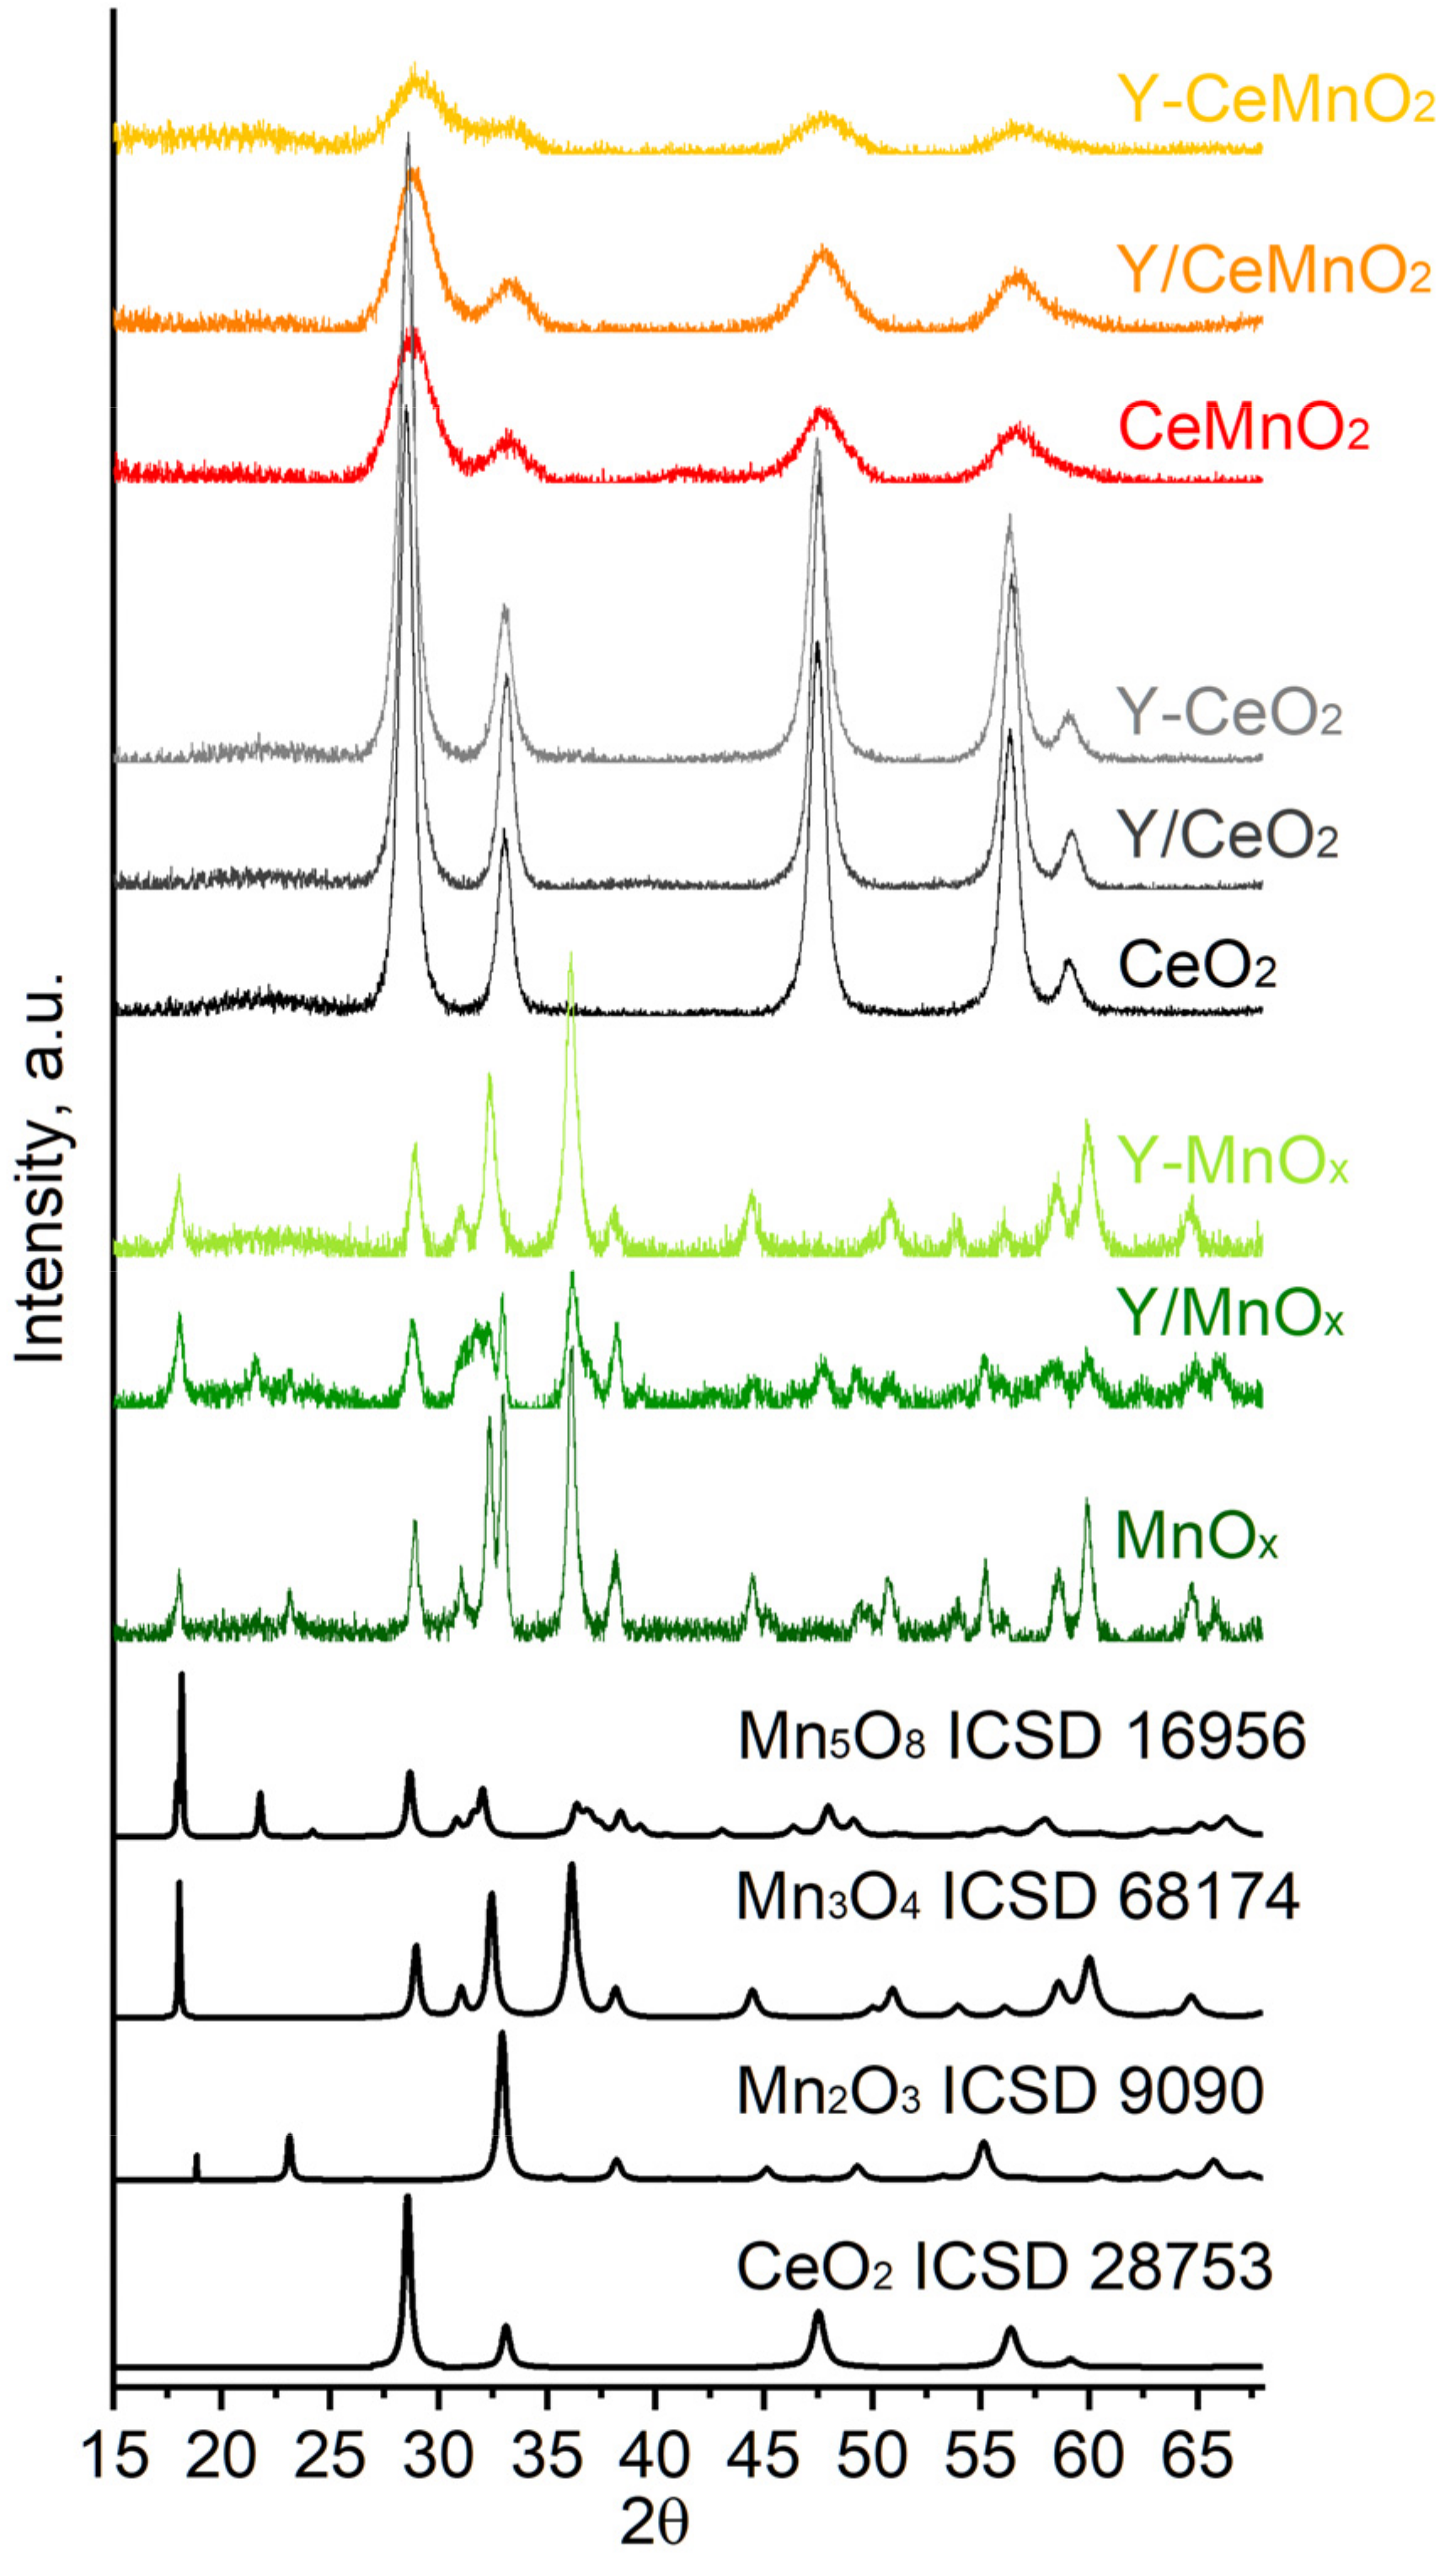
2.2. XRD Analysis
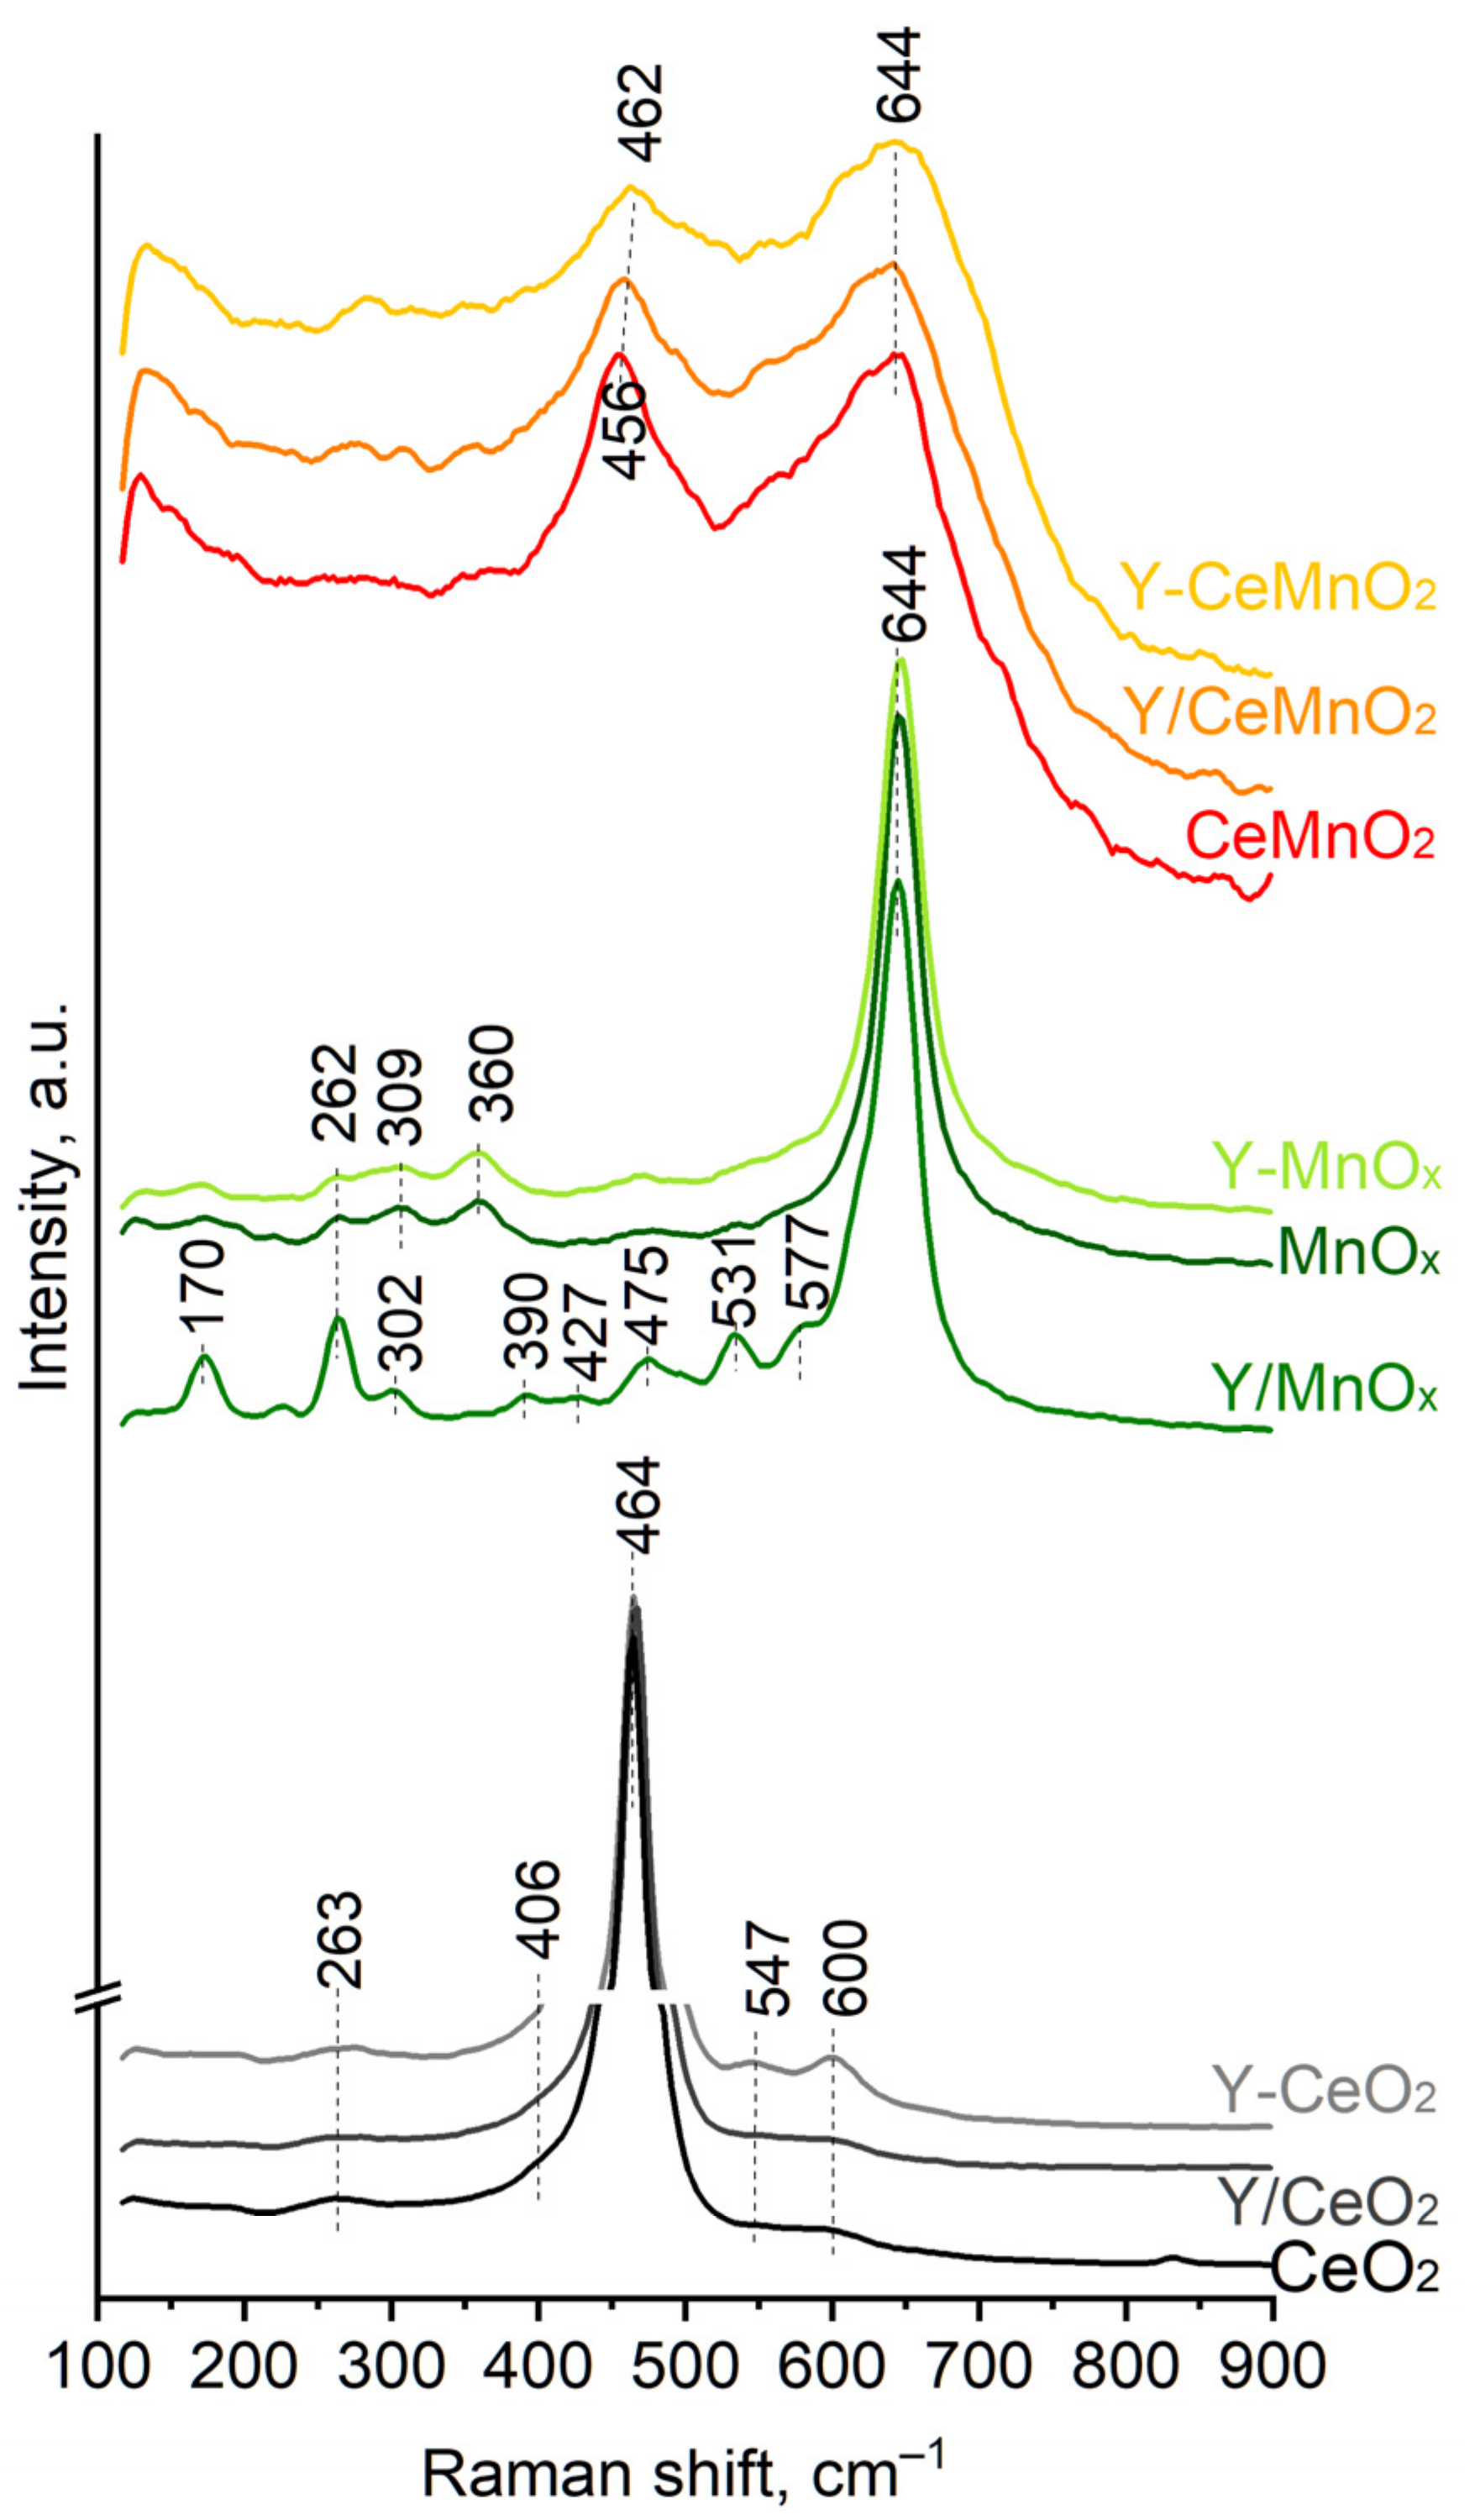
2.3. Raman Spectroscopy
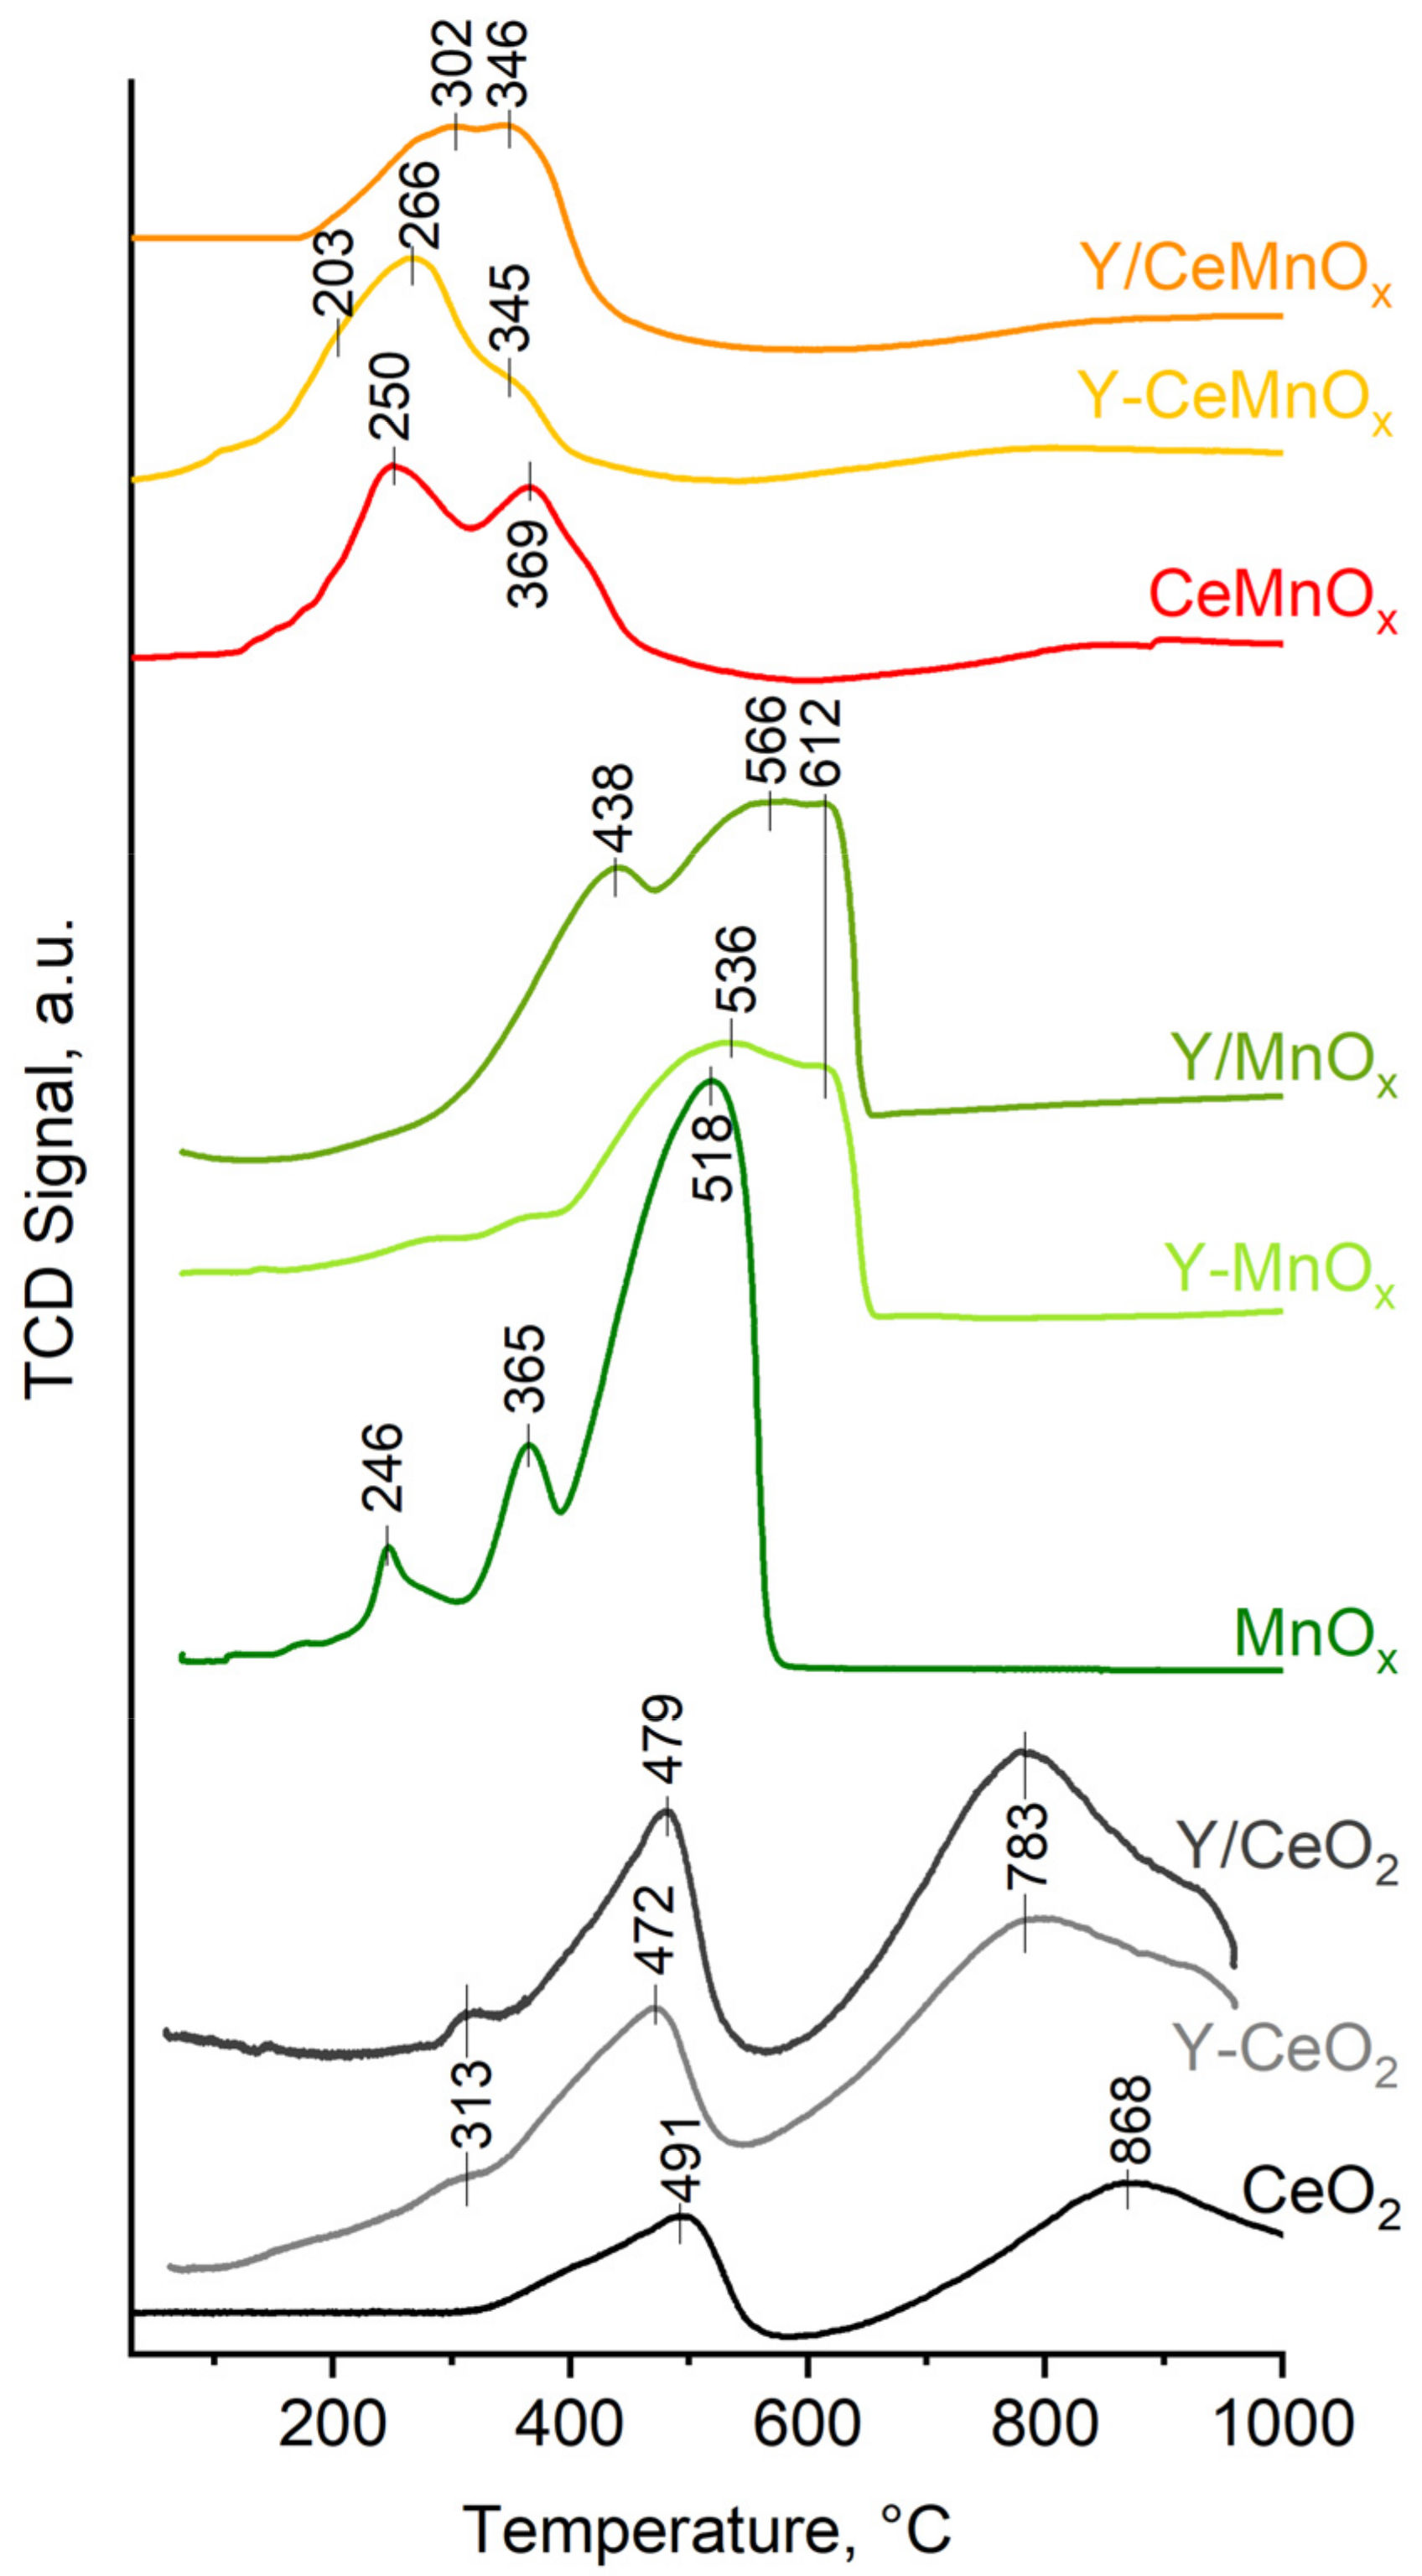
2.4. H2-TPR
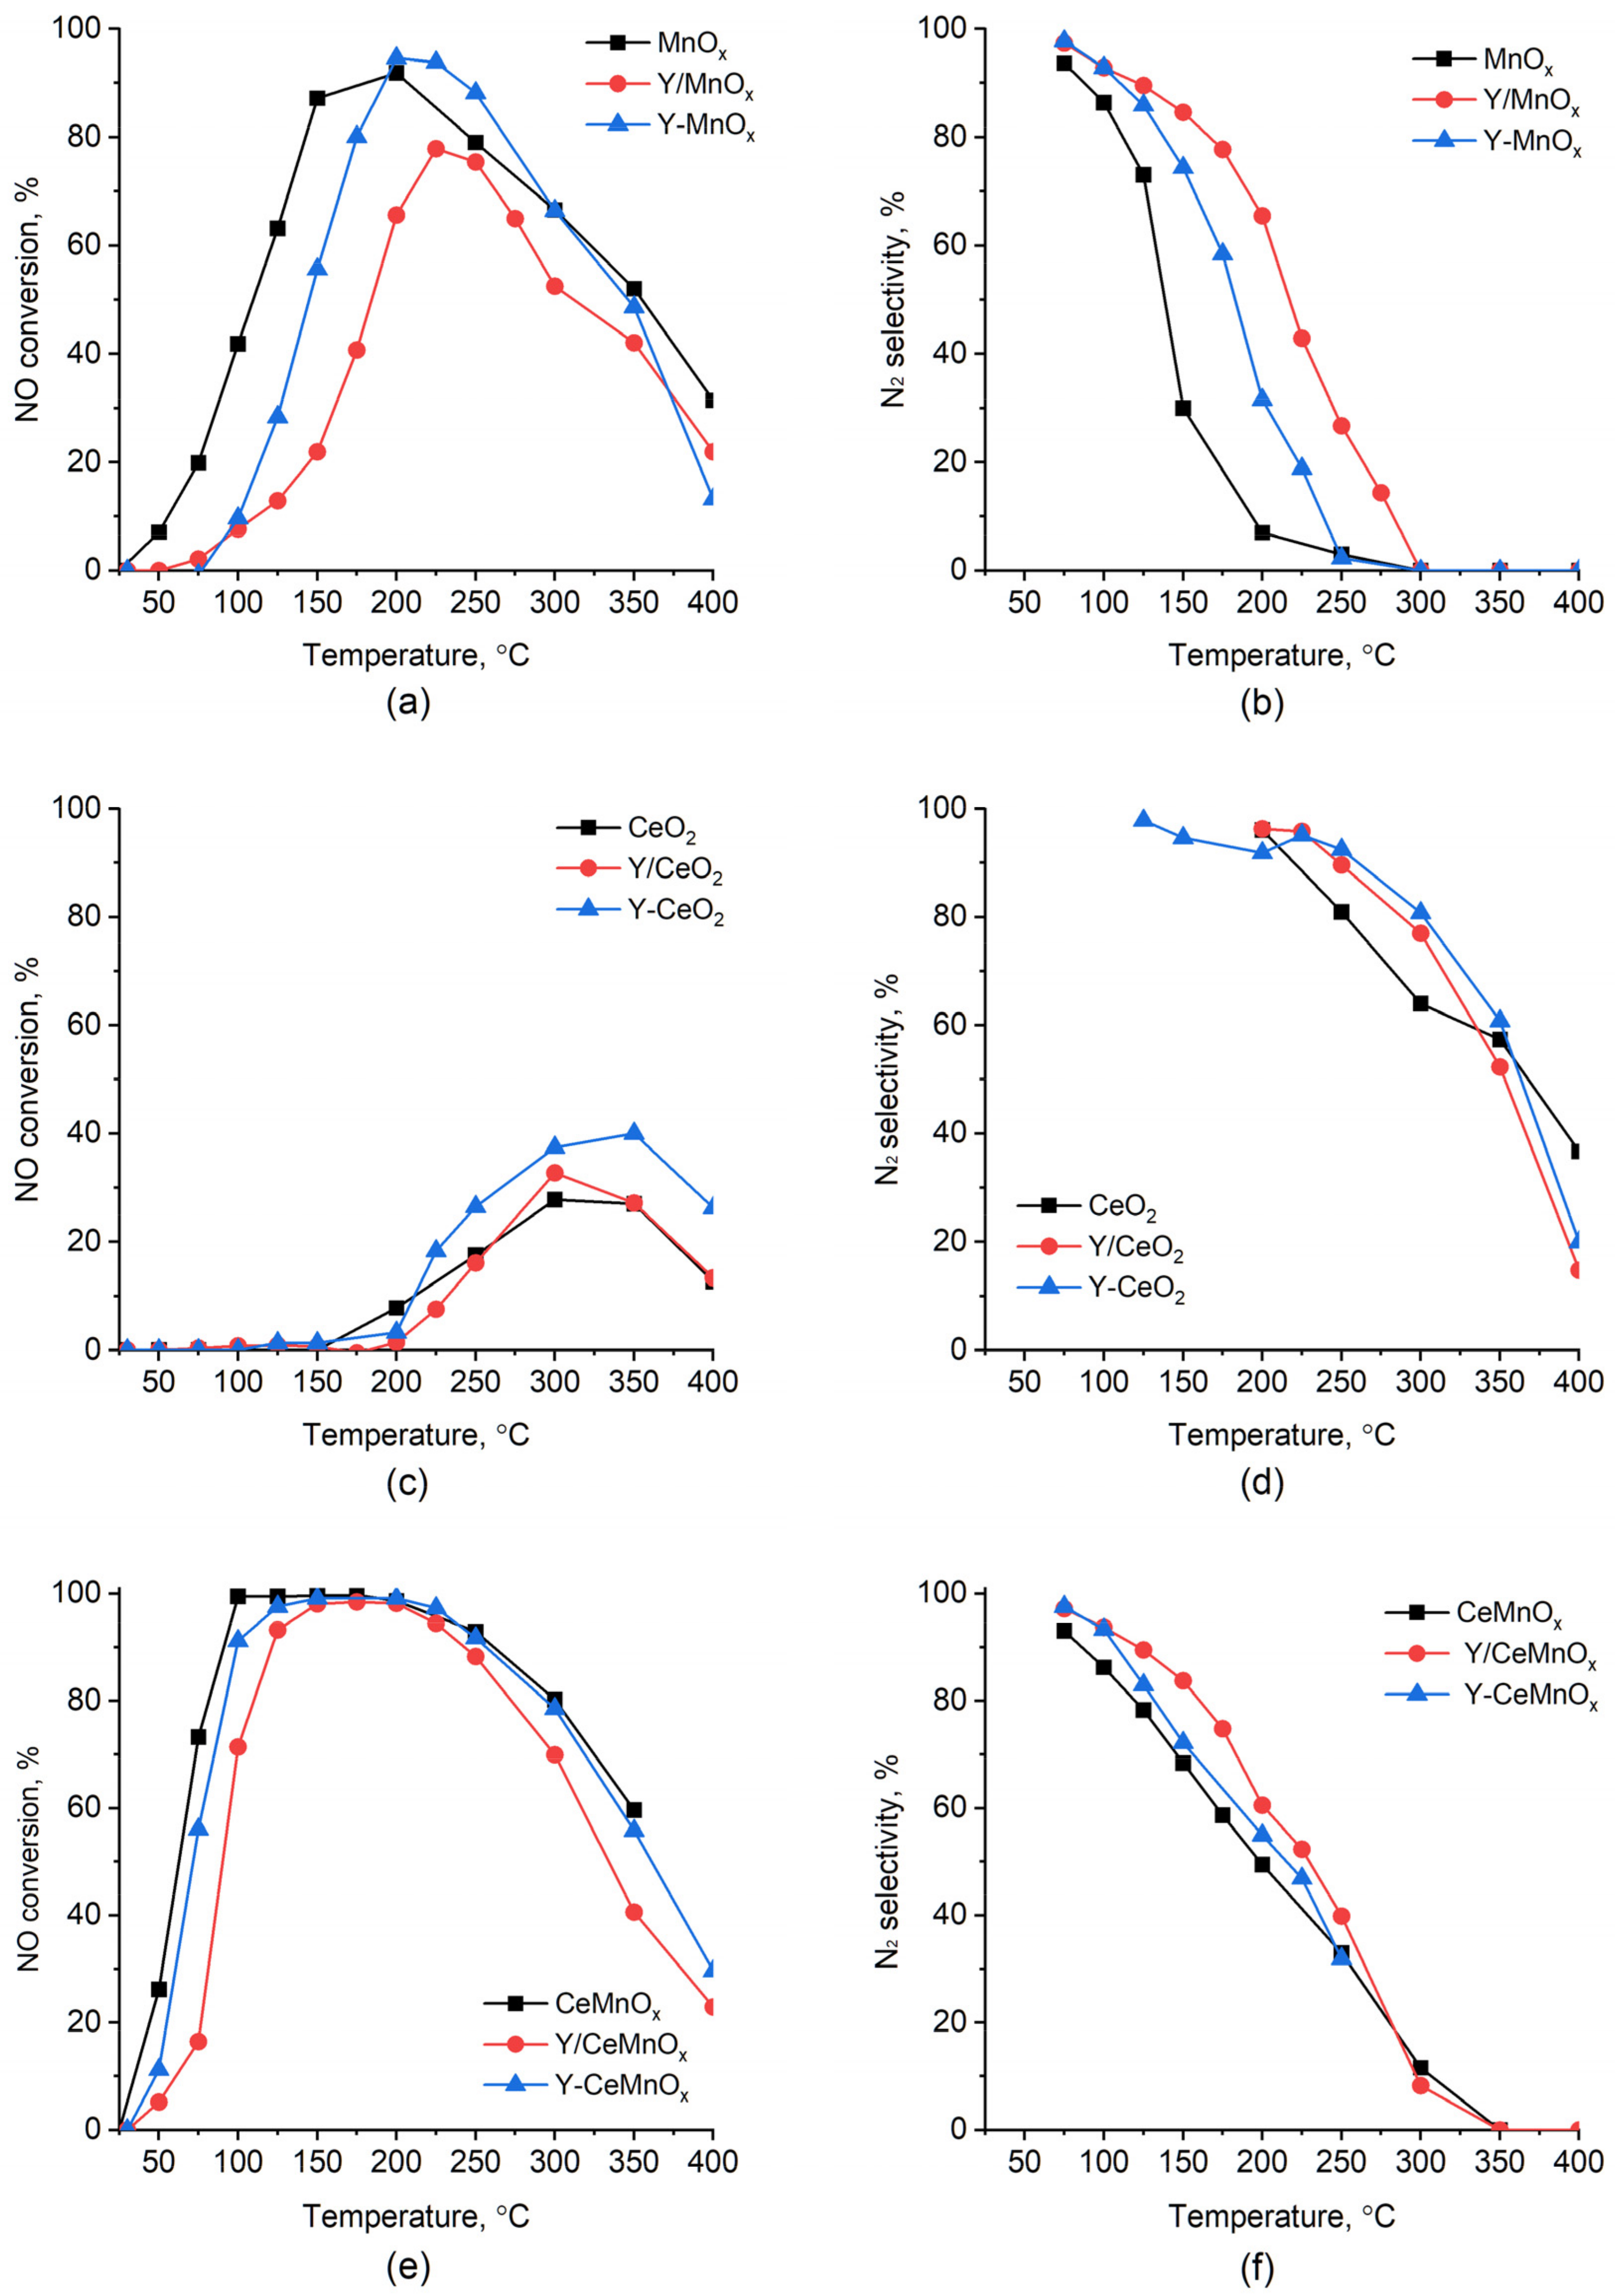
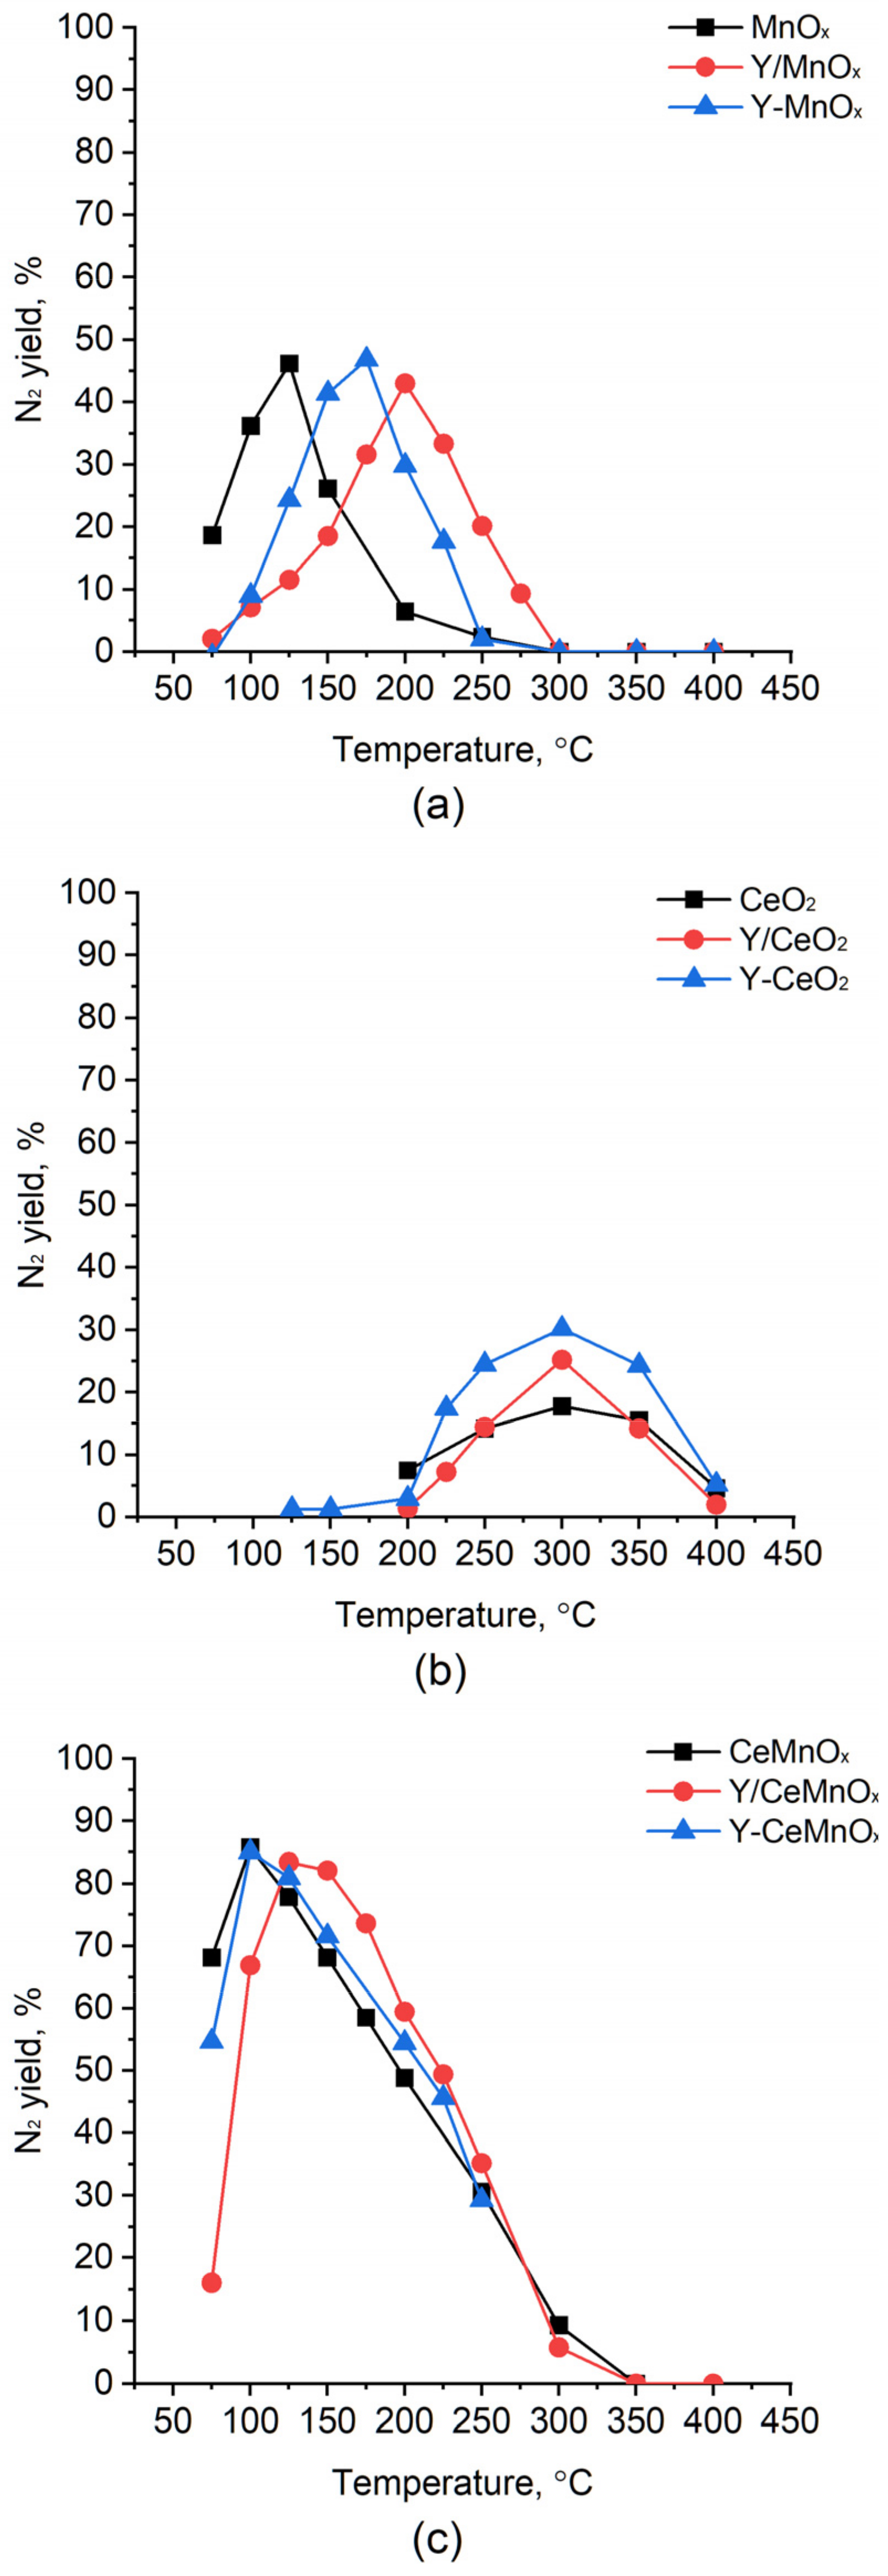
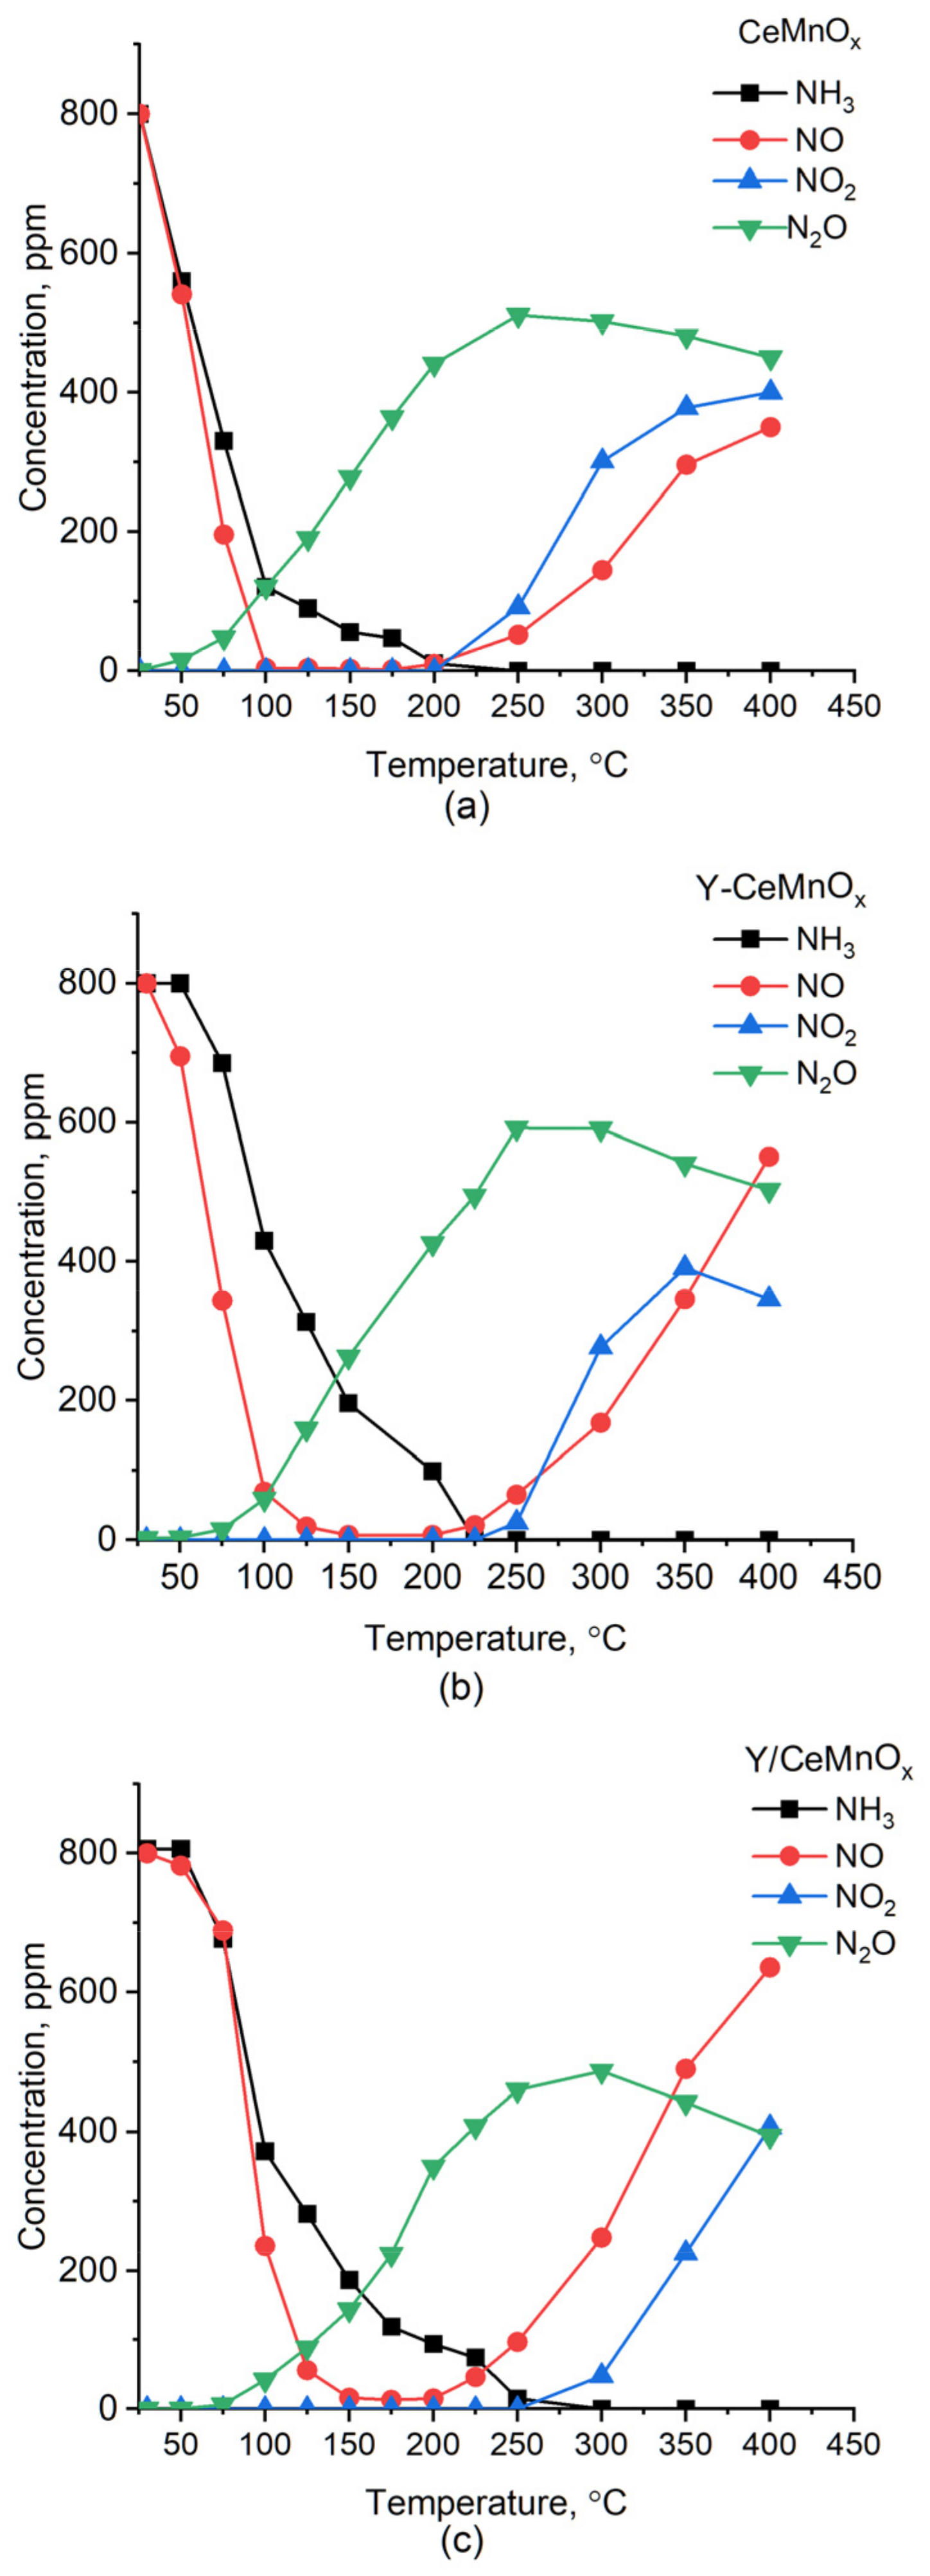
2.5. Catalytic Performance
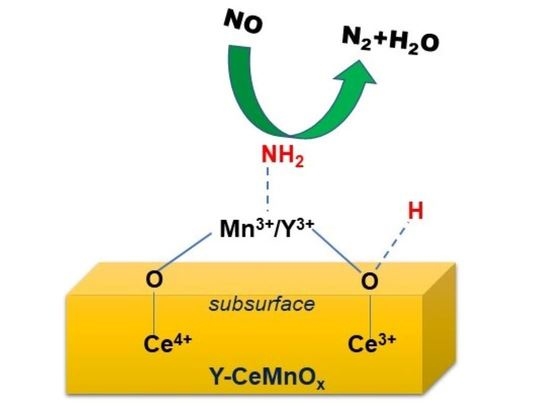
2.6. Role of Redox Properties and Surface Acidity
3. Materials and Methods
3.1. Sample Preparation
3.1.1. Sample Preparation Using Sol-Gel Citrate Method
3.1.2. Sample Modification Using Impregnation Technique
3.2. Characterization
3.2.1. Low-Temperature Nitrogen Adsorption/Desorption
3.2.2. XRD
3.2.3. Raman Spectroscopy
3.2.4. Transmission Electron Microscopy
3.2.5. H2-TPR
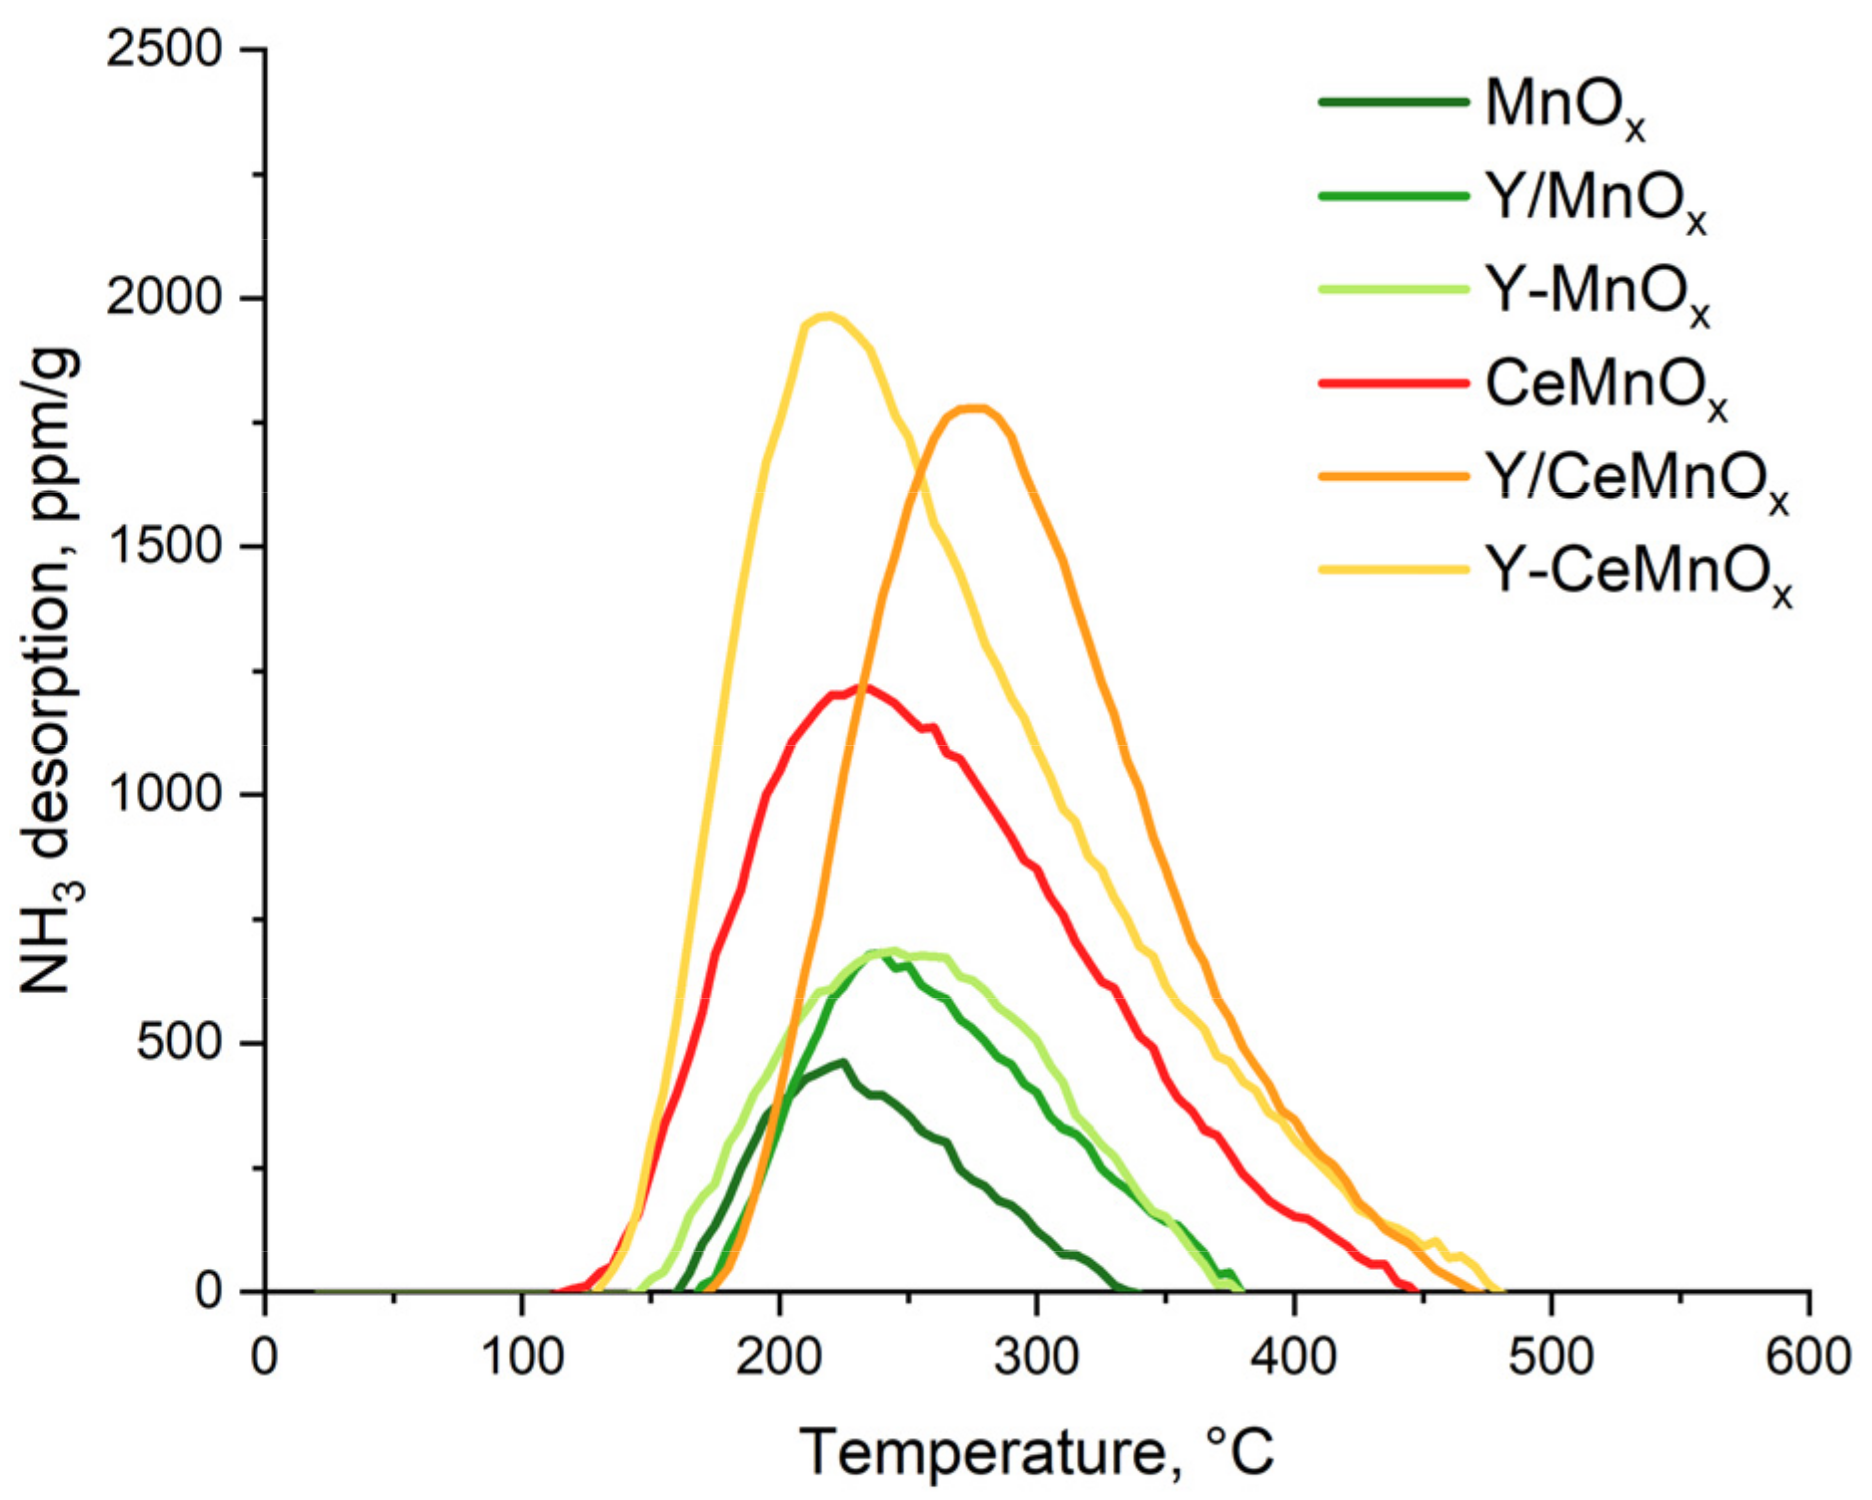
3.2.6. NH3-TPD
3.3. Activity Tests in SCR of NO by NH3
4. Conclusions
Supplementary Materials
Author Contributions
Funding
Data Availability Statement
Acknowledgments
Conflicts of Interest
References
- Gómez-García, M.A.; Pitchon, V.; Kiennemann, A. Pollution by Nitrogen Oxides: An Approach to NOx Abatement by Using Sorbing Catalytic Materials. Environ. Int. 2005, 31, 445–467. [Google Scholar] [CrossRef]
- Reşitoʇlu, I.A.; Altinişik, K.; Keskin, A. The Pollutant Emissions from Diesel-Engine Vehicles and Exhaust Aftertreatment Systems. Clean Technol. Environ. Policy 2015, 17, 15–27. [Google Scholar] [CrossRef]
- Flagiello, D.; Esposito, M.; Di Natale, F.; Salo, K. A Novel Approach to Reduce the Environmental Footprint of Maritime Shipping. J. Mar. Sci. Appl. 2021, 20, 229–247. [Google Scholar] [CrossRef]
- Chmielewski, A.G.; Sun, Y.; Zimek, Z.; Bułka, S.; Licki, J. Mechanism of NOx removal by electron beam process in the presence of scavengers. Radiat. Phys. Chem. 2002, 65, 397–403. [Google Scholar] [CrossRef]
- Wang, S.; Xu, S.; Gao, S.; Xiao, P.; Jiang, M.; Zhao, H.; Huang, B.; Liu, L.; Niu, H.; Wang, J.; et al. Simultaneous removal of SO2 and NOx from flue gas by low-temperature adsorption over activated carbon. Sci. Rep. 2021, 11, 11003. [Google Scholar] [CrossRef] [PubMed]
- Flagiello, D.; Di Natale, F.; Erto, A.; Lancia, A. Oxidative Scrubber for NOX Emission Control Using NaClO2 Aqueous Solutions. Chem. Eng. Trans. 2021, 86, 397–402. [Google Scholar] [CrossRef]
- Han, L.; Cai, S.; Gao, M.; Hasegawa, J.Y.; Wang, P.; Zhang, J.; Shi, L.; Zhang, D. Selective Catalytic Reduction of NOx with NH3 by Using Novel Catalysts: State of the Art and Future Prospects. Chem. Rev. 2019, 119, 10916–10976. [Google Scholar] [CrossRef]
- Alemany, L.J.; Berti, F.; Busca, G.; Ramis, G.; Robba, D.; Toledo, G.P.; Trombetta, M. Characterization and Composition of Commercial V2O5-WO3-TiO2 SCR Catalysts. Appl. Catal. B Environ. 1996, 10, 299–311. [Google Scholar] [CrossRef]
- Wu, H.; He, M.; Liu, W.; Jiang, L.; Cao, J.; Yang, C.; Yang, J.; Peng, J.; Liu, Y.; Liu, Q. Application of Manganese-Containing Soil as Novel Catalyst for Low-Temperature NH3-SCR of NO. J. Environ. Chem. Eng. 2021, 9, 105426. [Google Scholar] [CrossRef]
- Li, Y.; Zhang, Z.; Zhao, X.; Liu, Z.; Zhang, T.; Niu, X.; Zhu, Y. Effects of Nb-Modified CeVO4 to Form Surface Ce-O-Nb Bonds on Improving Low-Temperature NH3-SCR DeNOx Activity and Resistance to SO2 & H2O. Fuel 2023, 331, 125799. [Google Scholar] [CrossRef]
- Chen, L.; Liu, J.; Hu, W.; Gao, J.; Yang, J. Vanadium in Soil-Plant System: Source, Fate, Toxicity, and Bioremediation. J. Hazard. Mater. 2021, 405, 124200. [Google Scholar] [CrossRef] [PubMed]
- Ding, L.; Wang, Y.; Qian, L.; Qi, P.; Xie, M.; Long, H. Flue Gas DeNOxing Spent V2O5-WO3/TiO2 Catalyst: A Review of Deactivation Mechanisms and Current Disposal Status. Fuel 2023, 338, 127268. [Google Scholar] [CrossRef]
- Casapu, M.; Kröcher, O.; Elsener, M. Screening of Doped MnOx-CeO2 Catalysts for Low-Temperature NO-SCR. Appl. Catal. B Environ. 2009, 88, 413–419. [Google Scholar] [CrossRef]
- Shi, J.W.; Gao, C.; Liu, C.; Fan, Z.; Gao, G.; Niu, C. Porous MnOx for Low-Temperature NH3-SCR of NOx: The Intrinsic Relationship between Surface Physicochemical Property and Catalytic Activity. J. Nanoparticle Res. 2017, 19, 194. [Google Scholar] [CrossRef]
- Kapteijn, F.; Singoredjo, L.; Andreini, A.; Moulijn, J.A. Activity and Selectivity of Pure Manganese Oxides in the Selective Catalytic Reduction of Nitric Oxide with Ammonia. Appl. Catal. B Environ. 1994, 3, 173–189. [Google Scholar] [CrossRef]
- Kašpar, J.; Fornasiero, P.; Graziani, M. Use of CeO2-Based Oxides in the Three-Way Catalysis. Catal. Today 1999, 50, 285–298. [Google Scholar] [CrossRef]
- Sun, H.; Park, S.J. Recent Advances in MnOx/CeO2-Based Ternary Composites for Selective Catalytic Reduction of NOx by NH3: A Review. Catalysts 2021, 11, 1519. [Google Scholar] [CrossRef]
- Wu, X.; Yu, H.; Weng, D.; Liu, S.; Fan, J. Synergistic Effect between MnO and CeO2 in the Physical Mixture: Electronic Interaction and NO Oxidation Activity. J. Rare Earths 2013, 31, 1141–1147. [Google Scholar] [CrossRef]
- Wang, C.; Yu, F.; Zhu, M.; Tang, C.; Zhang, K.; Zhao, D.; Dong, L.; Dai, B. Highly Selective Catalytic Reduction of NOx by MnOx–CeO2–Al2O3 Catalysts Prepared by Self-Propagating High-Temperature Synthesis. J. Environ. Sci. 2019, 75, 124–135. [Google Scholar] [CrossRef]
- Qi, G.; Yang, R.T.; Chang, R. MnOx-CeO2 Mixed Oxides Prepared by Co-Precipitation for Selective Catalytic Reduction of NO with NH3 at Low Temperatures. Appl. Catal. B Environ. 2004, 51, 93–106. [Google Scholar] [CrossRef]
- Xu, L.; Li, X.S.; Crocker, M.; Zhang, Z.S.; Zhu, A.M.; Shi, C. A Study of the Mechanism of Low-Temperature SCR of NO with NH3 on MnOx/CeO2. J. Mol. Catal. A Chem. 2013, 378, 82–90. [Google Scholar] [CrossRef]
- Chen, L.; Ren, S.; Xing, X.; Yang, J.; Li, J.; Yang, J.; Liu, Q. Effect of MnO2 crystal types on CeO2@MnO2 oxides catalysts for low-temperature NH3-SCR. J. Environ. Chem. Eng. 2022, 10, 108239. [Google Scholar] [CrossRef]
- Chen, Z.; Ren, S.; Zhou, Y.; Li, X.; Wang, M.; Chen, L. Comparison of Mn doped CeO2 with different exposed facets for NH3-SCR at low temperature. J. Energy Inst. 2022, 105, 114–120. [Google Scholar] [CrossRef]
- Wu, Z.; Jin, R.; Liu, Y.; Wang, H. Ceria Modified MnOx/TiO2 as a Superior Catalyst for NO Reduction with NH3 at Low-Temperature. Catal. Commun. 2008, 9, 2217–2220. [Google Scholar] [CrossRef]
- Zhou, B.; Xi, K.; Fan, L.J.; Zhou, Y.; Wang, Y.; Zhu, Q.L.; Lu, H.F. A Comparative Study on Ce–Pr and Ce–Mn Mixed Oxide Catalysts toward Soot Catalytic Combustion. Appl. Catal. A Gen. 2018, 562, 1–10. [Google Scholar] [CrossRef]
- Jiang, Z.; Chen, C.; Ma, M.; Guo, Z.; Yu, Y.; He, C. Rare-Earth Element Doping-Promoted Toluene Low-Temperature Combustion over Mesostructured CuMCeO: X (M = Y, Eu, Ho, and Sm) Catalysts: The Indispensable Role of in Situ Generated Oxygen Vacancies. Catal. Sci. Technol. 2018, 8, 5933–5942. [Google Scholar] [CrossRef]
- Zhang, S.; Liu, X.; Zhong, Q.; Yao, Y. Effect of y Doping on Oxygen Vacancies of TiO2 Supported MnOX for Selective Catalytic Reduction of NO with NH3 at Low Temperature. Catal. Commun. 2012, 25, 7–11. [Google Scholar] [CrossRef]
- La Greca, E.; Kharlamova, T.S.; Grabchenko, M.V.; Consentino, L.; Savenko, D.Y.; Pantaleo, G.; Kibis, L.S.; Stonkus, O.A.; Vodyankina, O.V.; Liotta, L.F. Ag Catalysts Supported on CeO2, MnO2 and CeMnOx Mixed Oxides for Selective Catalytic Reduction of NO by C3H6. Nanomaterials 2023, 13, 873. [Google Scholar] [CrossRef] [PubMed]
- Huang, H.; Liu, J.; Sun, P.; Ye, S.; Liu, B. Effects of Mn-Doped Ceria Oxygen-Storage Material on Oxidation Activity of Diesel Soot. RSC Adv. 2017, 7, 7406–7412. [Google Scholar] [CrossRef]
- Murugan, B.; Ramaswamy, A.V.; Srinivas, D.; Gopinath, C.S.; Ramaswamy, V. Nature of Manganese Species in Ce1-xMnxO2-δ Solid Solutions Synthesized by the Solution Combustion Route. Chem. Mater. 2005, 17, 3983–3993. [Google Scholar] [CrossRef]
- Yang, X.; Wang, X.; Zhang, G.; Zheng, J.; Wang, T.; Liu, X.; Shu, C.; Jiang, L.; Wang, C. Enhanced Electrocatalytic Performance for Methanol Oxidation of Pt Nanoparticles on Mn3O4-Modified Multi-Walled Carbon Nanotubes. Int. J. Hydrogen Energy 2012, 37, 11167–11175. [Google Scholar] [CrossRef]
- Larbi, T.; Doll, K.; Manoubi, T. Density Functional Theory Study of Ferromagnetically and Ferrimagnetically Ordered Spinel Oxide Mn3O4. A Quantum Mechanical Simulation of Their IR and Raman Spectra. J. Alloys Compd. 2016, 688, 692–698. [Google Scholar] [CrossRef]
- Gao, T.; Fjellvåg, H.; Norby, P. A Comparison Study on Raman Scattering Properties of α- and β-MnO2. Anal. Chim. Acta 2009, 648, 235–239. [Google Scholar] [CrossRef] [PubMed]
- Julien, C.M.; Massot, M.; Poinsignon, C. Lattice Vibrations of Manganese Oxides: Part I. Periodic Structures. Spectrochim. Acta Part A Mol. Biomol. Spectrosc. 2004, 60, 689–700. [Google Scholar] [CrossRef] [PubMed]
- Gao, T.; Norby, P.; Krumeich, F.; Okamoto, H.; Nesper, R.; Fjellvåg, H. Synthesis and Properties of Layered-Structured Mn5O8 Nanorods. J. Phys. Chem. C 2010, 114, 922–928. [Google Scholar] [CrossRef]
- Schilling, C.; Hofmann, A.; Hess, C.; Ganduglia-Pirovano, M.V. Raman Spectra of Polycrystalline CeO2: A Density Functional Theory Study. J. Phys. Chem. C 2017, 121, 20834–20849. [Google Scholar] [CrossRef]
- Schilling, C.; Ganduglia-Pirovano, M.V.; Hess, C. Experimental and Theoretical Study on the Nature of Adsorbed Oxygen Species on Shaped Ceria Nanoparticles. J. Phys. Chem. Lett. 2018, 9, 6593–6598. [Google Scholar] [CrossRef]
- Taniguchi, T.; Watanabe, T.; Sugiyama, N.; Subramani, A.K.; Wagata, H.; Matsushita, N.; Yoshimura, M. Identifying Defects in Ceria-Based Nanocrystals by UV Resonance Raman Spectroscopy. J. Phys. Chem. C 2009, 113, 19789–19793. [Google Scholar] [CrossRef]
- Nakajima, A.; Yoshihara, A.; Ishigame, M. Defect-Induced Raman Spectra in Doped CeO2. Phys. Rev. B 1994, 50, 13297–13307. [Google Scholar] [CrossRef]
- Derevyannikova, E.A.; Kardash, T.Y.; Kibis, L.S.; Slavinskaya, E.M.; Svetlichnyi, V.A.; Stonkus, O.A.; Ivanova, A.S.; Boronin, A.I. The Structure and Catalytic Properties of Rh-Doped CeO2 Catalysts. Phys. Chem. Chem. Phys. 2017, 19, 31883–31897. [Google Scholar] [CrossRef]
- Grabchenko, M.V.; Mamontov, G.V.; Zaikovskii, V.I.; La Parola, V.; Liotta, L.F.; Vodyankina, O.V. Design of Ag-CeO2/SiO2 Catalyst for Oxidative Dehydrogenation of Ethanol: Control of Ag–CeO2 Interfacial Interaction. Catal. Today 2019, 333, 2–9. [Google Scholar] [CrossRef]
- Ilieva, L.; Venezia, A.M.; Petrova, P.; Pantaleo, G.; Liotta, L.F.; Zanella, R.; Kaszkur, Z.; Tabakova, T. Effect of Y Modified Ceria Support in Mono and Bimetallic Pd-Au Catalysts for Complete Benzene Oxidation. Catalysts 2018, 8, 283. [Google Scholar] [CrossRef]
- Trawczyński, J.; Bielak, B.; Miśta, W. Oxidation of Ethanol over Supported Manganese Catalysts—Effect of the Carrier. Appl. Catal. B Environ. 2005, 55, 277–285. [Google Scholar] [CrossRef]
- Stobbe, E.R.; De Boer, B.A.; Geus, J.W. The Reduction and Oxidation Behaviour of Manganese Oxides. Catal. Today 1999, 47, 161–167. [Google Scholar] [CrossRef]
- Zhan, S.; Zhu, D.; Qiu, M.; Li, Y. Highly efficient Removal of NO with Ordered Mesoporous Manganese Oxide at Low Temperature. RSC Adv. 2015, 5, 29353–29361. [Google Scholar] [CrossRef]
- Ye, Q.; Zhao, J.; Huo, F.; Wang, J.; Cheng, S.; Kang, T.; Dai, H. Nanosized Ag/α-MnO2 Catalysts Highly Active for the Low-Temperature Oxidation of Carbon Monoxide and Benzene. Catal. Today 2011, 175, 603–609. [Google Scholar] [CrossRef]
- Tang, X.; Chen, J.; Li, Y.; Li, Y.; Xu, Y.; Shen, W. Complete Oxidation of Formaldehyde over Ag/MnOx–CeO2 Catalysts. Chem. Eng. J. 2006, 118, 119–125. [Google Scholar] [CrossRef]
- Wang, K.; Liu, X.; Tu, S.; Zhang, L.; Li, W.; Jiang, C.; Ye, D. Low Temperature Catalytic Performance of Manganese and Cerium Complex Oxide Catalyst towards Toluene. IOP Conf. Ser. Mater. Sci. Eng. 2020, 729, 012069. [Google Scholar] [CrossRef]
- Consentino, L.; Pantaleo, G.; Parola, V.L.; Migliore, C.; Greca, E.L.; Liotta, L.F. NH3-NO SCR Catalysts for Engine Exhaust Gases Abatement: Replacement of Toxic V2O5 with MnOx to Improve the Environmental Sustainability. Top. Catal. 2022, 1–10. [Google Scholar] [CrossRef]
- Gao, F.; Liu, Y.; Sani, Z.; Tang, X.; Yi, H.; Zhao, S.; Yu, Q.; Zhou, Y. Advances in Selective Catalytic Oxidation of Ammonia (NH3-SCO) to Dinitrogen in Excess Oxygen: A Review on Typical Catalysts, Catalytic Performances and Reaction Mechanisms. J. Environ. Chem. Eng. 2021, 9, 104575. [Google Scholar] [CrossRef]
- Yang, S.; Liao, Y.; Xiong, S.; Qi, F.; Dang, H.; Xiao, X.; Li, J. N2 Selectivity of NO Reduction by NH3 over MnOx-CeO2: Mechanism and Key Factors. J. Phys. Chem. C 2014, 118, 21500–21508. [Google Scholar] [CrossRef]
- Liao, Y.; Liu, Z.; Li, Z.; Gao, G.; Ji, L.; Xu, H.; Huang, W.; Qu, Z.; Yan, N. The Unique CO Activation Effects for Boosting NH3 Selective Catalytic Oxidation over CuOx–CeO2. Environ. Sci. Technol. 2022, 56, 10402–10411. [Google Scholar] [CrossRef]
- Jiang, Y.; Han, D.; Yang, L.; Yang, Z.; Ge, H.; Lin, R.; Wang, X. Improving the K resistance effectively of CeO2-TiO2 catalyst by Nb doping for NH3-SCR reaction. Process Saf. Environ. Prot. 2022, 160, 876–886. [Google Scholar] [CrossRef]
- Lee, S.M.; Park, K.H.; Hong, S.C. MnOx/CeO2-TiO2 Mixed Oxide Catalysts for the Selective Catalytic Reduction of NO with NH3 at Low Temperature. Chem. Eng. J. 2012, 195–196, 323–331. [Google Scholar] [CrossRef]
- Kharlamova, T.S.; Timofeev, K.L.; Salaev, M.A.; Svetlichnyi, V.A.; Vodyankina, O.V. Monolayer MgVOx/Al2O3 catalysts for propane oxidative dehydrogenation: Insights into a role of structural, redox, and acid-base properties in catalytic performance. Appl. Catal. A 2020, 598, 117574. [Google Scholar] [CrossRef]
- Zhang, Y.; Zhou, Y.; Shi, J.; Zhou, S.; Zhang, Z.; Zhang, S.; Guo, M. Propane Dehydrogenation over PtSnNa/La-Doped Al2O3 Catalyst: Effect of La Content. Fuel Process. Technol. 2013, 111, 94–104. [Google Scholar] [CrossRef]
- Inomata, Y.; Mino, M.; Hata, S.; Kiyonaga, E.; Morita, K.; Hikino, K.; Yoshida, K.; Haruta, M.; Murayama, T. Low-temperature NH3-SCR Activity of Nanoparticulate Gold Supported on a Metal Oxide. J. Japan Pet. Inst. 2019, 62, 234–243. [Google Scholar] [CrossRef]


| Sample | Content (wt.%) | Ce/Mn | SSA (m2/g) | V (cm3/g) | ||
|---|---|---|---|---|---|---|
| Y | Ce | Mn | ||||
| CeO2 | - | 80.6 | - | - | 40 | 0.14 |
| Y/CeO2 | 2.7 | 78.6 | - | - | 32 | 0.13 |
| Y-CeO2 | 1.8 | 79.5 | - | - | 43 | 0.16 |
| MnOx | - | - | 72.7 | - | 14 | 0.12 |
| Y/MnOx | 3.3 | - | 66.8 | - | 9 | 0.10 |
| Y-MnOx | 3.0 | - | 69.3 | - | 19 | 0.16 |
| CeMnOx | - | 58.9 | 22.6 | 1.2 | 59 | 0.24 |
| Y/CeMnOx | 2.8 | 56.8 | 21.8 | 1.2 | 50 | 0.21 |
| Y-CeMnOx | 2.1 | 57.8 | 19.0 | 1.2 | 62 | 0.24 |
| Sample | Phase Composition | Structural Parameters | DXRD, nm | ||||||
|---|---|---|---|---|---|---|---|---|---|
| Phase | wt.% | S.G. | Symmetry | a, Å | b, Å | c, Å | β, ° | ||
| CeO2 | fluorite | 100 | Fm-3m | cubic | 5.41 | 5.41 | 5.41 | 90 | 18 |
| Y/CeO2 | fluorite | 100 | Fm-3m | cubic | 5.40 | 5.40 | 5.40 | 90 | 18 |
| Y-CeO2 | fluorite | 100 | Fm-3m | cubic | 5.41 | 5.41 | 5.41 | 90 | 15 |
| MnOx | Mn3O4 | 75 | I41/amd | tetragonal | 5.76 | 5.76 | 9.46 | 90 | 33 |
| Mn2O3 | 25 | Ia-3 | cubic | 9.41 | 9.41 | 9.41 | 90 | 61 | |
| Y/MnOx | Mn3O4 | 34 | I41/amd | tetragonal | 5.76 | 5.76 | 9.47 | 90 | 48 |
| Mn2O3 | 11 | Ia-3 | cubic | 9.42 | 9.42 | 9.42 | 90 | 64 | |
| Mn5O8 | 55 | C12/m1 | monoclinic | 10.42 | 5.73 | 4.87 | 109.9 | 24 | |
| Y-MnOx | Mn3O4 | 100 | I41/amd | tetragonal | 5.76 | 5.76 | 9.45 | 90 | 28 |
| CeMnOx | fluorite | 100 | Fm-3m | cubic | 5.38 | 5.38 | 5.38 | 90 | 5 |
| Y/CeMnOx | fluorite | 100 | Fm-3m | cubic | 5.38 | 5.38 | 5.38 | 90 | 5 |
| Y-CeMnOx | fluorite | 100 | Fm-3m | cubic | 5.38 | 5.38 | 5.38 | 90 | 4 |
| Sample | T (°C) | NH3 Desorbed (µmol g−1) |
|---|---|---|
| MnOx | 225 | 52 |
| Y-MnOx | 245 | 105 |
| Y/MnOx | 240 | 89 |
| CeMnOx | 235 | 243 |
| Y-CeMnOx | 225 | 370 |
| Y/CeMnOx | 280 | 318 |
Disclaimer/Publisher’s Note: The statements, opinions and data contained in all publications are solely those of the individual author(s) and contributor(s) and not of MDPI and/or the editor(s). MDPI and/or the editor(s) disclaim responsibility for any injury to people or property resulting from any ideas, methods, instructions or products referred to in the content. |
© 2023 by the authors. Licensee MDPI, Basel, Switzerland. This article is an open access article distributed under the terms and conditions of the Creative Commons Attribution (CC BY) license (https://creativecommons.org/licenses/by/4.0/).
Share and Cite
La Greca, E.; Kharlamova, T.S.; Grabchenko, M.V.; Svetlichnyi, V.A.; Pantaleo, G.; Consentino, L.; Stonkus, O.A.; Vodyankina, O.V.; Liotta, L.F. Influence of Y Doping on Catalytic Activity of CeO2, MnOx, and CeMnOx Catalysts for Selective Catalytic Reduction of NO by NH3. Catalysts 2023, 13, 901. https://doi.org/10.3390/catal13050901
La Greca E, Kharlamova TS, Grabchenko MV, Svetlichnyi VA, Pantaleo G, Consentino L, Stonkus OA, Vodyankina OV, Liotta LF. Influence of Y Doping on Catalytic Activity of CeO2, MnOx, and CeMnOx Catalysts for Selective Catalytic Reduction of NO by NH3. Catalysts. 2023; 13(5):901. https://doi.org/10.3390/catal13050901
Chicago/Turabian StyleLa Greca, Eleonora, Tamara S. Kharlamova, Maria V. Grabchenko, Valery A. Svetlichnyi, Giuseppe Pantaleo, Luca Consentino, Olga A. Stonkus, Olga V. Vodyankina, and Leonarda Francesca Liotta. 2023. "Influence of Y Doping on Catalytic Activity of CeO2, MnOx, and CeMnOx Catalysts for Selective Catalytic Reduction of NO by NH3" Catalysts 13, no. 5: 901. https://doi.org/10.3390/catal13050901