Article

Structure and Surface Behavior of Rh Complexes in Ionic Liquids Studied Using Angle-Resolved X-ray Photoelectron Spectroscopy

Lehrstuhl für Physikalische Chemie 2, Friedrich-Alexander-Universität Erlangen-Nürnberg, Egerlandstr. 3, 91058 Erlangen, Germany
*
Author to whom correspondence should be addressed.
Catalysts 2023, 13(5), 871; https://doi.org/10.3390/catal13050871
Submission received: 12 April 2023 / Revised: 3 May 2023 / Accepted: 4 May 2023 / Published: 11 May 2023
(This article belongs to the Special Issue Recent Developments in Rh Catalysts II)

Abstract

:
We present an ARXPS study on the surface composition and interfacial behavior of commercial [Rh(COD)2][TfO] in [C2C1Im][TfO], [C4C1Im][TfO], [C8C1Im][TfO], and [C2C1Im][EtOSO3]. The complex was found to be non-intact in a solution of these ILs through the loss of COD ligands, accompanied by the depletion of the metal center from the IL/vacuum interface. Increasing the chain length of the aliphatic substituent on the imidazolium cation of the [TfO]-based ILs led to a more pronounced depletion from the interface, due to the higher surface affinity of the solvent cations with the longer alkyl chains. The loss of COD ligands offered facile in situ ligand substitution with surface-active TPPTS to afford a moderate increase in the surface concentration of Rh. We propose the formation of a Schrock−Osborn-type catalyst [Rh(COD)(TPPTS)2][TfO]. Information on the surface composition and targeted design of the gas/IL interface is highly relevant for applications in IL-based catalytic systems, such as in supported ionic liquid phase (SILP) catalysis.

Graphical Abstract

1. Introduction

Ionic liquids (ILs) are low-melting salts representing an innovative class of solvents and electrolytes [1,2,3,4,5,6,7,8]. These compounds typically feature extremely low vapor pressures, high thermal stability, and wide electrochemical windows. One particularly fascinating aspect is the tuneability of their chemical structure, which allows for adjusting their physicochemical properties, such as miscibility, solvation, and coordination behavior, over a wide range. This adaptability gives rise to a rich spectrum of potential applications, e.g., in organic [5,6,9,10,11,12], organometallic [13,14,15], and nanoparticle synthesis [16,17,18], as well as in electrocatalysis [19,20,21], biocatalysis [22,23], and other fields of catalytic approaches. In terms of catalysis, the unique properties of ILs create novel concepts for heterogeneous and heterogenized systems [24,25]: The solid catalyst with an ionic liquid layer (SCILL) approach is based on coating a classical heterogeneous catalyst with a thin film of IL to mainly improve the selectivity of the process [26,27]. In supported ionic liquid phase (SILP) catalysis, a homogeneous catalyst is dissolved in a thin IL film, which is immobilized on an inert solid support material [28,29,30]. For both concepts, the interfacial behavior, that is, the structural and chemical properties at the solid/liquid, liquid/liquid, and/or liquid/gas interface of the IL film strongly influences the overall performance of the process [24].
Interfacial properties of IL-based materials have been intensively studied under ambient conditions by means of various spectroscopic, microscopic, and scattering techniques, such as sum frequency generation (SFG) [31,32,33,34], second harmonic generation (SHG) [35,36,37], atomic force microscopy (AFM) [38,39,40] and spectroscopy (AFS) [41], scanning tunnelling microscopy (STM) [39,40,42], and X-ray reflectivity (XRR) [43,44] techniques, to name a few. In addition, owing to the negligible volatility of ILs, ultra-high vacuum (UHV)-based surface science methods have also been successfully applied to access interfacial phenomena, for instance through low-energy ion scattering (LEIS) [45,46], mass spectrometry (MS) [47,48], high resolution electron energy loss spectroscopy (HREELS) [49], ultraviolet photoelectron spectroscopy (UPS) [49,50,51], metastable induced electron spectroscopy (MIES) [49,50], reactive atom scattering (RAS) [52,53,54], and UHV-based STM and AFM techniques [51,55,56,57,58,59].
X-ray photoelectron spectroscopy (XPS) has shown to be a particularly powerful tool for the analysis of the interface-near region of neat ILs [49,50,51,60,61,62,63,64,65,66], IL mixtures [67,68,69,70,71,72], and IL solutions [14,73,74,75,76,77,78,79]. With special interest in catalysis, significant effort has been dedicated to elucidate the nature and the interfacial behavior of organometallic complexes in IL solutions over recent years. Based on XPS core level shifts, it has been shown that the basicity of the IL anion has a significant influence on the electronic environment of the metal center [80,81], even affecting the reaction rate in catalyzed transformations [82]. In addition, the non-innocent character of IL cations has been reported, e.g., by coordination to the metal center forming N-heterocyclic carbene (NHC) complexes, [83] or via functional groups [14]. By performing angle-resolved XPS (ARXPS), a detailed structural picture of the IL/vacuum interface can be obtained, because in organic matter, the information depth (ID) decreases from 6–9 nm at 0° (normal electron emission), to 1.0–1.5 nm at an 80° (grazing electron emission) angle [84]. With ARXPS, preferential surface orientations and configurations, as well as the enrichment and depletion effects, are accessible [24,60,67,68,69,70,71,72,85,86,87,88,89], which has successfully been shown for IL-based catalyst solutions [14,73,74,75,76].
In this study, we address the composition and behavior at the IL/vacuum interface of the commercially available [Rh(COD)2][TfO] (COD = cyclooctadiene) metal complex in IL solution under well-defined UHV conditions using ARXPS. This metal complex is interesting for several reasons. (a) In an early study by Dupont et al. [90] on homogeneous catalysis in ILs, a [Rh(COD)2]+ catalyst showed a higher overall conversion in hydrogenation of cyclohexene than the more common Wilkinson catalyst. (b) Furthermore, [Rh(COD)2][TfO] was successfully employed for in situ preparation of Schrock−Osborn-type catalysts [Rh(COD)(L)2][TfO] (L = phosphine ligand) for asymmetric catalysis, through substitution of one of the COD ligands [91]. (c) As an ionic compound, [Rh(COD)2][TfO] promises high solubility in ILs, which should yield adequate signal intensities in XPS.
Our studies under vacuum conditions indicate that the dissolved catalyst loses COD ligands, which is accompanied by its depletion from the IL/vacuum interface. This behavior is observed for dissolving the catalyst in [C2C1Im][TfO], [C4C1Im][TfO], [C8C1Im][TfO], and [C2C1Im][EtOSO3]. Upon increasing the length of the aliphatic side chain on the imidazolium cation in the [TfO]-based solvent ILs, the depletion of the metal center from the interface is even more pronounced. This facile loss of COD from the initial complex opens an interesting route for modifying the complex, namely offering a surface-active ligand, such as trisodium 3,3′,3″-phosphanetriyltri(benzene-1-sulfonate) (TPPTS), which already has been shown to strongly increase the surface concentration of Rh complexes in a previous study [73]. We propose the formation of a Schrock−Osborn-type catalyst, as depicted in Scheme 1. Our ARXPS measurements indicate a particular enhancement in the Rh concentration at the IL/vacuum interface upon ligand substitution, and with that they also expand the surface-active character of the substituting ligand to this system. The structures of complexes and ILs employed in this work are shown in Figure 1, with color-coding referring to the assignment of XP signals to the molecular structures.

2. Results and Discussion

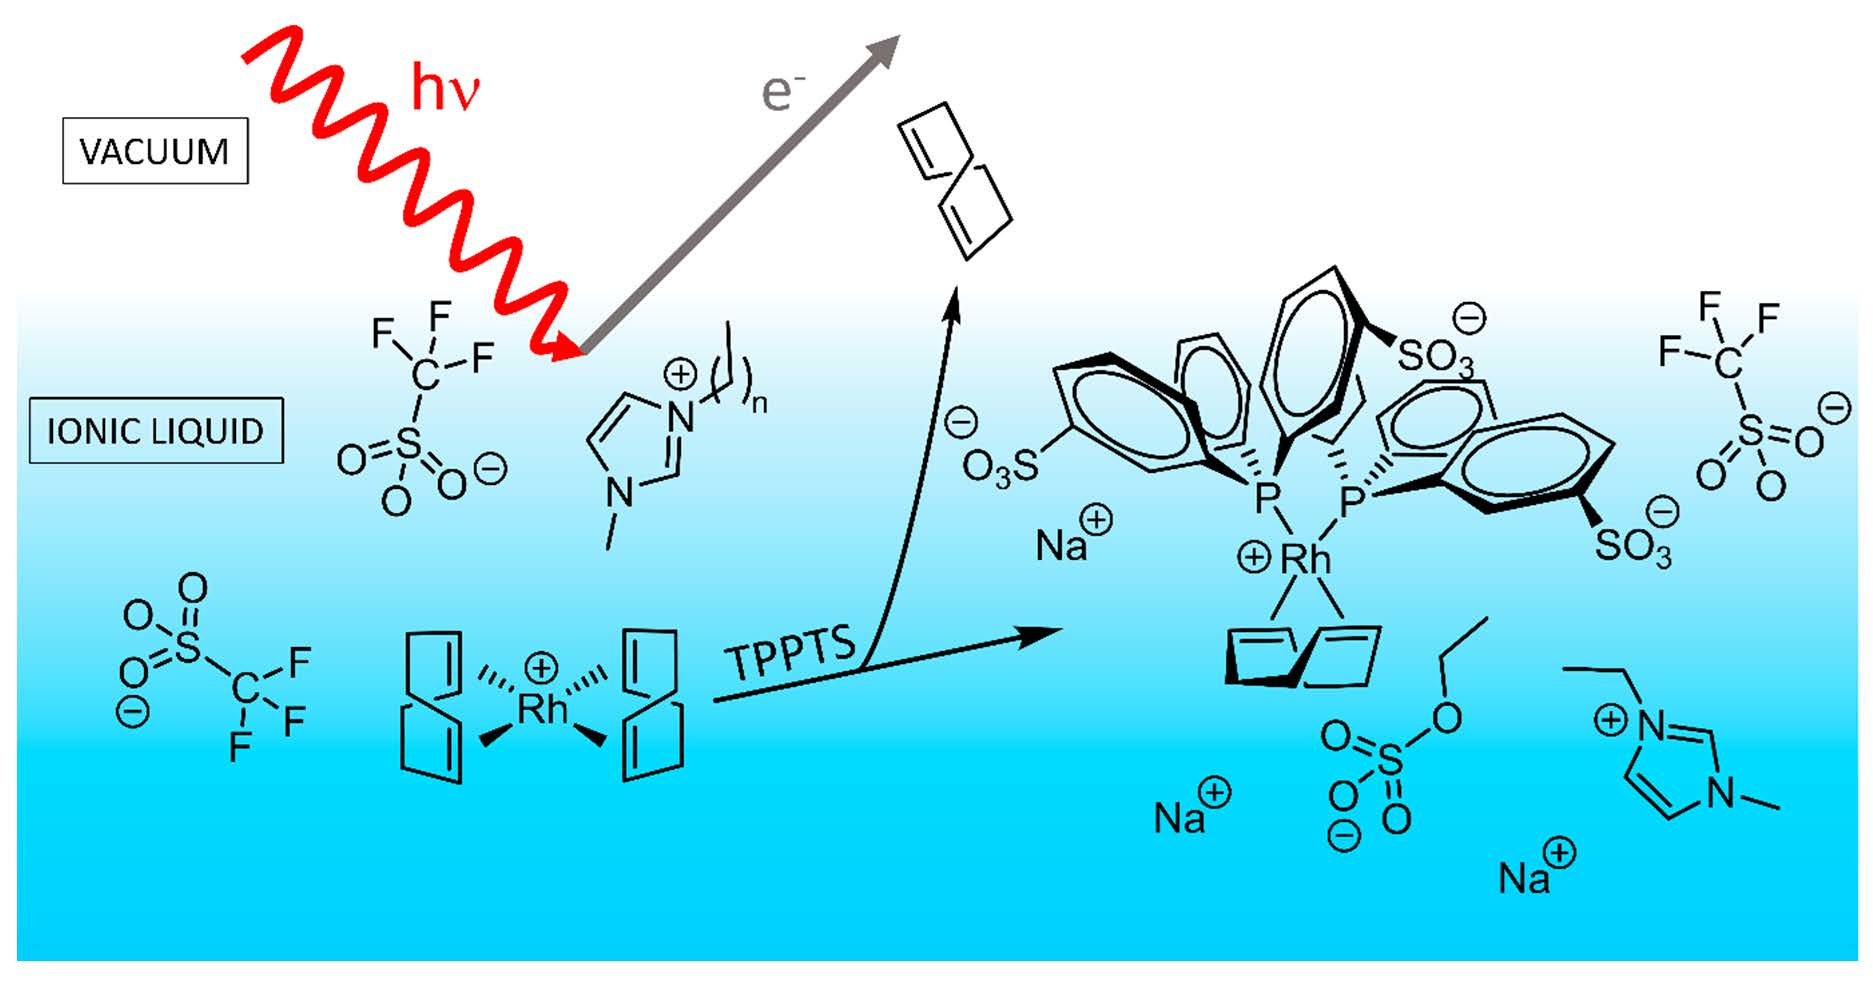
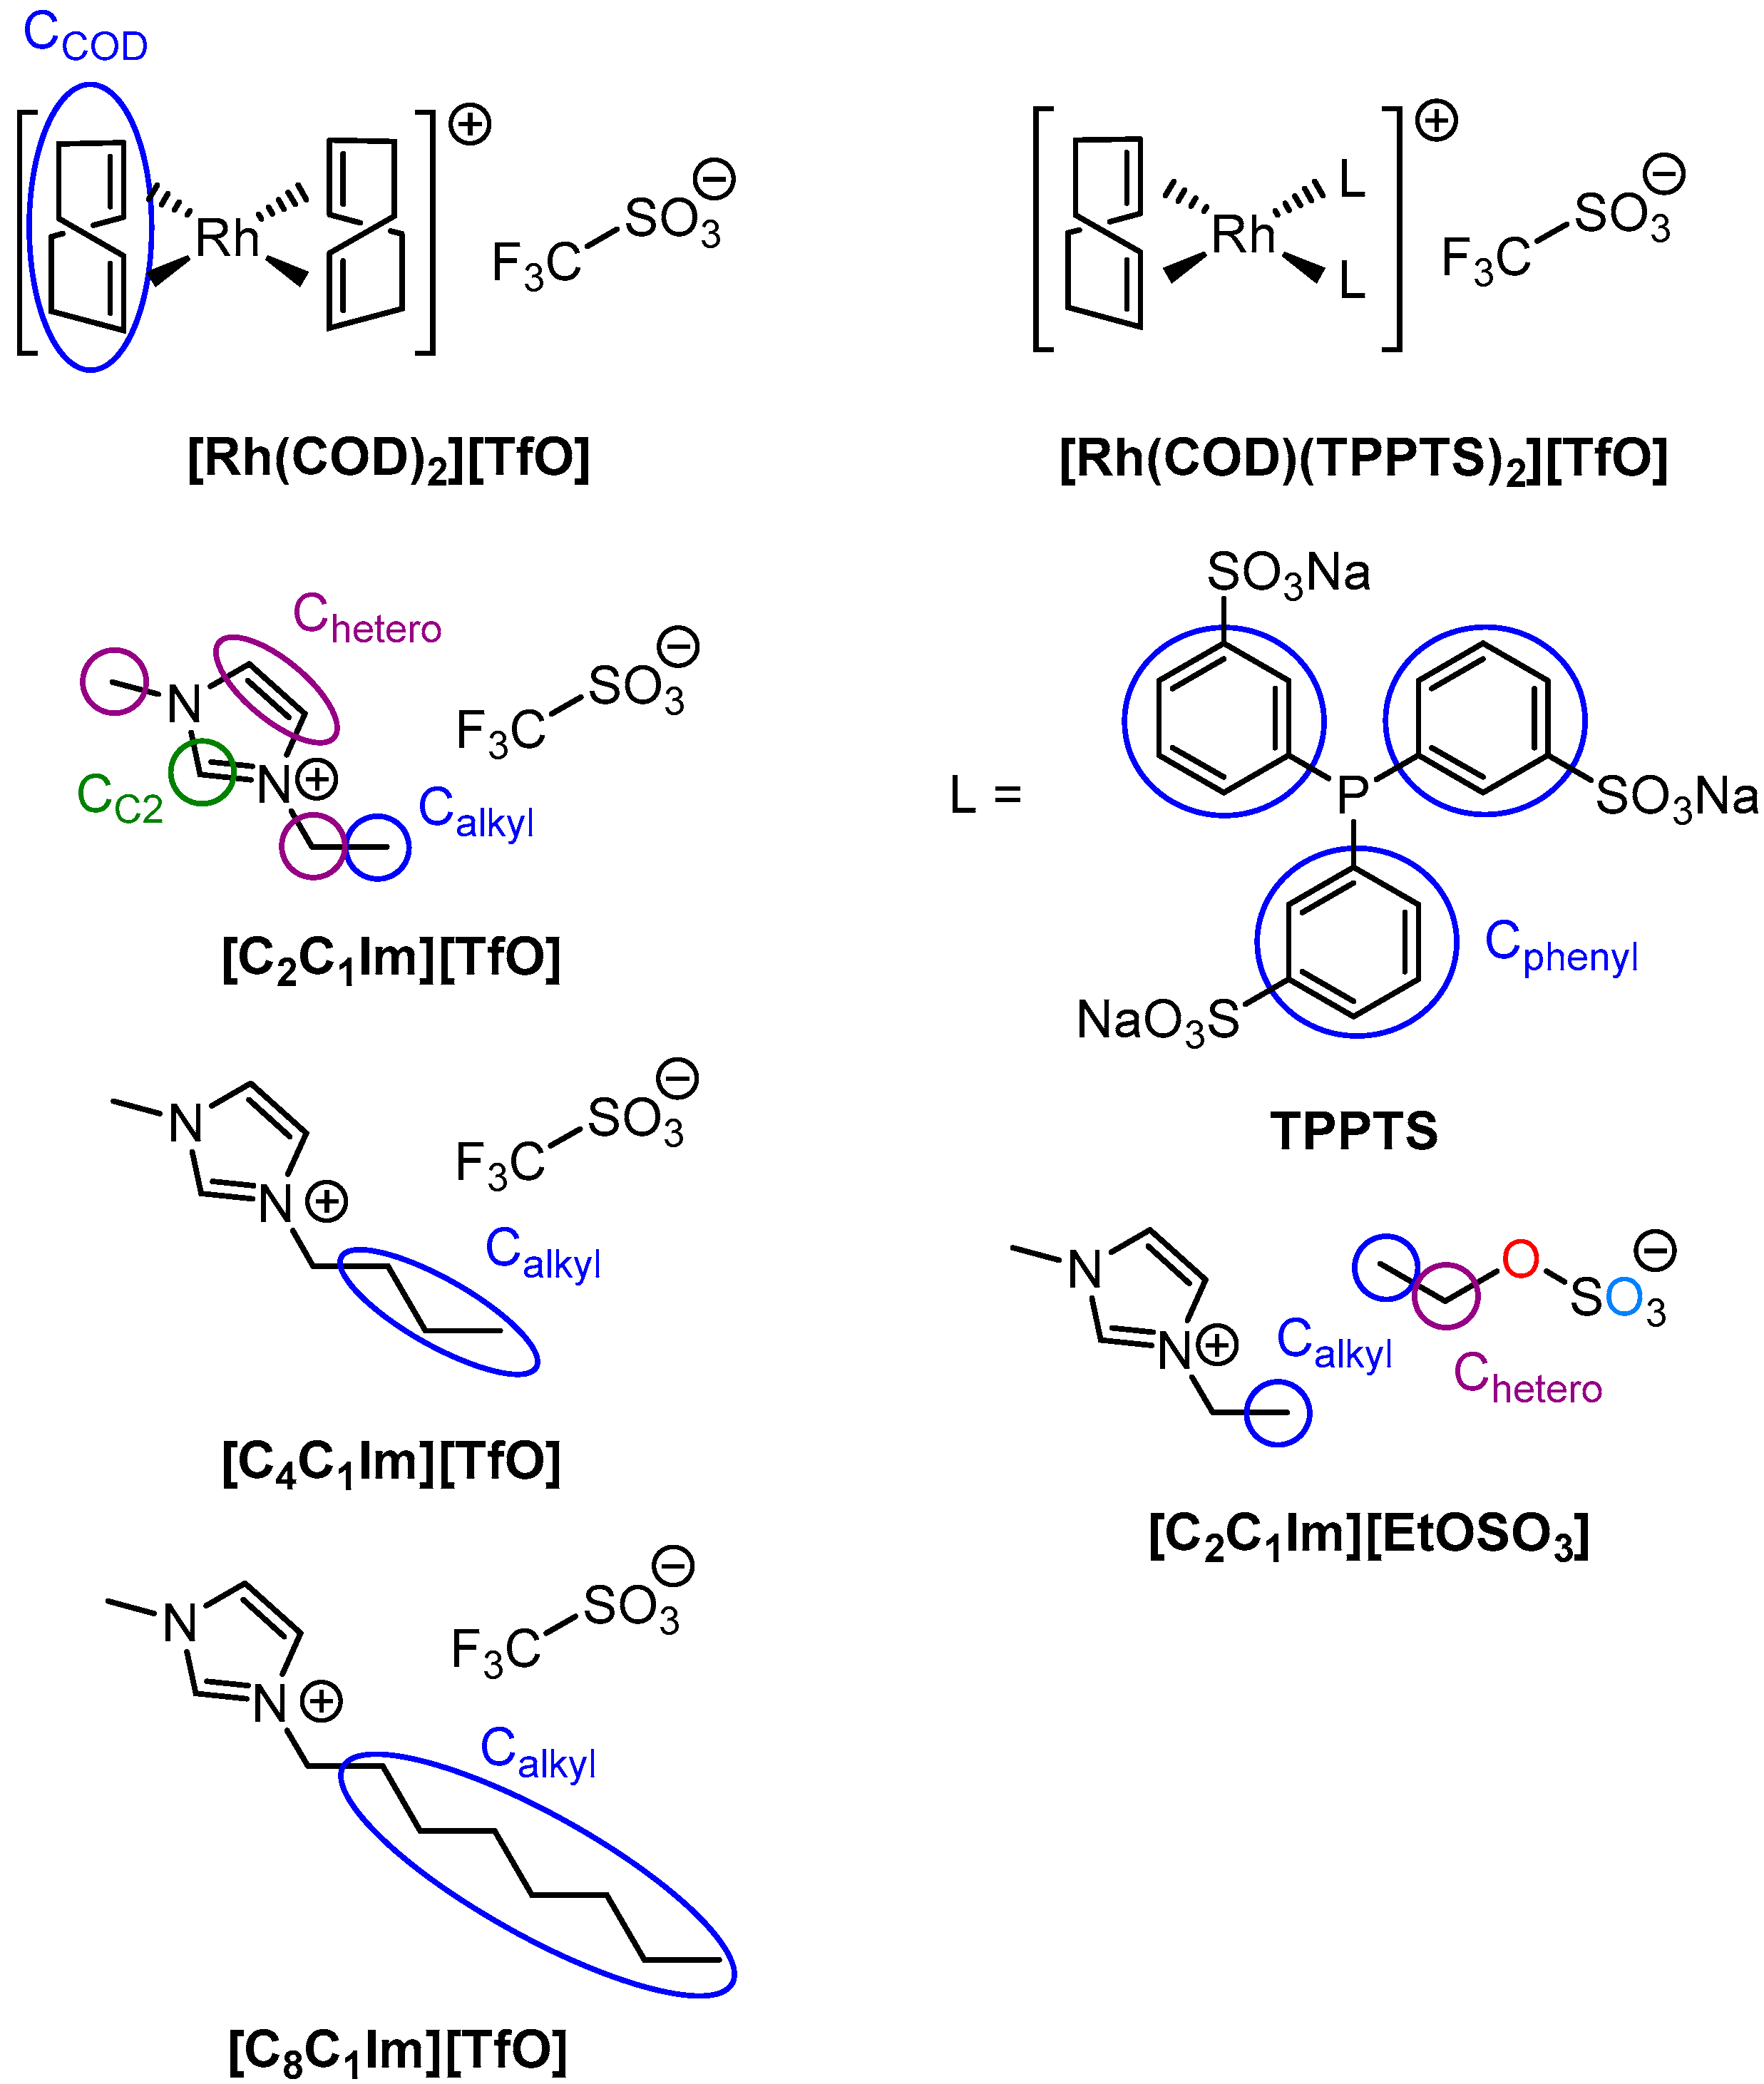
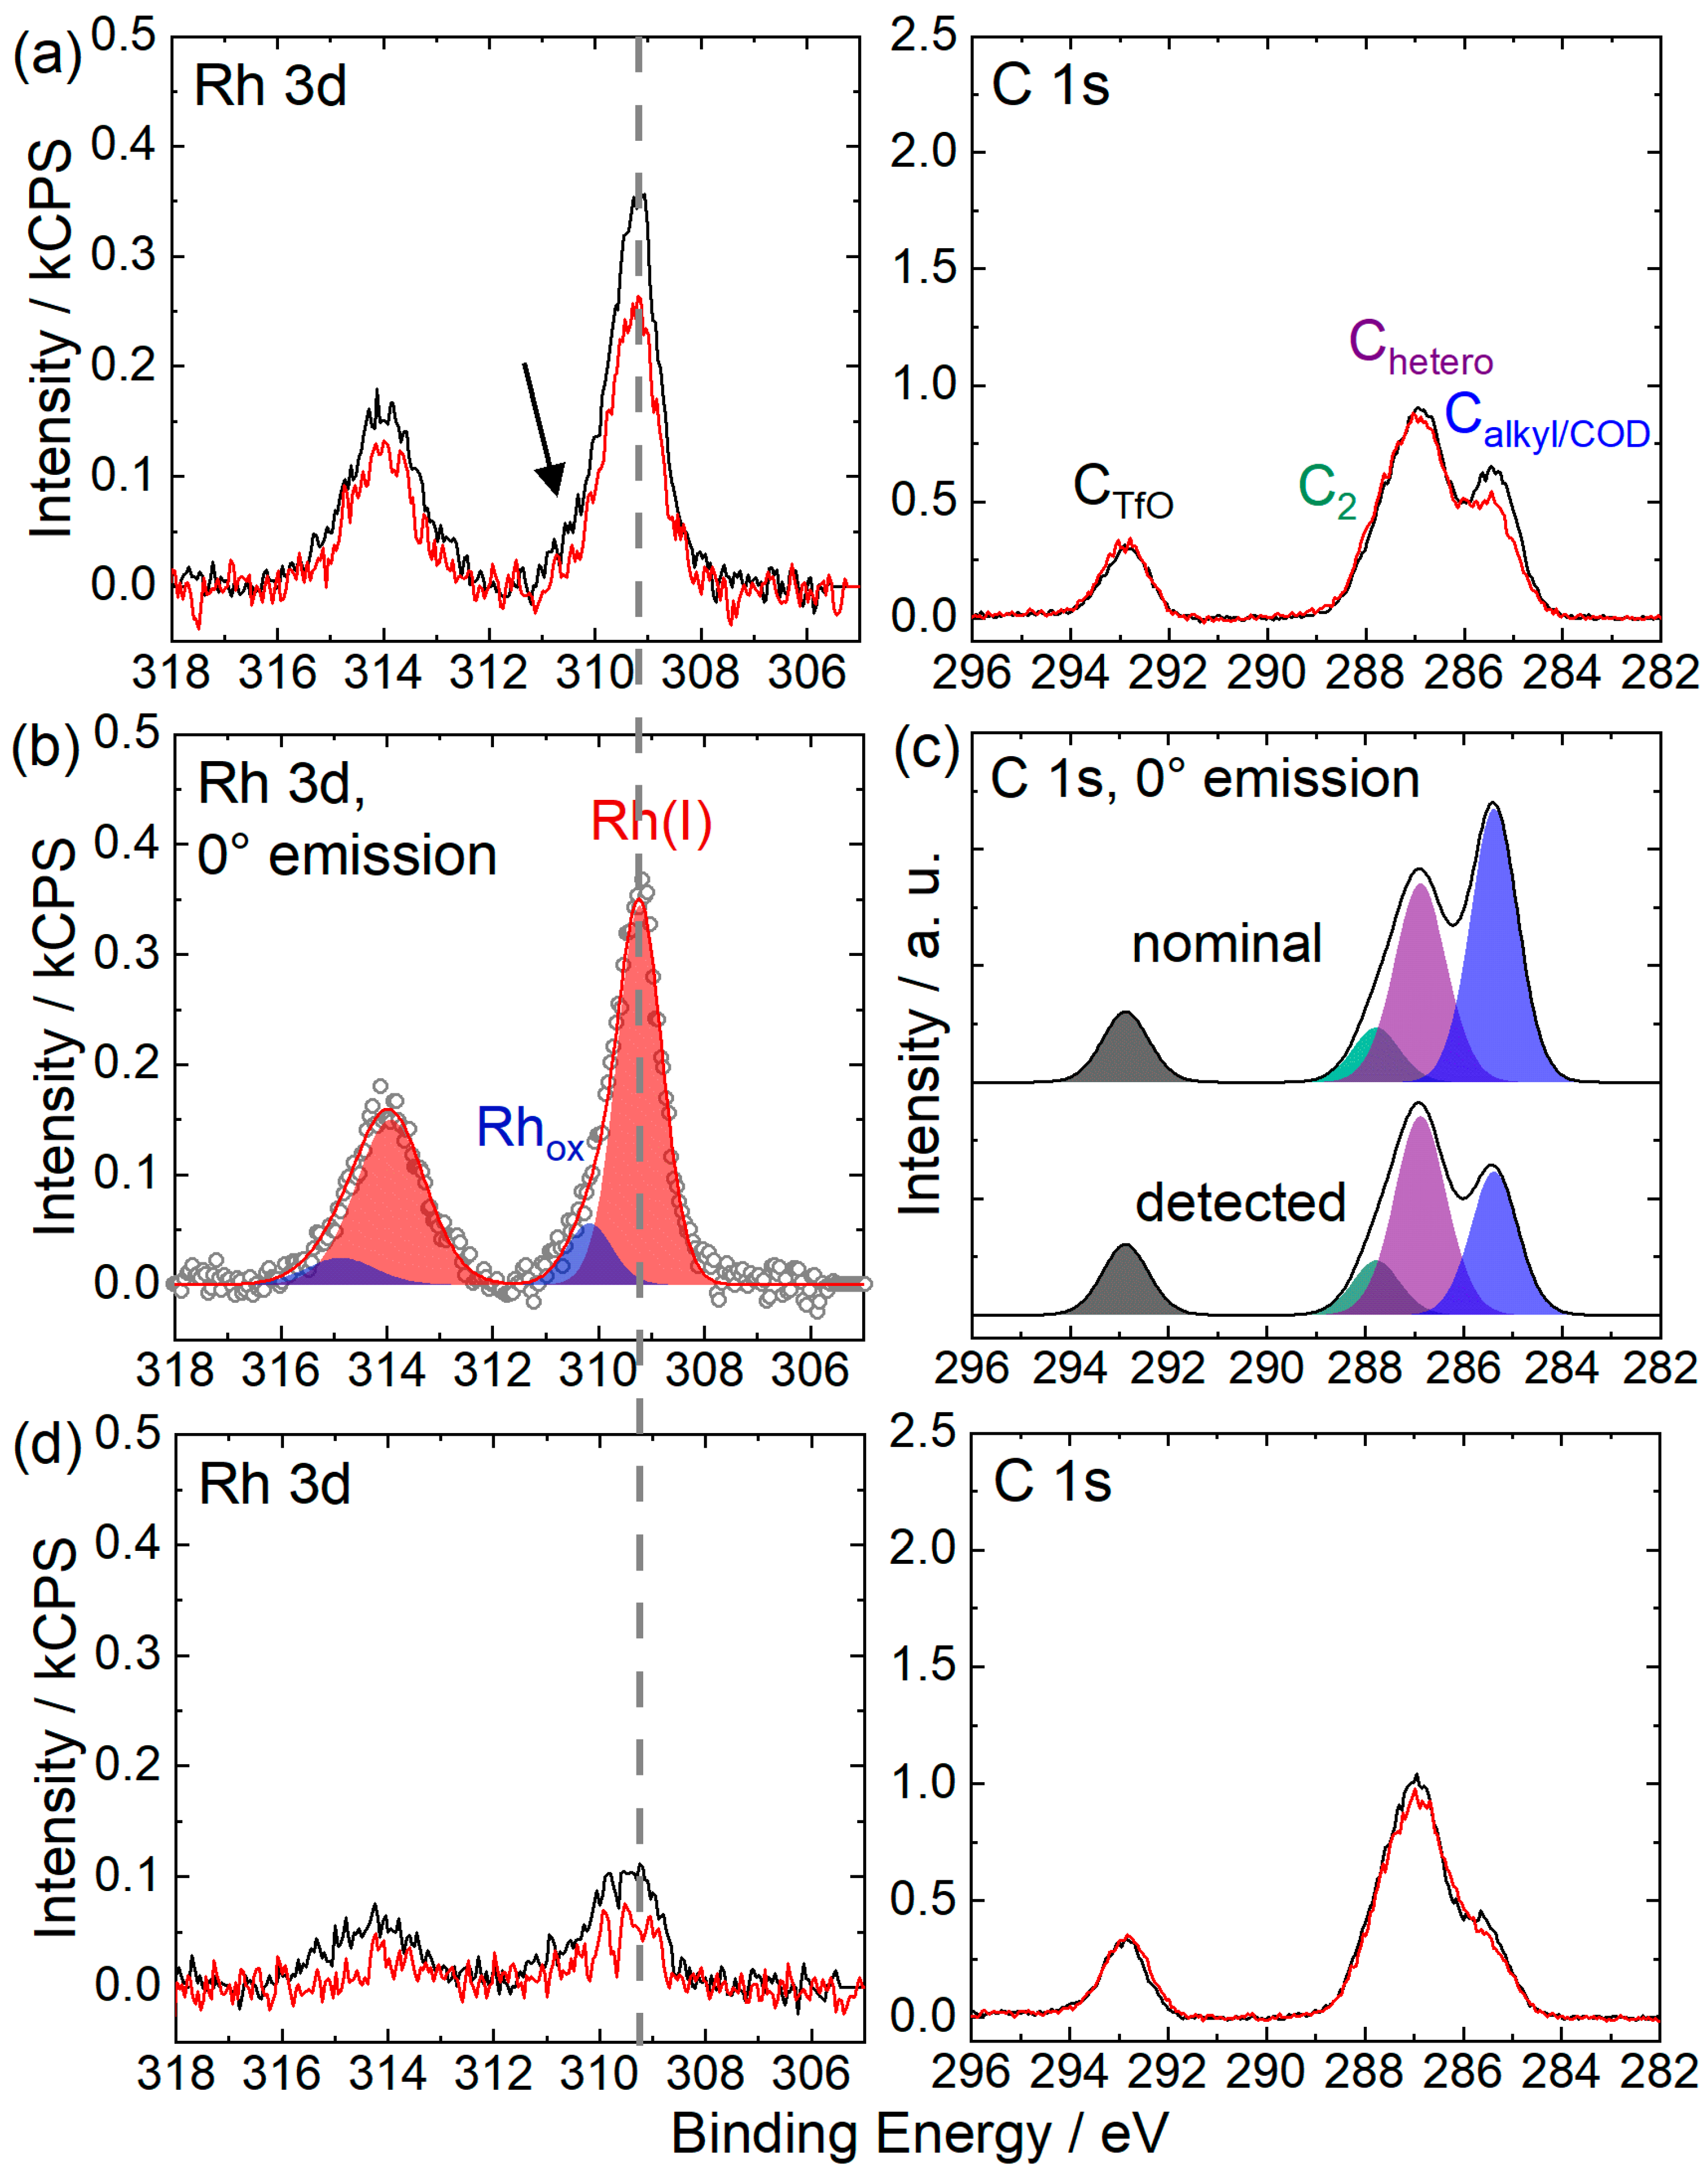
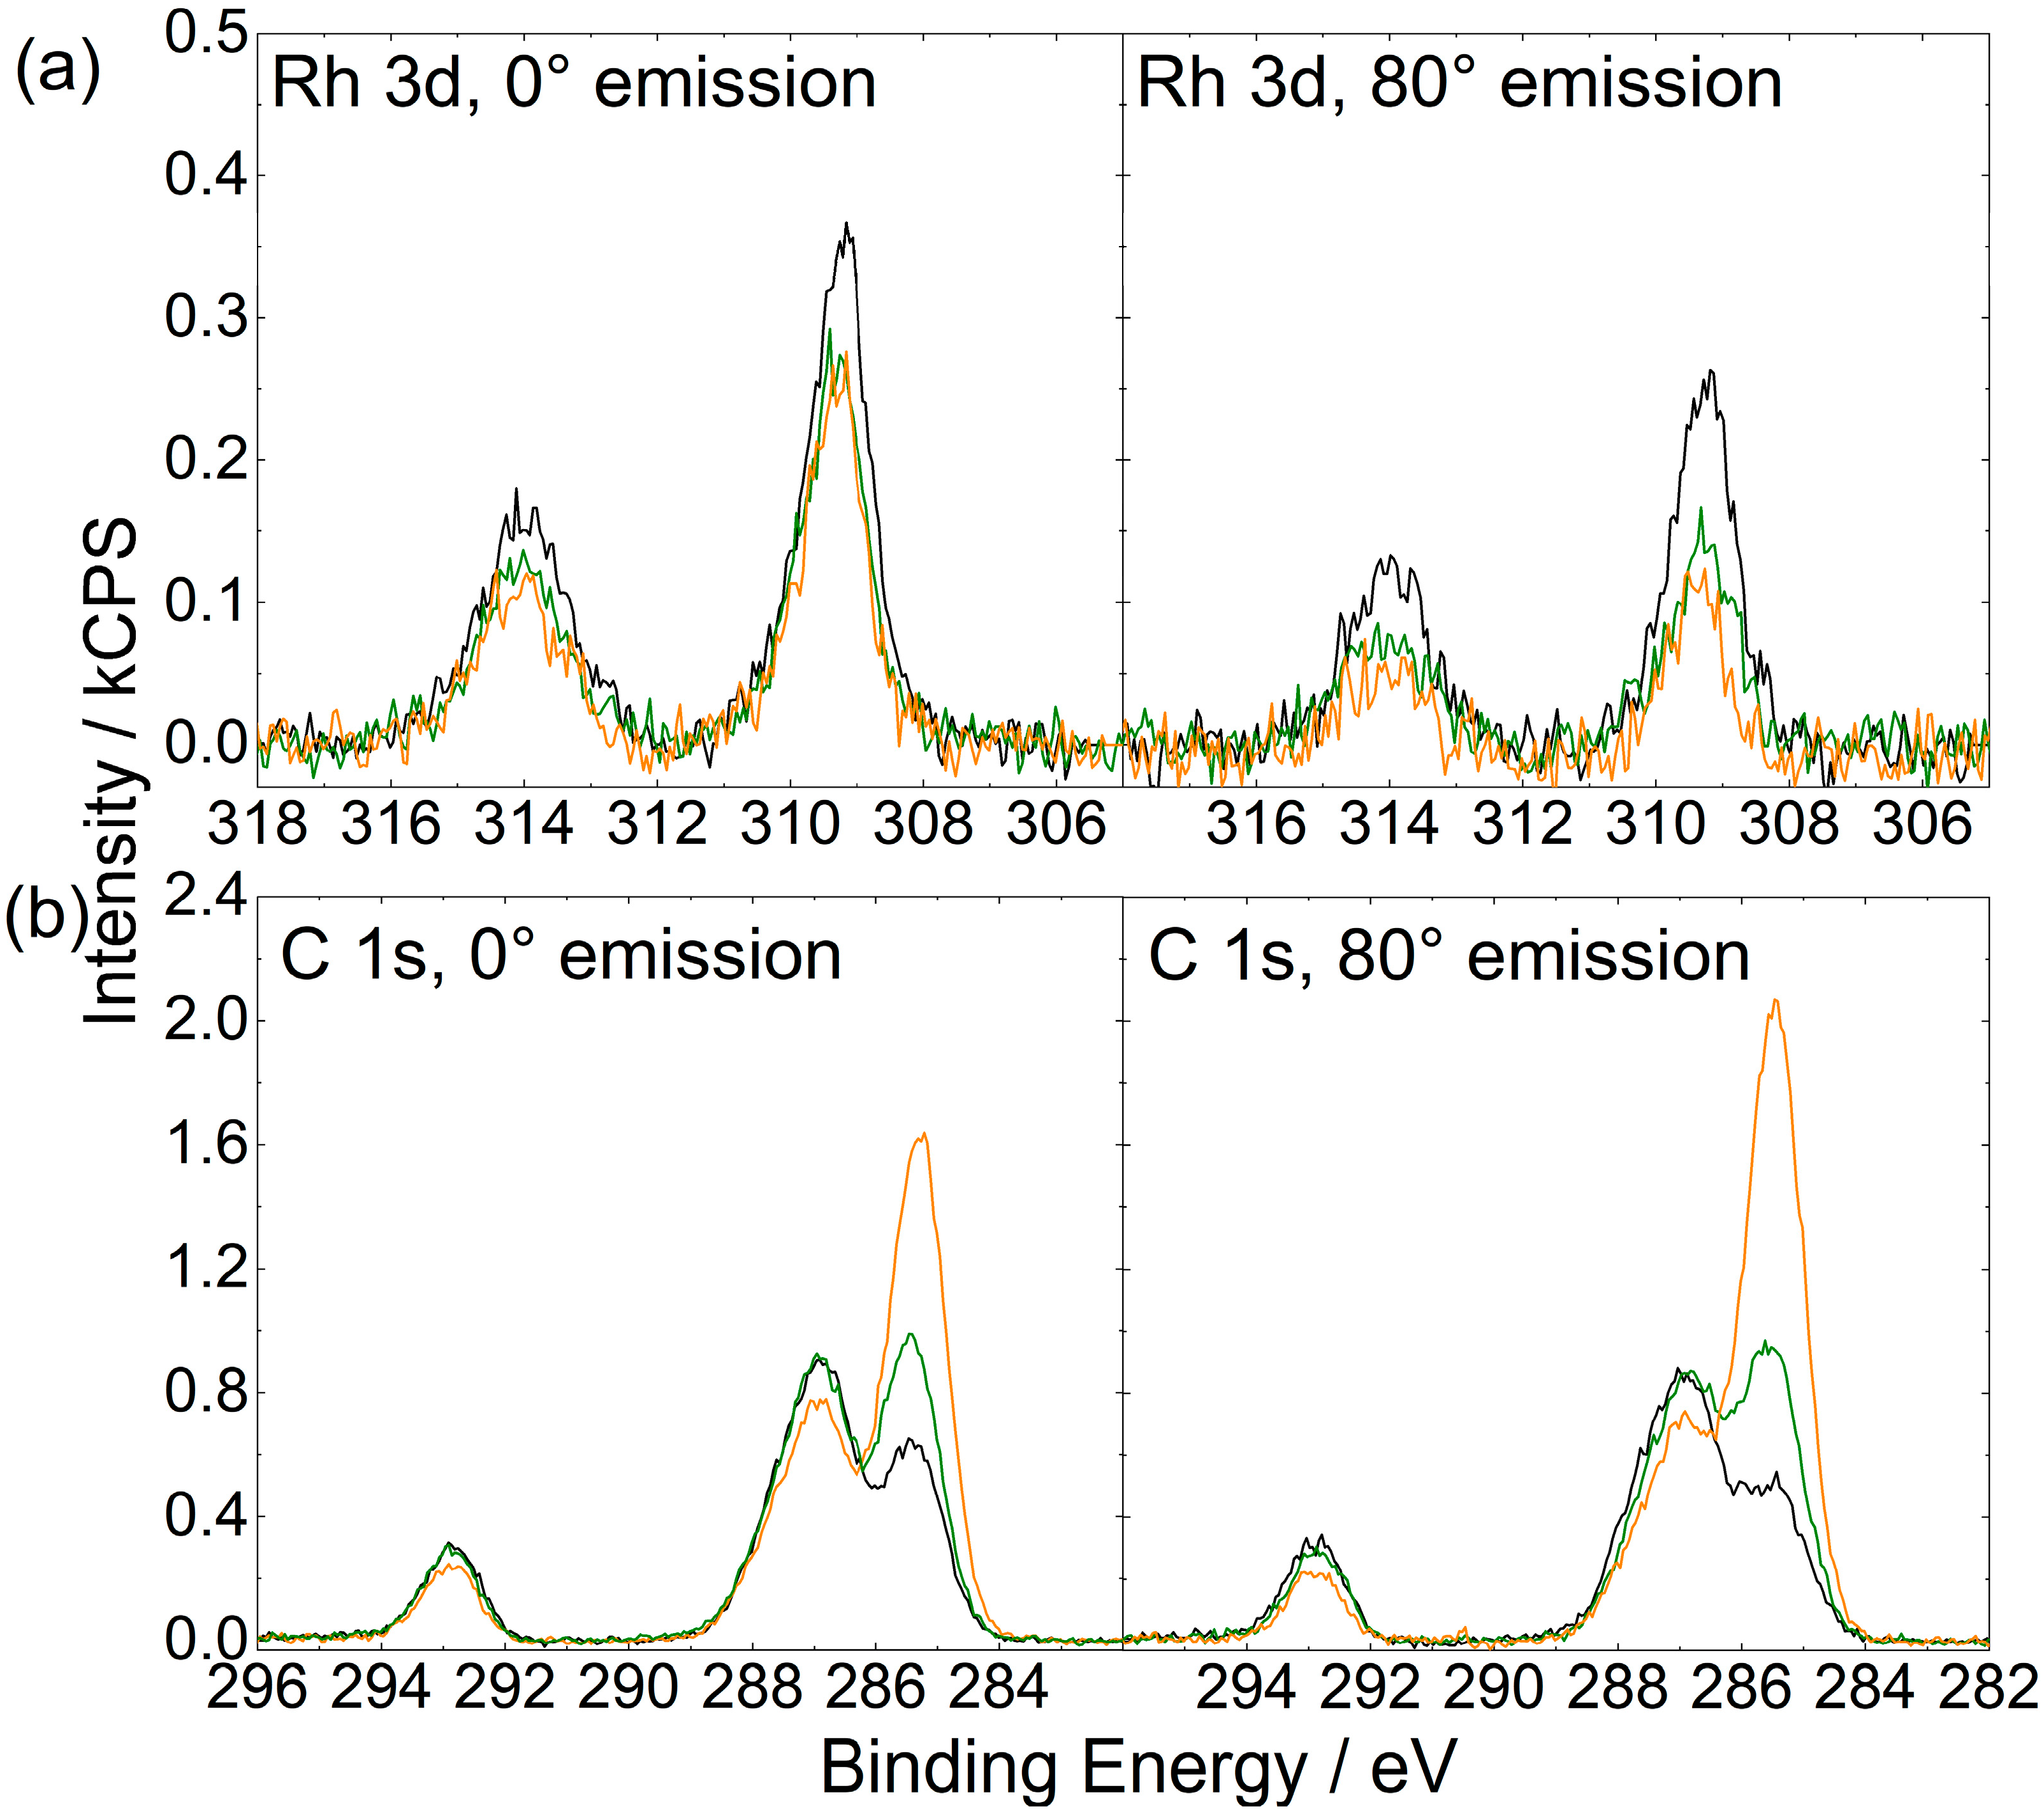
2.1. [Rh(COD)2][TfO] in [CnC1Im][TfO] (n = 2, 4, 8)

We found [Rh(COD)2][TfO] to be highly soluble in [TfO]-based ILs. As a starting point, we prepared a mixture with 20%mol catalyst concentration in [C2C1Im][TfO] and characterized it using ARXPS. Figure 2a depicts the Rh 3d and C 1s spectra of this solution in 0° (black, more bulk-sensitive) and 80° (red, more surface-sensitive) emission geometry. The full set of spectra is shown in Figure S1 in the Supporting Information (SI), where in addition, the F 1s, O 1s, and S 2p signals of the anion and the N 1s signals of quasi-equivalent nitrogen atoms of the [C2C1Im]+ cation are shown, along with a wide scan.
The spin−orbit-resolved Rh 3d3/2 and 3d5/2 signals are detected at 313.9 and 309.2 eV, respectively. From the fitted 0° spectrum in Figure 2b, an additional small feature at about 1 eV higher binding energy with respect to the major signal can be identified (indicated by an arrow), which indicates an oxidized species. Notably, the corresponding signal in the 80° emission is not detected to a significant extent, and thus is not quantified. The quantitative analysis shown in Table 1b reveals that the 0° signal of the oxidized species amounts to ~14% of the total Rh 3d signal.
As shown in the SI, comparable features are also detected in a similar mixture prepared under the full exclusion of air (Figure S2, spectrum b), and in the solid catalyst powder (spectrum d), indicating an inherent presence of oxidized Rh species. Similar findings were reported by Carvalho et al. for the XP spectra of a solid commercial sample of Wilkinson’s catalyst [92]. Notably, we did not observe any X-ray-induced changes over the time period required for the acquisition of all core levels (Figure S2, spectrum c), which rules out that the high-binding energy species is due to beam damage.
The C 1s region in Figure 2a shows a signal at 292.9 eV, which is assigned to the carbon atom CTfO of the [TfO] anion, and the C 1s signals at 287.8 and 286.9 eV are assigned to the C2 and Chetero carbon atoms of the IL cation, respectively. The Calkyl/COD peak at 285.4 eV is attributed to the superposition of the signals of the aliphatic alkyl chain of the IL cation and the COD ligand of the metal-containing cation (for comparison, the ARXPS spectra of the neat IL [C2C1Im][TfO] is depicted in Figure S3 in the SI). It is essential to note that the COD ligand involves sp2 and sp3 hybridized carbon species in equal amounts, which show significant differences in C 1s binding energy, as found by XPS for carbon materials [93,94]. Nonetheless, in accordance with the binding model for olefinic ligands after Dewar, Chatt, and Duncanson, the σ-donor and π-acceptor binding modes between the COD ligands and the metal center impose sp3-like character (rehybridization) for the coordinating carbon atoms [95,96]. Peak-fitting for quantitative analysis was done following an established deconvolution procedure for 1,3-alkylimidazolium cations [84], differentiating three different moieties from the [C2C1Im]+ cation C2, Chetero, and Calkyl/COD, as indicated in Figure 1.
The quantitative analysis of the peak intensities detected at 0° emission (as shown in Table 1b) provides information on the stoichiometric composition of the 20%mol mixture (note that the atomic ratio values given in the following are normalized to one imidazolium cation). Note that the nominal contributions of Calkyl (1.0) and CCOD (16/4 = 4.0) to the joint Calkyl/COD signal are denoted below the nominal value for this peak. Interestingly, for the major Rh 3d5/2 signal at 309.2 eV we observe a significantly lower intensity than expected from the nominal composition (0.16 vs. 0.25; which is 63% of the nominal value; the experimental uncertainty of the denoted composition values is 5–10%; to avoid rounding errors, three decimal digits are sometimes provided in the tables). If we assume complete solubility of the metal complex, this observation indicates a strong depletion of the dissolved complex from the IL/vacuum interface, that is, the topmost surface layer. It was recently shown that pronounced enrichment/depletion phenomena in the IL/vacuum interface in catalyst solutions can also significantly affect the more bulk-sensitive 0° XP spectra [76]. A lower than nominal signal is also observed for the Calkyl/COD signal at 285.4 eV. The intensity ratio of [C2C1Im]+-specific N 1s, C2, and Chetero signals is in perfect agreement with that of the nominal atomic composition of the IL cation, confirming its intactness. In addition, these signals concomitantly show a somewhat higher intensity (2.2, 1.1, and 4.4, respectively, that is, by 10%) than expected from the nominal composition of the solution (this is in line with the complex being depleted from the topmost layer); the same increase must also be expected for the Calkyl contribution to the joint Calkyl/COD signal. Consequently, the observed deficiency of the Calkyl/COD signal (2.9 vs. 5.0; or for CCOD 1.8 vs. 4.0, that is, 45% of the nominal value) must be entirely assigned to the contribution of CCOD. The decrease in CCOD to 45% of the nominal value far exceeds that observed for Rh (63%). This indicates a partial non-intactness of the catalyst cation due to the loss of COD ligands, in addition to the depletion of the present complex from the IL/vacuum interface. An illustration of the detected and expected C 1s spectra from nominal proportions is depicted in Figure 2c. As the deconvolution of the C 1s spectra is challenging, we used different procedures for estimation of the actual COD content, which are outlined in the SI. All of the approaches yielded a ratio of about 1.4 COD ligands per metal center, as shown in Table S3b in the SI. The resulting free coordination sites at the Rh center could be occupied by the [TfO] anion coordinating via the sulfonate group in manifold binding motifs, e.g., in η1-OS(O)2CF3, η2-O2S(O)CF3, or µ-O2S(O)CF3 fashion [97]. This assumption is supported by comparing the O 1s region scans of the catalyst solution (black) and neat [C2C1Im][TfO] (blue) in Figure S4. In the catalyst solution, a minor signal (broadening) at higher binding energy with respect to the major peak at 532.4 eV is detected (indicated by an arrow), which is likely due to coordination of the sulfonate groups of the corresponding [TfO] anions. However, an alternative explanation for this additional signal could be the above-mentioned oxidized Rh species of an unknown nature.
Interestingly, the extent of ligand loss is even higher in a more diluted solution with a catalyst concentration of 9%mol in the IL. The Rh 3d and C 1s spectra of this diluted solution are shown in Figure 2d (full set of spectra is depicted in Figure S5 in the SI) and the quantitative analysis of the peak intensities is shown in Table 1a. Quantification of the ligand loss yielded 0.8 COD molecules per metal center present in the solution (see Table S3a in the SI). This more pronounced loss of COD ligands is accompanied by a slight shift in Rh 3d signal by 0.2 eV to a higher binding energy with respect to the 20%mol solution, which confirms a (partially) different chemical environment for the metal centers in the solution, depending on the concentration.
The comparison of the XP spectra recorded for the 20%mol solution of [Rh(COD)2][TfO] in [C2C1Im][TfO] at 0° (normal emission) and 80° (grazing emission), depicted in Figure 2a and Figure S1, provides further information on the composition of the IL/vacuum interface. The quantitative analysis is provided in Table 1b. The Rh 3d signal showed a decline at 80°, which is to be expected for a depletion of the metal complex from the topmost molecular layer. Concomitantly, a lower 80° signal is also detected for Calkyl/COD. As the ARXP spectra of neat [C2C1Im][TfO] show no significant change in the Calkyl signal at 80° (see Figure S3 and Table S1 in the SI), we attribute the decrease in intensity of the Calkyl/COD signal solely to the contribution of CCOD. Hence, as already pointed out above, the organometallic complexes studied here are preferably located in the bulk rather than at the IL/vacuum interface. However, it must be emphasized that the exact structure of the metal-containing cations is unknown due to the ligand loss of the initial catalyst. Notably, for the more diluted solution with a 9%mol catalyst concentration, the decline in Rh 3d signal upon going from 0° to 80° emission is more pronounced, indicating a lower surface concentration of the metal center.
The F 1s signals (see Figure S1) and, to a lower extent, the CTfO signals, show a significantly higher intensity in grazing emission compared with the more bulk-sensitive 0° spectra. Furthermore, the S 2p signal shows a similar intensity at 0° and 80°, and the O 1s peak exhibits a minor decline. These findings are in line with a preferential surface orientation of the [TfO] anion with the CF3 group directed towards the vacuum, whereas the sulfonate group is directed towards the bulk. This orientation is well-known for anions carrying groups with perfluorinated carbon [24,89,98,99,100,101,102,103], and is also observed for the pure [C2C1Im][TfO] (see Figure S3 and Table S1).
Next, we increased the chain length of the aliphatic substituent on the IL cation from C2 to C4 and C8. Figure 3 shows the Rh 3d and C 1s spectra obtained from 20%mol solutions of [Rh(COD)2][TfO] in [C2C1Im][TfO] (black, cf. Figure 2a), [C4C1Im][TfO] (green), and [C8C1Im][TfO] (orange); the full sets of spectra are shown in Figure S1, Figure S6 and Figure S8, respectively. Their quantitative analysis is provided in Table 1b–d. Overall, we obtain similar findings for the solutions in the longer-chained IL derivatives [C4C1Im][TfO] and [C8C1Im][TfO] as for [C2C1Im][TfO]: (a) The Rh species are detected at similar binding energies, indicating a similar overall chemical environment for the metal in solution when increasing the chain length on the imidazolium cation; (b) similar contents of the oxidized minority Rh species (14 ± 3%) with respect to the total Rh signal are detected in 0° emission; (c) for all solutions, the intensity of the major Rh signal is found much lower than expected from nominal composition (59% ± 4% of the nominal value), with a weak trend toward lower values for the longer alkyl chains ([C2C1Im][TfO]: 63%, [C4C1Im][TfO]: 55%, [C8C1Im][TfO]: 58%; as derived from Table 1). These lower values are attributed to the depletion of the metal from the IL/vacuum interface, as discussed above.
For the [C4C1Im][TfO] solution, the contribution of the CCOD signal to Calkyl/COD shows a larger deficit than expected from the Rh signal, similar to the [C2C1Im][TfO] solution as described above; for both, a COD:Rh ratio of ~1.4:1 is found; see Table S3 in the SI. However, such a deficit is not observed for the [C8C1Im][TfO] solution, where Rh and CCOD both decrease to the same extent, yielding a nominal COD:Rh ratio of ~2.0:1 for the intact [Rh(COD)2]+ complex. A possible explanation for the absence of ligand loss in the [C8C1Im][TfO] solution is that the longer alkyl chains in [C8C1Im][TfO] stabilized the complex and prevented (or lower) the ligand loss. One should note here, that the alkyl and COD contributions to the Calkyl/COD peak in the C 1s spectrum cannot be easily separated. Therefore, three different approaches for calculating the COD:Rh ratios are discussed in the Supporting Information, and the most reliable numbers shown in Table S3 of SI are used here.
As shown in Figure 3a, the Rh 3d intensity detected in the 0° emission is found to be lower for the [C4C1Im][TfO] and [C8C1Im][TfO] solutions compared with the solution of [C2C1Im][TfO]. This effect is much more pronounced in the more surface-sensitive 80° spectra, where the intensity gradually decreases upon increasing the chain length on the imidazolium cation. At the same time, the Calkyl/COD peak showed a strong increase when comparing 0° and 80° spectra for the [C8C1Im][TfO] solution, while for the [C4C1Im][TfO] solution, the intensity remains virtually constant and decreases for the solution of [C2C1Im][TfO], as discussed above. This behavior indicates a more pronounced depletion of the present complex from the interface, due to the higher surface affinity of the solvent with longer substituents. It is well known that the IL/vacuum interface is preferentially populated with long alkyl chains, resulting in a lower surface tension [24,98,104].

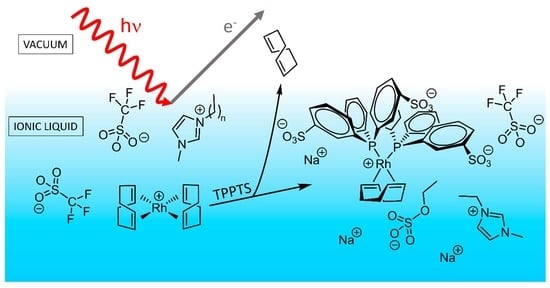
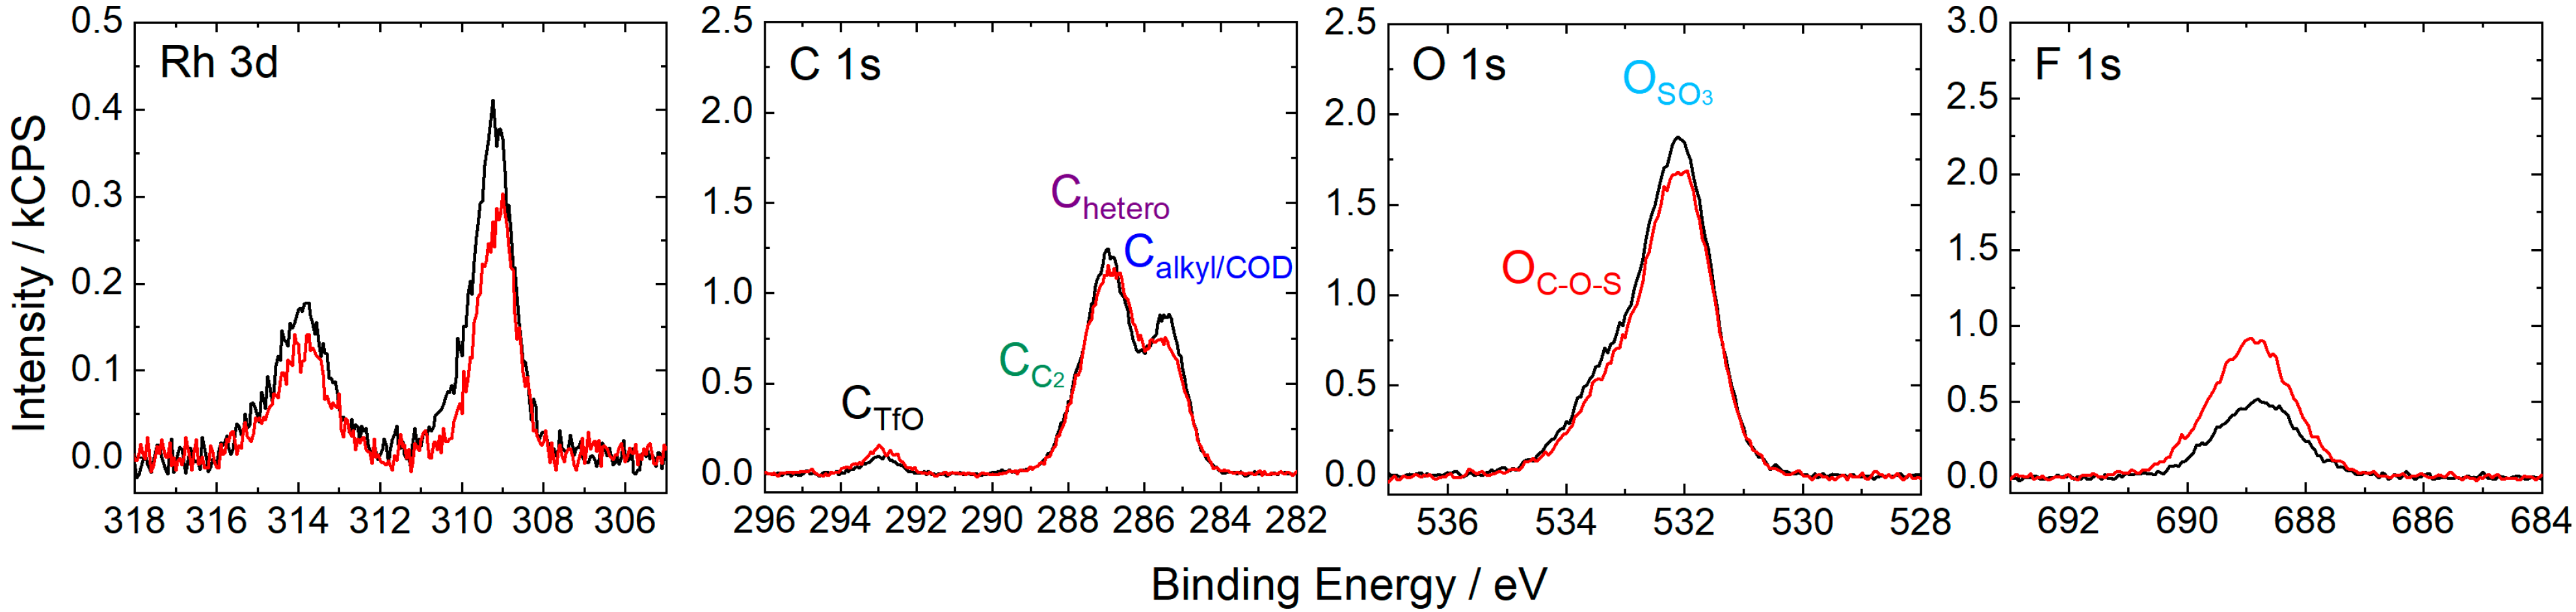
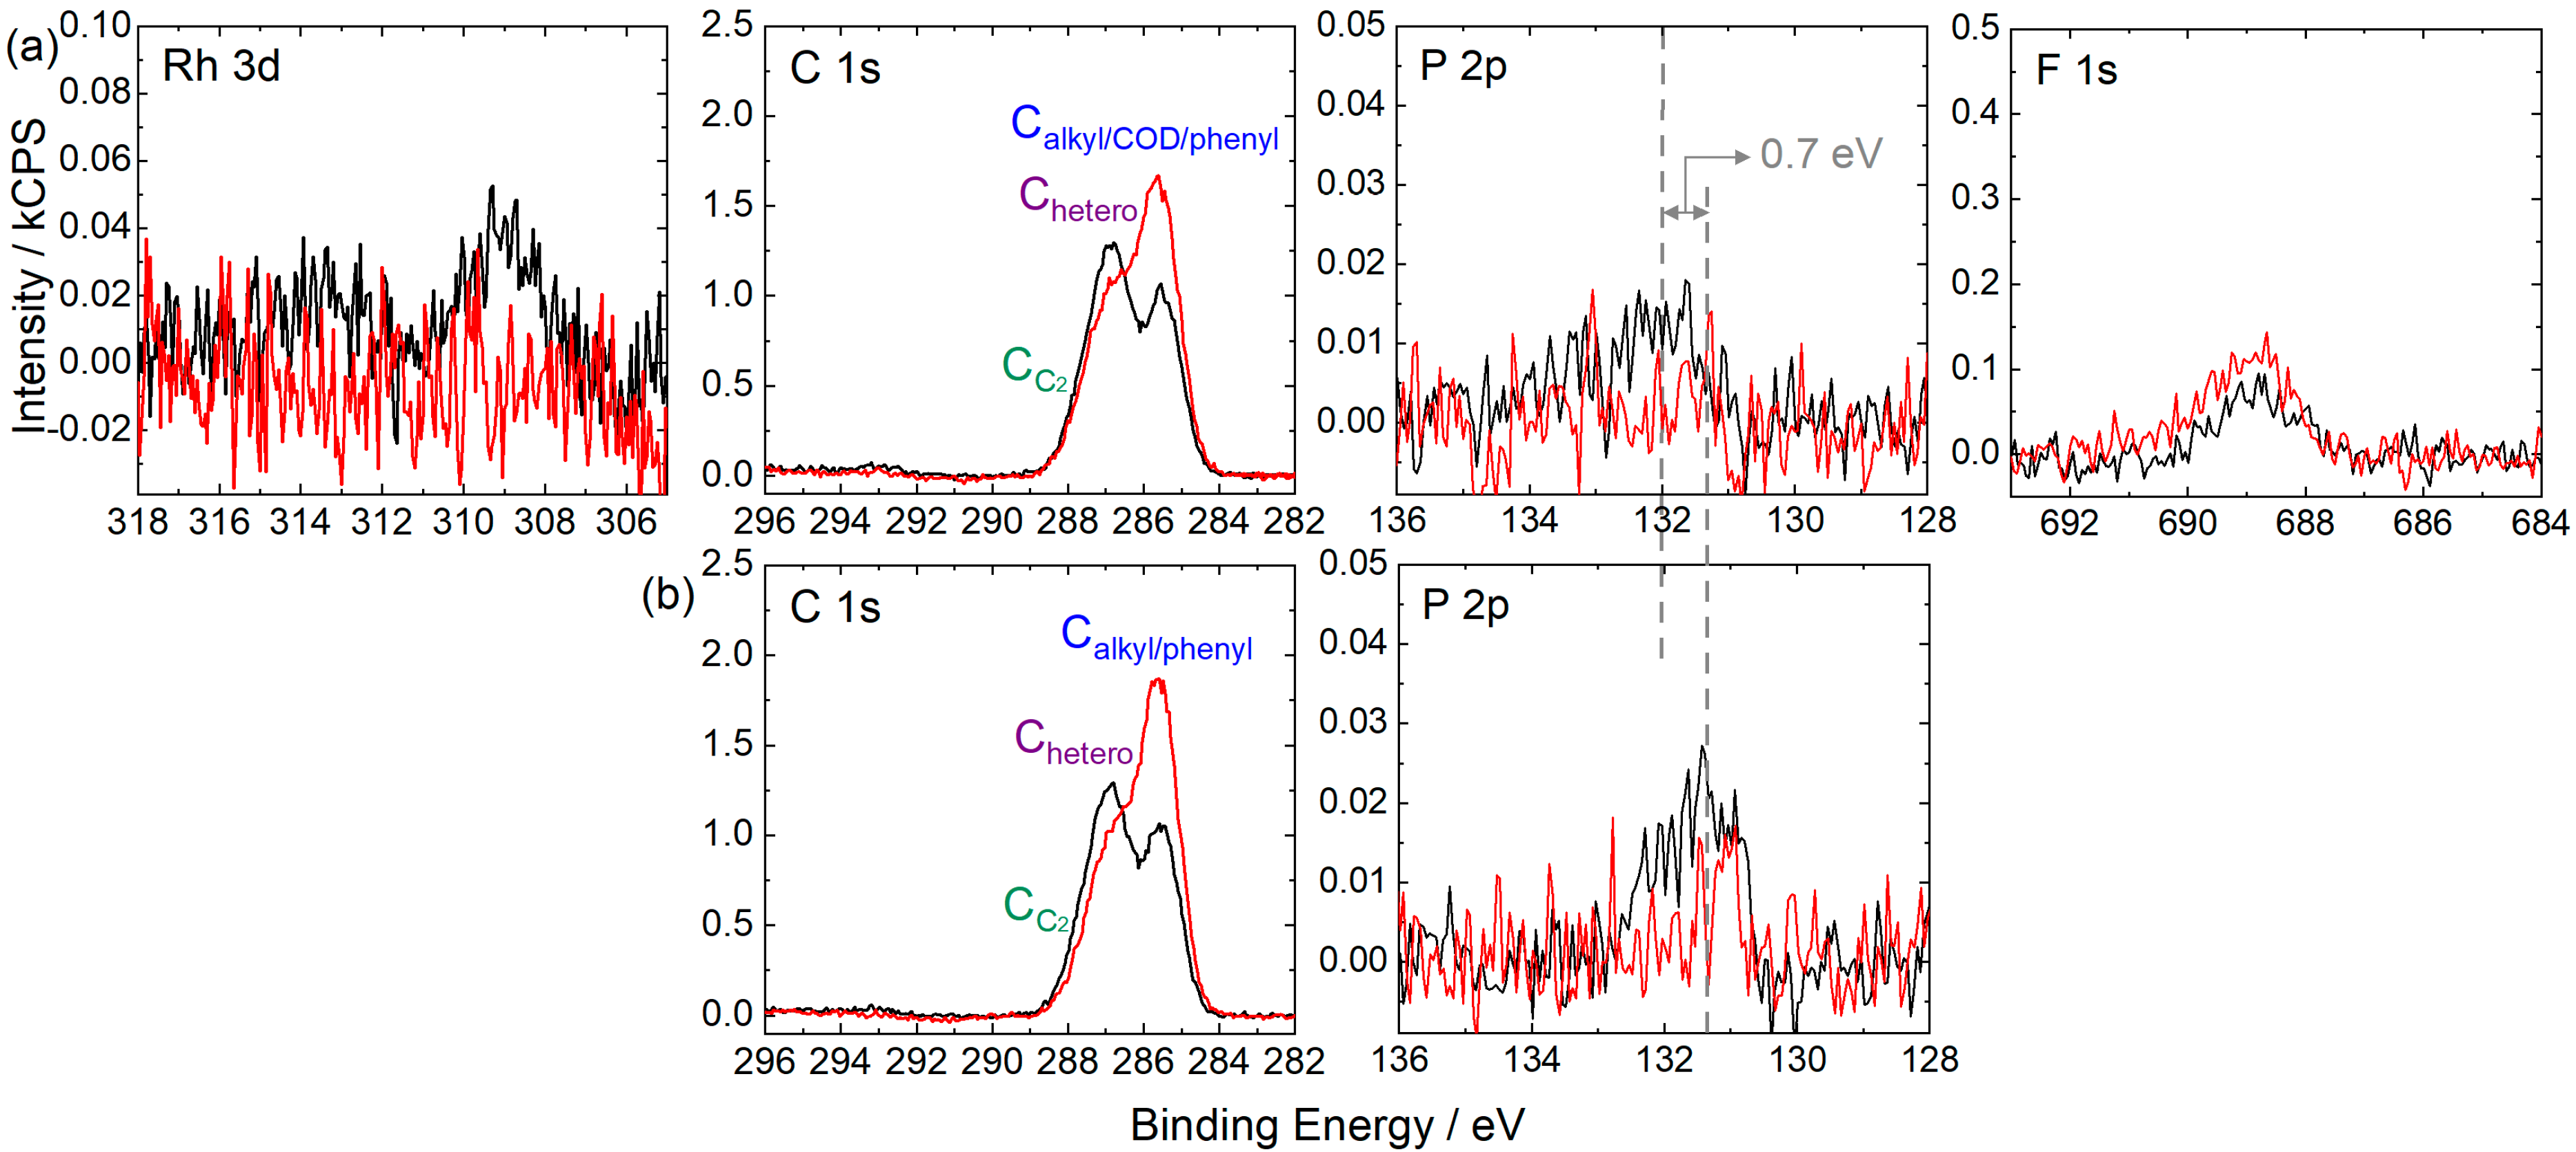
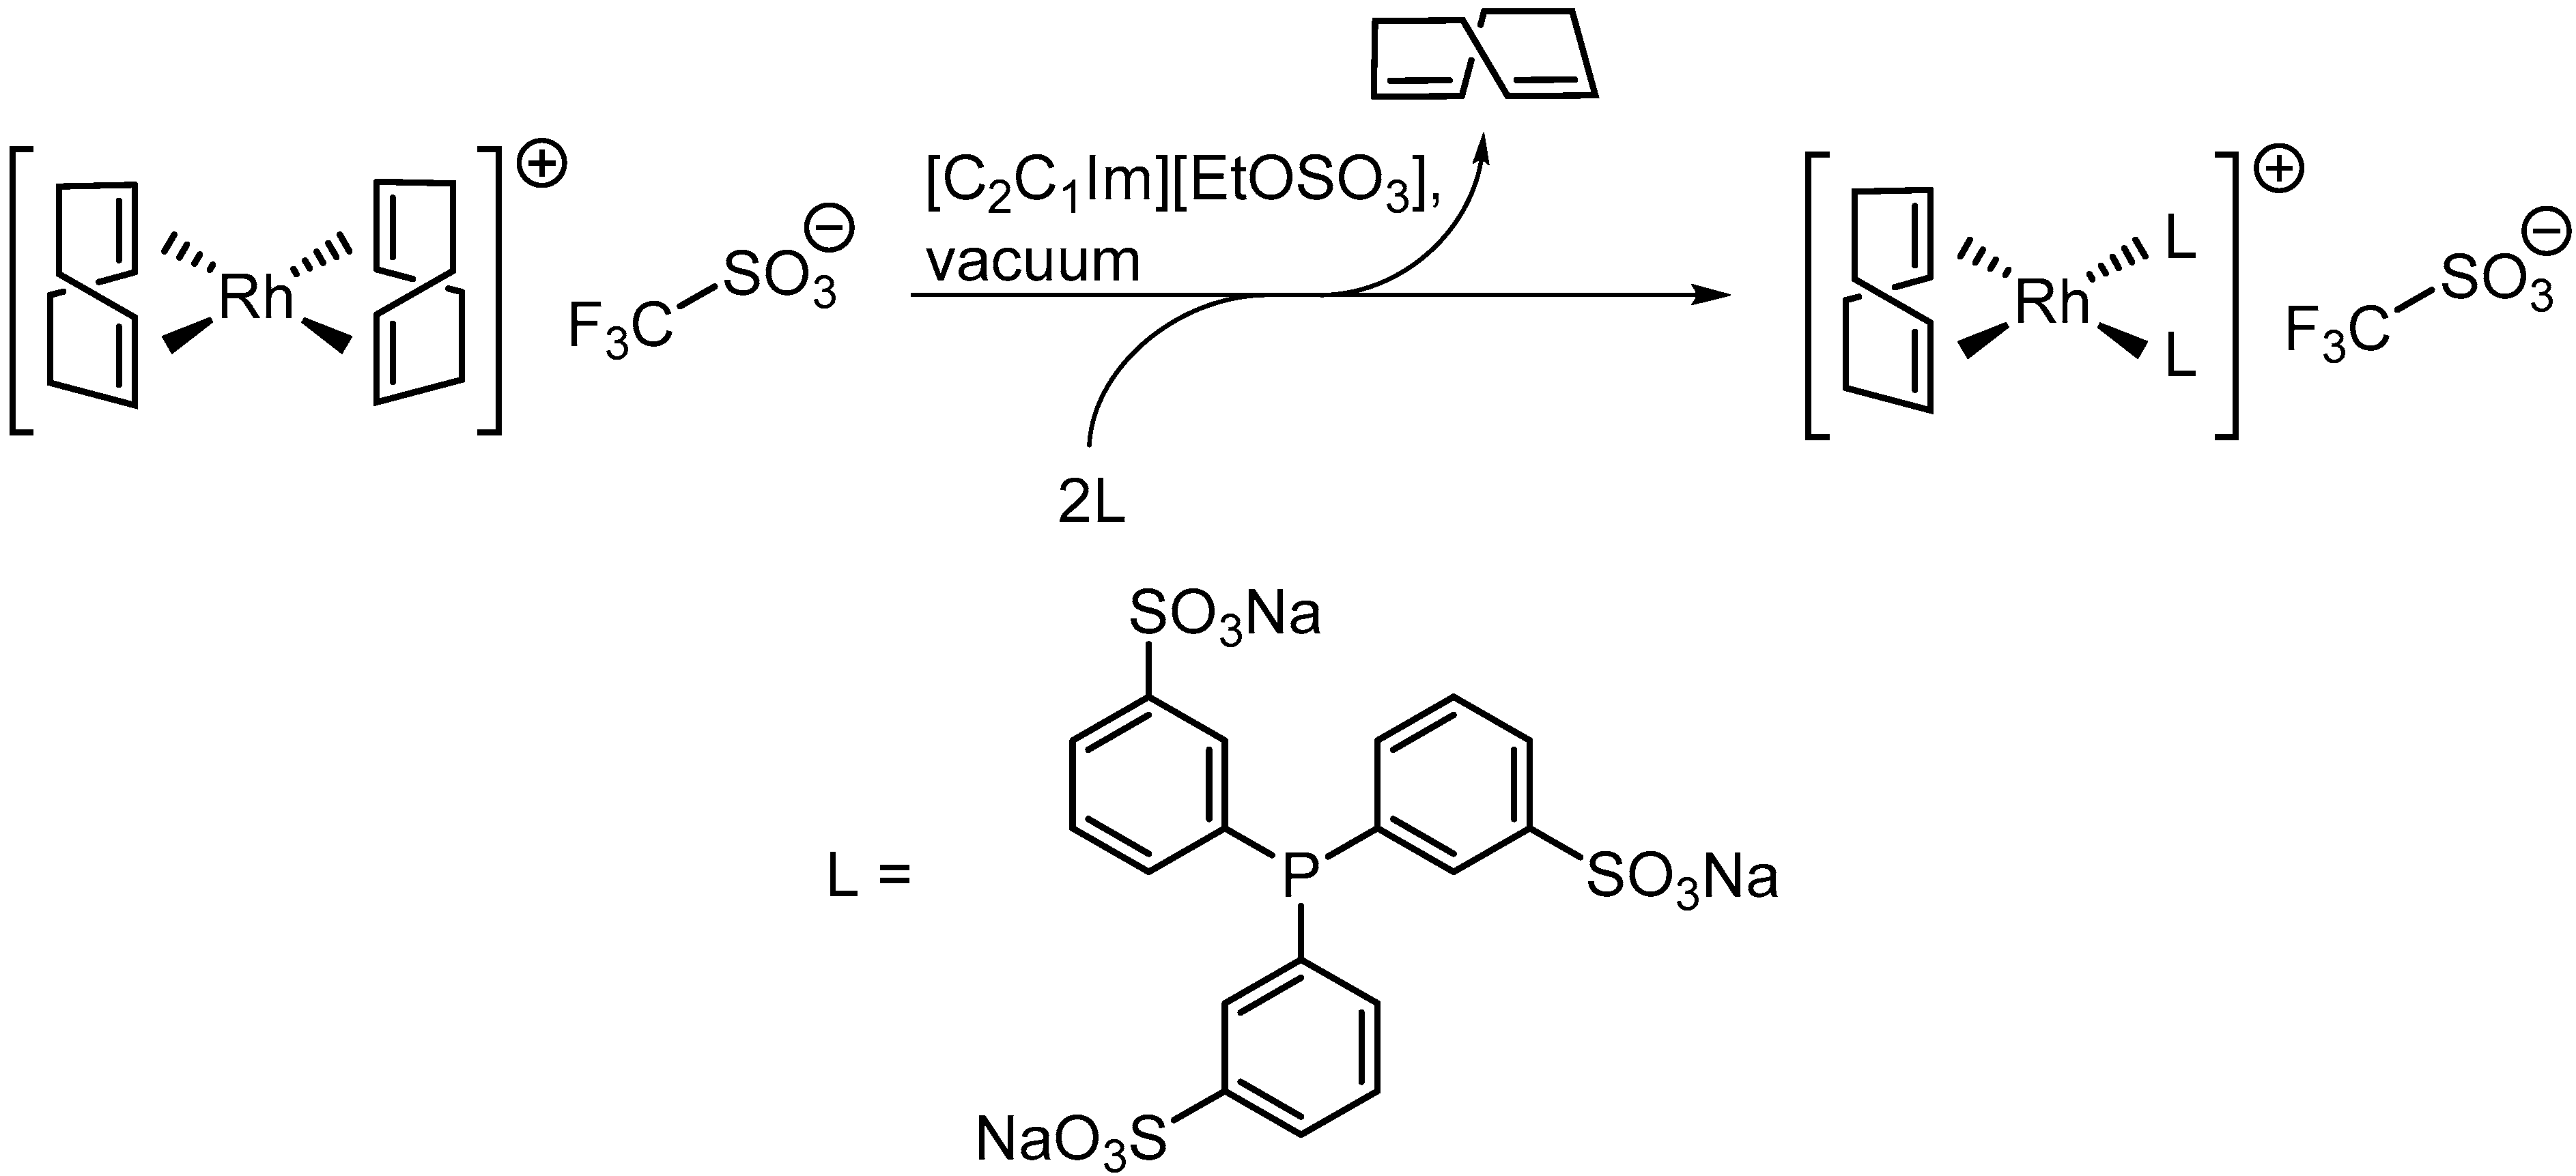
2.2. [Rh(COD)2][TfO] in [C2C1Im][EtOSO3]: Ligand Substitution Using TPPTS

In the previous section, pronounced depletion of the metal center from the IL/vacuum interface, along with ligand loss of [Rh(COD)2][TfO] dissolved in [C2C1Im][TfO] and [C4C1Im][TfO], was observed. The latter finding suggests a simple route towards the Schrock−Osborn-type [Rh(COD)L2][TfO] (L = TPPTS) complex. The expected reaction sequence is shown in Scheme 1. In a previous study, TPPTS has shown a particularly high solubility in [C2C1Im][EtOSO3] and exhibited surface activity [73]. In parallel with the solutions discussed above, we first consider a 20%mol solution of [Rh(COD)2][TfO] in [C2C1Im][EtOSO3], without adding TPPTS. Figure 4 depicts the ARXPS spectra and Table 2a shows the quantitative analysis of the peak intensities (note that the full set of spectra is shown in Figure S10 in the SI). The spectra show similar characteristics as have been observed and discussed for [TfO] ILs (see above), concerning Rh 3d binding energy, proportion of the oxidized Rh species, deficit of COD ligand, and depletion of the metal from the gas/IL interface. The ARXPS measurements on neat [C2C1Im][EtOSO3] (see Figure S11 for full set of spectra) reveal only a slight increase in the Calkyl signal when comparing the 0° and 80° emission spectra, which corresponds to a preferential surface orientation with the ethyl substituents of the cation and anion towards the vacuum. With this, the decrease in the Calkyl/COD signal seen in Figure 4 has to be fully assigned to the depletion of the metal complex from the gas/IL interface. The O 1s region displays two distinguishable species. OC-O-S corresponds to oxygen atoms bound to carbon and to sulfur in the [EtOSO3] anion, while the OSO3 signal includes the remaining oxygen atoms from the IL anion and the oxygen atoms from the [TfO] anion.
The peak intensity detected for the F 1s signal is significantly higher for 0° than expected from the nominal composition. In addition, the peak increase at 80° by far exceeded the magnitude typically observed for a pure orientational effect, as pointed out for the [TfO] ILs discussed above. Besides the expected preferential orientation of the [TfO] anion with the CF3 group pointing towards the vacuum, these effects are attributed to a selective enrichment of [TfO] at the IL/vacuum interface. The much larger than nominal CTfO signal, and its enhancement at 80°, supported this interpretation. Interestingly, the enrichment of the [TfO] at the IL/vacuum interface is not accompanied by an enrichment of the original counter ion [Rh(COD)2]+, but rather indicates an ion metathesis at the surface with a higher surface concentration of [C2C1Im]+ and [TfO] and a lower surface concentration of [Rh(COD)2]+ and [EtOSO3]. Apart from this effect, the behavior of the Rh-containing cation is similar to that in [C2C1Im][TfO] and [C4C1Im][TfO], in particular concerning the partial loss of the labile COD ligand.
As a next step, we address the desired ligand substitution using TPPTS according to Scheme 1. The maximum solubility of TPPTS in [C2C1Im][EtOSO3] was reported as 16.1%mol in the literature [73]. However, the XPS analysis of a saturated solution of TPPTS in [C2C1Im][EtOSO3] (concentration ~16.6%mol TPPTS, see experimental section and Table S8 for details), as shown in Figure S12 and Table S7, reveals a much lower intensity of TPPTS-specific P and Na signals than expected from the reported solubility. The intensity of the P 2p signal in the 0° emission corresponds to a solubility of ~7%mol of TPPTS in [C2C1Im][EtOSO3] (note that this finding is independent of using acetonitrile as a co-solvent, as has been used in literature [73], or not). Due to the very low intensity of the P 2p signal, a relatively high uncertainty must be expected for the derived solubility. For the ligand substitution reaction, we chose a slightly lower TPPTS content (5.9%mol TPPTS) to ensure full dissolution of the ligand before [Rh(COD)2][TfO] was added (see below). The full set of ARXPS spectra of the 5.9%mol solution of TPPTS in [C2C1Im][EtOSO3] is shown in Figure S13 (note that a detailed description of the relevant spectra is given below). The quantitative analysis of all signals shown in Table 2b reveals good agreement with the nominal composition, confirming the complete dissolution of TPPTS.
Finally, we discuss the spectra of the solution obtained by adding TPPTS to the ligand substitution, as shown in Figure 5a (full set of spectra shown in Figure S14). The nominal Rh:TPPTS ratio was chosen to be 1:2, as expected for the molecular structure of [Rh(COD)(TPPTS)2][TfO], and the nominal composition of the solution was chosen according to the 5.9%mol solution of TPPTS in [C2C1Im][EtOSO3], as discussed above. Thus, assuming the quantitative formation of the final complex, a Rh:TPPTS:IL ratio of 1:2:31.6 must be expected (yielding a concentration of 3.1%mol of [Rh(COD)(TPPTS)2][TfO]) in the solution. The quantitative analysis is shown in Table 2c. The Rh 3d5/2 signal is found at 309.0 eV and thus slightly shifted by 0.2 eV to a lower binding energy compared with the 20%mol solution of [Rh(COD)2][TfO] in [C2C1Im][EtOSO3] without adding the ligand (cf. Table 2a). Even though the extent of this shift is on the limit of experimental uncertainty, it is in line with coordination of the strong electron donating phosphine ligands. Further proof for successful coordination of TPPTS to the metal center can be extracted from comparison with the spectra obtained from the equimolar solution of TPPTS in [C2C1Im][EtOSO3], as shown in Figure 5b and Figure S13. Comparing the P 2p spectra (middle-right of Figure 5a,b) reveals a shift of 0.7 eV to a higher binding energy for the Rh-containing mixture, which is in accordance with the electron donation of the phosphorus atom to the metal center.
As shown in Table 2c, the experimental Rh content in the solution derived from the signal intensities in the 0° emission agrees well with the nominal composition, which is in contrast with the mixtures discussed above, without adding TPPTS, where only 55–68% of the nominal concentration was found (see Table 1 and Table 2a). This confirms the presence of the metal complex in the topmost layer, that is, a significantly higher concentration in the surface-near region upon ligand substitution with TPPTS compared with the [Rh(COD)2][TfO] solutions. All other atomic species are in line with the nominal stoichiometry, except for F 1s and Na 1s. For the F 1s signal, this must be assigned to the enrichment of the [TfO] anion at the IL/vacuum interface, as discussed for the 20%mol solution of [Rh(COD)2][TfO] in [C2C1Im][EtOSO3]. For the Na 1s signal, this finding is in agreement with the TPPTS-only solution and indicated preferential depletion of Na+ from the surface, whereby the SO3 groups could be charge-compensated by [C2C1Im]+ cations [73]. In the C 1s region, the signals from the TPPTS ligand superimpose with the Calkyl and CCOD signals to give a joint Calkyl/COD/phenyl signal. The intensity of this signal strongly increases at 80°, while all other signals show a decrease, except for the F 1s signal, which is due to the enrichment and preferred orientation of the [TfO] anion at the surface. The increase in the Calkyl/COD/phenyl signal emphasizes the surface affinity of the TPPTS ligand. In comparison with the TPPTS-only solution (Figure 5b middle-left), the increase is less pronounced for the metal-containing solution, which could be attributed to the contribution of the non-surface-active COD ligand to the signal. This indicates a preferential surface orientation of the complex, with the TPPTS ligands terminating the surface, while the metal center and the COD ligand are directed towards the bulk. Note that due to the low concentration and specific orientation of the final complex, no Rh 3d signal and P 2p signal signals could be resolved at 80°. As can be extracted from Table 2c, the S 2p and OSO3 signals show a decrease at 80°, indicating that the non-polar phenyl moieties occupy the outer surface, while the charged SO3 groups point towards the bulk, similar to observations made previously [73].

3. Experimental Section

3.1. Materials and Synthesis

[Rh(COD)2][TfO] (purity 98%) and TPPTS (purity 95%) were purchased from Sigma-Aldrich. [C2C1Im][TfO], [C4C1Im][TfO], [C8C1Im][TfO], and [C2C1Im][EtOSO3] (purity of all ILs used was 99%) were purchased from Iolitec. The chemicals were used as delivered.

3.2. Sample Preparation

Exact weighed proportions and concentrations of the solutions employed are given in Table S8 in the SI.

3.3. Solutions of [Rh(COD)2][TfO] in ILs

[Rh(COD)2][TfO] was dissolved in the respective IL under ambient conditions for at least 3 h to produce clear, deep red solutions.

3.4. Saturated Solution of TPPTS in [C2C1Im][EtOSO3]

TPPTS was stirred in [C2C1Im][EtOSO3] under ambient conditions for 3 h. Bigger excess particles of TPPTS were allowed to settle to the ground of the vessel. A white suspension was obtained.

3.5. 5.9.%mol Solution of TPPTS in [C2C1Im][EtOSO3]

TPPTS was stirred in [C2C1Im][EtOSO3] under ambient conditions for 24 h. A small amount of fine particles remained undissolved and were allowed to settle to the ground of the vessel to yield a clear colorless solution. The remaining particles were assigned to insoluble contaminations due the relatively low purity grade of TPPTS (95%).

3.6. Solution for Ligand Substitution

TPPTS was dissolved by stirring for 70 h in [C2C1Im][EtOSO3] in an inert gas atmosphere to yield a solution with similar characteristics as the 5.9%mol solution described above. [Rh(COD)2][TfO] was added and the mixture was stirred for 24 h under vacuum conditions using standard Schlenk techniques to yield a clear, deep red solution. Note that no co-solvent was employed for the preparation of the solution, as it had been used for a similar ligand substitution reaction reported previously [73].
The samples were applied onto the setup-compatible [84] molybdenum sample holders under ambient conditions. Prior to performing the XPS analyses, the samples were left for degassing for at least 12 h in the load-lock of the UHV apparatus.

3.7. ARXPS Measurements and Data Evaluation

XPS analyses were conducted using the DASSA (dual analyzer system for surface analysis) setup comprising two identical analyzers in 0° and in 80° emission geometry. For details, see [84]. We used monochromatized Al-Kα radiation (Source: XM 1000, 14 kV, 238 W, hν = 1486.6 eV).
Survey scans were recorded with a pass energy of 150 eV, while high-resolution region scans were taken with a pass energy of 35 eV. Moreover, 0° spectra were referenced to the F 1s signal of the [TfO] anion at 688.8 eV, and 80° spectra were referenced to the binding energy of the N 1s signals of the imidazolium ring at 80°. For the sake of comparability, XP spectra of neat [C2C1Im][EtOSO3] and the solutions of TPPTS in [C2C1Im][EtOSO3] were referenced to the N 1s imidazolium peak of the 20%mol solution of [Rh(COD)2][TfO] in [C2C1Im][EtOSO3].
For quantitative analysis of the intensities, atomic sensitivity factors were used [105]. XP spectra were normalized to the total intensity detected from the region scans of the 20%mol solution of [Rh(COD)2][TfO] in [C2C1Im][TfO]. For the Rh 3d spectra, a Shirley background was subtracted, while for non-metallic species, a two-point linear background subtraction was performed. For the C 1s spectra, a three-point linear background was subtracted, if a CTfO signal at ~293 eV was detected. Peak fitting was achieved using a Gauss−Lorentzian function with 30% Lorentzian contribution. Individual fitting procedures are outlined in the SI. Deconvolution of spin−orbit resolved signals was achieved using constraints according to the degeneracy ratio of the orbitals with identical full with at half maximum (FWHM) values. Spin−orbit-induced binding energy shifts were constraint as follows: 4.70 eV for Rh 3d, 0.90 eV for P 2p, and 1.21 eV for S 2p. For the sake of visual comparability, the inherently lower intensity of the 80° spectra was compensated for by scaling with a factor derived from the total intensity of all region spectra obtained in the two analyzation geometries [84].
During XPS measurements of solid [Rh(COD)2][TfO], an electron gun was used for charge compensation.

4. Conclusions

We studied the composition and surface behavior of [Rh(COD)2][TfO] in [C2C1Im][TfO], [C4C1Im][TfO], [C8C1Im][TfO], and [C2C1Im][EtOSO3] under well-defined UHV conditions by ARXPS. In the ILs with ethyl and butyl chains, we found a deficit of COD ligands indicating non-intactness of the catalyst under measuring conditions. In all cases, the metal species present in the solution are depleted from the IL/vacuum interface. Increasing the chain length of the aliphatic substituent on the imidazolium cation of the [TfO]-based ILs leads to a more pronounced depletion from this interface, which is most likely due to a higher surface affinity of the solvent cations with longer chains. The stoichiometric deficiency of COD suggests a simple route towards increasing the metal concentration at the IL/vacuum interface by offering a surface-active ligand, such as TPPTS [73]. We propose the formation of a Schrock−Osborn catalyst [Rh(COD)(TPPTS)2][TfO] by ligand substitution. Indeed, ARXPS investigations show a higher concentration of the metal center at the interface after ligand substitution, as has been observed previously when employing TPPTS [73]. These results are highly relevant for the design of IL-based catalytic systems with high surface areas between catalyst solutions and fluid reactant/product surroundings, such as in SILP or biphasic catalysis.

Supplementary Materials

The following supporting information can be downloaded at: https://www.mdpi.com/article/10.3390/catal13050871/s1, Figure S1: Survey, Rh 3d, C 1s, F 1s, N 1s, O 1s, S 2p and Si 2p XP spectra of a 20%mol solution of [Rh(COD)2][TfO] in [C2C1Im][TfO] in 0° (black) and 80° (red) emission recorded at room temperature with assignment of peaks to the molecular structure; Figure S2: Rh 3d XP spectra of 20%mol solutions of [Rh(COD)2][TfO] in [C2C1Im][TfO] (a) prepared in air, (b) prepared under exclusion of air, (c) solution shown in (b) after more than 100 min of X-radiation. (d) shows the Rh 3d XP spectrum of the solid catalyst. For sake of comparability, the spectrum shown in (d) was referenced to the binding energy of the signal shown in (a). Note that the spectrum shown in (d) shows broadening due to charging of the solid sample. All spectra were recorded in 0° emission at room temperature; Figure S3: Survey, C 1s, F 1s, N 1s, O 1s, S 2p and Si 2p XP spectra of neat [C2C1Im][TfO] in 0° (black) and 80° (red) emission recorded at room temperature with assignment of peaks to the molecular structure; Figure S4: O 1s XP spectra of the 20%mol solution of [Rh(COD)2][TfO] in [C2C1Im][TfO] shown in Figure S1 (black) and neat [C2C1Im][TfO] shown in Figure S3 (blue) in 0° emission recorded at room temperature. The Arrow indicates the additional shoulder in the black spectrum most likely due to [TfO]− anions coordinating to the metal center (for details, see main text); Figure S5: Survey, Rh 3d, C 1s, F 1s, N 1s, O 1s, S 2p and Si 2p XP spectra of a 9%mol solution of [Rh(COD)2][TfO] in [C2C1Im][TfO] in 0° (black) and 80° (red) emission recorded at room temperature with assignment of peaks to the molecular structure; Figure S6: Survey, Rh 3d, C 1s, F 1s, N 1s, O 1s, S 2p and Si 2p XP spectra of a 20%mol solution of [Rh(COD)2][TfO] in [C4C1Im][TfO] in 0° (black) and 80° (red) emission recorded at room temperature with assignment of peaks to the molecular structure; Figure S7: Survey, C 1s, F 1s, N 1s, O 1s, S 2p and Si 2p XP spectra of neat [C4C1Im][TfO] in 0° (black) and 80° (red) emission recorded at room temperature with assignment of peaks to the molecular structure; Figure S8: Survey, Rh 3d, C 1s, F 1s, N 1s, O 1s, S 2p and Si 2p XP spectra of a 20%mol solution of [Rh(COD)2][TfO] in [C8C1Im][TfO] in 0° (black) and 80° (red) emission recorded at room temperature with assignment of peaks to the molecular structure; Figure S9: Survey, C 1s, F 1s, N 1s, O 1s, S 2p and Si 2p XP spectra of neat [C8C1Im][TfO] in 0° (black) and 80° (red) emission recorded at room temperature with assignment of peaks to the molecular structure; Figure S10: Survey, Rh 3d, C 1s, F 1s, N 1s, O 1s, S 2p and Si 2p XP spectra of a 20%mol solution of [Rh(COD)2][TfO] in [C2C1Im][EtOSO3] in 0° (black) and 80° (red) emission recorded at room temperature with assignment of peaks to the molecular structure; Figure S11: Survey, C 1s, N 1s, O 1s, S 2p and Si 2p XP spectra of neat [C2C1Im][EtOSO3] in 0° (black) and 80° (red) emission recorded at room temperature with assignment of peaks to the molecular structure.; Figure S12: Survey, C 1s, F 1s, N 1s, O 1s, S 2p, P 2p, Na 1s and Si 2p XP spectra of a saturated solution of TPPTS in [C2C1Im][EtOSO3] in 0° (black) and 80° (red) emission recorded at room temperature with assignment of peaks to the molecular structure; Figure S13: Survey, C 1s, F 1s, N 1s, O 1s, S 2p, P 2p, Na 1s and Si 2p XP spectra of a 5.9%mol solution of TPPTS in [C2C1Im][EtOSO3] in 0° (black) and 80° (red) emission recorded at room temperature with assignment of peaks to the molecular structure; Figure S14: Survey, Rh 3d, C 1s, F 1s, N 1s, O 1s, S 2p, P 2p, Na 1s and Si 2p XP spectra of a solution of [Rh(COD)2][TfO] and TPPTS in [C2C1Im][EtOSO3] with 1:2:31.6 ratio in 0° (black) and 80° (red) emission recorded at room temperature with assignment of peaks to the molecular structure; Table S1: Quantitative analysis of ARXPS core level spectra of neat [C2C1Im][TfO]; Table S2: Atomic sensitivity factor (ASF)-corrected intensities obtained from XPS of a 20%mol solution of [Rh(COD)2][TfO] in [C2C1Im][TfO] in 0° emission relevant for the calculation of the actual COD content; Table S3: Estimation of COD content per metal center in 20%mol solutions of [Rh(COD)2][TfO] in [C2C1Im][TfO], [C4C1Im][TfO], [C8C1Im][TfO], [C2C1Im][EtOSO3] (a, c–e) and 9%mol solution in [C2C1Im][TfO] (b) using approaches I, I.2 and II outlined above. As the numbers derived from approach II (bold) are the most reliable one, they are used for the further discussion; Table S4: Quantitative analysis of ARXPS core level spectra of neat [C4C1Im][TfO]; Table S5: Quantitative analysis of ARXPS core level spectra of neat [C8C1Im][TfO]; Table S6: Quantitative analysis of ARXPS core level spectra of neat [C2C1Im][EtOSO3]; Table S7: Quantitative analysis of XPS core level spectra recorded in 0° emission of a solution of TPPTS in [C2C1Im][EtOSO3] assuming a solubility of 16.1%mol; Table S8: Weighed proportions for mixtures investigated in this work; Reference [106] is cited in the supplementary materials.

Author Contributions

Conceptualization, D.H., F.M. and H.-P.S.; methodology, D.H.; software, D.H.; validation, D.H., F.M. and H.-P.S.; formal analysis, D.H.; investigation, D.H. and U.P.; resources, D.H., F.M. and H.-P.S.; data curation, D.H.; writing—original draft preparation, D.H.; writing—review and editing, D.H., F.M. and H.-P.S.; visualization, D.H.; supervision, F.M. and H.-P.S.; project administration, F.M. and H.-P.S.; funding acquisition, H.-P.S. All authors have read and agreed to the published version of the manuscript.

Funding

Funded by the Deutsche Forschungsgemeinschaft (DFG, German Research Foundation)—Project-ID 431791331—SFB 1452. D. H. thanks the Stiftung Stipendien-Fonds of the German chemical industry association (Verband der Chemischen Industrie, VCI) for a Kekulé fellowship.

Data Availability Statement

The data that support the findings of this study are available from the corresponding author upon reasonable request.

Conflicts of Interest

The authors declare no conflict of interest.

References

  1. Welton, T. Room-Temperature Ionic Liquids. Solvents for Synthesis and Catalysis. Chem. Rev. 1999, 99, 2071–2084. [Google Scholar] [CrossRef] [PubMed]
  2. Welton, T. Ionic liquids in catalysis. Coord. Chem. Rev. 2004, 248, 2459–2477. [Google Scholar] [CrossRef]
  3. Hallett, J.P.; Welton, T. Room-Temperature Ionic Liquids: Solvents for Synthesis and Catalysis. 2. Chem. Rev. 2011, 111, 3508–3576. [Google Scholar] [CrossRef] [PubMed]
  4. Hayes, R.; Warr, G.G.; Atkin, R. Structure and Nanostructure in Ionic Liquids. Chem. Rev. 2015, 115, 6357–6426. [Google Scholar] [CrossRef]
  5. Chiappe, C.; Pieraccini, D. Ionic liquids: Solvent properties and organic reactivity. J. Phys. Org. Chem. 2005, 18, 275–297. [Google Scholar] [CrossRef]
  6. Marullo, S.; D’Anna, F.; Rizzo, C.; Billeci, F. Ionic liquids: “Normal” solvents or nanostructured fluids? Org. Biomol. Chem. 2021, 19, 2076–2095. [Google Scholar] [CrossRef]
  7. Pešić, J.; Watson, M.; Papović, S.; Vraneš, M. Ionic Liquids: Review of their Current and Future Industrial Applications and their Potential Environmental Impact. Recent Pat. Nanotechnol. 2021, 15, 225–244. [Google Scholar] [CrossRef]
  8. Greer, A.J.; Jacquemin, J.; Hardacre, C. Industrial Applications of Ionic Liquids. Molecules 2020, 25, 5207. [Google Scholar] [CrossRef]
  9. Vekariya, R.L. A review of ionic liquids: Applications towards catalytic organic transformations. J. Mol. Liq. 2017, 227, 44–60. [Google Scholar] [CrossRef]
  10. Martins, M.A.P.; Frizzo, C.P.; Moreira, D.N.; Zanatta, N.; Bonacorso, H.G. Ionic Liquids in Heterocyclic Synthesis. Chem. Rev. 2008, 108, 2015–2050. [Google Scholar] [CrossRef]
  11. Dhameliya, T.M.; Nagar, P.R.; Bhakhar, K.A.; Jivani, H.R.; Shah, B.J.; Patel, K.M.; Patel, V.S.; Soni, A.H.; Joshi, L.P.; Gajjar, N.D. Recent advancements in applications of ionic liquids in synthetic construction of heterocyclic scaffolds: A spotlight. J. Mol. Liq. 2022, 348, 118329. [Google Scholar] [CrossRef]
  12. Dai, C.; Zhang, J.; Huang, C.; Lei, Z. Ionic Liquids in Selective Oxidation: Catalysts and Solvents. Chem. Rev. 2017, 117, 6929–6983. [Google Scholar] [CrossRef]
  13. Dyson, P. Review: Synthesis of organometallics and catalytic hydrogenations in ionic liquids. Appl. Organomet. Chem. Appl. Organometal. Chem. 2002, 16, 495–500. [Google Scholar] [CrossRef]
  14. Hemmeter, D.; Paap, U.; Taccardi, N.; Mehler, J.; Schulz, P.; Wasserscheid, P.; Maier, F.; Steinrück, H.-P. Formation and surface behavior of Pt and Pd complexes with ligand systems derived from nitrile-functionalized ionic liquids studied by XPS. ChemPhysChem 2022, 24, e202200391. [Google Scholar]
  15. Zhao, D.; Fei, Z.; Geldbach, T.J.; Scopelliti, R.; Dyson, P.J. Nitrile-Functionalized Pyridinium Ionic Liquids:  Synthesis, Characterization, and Their Application in Carbon−Carbon Coupling Reactions. J. Am. Chem. Soc. 2004, 126, 15876–15882. [Google Scholar] [CrossRef]
  16. He, Z.; Alexandridis, P. Nanoparticles in ionic liquids: Interactions and organization. Phys. Chem. Chem. Phys. 2015, 17, 18238–18261. [Google Scholar] [CrossRef]
  17. Denicourt-Nowicki, A.; Léger, B.; Roucoux, A. N-Donor ligands based on bipyridine and ionic liquids: An efficient partnership to stabilize rhodium colloids. Focus on oxygen-containing compounds hydrogenation. Phys. Chem. Chem. Phys. 2011, 13, 13510–13517. [Google Scholar] [CrossRef]
  18. Antonietti, M.; Kuang, D.; Smarsly, B.; Zhou, Y. Ionic Liquids for the Convenient Synthesis of Functional Nanoparticles and Other Inorganic Nanostructures. Angew. Chem. Int. Ed. 2004, 43, 4988–4992. [Google Scholar] [CrossRef]
  19. Ejigu, A.; Walsh, D.A. Electrocatalysis in Room Temperature Ionic Liquids. In Electrochemistry in Ionic Liquids: Volume 2: Applications; Torriero, A.A.J., Ed.; Springer International Publishing: Heidelberg, Germany, 2015; pp. 483–506. [Google Scholar]
  20. Zhang, G.-R.; Etzold, B.J.M. Ionic liquids in electrocatalysis. J. Energy Chem. 2016, 25, 199–207. [Google Scholar] [CrossRef]
  21. Tan, X.; Sun, X.; Han, B. Ionic liquid-based electrolytes for CO2 electroreduction and CO2 electroorganic transformation. Natl. Sci. Rev. 2021, 9, nwab022. [Google Scholar] [CrossRef]
  22. Itoh, T. Ionic Liquids as Tool to Improve Enzymatic Organic Synthesis. Chem. Rev. 2017, 117, 10567–10607. [Google Scholar] [CrossRef] [PubMed]
  23. van Rantwijk, F.; Sheldon, R.A. Biocatalysis in Ionic Liquids. Chem. Rev. 2007, 107, 2757–2785. [Google Scholar] [CrossRef] [PubMed]
  24. Steinrück, H.-P.; Wasserscheid, P. Ionic Liquids in Catalysis. Catal. Lett. 2015, 145, 380–397. [Google Scholar] [CrossRef]
  25. Bartlewicz, O.; Dąbek, I.; Szymańska, A.; Maciejewski, H. Heterogeneous Catalysis with the Participation of Ionic Liquids. Catalysts 2020, 10, 1227. [Google Scholar] [CrossRef]
  26. Meyer, C.; Hager, V.; Schwieger, W.; Wasserscheid, P. Enhanced activity and selectivity in n-octane isomerization using a bifunctional SCILL catalyst. J. Catal. 2012, 292, 157–165. [Google Scholar] [CrossRef]
  27. Kernchen, U.; Etzold, B.; Korth, W.; Jess, A. Solid Catalyst with Ionic Liquid Layer (SCILL)—A New Concept to Improve Selectivity Illustrated by Hydrogenation of Cyclooctadiene. Chem. Eng. Technol. 2007, 30, 985–994. [Google Scholar] [CrossRef]
  28. Riisager, A.; Fehrmann, R.; Haumann, M.; Wasserscheid, P. Supported Ionic Liquid Phase (SILP) Catalysis: An Innovative Concept for Homogeneous Catalysis in Continuous Fixed-Bed Reactors. Eur. J. Inorg. Chem. 2006, 2006, 695–706. [Google Scholar] [CrossRef]
  29. Riisager, A.; Jørgensen, B.; Wasserscheid, P.; Fehrmann, R. First application of supported ionic liquid phase (SILP) catalysis for continuous methanol carbonylation. Chem. Commun. 2006, 9, 994–996. [Google Scholar] [CrossRef]
  30. Marinkovic, J.M.; Riisager, A.; Franke, R.; Wasserscheid, P.; Haumann, M. Fifteen Years of Supported Ionic Liquid Phase-Catalyzed Hydroformylation: Material and Process Developments. Ind. Eng. Chem. Res. 2019, 58, 2409–2420. [Google Scholar] [CrossRef]
  31. Baldelli, S. Interfacial Structure of Room-Temperature Ionic Liquids at the Solid–Liquid Interface as Probed by Sum Frequency Generation Spectroscopy. J. Phys. Chem. Lett. 2013, 4, 244–252. [Google Scholar] [CrossRef]
  32. Peñalber-Johnstone, C.; Adamová, G.; Plechkova, N.V.; Bahrami, M.; Ghaed-Sharaf, T.; Ghatee, M.H.; Seddon, K.R.; Baldelli, S. Sum frequency generation spectroscopy of tetraalkylphosphonium ionic liquids at the air–liquid interface. J. Chem. Phys. 2018, 148, 193841. [Google Scholar] [CrossRef]
  33. Huo, F.; Ding, J.; Tong, J.; He, H. Ionic liquid-air interface probed by sum frequency generation spectroscopy and molecular dynamics simulation: Influence of alkyl chain length and anion volume. Mol. Simul. 2022, 48, 844–854. [Google Scholar] [CrossRef]
  34. Iwahashi, T.; Ishiyama, T.; Sakai, Y.; Morita, A.; Kim, D.; Ouchi, Y. Bi-layering at ionic liquid surfaces: A sum-frequency generation vibrational spectroscopy- and molecular dynamics simulation-based study. Phys. Chem. Chem. Phys. 2020, 22, 12565–12576. [Google Scholar] [CrossRef]
  35. Sissaoui, J.; Budkina, D.S.; Vauthey, E. Probing Liquid Interfaces with Room-Temperature Ionic Liquids Using the Excited-State Dynamics of a Cationic Dye. J. Phys. Chem. B 2020, 124, 10546–10555. [Google Scholar] [CrossRef]
  36. Nishi, N.; Ishimatsu, R.; Yamamoto, M.; Kakiuchi, T. Orientation of 1-Dodecyl-4-phenylpyridinium Ions Constituting an Ionic Liquid at the Ionic Liquid|Water Interface Studied by Second Harmonic Generation. J. Phys. Chem. C 2007, 111, 12461–12466. [Google Scholar] [CrossRef]
  37. Costa, R.; Pereira, C.M.; Silva, A.F.; Brevet, P.-F.; Benichou, E. Ordering and Nonideality of Air–Ionic Liquid Interfaces in Surface Second Harmonic Generation. J. Phys. Chem. B 2020, 124, 3954–3961. [Google Scholar] [CrossRef]
  38. An, R.; Wei, Y.; Qiu, X.; Dai, Z.; Wu, M.; Gnecco, E.; Shah, F.U.; Zhang, W. Ionic liquids on uncharged and charged surfaces: In situ microstructures and nanofriction. Friction 2022, 10, 1893–1912. [Google Scholar] [CrossRef]
  39. Liu, S.; Peng, J.; Chen, L.; Sebastián, P.; Feliu, J.M.; Yan, J.; Mao, B. In-situ STM and AFM Studies on Electrochemical Interfaces in imidazolium-based ionic liquids. Electrochim. Acta 2019, 309, 11–17. [Google Scholar] [CrossRef]
  40. Endres, F.; Borisenko, N.; El Abedin, S.Z.; Hayes, R.; Atkin, R. The interface ionic liquid(s)/electrode(s): In situ STM and AFM measurements. Faraday Discuss. 2012, 154, 221–233; discussion 313–333, 465–471. [Google Scholar] [CrossRef]
  41. Rodenbücher, C.; Wippermann, K.; Korte, C. Atomic Force Spectroscopy on Ionic Liquids. Appl. Sci. 2019, 9, 2207. [Google Scholar] [CrossRef]
  42. Pajkossy, T.; Müller, C.; Jacob, T. The metal–ionic liquid interface as characterized by impedance spectroscopy and in situ scanning tunneling microscopy. Phys. Chem. Chem. Phys. 2018, 20, 21241–21250. [Google Scholar] [CrossRef] [PubMed]
  43. Sloutskin, E.; Ocko, B.M.; Tamam, L.; Kuzmenko, I.; Gog, T.; Deutsch, M. Surface Layering in Ionic Liquids:  An X-ray Reflectivity Study. J. Am. Chem. Soc. 2005, 127, 7796–7804. [Google Scholar] [CrossRef] [PubMed]
  44. Mars, J.; Hou, B.; Weiss, H.; Li, H.; Konovalov, O.; Festersen, S.; Murphy, B.M.; Rütt, U.; Bier, M.; Mezger, M. Surface induced smectic order in ionic liquids—An X-ray reflectivity study of [C22C1im]+[NTf2]. Phys. Chem. Chem. Phys. 2017, 19, 26651–26661, Erratum in Phys. Chem. Chem. Phys. 2018, 20, 24494–24495. [Google Scholar] [CrossRef] [PubMed]
  45. Villar-Garcia, I.J.; Fearn, S.; De Gregorio, G.F.; Ismail, N.L.; Gschwend, F.J.V.; McIntosh, A.J.S.; Lovelock, K.R.J. The ionic liquid–vacuum outer atomic surface: A low-energy ion scattering study. Chem. Sci. 2014, 5, 4404–4418. [Google Scholar] [CrossRef]
  46. Kauling, A.; Ebeling, G.; Morais, J.; Pádua, A.; Grehl, T.; Brongersma, H.H.; Dupont, J. Surface Composition/Organization of Ionic Liquids with Au Nanoparticles Revealed by High-Sensitivity Low-Energy Ion Scattering. Langmuir 2013, 29, 14301–14306. [Google Scholar] [CrossRef]
  47. Nakajima, K.; Miyashita, M.; Suzuki, M.; Kimura, K. Surface structures of binary mixtures of imidazolium-based ionic liquids using high-resolution Rutherford backscattering spectroscopy and time of flight secondary ion mass spectroscopy. J. Chem. Phys. 2013, 139, 224701. [Google Scholar] [CrossRef]
  48. Bomhardt, K.; Schneider, P.; Glaser, T.; Dürr, M. Surface Properties of Ionic Liquids: A Mass Spectrometric View Based on Soft Cluster-Induced Desorption. J. Am. Soc. Mass. Spectrom. 2022, 33, 974–980. [Google Scholar] [CrossRef]
  49. Krischok, S.; Eremtchenko, M.; Himmerlich, M.; Lorenz, P.; Uhlig, J.; Neumann, A.; Öttking, R.; Beenken, W.J.D.; Höfft, O.; Bahr, S.; et al. Temperature-Dependent Electronic and Vibrational Structure of the 1-Ethyl-3-methylimidazolium Bis(trifluoromethylsulfonyl)amide Room-Temperature Ionic Liquid Surface:  A Study with XPS, UPS, MIES, and HREELS. J. Phys. Chem. B 2007, 111, 4801–4806. [Google Scholar] [CrossRef]
  50. Krischok, S.; Ulbrich, A.; Ikari, T.; Kempter, V.; Marschewski, M.; Höfft, O. Surface structure of [XMIm]Tf2N ultrathin ionic liquid films probed by metastable He atoms and photoelectron spectroscopies (UPS and XPS). Nucl. Instrum. Methods Phys. Res. Sect. B Beam Interact. Mater. At. 2014, 340, 51–57. [Google Scholar] [CrossRef]
  51. Biedron, A.B.; Garfunkel, E.L.; Castner, E.W., Jr.; Rangan, S. Ionic liquid ultrathin films at the surface of Cu(100) and Au(111). J. Chem. Phys. 2017, 146, 054704. [Google Scholar] [CrossRef]
  52. Smoll, E.J.; Tesa-Serrate, M.A.; Purcell, S.M.; D’Andrea, L.; Bruce, D.W.; Slattery, J.M.; Costen, M.L.; Minton, T.K.; McKendrick, K.G. Determining the composition of the vacuum–liquid interface in ionic-liquid mixtures. Faraday Discuss. 2018, 206, 497–522. [Google Scholar] [CrossRef]
  53. Tesa-Serrate, M.A.; Marshall, B.C.; Smoll, E.J., Jr.; Purcell, S.M.; Costen, M.L.; Slattery, J.M.; Minton, T.K.; McKendrick, K.G. Ionic Liquid–Vacuum Interfaces Probed by Reactive Atom Scattering: Influence of Alkyl Chain Length and Anion Volume. J. Phys. Chem. C 2015, 119, 5491–5505. [Google Scholar] [CrossRef]
  54. Purcell, S.M.; Lane, P.D.; D’Andrea, L.; Elstone, N.S.; Bruce, D.W.; Slattery, J.M.; Smoll, E.J., Jr.; Greaves, S.J.; Costen, M.L.; Minton, T.K.; et al. Surface Structure of Alkyl/Fluoroalkylimidazolium Ionic–Liquid Mixtures. J. Phys. Chem. B 2022, 126, 1962–1979. [Google Scholar] [CrossRef]
  55. Meusel, M.; Gezmis, A.; Jaekel, S.; Lexow, M.; Bayer, A.; Maier, F.; Steinrück, H.-P. Time- and Temperature-Dependent Growth Behavior of Ionic Liquids on Au(111) Studied by Atomic Force Microscopy in Ultrahigh Vacuum. J. Phys. Chem. C 2021, 125, 20439–20449. [Google Scholar] [CrossRef]
  56. Meusel, M.; Lexow, M.; Gezmis, A.; Bayer, A.; Maier, F.; Steinrück, H.-P. Growth of Multilayers of Ionic Liquids on Au(111) Investigated by Atomic Force Microscopy in Ultrahigh Vacuum. Langmuir 2020, 36, 13670–13681. [Google Scholar] [CrossRef]
  57. Meusel, M.; Lexow, M.; Gezmis, A.; Schötz, S.; Wagner, M.; Bayer, A.; Maier, F.; Steinrück, H.-P. Atomic Force and Scanning Tunneling Microscopy of Ordered Ionic Liquid Wetting Layers from 110 K up to Room Temperature. ACS Nano 2020, 14, 9000–9010. [Google Scholar] [CrossRef]
  58. Uhl, B.; Buchner, F.; Alwast, D.; Wgner, N.; Behm, R.J. Adsorption of the ionic liquid [BMP][TFSA] on Au(111) and Ag(111): Substrate effects on the structure formation investigated by STM. Beilstein J. Nanotechnol. 2013, 4, 903–918. [Google Scholar] [CrossRef]
  59. Waldmann, T.; Huang, H.-H.; Hoster, H.E.; Höfft, O.; Endres, F.; Behm, R.J. Imaging an Ionic Liquid Adlayer by Scanning Tunneling Microscopy at the Solid|Vacuum Interface. ChemPhysChem 2011, 12, 2565–2567. [Google Scholar] [CrossRef]
  60. Seidl, V.; Bosch, M.; Paap, U.; Livraghi, M.; Zhai, Z.; Wick, C.R.; Koller, T.M.; Wasserscheid, P.; Maier, F.; Smith, A.-S.; et al. Bis-polyethylene glycol-functionalized imidazolium ionic liquids: A multi-method approach towards bulk and surface properties. J. Ion. Liq. 2022, 2, 100041. [Google Scholar] [CrossRef]
  61. Kolbeck, C.; Niedermaier, I.; Deyko, A.; Lovelock, K.R.J.; Taccardi, N.; Wei, W.; Wasserscheid, P.; Maier, F.; Steinrück, H.-P. Influence of Substituents and Functional Groups on the Surface Composition of Ionic Liquids. Chem. Eur. J. 2014, 20, 3954–3965. [Google Scholar] [CrossRef] [PubMed]
  62. Kolbeck, C.; Killian, M.; Maier, F.; Paape, N.; Wasserscheid, P.; Steinrück, H.-P. Surface Characterization of Functionalized Imidazolium-Based Ionic Liquids. Langmuir 2008, 24, 9500–9507. [Google Scholar] [CrossRef] [PubMed]
  63. Dick, E.J.; Fouda, A.E.A.; Besley, N.A.; Licence, P. Probing the electronic structure of ether functionalised ionic liquids using X-ray photoelectron spectroscopy. Phys. Chem. Chem. Phys. 2020, 22, 1624–1631. [Google Scholar] [CrossRef] [PubMed]
  64. Kolbeck, C.; Cremer, T.; Lovelock, K.R.J.; Paape, N.; Schulz, P.S.; Wasserscheid, P.; Maier, F.; Steinrück, H.P. Influence of Different Anions on the Surface Composition of Ionic Liquids Studied Using ARXPS. J. Phys. Chem. B 2009, 113, 8682–8688. [Google Scholar] [CrossRef]
  65. Men, S.; Sun, Y.; Licence, P.; Qu, J. X-ray photoelectron spectroscopy of morpholinium ionic liquids: Impact of a long alkyl side substituent on the cation–anion interactions. Phys. Chem. Chem. Phys. 2022, 24, 24845–24851. [Google Scholar] [CrossRef]
  66. Lexow, M.; Maier, F.; Steinrück, H.-P. Ultrathin ionic liquid films on metal surfaces: Adsorption, growth, stability and exchange phenomena. Adv. Phys. X 2020, 5, 1761266. [Google Scholar] [CrossRef]
  67. Heller, B.S.J.; Paap, U.; Maier, F.; Steinrück, H.-P. Pronounced surface enrichment of fluorinated ionic liquids in binary mixtures with methoxy-functionalized ionic liquids. J. Mol. Liq. 2020, 305, 112783. [Google Scholar] [CrossRef]
  68. Heller, B.S.J.; Kolbeck, C.; Niedermaier, I.; Dommer, S.; Schatz, J.; Hunt, P.; Maier, F.; Steinrück, H.-P. Surface Enrichment in Equimolar Mixtures of Non-Functionalized and Functionalized Imidazolium-Based Ionic Liquids. ChemPhysChem 2018, 19, 1733–1745. [Google Scholar] [CrossRef]
  69. Heller, B.S.J.; Lexow, M.; Greco, F.; Shin, S.; Partl, G.; Maier, F.; Steinrück, H.-P. Temperature-Dependent Surface Enrichment Effects in Binary Mixtures of Fluorinated and Non-Fluorinated Ionic Liquids. Chem. Eur. J. 2020, 26, 1117–1126. [Google Scholar] [CrossRef]
  70. Paap, U.; Seidl, V.; Meyer, K.; Maier, F.; Steinrück, H.-P. Direct Correlation of Surface Tension and Surface Composition of Ionic Liquid Mixtures—A Combined Vacuum Pendant Drop and Angle-Resolved X-ray Photoelectron Spectroscopy Study. Molecules 2022, 27, 8561. [Google Scholar] [CrossRef]
  71. Oz, E.; Sahin, O.; Okur, H.I.; Suzer, S. Surface Propensity of Anions in a Binary Ionic-Liquid Mixture Assessed by Full-Range Angle-Resolved X-ray Photoelectron Spectroscopy and Surface-Tension Measurements. ChemPhysChem 2020, 21, 2397–2401. [Google Scholar] [CrossRef]
  72. Zhang, Y.; Khalifa, Y.; Maginn, E.J.; Newberg, J.T. Anion Enhancement at the Liquid–Vacuum Interface of an Ionic Liquid Mixture. J. Phys. Chem. C 2018, 122, 27392–27401. [Google Scholar] [CrossRef]
  73. Kolbeck, C.; Paape, N.; Cremer, T.; Schulz, P.S.; Maier, F.; Steinrück, H.-P.; Wasserscheid, P. Ligand Effects on the Surface Composition of Rh-Containing Ionic Liquid Solutions Used in Hydroformylation Catalysis. Chem. Eur. J. 2010, 16, 12083–12087. [Google Scholar] [CrossRef]
  74. Kolbeck, C.; Taccardi, N.; Paape, N.; Schulz, P.S.; Wasserscheid, P.; Steinrück, H.-P.; Maier, F. Redox chemistry, solubility, and surface distribution of Pt(II) and Pt(IV) complexes dissolved in ionic liquids. J. Mol. Liq. 2014, 192, 103–113. [Google Scholar] [CrossRef]
  75. Maier, F.; Gottfried, J.M.; Rossa, J.; Gerhard, D.; Schulz, P.S.; Schwieger, W.; Wasserscheid, P.; Steinrück, H.-P. Surface Enrichment and Depletion Effects of Ions Dissolved in an Ionic Liquid: An X-ray Photoelectron Spectroscopy Study. Angew. Chem. Int. Ed. 2006, 45, 7778–7780. [Google Scholar] [CrossRef]
  76. Hemmeter, D.; Kremitzl, D.; Schulz, P.S.; Wasserscheid, P.; Maier, F.; Steinrück, H.-P. The Buoy Effect: Surface Enrichment of a Pt Complex in IL Solution by Ligand Design. Chem. Eur. J. 2023, 29, e202203325. [Google Scholar] [CrossRef]
  77. Dimitrova, A.; Walle, M.; Himmerlich, M.; Krischok, S. Surface composition of [BMP][Tf2N] and [PMIm][Tf2N] in the presence of NbF5 and TaF5. A photoelectron spectroscopy study. J. Mol. Liq. 2017, 226, 78–84. [Google Scholar] [CrossRef]
  78. Kurisaki, T.; Tanaka, D.; Inoue, Y.; Wakita, H.; Minofar, B.; Fukuda, S.; Ishiguro, S.-i.; Umebayashi, Y. Surface Analysis of Ionic Liquids with and without Lithium Salt Using X-ray Photoelectron Spectroscopy. J. Phys. Chem. B 2012, 116, 10870–10875. [Google Scholar] [CrossRef] [PubMed]
  79. Smoll, E.J.; Chen, X.; Hall, L.M.; D’Andrea, L.; Slattery, J.M.; Minton, T.K. Probing a Ruthenium Coordination Complex at the Ionic Liquid–Vacuum Interface with Reactive-Atom Scattering, X-ray Photoelectron Spectroscopy, and Time-of-Flight Secondary Ion Mass Spectrometry. J. Phys. Chem. C 2020, 124, 382–397. [Google Scholar] [CrossRef]
  80. Men, S.; Jiang, J. X-ray photoelectron spectroscopy as a probe of the interaction between rhodium acetate and ionic liquids. Chem. Phys. Lett. 2016, 646, 125–129. [Google Scholar] [CrossRef]
  81. Men, S.; Jin, Y. Rhodium Catalyst-Ionic Liquids Interaction by X-ray Photoelectron Spectroscopy Data. Russ. J. Phys. Chem. A 2018, 92, 2472. [Google Scholar]
  82. Men, S.; Lovelock, K.R.J.; Licence, P. Directly probing the effect of the solvent on a catalyst electronic environment using X-ray photoelectron spectroscopy. RSC Adv. 2015, 5, 35958–35965. [Google Scholar] [CrossRef]
  83. Men, S.; Jiang, J. Probing the Formation of the NHC-Palladium Species in Ionic Liquids by X-ray Photoelectron Spectroscopy. Russ. J. Phys. Chem. A 2018, 92, 1627–1630. [Google Scholar]
  84. Niedermaier, I.; Kolbeck, C.; Steinrück, H.-P.; Maier, F. Dual analyzer system for surface analysis dedicated for angle-resolved photoelectron spectroscopy at liquid surfaces and interfaces. Rev. Sci. Instrum. 2016, 87, 045105. [Google Scholar] [CrossRef]
  85. Steinrück, H.-P. Recent developments in the study of ionic liquid interfaces using X-ray photoelectron spectroscopy and potential future directions. Phys. Chem. Chem. Phys. 2012, 14, 5010–5029. [Google Scholar] [CrossRef]
  86. Steinrück, H.-P.; Libuda, J.; Wasserscheid, P.; Cremer, T.; Kolbeck, C.; Laurin, M.; Maier, F.; Sobota, M.; Schulz, P.S.; Stark, M. Surface Science and Model Catalysis with Ionic Liquid-Modified Materials. Adv. Mater. 2011, 23, 2571–2587. [Google Scholar] [CrossRef]
  87. Blundell, R.K.; Delorme, A.E.; Smith, E.F.; Licence, P. An ARXPS and ERXPS study of quaternary ammonium and phosphonium ionic liquids: Utilising a high energy Ag Lα′ X-ray source. Phys. Chem. Chem. Phys. 2016, 18, 6122–6131. [Google Scholar] [CrossRef]
  88. Men, S.; Hurisso, B.B.; Lovelock, K.R.J.; Licence, P. Does the influence of substituents impact upon the surface composition of pyrrolidinium-based ionic liquids? An angle resolved XPS study. Phys. Chem. Chem. Phys. 2012, 14, 5229–5238. [Google Scholar] [CrossRef]
  89. Lockett, V.; Sedev, R.; Harmer, S.; Ralston, J.; Horne, M.; Rodopoulos, T. Orientation and mutual location of ions at the surface of ionic liquids. Phys. Chem. Chem. Phys. 2010, 12, 13816–13827. [Google Scholar] [CrossRef]
  90. Suarez, P.A.Z.; Dullius, J.E.L.; Einloft, S.; De Souza, R.F.; Dupont, J. The use of new ionic liquids in two-phase catalytic hydrogenation reaction by rhodium complexes. Polyhedron 1996, 15, 1217–1219. [Google Scholar] [CrossRef]
  91. Nindakova, L.O.; Shainyan, B.A.; Albanov, A.I.; Shmidt, F.K. Double Stereoselection in the Hydrogenation over Cationic Rh(I) Complexes with Two Different Chiral Ligands. Russ. J. Org. Chem. 2003, 39, 926–932. [Google Scholar] [CrossRef]
  92. Carvalho, M.; Wieserman, L.F.; Hercules, D.M. Spectroscopic Characterization of Wilkinson’s Catalyst Using X-ray Photoelectron Spectroscopy (ESCA). Appl. Spectrosc. 1982, 36, 290–296. [Google Scholar] [CrossRef]
  93. Díaz, J.; Paolicelli, G.; Ferrer, S.; Comin, F. Separation of the sp3 and sp2 components in the C1s photoemission spectra of amorphous carbon films. Phys. Rev. B Condens. Matter 1996, 54, 8064–8069. [Google Scholar] [CrossRef]
  94. Fujimoto, A.; Yamada, Y.; Koinuma, M.; Sato, S. Origins of sp3C peaks in C1s X-ray Photoelectron Spectra of Carbon Materials. Anal. Chem. 2016, 88, 6110–6114. [Google Scholar] [CrossRef]
  95. Dewar, M.J.S. A Review of the-Complex Theory. Bull. Soc. Chim. Fr. 1951, 18, C79. [Google Scholar]
  96. Chatt, J.; Duncanson, L.A. 586. Olefin co-ordination compounds. Part III. Infra-red spectra and structure: Attempted preparation of acetylene complexes. J. Chem. Soc. (Resumed) 1953, 2939–2947. [Google Scholar] [CrossRef]
  97. Werner, H.; Bosch, M.; Schneider, M.E.; Hahn, C.; Kukla, F.; Manger, M.; Windmüller, B.; Weberndörfer, B.; Laubender, M. Preparation, molecular structure and reactivity of mono- and di-nuclear sulfonato rhodium(I) complexes. J. Chem. Soc. Dalton Trans. 1998, 21, 3549–3558. [Google Scholar] [CrossRef]
  98. Lovelock, K.R.J.; Kolbeck, C.; Cremer, T.; Paape, N.; Schulz, P.S.; Wasserscheid, P.; Maier, F.; Steinrück, H.P. Influence of Different Substituents on the Surface Composition of Ionic Liquids Studied Using ARXPS. J. Phys. Chem. B 2009, 113, 2854–2864. [Google Scholar] [CrossRef]
  99. Nakajima, K.; Ohno, A.; Suzuki, M.; Kimura, K. Observation of Molecular Ordering at the Surface of Trimethylpropylammonium Bis(trifluoromethanesulfonyl)imide Using High-Resolution Rutherford Backscattering Spectroscopy. Langmuir 2008, 24, 4482–4484. [Google Scholar] [CrossRef]
  100. Nakajima, K.; Lísal, M.; Kimura, K. Surfaces of Ionic Liquids. In Surface and Interface Science; Wandelt, K., Ed.; Wiley-VCH Verlag GmbH & Co. KGaA: Weinheim, Germany, 2020; pp. 351–389. [Google Scholar]
  101. Maier, F.; Cremer, T.; Kolbeck, C.; Lovelock, K.R.J.; Paape, N.; Schulz, P.S.; Wasserscheid, P.; Steinrück, H.P. Insights into the surface composition and enrichment effects of ionic liquids and ionic liquid mixtures. Phys. Chem. Chem. Phys. 2010, 12, 1905–1915. [Google Scholar] [CrossRef]
  102. Sanmartín Pensado, A.; Malfreyt, P.; Pádua, A.A.H. Molecular Dynamics Simulations of the Liquid Surface of the Ionic Liquid 1-Hexyl-3-methylimidazolium Bis(trifluoromethanesulfonyl)amide: Structure and Surface Tension. J. Phys. Chem. B 2009, 113, 14708–14718. [Google Scholar] [CrossRef] [PubMed]
  103. Iwahashi, T.; Miyamae, T.; Kanai, K.; Seki, K.; Kim, D.; Ouchi, Y. Anion Configuration at the Air/Liquid Interface of Ionic Liquid [bmim]OTf Studied by Sum-Frequency Generation Spectroscopy. J. Phys. Chem. B 2008, 112, 11936–11941. [Google Scholar] [CrossRef] [PubMed]
  104. Kolbeck, C.; Lehmann, J.; Lovelock, K.R.J.; Cremer, T.; Paape, N.; Wasserscheid, P.; Fröba, A.P.; Maier, F.; Steinrück, H.P. Density and Surface Tension of Ionic Liquids. J. Phys. Chem. B 2010, 114, 17025–17036. [Google Scholar] [CrossRef]
  105. Wagner, C.D.; Davis, L.E.; Zeller, M.V.; Taylor, J.A.; Raymond, R.H.; Gale, L.H. Empirical Atomic Sensitivity Factors for Quantitative Analysis by Electron Spectroscopy for Chemical Analysis. Surf. Interface Anal. 1981, 3, 211–225. [Google Scholar] [CrossRef]
  106. Gottfried, J.M.; Maier, F.; Rossa, J.; Gerhard, D.; Schulz, P.S.; Wasserscheid, P.; Steinrück, H.-P. Surface Studies on the Ionic Liquid 1-Ethyl-3-Methylimidazolium Ethylsulfate Using X-Ray Photoelectron Spectroscopy (XPS). Z. Phys. Chem. 2006, 220, 1439–1453. [Google Scholar] [CrossRef]
Scheme 1. Expected ligand substitution sequence generating a Schrock−Osborn-type catalyst [Rh(COD)(TPPTS)2][TfO] in [C2C1Im][EtOSO3] under vacuum conditions starting from [Rh(COD)2][TfO].
Catalysts 13 00871 sch001
Figure 1. Molecular structures of [Rh(COD)2][TfO] (top left), [Rh(COD)(TPPTS)2][TfO] (top right), [C2C1Im][TfO] (middle top left) TPPTS (middle top right), [C4C1Im][TfO] (middle bottom left), [C2C1Im][EtOSO3] (middle bottom right), and [C8C1Im][TfO] (bottom left) with the assignment of carbon and oxygen species detected in XPS.
Catalysts 13 00871 g001
Figure 2. Rh 3d (left) and C 1s (right) XP spectra of solutions of [Rh(COD)2][TfO] in [C2C1Im][TfO] with (a) 20%mol concentration and (d) 9%mol concentration in 0° (black) and 80° (red) emission recorded at room temperature. For the assignment of peaks to the molecular structure, see color-coding in Figure 1. (b) Applied deconvolution of the Rh region for the solution depicted in (a). (c) Deconvolution applied for the C 1s region recorded for the solution depicted in (a) and contrasted with the spectrum expected from nominal composition with the one actually detected (see Table 1).
Catalysts 13 00871 g002
Figure 3. (a) Rh 3d and (b) C 1s XP spectra of 20%mol solutions of [Rh(COD)2][TfO] in [C2C1Im][TfO] (black), [C4C1Im][TfO] (green), and [C8C1Im][TfO] (orange) in 0° (left) and 80° (right) emission. All of the spectra were recorded at room temperature.
Catalysts 13 00871 g003
Figure 4. Rh 3d (left), C 1s (middle left), F 1s (middle right), and O 1s (right) XP spectra of a solution of [Rh(COD)2][TfO] in [C2C1Im][EtOSO3] in 0° (black) and 80° (red) emission recorded at room temperature. For the assignment of peaks to the molecular structure, see Figure 1.
Catalysts 13 00871 g004
Figure 5. (a) Rh 3d (left), C 1s (middle left), F 1s (middle right), and P 2p (right) XP spectra of a solution of [Rh(COD)2][TfO] and TPPTS in [C2C1Im][EtOSO3] (ratio Rh:TPPTS:IL 1:2:31.6) and (b) C 1s and P 2p XP spectra of a solution of TPPTS in [C2C1Im][EtOSO3] (ratio TPPTS:IL 2:31.6) in 0° (black) and 80° (red) emission recorded at room temperature. For the assignment of peaks to the molecular structures, see Figure 1.
Catalysts 13 00871 g005
Table 1. Quantitative analysis of ARXPS core level spectra of solutions of [Rh(COD)2][TfO] in [C2C1Im][TfO], [C4C1Im][TfO], and [C8C1Im][TfO] (note that the exact weighed proportions and concentrations are given in Table S8 in the SI). The experimental uncertainty of the denoted composition values is 5–10%; to avoid rounding errors, three decimal digits are sometimes provided in the tables).
(a) 9%mol
[Rh(COD)2][TfO] in [C2C1Im][TfO]
Rh 3d5/2Rh 3d5/2 oxC 1s
TfO
C 1s
C2
C 1s
hetero
C 1s
alkyl/COD
N 1sF 1sO 1sS 2p
Binding Energy/eV309.4310.7292.9287.8286.9285.5402.2688.8532.3169.4
Nominal0.0990.001.101.004.002.58
1.00/1.58
2.003.303.301.10
Experimental, 0°0.0530.0121.221.044.151.432.093.573.701.20
Experimental, 80°0.033 1.331.024.091.231.994.173.401.21
(b) 20%mol
[Rh(COD)2][TfO] in [C2C1Im][TfO]
Rh 3d5/2Rh 3d5/2 oxC 1s
TfO
C 1s
C2
C 1s
hetero
C 1s
alkyl/COD
N 1sF 1sO 1sS 2p
Binding Energy/eV309.2310.2292.9287.8286.9285.4402.2688.8532.4169.4
Nominal0.2500.001.251.004.005.00
1.00/4.00
2.003.753.751.25
Experimental, 0°0.1580.0261.401.114.442.912.224.204.371.40
Experimental, 80°0.125 1.541.134.502.351.975.034.051.40
(c) 20%mol
[Rh(COD)2][TfO] in [C4C1Im][TfO]
Rh 3d5/2Rh 3d5/2 oxC 1s
TfO
C 1s
C2
C 1s
hetero
C 1s
alkyl/COD
N 1sF 1sO 1sS 2p
Binding Energy / eV309.3310.2292.9287.8286.9285.4402.3688.8532.4169.4
Nominal0.2560.001.261.004.007.10
3.00/4.10
2.003.773.771.26
Experimental, 0°0.1400.0171.461.184.724.832.284.064.341.39
Experimental, 80°0.083 1.481.164.624.832.224.683.931.41
(d) 20%mol
[Rh(COD)2][TfO] in [C8C1Im][TfO]
Rh 3d5/2Rh 3d5/2 oxC 1s
TfO
C 1s
C2
C 1s
hetero
C 1s
alkyl/COD
N 1sF 1sO 1sS 2p
Binding Energy/eV309.3310.4292.9287.8286.9285.3402.3688.8532.4169.4
Nominal0.2500.001.251.004.0011.0
7.00/4.00
2.003.753.751.25
Experimental, 0°0.1440.0171.381.164.659.332.143.874.161.39
Experimental, 80°0.066 1.191.064.2311.71.973.563.181.29
Table 2. Quantitative analysis of ARXPS core level spectra of the solutions relevant for ligand substitution in [C2C1Im][EtOSO3] (note that the exact weighed proportions and concentrations are given in Table S8 in the SI; the experimental uncertainty of the denoted composition values is 5–10%; to avoid rounding errors, three decimal digits are sometimes provided in the tables).
(a) 20%mol
[Rh(COD)2][TfO] in [C2C1Im][EtOSO3]
Rh 3d5/2Rh 3d5/2 oxC 1s
TfO
C 1s
C2
C 1s
hetero
C 1s
alkyl/
COD
N 1sF 1sO 1s
C-O-S
O 1s
SO3
S 2pP 2pNa 1s
Binding Energy/eV309.2310.2292.9287.8286.9285.4402.2688.8533.4532.1169.5
Nominal0.2500.000.2501.005.006.00
2.00/4.00
2.000.7501.003.751.25
Experimental, 0°0.1710.0250.4001.145.703.802.220.9831.194.241.39
Experimental, 80°0.133 0.6341.155.763.292.131.751.023.921.47
(b) 5.9%mol solution
of TPPTS in [C2C1Im][EtOSO3] (2:31.6 TPPTS:IL ratio)
Rh 3d5/2Rh 3d5/2 oxC 1s
TfO
C 1s
C2
C 1s
hetero
C 1s
alkyl/
phenyl
N 1sF 1sO 1s
C-O-S
O 1s
SO3
S 2pP 2pNa 1s
Binding Energy/eV 287.8286.9285.5402.2 533.4531.9169.5131.71071.9
Nominal 1.005.003.142.00 1.003.571.190.0630.190
Experimental, 0° 0.9594.803.581.74 1.123.581.200.0600.122
Experimental, 80° 0.7743.876.801.12 1.012.560.96 0.063
(c) [Rh(COD)2][TfO]
and TPPTS in [C2C1Im][EtOSO3] (1:2:31.6 Rh:TPPTS:IL ratio)
Rh 3d5/2Rh 3d5/2 oxC 1s
TfO
C 1s
C2
C 1s
hetero
C 1s
alkyl/
COD/
phenyl
N 1sF 1sO 1s
C-O-S
O 1s
SO3
S 2pP 2pNa 1s
Binding Energy/eV309.0 287.7286.8285.5402.2688.8533.3531.9169.5132.51071.9
Nominal0.0320.000.0321.005.003.392.000.0951.003.661.220.0630.190
Experimental, 0°0.031 1.004.993.551.850.1221.103.611.250.0540.122
Experimental, 80° 0.844.196.291.360.2000.9622.691.09 0.062
Disclaimer/Publisher’s Note: The statements, opinions and data contained in all publications are solely those of the individual author(s) and contributor(s) and not of MDPI and/or the editor(s). MDPI and/or the editor(s) disclaim responsibility for any injury to people or property resulting from any ideas, methods, instructions or products referred to in the content.

