Article

In Situ Transition of a Nickel Metal–Organic Framework on TiO2 Photoanode towards Urea Photoelectrolysis

School of New Energy and Materials, Southwest Petroleum University, Chengdu 610500, China
*
Authors to whom correspondence should be addressed.
Catalysts 2023, 13(4), 727; https://doi.org/10.3390/catal13040727
Submission received: 30 March 2023 / Revised: 8 April 2023 / Accepted: 10 April 2023 / Published: 12 April 2023

Abstract

:
Photoelectrochemical (PEC) urea splitting is of great significance for urea wastewater remediation and hydrogen production with low energy consumption simultaneously. Nickel hydroxides as electrocatalysts have been widely investigated for urea electrolysis. However, it is an open question how to synthesize highly catalytic Ni(OH)2 for the PEC urea splitting. Herein, we take advantage of the instability of metal–organic frameworks (MOFs) to perform an in situ synthesis of Ni(OH)2 catalysts on the surface of TiO2 nanorod arrays. This transformed Ni(OH)2 (T-Ni(OH)2) possesses a superior PEC catalytic activity for water/urea splitting in comparison to the Ni(OH)2 prepared by the impregnation method. The in situ transition of a Ni-MOF is accomplished through an electrochemical treatment under AM1.5G illumination in a KOH-and-urea mixed electrolyte. The specific transition mechanism of Ni-MOFs is the substitution of ligands with OH in a 1 M KOH electrolyte and the successive phase transition. The T-Ni(OH)2@TiO2 photoanode delivers a high photocurrent density of 1.22 mA cm−2 at 1.23 VRHE, which is 4.7 times that of Ni(OH)2@TiO2 prepared with the impregnation method. The onset potential of T-Ni(OH)2@TiO2 is negatively shifted by 118 mV in comparison to TiO2. Moreover, the decline of photocurrent during the continuous test can be recovered after the electrochemical and light treatments.

1. Introduction

Green hydrogen production is the foundation of a future hydrogen society. Photoelectrochemical (PEC) water splitting is one of the promising technologies for hydrogen production through the utilization of sustainable solar energy [1,2]. However, the sluggish kinetics of the oxygen evolution reaction (OER) greatly restrict the real solar-to-hydrogen (STH) efficiency and the practical applications of PEC technology [3,4]. To reduce the overpotential of OER, urea oxidation reaction (UOR) with a theoretical potential of 0.37 VRHE has been chosen to replace the OER reactions on the photoanodes [5] The need of the electric energy consumption of urea electrolysis can also be reduced when PEC urea splitting is used. In addition, the urea wastewater can be remediated simultaneously. If not, the toxic ammonia, nitrates, nitrites, or nitrogen oxides can be released from urea naturally [6]. Electrochemical technology has been used as a next-generation technology for the removal of organic and inorganic contaminants in the wastewater [7,8]. Urease is the most efficient enzyme for UOR, which contains a dinuclear Ni(II) cluster as the active site [9]. Therefore, nickel-based compounds are the most reported catalysts for urea electrolysis, especially nickel hydroxide [5]. Generally, NiOOH formed from the oxidation of Ni(OH)2 is recognized as the true active site for UOR [10,11]. Among nickel-based catalysts, nickel metal–organic frameworks (MOFs) are one type of promising UOR catalysts. MOFs have well-developed porous structures and tunable chemical properties, which can be used directly or indirectly (e.g., MOF derivatives) [5,12].
The first reported Ni-MOF (Ni-BDC, BDC = 1,4-benzenedicarboxylic acid) with a nanosheet morphology shows a high UOR activity [13]. The improvements were attributed to the high oxidation states of nickel species in the Ni-MOF and the large surface area of 2D nanostructure. Another Ni-MOF (Ni-BTC, BTC = 1,3,5-benzenetricarboxylic acid) also shows better activity when compared to the wet chemically prepared NiO [14]. Doping of MOFs has been found as an efficient approach for improving the electrocatalytic activity of MOFs. Ir doping demonstrated that it can further increase the electrochemical active area, accelerate the charge transport capability, and improve the stability of a Ni-MOF (Ni-BDC-TED, TED = triethylenediamine) for urea electrolysis [15]. Fe doping can cause the electronic structure reconstruction in a Ni-MOF (Ni-BDC), which induces the high-valence Ni formation and more electronic states, benefiting the UOR kinetics [16]. Furthermore, the highly electronegative ferrocenecarboxylic acid (Fc) was also used to tailor the electronic structure of NiCo-BDC and expose more unsaturated active sites [17]. In addition, the morphology tailoring study of MOFs suggests the Ni-MOF nanowires possess the highest electrocatalytic activity among nanowires, neurons, and urchins [18]. The 1D nanowires possess more accessible active sites, lower charge transport resistance, and the fast/direct electron transfer. Moreover, some Ni-MOF derivatives, such as nickel nitride [19], Ni-Fe Prussian blue analogue [20], NiCo-BDC nanosheets coated with amorphous Ni-S [21], and Ru-modified NiFe-MOF [22], were developed for urea electrolysis. Although the above works have achieved great progress in urea electrolysis, there is still no MOF cocatalyst investigated for the PEC urea splitting. The requirements for catalysts in the PEC urea splitting are entirely different from those in the urea electrolysis. Therefore, there is a challenge to develop one highly efficient MOF-based/derived cocatalyst for the PEC urea splitting.
In this work, we synthesized a Ni-MOF (Ni-BDC) on the surface of TiO2 nanorod arrays through the chemical bath deposition method. We discovered that the Ni-MOF experiences an in situ transition from a MOF to β-Ni(OH)2 during the electrochemical and light treatments. It was labeled as T-Ni(OH)2. The specific transition mechanism was revealed in detail. The in situ-formed Ni(OH)2 exhibits superior performance for the PEC urea splitting. More importantly, the decline of photocurrent during continuous test can be recovered after the electrochemical and light treatments. Specifically, the T-Ni(OH)2@TiO2 composite photoanode delivers a high urea splitting photocurrent density of 1.22 mA cm−2 at 1.23 VRHE, which is 4.7 times that of Ni(OH)2@TiO2 prepared with the impregnation method. The onset potential of T-Ni(OH)2@TiO2 is negatively shifted by 118 mV in comparison to TiO2.

2. Results and Discussion

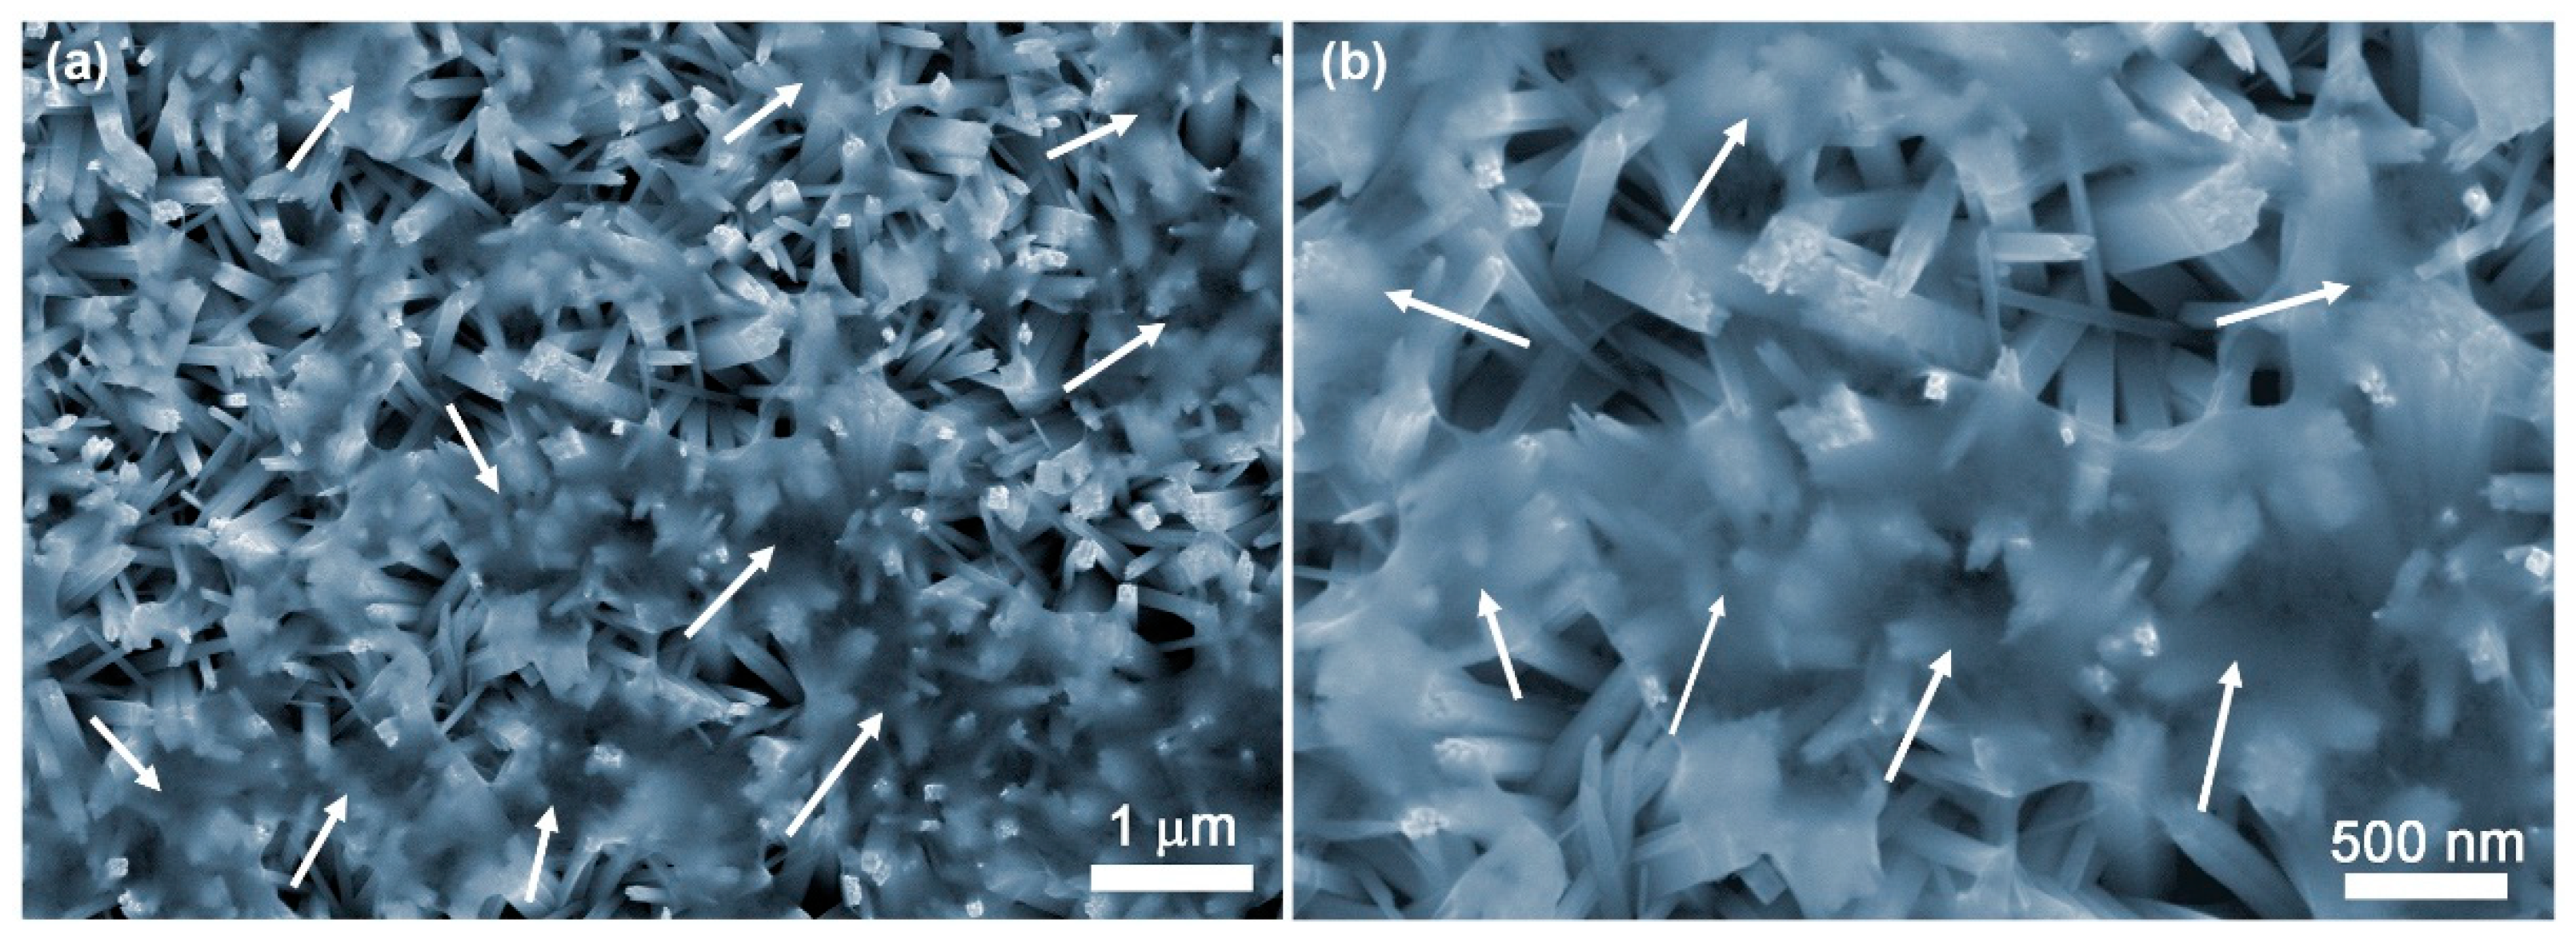
2.1. Preparation of Ni(OH)2@TiO2 and T-Ni(OH)2@TiO2 Film

One-dimensional TiO2 nanorod arrays were prepared through the reported hydrothermal method [23]. The rutile crystal structure of as-prepared TiO2 was identified with X-ray diffractometer (XRD) and Raman as shown in Figure S1. The XRD peaks located at 35.1°, 40.2°, 54.5°, 61.9°, 68.0°, and 67.0° can be attributed to the tetragonal-rutile-phase TiO2 (JCPDS No. 21-1276). The (101) plane is the highest intense peak, indicating the growth of TiO2 nanorods in the (001) direction. This result is consistent with that reported for TiO2 nanorods previously [24]. For Raman spectroscopy, three characteristic Raman active modes of rutile TiO2 with symmetries B1g, Eg, and A1g were observed at 143, 443, and 607 cm−1, respectively. These characteristic vibrational frequencies and their intensity ratios confirmed the phase of pure rutile TiO2 [25]. In addition, the multiple phonon scattering processes can be observed at 231 cm−1. The XRD and Raman results confirm the successful synthesis of rutile TiO2. The scanning electron microscope (SEM) image of as-prepared TiO2 films clearly demonstrates the structure of nanorod arrays in Figure S1c.
A Ni-MOF (Molecular formula: [Ni3(OH)2(C8H4O4)2(H2O)4]·2H2O) was synthesized via the chemical bath deposition (CBD) method [13]. The synthesis conditions were optimized firstly, and the results are shown in Figure S2. The stirring-assisted CBD-method-fabricated Ni-MOF@TiO2 photoanode shows a higher photocurrent density and a larger photovoltage as shown in Figure S2a,b. Considering the decay behavior of the photovoltage under dark, the stirring-assisted CBD-method-prepared photoanodes possess slow charge transfer and recombination kinetics [26]. Furthermore, the temperature of 100 °C and reaction time of 180 min were used for performing the synthesis of Ni-MOF. Note that the high temperature and long time would induce the rapid evaporation of water in the precursor solution. After the electrochemical and AM1.5G light illumination (EL) treatments, the morphology of T-Ni(OH)2@TiO2 was characterized with SEM as shown in Figure 1a,b. The surface of TiO2 film is partially covered with gauze-like T-Ni(OH)2. The gauze-like morphology of T-Ni(OH)2 is similar to the sheet morphology of the Ni-MOF in Figure S3, proving that the T-Ni(OH)2 transformed by the EL treatment can still maintain the Ni-MOF structure [13]. The formation of a two-dimensional gauze-like structure may be due to the layered crystal structure of Ni-MOF, in which the nickel octahedra layers are connected with the linkers of terephthalic acid (see the inset of Figure 6a) [27]. In addition, the energy dispersive spectroscopy (EDS) mapping and the pattern of T-Ni(OH)2@TiO2 (Figures S4 and S5) illustrate that the distribution of Ni and O elements is consistent with the SEM morphology. The atomic ratio of Ni/Ti is around 0.56%. The SEM image of TiO2 modified with Ni(OH)2 by the impregnation method is shown in Figure S6 as a control.

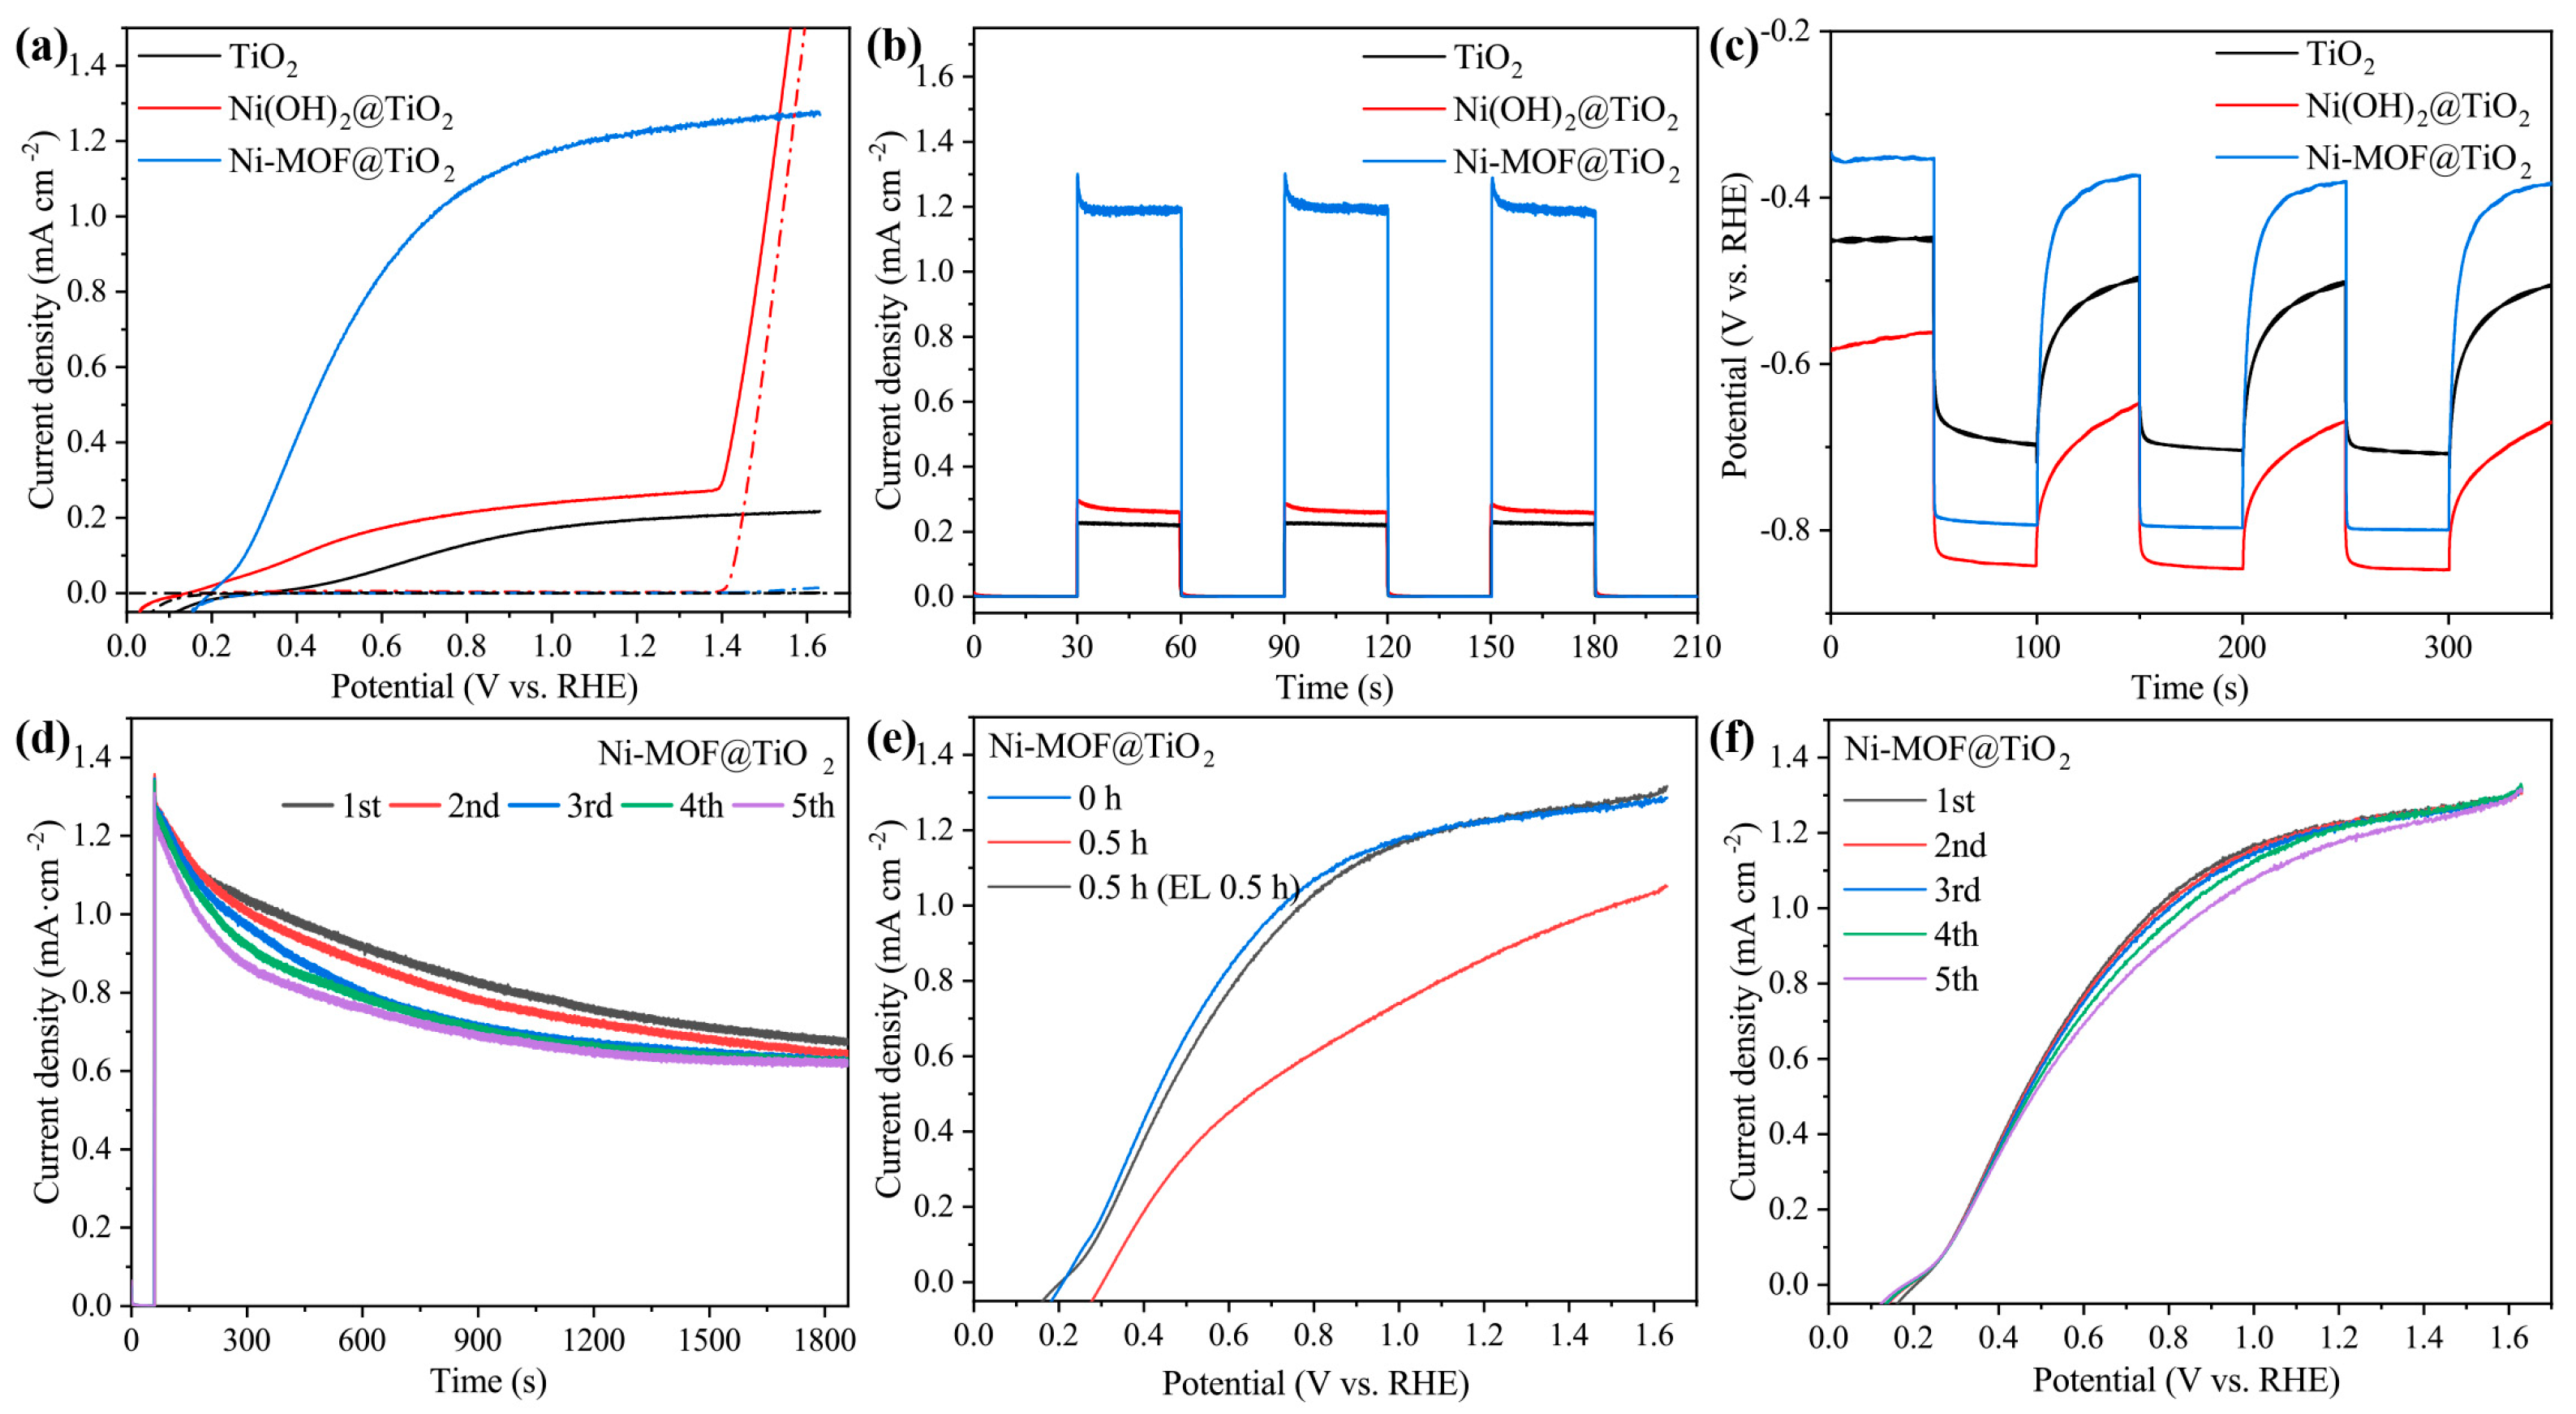
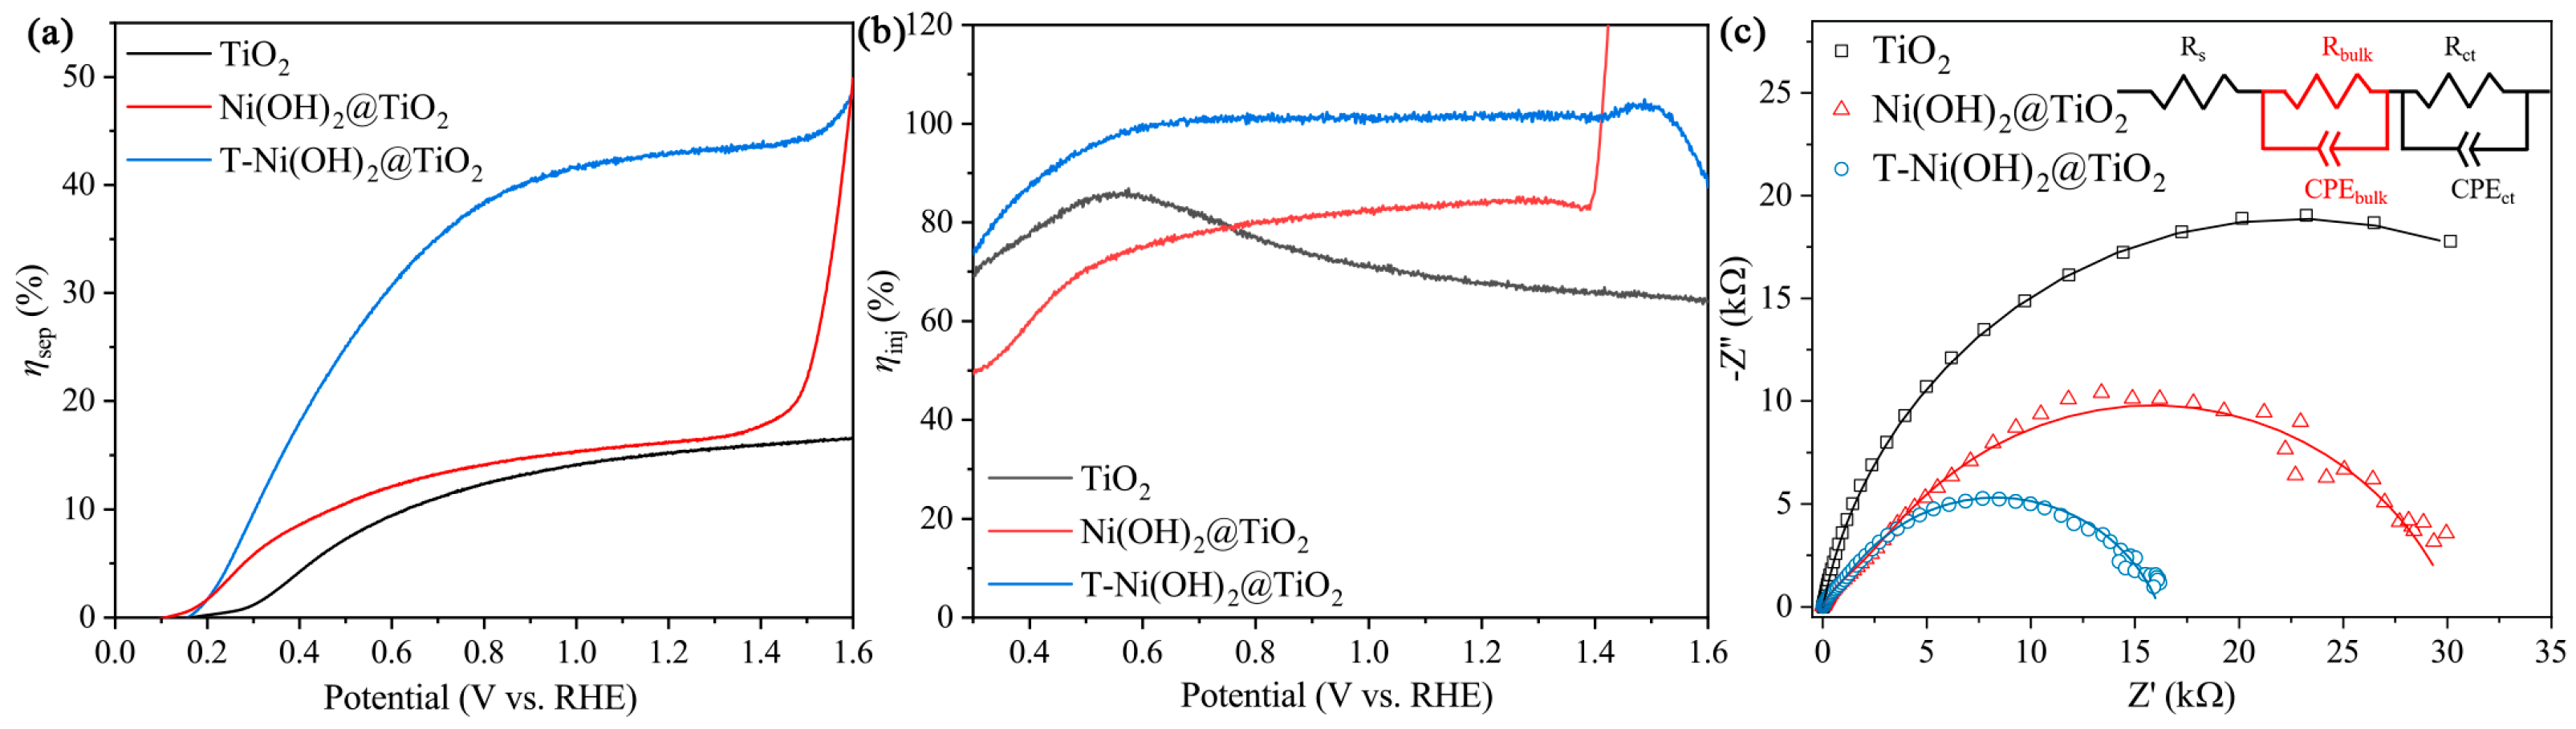
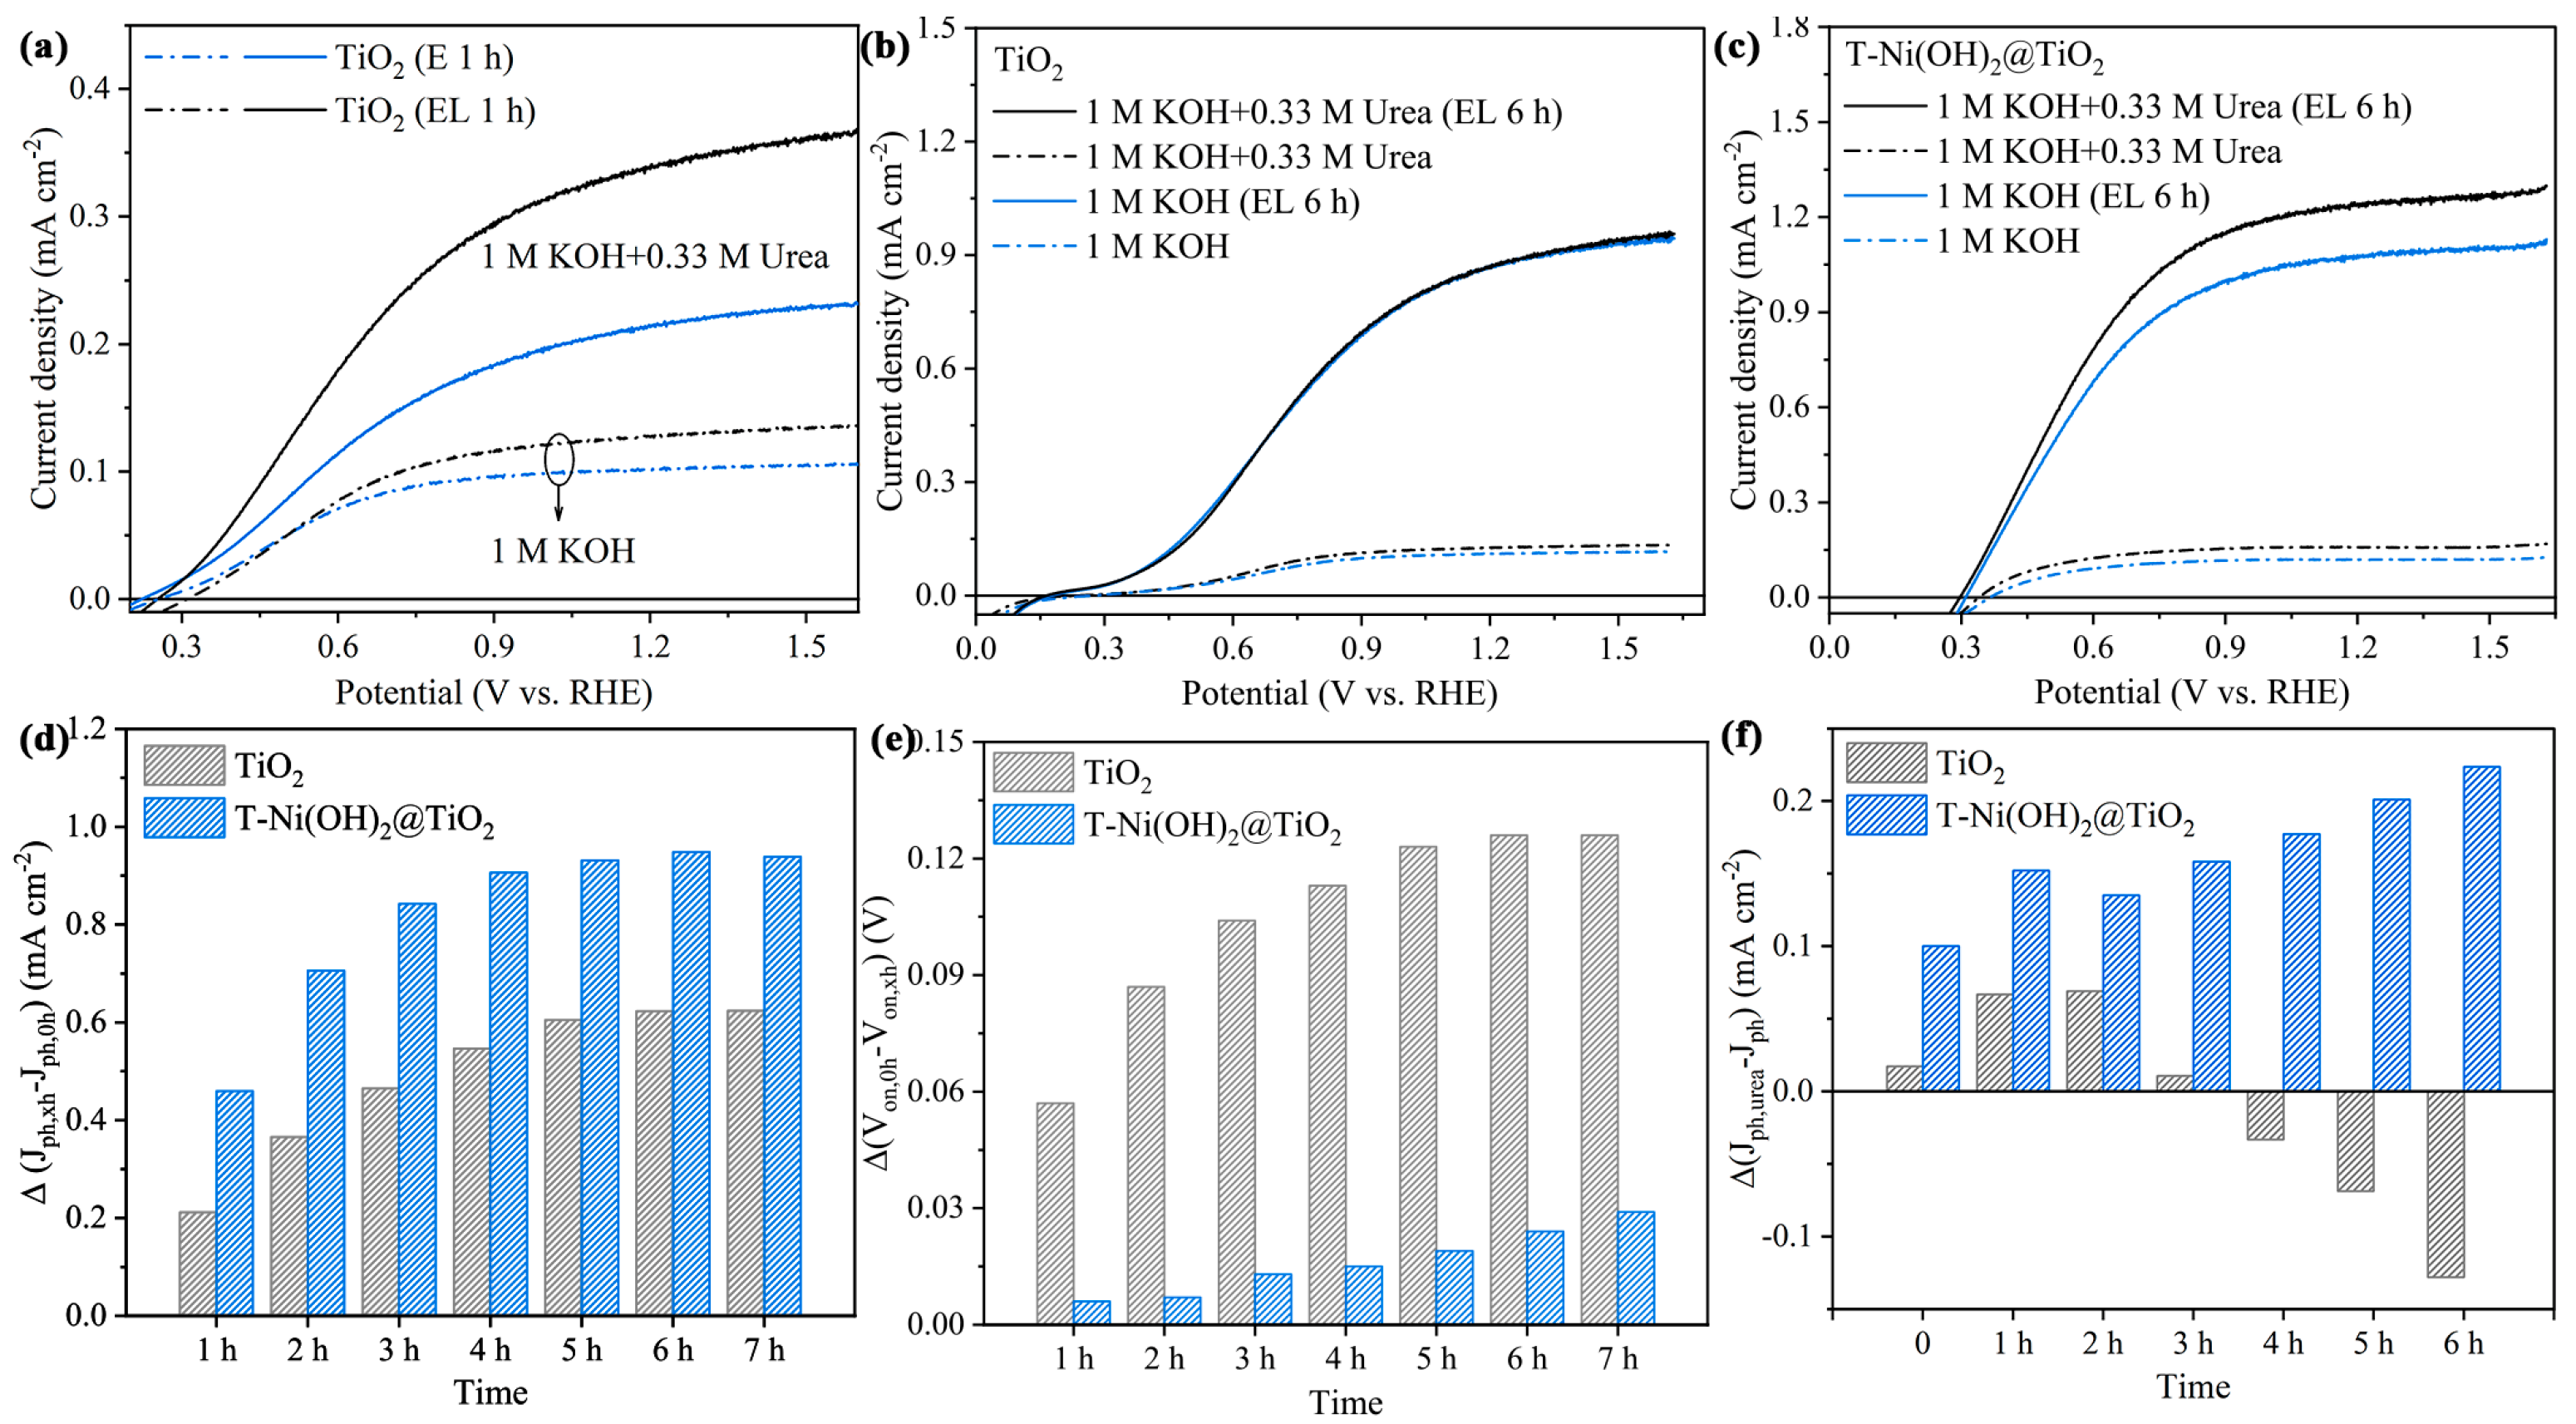
2.2. PEC UOR Performances of T-Ni(OH)2@TiO2

TiO2, Ni(OH)2@TiO2, and T-Ni(OH)2@TiO2 were prepared to investigate the PEC performance for UOR in 1 M KOH/0.33 M urea electrolyte. As shown in Figure 2a, the urea splitting photocurrent density (Jph,urea) of T-Ni(OH)2@TiO2 reaches 1.22 mA cm−2 at 1.23 VRHE, which is 6.2 times and 4.7 times that of TiO2 and Ni(OH)2@TiO2, respectively. The photocurrent improvement is superior in comparison with the reported Ni(OH)2-modified and hydrogen-reduced TiO2 photoanodes [28]. Due to the unimproved light absorption of T-Ni(OH)2@TiO2 (Figure S7), the boost of Jph,urea cannot be attributed to the enhanced photogenerated charges. Moreover, the cyclic voltammetry (CV) curves of T-Ni(OH)2@TiO2 and Ni-MOF@TiO2 photoanodes were measured and shown in Figure S8. T-Ni(OH)2@TiO2 also exhibits a significant improvement of photocurrent in comparison with the as-prepared Ni-MOF@TiO2. In Figure 2a, the onset potential of T-Ni(OH)2@TiO2 (197 mVRHE) is negatively shifted by 118 mV in comparison to TiO2 (315 mVRHE). For Ni(OH)2@TiO2, a great increase in current density at around 1.4 VRHE should be ascribed to the Ni2+/Ni3+ transition and the electrocatalytic urea oxidation [28]. The chopping j-t curve is shown in Figure 2b, which indicates the fast response when the light turns on/off. There is no visible cathodic peak when the light is turned off, suggesting no hole accumulation on the surface of TiO2-based photoanodes. The open-circuit potential of the TiO2-based photoanodes under chopping conditions is shown in Figure 2c. T-Ni(OH)2@TiO2 achieves a large photovoltage of 0.44 V (OCPdark − OCPlight), which is around 200 mV higher than that of pristine TiO2. Furthermore, we tested the PEC stability of T-Ni(OH)2@TiO2 at 1.23 VRHE under AM 1.5G illumination (Figure 2d–f). After the stability test of 0.5 h, the retention rate of Jph,urea is 70%. Interestingly, when T-Ni(OH)2@TiO2 was further subjected to the EL treatment for another 0.5 h, the Jph,urea could recover to the level before the stability test (Figure 2e). Then, we observed that this recovery procedure can be repeated at least five times, as shown in Figure 2d,f. The long-term stability for 10 h is shown in Figure S9. The retention rate of Jph,urea achieved after 10 h stability test is around 35%. The activity degradation should be mainly due to the photocorrosion [29] and the catalyst surface poisoning by the adsorption of reaction intermediates, such as NCO [30] and CO2 [31]. During the EL treatment, the adsorbed intermediates can be efficiently removed with the evolution of hydrogen. Thus, the active sites can be regenerated after the EL treatment.
For the OER catalyst of nickel oxyhydroxide, Fe impurities can significantly enhance the electrochemical activity for OER [32]. Therefore, the effect of Fe impurities on the electrolyte was further investigated. Inductively coupled plasma mass spectrometry (ICP-MS) analysis of 1.0 M KOH shows the content of Fe at 5.84 ppb. The linear sweep voltammetry (LSV) curves of T-Ni(OH)2@TiO2 with the EL treatment in normal and purified electrolytes under AM 1.5G illumination and in the dark are shown in Figure S10. The experimental results indicate that the trace impurities of Fe in the electrolyte cannot visibly influence the PEC UOR performance.
The kinetics of T-Ni(OH)2@TiO2 were revealed through the charge separation/injection efficiency (ηsepinj) measurements and photoelectrochemical impedance spectroscopy (PEIS). The LSV curves of TiO2, Ni(OH)2@TiO2, and T-Ni(OH)2@TiO2 measured in the 1 M KOH/0.33 M urea with/without the sacrificial reagent are shown in Figure S11. The ηsep and ηinj values were calculated using the following equations:
η inj = J urea / J Na 2 SO 3
η sep = J Na 2 SO 3 / J abs ,
where Jurea is the measured photocurrent density in 1 M KOH/0.33 M urea, JNa2SO3 is the measured photocurrent density in 1 M KOH/0.33 M urea/0.5 M Na2SO3, and Jabs is the rate of photon absorption expressed as a current density, which is calculated assuming 100% absorbed photon-to-current efficiency. Here, Jabs ~2.10 mA cm−2 is calculated from Figure S7. The T-Ni(OH)2@TiO2 photoanode exhibits a significantly higher ηsep (42.96% vs. 15.37% of TiO2, 1.23 VRHE). The ηinj value of T-Ni(OH)2@TiO2 is about 100%, which is considerably higher than that of TiO2 (84.53%). Although Ni(OH)2 is an effective cocatalyst, an EL-treated Ni-MOF is more favorable as a UOR cocatalyst. A significant difference for Ni(OH)2@TiO2 at the potential range of 1.4–1.6 VRHE can be observed. This can be attributed to the significantly electrocatalytic behaviors of Ni(OH)2@TiO2 as shown in Figure 2a. Figure 3c illustrates the Nyquist plots of TiO2-based photoanodes. The PEIS spectra were fitted with two equivalent circuits as shown in the inset of Figure 3c. One equivalent circuit consisting of one RC circuit is used for PEIS fitting of pristine TiO2, in which Rct represents the charge transfer resistance, and CPEct represents the surface trapping constant-phase element (CPE). One equivalent circuit consisting of two RC circuits is used for PEIS fitting of Ni(OH)2@TiO2 and T-Ni(OH)2@TiO2 photoanodes. Rbulk and CPEbulk represent the bulk trapping resistance and bulk CPE, respectively. The fitting parameters are shown in Table S1. After the Ni species coating, the Rct greatly decreases to 28.54 kΩ (Ni(OH)2@TiO2) and 15.58 kΩ (T-Ni(OH)2@TiO2) from 45.37 kΩ (TiO2). The Rbulk of T-Ni(OH)2@TiO2 (569.90 Ω) is far lower than that of Ni(OH)2@TiO2 (1727.00 Ω). These PEIS results indicate that the Ni species derived from the Ni-MOF has a better improvement for PEC UOR kinetics. In addition, we measured the Mott–Schottky (MS) plots of TiO2, Ni(OH)2@TiO2, and T-Ni(OH)2@TiO2 in the dark at a fixed frequency of 1000 Hz (Figure S12). All photoanodes exhibit a positive slope, indicating the typical n-type characteristic of the measured electrodes. Ni(OH)2@TiO2 and T-Ni(OH)2@TiO2 show a close slope (~4.2 × 1013 cm4 F−2 V−1), suggesting a similar electron density of these two photoanodes. The flat-band potential of T-Ni(OH)2@TiO2 shows a great positive shift of ~200 mV. This should be attributed to the electrochemical treatment of TiO2. The previously reported results of treated TiO2 can well support the above deduction [33].

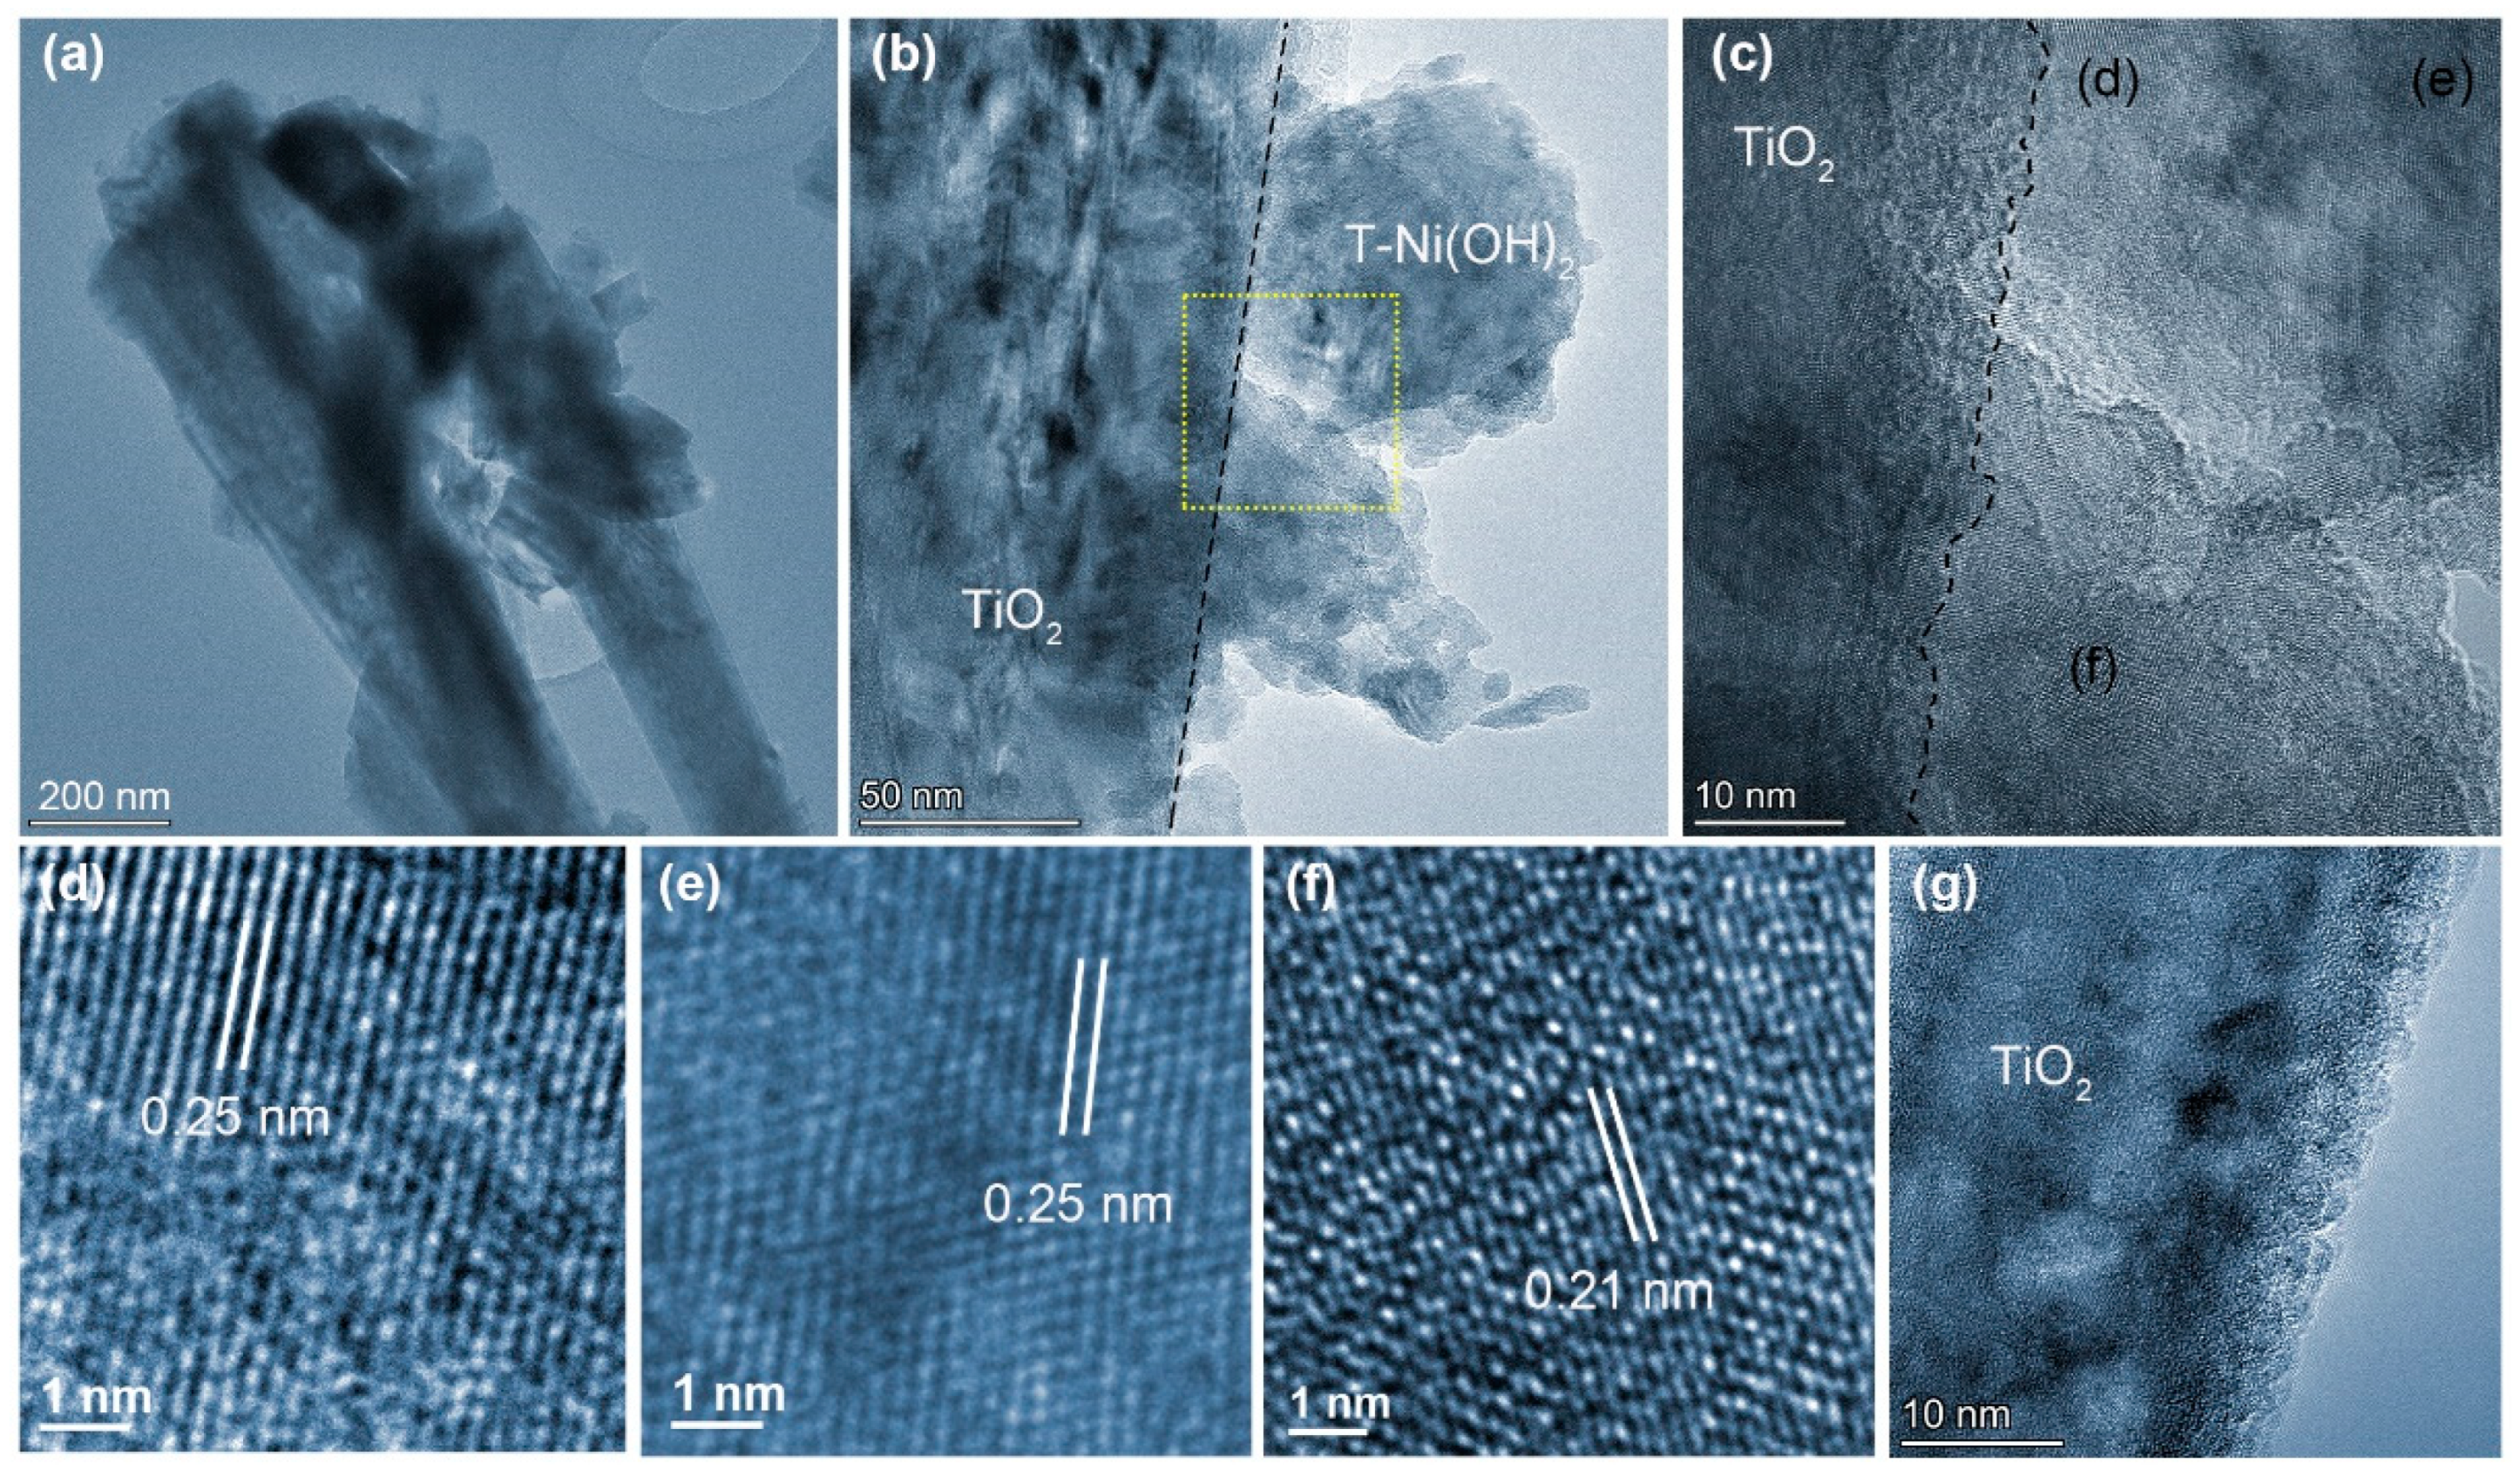
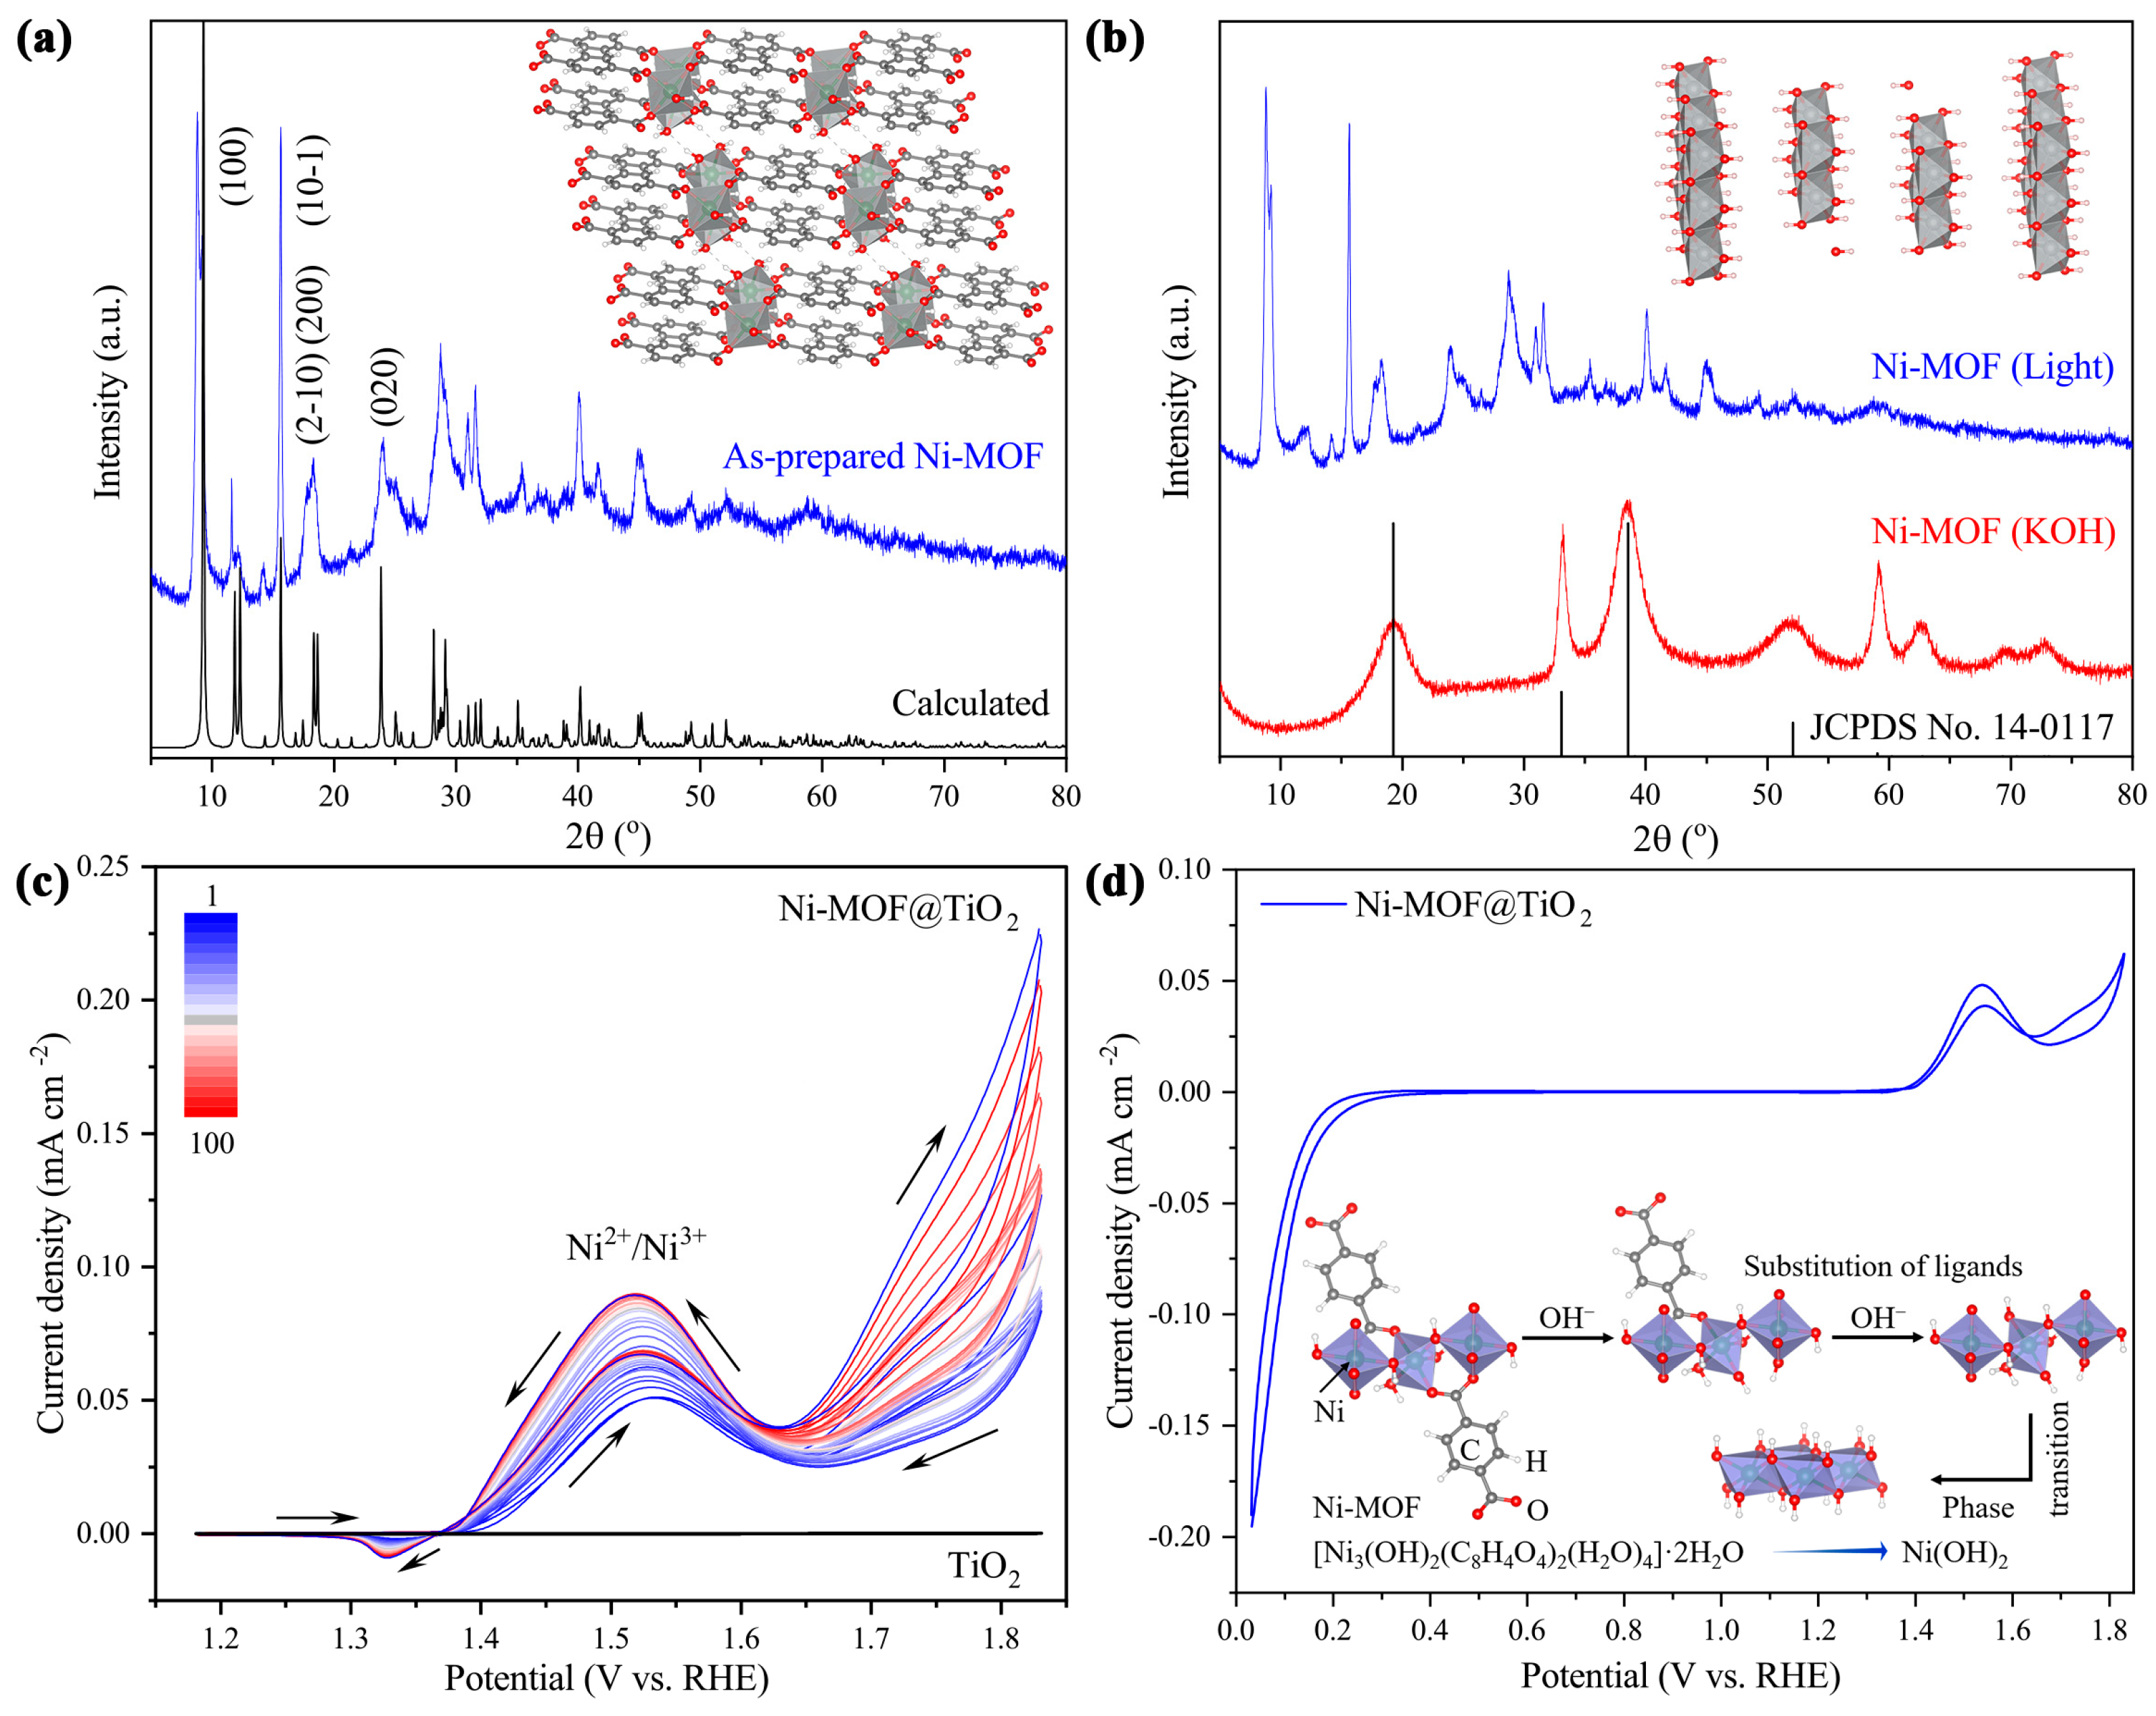
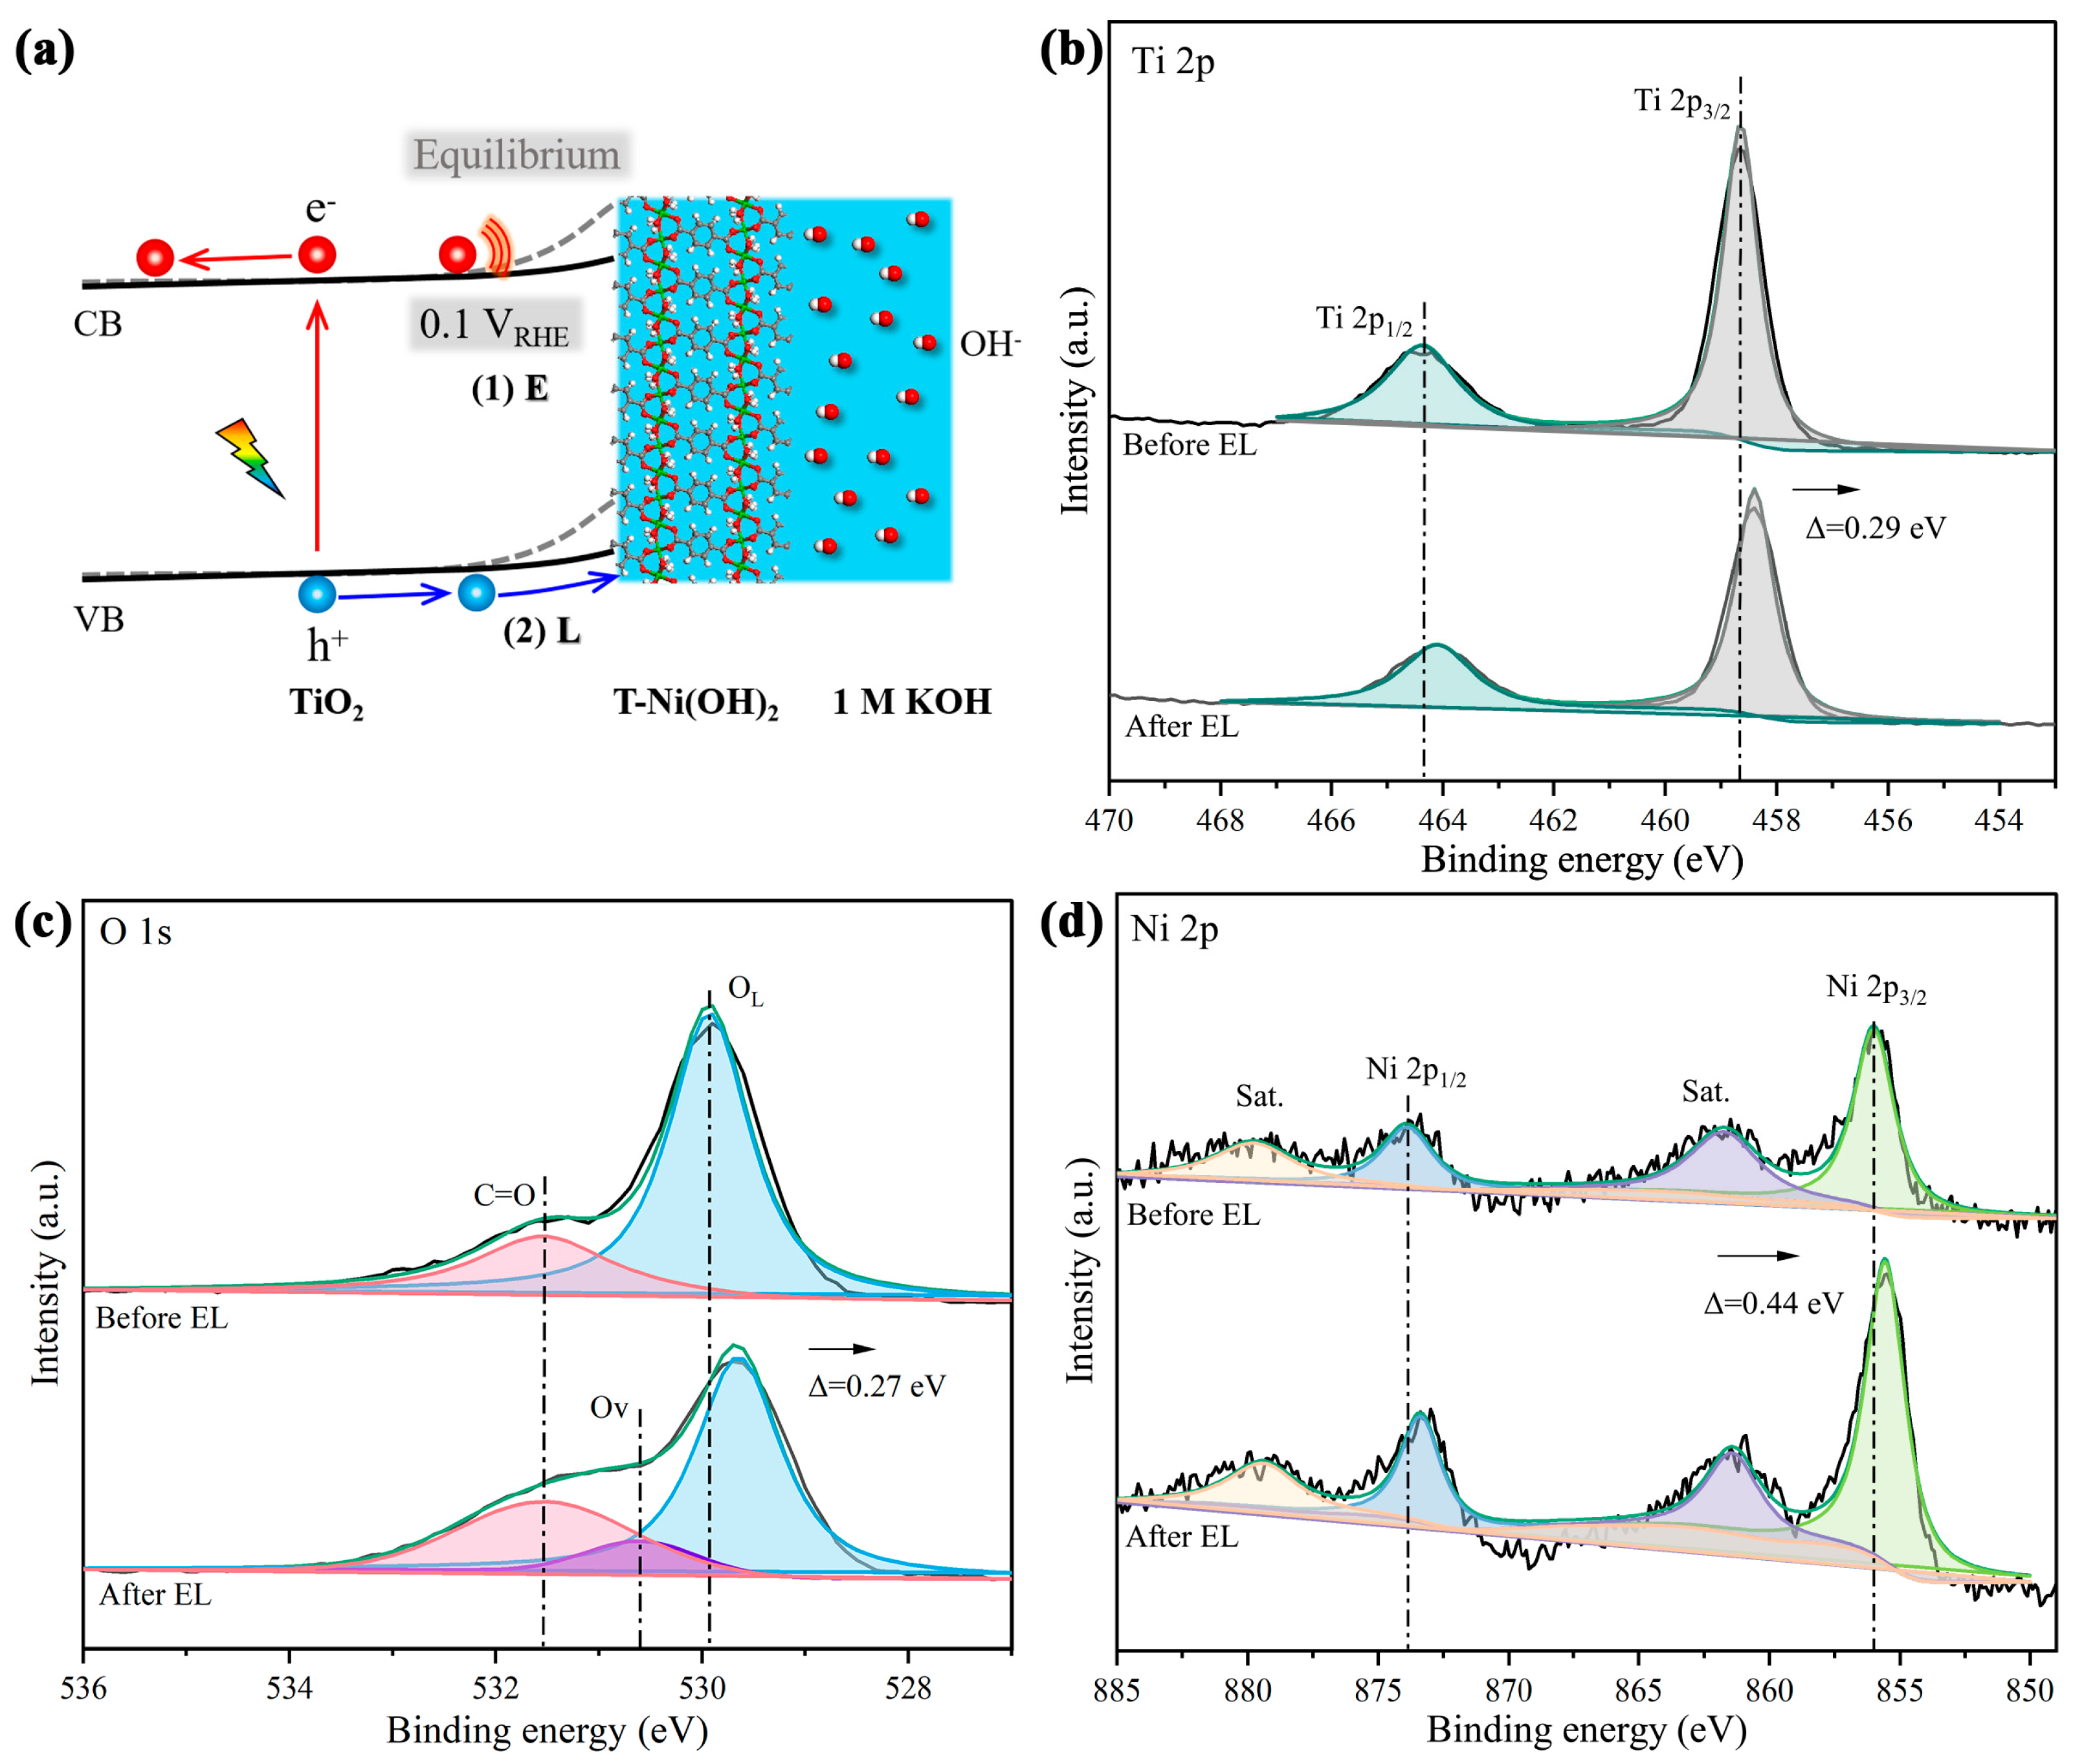
2.3. In Situ-Transition Mechanism of Ni-MOF

Transmission electron microscope (TEM) characterizations were used to observe the micro-structure and transition of the Ni-MOF after the EL treatment. The TEM results are shown in Figure 4a–g. The top of TiO2 nanorods coated with T-Ni(OH)2 can be observed clearly in Figure 4a. In Figure 4b, the TiO2 nanorod and T-Ni(OH)2 form a heterojunction. The high-resolution TEM image of the interface of TiO2/T-Ni(OH)2 marked with yellow square in Figure 4b is shown in Figure 4c. We measured the interspacing of lattice striping in three zones in Figure 4c, and the results are shown in Figure 4d–f. MOFs are the electron beam-sensitive crystalline materials, and their high-resolution imaging is still challenging to date [34]. Therefore, the interspacing of 0.25 and 0.21 nm can be attributed to the (100) and (101) directions of β-Ni(OH)2 (JCPDS No. 14-0117), respectively. The interspacing difference can be attributed to the imperfect transition of Ni-MOF. The formation of Ni(OH)2 powerfully demonstrates the in situ transition of the Ni-MOF occurs during the EL treatment. Moreover, the EL treatment also induces the formation of a disordered surface layer on TiO2 nanorods (Figure 4g), which is consistent with the reported results [35].
To study the influence of the EL treatment, we firstly subjected the TiO2 films to the electrochemical treatment (short as E) and EL treatment. As shown in Figure 5a, the EL-treated TiO2 photoanode exhibits a higher photocurrent density. Therefore, the EL treatment is utilized in this work. Furthermore, both treated and untreated TiO2 show no obvious photocurrent for urea splitting, as illustrated in Figure 5b. This suggests that there is no visible catalytic ability of TiO2 photoanodes towards urea oxidation reactions. When T-Ni(OH)2 is coated on the surface of TiO2 films, the photocurrent contribution for urea splitting can be observed as in Figure 5c. This indicates the role of T-Ni(OH)2 in this composite photoanode as a cocatalyst for urea splitting. Then various times were used to treat the TiO2 and T-Ni(OH)2@TiO2 photoanodes, following the EL way. The trends of the photocurrent increment Δ(Jph,xh − Jph,0h), the onset potential shift Δ(Von,0h − Von,xh), and the photocurrent contribution of urea splitting (Δ(Jph,urea − Jph)) are displayed in Figure 5d–f, respectively. Both TiO2 and T-Ni(OH)2@TiO2 photoanodes show a gradual improvement of Δ(Jph,xh − Jph,0h), suggesting the effectiveness of the EL treatment. At 6 h, the T-Ni(OH)2@TiO2 photoanode delivers the highest photocurrent density. Thus, 6 h was used to prepare the EL-treated photoanodes. A similar trend of Δ(Von,0h − Von,xh) is observed in Figure 5e. However, the shift of TiO2 is remarkably greater than that of T-Ni(OH)2@TiO2. This indicates that TiO2 has been influenced mostly, not the Ni(OH)2 layer. At last, we compared the difference in photocurrent density of 1 M KOH and 1 M KOH/0.33 M urea electrolytes. As shown in Figure 5f, the Ni-MOF modification and the EL treatment can truly boost the urea splitting (Δ(Jph,urea − Jph)). However, the EL treatment may be harmful for TiO2 photoanode when prolonging the time of the EL treatment. The corresponding LSV curves of the above photoanodes in different electrolytes are shown in Figures S13 and S14. In addition, we compared the LSV curves of untreated and EL-treated Ni(OH)2@TiO2 photoanodes as shown in Figure S15. Though the improvement of photocurrent density is observed after a 6 h EL treatment, the increment value of Δ(Jph,xh − Jph,0h) is 0.30 mA cm−2. This value is significantly lower than that of T-Ni(OH)2@TiO2 photoanodes after a 6 h EL treatment.
To reveal the mechanism of the EL treatment, we firstly measured the electrochemically active surface area (ECSA) of TiO2 and T-Ni(OH)2@TiO2 photoanodes with/without a 6 h EL treatment in 1 M KOH/0.33 M urea electrolyte. The potential window is 0.58–0.68 VRHE. As shown in Figure S16, the slope is equivalent to twice the double layer capacitance. Therefore, the unchanged slope after the EL treatment indicates that the factor of the ECSA improvement can be ruled out. To study the transition mechanism of the Ni-MOF during the EL processes, we collected the Ni-MOF powder during the electrode preparation and treated the powder with 1 M KOH and AM 1.5G illumination. The XRD patterns of the pristine and treated Ni-MOF powder are shown in Figure 6a,b. The as-prepared Ni-MOF shows a consistent result with the calculated XRD pattern (Figure 6a), suggesting the perfect crystal structure of the Ni-MOF synthesized in this work. The used crystal structure of the Ni-MOF for the XRD pattern calculation is shown in the inset of Figure 6a. The XRD pattern of the Ni-MOF treated with light illumination does not produce a new phase. This indicates that there is no influence on the Ni-MOF under the light illumination. However, a significant phase transition of the Ni-MOF treated in a KOH solution can be observed as shown in Figure 6b. The XRD pattern can be well-attributed to β-Ni(OH)2 (JCPDS No. 14-0117), which is consistent with the results of the TEM characterizations. The wide XRD peaks suggest that the size of β-Ni(OH)2 particles is small. The size estimated from the peak of 38.35° is 3.58 nm. The crystal structure of β-Ni(OH)2 is shown in the inset of Figure 6b. Considering the XRD results, we can deduce that a strong alkaline solution is one critical factor for the transition of the Ni-MOF [36].
Furthermore, we measured the CV curves of Ni-MOF@TiO2 electrode in the electrolyte of 1 M KOH/0.33 M urea and in the dark. The 100-cycle CV curves are shown in Figure 6c. A recognizable oxidation peak can be observed, which can be attributed to the oxidation of Ni2+/Ni3+ along with UOR located at ~1.52 VRHE [37]. The reduction peak at 1.33 VRHE can be attributed to the transformation from Ni3+ to Ni2+ species. Considering the large difference in the peak current, it can be deduced that the reduction of Ni3+/Ni2+ is hard to happen. The potential used for the EL treatment is 0.1 VRHE. As shown in Figure 6d, this potential is a reduction environment on the surface of Ni-MOF@TiO2. To sum up, the 0.1 VRHE potential will mainly induce the reduction of TiO2, while the high concentration of OH in 1 M KOH will lead to the in situ transition from the Ni-MOF to β-Ni(OH)2. The in situ-transition mechanism is schematically shown in the inset of Figure 6d. The ligands of the Ni-MOF will be substituted with OH- ions firstly. Then the phase transition will happen. Eventually, β-Ni(OH)2 is formed. This transition processes are consistent with the transition of ZIF-67 during the electrochemical processes [34].
To clearly illustrate the role of the EL treatment, the energy level diagram of T-Ni(OH)2@TiO2 is schematically shown in Figure 7a. At 0.1 VRHE, the bending of TiO2 band edge becomes weaker in comparison with the equilibrium state (process 1). The negative electrons will cause the reduction of TiO2, which is consistent with the reported result [35]. Of course, the electrons may induce the gentle reduction of T-Ni(OH)2. However, under AM1.5G illumination, the photogenerated holes in TiO2 possess the oxidizing ability (process 2), which would block the reduction of T-Ni(OH)2. Therefore, there will be no significant change (e.g., Ni2+ → Ni0) in the valance state of Ni species. In addition, the OH ions in KOH electrolyte can react with the Ni-MOF as shown in the inset of Figure 6d. At last, the in situ transition between the Ni-MOF and β-Ni(OH)2 takes place on the surface of T-Ni(OH)2@TiO2 photoanode.
The X-ray photoelectron spectroscopy (XPS) spectra of T-Ni(OH)2@TiO2 before and after the EL treatment can powerfully support the above explanation (Figure 7b–d). The spin-energy separation of Ti 2p and Ni 2p is 5.7 and 17.8 eV, respectively. These spin-energy separations indicate the presence of Ti4+ and Ni2+ [38]. After the EL treatment, Ti 2p3/2, OL, and Ni 2p3/2 peaks are negatively shifted by 0.29, 0.27, and 0.44 eV, respectively. The shift of Ti 2p suggests the presence of Ti3+ (Ti4+ + e → Ti3+) due to the electrochemical reduction [29]. In O 1s XPS spectra, the peak area of OOH (chemisorbed hydroxyl group) at 531.5 eV increases after the EL treatment, which demonstrates the formation of OH groups on the surface of TiO2 [33]. In addition, the peak of OV (oxygen vacancy) located at 530.6 eV can be observed after the EL treatment [39]. This change confirms the generation of oxygen vacancy. For Ni 2p XPS spectra, the spin-energy separation does not produce any change after the EL treatment, which is consistent with the reported results for the Ni(OH)2 and Ni-MOF [13]. The symmetric Ni 2p3/2 peak of T-Ni(OH)2@TiO2 informs that there is no visible presence of Ni3+ after the EL treatment. Ni2+ is partially reduced to Ni(2−δ)+. These characteristics indicate that the critical treatment of T-Ni(OH)2@TiO2 photoanode is the electrochemical treatment with electrons, not the photogenerated holes. The later can stabilize the +2 chemical state of Ni species in T-Ni(OH)2 layer, which can ensure the highly electrochemical activity of T-Ni(OH)2@TiO2 for UOR reaction [40]. As a control, Ni 2p XPS spectrum of Ni(OH)2@TiO2 shown in Figure S17 exhibits a slightly lower binding energy than that of T-Ni(OH)2@TiO2. This suggests that the Ni(OH)2 transformed from the Ni-MOF possesses a high oxidation state facilitating the urea oxidation reactions.

3. Materials and Methods

3.1. Materials

All chemicals and solvents were commercially available and used without further purification. Nickel (II) nitrate hexahydrate (NiCl2·6H2O), nickel nitrate hexahydrate (Ni(NO3)2·6H2O), 1,4-benzenedicarboxylic acid (BDC), triethylamine (TEA), N, N-dimethylformamide (DMF), urea (Co(NH2)2), sodium sulfite (Na2SO3), and potassium hydroxide (KOH) were purchased from Aladdin chemical company. Ethanol (C2H5OH) was analytical pure and purchased from a commercial supplier. Milli-Q water with a resistance of 18.2 MΩ was used for all experiments.

3.2. Preparation of TiO2 Photoanodes

TiO2 nanorod arrays were grown on FTO glasses by the hydrothermal method as had been previously reported [23]. TiO2 NRs thin films were grown on FTO glass by hydrothermal method. The FTO glass was ultrasonically cleaned successively with acetone, ethanol, and deionized (DI) water for 15 min, and then dried with a N2 flow. We slowly poured 20 mL of concentrated hydrochloric acid (38%) into 20 mL of DI water and stirred it well. Then, 0.668 mL of isopropyl titanate was added and thoroughly dissolved in the mixture by stirring. The aforementioned mixture was then transferred to a Teflon-lined stainless-steel autoclave (50 mL). We put the conductive side of the FTO conductive glass into the inner tank to ensure that the FTO glass is fully immersed in the mixed solution. The hydrothermal reaction was maintained at 180 °C for 3 h. After the reaction was completed, the autoclave was cooled to room temperature, and the FTO substrate was taken out. It was thoroughly rinsed with DI water, and then dried naturally at room temperature. In this work, the annealing time was extended to 1 h.

3.3. Preparation of T-Ni(OH)2@TiO2 and Ni(OH)2@TiO2 Photoanodes

Ni-MOFs were grown on the surface of TiO2 nanorod arrays by the chemical bath deposition method. Typically, dimethylformamide (DMF, 32 mL), ethanol (2 mL), and deionized water (DI H2O, 2 mL) were mixed together. Next, terephthalic acid (PTA, 0.075 mmol) and NiCl2·6H2O (0.075 mmol) were added to the above solution. After stirring until complete dissolution, 0.8 mL TEA was slowly added into the solution. Afterwards, the TiO2 photoanodes were immersed in the solution. The deposition process of Ni-MOFs was performed at 100 °C for 3 h. During this process, the solution was magnetically stirred at ~600–800 rpm min−1. After the synthesis of Ni-MOFs, the samples were rinsed with DI H2O and dried in the air naturally. Then Ni-MOF@TiO2 was electrochemically treated in a 1.0 M KOH/0.33 M urea solution at 0.1 VRHE under AM 1.5G illumination (short as EL). The optimal processing time was 6 h. The obtained samples were labeled as T-Ni(OH)2@TiO2. In addition, Ni-MOF powder was collected from the precipitation in the solution after the completed reaction for XRD characterizations.
Ni(OH)2@TiO2 photoanodes were fabricated as in the reported impregnation method [28]. TiO2 electrodes were dipped into 0.1 M Ni(NO3)2 for 10 s, then blow-dried with compressed N2. The electrodes next were dipped into 1.0 M KOH for 10 s and blow-dried with N2. Then Ni(OH)2 would be formed in a one-dip coating cycle. Three cycles were used for preparation of Ni(OH)2@TiO2.

3.4. Material Characterizations

The crystal structure was measured with XRD (PX’Pert Pro MPD, ANalytical B.V., Breda, The Netherlands) with a Cu Kα radiation source (λ = 1.5418 Å). The morphology of the as-prepared photoanodes was observed with SEM (Apreo 2C, Thermo Scientific, Waltham, MA, USA). The EDS pattern and mapping were obtained with an energy-dispersive spectrometer (ULTIM Max65, OXFORD, UK). The UV-vis absorption spectra were measured from 300 to 800 nm using the Shimadzu UV 3600 Plus (JPN) UV-vis-NIR spectrophotometer. XPS (XSAM-800, Kratos, Manchester, UK) was used to measure the chemical states of elements. Raman spectrum of TiO2 film was measured with an incident laser wavelength of 532 nm (Dxr2xi, Thermal Fisher, USA). The crystal structure of the EL-treated T-Ni(OH)2@TiO2 was performed with TEM (Talos F200S, Thermo Scientific, USA). ICP-MS measurement of 1.0 M KOH electrolyte was performed using Aglient 7700X (USA).

3.5. PEC Performance Measurements

Electrochemical workstation (CHI660E) was used for PEC performance-related tests. The TiO2-based photoanodes were used as the working electrode, the Pt wire was used as the counter electrode, and the Ag/AgCl electrode (3 M KCl) was used as the reference electrode. The potential was converted to the RHE electrode using the following Equation:
E RHE = E Ag / AgCl 0 + E Ag / AgCl + 0.059 × pH ,
where E Ag / AGCl 0 is 0.197 V. AM1.5G illumination (CELHXF 300) with an intensity of 100 mW cm−2 was used during the PEC measurements. The light is incident from the back of the photoanode. The electrolyte was a mixed solution of 1 M KOH and 0.33 M urea. During the study of Fe impurities, the electrolyte of 1.0 M KOH was purified as in the reported method [32]. The Ni/(Ni + Ti) ratio at the near surface of Ni(OH)2@TiO2 and T-Ni(OH)2@TiO2 measured with XPS was 84.98% and 20.10%, respectively.
LSV tests were performed at a scan rate of 20 mV s−1. PEISs were recorded at 0.8 VRHE with a 10 mV perturbation under AM 1.5G illumination. The frequency range is 0.1–105 Hz. The PEIS plots were fitted with Z-View software. MS measurements were performed at a fixed frequency of 1 kHz in the dark. To measure the ηsep and ηinj values, the electrolyte used was a mixed aqueous solution of 1 M KOH/0.33 M urea and 0.5 M Na2SO3.

4. Conclusions

In conclusion, one Ni-MOF cocatalyst was synthesized on the surface of TiO2 nanorod arrays for the PEC urea splitting. The in situ transition of the Ni-MOF during the EL treatment was found, which induces the formation of β-Ni(OH)2. T-Ni(OH)2@TiO2 photoanode delivers a high photocurrent density of 1.22 mA cm−2 at 1.23 VRHE, which is 4.7 times that of Ni(OH)2@TiO2 prepared with the impregnation method. The onset potential of T-Ni(OH)2@TiO2 is negatively shifted by 118 mV in comparison to TiO2. The PEC performance improvements can be attributed to the in situ-formed Ni(OH)2 cocatalyst, and the electrochemical reduction of TiO2. The former serves as the effectively active sites, which can be oxidized to the true active sites of NiOOH under the assistance of photogenerated holes. The later will induce the shallow states and promote the transfer of holes between TiO2 and T-Ni(OH)2. After the EL treatments, the charge separation and injection efficiencies are greatly boosted, even to near 100% injection efficiency. In addition, we experimentally confirm the origin of the in situ transition from the Ni-MOF to Ni(OH)2. A strong alkaline solution with OH ions can replace the ligands of the Ni-MOF and lead to the phase transition for Ni(OH)2 formation. This work applies to the chemical or/and electrochemical instability of MOFs in the preparation of nickel hydroxide catalysts, which provides a novel strategy for efficient PEC urea splitting.

Supplementary Materials

The following supporting information can be downloaded at: https://www.mdpi.com/article/10.3390/catal13040727/s1. Figure S1: (a) XRD pattern, (b) Raman spectrum, and (c) SEM image of TiO2 nanorod arrays film on FTO glass; Figure S2: (a) LSV curves and (b) chopped OCP curves of Ni-MOF@TiO2 prepared through CBD method with/without stirring, (c) LSV curves of Ni-MOF@TiO2 prepared at different temperatures, and (d) LSV curves of Ni-MOF@TiO2 prepared with various times; Figure S3: SEM image of Ni-MOF@TiO2 film; Figure S4: EDS mapping of T-Ni(OH)2@TiO2 film; Figure S5: EDS pattern of T-Ni(OH)2@TiO2 film on FTO glass; Figure S6: Top-view SEM images of (a) pristine TiO2 and (b) Ni(OH)2@TiO2 films; Figure S7: UV-vis absorption and transmittance spectra of TiO2 and T-Ni(OH)2@TiO2 with 6 h EL treatment; Figure S8: CV curves of Ni-MOF@TiO2 and T-Ni(OH)2@TiO2 photoanodes with 1 h EL treatments under AM1.5G illumination and in the dark; Figure S9: Long-term stability of T-Ni(OH)2@TiO2 photoanode at 1.23 VRHE under AM1.5G illumination; Figure S10: (a) LSV curves of T-Ni(OH)2@TiO2 photoanode with 1 h EL treatment in purified electrolyte, (b) LSV curves of T-Ni(OH)2@TiO2 photoanode with 1 h EL treatment in normal electrolyte; Figure S11: LSV curves of TiO2, Ni(OH)2@TiO2, and T-Ni(OH)2@TiO2 photoanodes measured in 1 M KOH/0.33 M urea (Solid line) and 1 M KOH/0.33 M urea containing 0.5 M Na2SO3 (Dash line); Figure S12: MS plots of TiO2, Ni(OH)2@TiO2, and T-Ni(OH)2@TiO2 photoanodes measured at a fixed frequency of 1000 Hz in the dark; Figure S13: (a) LSV curves of TiO2 after EL treatment with various times, (b) histogram of photocurrent density and onset potential of the above TiO2 photoanodes, (c) LSV curves of T-Ni(OH)2@TiO2 after EL treatment with different times, and (d) histogram of photocurrent density and onset potential of the above T-Ni(OH)2@TiO2 photoanodes; Figure S14: (a) LSV curves of TiO2 after EL treatment with various times, (b) histogram of photocurrent density and onset potential of the above TiO2 photoanodes, (c) LSV curves of T-Ni(OH2)@TiO2 after EL treatment with different times, and (d) histogram of photocurrent density and onset potential of the above T-Ni(OH2)@TiO2 photoanodes; Figure S15: LSV curves of Ni(OH)2@TiO2 photoanode with/without EL treatment of 6 h; electrolyte: 1 M KOH/0.33 M urea; Figure S16: The relationship curves between the capacitance current and the scan rate of TiO2-based photoanodes; Figure S17: Ni 2p XPS spectra of Ni-MOF@TiO2, T-Ni(OH)2@TiO2 and Ni(OH)2@TiO2; Table S1: PEIS fitting parameters of TiO2, Ni(OH)2@TiO2 and T-Ni(OH)2@TiO2 photoanodes.

Author Contributions

J.R.: Conceptualization, Methodology, Investigation, Data curation, Formal analysis, Writing—original draft. P.Y.: Conceptualization, Methodology, Investigation, Formal analysis, Funding acquisition, Supervision, Writing—review and editing. L.W.: Methodology, Formal analysis. H.C.: Investigation, Formal analysis. X.L.: Formal analysis. Q.Y.: Formal analysis. L.Z.: Investigation. C.H.: Project administration, Funding acquisition. J.X.: Formal analysis, Funding acquisition, Visualization, Writing—review and editing. All authors have read and agreed to the published version of the manuscript.

Funding

This work was supported by grants from the Sichuan Science and Technology Program (2020YJ0123, 2022NSFSC1272), the National Natural Science Foundation of China (21703150), the Scientific Research Starting Project of SWPU (2021QHZ018, 2021QHZ032), the Chengde Education Bureau Program (QYGG004, QYGG010) and the School of New Energy and Materials Program (2022SCNYTZHCL013).

Data Availability Statement

Data supporting reported results can be found in Supplementary Materials.

Conflicts of Interest

The authors declare no conflict of interest. The funders had no role in the design of the study.

References

  1. Pastor, E.; Sachs, M.; Selim, S.; Durrant, J.R.; Bakulin, A.A.; Walsh, A. Electronic defects in metal oxide photocatalysts. Nat. Rev. Mater. 2022, 7, 503–521. [Google Scholar] [CrossRef]
  2. Kundu, B.K.; Han, G.; Sun, Y. Derivatized Benzothiazoles as Two-Photon-Absorbing Organic Photosensitizers Active under Near Infrared Light Irradiation. J. Am. Chem. Soc. 2023, 145, 3535–3542. [Google Scholar] [CrossRef]
  3. Tang, R.; Zhou, S.; Zhang, Z.; Zheng, R.; Huang, J. Engineering Nanostructure–Interface of Photoanode Materials Toward Photoelectrochemical Water Oxidation. Adv. Mater. 2021, 33, 2005389. [Google Scholar] [CrossRef] [PubMed]
  4. Wang, H.; Qi, J.; Yang, N.; Cui, W.; Wang, J.; Li, Q.; Zhang, Q.; Yu, X.; Gu, L.; Li, J.; et al. Dual-Defects Adjusted Crystal-Field Splitting of LaCo1−xNixO3−δ Hollow Multishelled Structures for Efficient Oxygen Evolution. Angew. Chem. Int. Ed. 2020, 59, 19691–19695. [Google Scholar] [CrossRef] [PubMed]
  5. Zhu, B.; Liang, Z.; Zou, R. Designing Advanced Catalysts for Energy Conversion Based on Urea Oxidation Reaction. Small 2020, 16, 1906133. [Google Scholar] [CrossRef]
  6. Zhu, D.; Zhang, H.; Miao, J.; Hu, F.; Wang, L.; Tang, Y.; Qiao, M.; Guo, C. Strategies for designing more efficient electrocatalysts towards the urea oxidation reaction. J. Mater. Chem. A 2022, 10, 3296–3313. [Google Scholar] [CrossRef]
  7. Radjenovic, J.; Sedlak, D.L. Challenges and Opportunities for Electrochemical Processes as Next-Generation Technologies for the Treatment of Contaminated Water. Environ. Sci. Technol. 2015, 49, 11292–11302. [Google Scholar] [CrossRef]
  8. Altalhi, T.A.; Ibrahim, M.M.; Mersal, G.A.M.; Mahmoud, M.H.H.; Kumeria, T.; El-Desouky, M.G.; El-Bindary, A.A.; El-Bindary, M.A. Adsorption of doxorubicin hydrochloride onto thermally treated green adsorbent: Equilibrium, kinetic and thermodynamic studies. J. Mol. Struct. 2022, 1263, 133160. [Google Scholar] [CrossRef]
  9. Kundu, B.K.; Pragti; Biswas, S.; Mondal, A.; Mazumdar, S.; Mobin, S.M.; Mukhopadhyay, S. Unveiling the urease like intrinsic catalytic activities of two dinuclear nickel complexes towards the in situ syntheses of aminocyanopyridines. Dalton Trans. 2021, 50, 4848–4858. [Google Scholar] [CrossRef]
  10. Vedharathinam, V.; Botte, G.G. Understanding the electro-catalytic oxidation mechanism of urea on nickel electrodes in alkaline medium. Electrochim. Acta 2012, 81, 292–300. [Google Scholar] [CrossRef]
  11. Vedharathinam, V.; Botte, G.G. Direct evidence of the mechanism for the electro-oxidation of urea on Ni(OH)2 catalyst in alkaline medium. Electrochim. Acta 2013, 108, 660–665. [Google Scholar] [CrossRef]
  12. El-Bindary, M.A.; El-Desouky, M.G.; El-Bindary, A.A. Metal–organic frameworks encapsulated with an anticancer compound as drug delivery system: Synthesis, characterization, antioxidant, anticancer, antibacterial, and molecular docking investigation. Appl. Organomet. Chem. 2022, 36, e6660. [Google Scholar] [CrossRef]
  13. Zhu, D.; Guo, C.; Liu, J.; Wang, L.; Du, Y.; Qiao, S.-Z. Two-dimensional metal–organic frameworks with high oxidation states for efficient electrocatalytic urea oxidation. Chem. Commun. 2017, 53, 10906–10909. [Google Scholar] [CrossRef] [PubMed]
  14. Maruthapandian, V.; Kumaraguru, S.; Mohan, S.; Saraswathy, V.; Muralidharan, S. An Insight on the Electrocatalytic Mechanistic Study of Pristine Ni MOF (BTC) in Alkaline Medium for Enhanced OER and UOR. ChemElectroChem 2018, 5, 2795–2807. [Google Scholar] [CrossRef]
  15. Xu, Y.; Chai, X.; Ren, T.; Yu, S.; Yu, H.; Wang, Z.; Li, X.; Wang, L.; Wang, H. Ir-Doped Ni-based metal–organic framework ultrathin nanosheets on Ni foam for enhanced urea electro-oxidation. Chem. Commun. 2020, 56, 2151–2154. [Google Scholar] [CrossRef] [PubMed]
  16. Zhang, X.; Fang, X.; Zhu, K.; Yuan, W.; Jiang, T.; Xue, H.; Tian, J. Fe-doping induced electronic structure reconstruction in Ni-based metal-organic framework for improved energy-saving hydrogen production via urea degradation. J. Power Sources 2022, 520, 230882. [Google Scholar] [CrossRef]
  17. Li, M.; Sun, H.; Yang, J.; Humayun, M.; Li, L.; Xu, X.; Xue, X.; Habibi-Yangjeh, A.; Temst, K.; Wang, C. Mono-coordinated metallocene ligands endow metal-organic frameworks with highly efficient oxygen evolution and urea electrolysis. Chem. Eng. J. 2022, 430, 132733. [Google Scholar] [CrossRef]
  18. Yuan, M.; Wang, R.; Sun, Z.; Lin, L.; Yang, H.; Li, H.; Nan, C.; Sun, G.; Ma, S. Morphology-Controlled Synthesis of Ni-MOFs with Highly Enhanced Electrocatalytic Performance for Urea Oxidation. Inorg. Chem. 2019, 58, 11449–11457. [Google Scholar] [CrossRef]
  19. Hu, S.; Wang, S.; Feng, C.; Wu, H.; Zhang, J.; Mei, H. Novel MOF-Derived Nickel Nitride as High-Performance Bifunctional Electrocatalysts for Hydrogen Evolution and Urea Oxidation. ACS Sustain. Chem. Eng. 2020, 8, 7414–7422. [Google Scholar] [CrossRef]
  20. Xu, H.; Ye, K.; Zhu, K.; Gao, Y.; Yin, J.; Yan, J.; Wang, G.; Cao, D. Transforming Carnation-Shaped MOF-Ni to Ni–Fe Prussian Blue Analogue Derived Efficient Bifunctional Electrocatalyst for Urea Electrolysis. ACS Sustain. Chem. Eng. 2020, 8, 16037–16045. [Google Scholar] [CrossRef]
  21. Li, M.; Ao, X.; Li, J.-G.; Sun, H.; Zheng, L.; Wang, C. NiCo-BDC nanosheets coated with amorphous Ni-S thin film for high-efficiency oxygen evolution reaction and urea oxidation reaction. FlatChem 2021, 25, 100222. [Google Scholar] [CrossRef]
  22. Wang, Y.; Wang, C.; Shang, H.; Yuan, M.; Wu, Z.; Li, J.; Du, Y. Self-driven Ru-modified NiFe MOF nanosheet as multifunctional electrocatalyst for boosting water and urea electrolysis. J. Colloid Interface Sci. 2022, 605, 779–789. [Google Scholar] [CrossRef]
  23. Wang, X.; Xie, J.; Li, C.M. Architecting smart “umbrella” Bi2S3/rGO-modified TiO2 nanorod array structures at the nanoscale for efficient photoelectrocatalysis under visible light. J. Mater. Chem. A 2015, 3, 1235–1242. [Google Scholar] [CrossRef]
  24. Cho, I.S.; Chen, Z.; Forman, A.J.; Kim, D.R.; Rao, P.M.; Jaramillo, T.F.; Zheng, X. Branched TiO2 Nanorods for Photoelectrochemical Hydrogen Production. Nano Lett. 2011, 11, 4978–4984. [Google Scholar] [CrossRef] [PubMed]
  25. Challagulla, S.; Tarafder, K.; Ganesan, R.; Roy, S. Structure sensitive photocatalytic reduction of nitroarenes over TiO2. Sci. Rep. 2017, 7, 8783. [Google Scholar] [CrossRef] [PubMed]
  26. Zhu, H.; Zhao, M.; Zhou, J.; Li, W.; Wang, H.; Xu, Z.; Lu, L.; Pei, L.; Shi, Z.; Yan, S.; et al. Surface states as electron transfer pathway enhanced charge separation in TiO2 nanotube water splitting photoanodes. Appl. Catal. B Environ. 2018, 234, 100–108. [Google Scholar] [CrossRef]
  27. Carton, A.; Mesbah, A.; Mazet, T.; Porcher, F.; François, M. Ab initio crystal structure of nickel(II) hydroxy-terephthalate by synchrotron powder diffraction and magnetic study. Solid State Sci. 2007, 9, 465–471. [Google Scholar] [CrossRef]
  28. Wang, G.; Ling, Y.; Lu, X.; Wang, H.; Qian, F.; Tong, Y.; Li, Y. Solar driven hydrogen releasing from urea and human urine. Energy Environ. Sci. 2012, 5, 8215–8219. [Google Scholar] [CrossRef]
  29. Yang, Y.; Ling, Y.; Wang, G.; Liu, T.; Wang, F.; Zhai, T.; Tong, Y.; Li, Y. Photohole Induced Corrosion of Titanium Dioxide: Mechanism and Solutions. Nano Lett. 2015, 15, 7051–7057. [Google Scholar] [CrossRef]
  30. Wang, L.; Zhu, S.; Marinkovic, N.; Kattel, S.; Shao, M.; Yang, B.; Chen, J.G. Insight into the synergistic effect between nickel and tungsten carbide for catalyzing urea electrooxidation in alkaline electrolyte. Appl. Catal. B Environ. 2018, 232, 365–370. [Google Scholar] [CrossRef] [Green Version]
  31. Safeer, N.K.M.; Alex, C.; Jana, R.; Datta, A.; John, N.S. Remarkable COx tolerance of Ni3+ active species in a Ni2O3 catalyst for sustained electrochemical urea oxidation. J. Mater. Chem. A 2022, 10, 4209–4221. [Google Scholar] [CrossRef]
  32. Trotochaud, L.; Young, S.L.; Ranney, J.K.; Boettcher, S.W. Nickel–Iron Oxyhydroxide Oxygen-Evolution Electrocatalysts: The Role of Intentional and Incidental Iron Incorporation. J. Am. Chem. Soc. 2014, 136, 6744–6753. [Google Scholar] [CrossRef] [PubMed]
  33. Ma, W.; Huang, K.; Wu, X.; Wang, M.; Feng, S. Surface polarization enables high charge separation in TiO2 nanorod photoanode. Nano Res. 2021, 14, 4056–4062. [Google Scholar] [CrossRef]
  34. Zheng, W.; Liu, M.; Lee, L.Y.S. Electrochemical Instability of Metal–Organic Frameworks: In Situ Spectroelectrochemical Investigation of the Real Active Sites. ACS Catal. 2020, 10, 81–92. [Google Scholar] [CrossRef]
  35. Yan, P.; Liu, G.; Ding, C.; Han, H.; Shi, J.; Gan, Y.; Li, C. Photoelectrochemical Water Splitting Promoted with a Disordered Surface Layer Created by Electrochemical Reduction. ACS Appl. Mater. Interfaces 2015, 7, 3791–3796. [Google Scholar] [CrossRef]
  36. Dai, W.; Zhou, J.; Bian, Y.; Hao, Z.; Cao, Y.; Xiao, J.; Gou, H.; Gao, F. A universal synthesis of MOF-Hydroxyl for highly active oxygen evolution. J. Colloid Interface Sci. 2022, 623, 318–326. [Google Scholar] [CrossRef]
  37. Tran, T.Q.N.; Das, G.; Yoon, H.H. Nickel-metal organic framework/MWCNT composite electrode for non-enzymatic urea detection. Sens. Actuators B Chem. 2017, 243, 78–83. [Google Scholar] [CrossRef]
  38. Cao, Q.; Yuan, Y.; Wang, K.; Huang, W.; Zhao, Y.; Sun, X.; Ding, R.; Lin, W.; Liu, E.; Gao, P. Phase and crystallinity regulations of Ni(OH)2 by vanadium doping boost electrocatalytic urea oxidation reaction. J. Colloid Interface Sci. 2022, 618, 411–418. [Google Scholar] [CrossRef]
  39. Gao, R.-T.; Wang, L. Stable Cocatalyst-Free BiVO4 Photoanodes with Passivated Surface States for Photocorrosion Inhibition. Angew. Chem. Int. Ed. 2020, 59, 23094–23099. [Google Scholar] [CrossRef]
  40. Zhang, L.; Wang, L.; Lin, H.; Liu, Y.; Ye, J.; Wen, Y.; Chen, A.; Wang, L.; Ni, F.; Zhou, Z.; et al. A Lattice-Oxygen-Involved Reaction Pathway to Boost Urea Oxidation. Angew. Chem. Int. Ed. 2019, 58, 16820–16825. [Google Scholar] [CrossRef]
Figure 1. (a,b) Top-view SEM images of T-Ni(OH)2@TiO2 films. T-Ni(OH)2 overlayer is indicated by arrows.
Catalysts 13 00727 g001
Figure 2. (a) LSV curves of TiO2, Ni(OH)2@TiO2, and T-Ni(OH)2@TiO2 in 1 M KOH/0.33 M urea at a scan rate of 20 mV s−1. Dash line: dark. Solid line: AM1.5G illumination. (b) Chopped j-t curves of TiO2-based photoanodes at 1.23 VRHE. (c) OCP of TiO2-based photoanodes under the chopped light. (d) Stability test of T-Ni(OH)2@TiO2 in 1 M KOH/0.33 M urea at 1.23 VRHE. (e) LSV curves of T-Ni(OH)2@TiO2 before and after 0.5 h stability test and 0.5 h EL treatment. (f) LSV curves of T-Ni(OH)2@TiO2 before each cycle of the stability test and EL treatment.
Catalysts 13 00727 g002
Figure 3. (a) Bulk charge separation efficiency and (b) surface charge injection efficiency plots of TiO2, Ni(OH)2@TiO2, and T-Ni(OH)2@TiO2. (c) Nyquist plots of TiO2, Ni(OH)2@TiO2, and T-Ni(OH)2@TiO2 photoanodes at 0.8 VRHE in 1 M KOH/0.33 M urea under AM 1.5G illumination. Inset: equivalent circuit for PEIS fitting. Solid line: fitting plot.
Catalysts 13 00727 g003
Figure 4. (a,b) Low-magnification TEM images of T-Ni(OH)2@TiO2. (cf) High-magnification TEM images of T-Ni(OH)2@TiO2. (g) TEM image of T-Ni(OH)2@TiO2 in the region of bare TiO2.
Catalysts 13 00727 g004
Figure 5. (a) LSV curves of TiO2 photoanodes subjected to 1 h E and 1 h EL treatments. (b) LSV curves of TiO2 photoanodes with/without 6 h EL treatment measured in 1 M KOH or 1 M KOH/0.33 M urea. (c) LSV curves of T-Ni(OH)2@TiO2 photoanodes with/without 6 h EL treatment measured in 1 M KOH or 1 M KOH/0.33 M urea. (d) The increment of photocurrent density (Δ(Jph,xh − Jph,0h)) of TiO2 and T-Ni(OH)2@TiO2 photoanodes. (e) The negative shift of the onset potential (Δ(Von,0h − Von,xh)) of TiO2 and T-Ni(OH)2@TiO2 photoanodes. (f) The difference values of the urea splitting Jph,urea and water splitting Jph (Δ(Jph,urea − Jph)). Scan rate: 20 mV s−1. Illumination: AM 1.5 G illumination.
Catalysts 13 00727 g005
Figure 6. (a) Calculated and experimental XRD patterns of as-prepared Ni-MOF powder. Inset: crystal structure of Ni-MOF. (b) XRD of Ni-MOF powder treated under AM 1.5G illumination and in the 1 M KOH/0.33 M urea solution. Inset: crystal structure of β-Ni(OH)2. (c,d) CV curves of Ni-MOF@TiO2 electrode measured in the electrolyte of 1 M KOH/0.33 M urea and in the dark. Scan rate: 100 mV s−1. Inset of (d): probable transition mechanism of Ni-MOF.
Catalysts 13 00727 g006
Figure 7. (a) In situ-transition mechanism of Ni-MOF on the surface of T-Ni(OH)2@TiO2 under EL treatment. Dash line: equilibrium state. Solid line: at the potential of 0.1 VRHE. (b) Ti 2p, (c) O 1s, and (d) Ni 2p XPS spectra of T-Ni(OH)2@TiO2 before and after 6 h EL treatment.
Catalysts 13 00727 g007
Disclaimer/Publisher’s Note: The statements, opinions and data contained in all publications are solely those of the individual author(s) and contributor(s) and not of MDPI and/or the editor(s). MDPI and/or the editor(s) disclaim responsibility for any injury to people or property resulting from any ideas, methods, instructions or products referred to in the content.

