Article

Electrocatalytic Oxygen Reduction to Hydrogen Peroxide on Graphdiyne-Based Single-Atom Catalysts: First-Principles Studies

1
State Key Laboratory of Photocatalysis on Energy and Environment, College of Chemistry, Fuzhou University, Fuzhou 350002, China
2
Institute of Advanced Energy Materials, College of Chemistry, Fuzhou University, Fuzhou 350002, China
*
Authors to whom correspondence should be addressed.
Catalysts 2023, 13(2), 307; https://doi.org/10.3390/catal13020307
Submission received: 8 January 2023 / Revised: 21 January 2023 / Accepted: 26 January 2023 / Published: 30 January 2023
(This article belongs to the Section Computational Catalysis)

Abstract

:
The electrocatalytic oxygen reduction reaction (2e ORR) via a two-electron process is a promising pathway for the production of hydrogen peroxide (H2O2). Here, we systematically investigated the 2e ORR process on graphdiyne (GDY) supported single transition metal atoms (TM1@GDY) using density functional theory (DFT) calculations. Among the 23 TM1@GDY catalysts, Pt1@GDY showed the best performance for the H2O2 product with an overpotential as low as 0.15 V. The electronic structure analysis, on the one hand, elucidates that the electron transfer between Pt1@GDY and the adsorbed O2 facilitates the activation of O2, and, on the other hand, reveals that the high 2e ORR activity of Pt1@GDY lies in the transfer of electrons from the filled Pt-3d orbitals to the 2p antibonding orbitals of OOH*, which effectively activates the O–O bond. This work provides insights to design efficient electrocatalysts for H2O2 generation.

1. Introduction

Hydrogen peroxide (H2O2) is an important green chemical with various applications in industrial processes such as paper bleaching, textiles, water treatment [1,2,3,4] and chemical synthesis [5]. More importantly, COVID-19, which is currently sweeping the world, has intensified the demand for H2O2 for medical purposes. Global production of H2O2 was close to 4.5 million tons in 2020, and the market demand is expected to reach approximately 5.7 million tons by 2027 [6]. However, current industrial H2O2 production relies mainly on the anthraquinone oxidation (AO) process, which is costly and highly polluting [7]. In addition, transporting, storing and handling high concentrations of H2O2 is dangerous and expensive. Hence, it has become urgent to develop a simple, low-cost and environmentally friendly method for H2O2 production. In recent years, electrocatalytic reduction of O2 has been considered as a promising method for the production of H2O2 [8,9,10]. In this case, H2O2 can be produced on-site, which is both safe and convenient. The electrocatalytic O2 reduction reaction (ORR) involves multiple electron steps, where O2 can be reduced to H2O2 via the 2e pathway or to H2O via the 4e route. Therefore, the main challenge in H2O2 production with the electrocatalytic ORR is how to control the selectivity of the reaction.
An increasing number of catalysts for the electrocatalytic synthesis of H2O2 have been reported recently, including noble metal [11,12] and their alloy catalysts [9,13,14], single-atom catalysts and carbon-based catalysts [15,16,17]. Among these, carbon-based catalysts are of great interest due to their abundant sources and easy tunability. In particular, graphene-based single-atom catalysts (SACs) have been designed and applied for the preparation of H2O2. For example, previous studies have reported that metal–nitrogen–carbon SACs can promote the selectivity of the electrocatalytic 2e ORR while maintaining high activity [18,19,20]. As a member of the carbon material family, graphdiyne (GDY) has recently been reported in various fields [21]. Importantly, single metal atoms can be stably anchored on the GDY surface [22,23] due to the in-plane conjugated network of alkyl and aryl groups and the inhomogeneous charge distribution of GDY. More importantly, the pristine GDY monolayer (Figure 1a) has an excellent electron mobility, reaching 105 cm2/(Vs) at 300 K [24]. These advantages of GDY make it of great potential as a substrate for electrocatalysts.
In this work, we have investigated the activity of a series of single transition metal atoms (TM1) supported on GDY (TM1@GDY) for the 2e ORR using density functional theory (DFT) calculations under acidic conditions (pH = 0). Of all the TM1@GDYs, calculations showed that Pt1@GDY has the best activity and selectivity in the 2e ORR. Encouragingly, the predicted activity of Pt1@GDY is comparable to that of known commercial catalysts. Electronic structure analysis further revealed the origin of the high activity of Pt1@GDY towards the 2e ORR. This work provides insight into the design of efficient electrocatalysts for the production of H2O2.

2. Results and Discussion

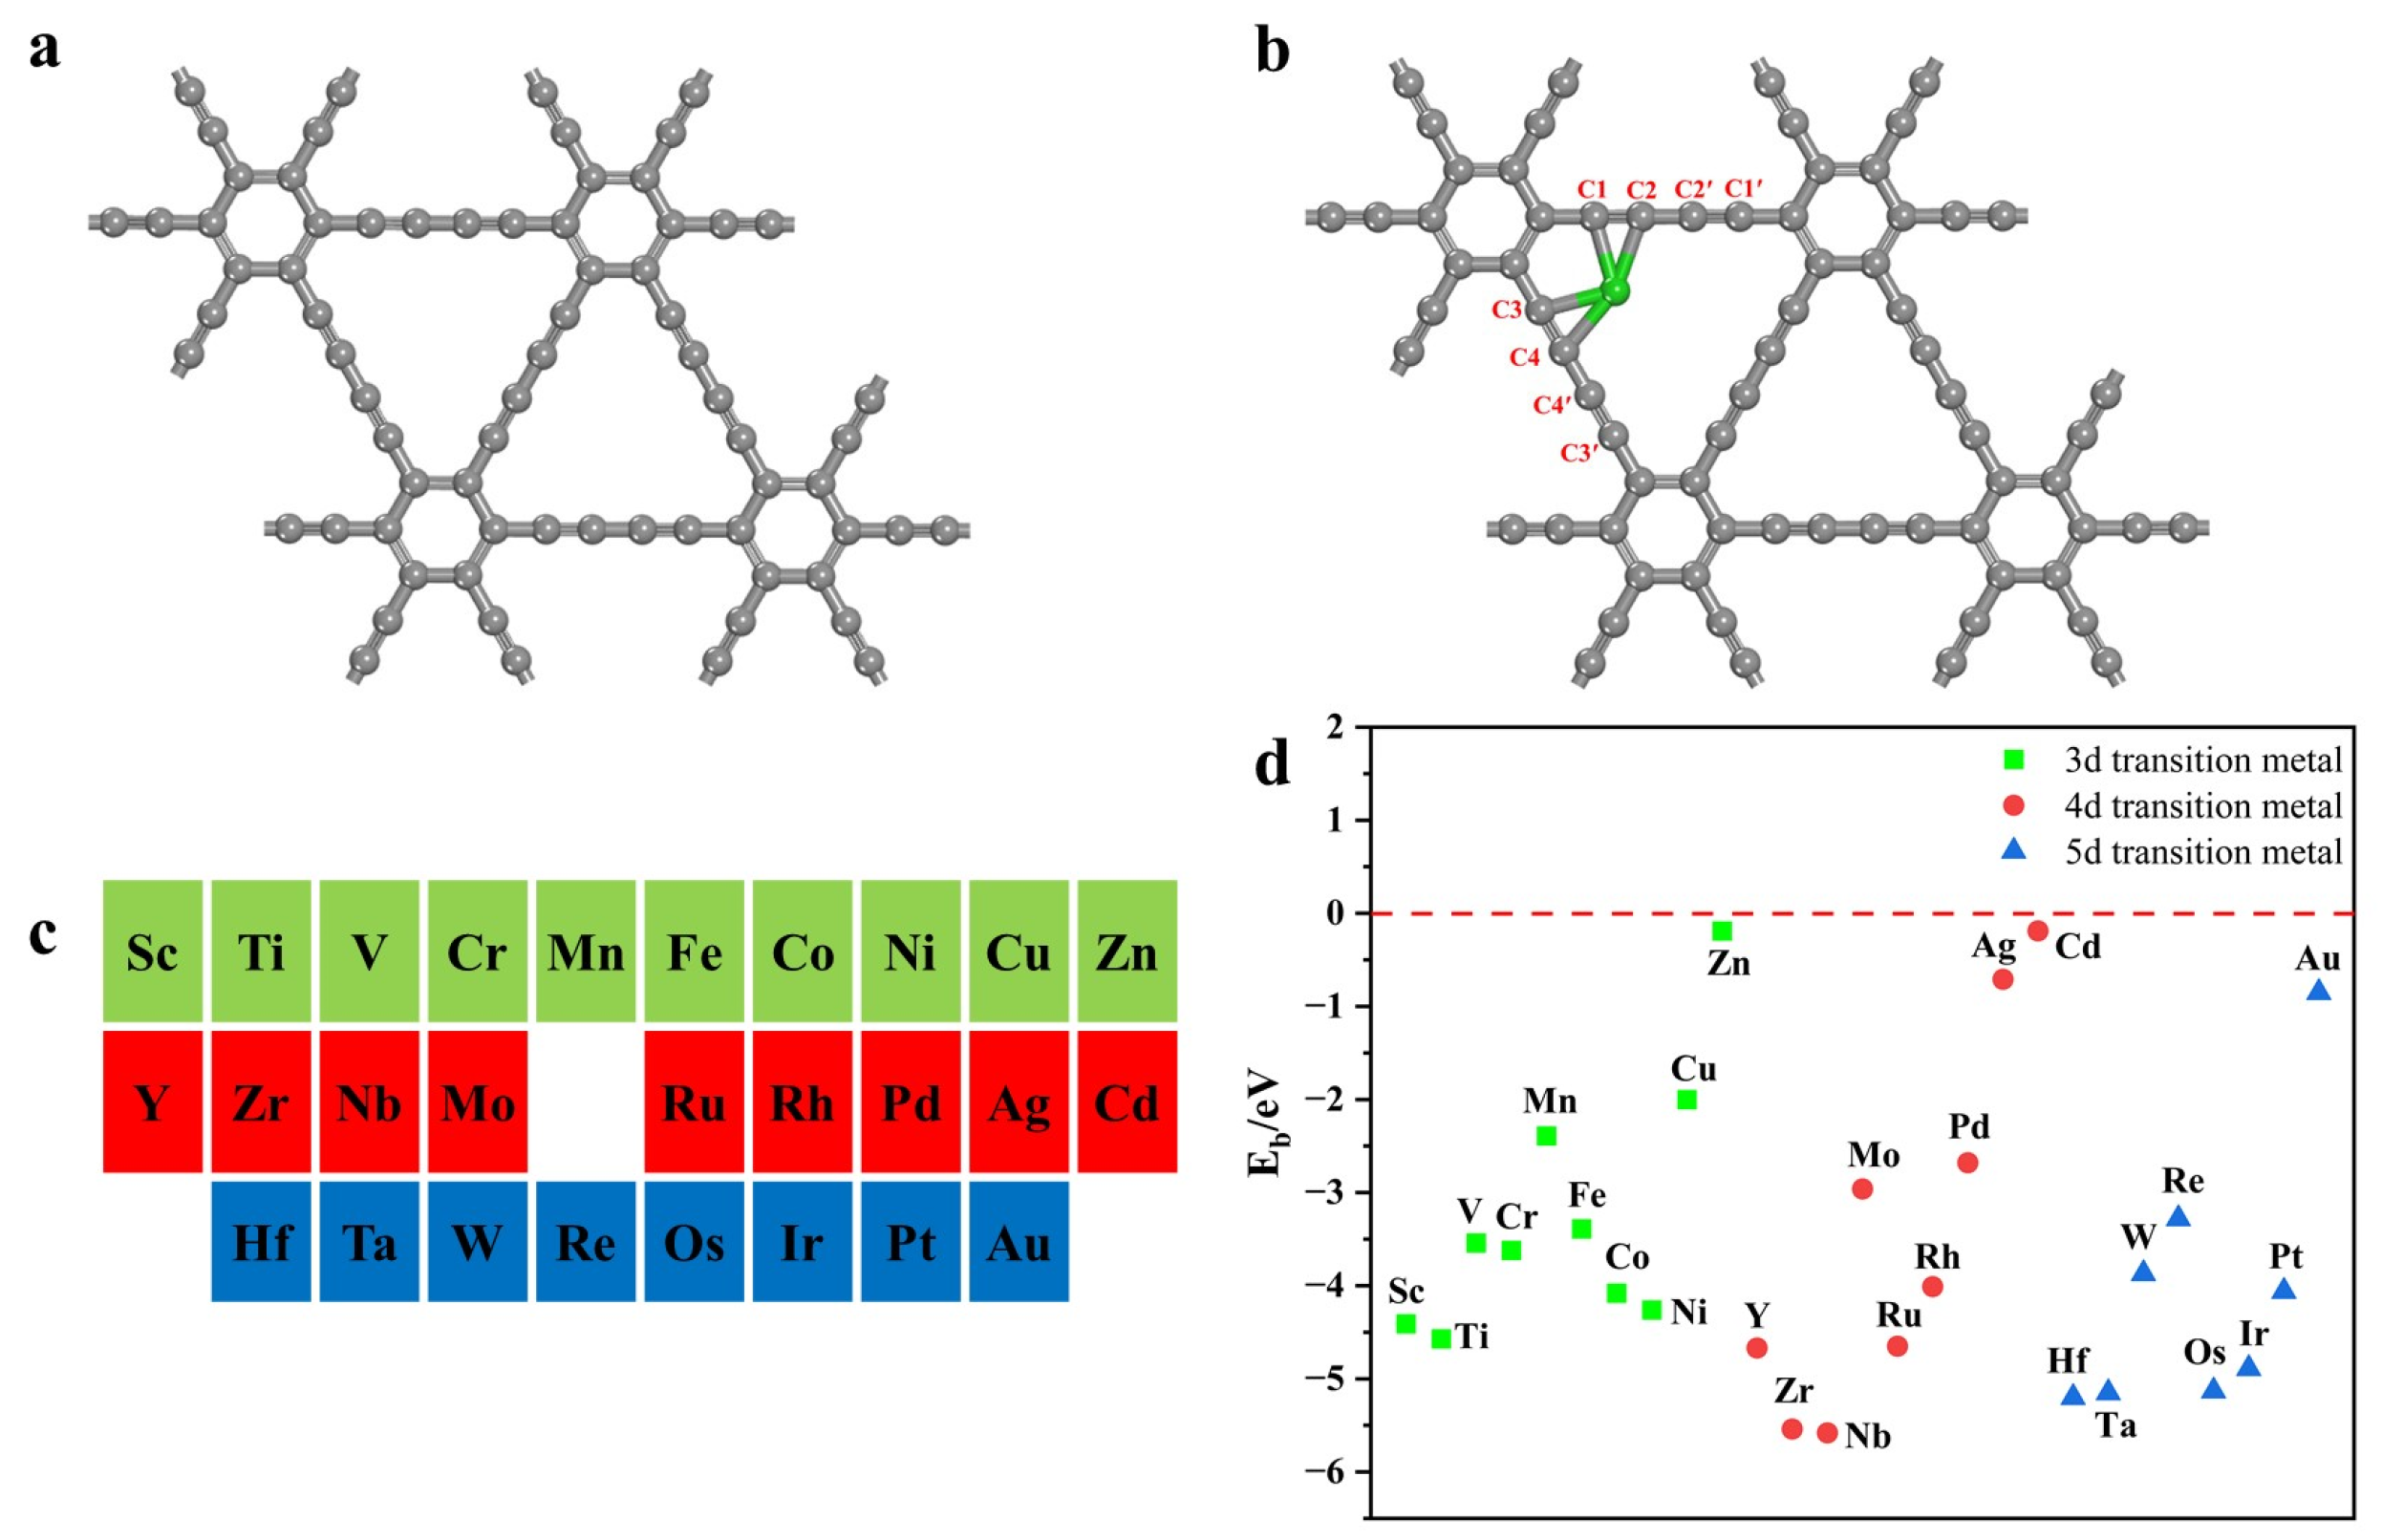
2.1. Catalyst Structure and Stability

As the stability of a catalyst is a prerequisite for its application, we first assessed the thermal stability of TM1@GDY by calculating the binding energy (Eb) of TM1 on GDY. As shown in Figure 1b, TM1 prefers to adsorb on corners near the six-membered carbon ring and is bonded to four carbon atoms. TM1 involves all 3d, 4d and 5d transition metal elements except for radioactive technetium (Tc), lanthanides (La~Lu) and the liquid metal mercury (Hg), as shown in Figure 1c. The Eb of TM1 was calculated as follows:
E b = E TM 1 @ GDY   E TM 1     E GDY
where E TM 1 @ GDY  and EGDY represent the total energy of TM1@GDY and GDY, respectively, and   E TM 1   represents the energy of the single transition metal atom. The Eb of all TM1@GDY are shown in Figure 1d and Table S1 from Supplementary Materials, and the Eb < 0 indicated that the single metal atom can be stably supported on GDY. It is found that the Eb of single atoms of zinc (Zn), cadmium (Cd), argentum (Ag) and aurum (Au) are less than 0 eV but greater than −1 eV. Their optimized structures are shown in Figure S1 from Supplementary Materials. However, it is found that the Zn and Cd on GDY are not at the corners of the acetylene ring but at the center of the ring. They are far from the GDY plane at distances of 2.32 and 3.03 Å, respectively, indicating that Cd1@GDY and Zn1@GDY are unstable. The Eb of both Ag1 and Au1@GDY are very close to 0 eV, indicating that they are also unstable. Meanwhile, the Eb of Cu1@GDY was calculated to be −2.00 eV. Notably, Li et al. synthesized Cu single atoms anchored to GDY and demonstrated that the supported Cu1 is very stable [25]. Therefore, we consider the supported single atoms with Eb more negative than −2.00 eV to be stable by using Cu1@GDY as a criterion. Accordingly, Zn, Cd, Ag and Au single atoms are relatively unstable because their Eb is more positive than −2.00 eV.

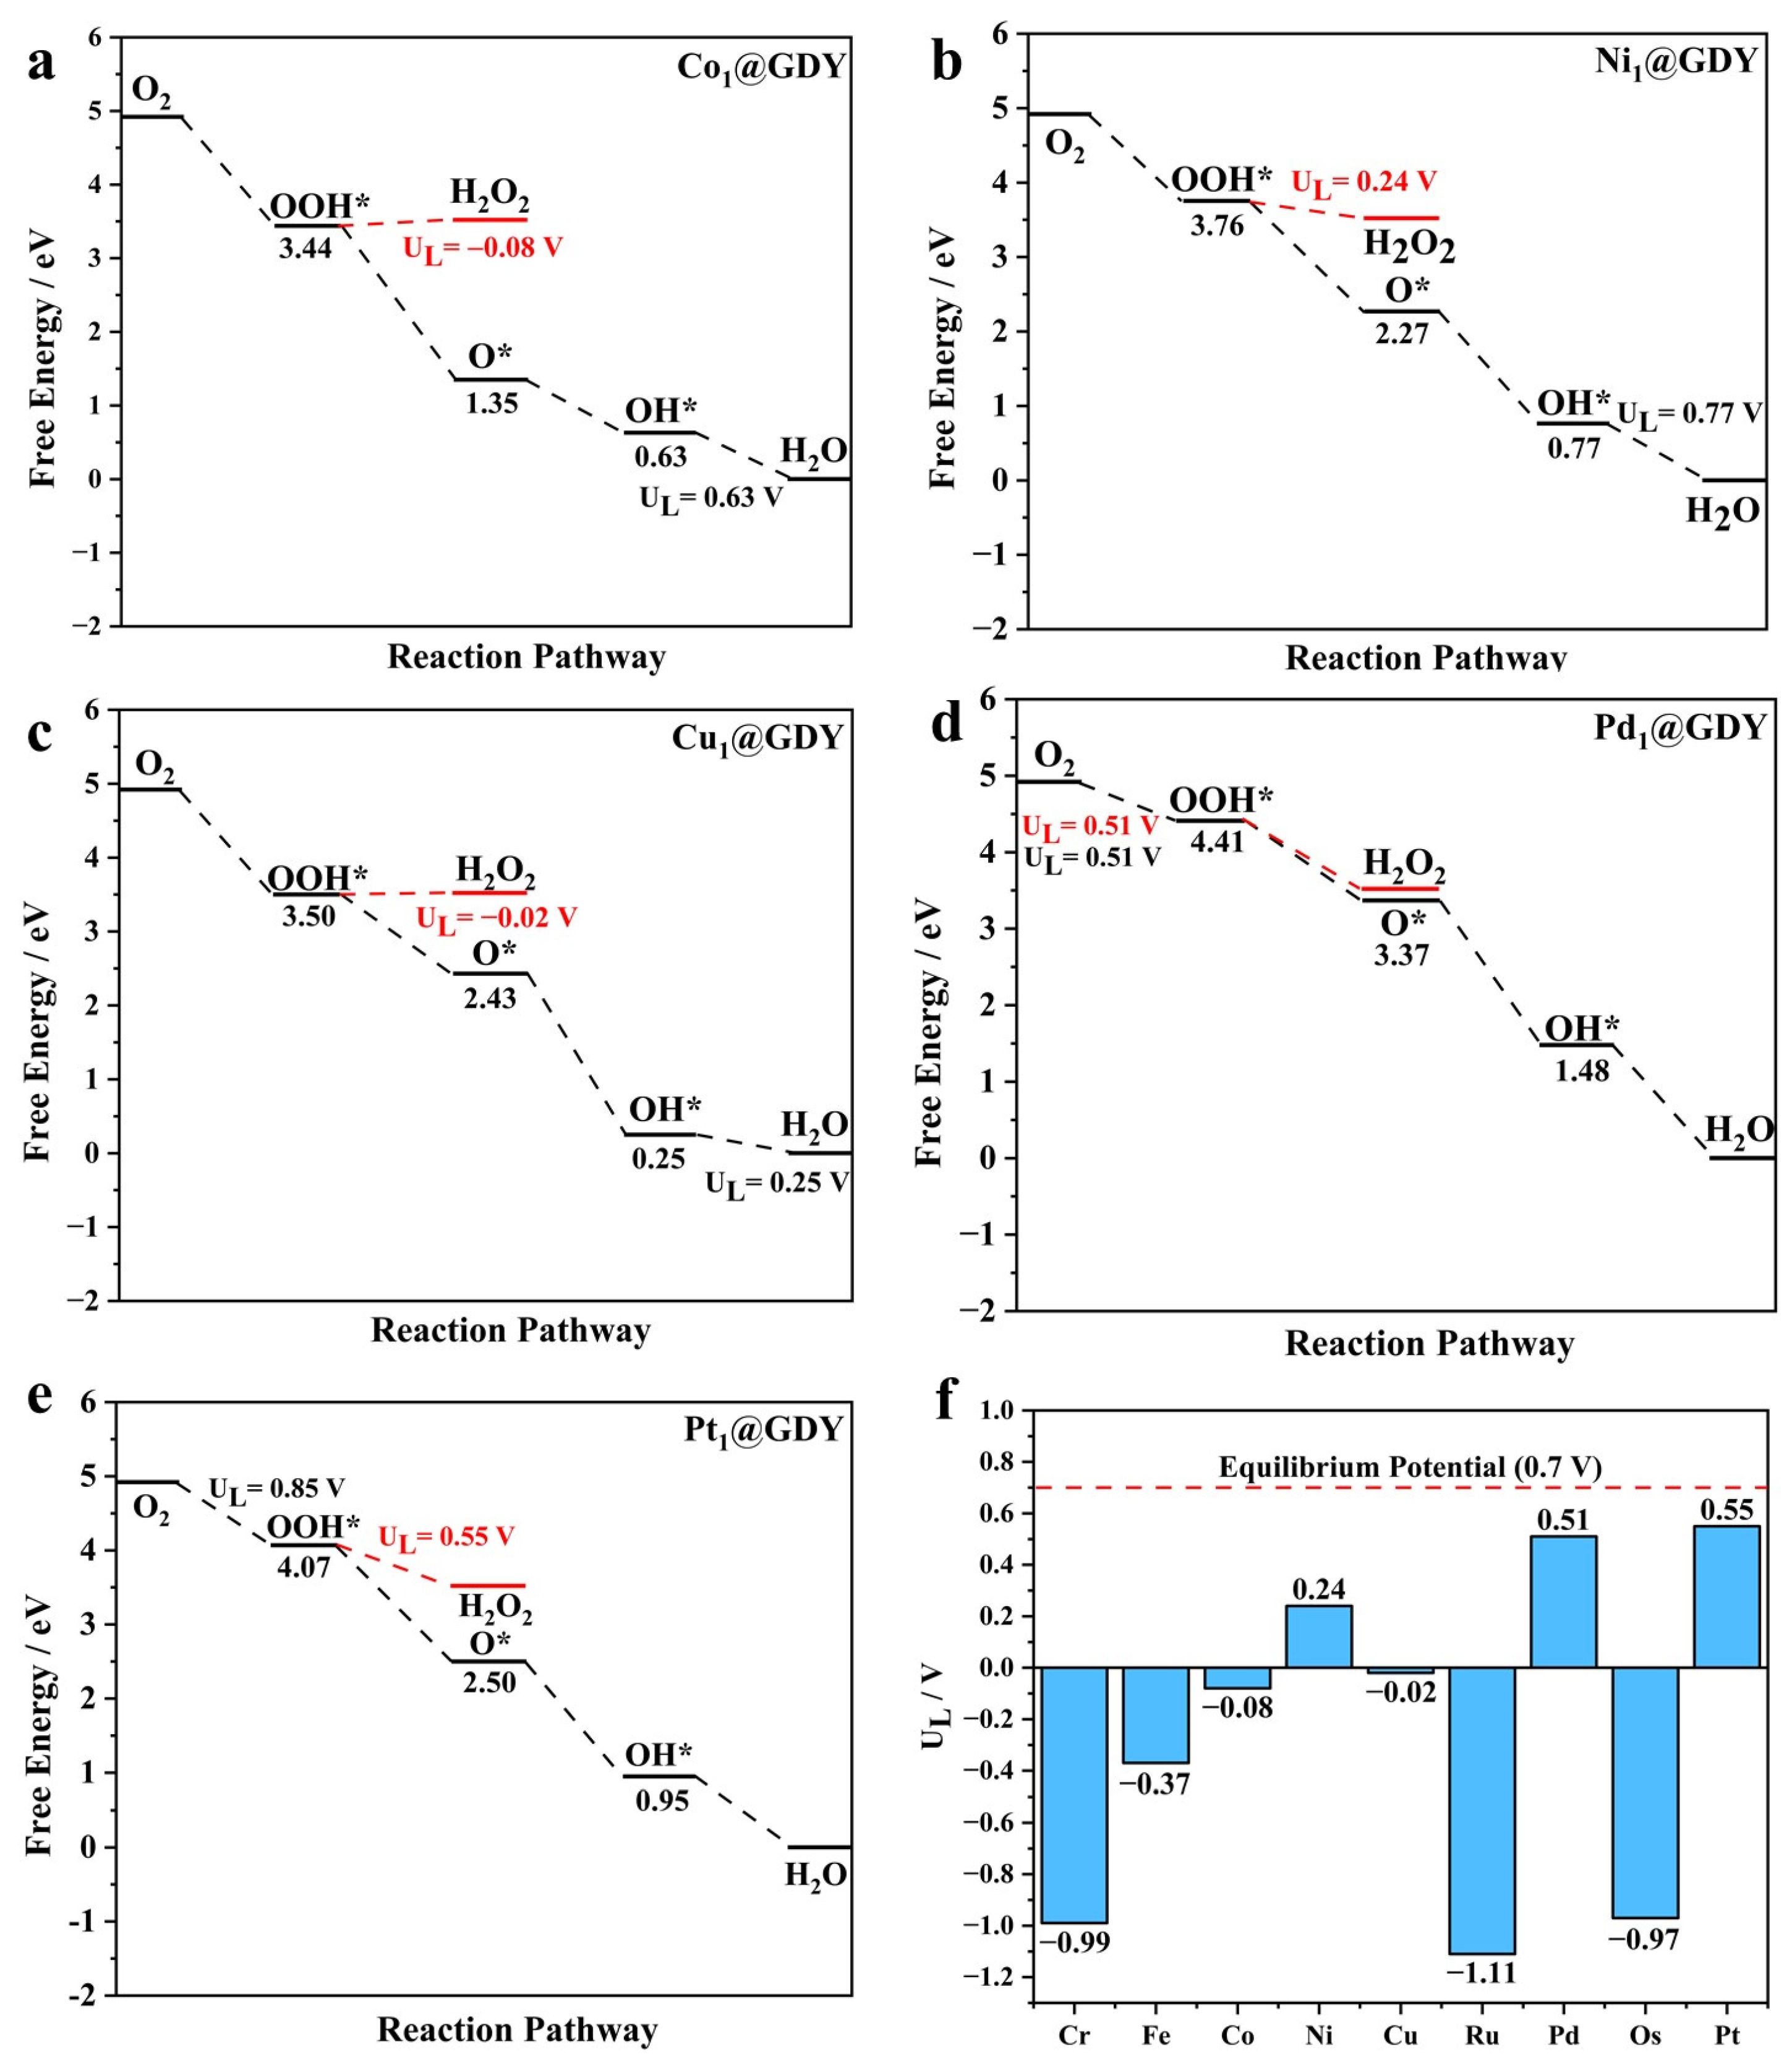
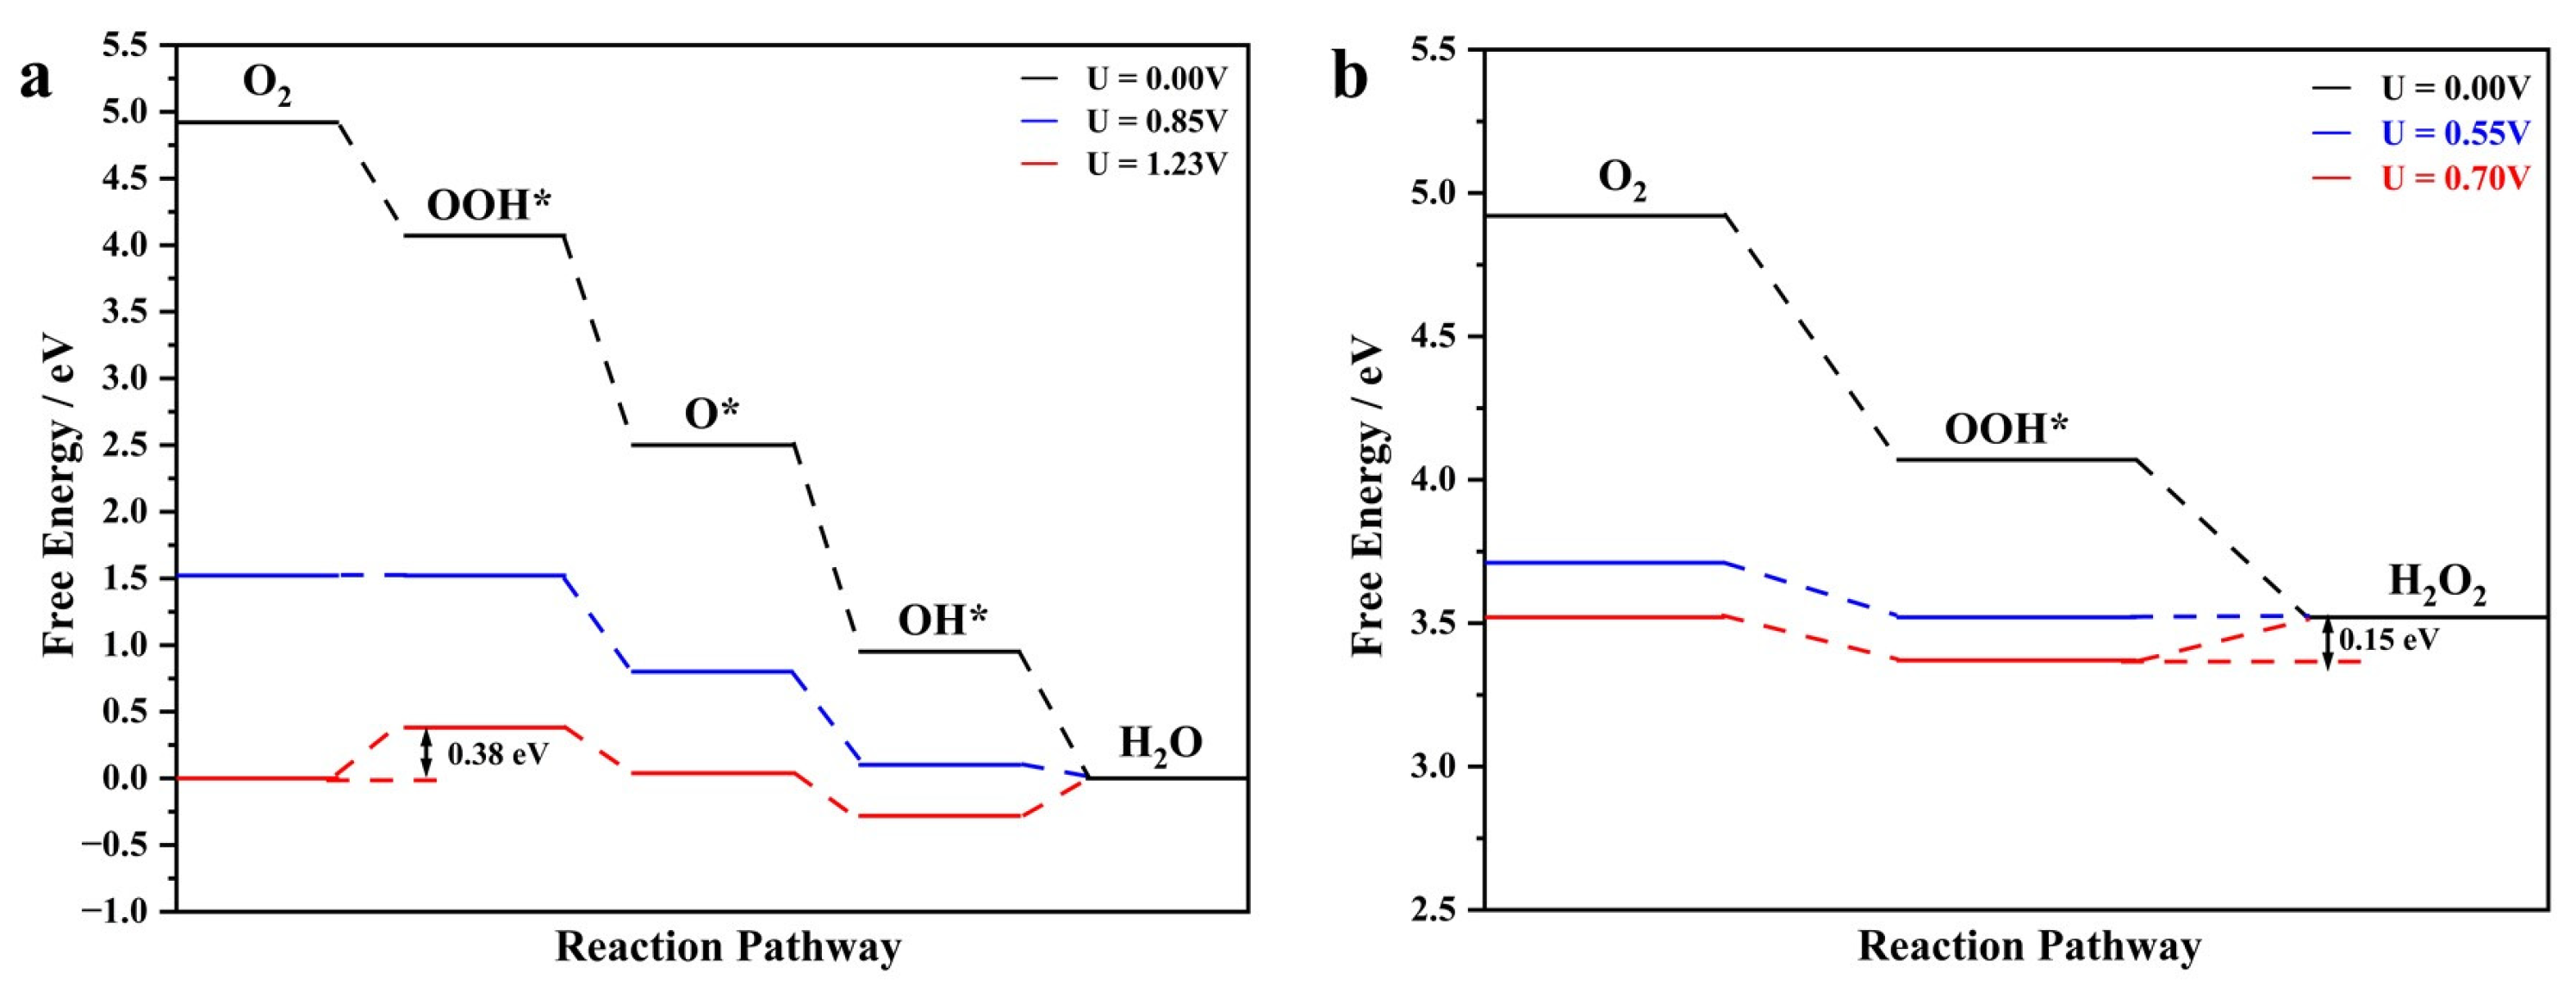
2.2. Catalyst Performance
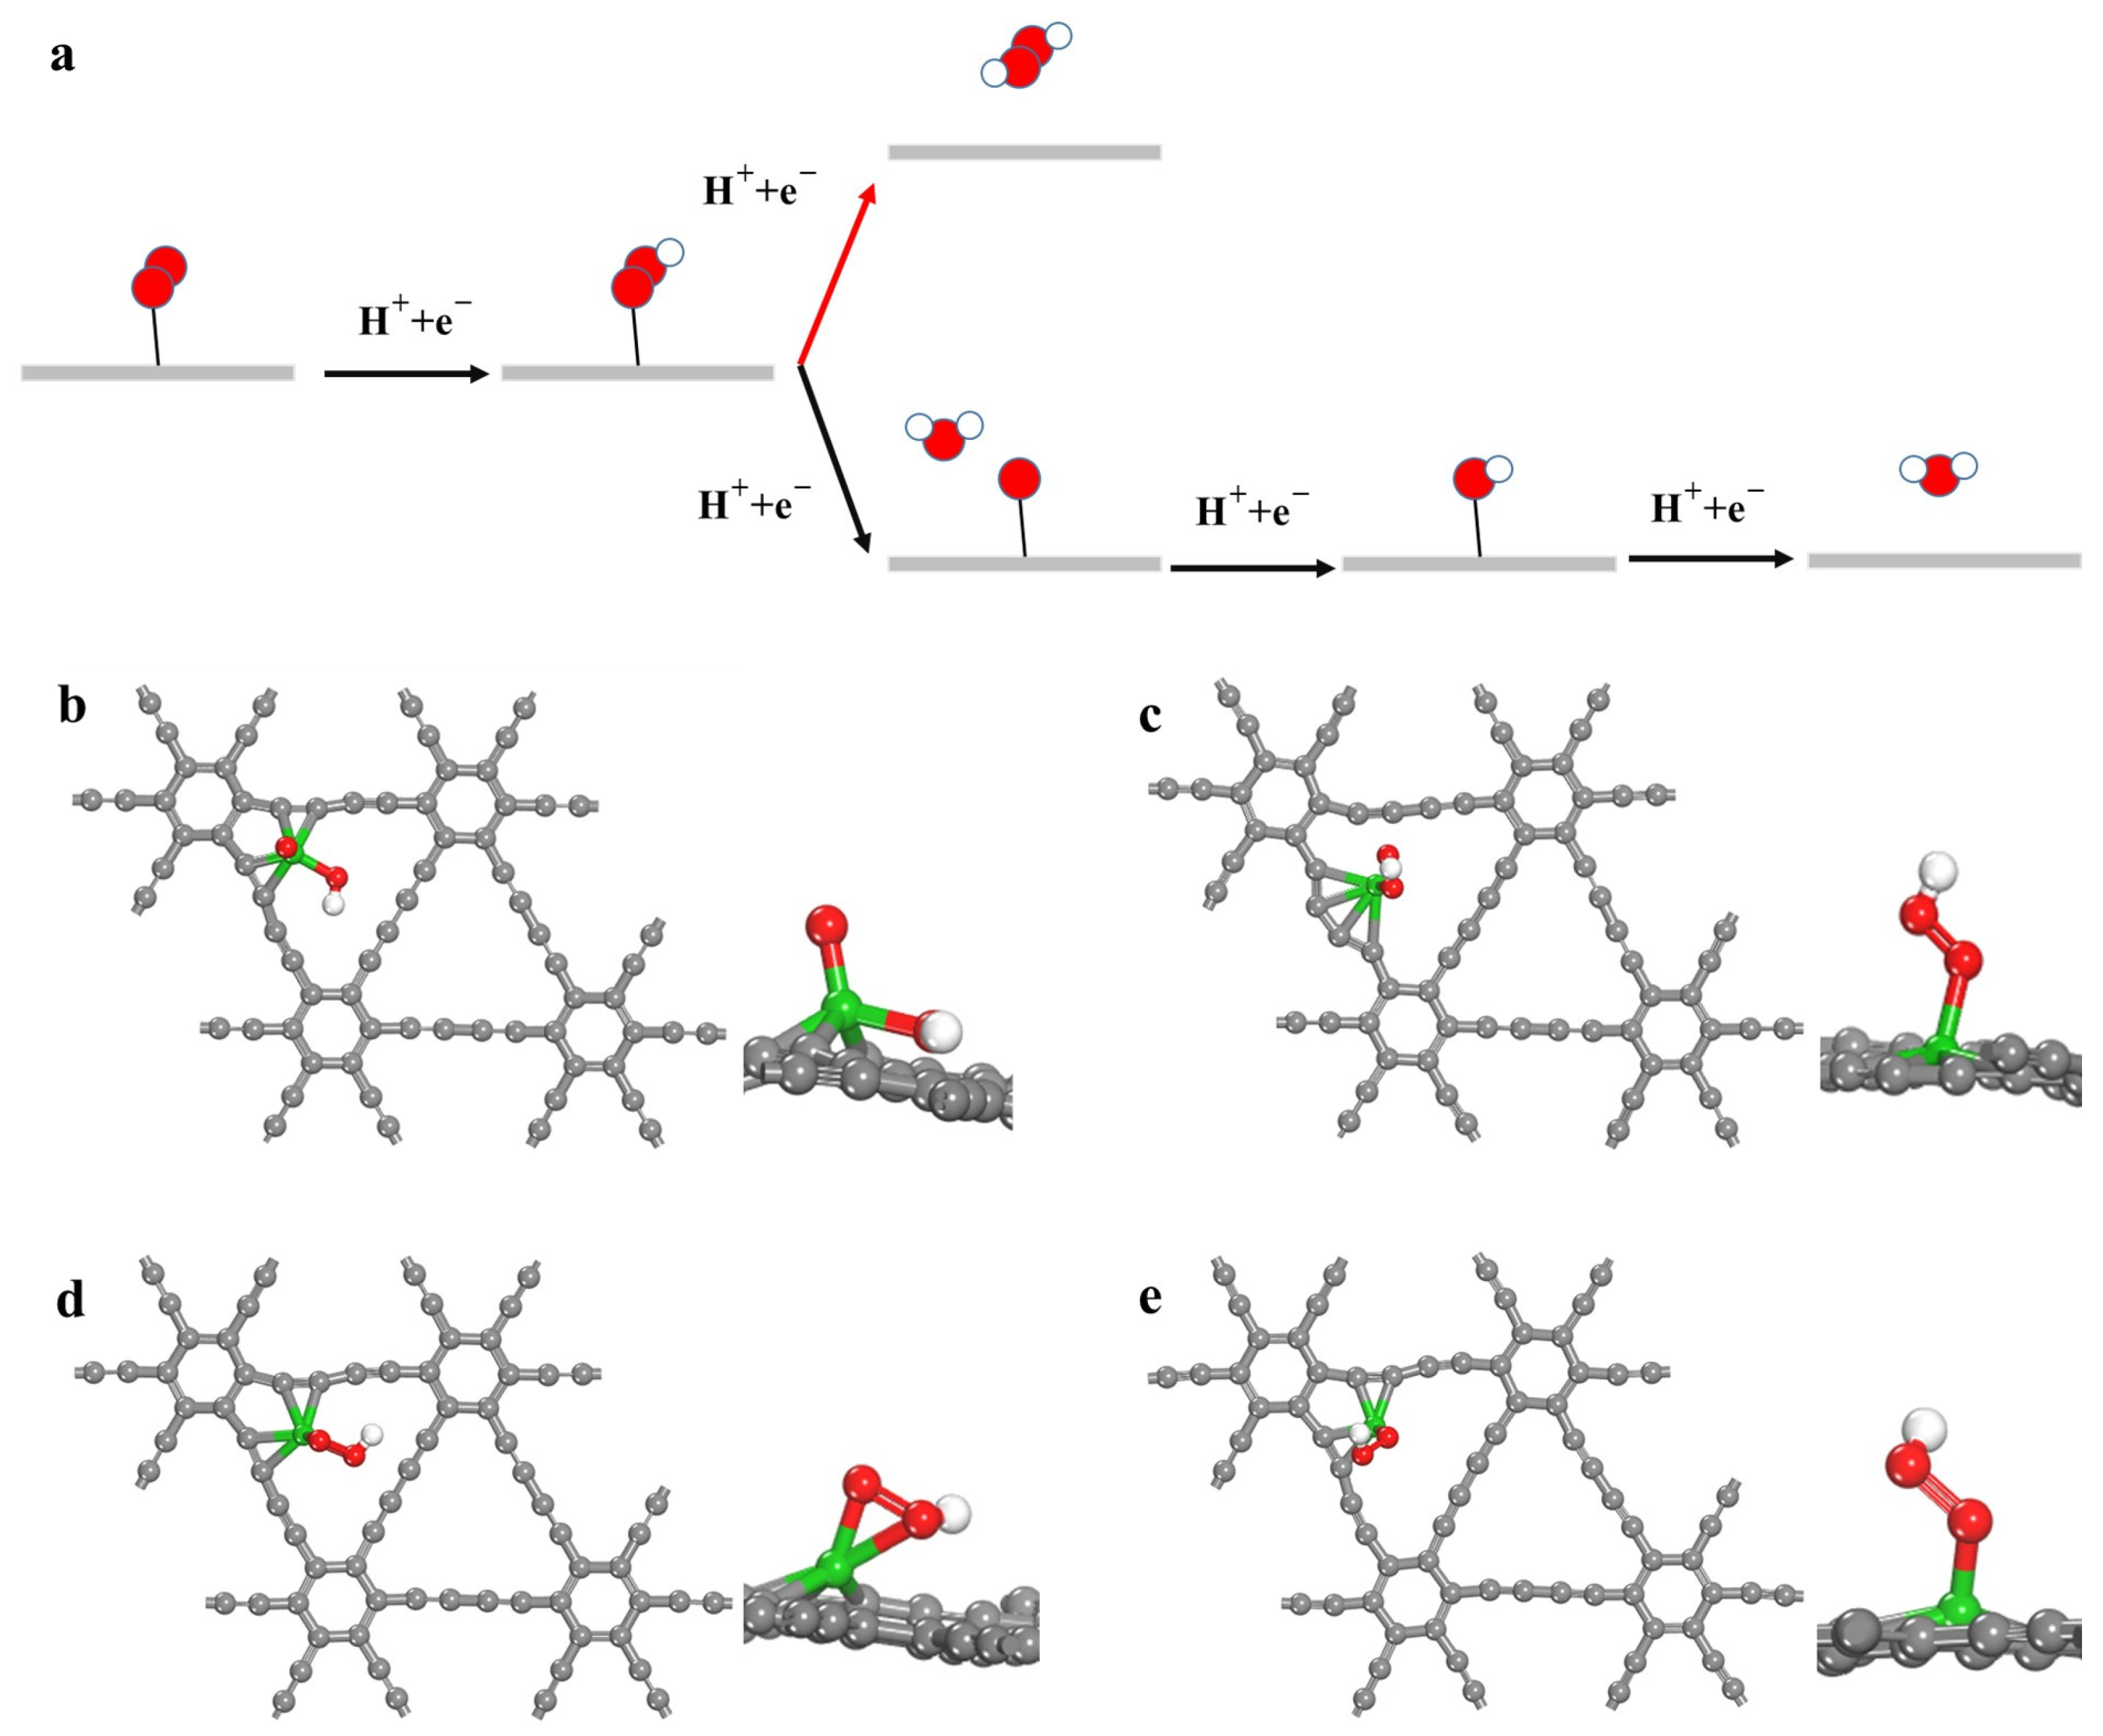
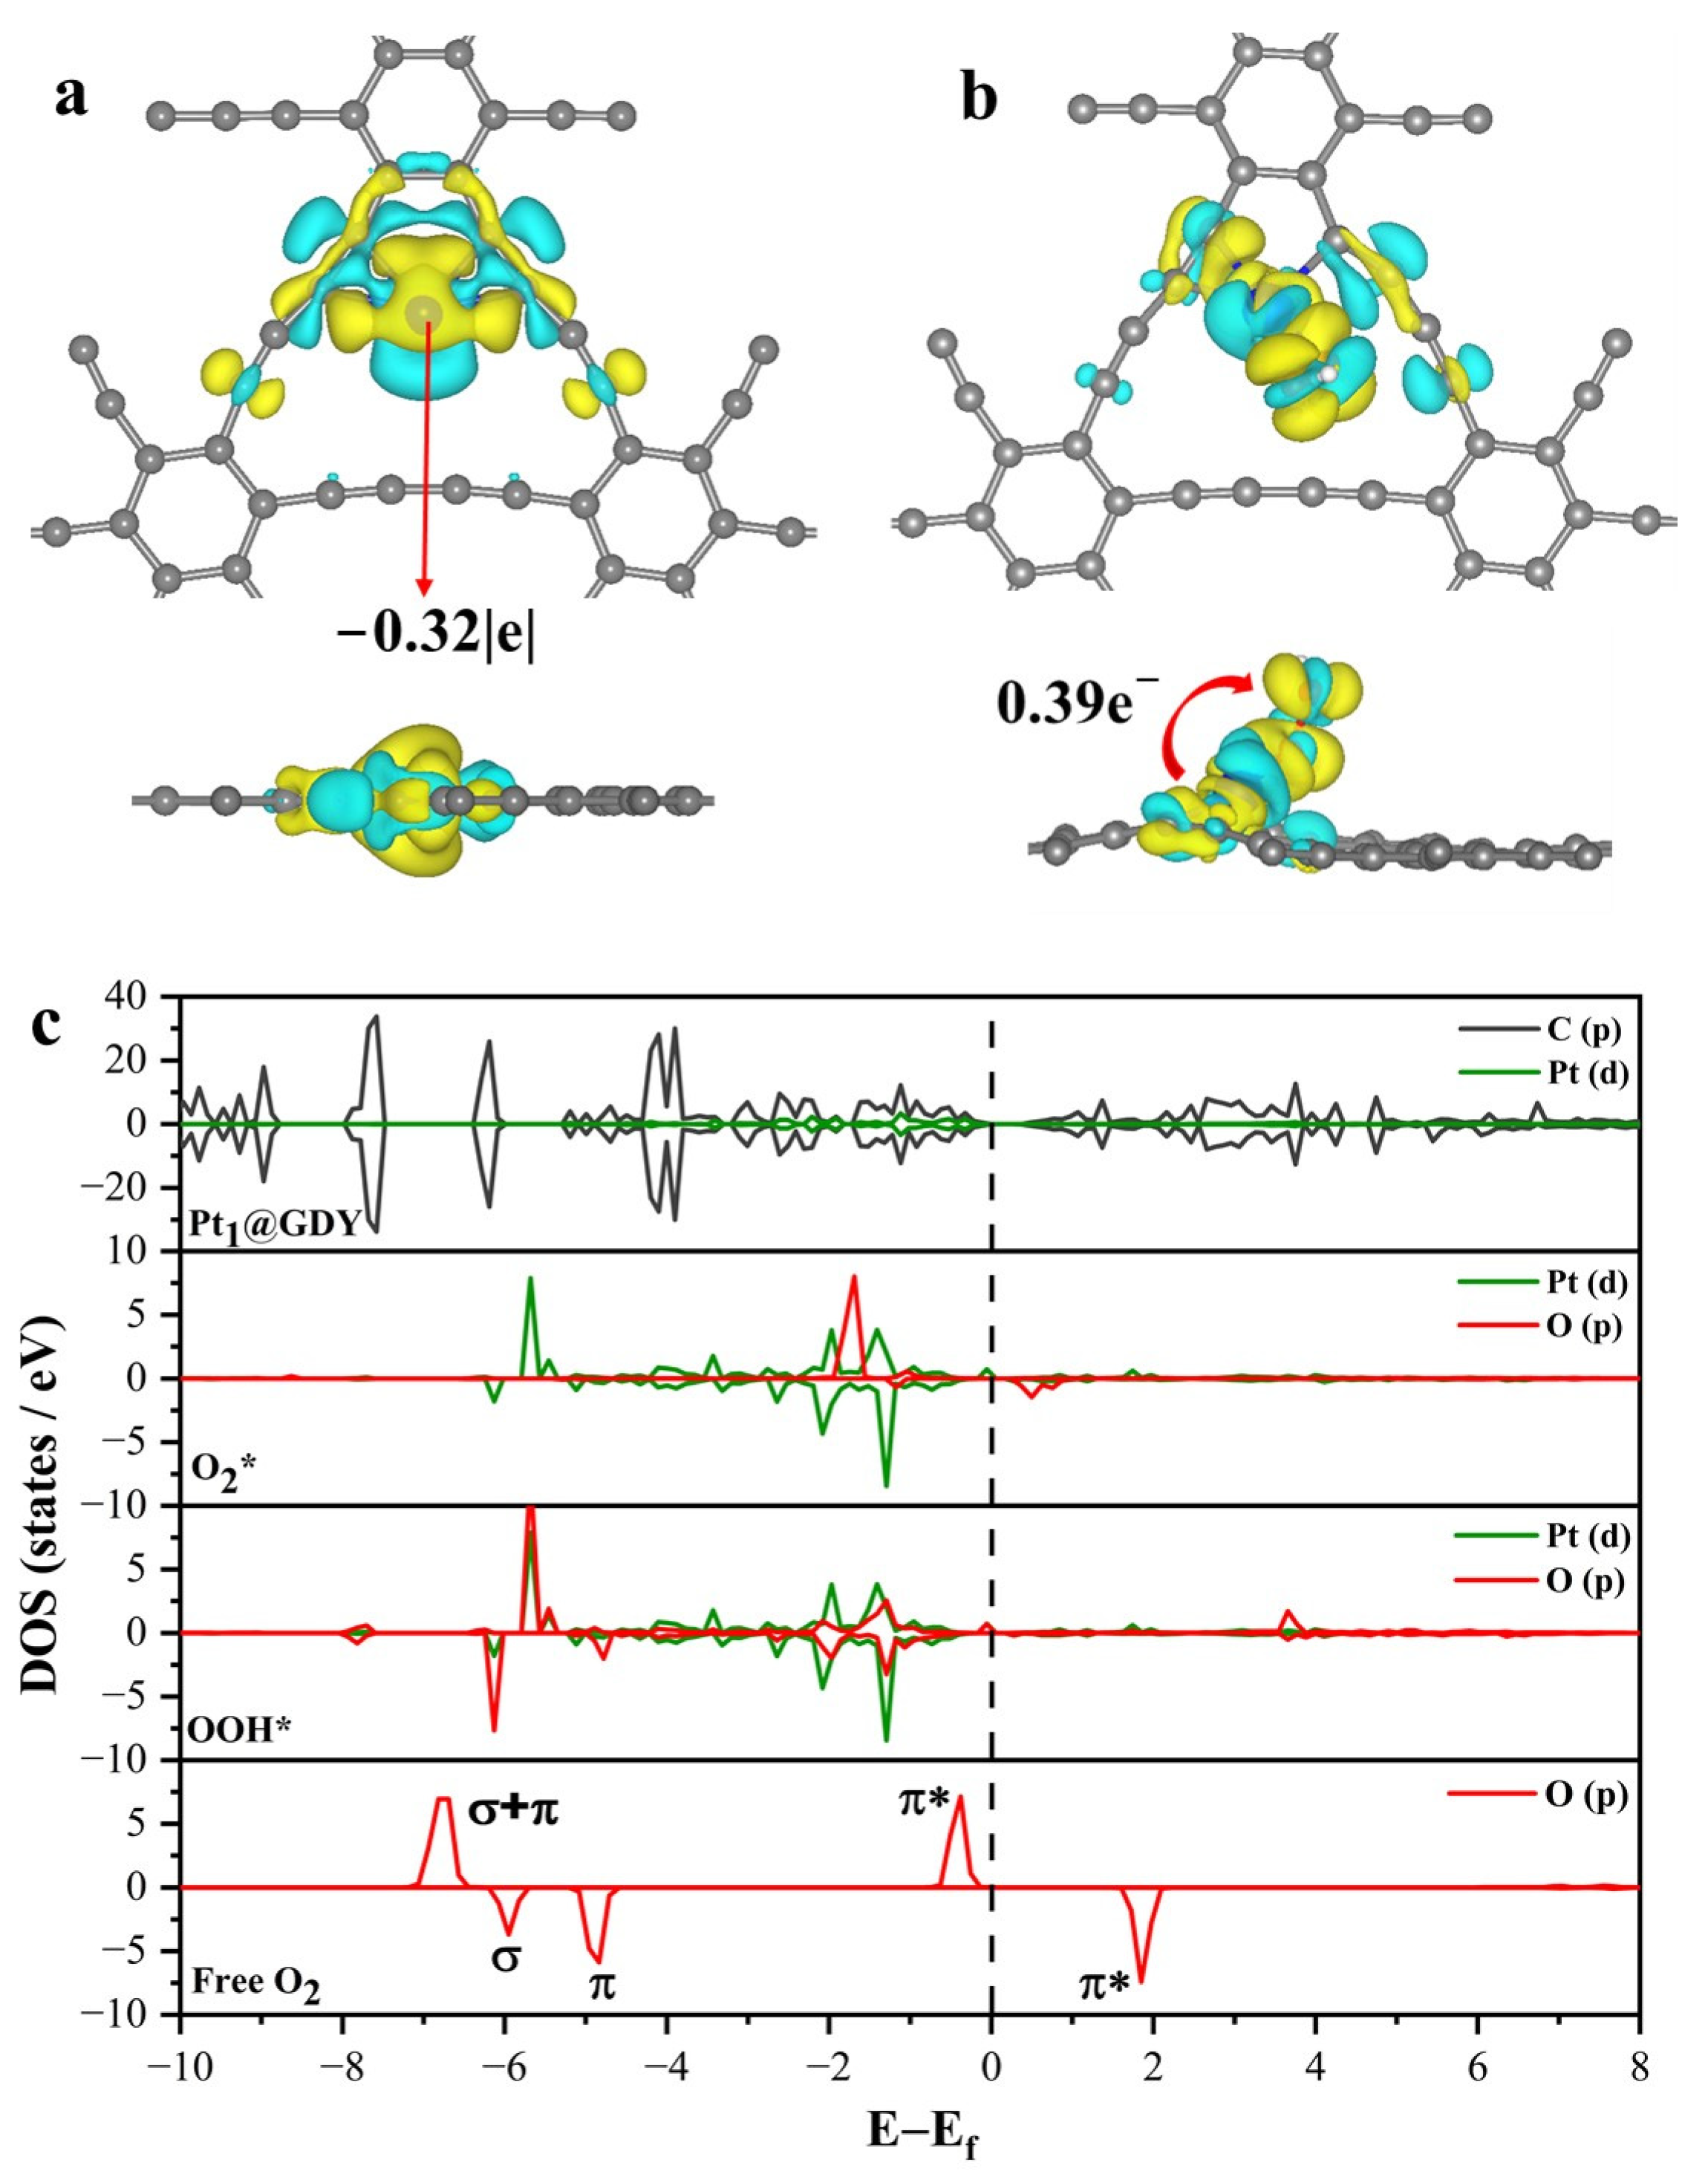
The ORR performance of TM1@GDY under acidic conditions (pH = 0) was investigated. The scheme of the reaction process is shown in Figure 2a. Firstly, the adsorbed O2 on TM1@GDY obtained one (electron (e) and proton (H+)) pair from the aqueous solution, producing an OOH* intermediate. Followed by the further reduction of OOH* by (H+ + e), this step can generate either H2O2 (2e ORR) or H2O (4e ORR), and the product depends on if the O–O bond is broken. The steps of the ORR are as follows, the * in the following steps represents the adsorption site on the catalyst [26]:
The 2e ORR pathway:
O 2 + * + H + + e   OOH *
OOH * + H + + e     H 2 O 2 + *
The complete reaction can be expressed as:
O 2 + 2 H + + 2 e     H 2 O 2   ( 0.7   V   vs .   SHE )
The 4e ORR pathway:
O 2 + * + H + + e   OOH *
OOH * + H + + e   H 2 O + O *
O * + H + + e     OH *
OH * + H + + e   H 2 O + *
The complete reaction can be expressed as:
O 2 + 4 H + + 4 e     2 H 2 O   ( 1.23   V   vs .   SHE )
From the above ORR reaction pathway, it is clear that the 4e ORR and 2e ORR are two competing reactions during the electrochemical synthesis of H2O2, which depends on the type of O2 adsorption [26]. The adsorption of O2 on the catalyst surface can be generally classified into two types: end-on and side-on modes [27]. Obviously, in both the 4e and 2e pathways, the intermediate OOH* is formed in the first step of oxygen adsorption and hydrogenation, so we first calculated the free energy of OOH* (GOOH*) (Table S2 from Supplementary Materials). As shown in Equations (5) and (6), the ΔG of each electron step in the 2e ORR under ideal conditions is 0.70 eV (GOOH* = 4.22 eV), so the change in free energy of the whole reaction is 1.40 eV ( G H 2 O 2   = 3.52 eV).
In general, the adsorption conformations of OOH* on these TM1@GDYs can be divided into four types, as shown in Figure 2b–e. The first one (TM = Re, W, Nb, Ta and Mo) is shown in Figure 2b, where the O–O bond of OOH* undergoes spontaneous cleavage due to strong interactions between OOH* and TM1@GDY, indicating the poor selectivity of these TM1@GDYs (TM = Re, W, Nb, Ta and Mo). For the second one shown in Figure 2c (TM = Sc, Y and Hf), the GOOH* of OOH* are all less than 3.52 eV (Table S1 from Supplementary Materials), which indicates that Sc1, Y1 and Hf1@GDY have strong adsorption of OOH. In addition, after OOH adsorption, a facile migration of the single atom to the C–C triple bond site (located between C2 and C2′) can be observed, indicating that the single atom is unstable during the catalysis. In the third one (TM = Ti, V, Mn, Zr, Rh and Ir), OOH* is in the side-on mode (Figure 2d); it can be seen that the GOOH* of the laterally adsorbed OOH* are all less than 3.52 eV (Table S1), which means that ΔGOOH* are greater than 1.40 eV, which is not favorable for the 2e ORR. For the last one (TM = Pt, Pd, Cu, Co, Ni, Ru, Os, Cr and Fe, Figure 2e), OOH* is following the end-on pattern. The GOOH* are all greater than 3.52 eV, which means that these TM1@GDYs have strong adsorption of OOH, and is, therefore, favorable for the 2e ORR pathway. Therefore, the structures in Figure 2e were used for the subsequent studies.
Next, we compared the electrocatalytic ORR performance of TM1@GDYs (TM = Pt, Pd, Cu, Co, Ni, Ru, Os, Cr and Fe). The free energy curves, as well as the corresponding η and potential limiting steps, are given in Figure 3 and Figure S2 from Supplementary Materials to further clarify the catalytic activity and selectivity. We can see that the GOOH* on Cr1@GDY, Fe1@GDY, Co1@GDY, Cu1@GDY, Ru1@GDY and Os1@GDY are 2.53 eV, 3.15 eV, 3.44 eV, 3.50 eV, 2.41 eV and 2.55 eV, respectively (Figure S2 from Supplementary Materials and Figure 3a,c), which are all lower than 3.52 eV, implying that they all have a strong adsorption for OOH*. Therefore, this strong adsorption of OOH* leads to the second elementary step of the 2e ORR being uphill and becoming PDS. In contrast, the GOOH* of the other three catalysts (Ni1@GDY, Pd1@GDY and Pt1@GDY) are 3.76 eV, 4.41 eV and 4.07 eV, respectively (Figure 3b,d–f), which are all above 3.52 eV. In particular, the GOOH* of Pd1@GDY and Pt1@GDY (4.41 eV and 4.07 eV) are very close to 4.22 eV, which indicates that the adsorption strength of OOH is moderate on both catalysts with the first and second elementary step as PDS, respectively. In contrast, the GOOH* of Ni1@GDY is lower than 4.22 eV, which indicates a stronger adsorption of OOH*, leading to the second step as PDS and thus unfavorable to the 2e ORR pathway.
In addition, we can see the 4e ORR pathway on each TM1@GDY in Figure 3 and Figure S2 from Supplementary Materials. The PDSs of Cr1@GDY, Fe1@GDY, Ru1@GDY and Os1@GDY are the fourth step (Figure S2 from Supplementary Materials), which are all uphill in energy with ΔG equal to 0.90 eV, 0.23 eV, 0.72 eV and 0.94 eV, respectively. This suggests that the 4e ORR process cannot be spontaneous. As can be seen from Figure 3a–c, the PDS of Co1@GDY, Ni1@GDY and Cu1@GDY is the last reaction step with ΔG of −0.63 eV, −0.77 eV and −0.25 eV, respectively, while the PDS of the 4e ORR on Pd1@GDY and Pt1@GDY (Figure 3d–e) is the first reaction step with ΔG of −0.51 eV and −0.85 eV, respectively.
For the 2e ORR pathway, it is well known that a good catalyst for the electrochemical generation of H2O2 should have a UL close to Uequilibrium. Therefore, UL can be used as a descriptor to evaluate its 2e ORR activity. To better understand the ORR ability of catalysts, we calculated the UL of the 2e and 4e ORR for these nine catalysts (Cr1@GDY, Fe1@GDY, Co1@GDY, Ni1@GDY, Cu1@GDY, Ru1@GDY, Pd1@GDY, Os1@GDY and Pt1@GDY) by using the UL formula and plotted Figure 3f and Figure S3 from Supplementary Materials with the red dashed lines representing the standard Uequilibrium, which are 0.7 V and 1.23 V, respectively. Theoretically, the closer the UL is to Uequilibrium, the closer the GOOH* is to 4.22 eV, implying a higher 2e ORR activity of the catalyst. The reason is that GOOH* is lower than 3.52 eV when UL < 0, i.e., the adsorption of OOH is too strong. In addition, η can be used more intuitively to evaluate the activity because η = Uequilibrium − UL. It can be seen from Figure 3f that the catalysts with UL > 0 are favorable catalysts for the 2e ORR. The results show that the UL values of Ni1@GDY, Pd1@GDY and Pt1@GDY are 0.24 V, 0.51V, and 0.55 V, corresponding to η of 0.46 V, 0.19 V, and 0.15 V, respectively. As a result, Pt1@GDY and Pd1@GDY have the smallest and second smallest η, which are comparable to those on Au(100) and Au(111) [28] and PtHg4 electrocatalysts [29], indicating that they have good 2e ORR activity.
In the ORR process, selectivity is a key indicator to evaluate the catalytic performance of the catalyst for H2O2 synthesis. Figure 4 shows the Gibbs free energy diagrams of the 2e and 4e ORRs on Pt1@GDY. At U = 0 V (black curve), the reaction steps in both the 2e and 4e ORR proceed spontaneously, as their ΔG are negative. The results also show that ΔGPDS is 0.55 eV for the 2e ORR and 0.85 eV for the 4e ORR. Thus, for the 2e ORR and 4e ORR, the free energy of the PDS changes to zero when the applied potential is equal to 0.55 V (blue curve) and 0.85 V (red curve), respectively, while the other steps remain downhill in energy. The PDS steps of both the 2e and 4e ORR are uphill when the applied potential is equal to Uequilibrium. The results also show that η is 0.15 V and 0.38 V for the 2e and 4e ORR, respectively, indicating that the 2e ORR exhibits higher selectivity over the 4e ORR on Pt1@GDY. In conclusion, it is predicted that Pt1@GDY is an ideal catalyst for the catalytic synthesis of H2O2.

2.3. Origin of the 2e ORR Activity

Essentially, catalytic properties, such as activity, stability and selectivity, are often determined by the electronic structure of the catalyst [30]. Previously, we discussed in detail the effect of catalyst structure on the activity and selectivity of the 2e ORR. In order to better design catalysts for the 2e ORR, we further discussed the origin of catalytic activity using electronic structure analysis. First, we calculated the Bader charge and charge differential density (CDD). As shown in Figure 5a, the CDD results show that there is significant electron transfer between Pt1 and C atoms of Pt1@GDY. From the Bader charge analysis, we find that about 0.32 e are transferred from Pt1 to the C atom of GDY. This indicates that the interaction between Pt1 and the C atoms allows Pt1 to be stabilized on the GDY support. In addition, the CDD plot (Figure 5b) shows a significant charge transfer between Pt1 and OOH when OOH species are adsorbed on Pt1@GDY. This leads to an elongation of the O–O bond length of OOH from 1.21 Å to 1.45 Å (Figure S4 from Supplementary Materials). Moreover, the Bader charge analysis further confirms that there is about 0.39 e transferred from Pt1 to the adsorbed OOH. This implies that the Pt single atom effectively activates the O–O bond, which facilitates the subsequent hydrogenation of OOH* to generate the final H2O2 product.
Finally, we determined the activation mechanism of the O2 molecule from the perspective of molecular orbital theory. First, as shown in Figure 5c, the obvious orbital overlap between Pt1 3d and C 2p indicates a strong interaction between the anchored Pt1 and the surrounding C atoms, which further demonstrates the stability of Pt1@GDY. Second, we investigated spin-polarized PDOSs to elucidate the interactions between Pt1 and O atoms in O2* and OOH* species. It is seen from Figure 5c that the 2p antibonding orbital π* and the bonding orbital π of the free O2 are near the Fermi level, which indicates that they are the most active orbitals of O2. When the free O2 is adsorbed onto Pt1@GDY, the π* antibonding orbitals of O2 orbitals shift to the lower energy region and hybridize with the d orbitals of Pt1. On the other hand, the empty π* of O2* is partially occupied, which indicates that the d electrons of Pt1 are partially transferred to the empty π* of O2, allowing O2 to be activated. As shown in the PDOS diagram for OOH*, the 3d orbital of Pt1 couples simultaneously with the bonding and antibonding orbitals of 2p of O, which leads to a moderate activation of the O–O bond in OOH. Thus, the electronic structure analysis suggests that the ORR process on Pt1@GDY tends to follow the 2e pathway.

3. Materials and Methods

Computational Details

All spin-polarized DFT calculations were performed using the Vienna Ab-initio Simulation Packages (VASP.5.4.4) [31], and the electron–ion interaction was described with the projector-augmented wave (PAW) method [32,33]. The exchange-correlation potential was treated by the Perdew–Burke–Ernzerhof (PBE) version of the generalized gradient approximation (GGA) [34]. The valence electrons were expanded in a plane-wave basis set with an energy cutoff of 450 eV. The optimized monolayer GDY has a lattice constant of 18.74 Å (Figure 1a). The 2 × 2 supercells of GDY were adopted for the subsequent calculations. A 15 Å vacuum space was adopted along the z-direction to avoid interactions between periodic slabs. K-points mesh was set to 3 × 3 × 1 for Brillouin zone sampling in structural optimization and electronic structure calculations. The DFT-D3 method with zero-damping [35] was introduced to describe van der Waals weakly dispersive interactions (vdW). All the structures were relaxed until the forces on each ion were less than 0.05 eV/Å, and the convergence criteria for the energy was set as 10−4 eV.
Based on Nørskov’s computational hydrogen electrode model [36,37], we calculated the Gibbs free energy change (ΔG) for each elementary step as follows:
Δ G = Δ E + Δ E zpe   T Δ S + eU  
where ΔE refers to the energy difference directly calculated with DFT before and after each elementary reaction step; ΔEzpe and TΔS are the differences in the zero-point energies and entropies at 298.15 K, respectively; and the value of eU was determined using the applied potential (U).
In addition, we defined a descriptor of limiting potential (UL) to describe the activity of the electrocatalytic ORR with the free energy change of the potential-determining step (PDS):
U L = Δ G PDS / e
where the ΔGPDS is the Gibbs free energy change of PDS.
The overpotential (η) was calculated as:
η = U equilibrium   U L
where the equilibrium potentials (Uequilibrium) are 1.23 V and 0.70 V for the 4e ORR and 2e ORR, respectively.

4. Conclusions

In summary: the 2e ORR catalyzed by the GDY-supported single transition metal atom catalysts in an acidic environment was investigated using first-principles DFT calculations. The results show that Pt1@GDY has good stability and the best activity for the 2e ORR, as it exhibits the lowest thermodynamic η (0.15 V) among the 23 catalysts studied. In addition, the electronic structure analysis of the interactions between O2*, OOH* and Pt1@GDY provides an in-depth understanding of the 2e ORR pathway to produce H2O2. The high activity of Pt1@GDY is attributed to the electron transfer between the 3d orbital of Pt1 and the antibonding orbital π* of the 2p orbital of O in OOH*, allowing the efficient activation of the O–O bond. This work provides theoretical insights into the design of efficient electrocatalysts for the generation of H2O2.

Supplementary Materials

The following supporting information can be downloaded at: https://www.mdpi.com/article/10.3390/catal13020307/s1, Figure S1: Top and side views of the (a) Zn atom, (b) Cd atom, (c) Ag atom and (d) Au atom supported on GDY. Color scheme: C: Gray; Zn: Pink; Cd: Purple; Ag: Blue; Au: Yellow; Figure S2: Free energy diagrams of 2e and 4e ORR on (a): Fe1@GDY; (b): Cr1@GDY; (c): Ru1@GDY; (d): Os1@GDY; Figure S3: Limiting potentials of 4e ORR on TM1@GDY (TM = Cr, Fe, Co, Ni, Cu, Ru, Pd, Os, and Pt) catalysts. The red line represents the equilibrium potential of 4e ORR.; Figure S4: The adsorption structure of OOH* on Pt1@GDY and the O–O bond length; Table S1: The Eb on TM1@GDY; Table S2: The GOOH* on TM1@GDY.

Author Contributions

Conceptualization, R.J. and S.L.; methodology, K.L. and Q.W.; software, K.L. and Q.W.; validation, Q.W., R.J. and S.L.; formal analysis, K.L.; investigation, K.L.; resources, S.L.; data curation, K.L.; writing—original draft preparation, K.L.; writing—review and editing, K.L., Q.W., R.J. and S.L.; visualization, K.L.; supervision, S.L.; project administration, S.L.; funding acquisition, S.L. All authors have read and agreed to the published version of the manuscript.

Funding

Funds from the National Natural Science Foundation of China (21973013) and the National Natural Science Foundation of Fujian Province, China (2020J02025) are acknowledged. S.L. thanks the “Chuying Program” for the Top Young Talents of Fujian Province. DFT computations were performed at the Hefei advanced computing center and Supercomputing Center of Fujian.

Data Availability Statement

The datasets used to support the findings are included within the paper and in the Supplementary Materials.

Conflicts of Interest

The authors declare no conflict of interest.

References

  1. Melchionna, M.; Fornasiero, P.; Prato, M. The Rise of Hydrogen Peroxide as the Main Product by Metal-Free Catalysis in Oxygen Reductions. Adv. Mater. 2019, 31, e1802920. [Google Scholar] [CrossRef]
  2. Rozendal, R.A.; Leone, E.; Keller, J.; Rabaey, K. Efficient hydrogen peroxide generation from organic matter in a bioelectrochemical system. Electrochem. Commun. 2009, 11, 1752–1755. [Google Scholar] [CrossRef]
  3. Kosaka, K.; Yamada, H.; Shishida, K.; Echigo, S.; Minear, R.A.; Tsuno, H.; Matsui, S. Evaluation of the treatment performance of a multistage ozone/hydrogen peroxide process by decomposition by-products. Water Res. 2001, 35, 3587–3594. [Google Scholar] [CrossRef]
  4. Yamanaka, I.; Murayama, T. Neutral H2O2 synthesis by electrolysis of water and O2. Angew. Chem. Int. Ed. Engl. 2008, 47, 1900–1902. [Google Scholar] [CrossRef]
  5. Ksibi, M. Chemical oxidation with hydrogen peroxide for domestic wastewater treatment. Chem. Eng. J. 2006, 119, 161–165. [Google Scholar] [CrossRef]
  6. Zhang, X.L.; Su, X.; Zheng, Y.R.; Hu, S.J.; Shi, L.; Gao, F.Y.; Yang, P.P.; Niu, Z.Z.; Wu, Z.Z.; Qin, S.; et al. Strongly Coupled Cobalt Diselenide Monolayers for Selective Electrocatalytic Oxygen Reduction to H2O2 under Acidic Conditions. Angew. Chem. Int. Ed. Engl. 2021, 60, 26922–26931. [Google Scholar] [CrossRef]
  7. Campos-Martin, J.M.; Blanco-Brieva, G.; Fierro, J.L. Hydrogen peroxide synthesis: An outlook beyond the anthraquinone process. Angew. Chem. Int. Ed. Engl. 2006, 45, 6962–6984. [Google Scholar] [CrossRef]
  8. Jirkovsky, J.S.; Panas, I.; Ahlberg, E.; Halasa, M.; Romani, S.; Schiffrin, D.J. Single atom hot-spots at Au-Pd nanoalloys for electrocatalytic H2O2 production. J. Am. Chem. Soc. 2011, 133, 19432–19441. [Google Scholar] [CrossRef]
  9. Zheng, Z.; Ng, Y.H.; Wang, D.W.; Amal, R. Epitaxial Growth of Au-Pt-Ni Nanorods for Direct High Selectivity H2O2 Production. Adv. Mater. 2016, 28, 9949–9955. [Google Scholar] [CrossRef]
  10. Jiang, Y.; Ni, P.; Chen, C.; Lu, Y.; Yang, P.; Kong, B.; Fisher, A.; Wang, X. Selective Electrochemical H2O2 Production through Two-Electron Oxygen Electrochemistry. Adv. Energy Mater. 2018, 8, 1801909. [Google Scholar] [CrossRef]
  11. Gervasini, A.; Carniti, P.; Desmedt, F.; Miquel, P. Liquid Phase Direct Synthesis of H2O2: Activity and Selectivity of Pd-Dispersed Phase on Acidic Niobia-Silica Supports. ACS Catal. 2017, 7, 4741–4752. [Google Scholar] [CrossRef]
  12. Arrigo, R.; Schuster, M.E.; Abate, S.; Giorgianni, G.; Centi, G.; Perathoner, S.; Wrabetz, S.; Pfeifer, V.; Antonietti, M.; Schlögl, R. Pd Supported on Carbon Nitride Boosts the Direct Hydrogen Peroxide Synthesis. ACS Catal. 2016, 6, 6959–6966. [Google Scholar] [CrossRef]
  13. Edwards, J.K.; Ntainjua, E.; Carley, A.F.; Herzing, A.A.; Kiely, C.J.; Hutchings, G.J. Direct synthesis of H2O2 from H2 and O2 over gold, palladium, and gold-palladium catalysts supported on acid-pretreated TiO2. Angew. Chem. Int. Ed. Engl. 2009, 48, 8512–8515. [Google Scholar] [CrossRef]
  14. Li, F.; Shao, Q.; Hu, M.; Chen, Y.; Huang, X. Hollow Pd–Sn Nanocrystals for Efficient Direct H2O2 Synthesis: The Critical Role of Sn on Structure Evolution and Catalytic Performance. ACS Catal. 2018, 8, 3418–3423. [Google Scholar] [CrossRef]
  15. Sun, Y.; Sinev, I.; Ju, W.; Bergmann, A.; Dresp, S.; Kühl, S.; Spöri, C.; Schmies, H.; Wang, H.; Bernsmeier, D.; et al. Efficient Electrochemical Hydrogen Peroxide Production from Molecular Oxygen on Nitrogen-Doped Mesoporous Carbon Catalysts. ACS Catal. 2018, 8, 2844–2856. [Google Scholar] [CrossRef]
  16. Han, L.; Sun, Y.; Li, S.; Cheng, C.; Halbig, C.E.; Feicht, P.; Hübner, J.L.; Strasser, P.; Eigler, S. In-Plane Carbon Lattice-Defect Regulating Electrochemical Oxygen Reduction to Hydrogen Peroxide Production over Nitrogen-Doped Graphene. ACS Catal. 2019, 9, 1283–1288. [Google Scholar] [CrossRef]
  17. Iglesias, D.; Giuliani, A.; Melchionna, M.; Marchesan, S.; Criado, A.; Nasi, L.; Bevilacqua, M.; Tavagnacco, C.; Vizza, F.; Prato, M.; et al. N-Doped Graphitized Carbon Nanohorns as a Forefront Electrocatalyst in Highly Selective O2 Reduction to H2O2. Chem 2018, 4, 106–123. [Google Scholar] [CrossRef]
  18. Sun, Y.; Silvioli, L.; Sahraie, N.R.; Ju, W.; Li, J.; Zitolo, A.; Li, S.; Bagger, A.; Arnarson, L.; Wang, X.; et al. Activity-Selectivity Trends in the Electrochemical Production of Hydrogen Peroxide over Single-Site Metal-Nitrogen-Carbon Catalysts. J. Am. Chem. Soc. 2019, 141, 12372–12381. [Google Scholar] [CrossRef]
  19. Gao, J.; Yang, H.B.; Huang, X.; Hung, S.-F.; Cai, W.; Jia, C.; Miao, S.; Chen, H.M.; Yang, X.; Huang, Y.; et al. Enabling Direct H2O2 Production in Acidic Media through Rational Design of Transition Metal Single Atom Catalyst. Chem 2020, 6, 658–674. [Google Scholar] [CrossRef] [Green Version]
  20. Li, B.Q.; Zhao, C.X.; Liu, J.N.; Zhang, Q. Electrosynthesis of Hydrogen Peroxide Synergistically Catalyzed by Atomic Co-Nx-C Sites and Oxygen Functional Groups in Noble-Metal-Free Electrocatalysts. Adv. Mater. 2019, 31, e1808173. [Google Scholar] [CrossRef]
  21. Li, Y.; Xu, L.; Liu, H.; Li, Y. Graphdiyne and graphyne: From theoretical predictions to practical construction. Chem. Soc. Rev. 2014, 43, 2572–2586. [Google Scholar] [CrossRef]
  22. Jiao, Y.; Du, A.; Hankel, M.; Zhu, Z.; Rudolph, V.; Smith, S.C. Graphdiyne: A versatile nanomaterial for electronics and hydrogen purification. Chem. Commun. 2011, 47, 11843–11845. [Google Scholar] [CrossRef]
  23. He, J.; Ma, S.Y.; Zhou, P.; Zhang, C.X.; He, C.; Sun, L.Z. Magnetic Properties of Single Transition-Metal Atom Absorbed Graphdiyne and Graphyne Sheet from DFT+U Calculations. J. Phys. Chem. C 2012, 116, 26313–26321. [Google Scholar] [CrossRef] [Green Version]
  24. He, T.; Matta, S.K.; Will, G.; Du, A. Transition-Metal Single Atoms Anchored on Graphdiyne as High-Efficiency Electrocatalysts for Water Splitting and Oxygen Reduction. Small Methods 2019, 3, 1800419. [Google Scholar] [CrossRef]
  25. Yu, J.; Cao, C.; Jin, H.; Chen, W.; Shen, Q.; Li, P.; Zheng, L.; He, F.; Song, W.; Li, Y. Uniform single atomic Cu1-C4 sites anchored in graphdiyne for hydroxylation of benzene to phenol. Natl. Sci. Rev. 2022, 9, nwac018. [Google Scholar] [CrossRef]
  26. Kulkarni, A.; Siahrostami, S.; Patel, A.; Norskov, J.K. Understanding Catalytic Activity Trends in the Oxygen Reduction Reaction. Chem. Rev. 2018, 118, 2302–2312. [Google Scholar] [CrossRef]
  27. Ye, C.-W.; Xu, L. Recent advances in the design of a high performance metal–nitrogen–carbon catalyst for the oxygen reduction reaction. J. Mater. Chem. A 2021, 9, 22218–22247. [Google Scholar] [CrossRef]
  28. Viswanathan, V.; Hansen, H.A.; Rossmeisl, J.; Norskov, J.K. Unifying the 2e- and 4e- Reduction of Oxygen on Metal Surfaces. J. Phys. Chem. Lett. 2012, 3, 2948–2951. [Google Scholar] [CrossRef] [Green Version]
  29. Siahrostami, S.; Verdaguer-Casadevall, A.; Karamad, M.; Deiana, D.; Malacrida, P.; Wickman, B.; Escudero-Escribano, M.; Paoli, E.A.; Frydendal, R.; Hansen, T.W.; et al. Enabling direct H2O2 production through rational electrocatalyst design. Nat. Mater. 2013, 12, 1137–1143. [Google Scholar] [CrossRef] [Green Version]
  30. Pan, J.; Fang, Q.; Xia, Q.; Hu, A.; Sun, F.; Zhang, W.; Yu, Y.; Zhuang, G.; Jiang, J.; Wang, J. Dual effect of the coordination field and sulphuric acid on the properties of a single-atom catalyst in the electrosynthesis of H2O2. Phys. Chem. Chem. Phys. 2021, 23, 21338–21349. [Google Scholar] [CrossRef]
  31. Kresse, G.; Hafner, J. Ab initio molecular dynamics for liquid metals. Phys. Rev. B 1993, 47, 558–561. [Google Scholar] [CrossRef]
  32. Kresse, G.; Joubert, D. From ultrasoft pseudopotentials to the projector augmented-wave method. Phys. Rev. B 1999, 59, 1758–1775. [Google Scholar] [CrossRef]
  33. Blochl, P.E. Projector augmented-wave method. Phys. Rev. B 1994, 50, 17953–17979. [Google Scholar] [CrossRef] [Green Version]
  34. Perdew, J.P.; Burke, K.; Ernzerhof, M. Generalized Gradient Approximation Made Simple. Phys. Rev. Lett. 1996, 77, 3865–3868. [Google Scholar] [CrossRef] [PubMed] [Green Version]
  35. Grimme, S.; Antony, J.; Ehrlich, S.; Krieg, H. A consistent and accurate ab initio parametrization of density functional dispersion correction (DFT-D) for the 94 elements H-Pu. J. Chem. Phys. 2010, 132, 154104. [Google Scholar] [CrossRef] [Green Version]
  36. Nørskov, J.K.; Rossmeisl, J.; Logadottir, A.; Lindqvist, L.; Kitchin, J.R.; Bligaard, T.; Jónsson, H. Origin of the Overpotential for Oxygen Reduction at a Fuel-Cell Cathode. J. Phys. Chem. B 2004, 108, 17886–17892. [Google Scholar] [CrossRef]
  37. Valdés, Á.; Qu, Z.W.; Kroes, G.J.; Rossmeisl, J.; Nørskov, J.K. Oxidation and Photo-Oxidation of Water on TiO2 Surface. J. Phys. Chem. C 2008, 112, 9872–9879. [Google Scholar] [CrossRef]
Figure 1. (a) Structure of GDY monolayer. (b) Structure of TM1@GDY single-atom catalyst with different C sites labeled. Gray represents C atoms while green represents transition metal atoms. (c) The transition metal atoms investigated in this work. (d) Calculated binding energy (Eb) of TM1 over different TM1@GDY.
Catalysts 13 00307 g001
Figure 2. (a) Scheme of the 2e ORR and 4e ORR pathways. Different adsorption types of intermediate OOH: (b) O–O bond cleavage after OOH adsorption to form a *(O + OH) intermediate on TM1@GDY (TM = Re, W, Nb, Ta and Mo), (c) after OOH adsorption, a single atom is transferred to the acetylene chain on TM1@GDY (TM = Sc, Y and Hf), (d) side-on adsorption pattern of OOH on TM1@GDY (TM = Ti, V, Mn, Zr, Rh and Ir), and (e) end-on adsorption mode of OOH on TM1@GDY (TM = Pt, Pd, Cu, Co, Ni, Ru, Os, Cr and Fe). Color scheme: H: White; C: Gray; O: Red; Transition metals (TM): Green.
Catalysts 13 00307 g002
Figure 3. Free energy diagrams of the 2e and 4e ORR on (a) Co1@GDY, (b) Ni1@GDY, (c) Cu1@GDY, (d) Pd1@GDY and (e) Pt1@GDY. Red curve: the 2e ORR pathway. Black curve: the 4e ORR pathway. The potential-determining step (PDS) of the 2e and 4e ORR on Co1@GDY, Ni1@GDY and Cu1@GDY is the second and fourth step, respectively. The PDSs of the 2e and 4e ORR on Pd1@GDY are the first step. The PDSs of the 2e and 4e ORR on Pt1@GDY are the second and first step, respectively. (f) Limiting potential (UL) of the 2e ORR on TM1@GDY (TM = Co, Ni, Cu, Pd, and Pt) catalysts. The red dashed line represents the equilibrium potential which is equal to 0.70 V.
Catalysts 13 00307 g003
Figure 4. Free energy changes in the (a) 4e ORR and (b) 2e ORR on Pt1@GDY with different voltages.
Catalysts 13 00307 g004
Figure 5. Top and side views of charge differential density (CDD) plots of (a) Pt1@GDY and (b) OOH* on Pt1@GDY. The blue and yellow areas represent positive and negative charge accumulation, respectively. The isosurface value is set to 0.002 e/Bohr3. (c) Partial density of states (PDOSs) of the free O2 and O2*/OOH* on Pt1@GDY. The Fermi level is set to zero.
Catalysts 13 00307 g005
Disclaimer/Publisher’s Note: The statements, opinions and data contained in all publications are solely those of the individual author(s) and contributor(s) and not of MDPI and/or the editor(s). MDPI and/or the editor(s) disclaim responsibility for any injury to people or property resulting from any ideas, methods, instructions or products referred to in the content.

