Article

Enhanced Photodegradation of Organic Pollutants by Novel Samarium-Doped Zinc Aluminium Spinel Ferrites

1
“Petru Poni” Institute of Macromolecular Chemistry, 41A Grigore Ghica Voda Alley, 700487 Iasi, Romania
2
Department of Chemistry, ”Alexandru Ioan Cuza” University, 11 Carol I Blvd, Iasi 700506, Romania
*
Authors to whom correspondence should be addressed.
Catalysts 2023, 13(2), 266; https://doi.org/10.3390/catal13020266
Submission received: 28 December 2022 / Revised: 18 January 2023 / Accepted: 20 January 2023 / Published: 24 January 2023

Abstract

:
ZnAlFe1−xSmxO4 (x = 0, 0.02, 0.04, 0.06, 0.08) spinel ferrites were successfully obtained for the first time via a sol–gel autocombustion technique using citric acid as the combustion/chelating agent. These materials were then employed as photocatalysts for the degradation of Evans Blue, considered herein as a model organic pollutant. The XRD and FTIR analysis confirmed the achievement of pure spinel ferrite structures for all the materials. TEM analysis showed that the average particle sizes decline from about 27 for the undoped material to 17 nm for samarium-doped materials, and the magnetic characterization at room temperature indicated the paramagnetic conduct for the studied samples. All the photocatalysts were active in Evans Blue photodegradation. The best photocatalytic performances were observed for the ZnAlFe0.94Sm0.06O4 formulation and explained by the smallest values calculated for lattice parameter, interplanar distance, and particle-size values. By adding H2O2 and applying the modelling and optimization of the photocatalytic process for the best material, the half-life of the pollutant decreased significantly from 115 min to about 7 min (about 16-times), and the colour-removal efficiency was almost 100%.

1. Introduction

Spinel ferrites (MFe2O4—where M is a divalent cation) are a special category of mixed iron oxides of great interest to the research community because of their unique properties, from magnetic, electrical, electronic, dielectric, mechanical, optical, as well as (photo)catalytic points of view [1,2]. Their properties are making spinel ferrites strong candidates for a wide range of applications from microwave and electronic devices [2] to hyperthermia, contrast agents for MRI applications, and drug delivery systems [3] or catalytic [4], adsorption [5], and photocatalytic applications for wastewater treatment [6].
The characteristics of spinel ferrites strongly depend on their chemical composition, phase purity, grain and/or crystallite size, or specific surface area. In order to fine-tune the spinel ferrite properties for a specific application, several strategies have been implemented to date: judicious selection of the synthesis method considering the targeted application [1], variation in the sintering temperature and/or time [7], the substitution of divalent or iron ions [8,9], doping [10], etc.
Spinel ferrites with zinc as a divalent cation are known as zinc spinel ferrites. ZnFe2O4 is one of the most representative compounds of the spinel ferrite class of materials, along with CoFe2O4 and NiFe2O4 [11]. Because of its relatively narrow band gap (around 1.9 eV) [12,13], zinc ferrite was often proposed as a highly active photocatalyst for wastewater purification by advanced oxidation of organic pollutants [13]. Thus, in their exhaustive review, Sonu et al. [13] observed that the number of publications on ZnFe2O4 was constantly growing from 2010 to 2020, and more than half of the studies proposed this material as an efficient photocatalyst for oxidative water-purification applications compared to only 24% for inductors, 14% for adsorption processes, and 9% for electronic devices, respectively. Despite the encouraging photocatalytic behaviour of the pristine zinc ferrite, different strategies were developed to enhance the performances of these materials, such as [9,14,15] substitution, composite formation, and doping. In a previous work, we demonstrated that the substitution of Fe cations with Al cations into Zinc ferrite clearly improved the photodegradation efficiency of Orange I azo dye [9]. On the other hand, we previously proved that the properties of Cobalt and Nickel ferrites can be significantly changed by doping with rare-earth cations [4,16]. Thus, in this work, we propose, for the first time, to simultaneously study the influence of substituting Fe cations with Al and of doping the as-obtained ZnAlFeO4 with a representative rare-earth element: samarium. Therefore, in the present work, for the first time, ternary spinel ferrites with the general formula ZnAlFe1−xSmxO4 (x = 0, 0.02, 0.04, 0.06, 0.08), as highly efficient photocatalysts for Evans Blue dye removal from synthetic wastewaters under UV-Vis light, are studied.

2. Results

2.1. Characterization of Photocatalysts

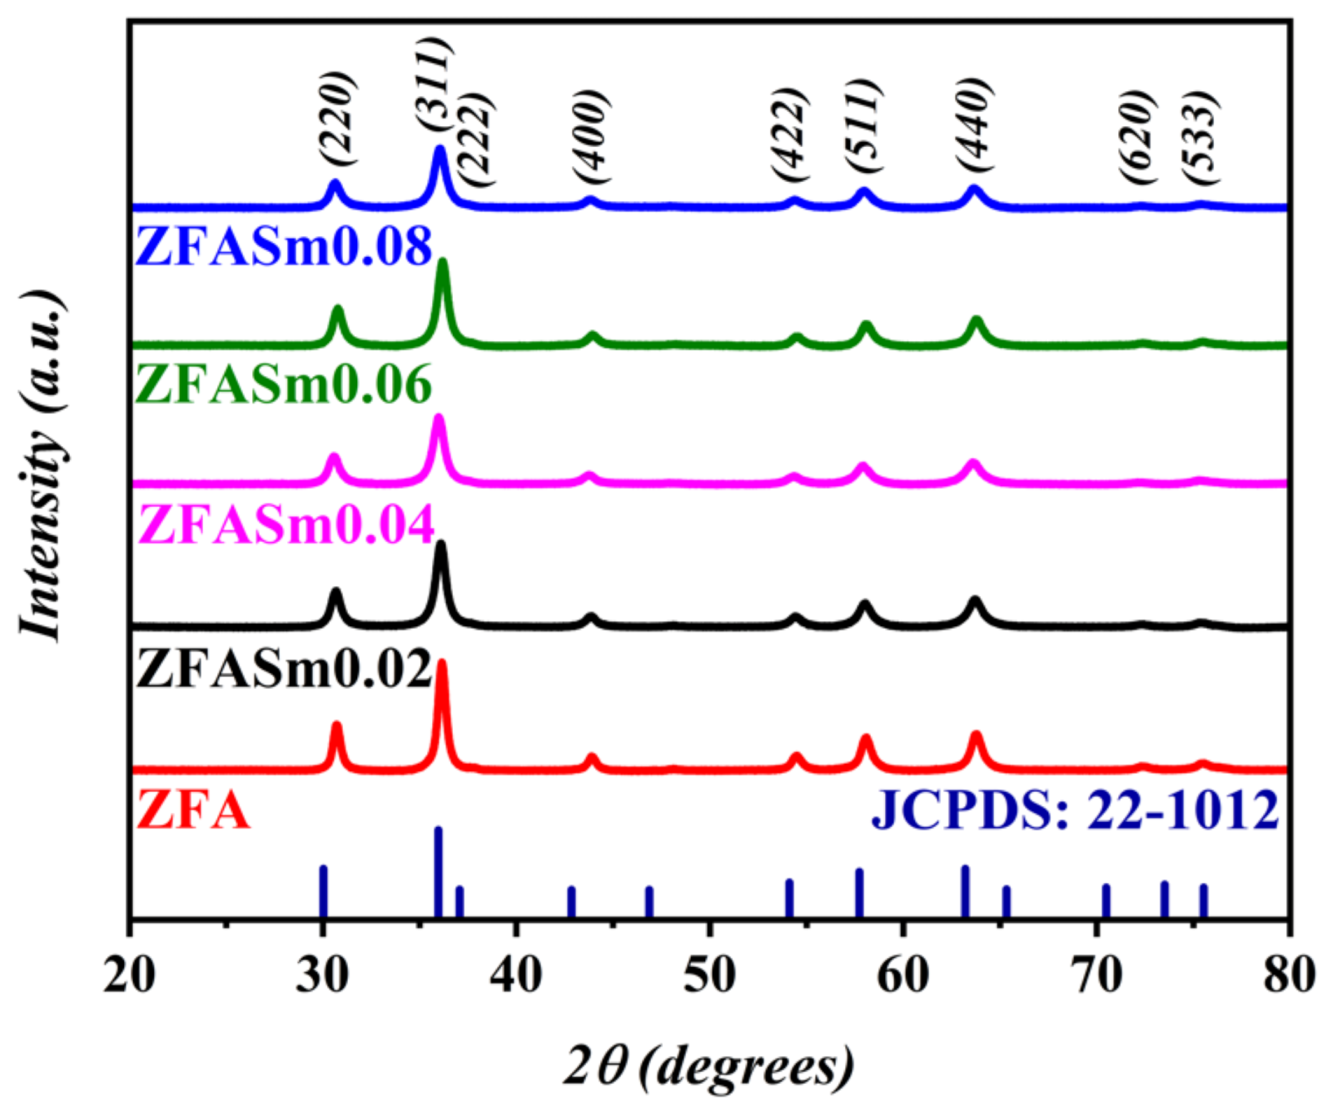
2.1.1. X-Ray Diffraction Analysis

XRD analysis was performed in order to disclose the structural features of the obtained catalysts. The recorded XRD patterns for the powders are depicted in Figure 1, and the chemical formulas, sample codes, and calculated data are given in Table 1. Close inspection of the patterns shown in Figure 1 suggests that each of the observed peaks for each of the studied materials closely resembles the typical patterns for zinc ferrite samples according to JCPDS card No. 22-1012 [17,18]. As a result, the exclusive presence of the planes (220), (311), (222), (400), (422), (511), (440), (620), and (533) in the diffraction patterns reveals that all of the samples formed a pure cubic spinel structure free of any observable impurities. This fact demonstrates that the selected preparation technique was successfully achieved for, on one hand, the insertion of the aluminium cations in the zinc ferrite spinel matrix and, on the other hand, the incorporation of Sm cations into the spinel structure of the aluminium-substituted zinc ferrite.
Despite the greater ionic radius of samarium cations (0.958 Å) compared to Fe3+ (0.645 Å), the similarity between the diffraction patterns of Sm-doped materials and those corresponding to the zinc–aluminium ferrite one suggested that Sm3+ may have replaced Fe3+ ions in the host spinel structure [19]. However, as a consequence of the inclusion of the larger samarium cations in the spinel structure, the diffraction peaks in doped samples are widened with increasing amounts of lanthanide. These findings are in close agreement with our previous work on the rare-earth doping of spinel ferrites [4,16,20].
Deeper exploitation of the registered XRD patterns was achieved by determining the crystallite sizes (D) using the Debye–Scherrer formula, the lattice parameter (a), and the interplanar distance (d), according to Laue and Bragg’s equations for cubic lattices using the relations presented in previous works [4,20]. These data are given in Table 1. One may observe that the crystallite sizes decrease regularly with the samarium content increasing; doping the ZFA sample with samarium led to a decrease. This fact indicates that the replacement of Fe3+ with larger Sm3+ cations obstructs the growth of crystallites. Such behaviour is often reported on doping spinels with rare-earth cations [4,16,20,21]. Both lattice parameters and interplanar distances are higher for Sm-containing materials, except for the ZFASm0.06 sample, but no direct correlation between rare-earth concentration and these values can be observed. This fact suggests that increasing samarium concentration leads to the redistribution of the Zn, Fe, and Al cations between the tetrahedral and octahedral sites [21,22].

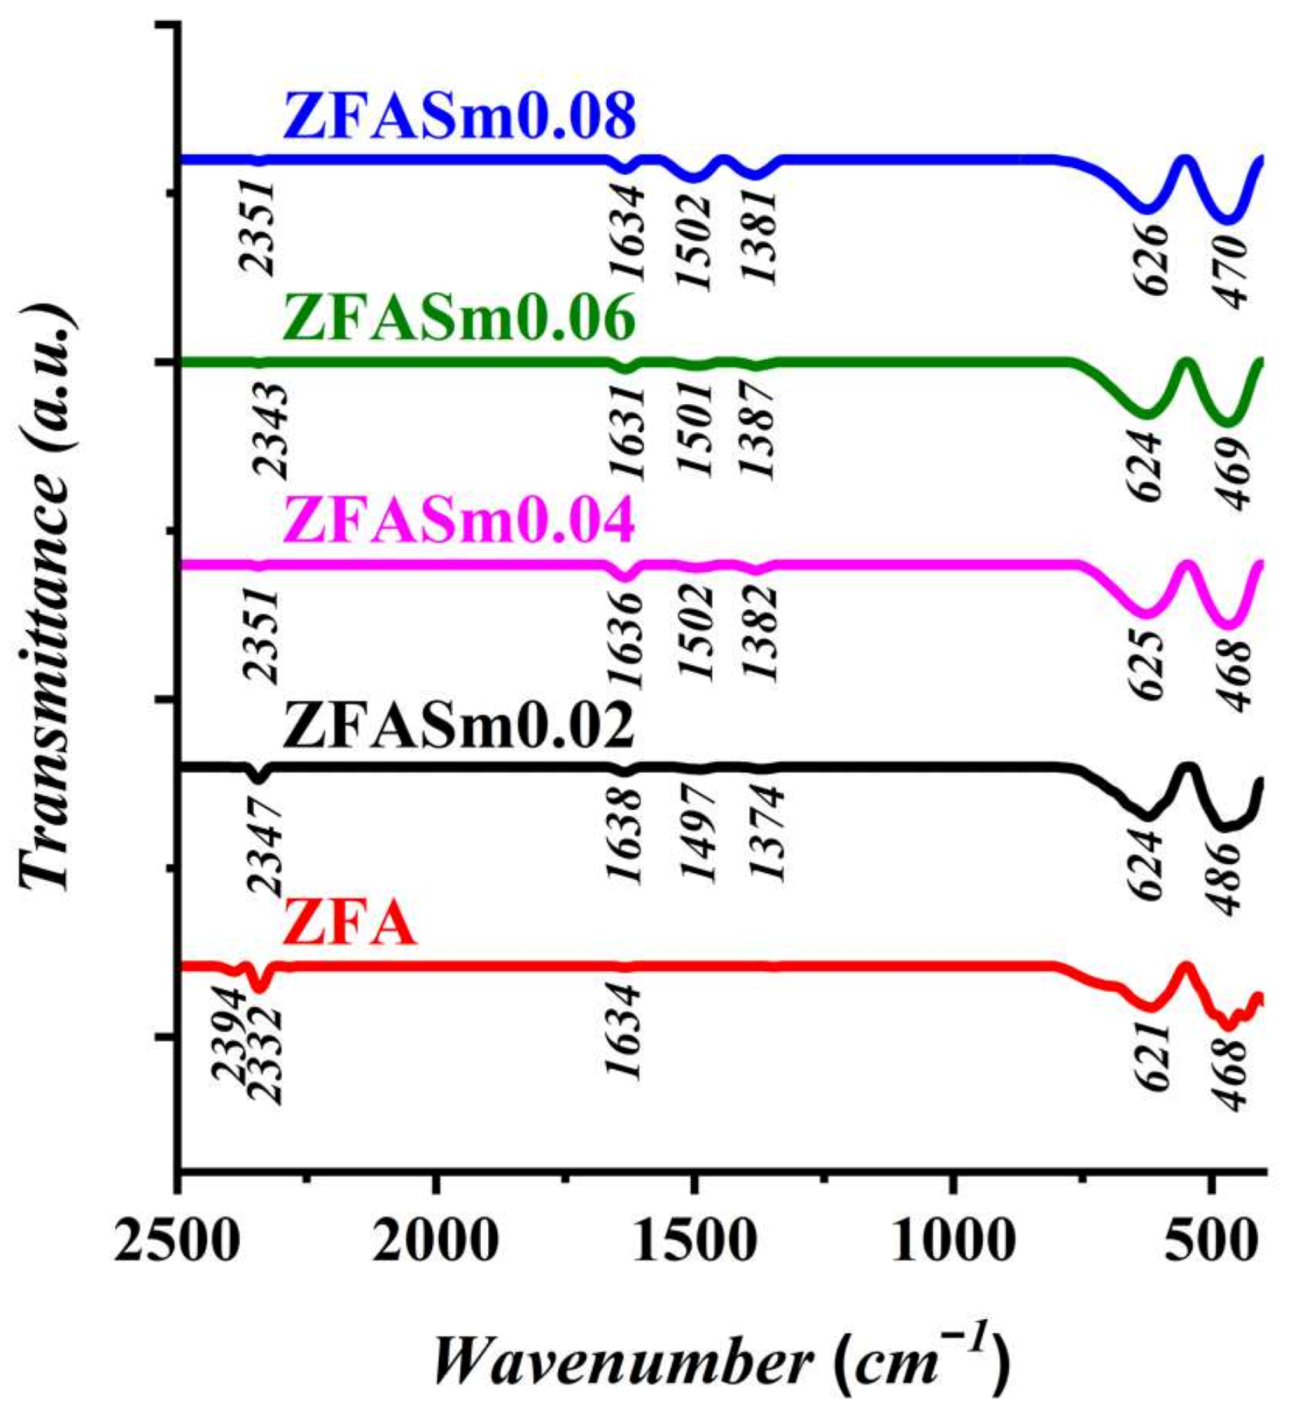
2.1.2. Fourier-Transform Infrared Spectroscopy Analysis

FTIR spectroscopy was employed to identify the metal–oxygen bonds once the ferrite structure was obtained in order to confirm the XRD findings. Further, this technique was used to estimate the presence of combustion by-products in the samples. In this respect, the spectra were registered in a wavenumber range of 400–4000 cm−1, as shown in Figure 2.
First, the fingerprint bands for metal oxides are clearly observed in a range of 700–400 cm−1. Thus, the band observed in the 621–626 cm−1 range is usually attributed to the stretching vibration of the metal–oxygen bond in the tetrahedral positions of the spinel structure, whereas the band observed at 468–486 cm−1 is assigned to the stretching vibration of the metal–oxygen bond in the octahedral sites of the spinel matrix [23,24]. It is important to note that all the samples containing samarium cations show a slight increase in the wavenumber value for both tetrahedral and octahedral vibrations compared to the ZFA sample. These observations are consistent with previous works on rare-earth-doped ferrites [25,26] and indicate perturbations occurring in the Fe–O, Zn–O and Al–O bonds, respectively, as well as cation migration between the two types of sites, due to the replacement of small amounts of iron cations by bulkier samarium cations [27]. It is worth noting that these observations are in very close agreement with the XRD discussion.
Second, the weak bands in the 2931–1374 cm−1 range are due to the presence of very small amounts of combustion by-products and can be assigned as follows [28,29]: the bands in the 2931–2862 cm−1 range are ascribed to antisymmetric and symmetric –CH2– group vibrations resulting from the citric acid combustion, the bands in the 2394–1497 cm−1 range are most probably due to the water and CO2 absorbed by the samples from the atmosphere, and the bands around 1380 cm−1 indicate the presence of nitrate ions from the metallic salts used during synthesis.

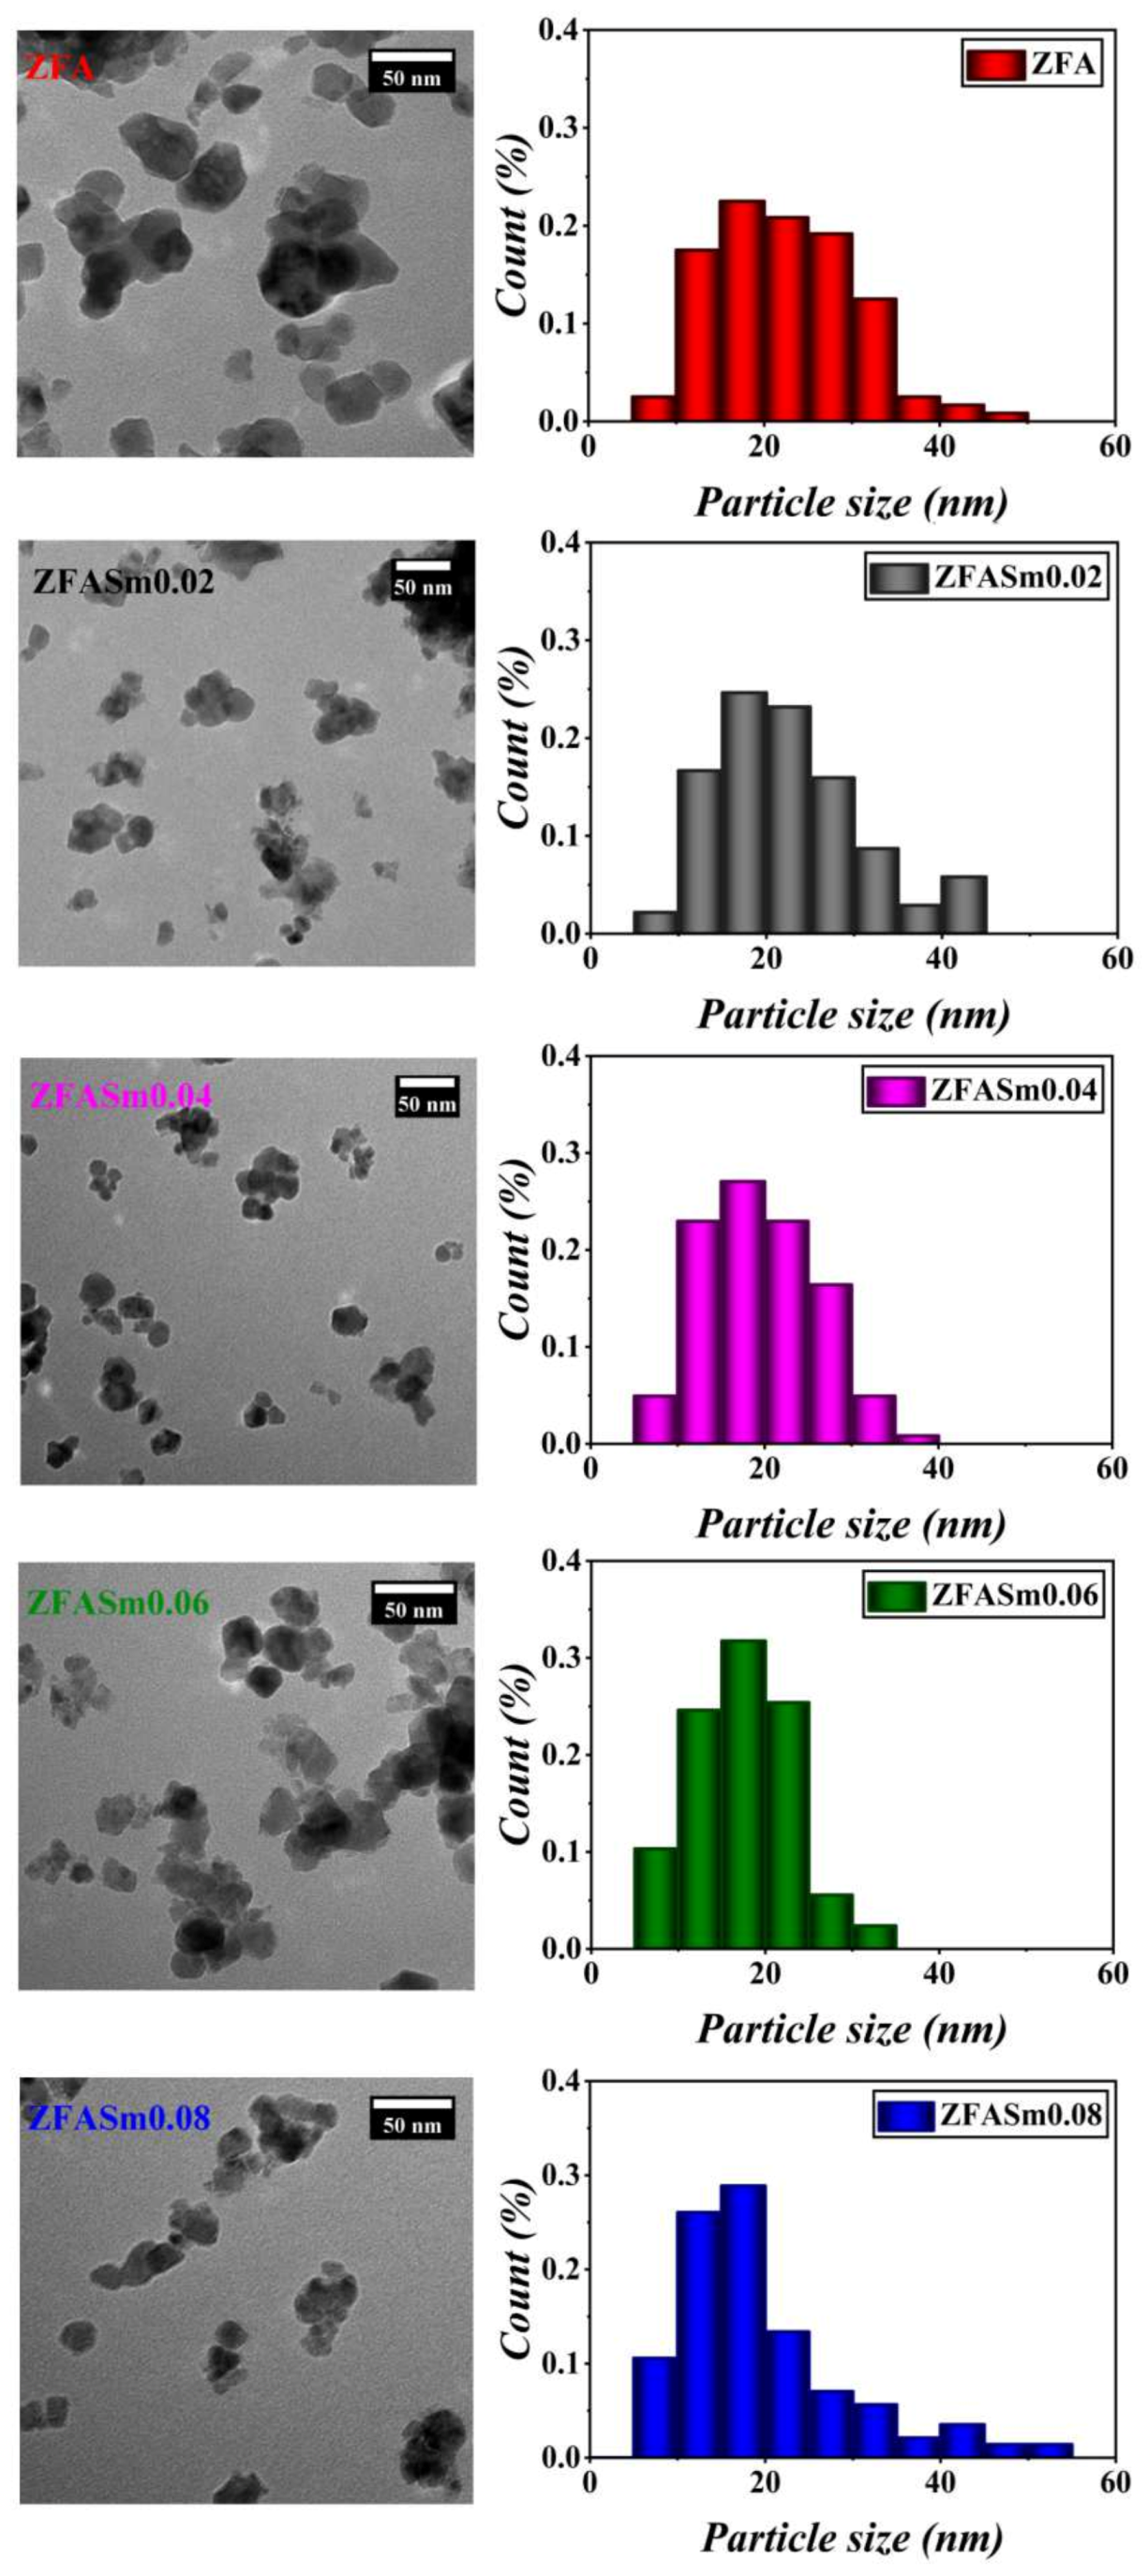
2.1.3. Transmission Electron Microscopy

Representative TEM micrographs and grain-size distributions for the materials under study are shown in Figure 3. Table 1 lists the average particle sizes, as measured by analysing more than 100 grains from at least five different TEM images, for each photocatalyst. For the five materials under study, the TEM micrographs demonstrate the nanometric nature of grains, a narrow grain-size distribution, and a low degree of agglomeration. The average particle sizes fall from about 27, for the undoped material, to 17 nm with an increase in samarium content. Nevertheless, it is important to note that the average grain sizes are not directly correlated with the rare-earth concentration, the ZFASm0.06 presenting the smallest particles. It should also be noted that the distributions of the particle sizes are narrowed when Sm ions replace Fe ions, except for the material most loaded in samarium.

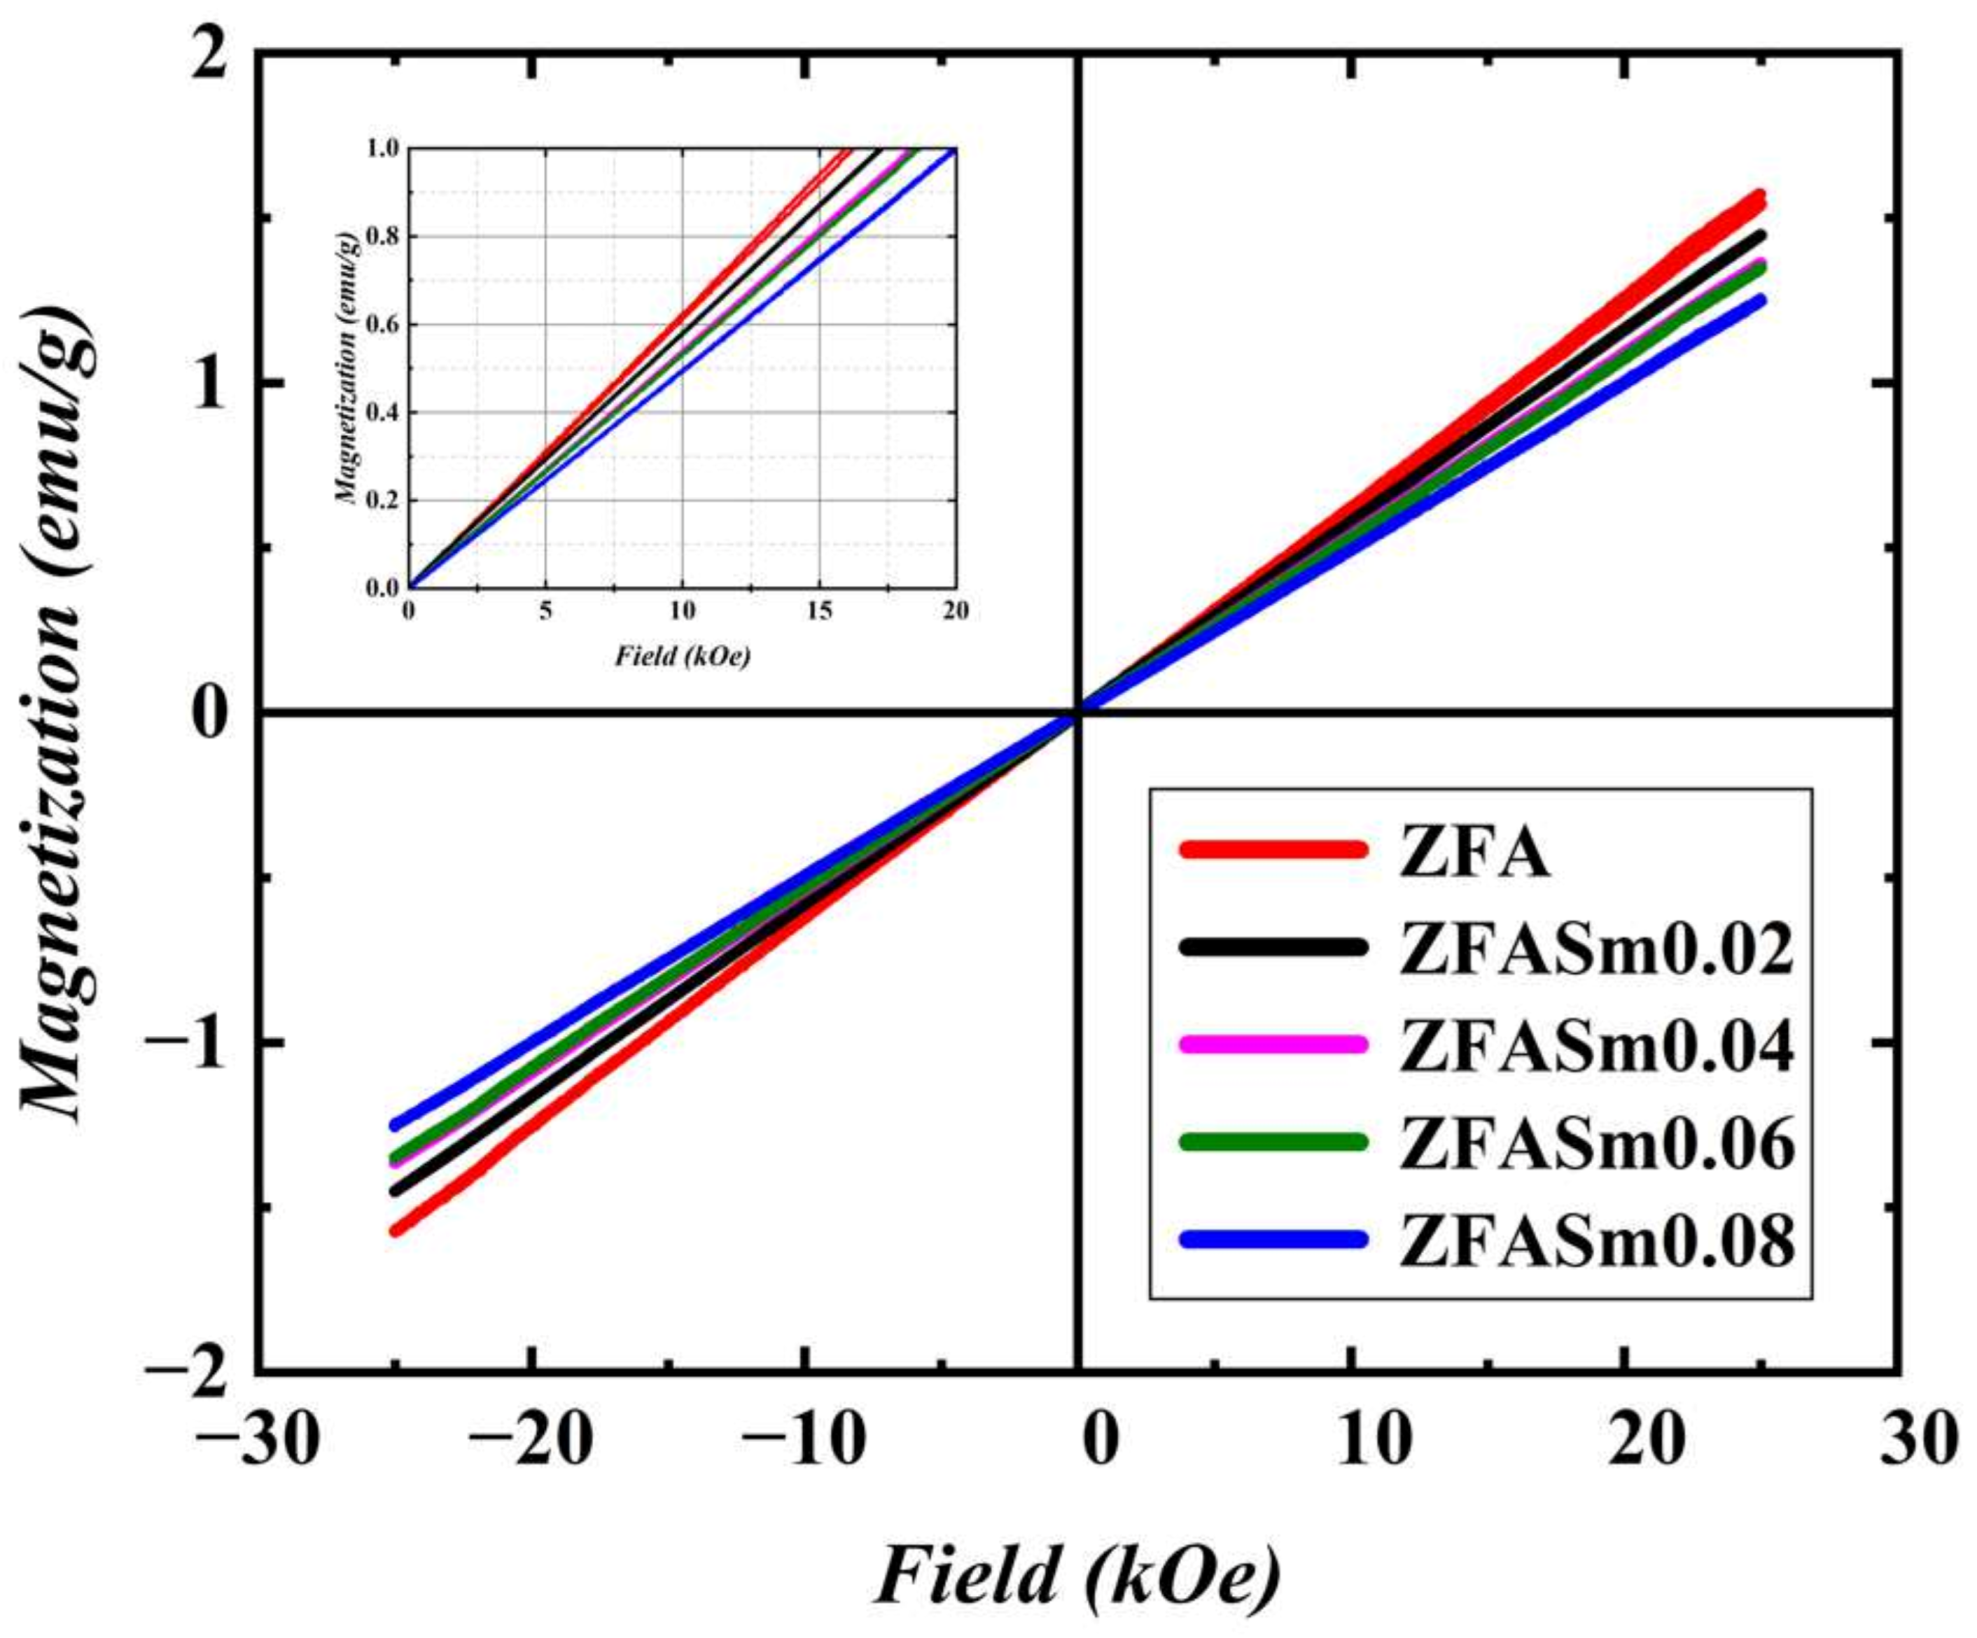
2.1.4. Magnetic Properties

The magnetic properties of the studied materials were evaluated at room temperature by registering the hysteresis cycles (Figure 4).
The shapes of the loops from Figure 4 are in close agreement with previous findings on zinc ferrite materials studied at room temperature and indicate the paramagnetic comportment with zero remanent magnetization and zero intrinsic coercivity (see insert in Figure 4) for all the photocatalysts [30,31]. According to the literature, the paramagnetic nature of zinc ferrite materials is usually explained by the arrangement of the cations within the tetrahedral and octahedral sites close to the ideal normal spinel structure [31]. One may observe that the replacement of half of the iron cations with non-magnetic aluminium cations and paramagnetic samarium cations does not interfere with the paramagnetic behaviour of the original zinc ferrite. Nevertheless, a slight decrease in magnetization is observed with increasing samarium content.

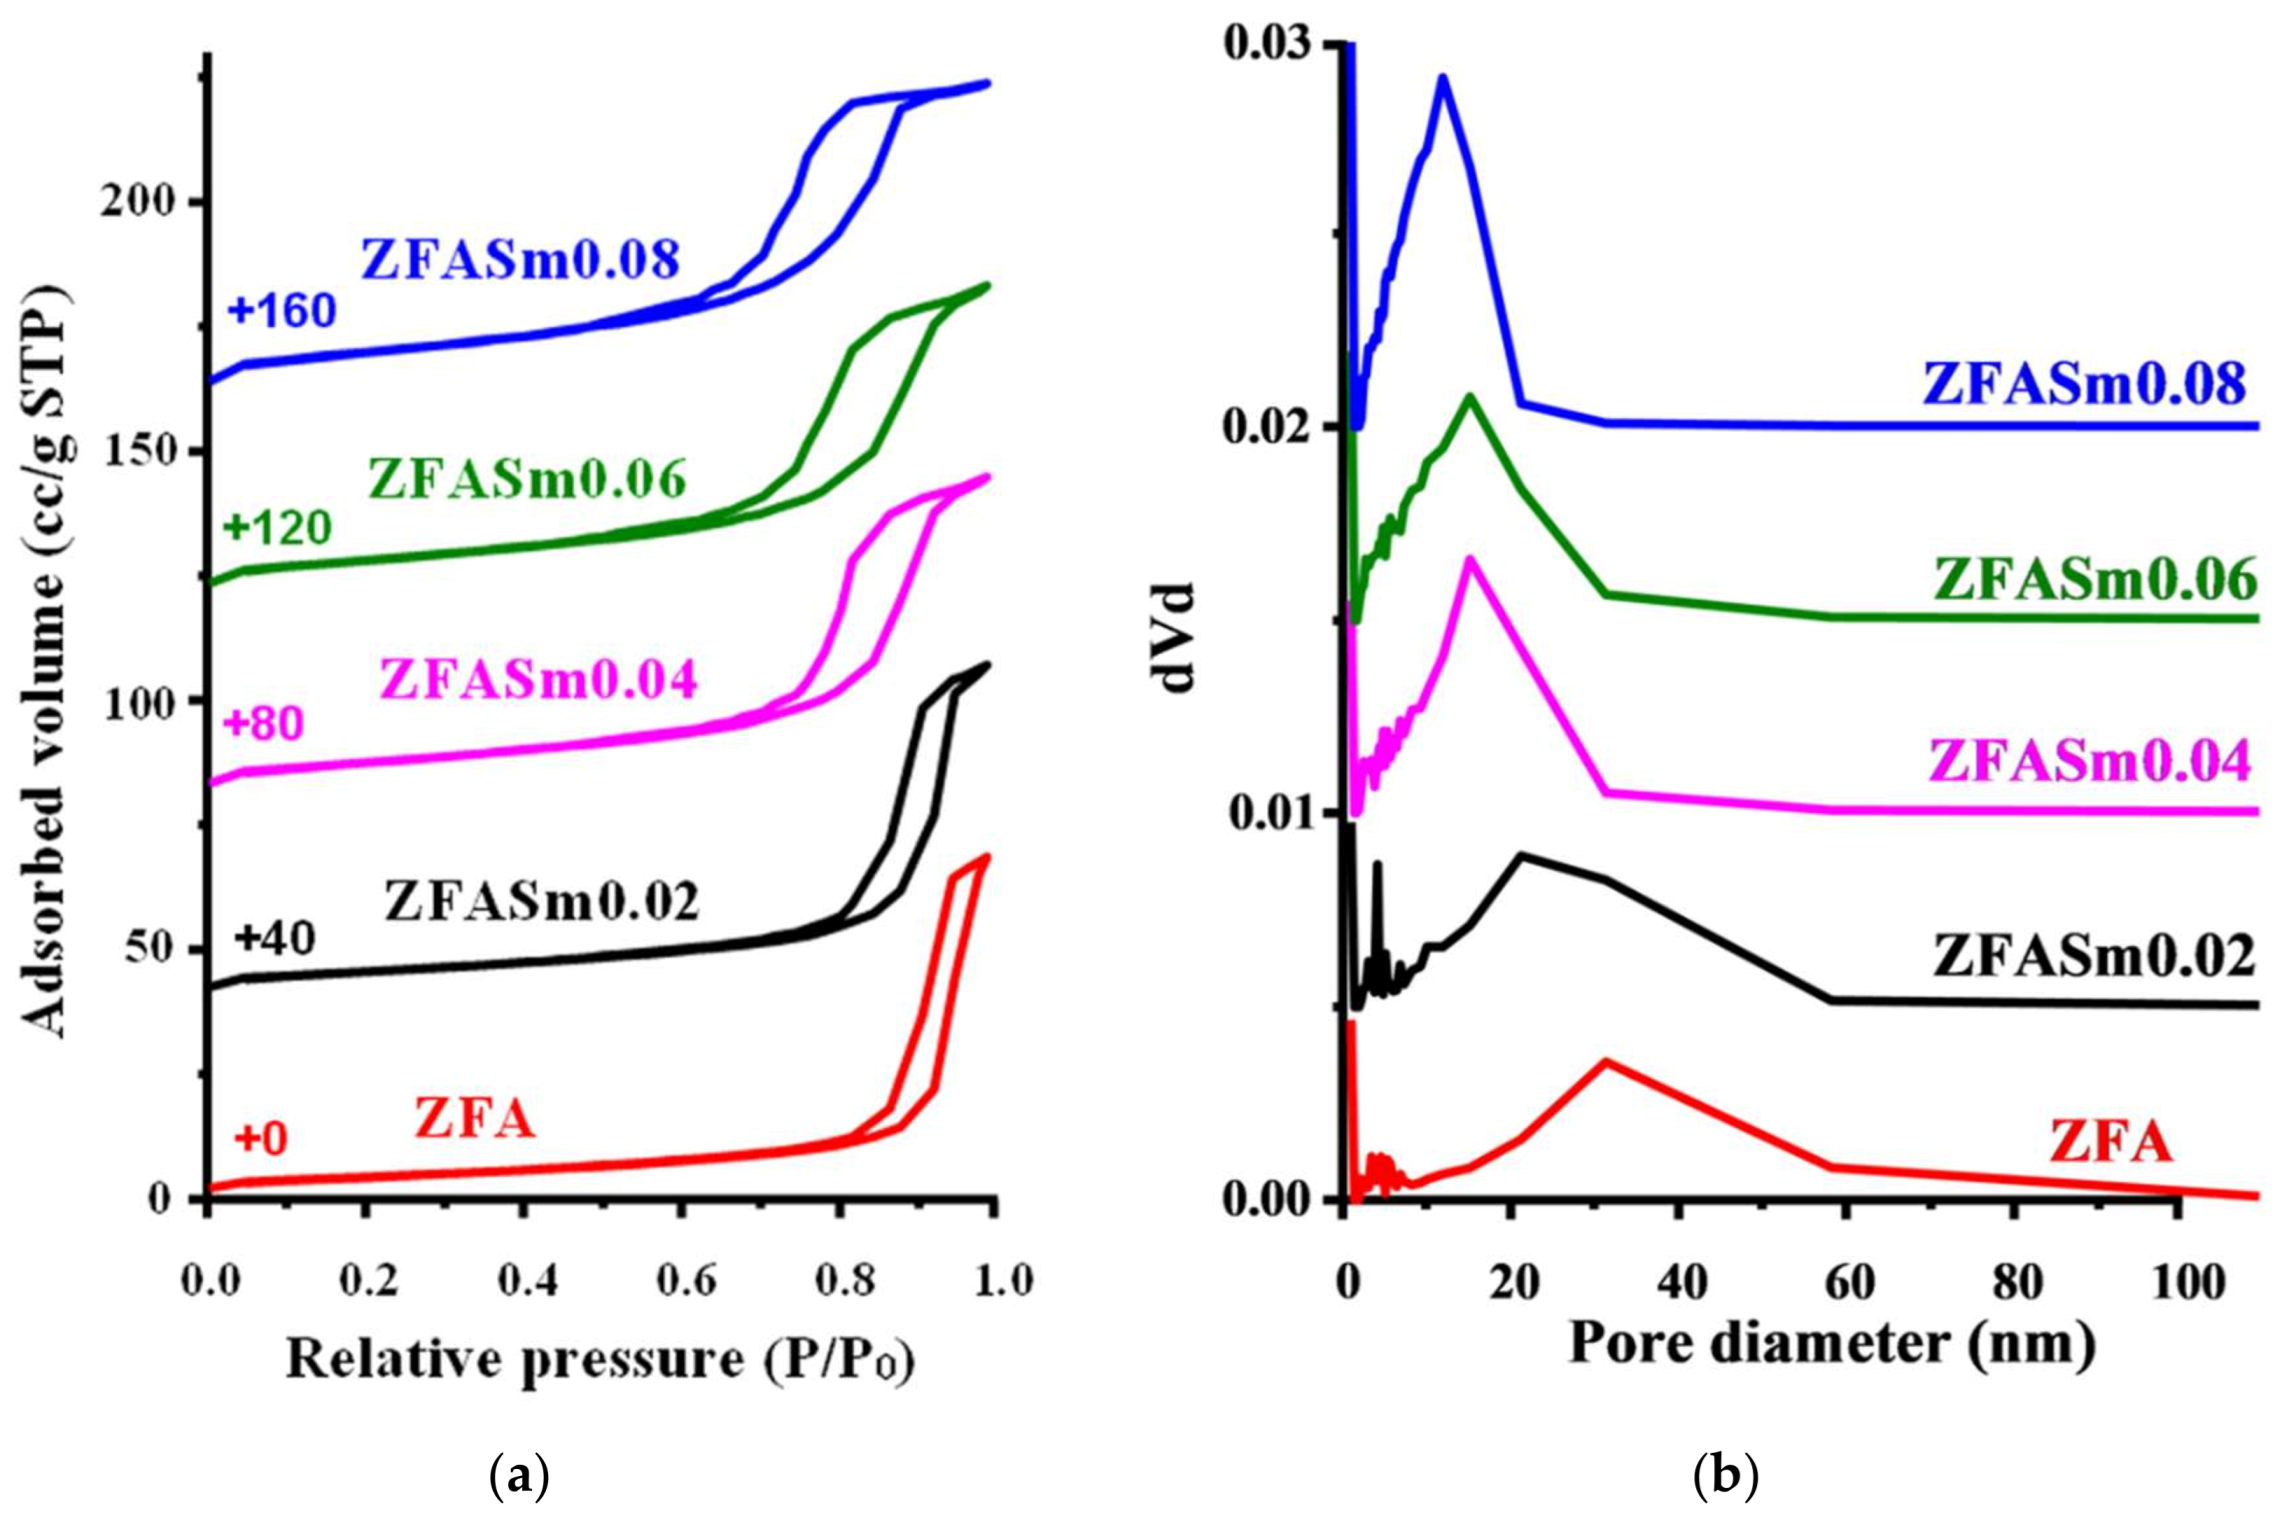
2.1.5. Textural Properties

The nitrogen adsorption–desorption isotherms and the corresponding pore-size distribution are depicted in Figure 5, and the calculated data are provided in Table 1.
According to IUPAC classification [32], the registered nitrogen adsorption–desorption isotherms are of type IVa, characterizing mesoporous adsorbent materials. All isotherms are accompanied by a H1-type hysteresis loop, meaning that the adsorption occurs in pores larger than 4 nm and the characterized material exhibits a narrow range of uniform ink-bottle-like mesopores [33]. As can be observed, the condensation in mesopores occurs at high relative pressures (P/P0 = 0.8–1), indicating that the mesopores are large in size.
It should be mentioned that the capillary condensation shifts to lower relative pressures as the Sm quantity increases. Thus, by applying the BJH (Barret–Joyner–Halenda) theory, pore-size distributions were found and drawn, allowing for estimation of the mean pore diameter for each characterized sample. As expected, the ZFA pore diameters decrease as the Sm quantity increases in doped ferrite samples, from 31.7 nm to 11.8 nm, respectively. Additionally, an inverse trend for the BET (Brunauer–Emmett–Teller) specific surface area was observed starting from 15.076 m2/g for the ZFA sample, increasing up to 34.617 m2/g for ZFASm0.08, respectively. This finding could be explained by the larger Sm ion diameter compared to the other containing elements of ZFA. The Sm doping led to an increase in ZFA pore volume, but no trend was observed with the increasing Sm dosage.

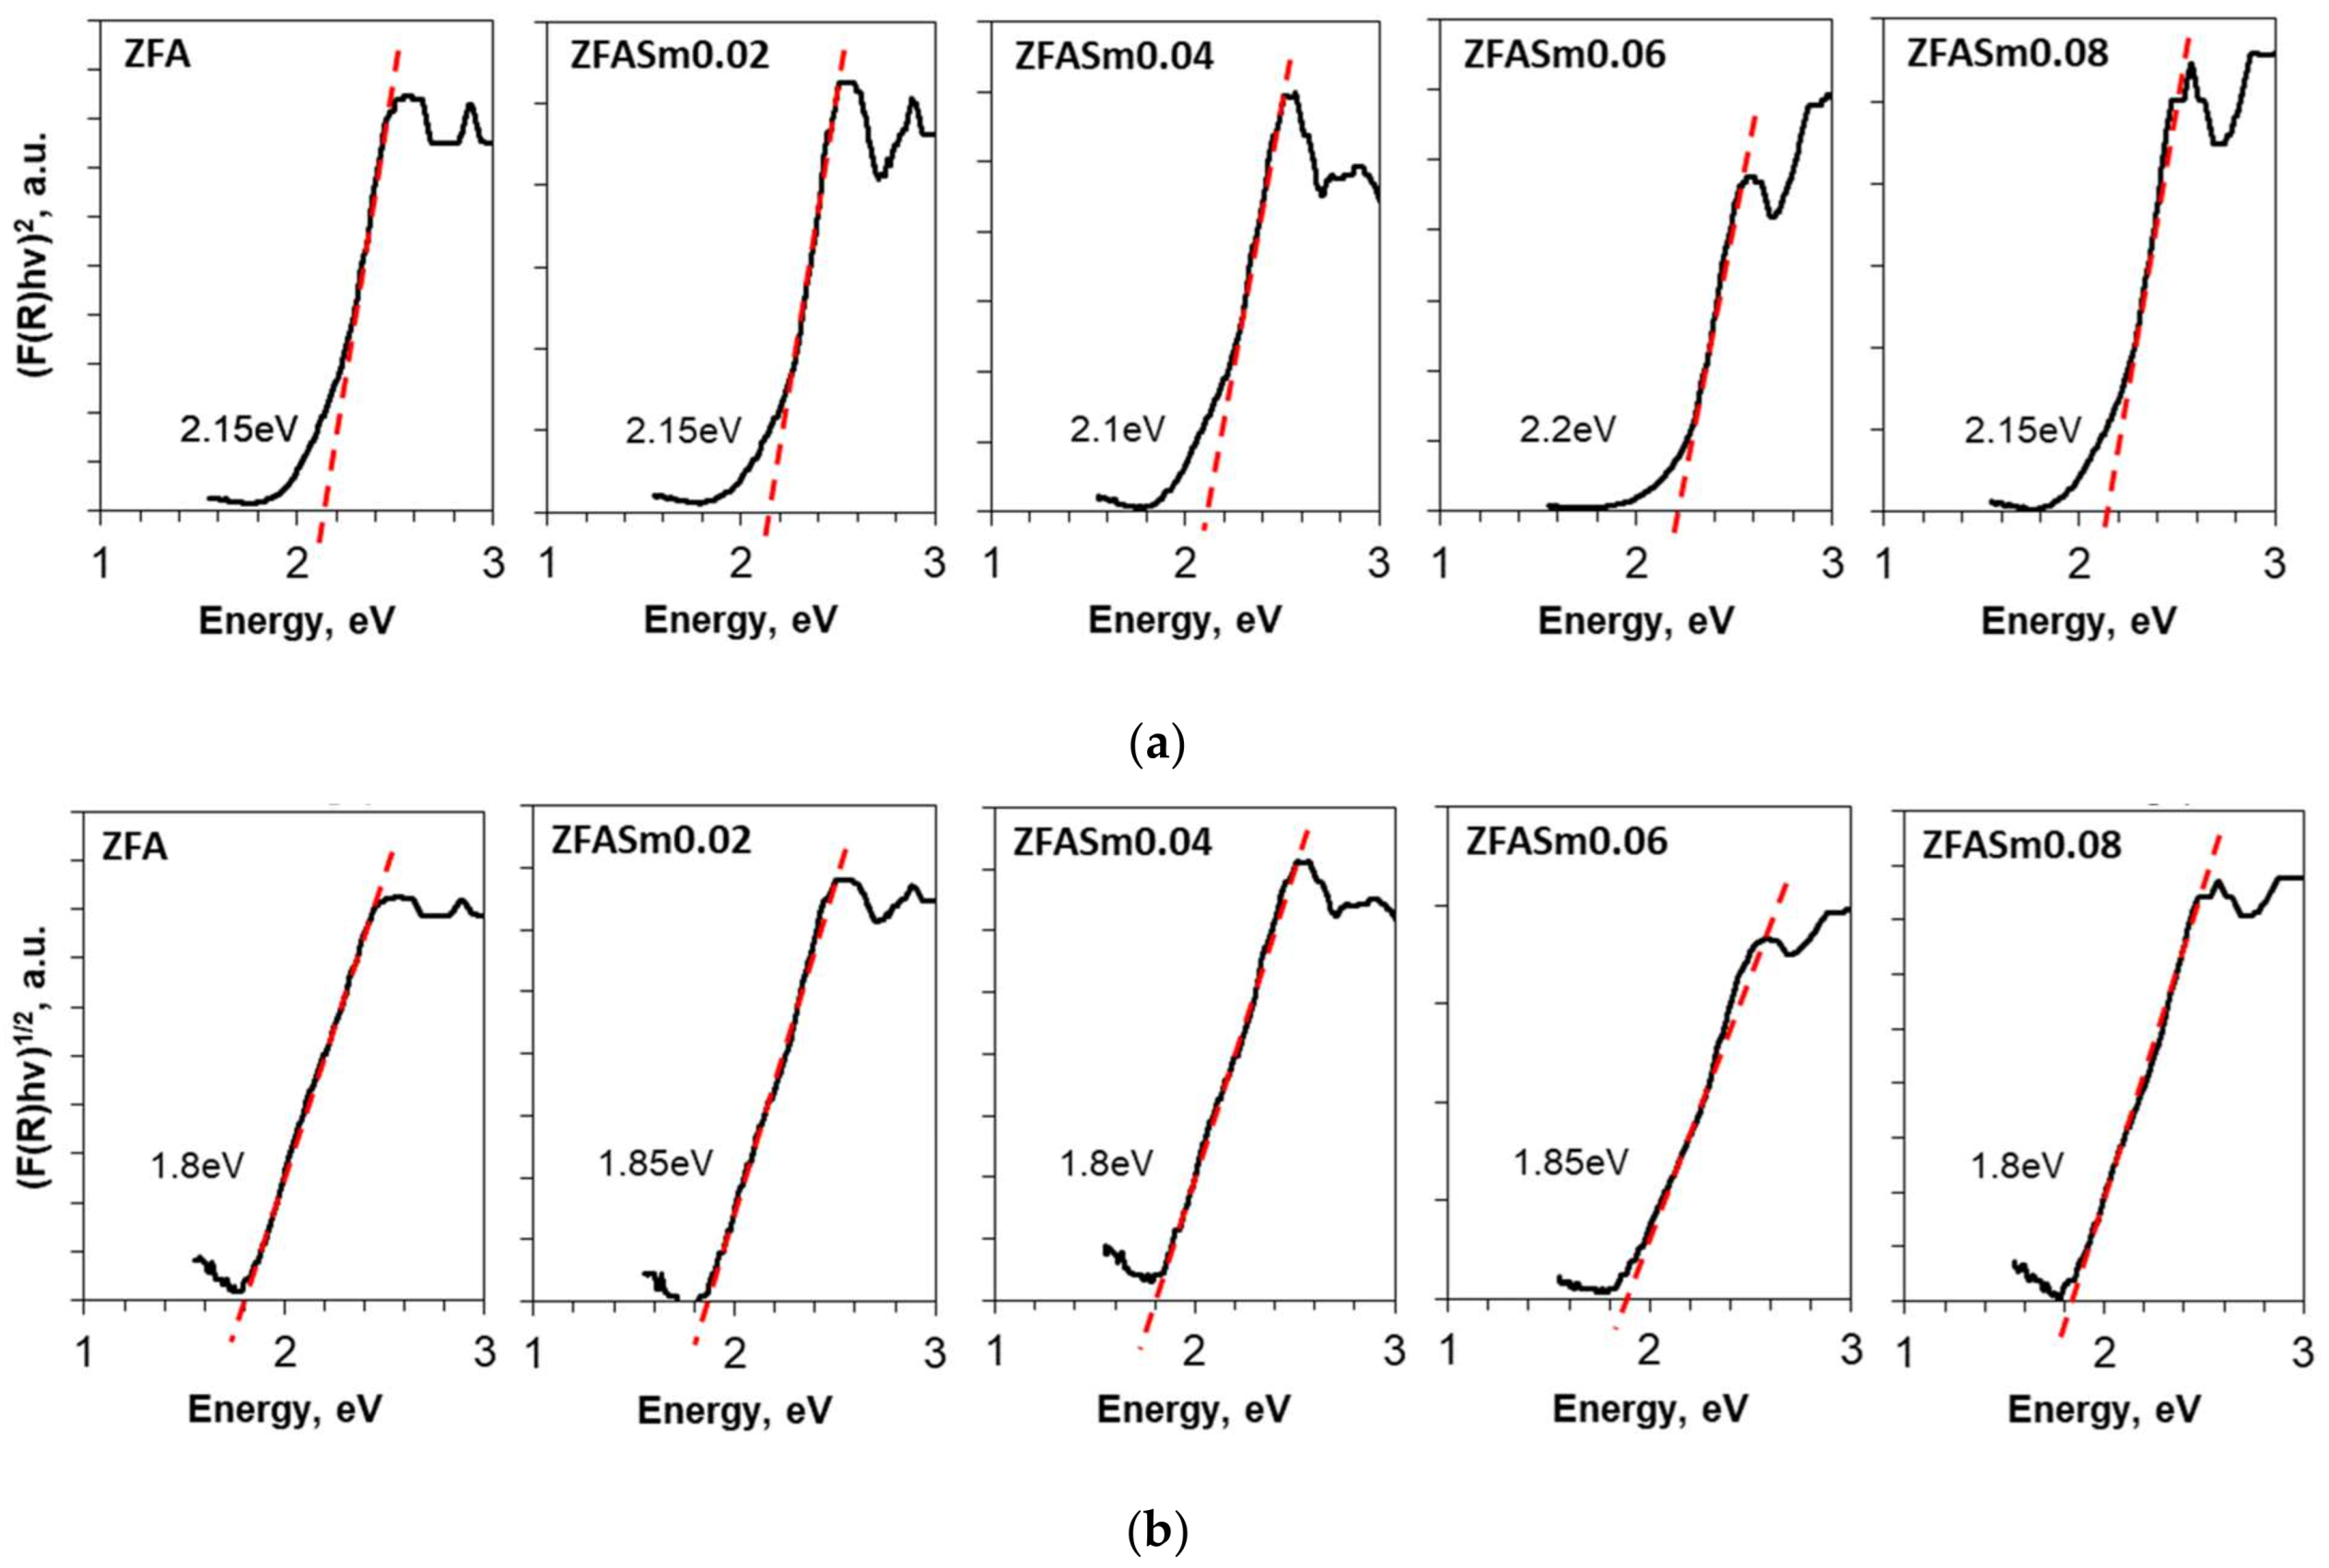
2.1.6. Optical Properties

By drawing the Tauc plots resulting from the UV–Vis DR spectra, the optical band gap values were obtained using the Kubelka-Munk function (see Section 3.2. Photocatalyst characterization). As observed from Figure 6a,b the direct band gap energies were found to be about 2.1–2.2 eV, while the indirect band gap energies of 1.8–1.85 eV. As observed, the band gap energies for the Sm-doped samples did not change in comparison with the ZFA sample (undoped), meaning that all samples will be photoactivated at the same wavelength.

2.2. Photocatalytic Properties

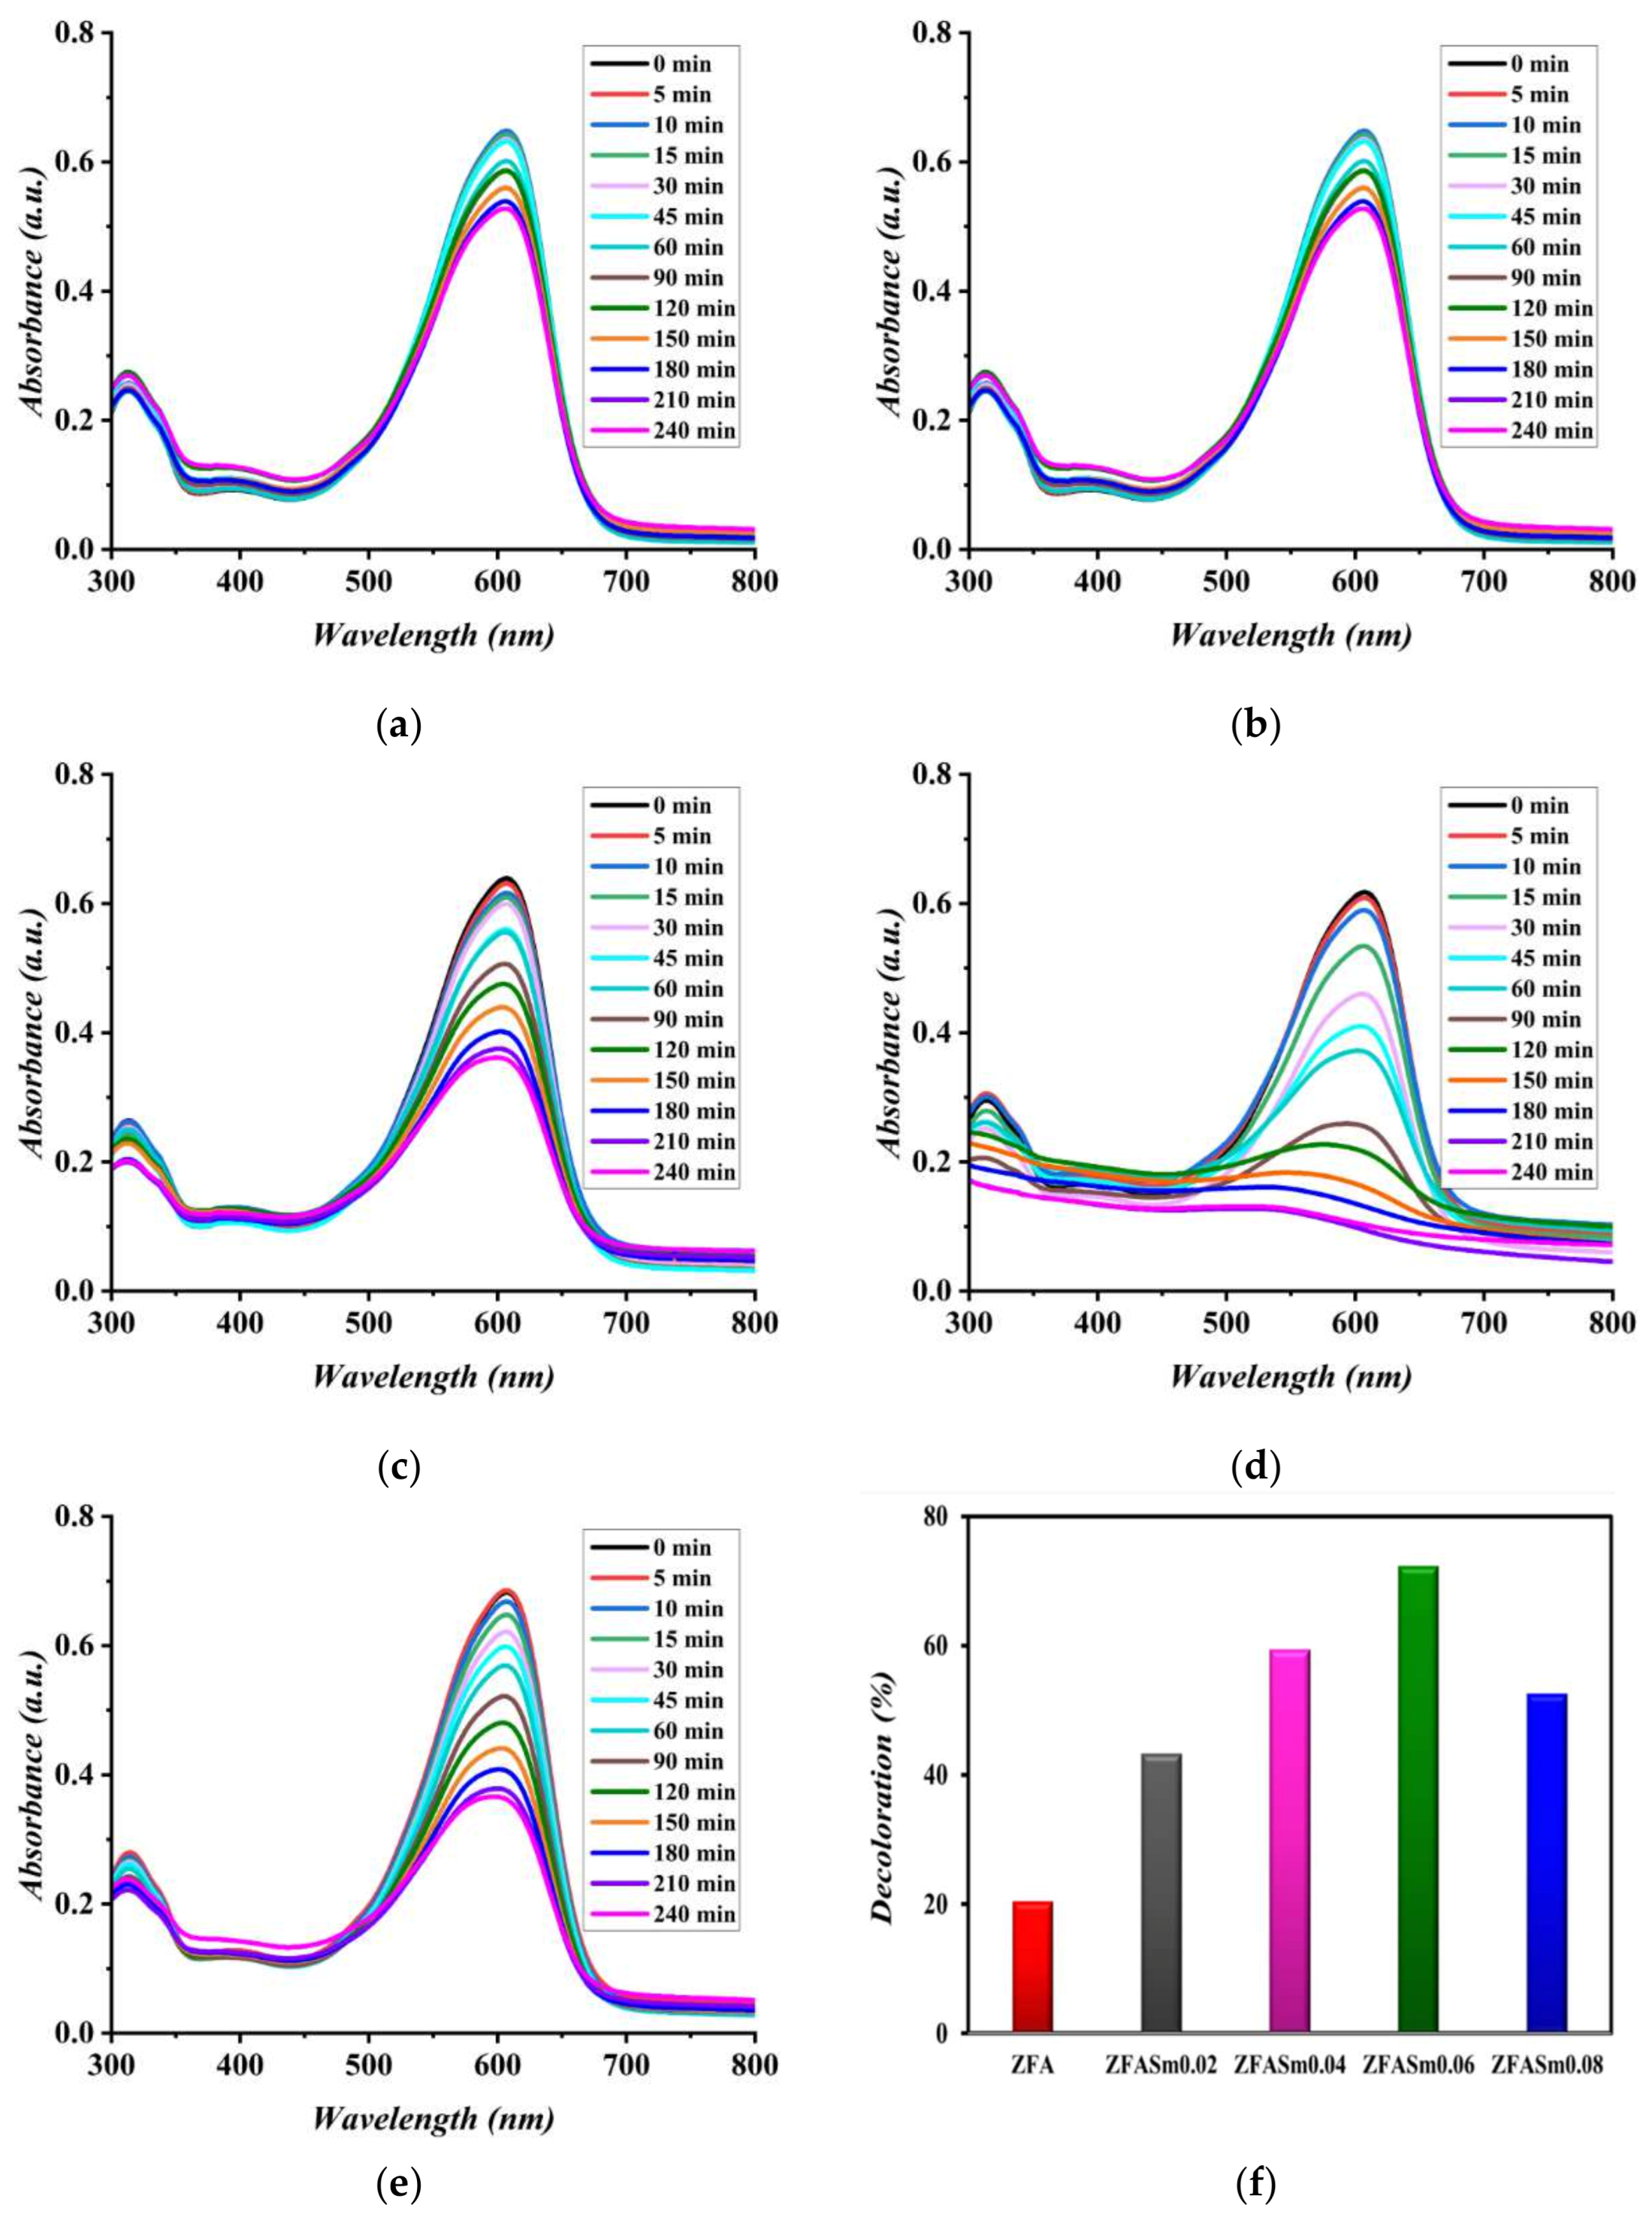
2.2.1. Photocatalytic Activity under UV-Vis Light

The photocatalytic activity of ZnAlFe1−xSmxO4 (x = 0, 0.02, 0.04, 0.06, 0.08) materials was evaluated in photodegradation processes of Evans Blue (EB) dye under UV-Vis light at room temperature. Evans blue (C34H24N6Na4O14S4) was selected as the model organic pollutant, on one hand, due to its wide range of applications from the diagnostic tools in biomedicine to colouring agent for cotton and silk fibres in the textile industry and, on the other hand, owing to its high toxicity for lung, liver, intestine, and kidney function [34,35].
Figure 7a–e show the modifications of the UV-Vis spectra of EB in the presence of the studied photocatalysts at a regular time interval from 0 to 240 min. Several observations can be seen by close inspection of Figure 7a–e. First, one may observe that, in the 300–800 nm range, EB registered UV-Vis spectra are characterized by two adsorption peaks: one broad peak located at 606 nm and another peak around 320 nm, in close agreement with the literature [36]. Second, with reaction time, both EB peaks became weaker, which shows that all of the investigated photocatalysts are attacking the pollutant molecule. Third, after 4 h of the photocatalytic process, the colour removal was (almost) complete for some of the samarium-containing samples, as compared to the ZFA sample. For comparison purposes, Figure 7f shows the colour-removal efficiency registered after 1 h of the photocatalytic process for all samples. One may note all materials doped with samarium ions are significantly more active as photocatalysts than the undoped zinc aluminium ferrite sample. Among the materials with Sm, the ZFASm0.06 is the most active by far. The photocatalytic behaviours of the samples can be easily correlated with lattice parameters, interplanar distance, and particle-size values (see Table 1). Furthermore, XRD and FTIR analysis indicated that the insertion of samarium into the spinel structure led to the redistribution of the cations between tetrahedral and octahedral sites. The most suitable cation arrangement from a photocatalytic performance standpoint was, most probably, for x = 0.06.

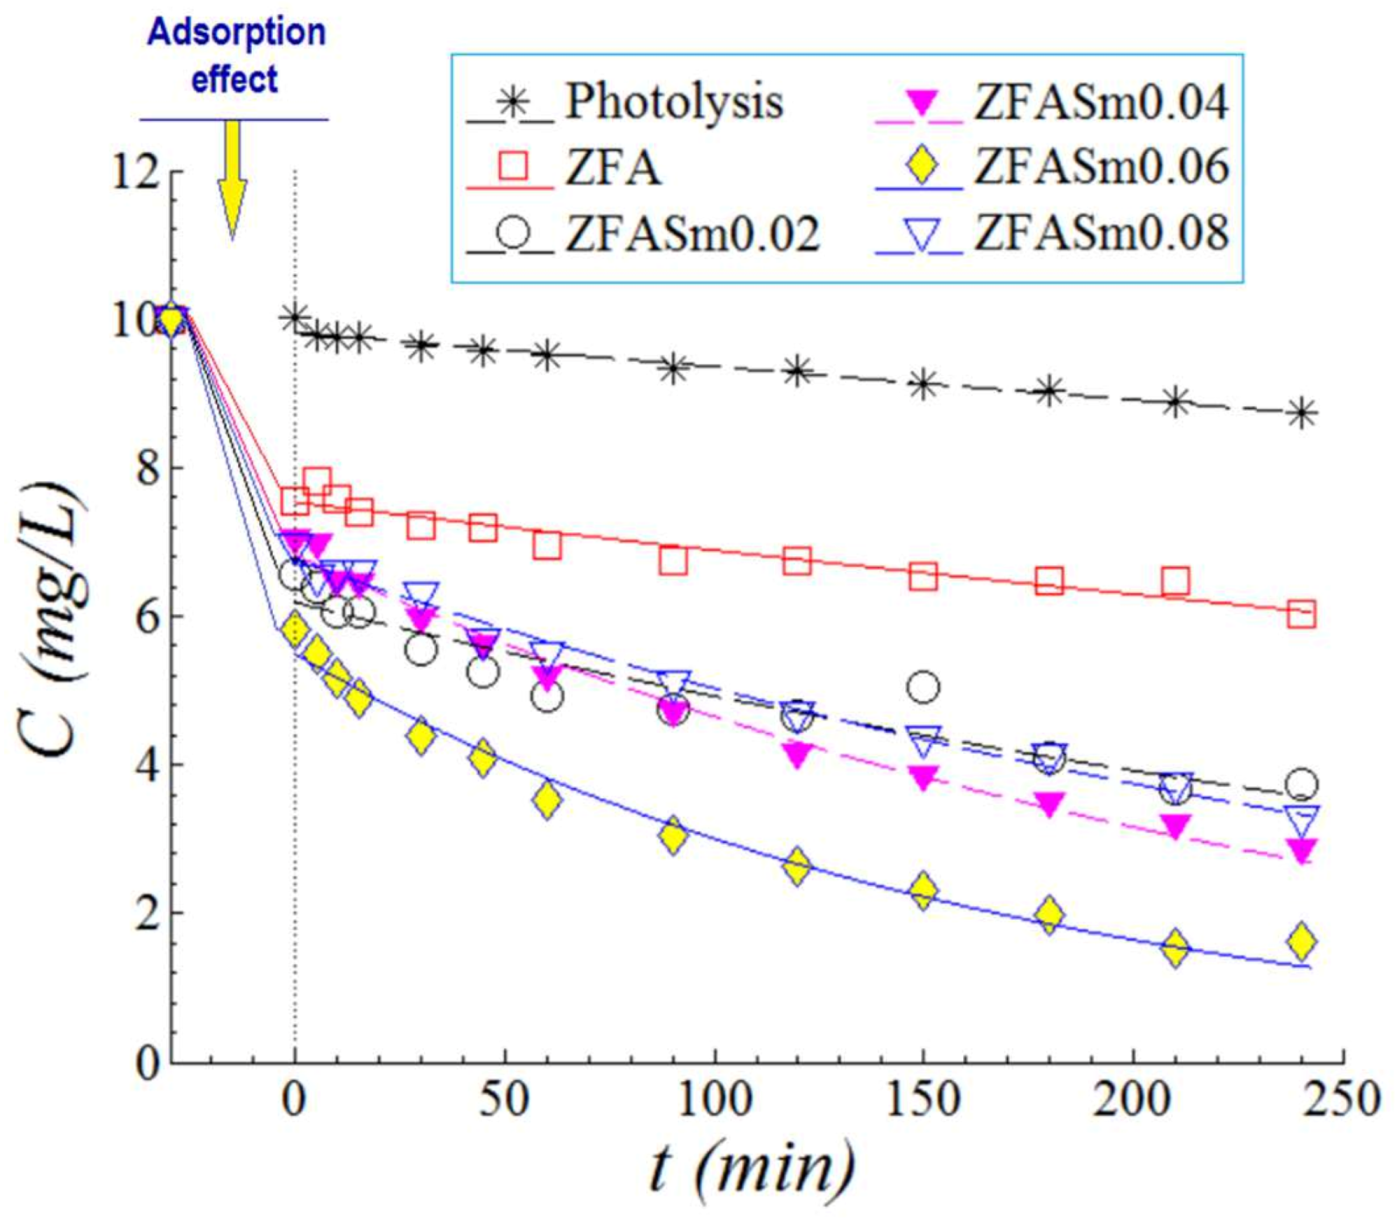
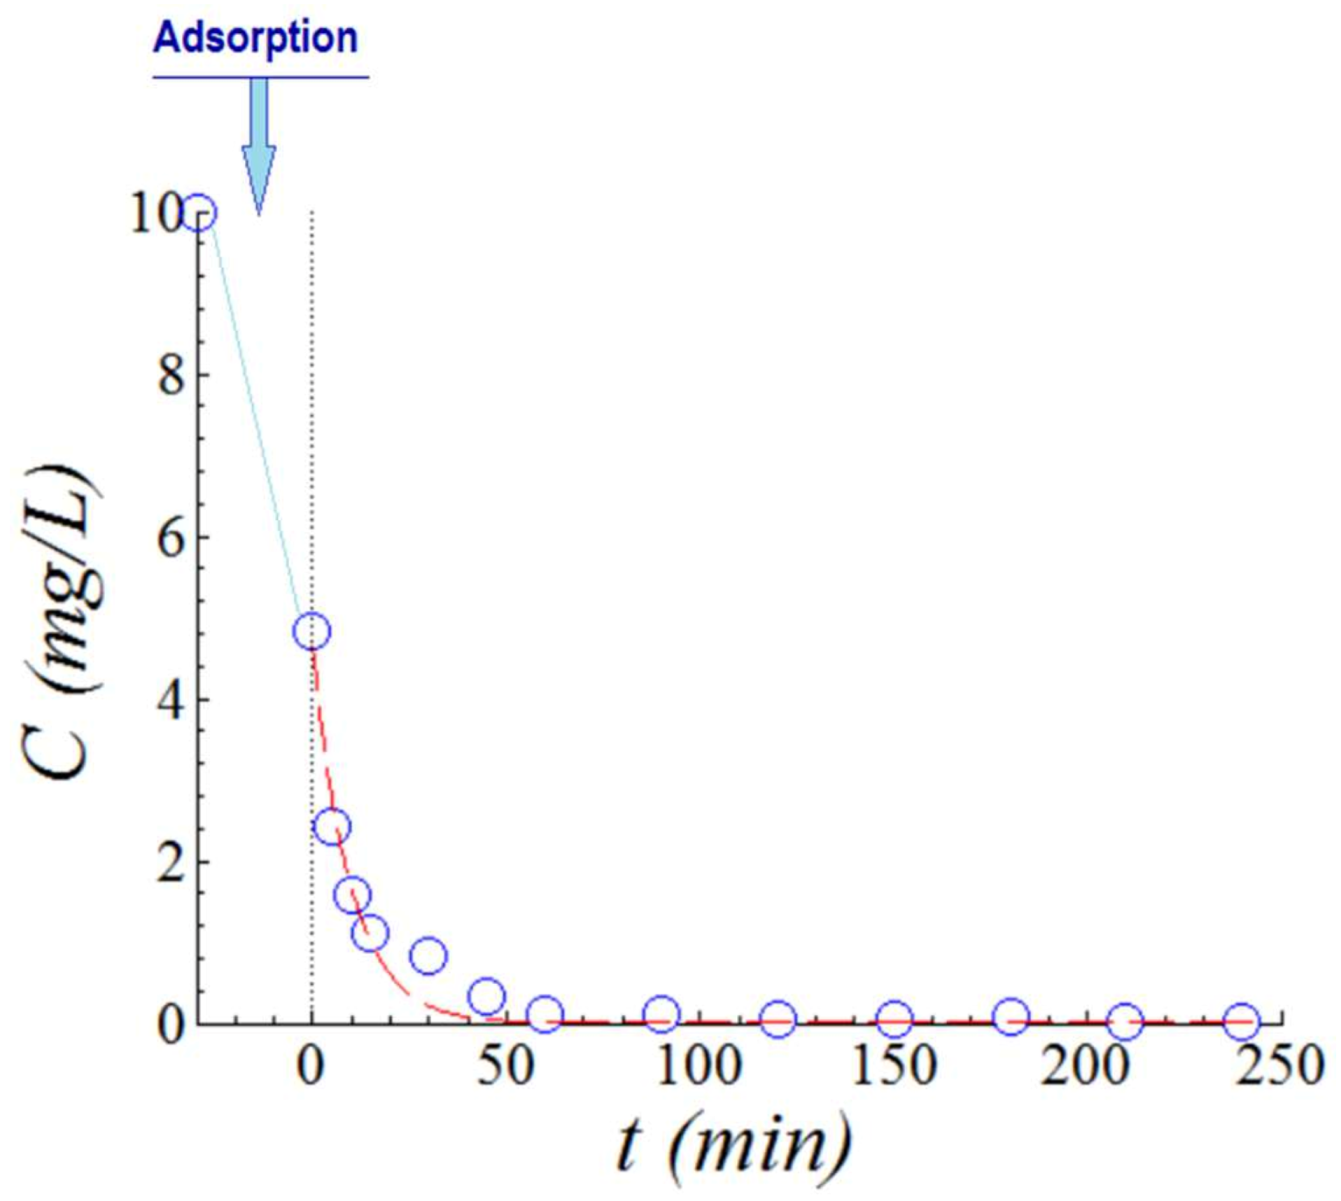
2.2.2. Kinetics of the Photodegradation Process under UV-Vis Light

Based on the registered UV-Vis spectra, kinetics studies of EB photodegradation under UV-Vis light were performed. Thus, Figure 8 illustrates the kinetics data related to the photodegradation of EB dye in aqueous solutions under UV-Vis light, in the absence of a catalyst (photolysis) and in the presence of catalysts (ZnAlFe1−xSmxO4 (x = 0, 0.02, 0.04, 0.06, 0.08)). For the experiments with photocatalytic materials, one should mention that before irradiation, the suspension was magnetically stirred for 30 min to ensure adsorption–desorption equilibrium. Thus, it is important to observe the adsorption effect of EB onto the surface of the catalyst for all studied materials. The adsorption capacity of the materials seems very sensitive to the samarium presence in the samples and strongly influences the dye-removal performances. Throughout the reaction time, the photocatalytic activity of the zinc–aluminium ferrite was enhanced by doping with samarium. Nevertheless, the best photocatalyst was proven to be ZFASm0.06. From Figure 8, it is also important to note that without a catalyst, the photodegradation of the EB dye is practically negligible.
By means of nonlinear regression techniques, the experimental data were fitted to the pseudo-first-order (PFO) kinetic model. The goodness of fit was ascertained by the chi-square test (χ2-value). The PFO equation can be expressed as:
C = C 0   e k t
where C 0 designates the initial EB dye concentration (~10 mg/L), k   —pseudo-first-order reaction rate constant (min−1), and t   —irradiation time (min). The fitted parameters of the PFO model are listed in Table 2.
Consequently, analysing the pseudo-first-order reaction rate constants reported in Table 2, one can see that for the experiments with photocatalytic material, the k values were at least two-times higher as compared to the experiment without catalyst (photolysis). More importantly, the k values for the samarium-doped photocatalysts were clearly higher than for the undoped ZFA sample, demonstrating the positive impact of the Sm3+ presence in the spinel structure on the photocatalysts. On the other hand, among the samarium-doped materials, as previously observed for the colour-removal efficiency after 1 h of photocatalytic reaction, the most performant catalyst was the ZFASm0.06. This fact indicates that, for our series of photocatalysts, lattice parameters, interplanar distances, and particle sizes are playing a key role in the photocatalytic behaviour of the obtained materials, as compared to the crystallite size.

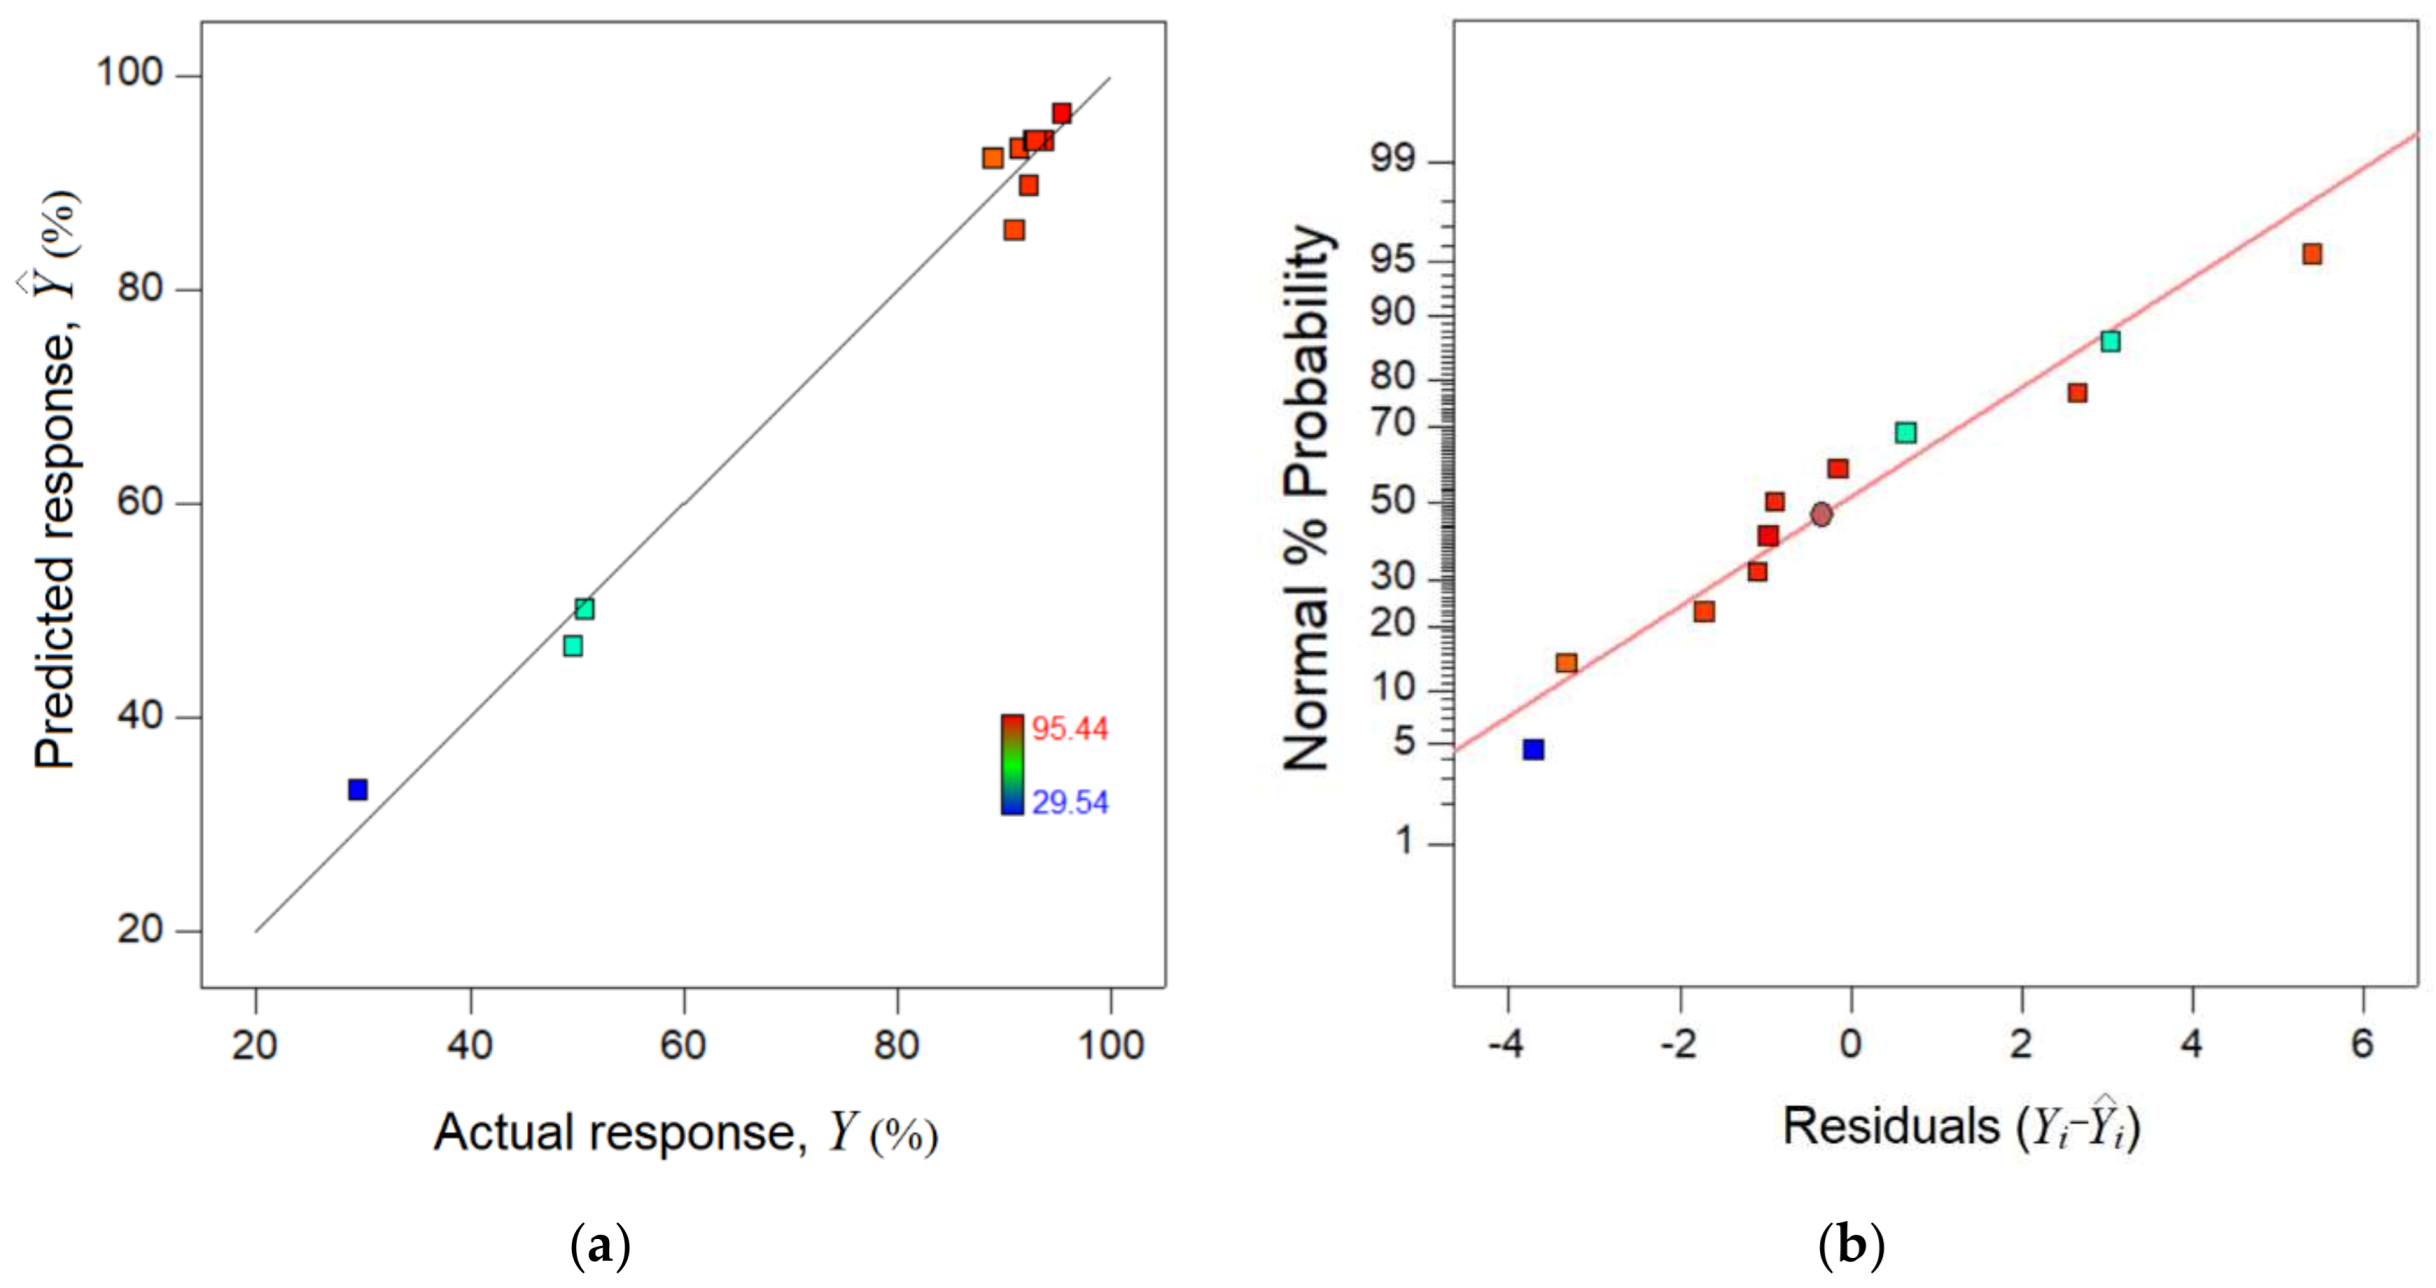
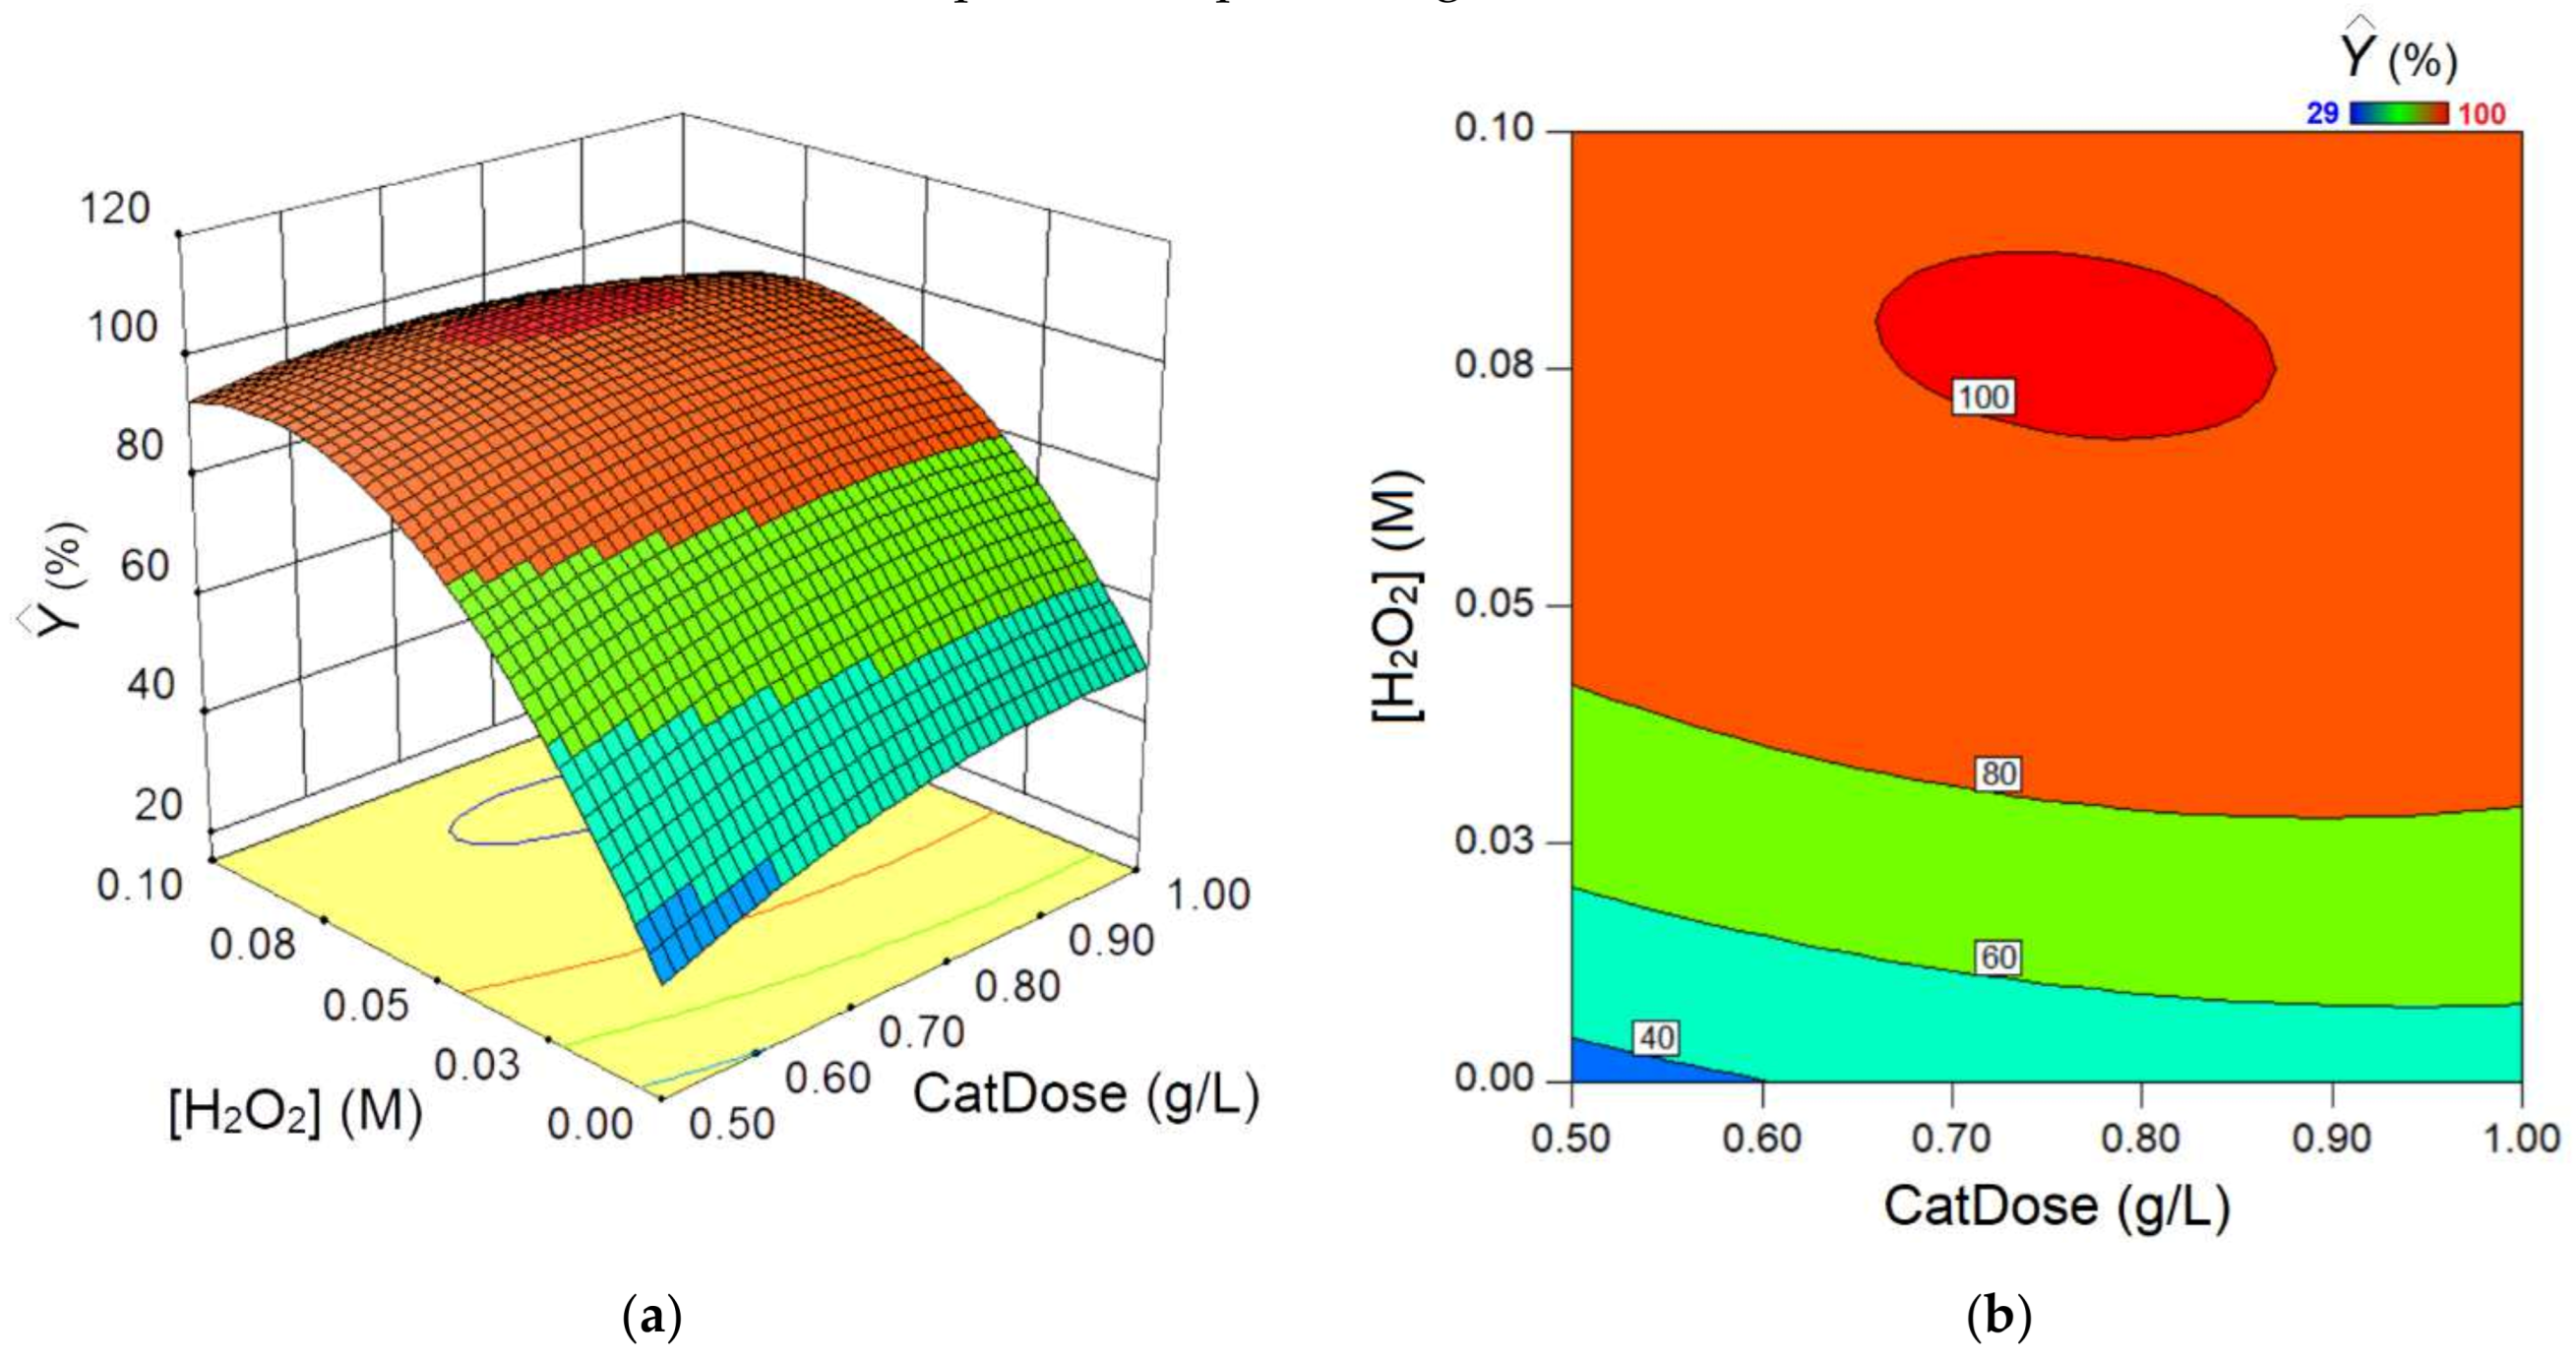
2.2.3. Effect of Hydrogen Peroxide Addition and Catalyst Dose: Process Optimization

The intensification of the photocatalytic process (under UV-Vis light irradiation) was carried out by adding hydrogen peroxide (H2O2) to the system and by varying the photocatalyst dose. In this regard, the best photocatalyst sample, ZFASm0.06 (with formulation ZnAlFe0.94Sm0.06O4), was used in these experiments for EB photodegradation. Thus, herein, we investigated the synergistic effect of two operating parameters (factors), i.e., the initial concentration of the hydrogen peroxide ((H2O2), M) in the system and the catalyst dose (CatDose, g/L). For this purpose, we applied the design of experiments (DoE) and response surface methodology (RSM) as the modelling-optimization tools. More details regarding these methodologies (DoE and RSM) can be found in the following references [37,38].
Hence, the simultaneous influence of both factors ((H2O2) and CatDose) was investigated in a systematic fashion by using DoE and RSM. The purpose of this study was to intensify the photocatalytic process by maximization of the colour-removal efficiency, Y (the process response). In all experiments, the aqueous solutions of 10 mg/L EB dye (initial concentration) were subjected to photodegradation at a temperature level of 25 ± 1 °C.
For each experimental trial, the process response Y (colour-removal efficiency) was determined for an irradiation time equal to 60 min. The aim of the optimization was to maximize the value of the colour-removal efficiency Y (%), which may be expressed as:
Y = 1 C C 0 × 100
where C 0 is the initial concentration of EB dye (10 mg/L) and C is the remaining concentration of EB dye determined after t = 60 min irradiation time.
For modelling purposes, both operating parameters ((CatDose) and (H2O2)) were scaled into the coded variables x1 and x2 in order to compare their influence in the same dimensionless scale. The mathematical relations used for coding factors are given elsewhere [37,38].
In this section, a central composite experimental design of the face-centred type was adopted to conduct experiments (Table 3). According to Table 3, the operating parameters (factors) are reported in actual values ((CatDose) and (H2O2)) as well as in coded values (x1 and x2). The experimental design matrix (Table 3) included 11 experimental trials, where both factors were changed simultaneously. As a result, the process response (Y, %) was determined for each run (set of conditions). Note that the central assays (runs no.9 to 11) were performed to estimate the reproducibility of the experiment.
Based on the data shown in Table 3, a mathematical model was built using multiple regression techniques [37,38]. Finally, the multiple-regression model for estimated response ( Y ^ ) can be written in terms of coded variables (x1 and x2) as follows:
Y ^ = 93.89 + 3.37 x 1 + 24.88 x 2 5.07 x 1 x 2 4.94 x 1 2 22.37 x 2 2 subjected   to : 1     x j   + 1 ;   ( j = 1 ,   2 )
The obtained multiple-regression model (Equation (3)) was validated from a statistical point of view by using analysis of variance (ANOVA) [37]. The statistical estimators calculated by the ANOVA method are given in Table 4.
According to ANOVA outcomes (Table 4), the F-value of 71.50 and a very small P-value (0.0001) indicated a significant model from a statistical standpoint. In other words, the model is adequate to estimate the process response in the valid region (region of experimentation). Moreover, the value of the determination coefficient R2 points out that the model can explain more than 98% of data variation. Further, the adjusted coefficient R2adj is close to R2, suggesting that the multiple-regression model implying main, interaction, and quadratic effects offers good predictions. Figure 9 illustrates the goodness of fit between the experimental data and model predictions. The data scattered around the bisector (45o straight line) indicate a good accordance between the model and observations (Figure 9a). In addition, Figure 9b highlights the normal plot of residuals. In fact, the residual designates the difference between the experimental response and the model prediction ( Y i Y ^ i ). Hence, this type of graph illustrates the departure of the residual errors from the normal distribution. From Figure 9b, one can see that the residuals are located in the vicinity of the straight line underlining a normal distribution.
By using the substitution technique, the final empirical model in terms of actual factors was developed, which can be expressed as:
Y ^ = 23.17 + 152.4 × CatDose + 1696 . 5 × H 2 O 2 405 . 5 × CatDose × H 2 O 2 79 . 1 × CatDose 2 8948 . 5 × H 2 O 2 2 subjected   to :   0.5     CatDose     1.0   ( g / L ) ; 0     [ H 2 O 2 ]     0.10   M
This empirical model (Equation (4)) was applied for simulation to detail the 3D response surface diagram and 2D contour-lines map in order to reveal the mutual effect of factors on the process response (Figure 10).
As one can see from Figure 10, the main effects of CatDose and (H2O2) operating parameters are positive with respect to the estimated process response ( Y ^ , %). In other words, the greater the factors (CatDose and (H2O2)), the greater the estimated colour-removal efficiency ( Y ^ , %). However, it should be noted that the main effect of (H2O2) is stronger than the main effect of the CatDose factor. The quadratic effects of both factors induce curvature features on the response surface, pointing out an optimal zone (maximum) on the plateau. In addition, there is a discernible interaction effect between both operating parameters CatDose and (H2O2). In accordance with this interaction effect, the influence of the CatDose factor on the estimated response is more evident at low concentrations of hydrogen peroxide.
The graphical analysis of the response surface (Figure 10) indicated an extreme point (a local maximum) inside the valid region. To determine exactly the coordinates of the optimal point, we used the classical approach [39]. According to this, we located, firstly, the stationary point (xS = [x1 x2]T) by vanishing the first derivatives of the objective function ( Y ^ ) in relation to the decision variables (x1 and x2—coded values). Consequently, a system of two algebraic equations resulted, which was solved analytically to establish the stationary point, that is,
Y ^ x 1 = 3.37 5.07 x 2 9.88 x 1 = 0 Y ^ x 2 = 24.88 5.07 x 1 44.74 x 2 = 0
Hence, the established stationary point is equal to xS = [0.059 0.549]T (in terms of coded variables). In order to confirm that the stationary point (xS) is a point of maximum, we performed the second partial derivative test based on the Hessian matrix (H) [39]. Generally, if det(H) > 0 and (2 Y ^ /x12) < 0, then the stationary point is a point of maximum. If det(H) > 0 and (2 Y ^ /x12) > 0, then the stationary point is a point of minimum. Instead, if det(H) < 0, then the stationary point is a saddle point (i.e., a point of inflection or minimax). Otherwise, for det(H) = 0, the second derivative test is inconclusive [39]. In our particular case, the Hessian matrix (H) can be written as:
H i , j = 2 Y ^ x i x j = 9.88 5.07 5.07 44.74
where det(H) = 416.3; hence, the optimal point (xS = [0.059 0.549]T) is a point of maximum since det(H) > 0 and (2 Y ^ /x12) < 0. By converting the coded variables into the actual factors, the optimal point (xS = [0.059 0.549]T) can be written as CatDose = 0.765 g/L and (H2O2) = 0.077 M. Subsequently, the experimental validation (confirmation run) was carried out under these established optimal conditions (CatDose = 0.765 g/L and (H2O2) = 0.077 M). Under these optimal conditions, the colour-removal efficiency (determined at 60 min irradiation time) was equal to Y ^ = 100.82 (estimated value by model) and Y = 98.83% (experimental value). The difference ( Y ^ -Y) of 1.99% was assigned to the residual error (between the model and experiment).
In addition, under the determined optimal conditions, we recorded the full kinetics of photo-degradation of EB dye (Figure 11). Results revealed a significant PFO rate constant (k = 1.020 × 10⁻¹ min−1) for these optimal conditions if compared with a similar system (k = 6.014 × 10⁻³ min−1) that did not contain hydrogen peroxide as a booster.
By using the term, the half-life of reaction (τ = ln2/k), the process was evidently intensified after optimization. Thus, the half-life of the reaction decreased significantly from 115 min to about 7 min, which corresponds to a process intensification of about 16-fold. It should be mentioned here that after an irradiation time of 240 min (UV-Vis light), the final colour-removal efficiency was equal to 99.9% (Figure 11).
For modelling and optimization purposes, the scientific computations were carried out by using the Design-Expert and Matlab software packages.

3. Materials and Methods

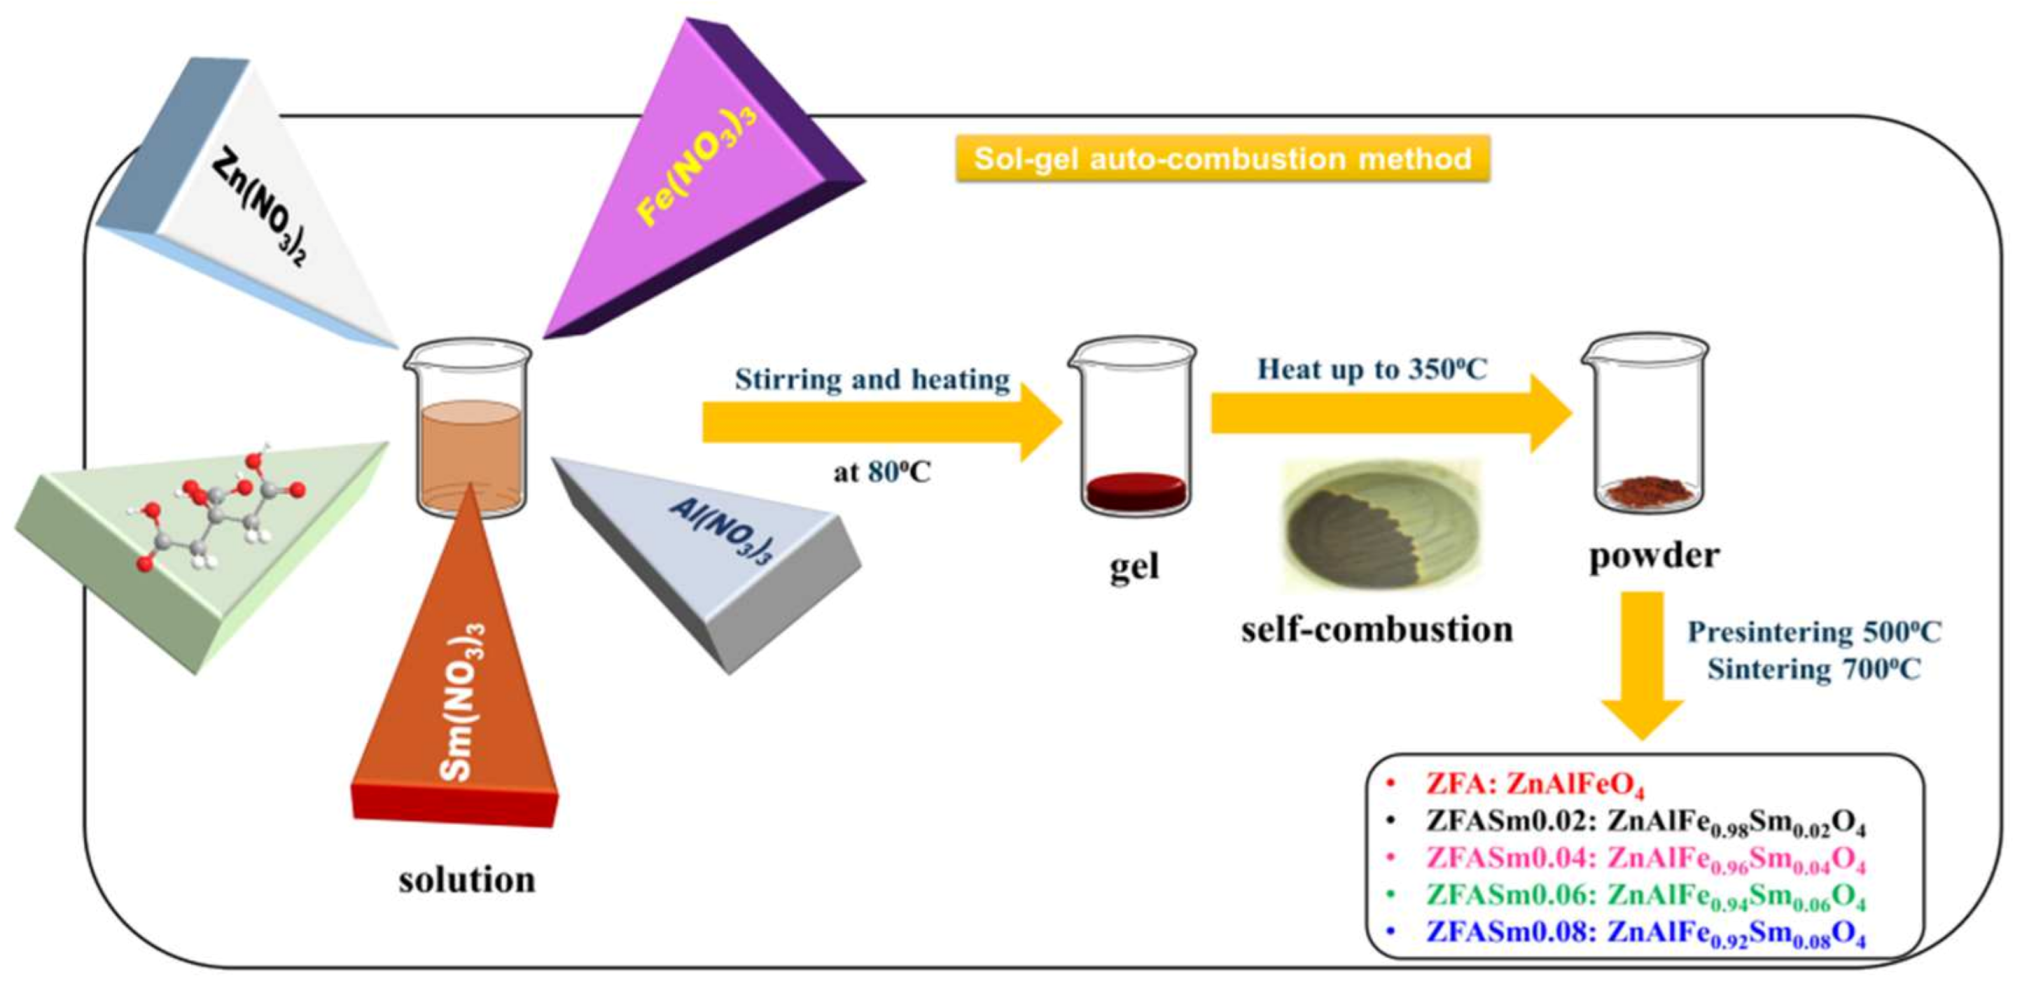
3.1. Photocatalyst Synthesis

Zinc ferrite nanoparticles substituted with aluminium and doped with samarium cations with the formula ZnAlFe1−xSmxO4 (x = 0.02, 0.04, 0.06, 0.08) were obtained via the sol–gel autocombustion technique using citric acid as fuel. Likewise, the undoped ZnAlFeO4 (x = 0) sample was prepared for comparison. Analytical reagent-graded zinc nitrate (Zn(NO3)2·6H2O), aluminium nitrate (Al(NO3)3·9H2O), iron nitrate (Fe(NO3)3·9H2O), and samarium nitrate (Sm(NO3)3·6H2O) and citric acid (C6H8O7·H2O) were used, as purchased from Sigma-Aldrich, to obtain the ferrite samples. First, stoichiometric mixtures of the metal nitrate solutions were prepared. Second, each sample of the metal nitrate combination was mixed with a solution of citric acid in a 1:1 molar ratio of combustion agent to metallic cations. The mixtures were heated at 80 °C in a water bath to produce viscous gels. In order to provoke self-ignition, the gels were progressively heated up to 350 °C in a sand bath. The resulting powders underwent two stages of thermal treatment, including pre-sinterization at 500 °C for five hours and sinterization at 700 °C for five hours.
The obtained samples were denoted as ZFA, ZFASm0.02, ZFASm0.04, ZFASm0.06, and ZFASm0.08, respectively, after the cation initials present in the system and the samarium content. For a better understanding, a synthesis flowchart is provided in Scheme 1.

3.2. Photocatalyst Characterization

Structural characterization of the ferrites heated at 7000 C was performed by recording the powder X-ray diffraction (XRD) patterns on a Rigaku Miniflex 600 diffractometer (Rigaku Corporation, Tokio, Japan) using CuKα emission in a 2θ range 20–80°, with a scanning step of 0.01° and a recording rate of 1°/min.
The formation of spinel structure at 7000 C was observed by infrared spectroscopy using a Bruker Vertex 70 FTIR spectrometer (Ettlingen, Germany) using the KBr pellets technique, at room temperature, with a resolution of 2 cm−1. The spectra were recorded in a range of 4000–400 cm−1.
The morphology and microstructure of photocatalysts were investigated using a Transmission Electron Microscope (TEM) Hitachi High-Tech HT7700 (Hitachi High Technologies Corporation, Tokyo, Japan), operated in high-contrast mode at 100 kV accelerating voltage. Samples were prepared by dispersion in acetone, ultrasonication for 30 min, drop casting on 300 mesh, Ted Pella carbon-coated copper grids, and drying in a vacuum at 60 °C.
Magnetic measurements were performed on a (vibrating sample magnetometer) VSM LakeShore 8607 system (Lake Shore Cryotronics, Westerville, OH, USA) at room temperature. The samples were demagnetized in the alternating field before the experiment.
Textural characteristics of the synthesized materials were determined by registering nitrogen adsorption–desorption isotherms on an NOVA 2200e Quantachrome instrument (Quantachrome instruments, Boynton Beach, FL, USA), working at N2 liquefaction temperature of −196 °C. Before measurements, each sample was outgassed at room temperature for two hours, for the purpose of emptying the pores from physically adsorbed molecules. The obtained data allowed us to calculate the specific surface area by applying BET theory (Brunauer–Emmet–Teller) for the isotherm region of P/P0 = 0.05–0.35. Moreover, the BJH (Barrett–Joyner–Halenda) equation was used to draw the pore-size distributions, and the total pore volume was calculated by considering the volume of nitrogen adsorbed on the material’s surface at a relative pressure of 0.95 P/P0.
The optical behaviour of ZFA and Sm-doped ZFA samples was investigated through DRS technique (Diffuse Reflectance Spectroscopy) by recording UV-Vis spectra on a Schimadzu UV-2450 spectrophotometer (Kyoto, Japan) equipped with an integrating sphere to measure the reflectance of the solid sample. All samples were compacted into pellets using MgO as white standard. The remission function of Kubelka–Munk was applied to registered optical absorption spectra, and direct and indirect band gap energies were determined using Equation (7):
F R = 1 R 2 2 R = k S = A c S
where k is the Kubelka–Munk absorption coefficient, S is the scattering coefficient, R is the reflectance, c is the concentration of the absorbing species, and A is the absorbance.

3.3. Photocatalytic Activity Evaluation

The photodegradation under UV-Vis light of Evans Blue (T-1824) dye, as provided by Sigma-Aldrich, was studied in this work.
A medium-pressure Hg lamp was placed in the centre of a cylindrical photoreactor and used for the photodegradation of Evans Blue. In order to maintain the temperature at 25 °C during the reaction, the lamp was placed inside a recirculating water jacket. For a typical photocatalytic run, 600 mL of 10 mg L−1 Evans Blue solution was placed in the cylindrical photoreactor and then 0.45 g of spinel ferrite photocatalyst, in powder form, was added under continuous stirring. After 30 min of magnetic stirring in the dark, to achieve adsorption–desorption equilibrium at a constant temperature, the suspension was exposed to irradiation. This moment was considered as zero time for all photodegradation experiments. Stirring was continued throughout the irradiation process to keep the mixture suspended. At time intervals of 5, 10, 15, 30, 45, 60, 90, 120, 150, 180, 210, and 240 min, analytical samples were extracted from the photoreactor in order to evaluate the change in the concentration of each irradiated solution by measuring the absorbance in a range of 300–800 nm for Evans blue, using a Hitachi U-2910 Spectrophotometer (Hitachi High Technologies Corporation, Tokyo, Japan). The estimated absorbance of Evans Blue solutions at 606 nm was used to calculate the organic pollutant concentration. For comparison purposes, an experiment without a photocatalyst was performed respecting the previous protocol.

4. Conclusions

In this study, the efficiency of zinc aluminium ferrite and samarium-doped zinc aluminium ferrite, with the chemical formula ZnAlFe1−xSmxO4 (x = 0, 0.02, 0.04, 0.06, 0.08), as photocatalysts for the degradation of a dangerous organic pollutant such as Evans Blue was examined. The sol–gel autocombustion preparation technique successfully allowed for the insertion of aluminium cations into the zinc ferrite spinel structure, as well as the incorporation of Sm cations into the spinel unit cell of the aluminium-substituted zinc ferrite, as proven by XRD and FTIR analysis. TEM analysis showed a decrease in particle sizes with samarium doping, but no strict correlation between samarium content and grain sizes was found. Magnetic characterization of the materials indicated the paramagnetic behaviour, for all studied samples, with zero intrinsic coercivity and zero remanent magnetization.
The photodegradation of Evans Blue was successfully achieved by using the studied photocatalysts. The samarium-doped photocatalysts were clearly more active than the un-doped material, demonstrating the positive impact of Sm3+ presence in the spinel structure on the photocatalysts. The photocatalytic performances followed the same trend as the lattice parameter, interplanar distance, and particle-size values. Thus, the sample with the chemical formula ZnAlFe0.94Sm0.06O4 was the most active by far. The intensification of the photocatalytic process was realized by adding hydrogen (H2O2) peroxide to the system and by varying the best catalyst dose in the frame of the optimization procedure based on a central composite experimental design of the face-centred type. The obtained results revealed an increase in pseudo-first-order reaction rate constant of about 16-times using hydrogen peroxide as a photodegradation reaction booster.

Author Contributions

Conceptualization, P.S. and C.C.; methodology, P.S., C.C., I.G., M.I. and P.P; software, C.C. and I.-A.D.; validation, P.S., C.C. and V.H.; investigation, I.G., P.S., C.C., P.P., M.I. and I.-A.D.; resources, P.S. and V.H.; writing—original draft preparation, P.S., C.C., I.G., M.I. and P.P.; writing—review and editing, P.S., C.C. and V.H.; supervision, V.H.; project administration, P.S and C.C.; funding acquisition, P.S. All authors have read and agreed to the published version of the manuscript.

Funding

This work was supported by a grant from the Ministry of Research, Innovation and Digitization, CNCS-UEFISCDI, project number PN-III-P1-1.1-TE-2021-0030, within PNCDI III.

Data Availability Statement

Not applicable.

Conflicts of Interest

The authors declare no conflict of interest.

References

  1. Soufi, A.; Hajjaoui, H.; Elmoubarki, R.; Abdennouri, M.; Qourzal, S.; Barka, N. Spinel ferrites nanoparticles: Synthesis methods and application in heterogeneous Fenton oxidation of organic pollutants—A review. Appl. Surf. Sci. Adv. 2021, 6, 100145. [Google Scholar] [CrossRef]
  2. Gong, L.; Chen, G.; Lv, J.; Lu, M.; Zhang, J.; Wu, X.; Wang, J. Phase transition-enabled MnFe2O4 nanoparticles modulated by high-pressure with enhanced electrical transport properties. Appl. Surf. Sci. 2021, 565, 150532. [Google Scholar] [CrossRef]
  3. Anila, I.; Mathew, M.J. Study on the physico-chemical properties, magnetic phase resolution and cytotoxicity behavior of chitosan-coated cobalt ferrite nanocubes. Appl. Surf. Sci. 2021, 556, 149791. [Google Scholar] [CrossRef]
  4. Samoila, P.; Cojocaru, C.; Mahu, E.; Ignat, M.; Harabagiu, V. Boosting catalytic wet-peroxide-oxidation performances of cobalt ferrite by doping with lanthanides for organic pollutants degradation. J. Environ. Chem. Eng. 2021, 9, 104961. [Google Scholar] [CrossRef]
  5. Samoila, P.; Cojocaru, C.; Cretescu, I.; Stan, C.D.; Nica, V.; Sacarescu, L.; Harabagiu, V. Nanosized spinel ferrites synthesized by sol-gel autocombustion for optimized removal of azo dye from aqueous solution. J. Nanomater. 2015, 2015, 713802. [Google Scholar] [CrossRef] [Green Version]
  6. Kefeni, K.K.; Mamba, B.B. Photocatalytic application of spinel ferrite nanoparticles and nanocomposites in wastewater treatment: Review. Sustain. Mater. Technol. 2019, 23, e00140. [Google Scholar] [CrossRef]
  7. Hcini, F.; Hcini, S.; Alzahrani, B.; Zemni, S.; Bouazizi, M.L. Effects of sintering temperature on structural, infrared, magnetic and electrical properties of Cd0.5Zn0.5FeCrO4 ferrites prepared by sol–gel route. J. Mater. Sci. Mater. Electron. 2020, 31, 14986–14997. [Google Scholar] [CrossRef]
  8. Sharma, A.; Harmanpreet, H. Influence of different substitution metal ion on magnetic properties of Mn-Zn ferrite. Mater. Today Proc. 2020, 37, 3058–3060. [Google Scholar] [CrossRef]
  9. Borhan, A.I.; Samoila, P.; Hulea, V.; Iordan, A.R.; Palamaru, M.N. Effect of Al3+ substituted zinc ferrite on photocatalytic degradation of Orange I azo dye. J. Photochem. Photobiol. A. 2014, 279, 17–23. [Google Scholar] [CrossRef]
  10. Pham, T.N.; Huy, T.Q.; Le, A.-T. Spinel ferrite (AFe2O4)-based heterostructured designs for lithium-ion battery, environmental monitoring, and biomedical applications. RSC Adv. 2020, 10, 31622–31661. [Google Scholar] [CrossRef]
  11. Amiri, M.; Salavati-Niasari, M.; Akbari, A. Magnetic nanocarriers: Evolution of spinel ferrites for medical applications. Adv. Colloid Interface Sci. 2019, 265, 29–44. [Google Scholar] [CrossRef]
  12. Wu, K.; Li, J.; Zhang, C. Zinc ferrite based gas sensors: A review. Ceram. Int. 2019, 45, 11143–11157. [Google Scholar] [CrossRef]
  13. Sharma, S.S.; Dutta, V.; Raizada, P.; Hosseini-Bandegharaei, A.; Thakur, V.; Nguyen, V.-H.; Vanle, Q.; Singh, P. An overview of heterojunctioned ZnFe2O4 photocatalyst for enhanced oxidative water purification. J. Environ. Chem. Eng. 2021, 9, 105812. [Google Scholar] [CrossRef]
  14. Katrapally, V.K.; Bhavani, S.D. Impact of calcination temperature on structural and optical properties of erbium-doped zinc ferrite nanoparticles. Phase Transit. 2022, 95, 770–785. [Google Scholar] [CrossRef]
  15. Qin, M.; Shuai, Q.; Wu, G.; Zheng, B.; Wang, Z.; Wu, H. Zinc ferrite composite material with controllable morphology and its applications. Mater. Sci. Eng. B 2017, 224, 125–138. [Google Scholar] [CrossRef]
  16. Samoila, P.; Cojocaru, C.; Sacarescu, L.; Dorneanu Pascariu, P.; Domocos, A.A.; Rotaru, A. Remarkable catalytic properties of rare-earth doped nickel ferrites synthesized by sol-gel auto-combustion with maleic acid as fuel for CWPO of dyes. Appl. Catal. B Environ. 2017, 202, 21–32. [Google Scholar] [CrossRef]
  17. Zhang, J.; Song, J.-M.; Niu, H.-L.; Mao, C.-J.; Zhang, S.-Y.; Shen, Y.-H. ZnFe2O4 nanoparticles: Synthesis, characterization, and enhanced gas sensing property for acetone. Sens. Actuators B Chem. 2015, 221, 55–62. [Google Scholar] [CrossRef] [Green Version]
  18. Ignat, M.; Samoila, P.; Cojocaru, C.; Sacarescu, L.; Harabagiu, V. Novel Synthesis Route for Chitosan-Coated Zinc Ferrite Nanoparticles as Potential Sorbents for Wastewater Treatment (Chitosan-ZnFe2O4 Sorbent for Wastewater Treatment). Chem. Eng. Commun. 2016, 203, 1591–1599. [Google Scholar] [CrossRef]
  19. Shannon, R.D. Revised effective ionic radii and systematic studies of interatomic distances in halides and chalcogenides. Acta Cryst. 1976, A32, 751–767. [Google Scholar] [CrossRef]
  20. Samoila, P.; Sacarescu, L.; Borhan, A.I.; Timpu, D.; Grigoras, M.; Lupu, N.; Zaltariov, M.; Harabagiu, V. Magnetic properties of nanosized Gd doped Ni-Mn-Cr ferrites prepared using the sol-gel autocombustion technique. J. Magn. Magn. Mater. 2015, 378, 92–97. [Google Scholar] [CrossRef]
  21. Slimani, Y.; Almessiere, M.A.; Guner, S.; Aktas, B.; Shirsath, S.E.; Silibin, M.V.; Trukhanov, A.V.; Baykal, A. Impact of Sm3+ and Er3+ cations on the structural, optical, and magnetic traits of spinel cobalt ferrite nanoparticles: Comparison investigation. ACS Omega 2022, 7, 6292–6301. [Google Scholar] [CrossRef] [PubMed]
  22. Xavier, S.; Thankachan, S.; Jacob, B.P.; Mohammed, E.M. Effect of samarium substitution on the structural and magnetic properties of nanocrystalline cobalt ferrite. J. Nanosci. 2013, 524380, 524380. [Google Scholar] [CrossRef] [Green Version]
  23. Borhan, A.I.; Iordan, A.R.; Palamaru, M.N. Correlation between structural, magnetic and electrical properties of nanocrystalline Al3+ substituted zinc ferrite. Mater. Res. Bull. 2013, 48, 2549–2556. [Google Scholar] [CrossRef]
  24. Hajdu, V.; Muránszky, G.; Nagy, M.; Kopcsik, E.; Kristály, F.; Fiser, B.; Viskolcz, B.; Vanyorek, L. Development of high-efficiency, magnetically separable palladium-decorated manganese-ferrite catalyst for nitrobenzene hydrogenation. Int. J. Mol. Sci. 2022, 23, 6535. [Google Scholar] [CrossRef]
  25. Kumar, N.H.; Ravinder, D.; Edukondalu, A. Effect of Ce3+ ion doped Ni-Zn Ferrites: Structural, Optical and Low temperature Magnetic Properties. Chin. J. Phys. 2022, 81, 171–180. [Google Scholar] [CrossRef]
  26. Naik, P.P.; Tangsali, R.B.; Meena, S.S.; Yusuf, S.M. Influence of rare earth (Nd3+) doping on structural and magnetic properties of nanocrystalline manganese-zinc ferrite. Mater. Chem. Phys. 2017, 191, 215–224. [Google Scholar] [CrossRef]
  27. Amri, N.; Massoudi, J.; Nouri, K.; Triki, M.; Dhahri, E.; Bessais, L. Influence of neodymium substitution on structural, magnetic and spectroscopic properties of Ni–Zn– Al nano-ferrites. RSC Adv. 2021, 11, 13256–13268. [Google Scholar] [CrossRef]
  28. Kanagesan, S.; Hashim, M.; Aziz, S.A.B.; Ismail, I.; Tamilselvan, S.; Alitheen, N.B.; Swamy, M.K.; Rao, B.P.C. Evaluation of Antioxidant and Cytotoxicity Activities of Copper Ferrite (CuFe2O4) and Zinc Ferrite (ZnFe2O4) Nanoparticles Synthesized by Sol Gel Self-Combustion Method. Appl. Sci. 2016, 6, 184. [Google Scholar] [CrossRef]
  29. Singh, J.P.; Dixit, G.; Srivastava, R.C.; Negi, P.; Agrawal, H.M.; Kumar, R. HRTEM and FTIR investigation of nanosized zinc ferrite irradiated with 100 MeV oxygen ions. Spectrochim. Acta A Mol. Biomol. Spectrosc. 2013, 107, 326–333. [Google Scholar] [CrossRef]
  30. Ochmann, M.; Vrba, V.; Kopp, J.; Ingr, T.; Malina, O.; Machala, L. Microwave-enhanced crystalline properties of zinc ferrite nanoparticles. Nanomaterials 2022, 12, 2987. [Google Scholar] [CrossRef]
  31. Xiang, Q.-Y.; Wu, D.; Bai, Y.; Yan, K.; Yao, W.-Q.; Zhang, L.; Zhang, J.; Cao, J.-L. Atomic hydrogenation-induced paramagnetic-ferromagnetic transition in zinc ferrite. Ceram. Int. 2016, 42, 16882–16887. [Google Scholar] [CrossRef]
  32. Thommes, M.; Kaneko, K.; Neimark, A.V.; Olivier, J.P.; Rodriguez-Reinoso, F.; Rouquerol, J.; Sing, K.S.W. Physisorption of gases, with special reference to the evaluation of surface area and pore size distribution (IUPAC Technical Report). Pure Appl. Chem. 2015, 87, 1051–1069. [Google Scholar] [CrossRef] [Green Version]
  33. Thommes, M.; Cychosz, K.A. Physical adsorption characterization of nanoporous materials: Progress and challenges. Adsorption 2014, 20, 233–250. [Google Scholar] [CrossRef]
  34. Adarsha, J.R.; Ravishankar, T.N.; Manjunatha, C.R.; Ramakrishnappa, T. Green synthesis of nanostructured calcium ferrite particles and its application to photocatalytic degradation of Evans blue dye. Mater. Today Proc. 2022, 49, 777–788. [Google Scholar] [CrossRef]
  35. Jinendra, U.; Bilehal, D.; Nagabhushana, B.M.; Jithendra Kumara, K.M.; Kollur, S.P. Nano-catalytic behavior of highly efficient and regenerable mussel-inspired Fe3O4@CFR@GO and Fe3O4@CFR@TiO2 magnetic nanospheres in the reduction of Evans blue dye. Heliyon 2021, 7, e06070. [Google Scholar] [CrossRef]
  36. Perniss, A.; Wolf, A.; Wichmann, L.; Schönberger, M.; Althaus, M. Evans Blue is not a suitable inhibitor of the epithelial sodium channel d-subunit. Biochem. Biophys. Res. Commun. 2015, 466, 468–474. [Google Scholar] [CrossRef]
  37. Bezerra, M.A.; Santelli, R.E.; Oliveira, E.P.; Villar, L.S.; Escaleira, L.A. Response surface methodology (RSM) as a tool for optimization in analytical chemistry. Talanta 2008, 76, 965–977. [Google Scholar] [CrossRef]
  38. Mäkelä, M. Experimental design and response surface methodology in energy applications: A tutorial review. Energy Convers. Manage. 2017, 151, 630–640. [Google Scholar] [CrossRef]
  39. Rao, S.S. Engineering Optimization: Theory and Practice, 4th ed.; John Wiley and Sons: Hoboken, NJ, USA, 2009; pp. 63–75. [Google Scholar]
Figure 1. XRD patterns of ZnAlFe1−xSmxO4 (x = 0, 0.02, 0.04, 0.06, 0.08) photocatalysts compared to the standard XRD pattern of ZnFe2O4 (JCPDS card No. 22-1012).
Catalysts 13 00266 g001
Figure 2. FTIR spectra of ZnAlFe1−xSmxO4 (x = 0, 0.02, 0.04, 0.06, 0.08) photocatalysts.
Catalysts 13 00266 g002
Figure 3. Representative TEM micrographs (left) and particle-size distributions (right) of ZnAlFe1−xSmxO4 (x = 0, 0.02, 0.04, 0.06, 0.08) photocatalysts.
Catalysts 13 00266 g003
Figure 4. Hysteresis loops recorded at room temperature for ZnAlFe1−xSmxO4 (x = 0, 0.02, 0.04, 0.06, 0.08) photocatalysts.
Catalysts 13 00266 g004
Figure 5. N2-sorption isotherms (a) and corresponding pore-size distributions (b) for ZnAlFe1−xSmxO4 (x = 0, 0.02, 0.04, 0.06, 0.08) photocatalysts.
Catalysts 13 00266 g005
Figure 6. Direct band gap transition (a) and indirect band gap transition (b) in ZnAlFe1−xSmxO4 (x = 0, 0.02, 0.04, 0.06, 0.08) photocatalysts.
Catalysts 13 00266 g006
Figure 7. Spectral response of EB during photodegradation in the presence of samples (a) ZnAlFeO4 (ZFA), (b) ZnAlFe0.98Sm0.02O4 (ZFASm0.02), (c) ZnAlFe0.96Sm0.04O4 (ZFASm0.04), (d) ZnAlFe0.94Sm0.06O4 (ZFASm0.06), (e) ZnAlFe0.92Sm0.08O4 (ZFASm0.08), and (f) colour-removal efficiency after 1 h of photocatalytic reaction, in the presence of ZnAlFe1−xSmxO4 (x = 0, 0.02, 0.04, 0.06, 0.08) photocatalysts.
Catalysts 13 00266 g007
Figure 8. Kinetics of EB dye concentration decay versus irradiation time recorded during photolysis and photocatalysis processes under UV-Vis light; ZnAlFe1−xSmxO4 (x = 0, 0.02, 0.04, 0.06, 0.08) were used as photocatalysts; solid and dashed lines provide predictions according to PFO kinetic model; experimental conditions: catalyst dosage = 0.75 g/L; T = 25 ± 1 °C.
Catalysts 13 00266 g008
Figure 9. Agreement between experimental data and model predictions: (a) parity plot and (b) normal plot of residuals.
Catalysts 13 00266 g009
Figure 10. Response surface 3D plot (a) and contour-lines 2D map (b) showing the mutual effect of CatDose and (H2O2) factors on the estimated process response ( Y ^ , %).
Catalysts 13 00266 g010
Figure 11. Kinetics of photocatalytic degradation (UV-Vis light) of EB dye recorded under optimal conditions in the presence of ZnAlFe0.94Sm0.06O4 (sample ZFASm0.06); experimental conditions: CatDose = 0.765 g/L, (H2O2) = 0.077 M, and T = 25 ± 1 °C.
Catalysts 13 00266 g011
Scheme 1. A synthesis flowchart of ZnAlFe1−xSmxO4 (x = 0, 0.02, 0.04, 0.06, 0.08) photocatalysts.
Catalysts 13 00266 sch001
Table 1. Calculated data for ZnAlFe1−xSmxO4 (x = 0, 0.02, 0.04, 0.06, 0.08) photocatalysts.
Photocatalyst
Chemical Formula
CodeD (nm) 1a (Å) 1d311 (Å) 1 d ¯ (nm) 2SBET 3 (m2/g)Vtot 3 (cc/g)Dpore 3 (nm)
ZnAlFeO4ZFA13.008.24031.842326.615.0766.82 × 10−231.7
ZnAlFe0.98Sm0.02O4ZFASm0.0211.178.25011.844622.919.6259.49 × 10−221.5
ZnAlFe0.96Sm0.04O4ZFASm0.0410.348.24571.843420.926.5569.49 × 10−215.3
ZnAlFe0.94Sm0.06O4ZFASm0.0610.268.23591.841017.328.2399.20 × 10−214.7
ZnAlFe0.92Sm0.08O4ZFASm0.0810.048.25251.845319.434.6179.59 × 10−211.8
1 Data from XRD; 2 Data from TEM; 3 Data from N2 sorption.
Table 2. Kinetic parameters for EB dye photodegradation under UV-Vis light in the presence of catalytic materials ZnAlFe1−xSmxO4 (x = 0, 0.02, 0.04, 0.06, 0.08).
Photocatalyst
Code
Pseudo-First-Order
Reaction Rate Constant, k (min−1)
χ2-Test Value
na (photolysis)4.886 × 10−40.005
ZFA8.983 × 10−40.041
ZFASm0.022.275 × 10−30.234
ZFASm0.043.842 × 10−30.058
ZFASm0.066.014 × 10−30.154
ZFASm0.082.945 × 10−30.039
Table 3. Central composite design of face-centred type employed for experimentation.
RunCatalyst Dose (g/L)Concentration of Hydrogen Peroxide, (M = mol/L)Colour-Removal Efficiency (Response), Determined after 60 min Irradiation Time
Coded
x1
Actual
CatDose, g/L
Coded
x2
Actual
[H2O2], M
Y (%)
1−10.50−10.0029.55
2+11.00−10.0050.79
3−10.50+10.1091.44
4+11.00+10.1092.41
5−10.5000.0590.98
6+11.0000.0588.99
700.75−10.0049.69
800.75+10.1095.44
900.7500.0592.81
1000.7500.0593.75
1100.7500.0593.01
Table 4. Analysis of variance (ANOVA) for the multiple-regression model Y ^ x 1 , x 2 .
SourceDF 1SS 2MS 3F-value 4P-value 5R2 6Radj2 7
Model5476.6451095.3371.500.00010.9860.972
Residual76.59515.32
Total5553.2310
1 degree of freedom; 2 sum of squares; 3 mean square; 4 ratio between mean squares; 5 probability of randomness; 6 coefficient of determination; 7 adjusted coefficient of determination.
Disclaimer/Publisher’s Note: The statements, opinions and data contained in all publications are solely those of the individual author(s) and contributor(s) and not of MDPI and/or the editor(s). MDPI and/or the editor(s) disclaim responsibility for any injury to people or property resulting from any ideas, methods, instructions or products referred to in the content.

