


A New Ammonia Kinetic Model in Ru-Catalyzed Steam-Reforming Reaction Containing N2 in Natural Gas


Abstract
:1. Introduction
2. Results
2.1. Numerical Modeling
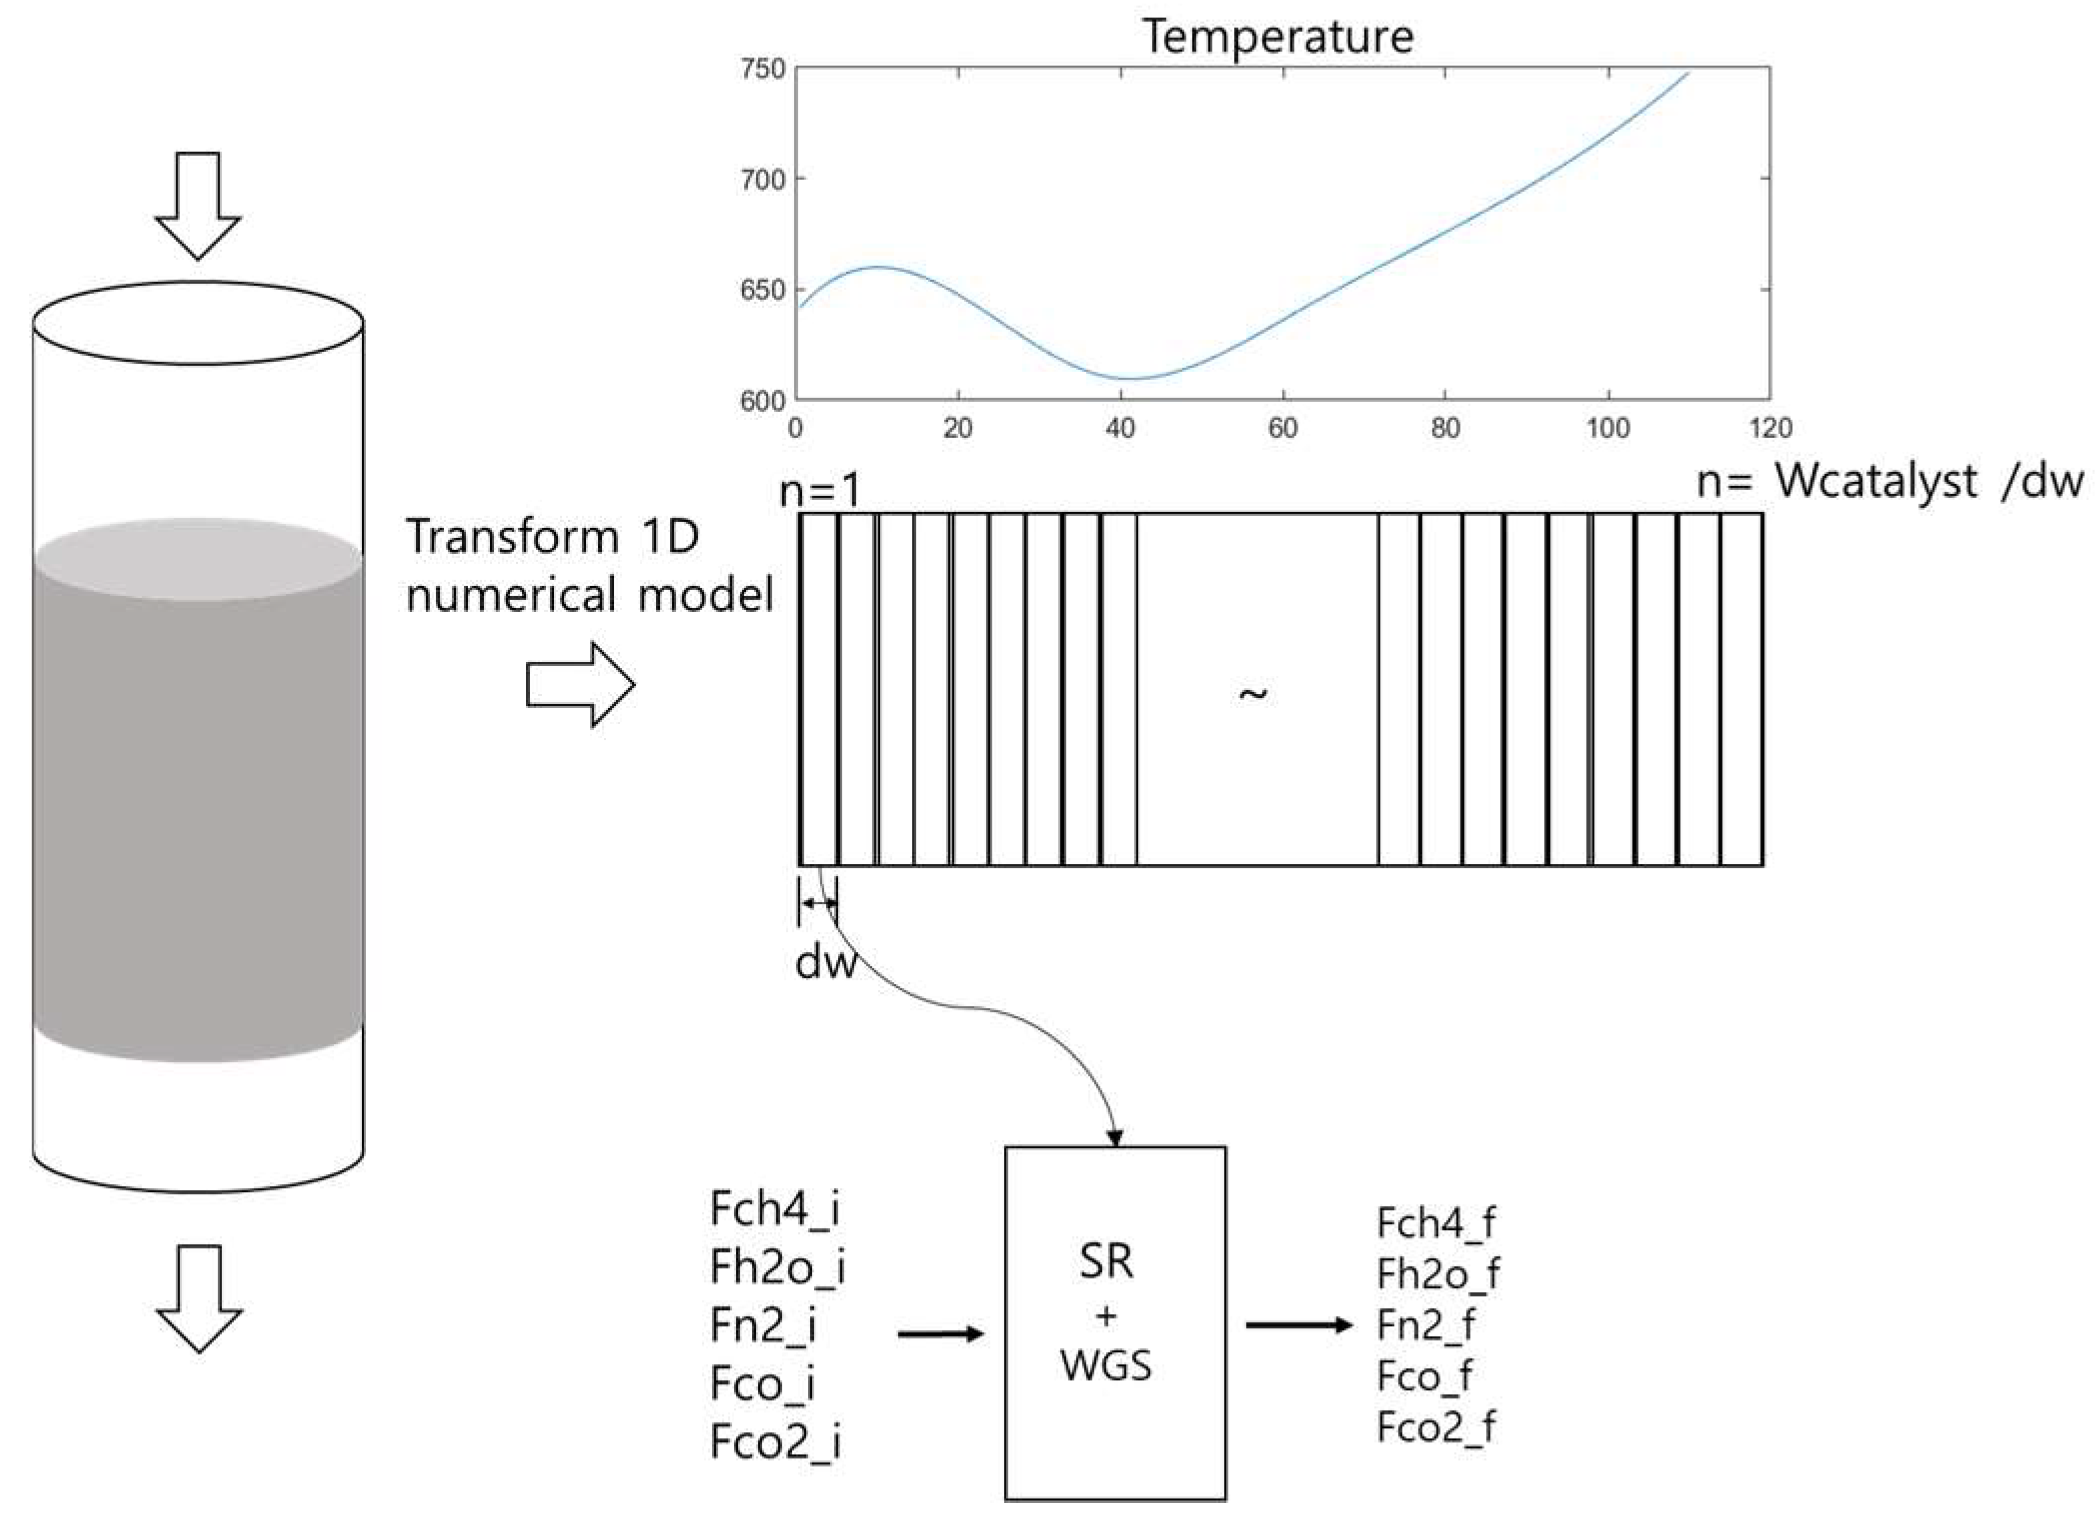
2.1.1. Steam-Reforming-Reactor Model
2.1.2. Ammonia-Formation Kinetic Model in the SR Reactor
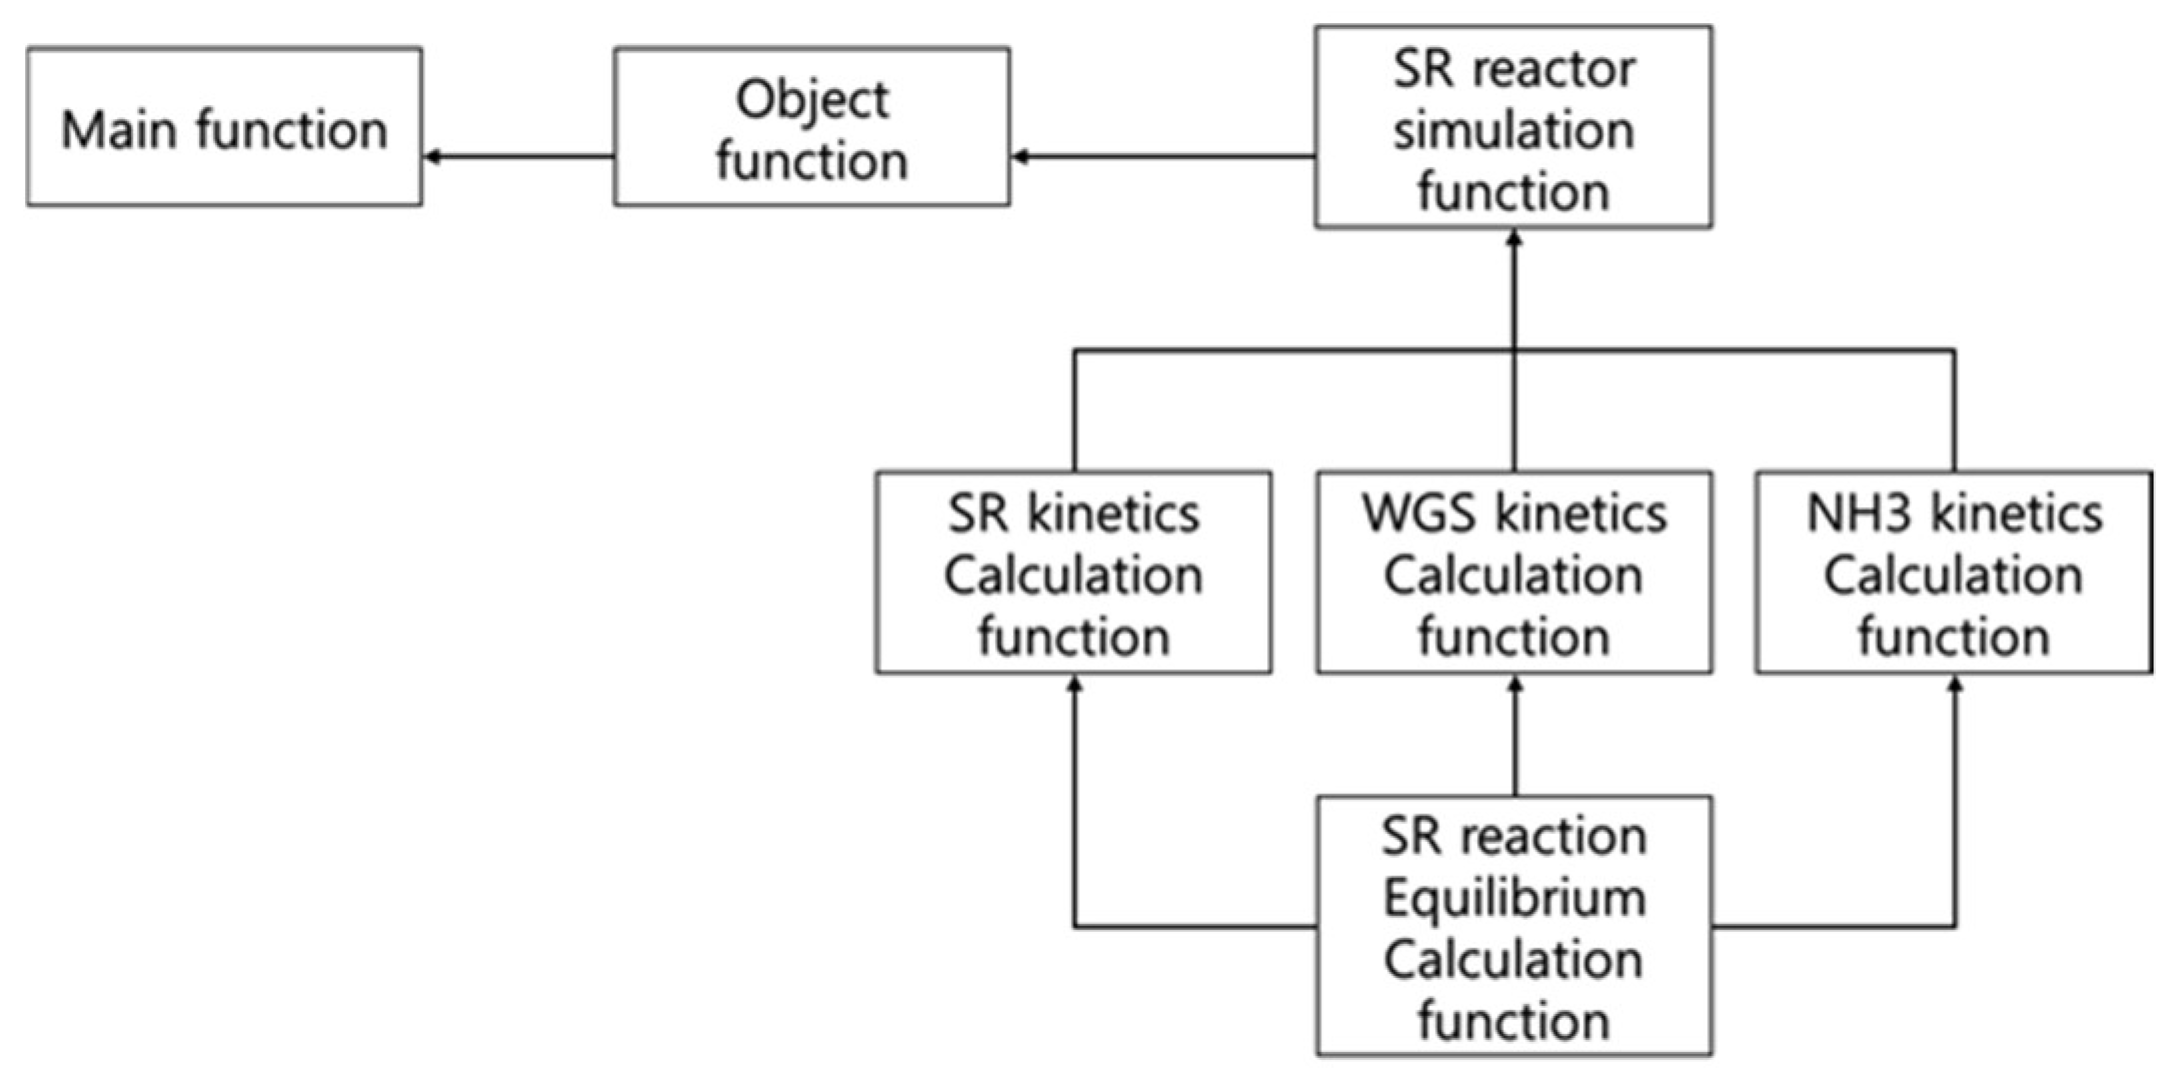
2.1.3. Numerical Models for Estimating Kinetic Parameters
3. Experimental Results
3.1. Steam-Reforming and Water-Gas-Shift Reactions
3.1.1. Experimental Results
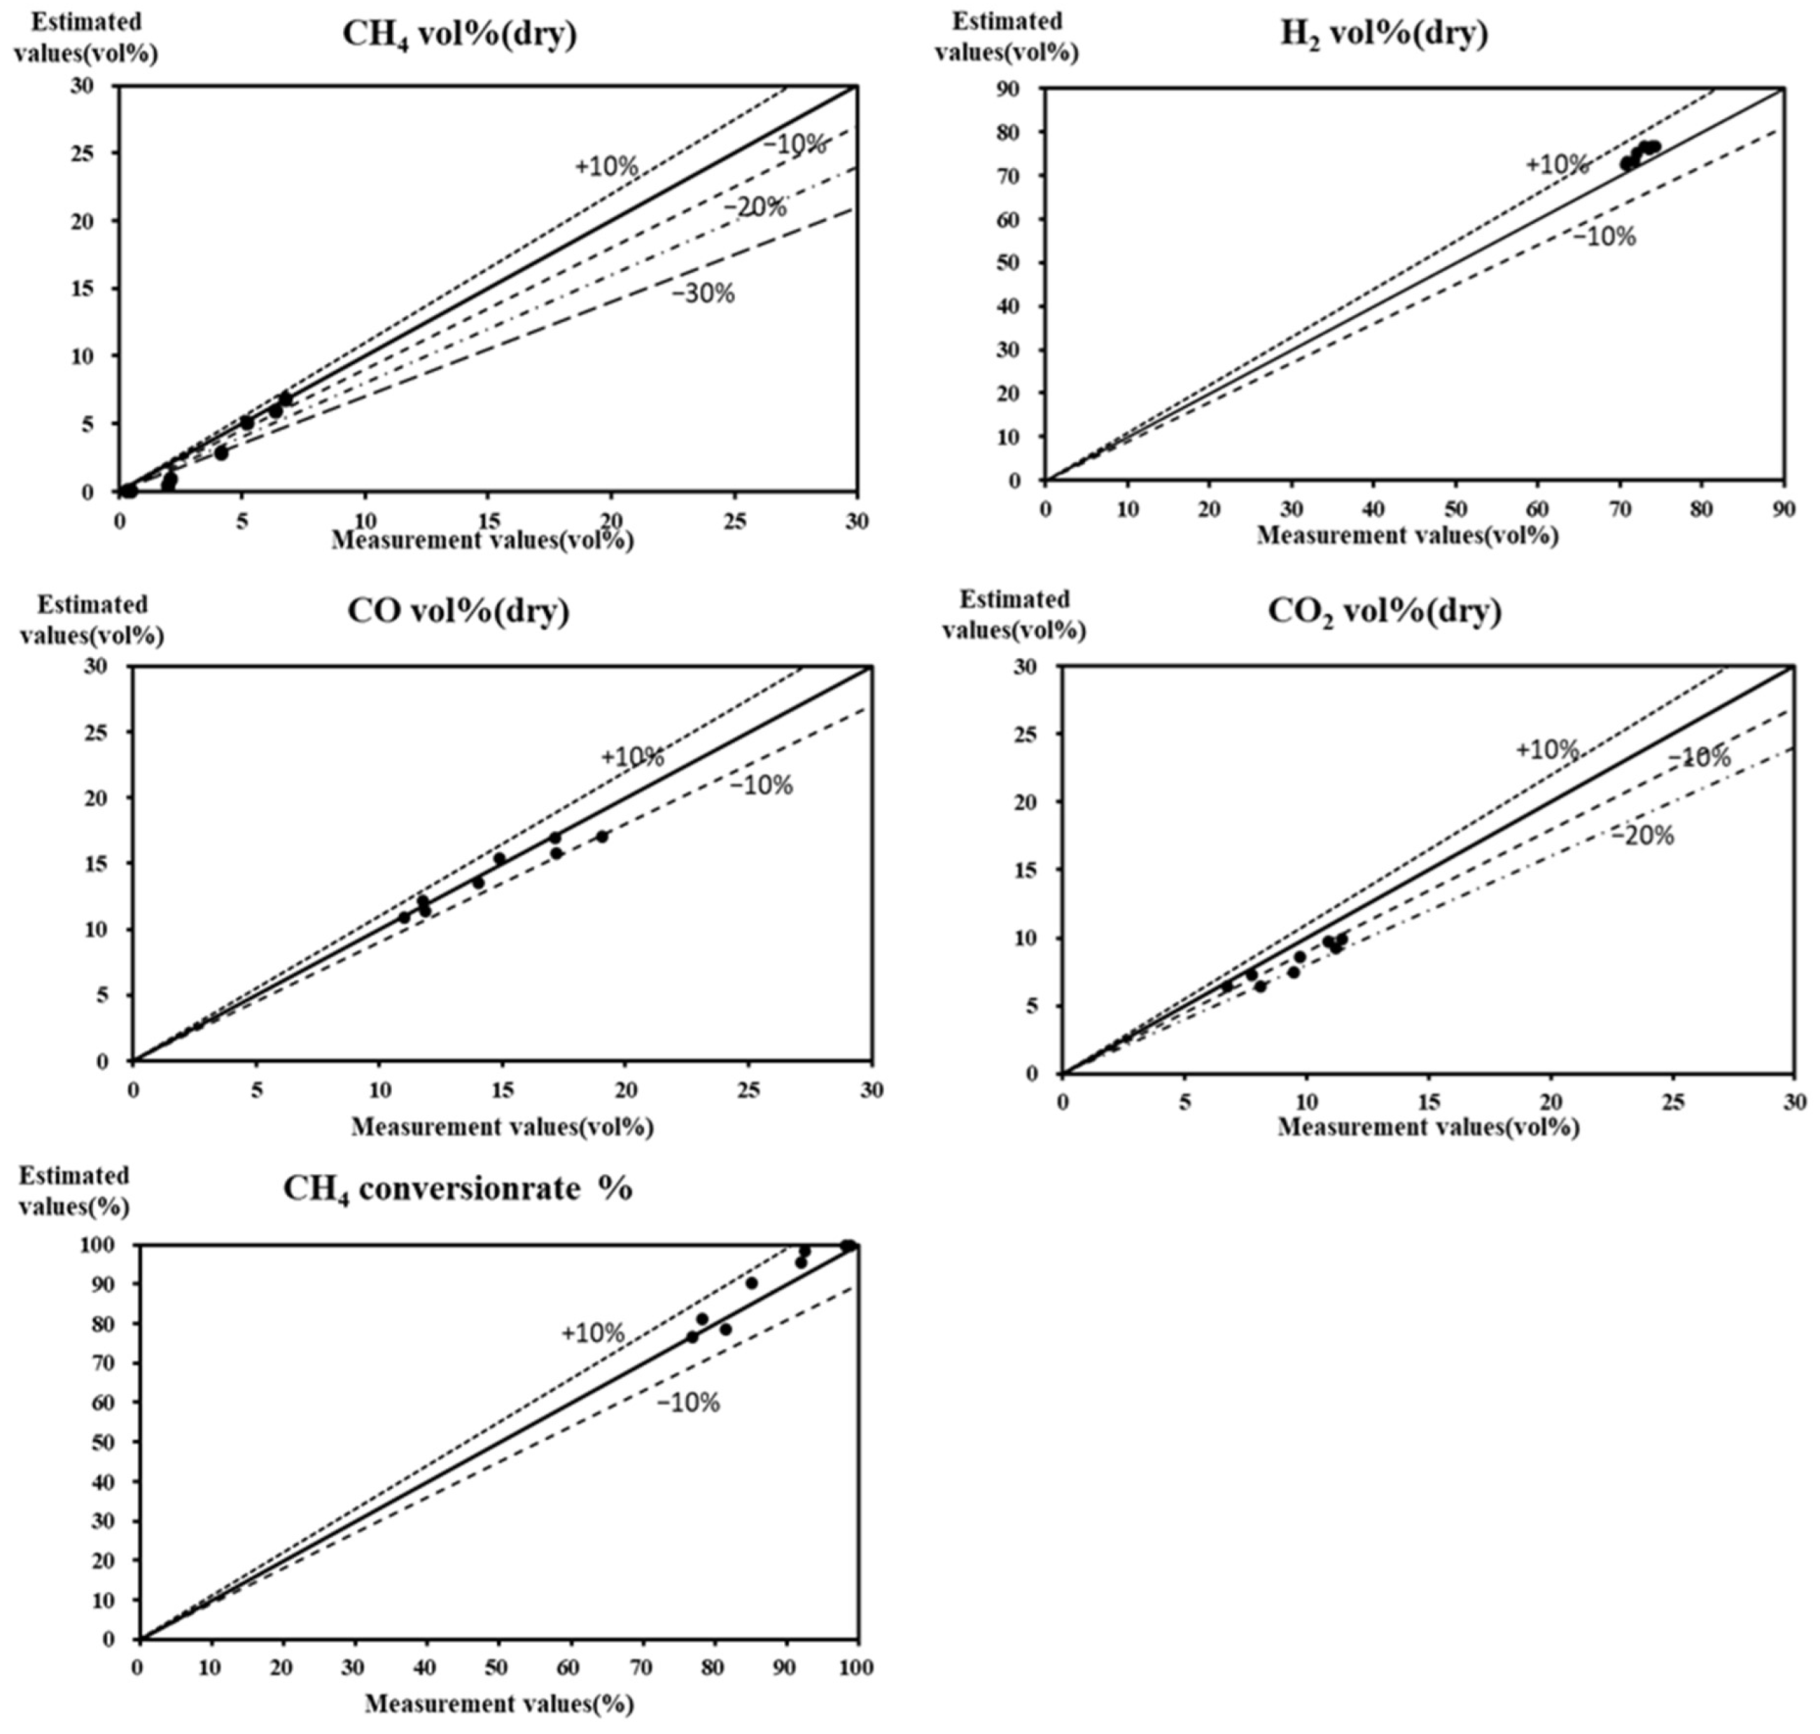
3.1.2. Calculation Results
3.2. NH3 Formation Reaction
3.2.1. Experimental Results
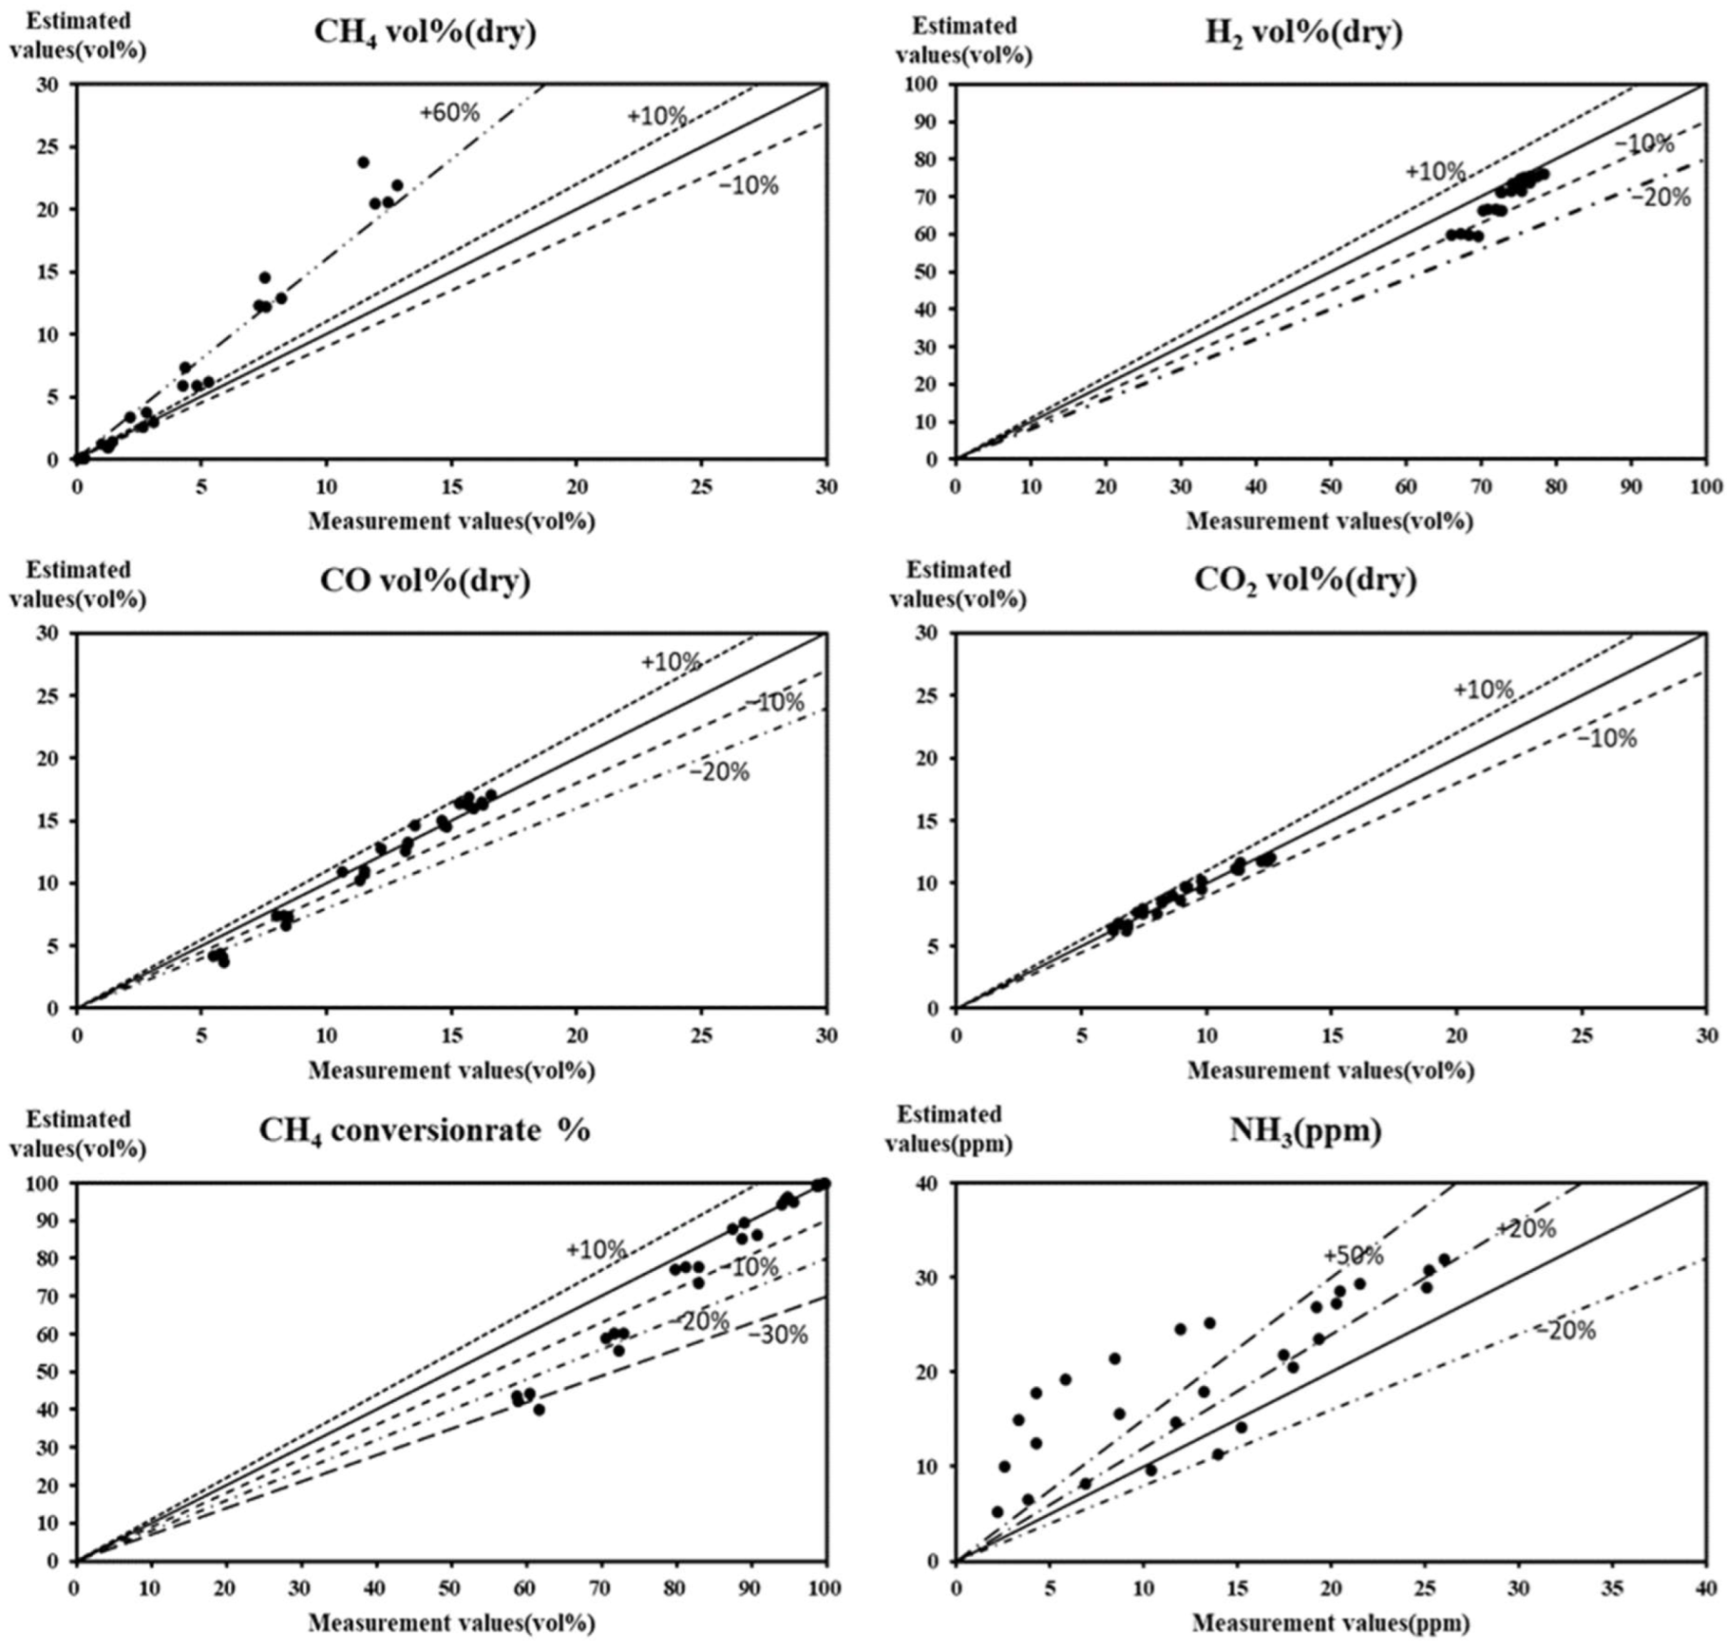
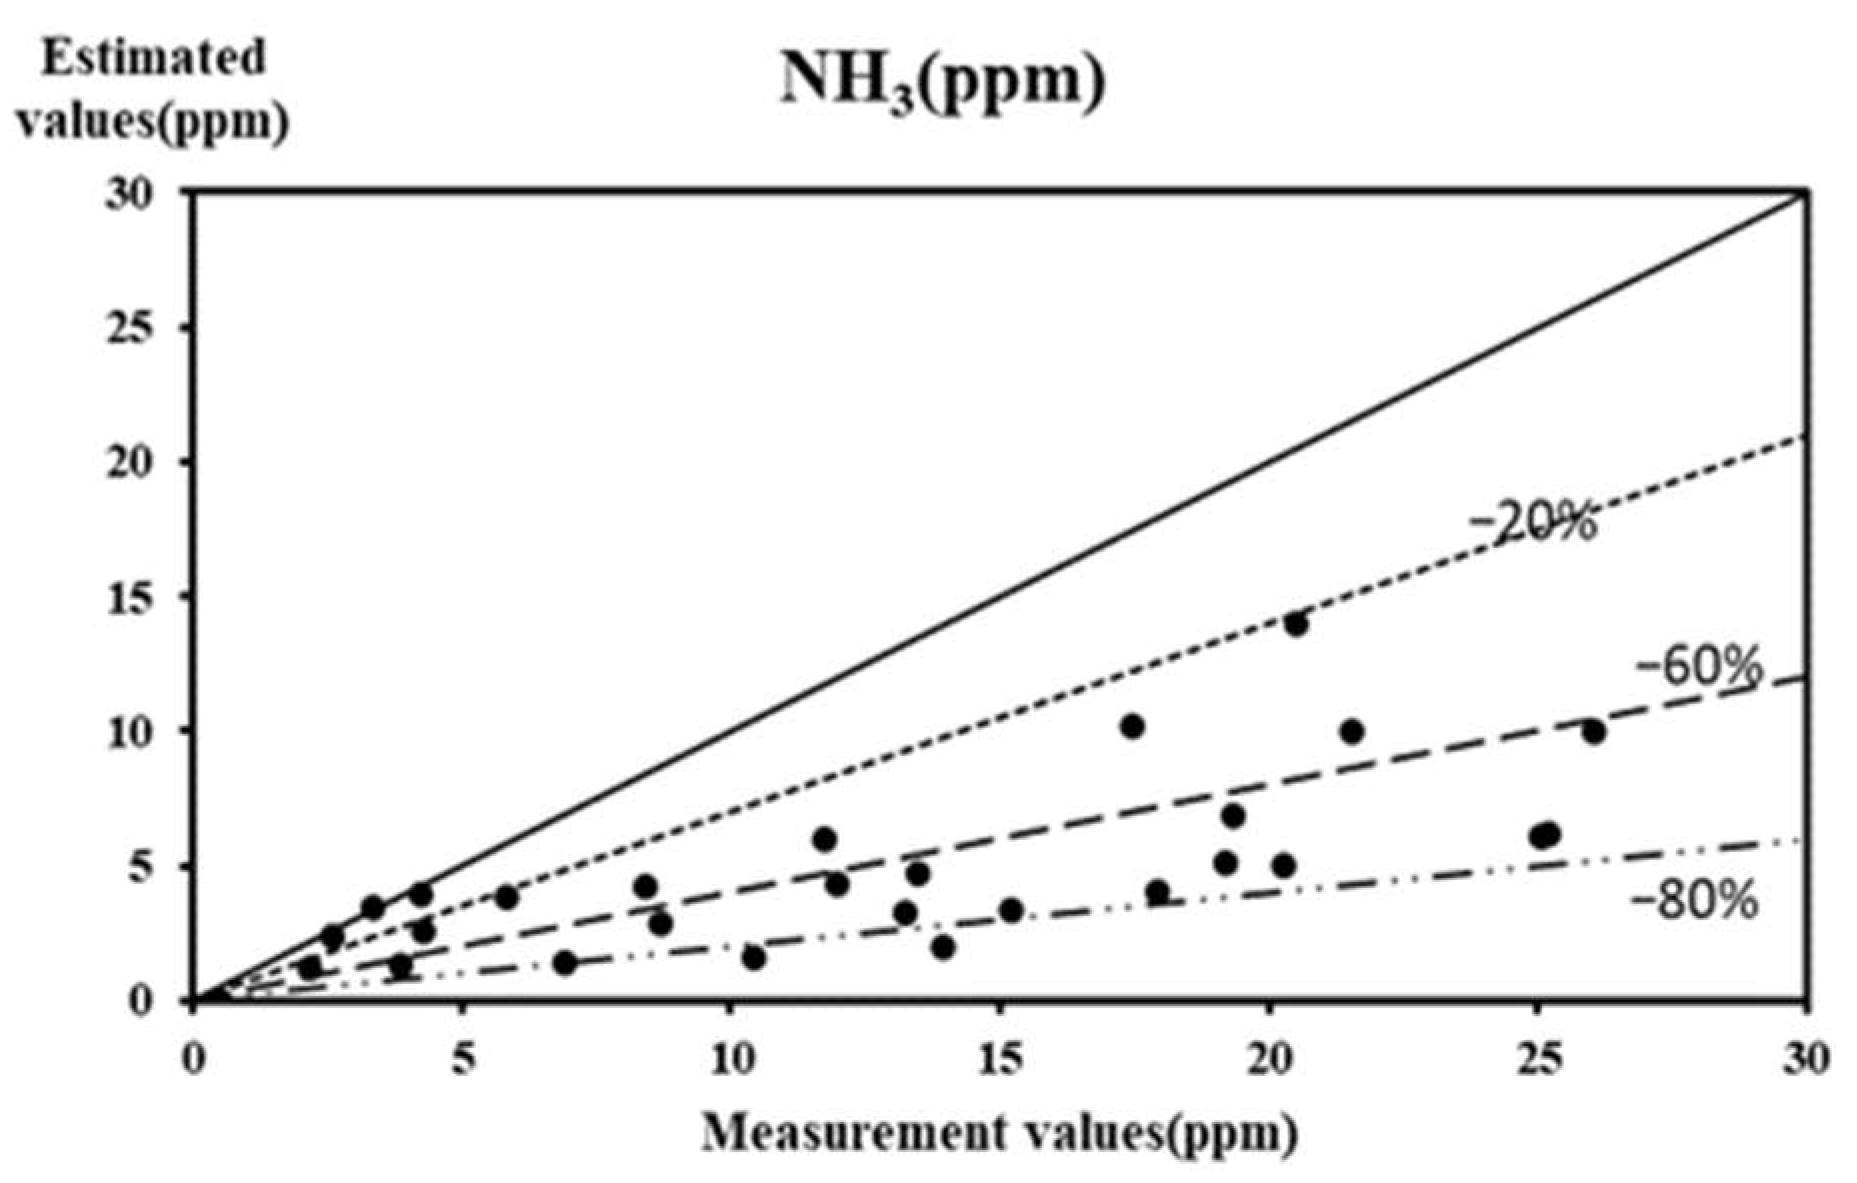
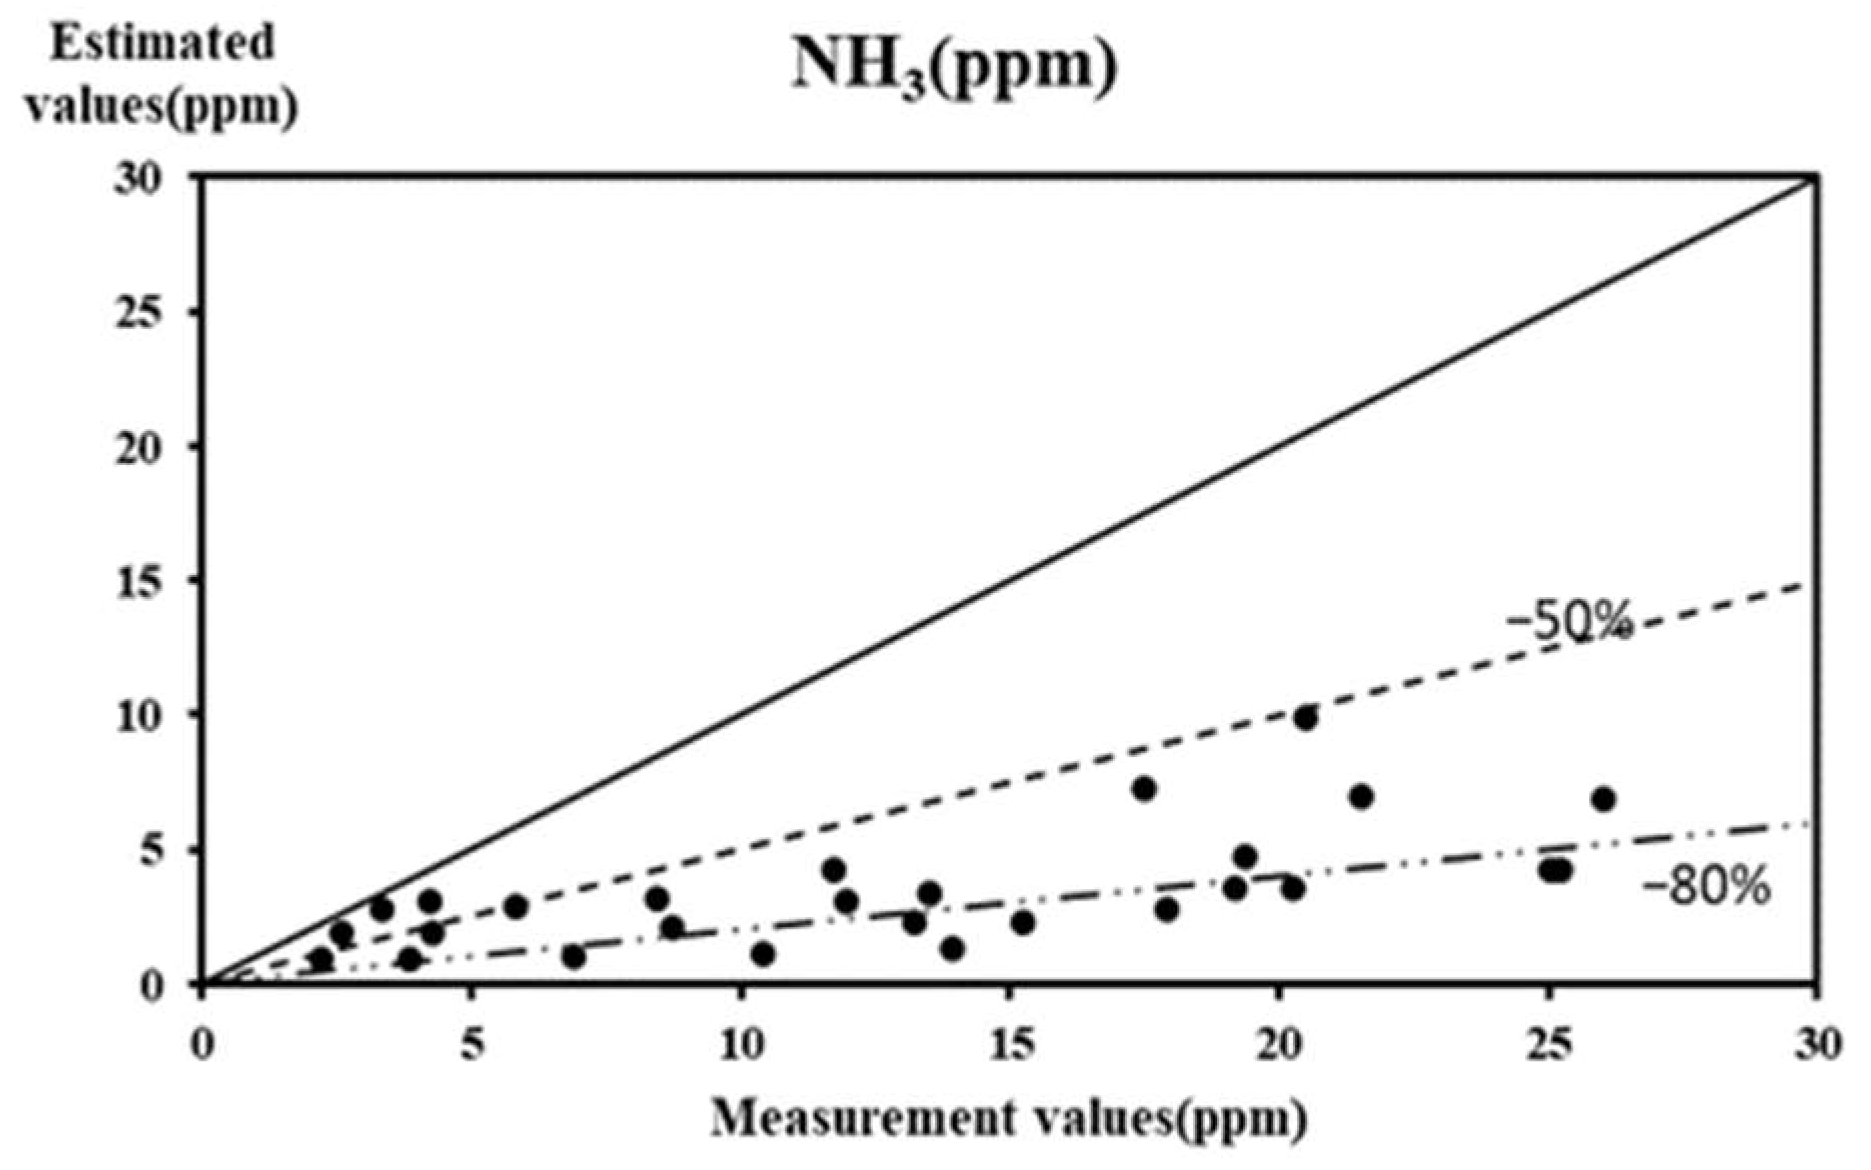
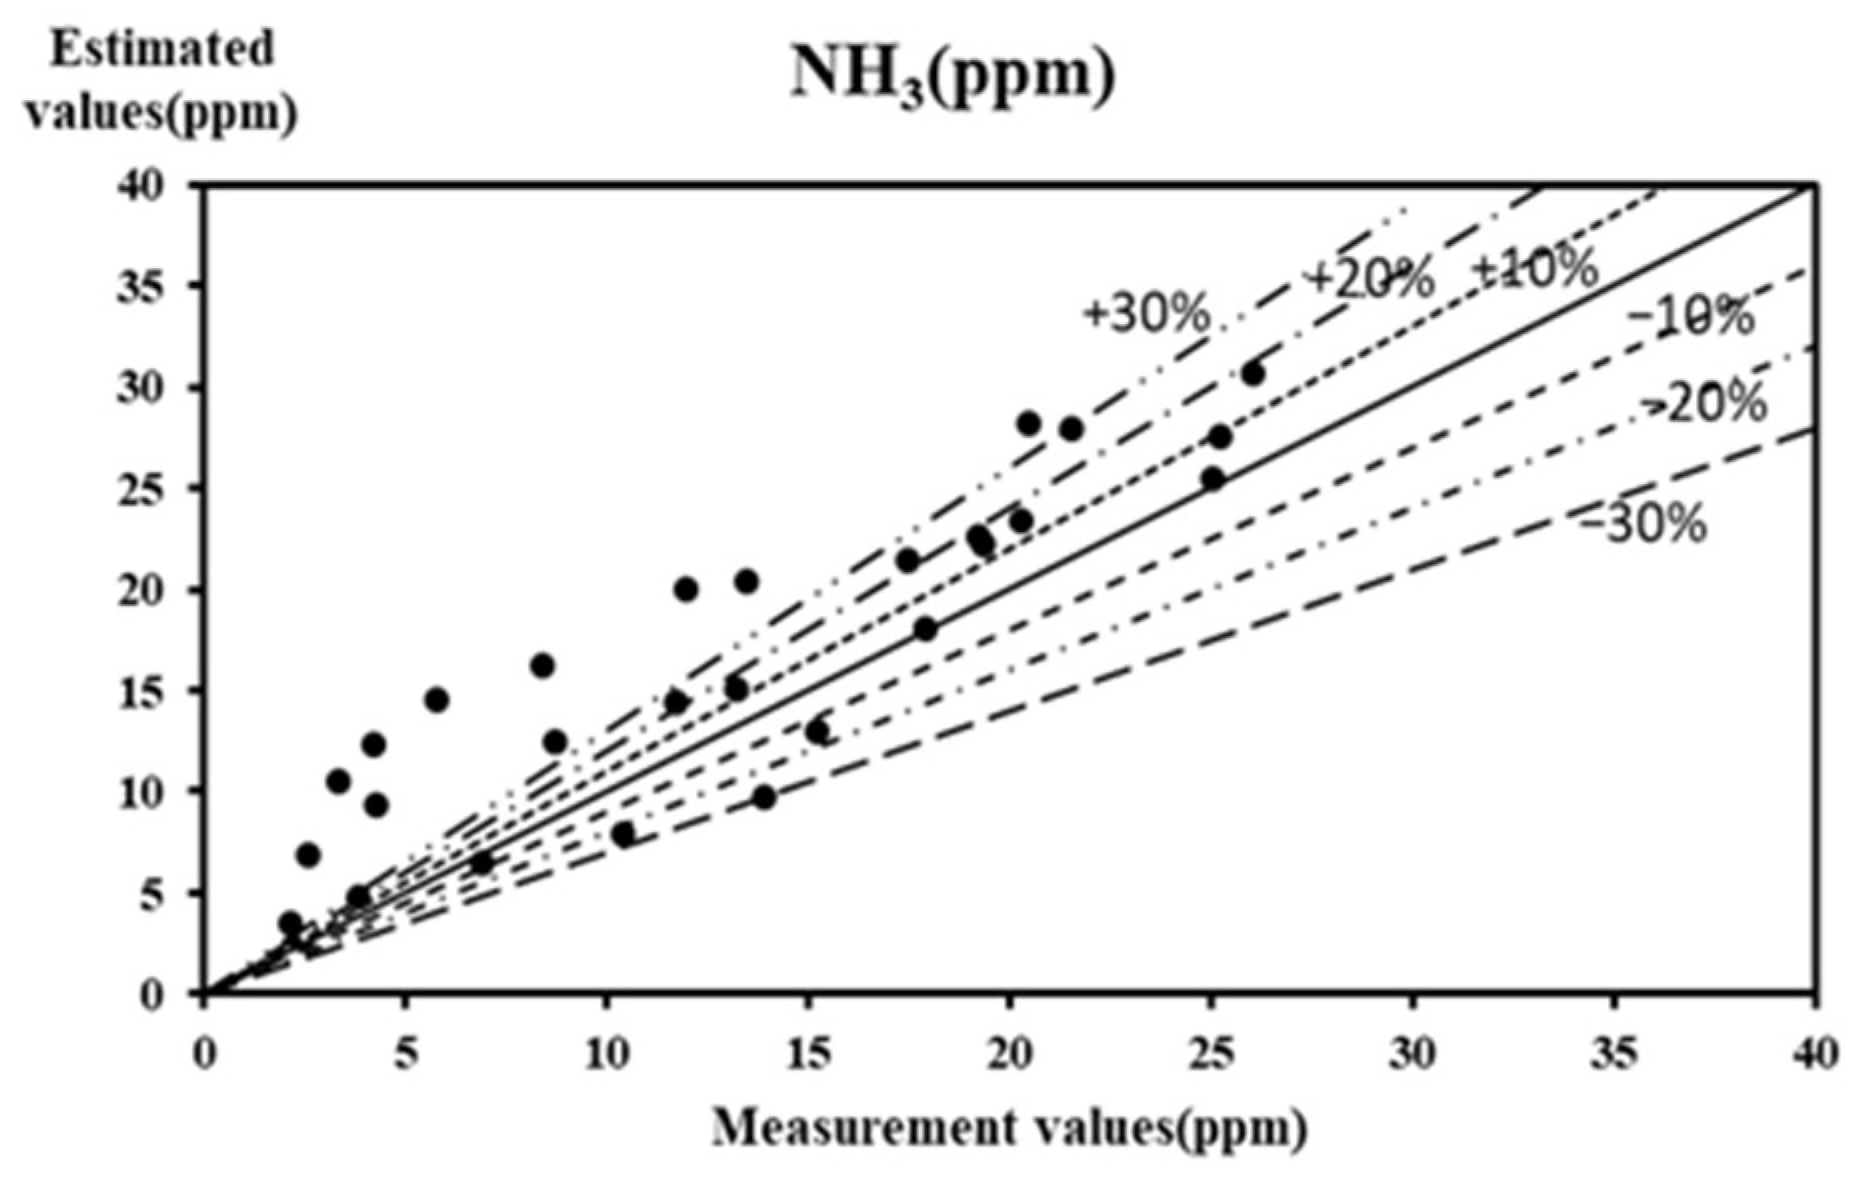
3.2.2. Comparison between Calculated Values and Measured Valued
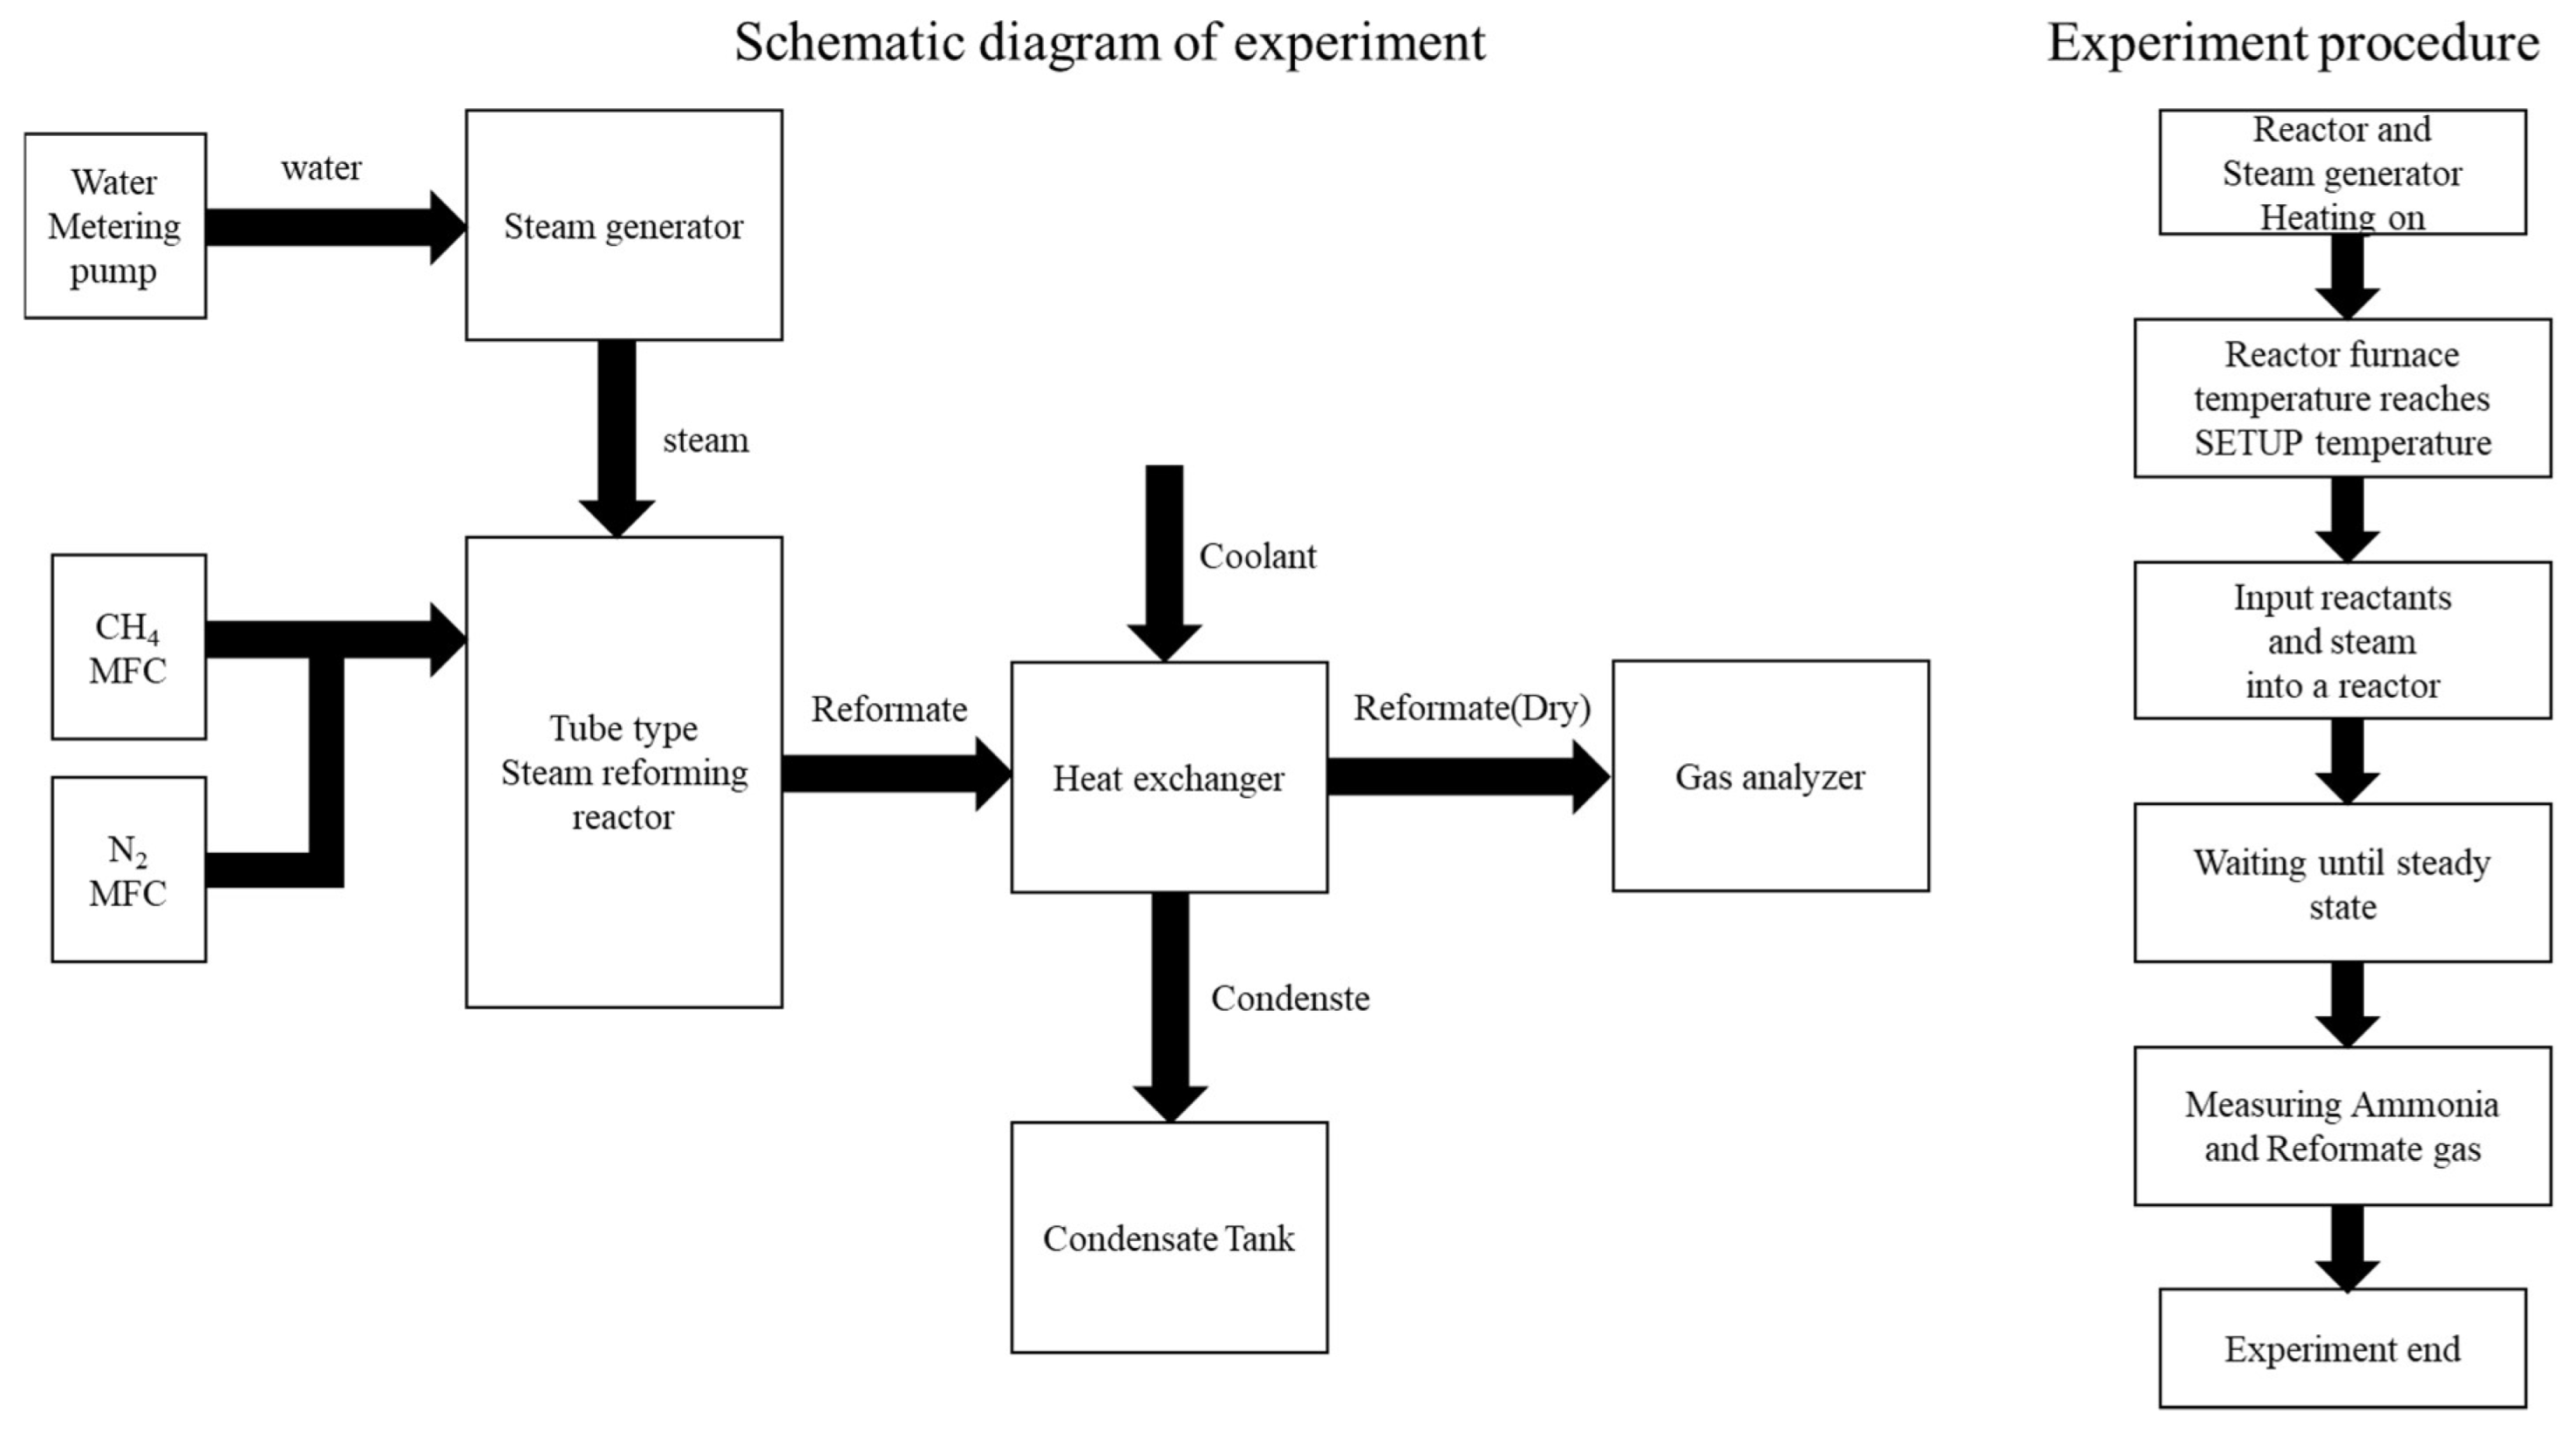
4. Experiments
5. Conclusions
Author Contributions
Funding
Data Availability Statement
Acknowledgments
Conflicts of Interest
References
- Mueller, F.; Jabbari, F.; Brouwer, J. On the intrinsic transient capability and limitations of solid oxide fuel cell systems. J. Power Sources 2009, 187, 452–460. [Google Scholar] [CrossRef]
- Ye, M.; Wang, X.; Xu, Y. Parameter identification for proton exchange membrane fuel cell model using particle swarm optimization. Int. J. Hydrogen Energy 2009, 34, 981–989. [Google Scholar] [CrossRef]
- Deng, Z.; Cao, H.; Li, X.; Jiang, J.; Yang, J.; Qin, Y. Generalized predictive control for fractional order dynamic model of solid oxide fuel cell output power. J. Power Sources 2010, 195, 8097–8103. [Google Scholar] [CrossRef]
- Larminie, J.; Dicks, A. Fuel Cell Systems Explained; John Wiley & Sons Ltd.: Chichester, UK, 2003; Volume 2. [Google Scholar]
- Suiso. Nenryou Denchi Handbook Henshu Iinlcai. Suiso. Nenryou Denchi Handbook; Ohmsha: Tokyo, Japan, 2006. [Google Scholar]
- Hashimasa, Y.; Matsuda, Y.; Imamura, D.; Akai, M. PEFC Power Generation Performance Degradation by Hydrogen Sulfide and Ammonia—Effects of Lowering Platinum Loading—. Electrochemistry 2011, 79, 343–345. [Google Scholar] [CrossRef]
- Watanabe, F.; Kaburaki, I.; Shimoda, N.; Satokawa, S. Influence of nitrogen impurity for steam methane reforming over noble metal catalysts. Fuel Process. Technol. 2016, 152, 15–21. [Google Scholar] [CrossRef]
- Jakobsen, J.G.; Jørgensen, T.L.; Chorkendorff, I.; Sehested, J. Steam and CO2 reforming of methane over a Ru/ZrO2 catalyst. Appl. Catal. A Gen. 2010, 377, 158–166. [Google Scholar] [CrossRef]
- Jakobsen, J.G.; Jakobsen, M.; Chorkendorff, I.; Sehested, J. Methane Steam Reforming Kinetics for a Rhodium-Based Catalyst. Catal. Lett. 2010, 140, 90–97. [Google Scholar] [CrossRef]
- Jones, G.; Jakobsen, J.G.; Shim, S.S.; Kleis, J.; Andersson, M.P.; Rossmeisl, J.; Abild-Pedersen, F.; Bligaard, T.; Helveg, S.; Hinnemann, B.; et al. First principles calculations and experimental insight into methane steam reforming over transition metal catalysts. J. Catal. 2008, 259, 147–160. [Google Scholar] [CrossRef]
- Mozdzierz, M.; Brus, G.; Sciazko, A.; Komatsu, Y.; Kimijima, S.; Szmyd, J.S. Towards a Thermal Optimization of a Methane/Steam Reforming Reactor. Flow Turbul. Combust 2016, 97, 171–189. [Google Scholar] [CrossRef]
- Na, W.; Gou, B. The efficient and economic design of PEM fuel cell systems by multi-objective optimization. J. Power Sources 2007, 166, 411–418. [Google Scholar] [CrossRef]
- Boudart, M. Kinetics and Mechanism of Ammonia Synthesis. Catal. Rev. 1981, 23, 1–15. [Google Scholar] [CrossRef]
- Aparicio, L.M.; Dumesic, J.A. Ammonia synthesis kinetics: Surface chemistry, rate expressions, and kinetic analysis. Top. Catal. 1994, 1, 233–252. [Google Scholar] [CrossRef]
- Rossetti, I.; Pernicone, N.; Ferrero, F.; Forni, L. Kinetic Study of Ammonia Synthesis on a Promoted Ru/C Catalyst. Ind. Eng. Chem. Res. 2006, 45, 4150–4155. [Google Scholar] [CrossRef]
- Ozaki, A.; Taylor, H.S.; Boudart, M. Kinetics and mechanism of the ammonia synthesis. Proc. R. Soc. Lond. A 1960, 258, 47–62. [Google Scholar] [CrossRef]
- Temkin, M.; Pyzhev, V. Kinetics of the synthesis of ammonia on promoted iron catalysts. Acta Physicochim. 1940, 12, 217–222. [Google Scholar]
- Zhu, J.; Cui, X.; Araya, S.S. Comparison between 1D and 2D numerical models of a multi-tubular packed-bed reactor for methanol steam reforming. Int. J. Hydrogen Energy 2022, 47, 22704–22719. [Google Scholar] [CrossRef]
- Sun, J.; DesJardins, J.; Buglass, J.; Liu, K. Noble metal water gas shift catalysis: Kinetics study and reactor design. Int. J. Hydrogen Energy 2005, 30, 1259–1264. [Google Scholar] [CrossRef]
- Rosowski, F.; Hornung, A.; Hinrichsen, O.; Herein, D.; Muhler, M.; Ertl, G. Ruthenium catalysts for ammonia synthesis at high pressures: Preparation, characterization, and power-law kinetics. Appl. Catal. A Gen. 1997, 151, 443–460. [Google Scholar] [CrossRef]


| Steam-Reforming Kinetics Parameters | |||||
|---|---|---|---|---|---|
| A1 (mol/g·h·bar) | E1 (kJ/mol) | Aco (bar−1) | ΔHco (kJ/mol) | AH (bar−1/2) | ΔHH (kJ/mol) |
| 4.39 × 10⁷ | 107.9 | 2.19 × 10⁻⁵ | −87.4 | 7.31 × 10⁻⁶ | −71 |
| Water–Gas-Shift Kinetics Parameters | |||||
| A (mol/m3.atm2.s) | E (kJ/mol) | Aco (atm−1) | ΔHco (kJ/mol) | AH2 (atm−1) | ΔHH2 (kJ/mol) |
| 2.00 × 10⁷ | 43 | 9.40 × 10⁻¹¹ | −100 | 1.10 × 10⁻¹⁰ | −90 |
| NH3 Kinetics Parameters | |
|---|---|
| A1 (mol/g·h·bar) | E1 (kJ/mol) |
| 5 | 80 |
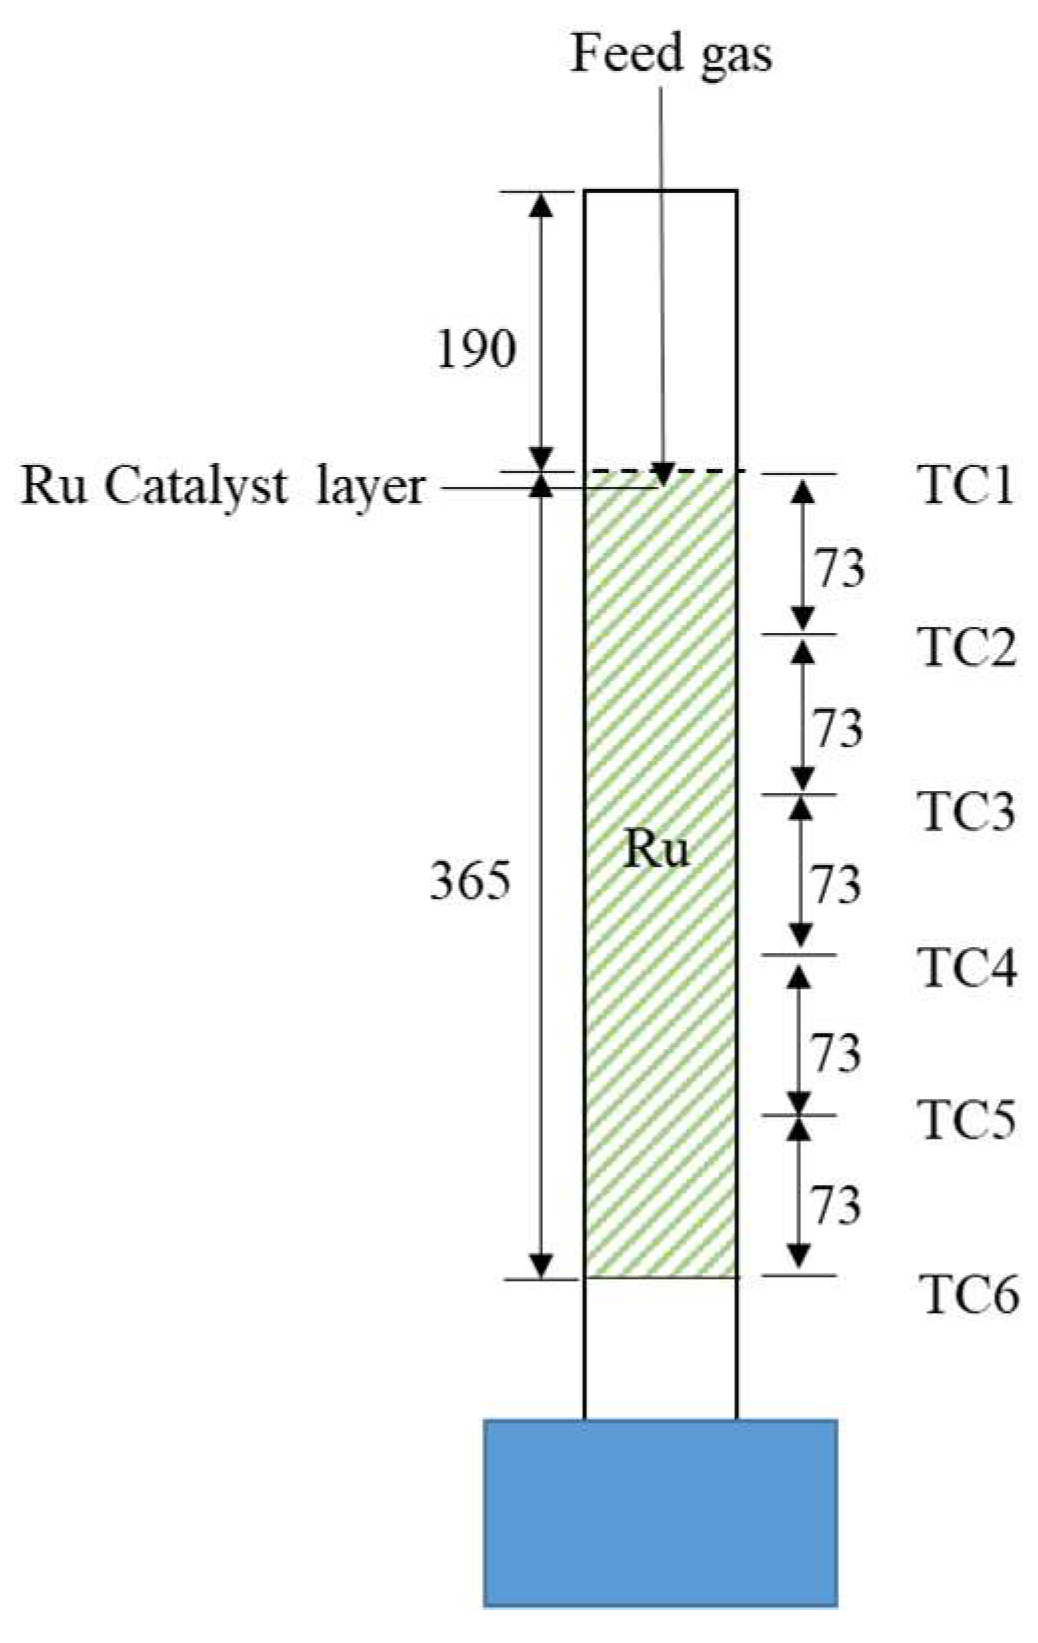
| Reactor-Surface-Temperature Measurements | ||||||
|---|---|---|---|---|---|---|
| Experiment No. | TC1 | TC2 | TC3 | TC4 | TC5 | TC6 |
| 1 | 416.103 | 427.890 | 490.712 | 541.452 | 614.178 | 688.963 |
| 2 | 421.888 | 428.360 | 488.376 | 537.954 | 610.327 | 686.980 |
| 3 | 402.377 | 439.223 | 508.940 | 561.301 | 637.521 | 715.646 |
| 4 | 403.623 | 436.523 | 504.549 | 554.959 | 627.075 | 705.193 |
| 5 | 427.960 | 469.278 | 535.604 | 591.280 | 675.579 | 761.531 |
| 6 | 432.481 | 453.047 | 530.301 | 586.076 | 665.849 | 757.463 |
| 7 | 444.038 | 487.878 | 560.254 | 621.675 | 723.599 | 824.274 |
| 8 | 453.183 | 470.034 | 555.041 | 613.283 | 708.914 | 819.654 |
| Measured Composition of the Reactor Outlet Gas (Dry Base) | |||||||
|---|---|---|---|---|---|---|---|
| Experiment No. | Furnace Setup Temp. | FCH4 (mol/) | CH4 (%) | H2 (%) | CO (%) | CO2 (%) | CH4 Conversion (%) |
| 1 | 500 | 2.6771 | 6.4341 | 71.7208 | 11.9954 | 11.0434 | 78.18 |
| 2 | 500 | 2.9449 | 6.8156 | 71.5951 | 11.1548 | 11.5788 | 76.92 |
| 3 | 520 | 2.6771 | 4.2164 | 73.0609 | 14.2023 | 9.8340 | 85.06 |
| 4 | 520 | 3.4803 | 5.2540 | 72.6521 | 11.8964 | 11.3181 | 81.56 |
| 5 | 550 | 2.6771 | 2.0439 | 74.2690 | 17.4827 | 7.8603 | 92.55 |
| 6 | 550 | 3.4803 | 2.1483 | 74.6066 | 15.0817 | 9.6202 | 91.99 |
| 7 | 580 | 2.6771 | 0.3226 | 75.3647 | 19.4244 | 6.8561 | 98.80 |
| 8 | 580 | 3.7480 | 0.4790 | 75.6000 | 17.4718 | 8.2331 | 98.17 |
| Steam-Reforming Kinetics Parameters | |||||
|---|---|---|---|---|---|
| A1 (mol/g.h.bar) | E1 (kJ/mol) | Aco (bar−1) | ΔHco (kJ/mol) | AH (bar−1/2) | ΔHH (kJ/mol) |
| 4.3785 × 10⁷ | 1.2768 × 10² | 9.0900 × 10⁻⁵ | −9.5343 × 101 | 6.7500 × 10⁻⁶ | −7.6548 × 101 |
| WGS Kinetics Parameters | |||||
| A (mol/m3.atm2.s) | E (kJ/mol) | Aco (atm−1) | ΔHco (kJ/mol) | AH2 (atm−1) | ΔHH2 (kJ/mol) |
| 1.9991 × 10⁷ | 4.2383 × 101 | 3.6400 × 10⁻¹¹ | −9.9403 × 101 | 3.6000 × 10⁻¹¹ | −8.8443 × 101 |
| Average Error (%) | ||||
|---|---|---|---|---|
| CH4 | H2 | CO | CO2 | CH4 Conversion Rate |
| 42.64 | 3.32 | 4.46 | 13.16 | 3.31 |
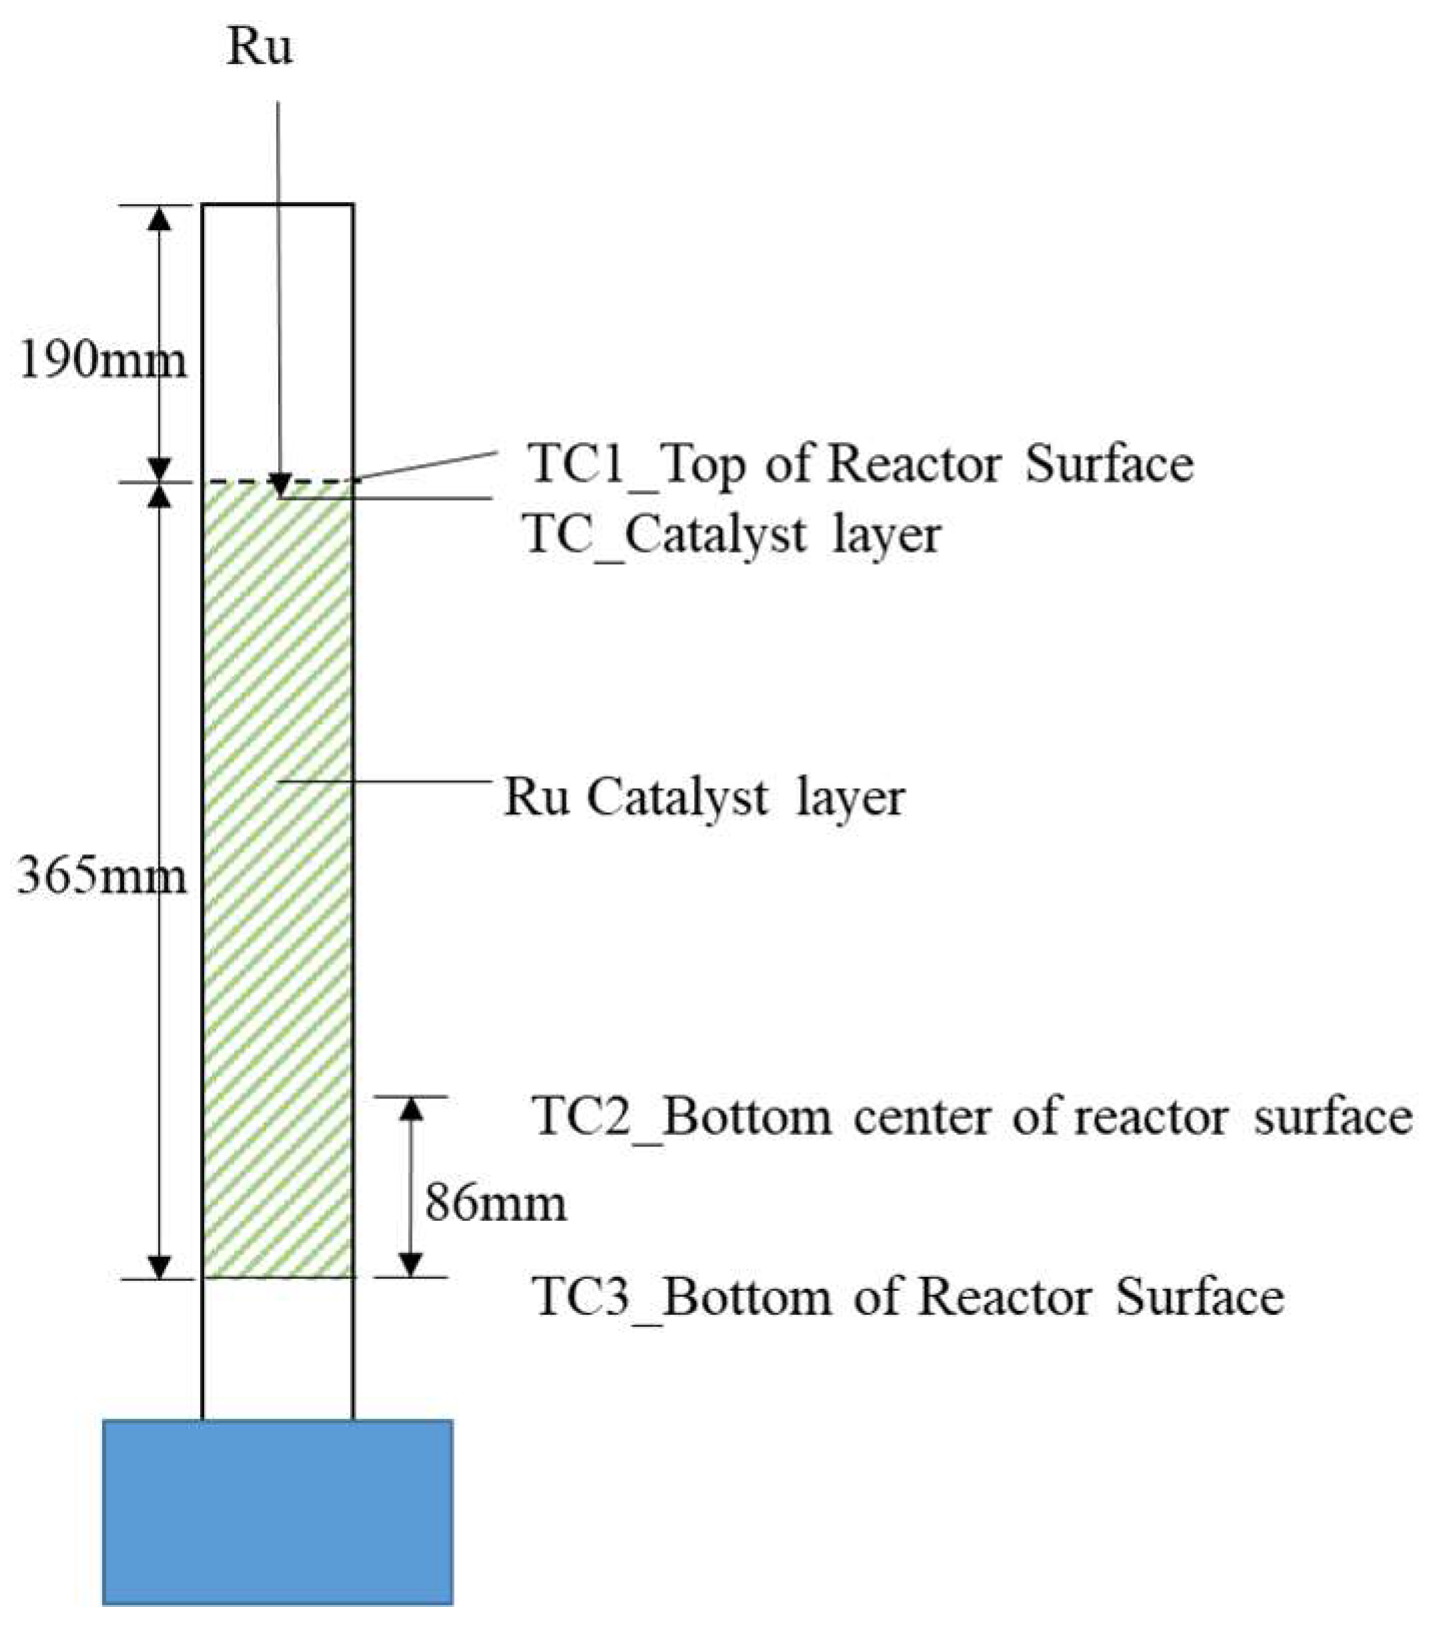
| Reactor-Surface-Temperature Measurements | |||
|---|---|---|---|
| Experiment No. | TC1 | TC2 | TC3 |
| 1 | 434.2252 | 553.9525 | 595.2163 |
| 2 | 458.5575 | 586.2754 | 632.4215 |
| 3 | 483.6517 | 619.8598 | 672.3031 |
| 4 | 499.0160 | 644.0106 | 700.7845 |
| 5 | 513.5956 | 668.8458 | 731.3515 |
| 6 | 530.3918 | 710.7519 | 789.1044 |
| 7 | 548.0571 | 755.8316 | 834.4375 |
| 8 | 440.0291 | 556.2471 | 605.9996 |
| 9 | 463.8518 | 588.7224 | 646.0989 |
| 10 | 487.6856 | 622.2952 | 686.5030 |
| 11 | 501.8929 | 645.3193 | 713.8137 |
| 12 | 516.5297 | 670.3384 | 747.8994 |
| 13 | 537.5016 | 712.1737 | 798.3009 |
| 14 | 548.4273 | 744.9738 | 830.3618 |
| 15 | 437.2601 | 560.6386 | 610.6106 |
| 16 | 462.3212 | 593.1973 | 644.3216 |
| 17 | 486.0982 | 629.5613 | 679.6483 |
| 18 | 504.6832 | 652.3975 | 713.9694 |
| 19 | 518.6271 | 675.0642 | 736.6576 |
| 20 | 541.1640 | 714.3720 | 786.7085 |
| 21 | 553.4275 | 741.6453 | 815.8044 |
| 22 | 443.5432 | 560.9095 | 602.7401 |
| 23 | 470.3663 | 593.2220 | 644.9947 |
| 24 | 496.1722 | 625.3554 | 687.1435 |
| 25 | 513.8378 | 641.2851 | 711.8383 |
| 26 | 528.0075 | 663.2032 | 746.5344 |
| 27 | 540.0961 | 702.7927 | 810.3330 |
| Reactor-Outlet-Composition Measurement | ||||||||
|---|---|---|---|---|---|---|---|---|
| Experiment No. | Furnace Setup Temp. | FCH4 (mol/h) | CH4 (%) | H2 (%) | CO (%) | CO2 (%) | NH3 (ppm) | CH4 Conversion (%) |
| 1 | 520 | 2.8295 | 11.4679 | 69.6571 | 5.8750 | 12.5571 | 2.1949 | 61.65 |
| 2 | 550 | 2.7278 | 7.5450 | 72.8300 | 8.3900 | 11.3350 | 3.8545 | 72.32 |
| 3 | 580 | 2.6314 | 4.3583 | 75.4958 | 11.3250 | 9.8083 | 6.9101 | 82.90 |
| 4 | 600 | 2.5725 | 2.7750 | 76.5813 | 13.1533 | 8.6125 | 10.4133 | 88.67 |
| 5 | 620 | 2.5136 | 1.4444 | 77.4389 | 14.7889 | 7.4667 | 13.9303 | 93.92 |
| 6 | 650 | 2.4333 | 0.3067 | 78.1733 | 16.2533 | 6.5000 | 15.2267 | 98.66 |
| 7 | 680 | 2.3557 | 0.0765 | 78.3412 | 16.5706 | 6.2882 | 11.7188 | 99.65 |
| 8 | 520 | 2.8054 | 12.8150 | 68.4650 | 5.8350 | 12.4400 | 2.6023 | 58.78 |
| 9 | 550 | 2.7037 | 8.2000 | 72.0348 | 8.4957 | 11.1565 | 4.2844 | 70.57 |
| 10 | 580 | 2.6100 | 5.2609 | 74.0696 | 11.5348 | 9.2435 | 8.7123 | 79.79 |
| 11 | 600 | 2.5484 | 3.0895 | 75.7000 | 13.2316 | 8.2421 | 13.2180 | 87.42 |
| 12 | 620 | 2.4922 | 1.2292 | 75.7125 | 14.6250 | 7.4583 | 17.9330 | 94.73 |
| 13 | 650 | 2.4119 | 0.2040 | 76.5120 | 15.6320 | 6.8480 | 19.3508 | 99.12 |
| 14 | 670 | 2.3610 | 0.0600 | 76.6500 | 15.7000 | 6.8100 | 17.4777 | 99.73 |
| 15 | 520 | 2.7840 | 11.9455 | 67.3864 | 5.7591 | 12.4364 | 3.3526 | 60.36 |
| 16 | 550 | 2.6823 | 7.3000 | 70.8850 | 8.3000 | 11.2950 | 5.8103 | 72.86 |
| 17 | 580 | 2.5859 | 4.7913 | 72.6261 | 11.5261 | 9.1565 | 11.9798 | 81.20 |
| 18 | 600 | 2.5297 | 2.6565 | 74.2217 | 13.2696 | 8.2130 | 20.2724 | 88.98 |
| 19 | 620 | 2.4708 | 1.2875 | 75.2292 | 14.7167 | 7.2375 | 25.2017 | 94.45 |
| 20 | 650 | 2.3905 | 0.2760 | 75.9200 | 15.8720 | 6.4920 | 26.0380 | 98.76 |
| 21 | 670 | 2.3396 | 0.1040 | 76.0000 | 16.2080 | 6.2480 | 20.4790 | 99.56 |
| 22 | 520 | 2.6769 | 12.4650 | 66.0600 | 5.4950 | 12.1950 | 4.2351 | 58.67 |
| 23 | 550 | 2.6769 | 7.5909 | 70.2682 | 8.0045 | 11.2500 | 8.4266 | 71.72 |
| 24 | 580 | 2.6769 | 4.2409 | 72.8091 | 10.6273 | 9.8136 | 13.4893 | 82.82 |
| 25 | 600 | 2.6769 | 2.1500 | 74.3727 | 12.1773 | 8.9455 | 19.1980 | 90.76 |
| 26 | 620 | 2.6769 | 0.9952 | 75.1143 | 13.5476 | 8.0381 | 25.0476 | 95.57 |
| 27 | 650 | 2.6769 | 0.3043 | 75.6130 | 15.3304 | 6.8522 | 21.5246 | 98.67 |
| NH3 Kinetics Parameters Results | |
|---|---|
| An2 (mol/g.h.bar) | En2 (kJ/mol) |
| 4.9809 | 8.0787 × 101 |
| Average Error (%) | |||||
|---|---|---|---|---|---|
| CH4 | H2 | CO | CO2 | NH3 | CH4 Conversion Rate |
| 43.99% | 4.28% | 8.84% | 3.92% | 88.29% | 8.53% |
| NH3 Kinetics Parameters | |||||
|---|---|---|---|---|---|
| An2 (mol/g.h.bar) | En2 (kJ/mol) | Aco (bar−1) | ΔHco (kJ/mol) | AH (bar−1/2) | ΔHH (kJ/mol) |
| 4.7953 | 8.2667 × 101 | 9.0900 × 10⁻⁵ | −9.5343 × 101 | 6.7500 × 10⁻⁶ | −7.6548 × 101 |
| NH3 Kinetics Parameters | |||
|---|---|---|---|
| An2 (mol/g.h.bar) | En2 (kJ/mol) | Aco (bar−1) | ΔHco (kJ/mol) |
| 5.3597 | 8.7339 × 101 | 9.0900 × 10⁻⁵ | −9.5343 × 101 |
| NH3 Kinetics Parameters | |||
|---|---|---|---|
| An2 (mol/g.h.bar) | En2 (kJ/mol) | AH (bar−1/2) | ΔHH (kJ/mol) |
| 4.9920 | 8.0381 × 101 | 6.7500 × 10⁻⁶ | −7.6548 × 101 |
| NH3 Average Error | |||
|---|---|---|---|
| Adsorption Term | CO and H | CO | H |
| Error (%) | 57.05% | 68.14% | 54.02% |
| Catalyst | Size | Shape | Content | Support |
|---|---|---|---|---|
| Ru | 3 mm | Sphere | 2 (wt%) | α-Al2O3 |
| Experimental Conditions | |||
|---|---|---|---|
| Experiment | Furnace Temperature (℃) | FCH4_i (mol/h) | FH2O_i (mol/h) |
| 1 | 500 | 2.6771 | 6.69 |
| 2 | 500 | 2.9449 | 7.36 |
| 3 | 520 | 2.6771 | 6.69 |
| 4 | 520 | 3.4803 | 8.70 |
| 5 | 550 | 2.6771 | 6.69 |
| 6 | 550 | 3.4803 | 8.70 |
| 7 | 580 | 2.6771 | 6.69 |
| 8 | 580 | 3.7480 | 9.37 |
| Experimental Conditions for NH3 Formation | ||||
|---|---|---|---|---|
| Experiment No. | Furnace Temperature (°C) | FCH4_i (mol/h) | FH2O_i (mol/h) | N2/CH4 |
| 1 | 520 | 2.8295 | 7.0738 | 0.03 |
| 2 | 550 | 2.7278 | 6.8195 | 0.03 |
| 3 | 580 | 2.6314 | 6.5785 | 0.03 |
| 4 | 600 | 2.5725 | 6.4313 | 0.03 |
| 5 | 620 | 2.5136 | 6.2840 | 0.03 |
| 6 | 650 | 2.4333 | 6.0833 | 0.03 |
| 7 | 680 | 2.3557 | 5.8893 | 0.03 |
| 8 | 520 | 2.8054 | 7.0135 | 0.06 |
| 9 | 550 | 2.7037 | 6.7593 | 0.06 |
| 10 | 580 | 2.6100 | 6.5250 | 0.06 |
| 11 | 600 | 2.5484 | 6.3710 | 0.06 |
| 12 | 620 | 2.4922 | 6.2305 | 0.06 |
| 13 | 650 | 2.4119 | 6.0298 | 0.06 |
| 14 | 670 | 2.3610 | 5.9025 | 0.06 |
| 15 | 520 | 2.7840 | 6.9600 | 0.09 |
| 16 | 550 | 2.6823 | 6.7058 | 0.09 |
| 17 | 580 | 2.5859 | 6.4648 | 0.09 |
| 18 | 600 | 2.5297 | 6.3243 | 0.09 |
| 19 | 620 | 2.4708 | 6.1770 | 0.09 |
| 20 | 650 | 2.3905 | 5.9763 | 0.09 |
| 21 | 670 | 2.3396 | 5.8490 | 0.09 |
| 22 | 520 | 2.6769 | 6.6923 | 0.10 |
| 23 | 550 | 2.6769 | 6.6923 | 0.10 |
| 24 | 580 | 2.6769 | 6.6923 | 0.10 |
| 25 | 600 | 2.6769 | 6.6923 | 0.10 |
| 26 | 620 | 2.6769 | 6.6923 | 0.10 |
| 27 | 650 | 2.6769 | 6.6923 | 0.10 |
Disclaimer/Publisher’s Note: The statements, opinions and data contained in all publications are solely those of the individual author(s) and contributor(s) and not of MDPI and/or the editor(s). MDPI and/or the editor(s) disclaim responsibility for any injury to people or property resulting from any ideas, methods, instructions or products referred to in the content. |
© 2023 by the authors. Licensee MDPI, Basel, Switzerland. This article is an open access article distributed under the terms and conditions of the Creative Commons Attribution (CC BY) license (https://creativecommons.org/licenses/by/4.0/).
Share and Cite
Kim, C.; Lee, J.; Lee, S. A New Ammonia Kinetic Model in Ru-Catalyzed Steam-Reforming Reaction Containing N2 in Natural Gas. Catalysts 2023, 13, 1380. https://doi.org/10.3390/catal13101380
Kim C, Lee J, Lee S. A New Ammonia Kinetic Model in Ru-Catalyzed Steam-Reforming Reaction Containing N2 in Natural Gas. Catalysts. 2023; 13(10):1380. https://doi.org/10.3390/catal13101380
Chicago/Turabian StyleKim, Chulmin, Juhan Lee, and Sangyong Lee. 2023. "A New Ammonia Kinetic Model in Ru-Catalyzed Steam-Reforming Reaction Containing N2 in Natural Gas" Catalysts 13, no. 10: 1380. https://doi.org/10.3390/catal13101380