Article

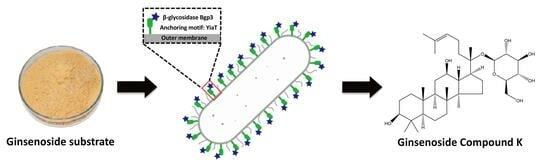
The Synthesis of Ginsenoside Compound K Using a Surface-Displayed β-Glycosidase Whole-Cell Catalyst

State Key Laboratory of Materials-Oriented Chemical Engineering, Jiangsu National Synergetic Innovation Center for Advanced Materials (SICAM), College of Biotechnology and Pharmaceutical Engineering, Nanjing Tech University, Nanjing 211816, China
*
Author to whom correspondence should be addressed.
Catalysts 2023, 13(10), 1375; https://doi.org/10.3390/catal13101375
Submission received: 25 September 2023 / Revised: 14 October 2023 / Accepted: 16 October 2023 / Published: 18 October 2023

Abstract

:
Ginsenoside compound K (CK) has garnered considerable attention due to its versatile pharmacological properties, including anti-inflammatory, anti-allergic, anti-aging, anti-diabetic, and hepatoprotective effects, along with neuroprotection. The conventional approach to synthesizing ginsenoside CK involves enzymatic conversion. However, the purification of enzymes necessitates effort and expense, and enzymes are prone to inactivation. Additionally, whole-cell catalysis suffers from inefficiency due to limited cell permeability. To address these challenges, we harnessed the YiaT protein as an anchoring motif, establishing a surface display system for β-glycosidase Bgp3. This innovative system served as a whole-cell catalyst for the efficient synthesis of ginsenoside CK. We further optimized the YiaT-Bgp3 system, enhancing display levels and significantly increasing ginsenoside CK production. Optimal conditions were achieved at an IPTG concentration of 0.5 mM, an induction temperature of 16 °C, a ginsenoside substrate concentration of 15 mg/mL, and a catalytic temperature of 30 °C. Ultimately, the YiaT-Bgp3 system synthesized 5.18 ± 0.08 mg/mL ginsenoside CK within 24 h, with a conversion of 81.83 ± 1.34%. Furthermore, the YiaT-Bgp3 system exhibited good reusability, adding to its practicality and value. This study has successfully developed an efficient whole-cell Bgp3 biocatalyst, offering a convenient, highly productive, and economically viable solution for the industrial production of ginsenoside CK.

Graphical Abstract

1. Introduction

Ginseng is a traditional herbaceous plant that can be used to maintain physical vitality and prolong life, so it is also known as the “king of herbs” [1]. The pharmacological activity of ginseng is mainly attributed to ginsenosides. Rare ginsenosides, including ginsenoside compound K (CK), are the secondary metabolites of ginsenosides and the most important active components [2].
Ginsenoside CK, first discovered in 1972, represents a rare protopanaxadiol class of ginsenoside not naturally found in ginseng plants [2,3]. It emerges as the primary degradation product of other protopanaxadiol-type ginsenosides within the human intestine, and it is a truly absorbed and functional entity [4]. Over the past half-century, the (auxiliary) therapeutic ability of CK for cancer, tumors, inflammation, diabetes, and other diseases has been confirmed in many studies. Owing to its high safety and diverse biological functions, ginsenoside CK holds significant potential as a therapeutic agent for numerous diseases [3,5,6,7].
Ginsenoside CK is currently mainly prepared through the deglycosylation of ginsenosides Rb1, Rb2, Rd, and Rc. Enzymatic conversion is an important pathway for the conversion of ginsenosides [8,9], and various glycosidases have been reported to be used for the enzymatic synthesis of ginsenoside CK [10,11,12,13,14,15]. For example, Kim [11] used purified Armillaria mellea mycelium β-glycosidase BG-1 to convert ginsenoside Rb2 into rare ginsenoside CY and CK and elucidated the conversion pathway as Rb2 → CO → CY → CK. Shin [12] characterized a β-glucosidase, which can completely convert all PPD (protopanaxadiol)-type ginsenosides in ginseng extract into ginsenoside CK. The extracellular enzyme of Paecilomyces bainier sp. 229 was isolated and purified to obtain seven components, each of which had the ability to hydrolyze ginsenosides. One of the components is defined as β-glucosidase, which can specifically hydrolyze Rb1 into CK [16]. However, glycosidases are typically intracellular enzymes, necessitating additional steps for enzyme recovery and purification, which can elevate costs [17]. Moreover, the process of enzyme recovery and purification may lead to a reduction in enzyme activity [17]. On the other hand, whole-cell catalysis is often hindered by poor cell permeability, resulting in reduced efficiency [18]. To surmount these challenges, we employed surface display technology to express β-glycosidase on the extracellular surface of cells. This innovative approach enables the entire cell to serve as a catalyst for the synthesis of ginsenoside CK in the extracellular space.
Surface display is a technique that presents the structural domains of expressed exogenous peptides or proteins in the form of fusion proteins on the surface of cells or bacteriophages [19]. This method offers notable advantages in terms of convenience, efficiency, and cost-effectiveness [18,20]. Surface display can be used for a wide range of biotechnology and industrial applications, including the development of live vaccines, peptide libraries to screen displays, biosorbents, biosensors, whole-cell biocatalysts, and biofuel [21,22].
Surface display systems consist of a carrier protein that acts as an anchoring motif, a passenger protein that acts as a target protein, and a host strain. Among the host organisms, Escherichia coli stands out as one of the most extensively employed choices, benefitting from its well-explored genome, well-established genetic toolbox, exceptional transformation efficiency, and good compatibility with heterogeneous proteins [18,23,24,25]. The choice of anchoring motif is particularly important because an incorrect motif may destabilize cell envelope integrity and cause growth defects [24]. Many different proteins have been developed as anchoring motifs of E. coli. The Lpp Ompa (LOA) system is the first widely used carrier protein in the surface display system of E. coli [26]. Subsequently, numerous candidate proteins located on the outer membrane of E. coli, such as MipA [27] and YiaT [28] motifs, have been developed and demonstrated to effectively display proteins of varying sizes and characteristics.
In this study, the N-terminal truncated YiaT protein of E. coli MG1655 was used as the anchoring motif to construct a surface display system for β-glycosidase Bgp3. We further optimized the YiaT-Bgp3 system to achieve higher display levels and compared it with Bgp3 in the intracellular expression system. Additionally, the reusability of the YiaT-Bgp3 system was evaluated to facilitate industrial applications.

2. Results and Discussion

2.1. Expression and Analysis of Recombinant Proteins in E. coli

The generated recombinant plasmids pET28a-bgp3 and pET28a-yiaT-bgp3 were confirmed to be correct using restriction enzyme analysis (Figure S1) and DNA sequencing before being transformed into E. coli BL21(DE3) for expression. The recombinant Bgp3 protein was examined using SDS-PAGE and found to have a molecular mass of approximately 80 kDa, corresponding to the predicted value of 79.7 kDa (Figure 1a) [29]. The anticipated molecular weight of the recombinant YiaT-Bgp3 protein from entire cells resuspended in a PBS buffer (0.01 M, pH 7.4) after fermentation was 105.7 kDa [28]. SDS-PAGE analysis demonstrated that the molecular weight was approximately 110 kDa (Figure 1b), suggesting that the plasmid pET28a-yiaT-bgp3 was successfully expressed.

2.2. Confirmation of the Surface Display System

Trypsin cleaves proteins on the C-terminal side of lysine and arginine residues, so proteins attached to the cell surface with extracellular exposure can be digested by trypsin while the intracellular proteins are unavailable to trypsin. The trypsin accessibility can be easily determined using SDS-PAGE analysis of trypsin-treated and untreated whole cells, which provides the position of specific proteins [18,30,31]. To evaluate if the trypsin accessibility assay is effective for the Bgp3 protein, whole cells and cell lysates from the Bgp3 intracellular expression system were treated with trypsin. SDS-PAGE analysis showed the same intact Bgp3 bands for the trypsin-untreated and treated whole cells, but the Bgp3 band of the cell lysate disappeared after trypsin treatment (Figure 2a). This demonstrated that Bgp3 could be digested by trypsin, but trypsin could not pass through the cell membranes. Therefore, a trypsin accessibility assay can be used to determine the surface localization of the expressed Bgp3.
SDS-PAGE analysis of trypsin-treated and untreated whole cells expressing fusion proteins YiaT-Bgp3 showed that the band of YiaT-Bgp3 existed in trypsin-untreated cells, while the band of YiaT-Bgp3 in trypsin-treated cells disappeared (Figure 2b). This result suggested that the fusion protein YiaT-Bgp3 was successfully displayed on the E. coli cell surface.
Previous research has found that different anchoring motifs have different efficiencies [18]. In a surface display system, the display of a successful recombinant protein is highly dependent on the choice of anchoring motif [28]. Thus, the anchoring motif YiaT originating from E. coli itself was selected to overcome the significant problems associated with the broader applications of display systems, such as target protein size limitations and misfolding, making it possible to generate cost-effective biocatalytic systems for various chemical industries [28].

2.3. Determination of Surface Display Efficiency

After confirming that YiaT-Bgp3 could be displayed on the E. coli cell surface, the whole cell activity of the cell surface display system was assessed, exhibiting an activity of 57.06 ± 0.95 U/mg (Table 1). By comparison, the whole cell activity and lysate activity of the cells with Bgp3 in an intracellular expression system were 56.10 ± 1.45 U/mg and 10.91 ± 1.26 U/mg, respectively, indicating that the YiaT-Bgp3 system exhibited good protein expression. Furthermore, the YiaT-Bgp3 system could synthesize 1.07 ± 0.05 mg/mL ginsenoside CK, which increased the production by approximately 3.5 times compared to the whole cell with Bgp3, suggesting that the YiaT-Bgp3 system enabled the strain to synthesize ginsenoside CK more effectively. The specific enzyme activity and ginsenoside CK production of the YiaT-Bgp3 system was similar to the lysate cell with Bgp3, but the system did not need additional steps to recover and purify the target enzymes, which may contribute to decreased enzyme activity and increased production costs [17].

2.4. Effects of IPTG Concentration on Protein Expression and Ginsenoside CK Production

Isopropyl-β-D-thiogalactopyranoside (IPTG) is an inducer with strong induction capability. The optimal concentration of IPTG appears to be highly system-dependent [32,33]. Therefore, we evaluated the effect of IPTG concentrations of 0 mM, 0.2 mM, 0.5 mM, 0.8 mM, and 1 mM. Trypsin accessibility assays demonstrated that the amount of expressed YiaT-Bgp3 was almost the same under these IPTG concentrations (Figure 3a). The maximum yield of ginsenoside CK was 1.17 ± 0.07 mg/mL observed at a concentration of IPTG of 0.5 mM (Figure 3b), with a conversion of 55.45 ± 3.35%.
The concentration of IPTG required for optimal expression is influenced by various factors, such as the strength of the promoter, the presence or absence of repressor genes on a plasmid, the cellular location of product expression, the response of the cell to recombinant protein expression, the solubility of the target protein and the characteristics of the protein itself [32]. In addition, the characteristics of target proteins, their required forms, and the cell location where the target protein accumulates significantly affect the optimal IPTG concentration [33]. Therefore, we had to conduct experiments to determine the optimal concentration.

2.5. Effects of Induction Temperature on Protein Expression and Ginsenoside CK Production

Induction temperature has an important impact on the expression of proteins. When the induction temperature is higher, the protein synthesis rate is too quick, and it is easy to form inclusion bodies [32,34,35]. Low induction temperature is conducive to the production of recombinant proteins and can increase the yield or activity of target proteins [36]. This study examined 4, 16, 25, and 37 °C to explore the effects of induction temperature on protein expression and ginsenoside CK production.
According to the SDS-PAGE analysis, the YiaT-Bgp3 expression levels were different under these temperatures, with the optimal induction temperature being 25 °C (Figure 4a). However, the cells undergoing protein expression at 25 °C exhibited low activity (Figure 4b), while those expressed at 16 °C exhibited the best activity. We speculated that the induction temperature was too high, resulting in the appearance of inclusion bodies, so the SDS-PAGE analysis showed that trypsin could not fully digest the YiaT-Bgp3 band. Correspondingly, the yield of ginsenoside CK was the highest at 16 °C (Figure 4c). Thus, 16 °C was employed as the optimal induction temperature for the YiaT-Bgp3 system in our subsequent experiments.
The maximum specific growth rate of E. coli occurs at a temperature of 37–39 °C [37]. The use of suboptimal growth temperatures, in some cases, can reduce unwanted metabolic responses to the synthesis of a foreign protein and, as a consequence, improve the yield and/or solubility of the target protein product [32]. For example, growth and induction at 21 °C instead of 37 °C enhanced the soluble yield of cytoplasmic Fab fragments 10-fold [38]. So, induction at lower temperatures is beneficial as it can improve the expression of soluble target proteins, which is consistent with our experimental results.

2.6. Effects of Ginsenoside Substrate Concentration on Ginsenoside CK Production

The substrate concentration affects the rate of whole-cell catalytic reactions and the generation of products. The effect of ginsenoside substrate concentration on the generation of ginsenoside CK was examined using different substrate concentrations (5 mg/mL to 25 mg/mL) (Figure 5). The production of ginsenoside CK increased with the increase in substrate concentrations. When the substrate concentrations were 5 mg/mL and 10 mg/mL, the conversion reached 68.49 ± 1.68% and 73.11 ± 0.84%, respectively. When the substrate concentration was 15 mg/mL, the conversion reached its maximum of 76.86 ± 1.23%. As the substrate concentration increased further, the conversion decreased, possibly due to the inhibition of ginsenoside CK and the saturation of substrate concentration [15]. When the substrate concentration was further increased to 20 mg/mL, the conversion decreased to 63.10 ± 1.76%. The conversion was 57.77 ± 1.00% with a substrate concentration of 25 mg/mL. Therefore, considering the cost, the following experiments were conducted with a 15 mg/mL substrate concentration.

2.7. Effects of Catalytic Temperature on Ginsenoside CK Production

In whole-cell catalytic reactions, the catalytic temperature is an essential factor. Therefore, we investigated the influence of different catalytic temperatures (Figure 6). The production of ginsenoside CK was 2.66 ± 0.13 mg/mL when the catalytic temperature was 16 °C. As the catalytic temperature increased, the production of ginsenoside CK also increased. When the catalytic temperature was 30 °C, the production of ginsenoside CK reached its maximum. The ginsenoside CK production decreased when the temperature reached 37 °C. Therefore, the optimal catalytic temperature was 30 °C. Under these optimal conditions, YiaT-Bgp3 converted 15 mg/mL ginsenoside substrate to 5.18 ± 0.08 mg/mL ginsenoside CK, with an 81.83 ± 1.34% conversion.

2.8. Synthesis of Ginsenoside CK in a 100 mL System

It had been shown through the optimization experiments (based on incubating tube set-up) that the whole-cell catalyst YiaT-Bgp3 can efficiently synthesize ginsenoside CK. To demonstrate the scalability and reliability of the ginsenoside CK synthesis reaction, a 100 mL system was conducted under optimal conditions, and the result is shown in Figure 7. After 18 h, 4.99 ± 0.09 mg/mL ginsenoside CK was produced. This indicated that the synthesis of ginsenoside CK is scalable and reliable, and the whole-cell catalyst YiaT-Bgp3 has industrial potential.

2.9. Evaluation of the Reusability of the Surface Display System

The whole cells were suspended in a PBS buffer, and the reusability of the cells was examined via repeated whole-cell catalytic reactions. As illustrated in Figure 8, whole cells with Bgp3 only produced 0.13 ± 0.04 mg/mL of ginsenoside CK after being reusedeight times, and with an increasing number of uses, ginsenoside CK production significantly decreased. By comparison, whole cells with YiaT-Bgp3 still generated 4.18 ± 0.15 mg/mL ginsenoside CK after being reused eight times, with a conversion of 65.96 ± 2.34%. Moreover, the ginsenoside CK production of the surface displayed E. coli decreased smoothly. This indicated that the YiaT-Bgp3 display system has good reusability, which is economical for industrialization.

3. Materials and Methods

3.1. Materials

The genomic DNA extraction bacteria kit, DNA purification kit, and plasmid mini-prep kit were purchased from Tiangen Biotech Co., Ltd. (Beijing, China). The 2 × Phanta Max Master Mix DNA polymerase and ClonExpress Ultra One Step Cloning Kit were purchased from Vazyme Biotech Co., Ltd. (Nanjing, China). Restriction enzymes were purchased from Takara Bio Inc. (Beijing, China). All other chemicals and reagents were purchased from Sinopharm Chemical Reagent Co., Ltd. (Shanghai, China). Ginsenoside substrate (including 42.29% ginsenoside Rb1) was provided by Shanxi Hongtian Jiali Agricultural Science and Technology Co., Ltd. (Shanxi, China). Ginsenoside CK, with a purity of 98%, was purchased from Shanghai D&B Biological Science and Technology Co., Ltd. (Shanghai, China).

3.2. Strains and Plasmids

All strains and plasmids used in this study are outlined in Table 2. E. coli strains DH5α and BL21(DE3) were used as hosts for gene manipulation and protein expression, respectively. The plasmid pET28a was used for the construction of expression vectors for proteins.

3.3. Plasmid Construction and Transformation

The primers used in this study are listed in Table S1. The codon-optimized sequence of bgp3 (GenBank accession number JN603821.1) was synthesized by General Biol. (Chuzhou, Anhui, China). The bgp3 gene sequence assembled for genetic engineering was obtained via PCR amplification using the primers bgp-F/Sal I and bgp-R/Xho I and ligated into the Sal I/Xho I sites of the pET28a plasmid to obtain the recombinant plasmid pET28a-bgp3. The genomic DNA of E. coli MG1655 was isolated and used as the template for PCR amplification to obtain the YiaT gene (N-terminal residues 1-232) using the primers YiaT-F/EcoR I and YiaT-R/Sal I. The YiaT gene was then ligated into the EcoR I/Sal I sites of the previously constructed plasmid (pET28a-bgp3) to generate the plasmid pET28a-yiaT-bgp3. All recombinant plasmids were verified using restriction enzyme analysis and DNA sequencing. The recombinant plasmids were transformed into E. coli BL21(DE3) for expression.

3.4. Culture Conditions

The 200 μL of preserved recombinant E. coli BL21(DE3) was evenly coated on an LB solid medium (10 g/L tryptone, 5 g/L yeast extract, 10 g/L NaCl, and 20 g/L agar powder) and cultured overnight at 37 °C. Overnight cultures of E. coli BL21(DE3) were inoculated in an LB liquid medium (10 g/L tryptone, 5 g/L yeast extract, and 10 g/L NaCl) with 30 μg/mL kanamycin at 37 °C for 8 h, and inoculated in an LB liquid medium with an inoculation amount of 5% (v/v). When the OD600 reached 0.6–0.8, the protein expression was induced using 0.2 mM IPTG at 25 °C for 24 h.

3.5. Ginsenoside CK Synthesis

After the cultivation, pellets that can serve as a subsequent whole-cell catalyst were collected via centrifugation at 6000 rpm for 10 min at 4 °C. The pellets were washed twice with a PBS buffer (0.01 M, pH 7.4) and then resuspended. The ginsenoside CK synthesis reaction was carried out at 37 °C in a 25 mL incubating tube in a 5 mL PBS buffer containing 5 mg/mL ginsenoside substrate and whole cells.

3.6. Analytical Methods

3.6.1. Biomass Determination

Biomass was determined using a spectrophotometer (756S, Lengguang, Huangpu, Shanghai, China) at 600 nm.

3.6.2. High-Performance Liquid Chromatography (HPLC) Analysis of Ginsenoside CK

After the ginsenoside CK synthesis reaction, 5 mL water-saturated n-butanol was added to the reaction system, ultrasonic treatment for 30 min, standing for 1 h, centrifugation, and rare ginsenoside CK was present in the upper solution. The upper solution of water-saturated n-butanol extraction was steamed, an equal volume of methanol was added and then filtered through a 0.22 μm membrane for analysis. HPLC (Agilent, Santa Clara, CA, USA) was employed to quantitatively analyze ginsenoside CK at 203 nm with a C18 column (4.6 mm × 250 mm, 5 μm). The column temperature was 35 °C, and the injected volume was 20 µL. The mobile phase consisted of a gradient of water (A) and acetonitrile (B), as follows: 65% A, 0–10 min; 65% to 45% A, 10–12 min; 45% A, 12–35 min; 45% to 0% A, 35–40 min; 0% to 65% A, 40–45 min; and 65% A, 45–50 min. The flow rate was established at 1.5 mL/min [1].

3.6.3. Trypsin Accessibility Assay for Confirmation of the Surface Display System

To investigate the surface display of Bgp3, a trypsin accessibility test was used. The culture of E. coli BL21(DE3) harboring the Bgp3 surface display system was collected via centrifugation at 6000 rpm for 10 min at 4 °C. Cell pellets were washed twice with a PBS buffer and resuspended. The intact cells were treated with trypsin with the final concentration of 400 μg/mL for 1 h at 37 °C. The digestion was terminated by adding 2.5 mM PMSF after incubation on ice for 5 min [18]. The E. coli BL21(DE3) cells containing the pET28a-bgp3 plasmid for intracellular Bgp3 expression were treated the same way and used as a control. All samples were analyzed via a SDS-PAGE gel and stained with Coomassie blue dye.

3.6.4. Enzymatic Activity Assays

The enzymatic activity was assayed using p-nitrophenyl-β-D-glucopyranoside (pNPG) as the substrate. A 100 µL reaction solution consisting of 80 µL of 10 mM PBS buffer, 10 µL of whole cell solution or lysate at the appropriate dilution, and 10 µL of 2.5 mM pNPG was incubated for 5 min at 35 °C. The reaction was stopped by adding 100 µL of 1 M Na2CO3, and the absorbance was measured at 400 nm. One unit (U) of hydrolysis activity was defined as the amount of enzyme required to liberate 1 µM of pNP per minute under standard conditions [39].

3.6.5. Data Analysis

All experiments were independently performed in triplicate, and the mean and standard deviation of the results were obtained by Origin 2017.

3.7. Effects of IPTG Concentration and Induction Temperature on Protein Expression and Ginsenoside CK Production

To examine the effect of the inducer IPTG, different concentrations of IPTG ranging from 0 to 1.0 mM were used to induce the expression of YiaT-Bgp3. The effect of induction temperature on YiaT-Bgp3 expression after the induction was also examined at 4 °C, 16 °C, 25 °C, and 37 °C.

3.8. Effects of Ginsenoside Substrate Concentration and Catalytic Temperature on Ginsenoside CK Production

The effects of ginsenoside substrate concentration and catalytic temperature on ginsenoside CK production were examined by varying the ginsenoside substrate concentration from 5 to 25 mg/mL at 37 °C and the catalytic temperature from 16 to 37 °C at 15 mg/mL ginsenoside substrate.

3.9. Scale-Up of Ginsenoside CK Synthesis Reaction

For the scale-up of the synthesis reaction, pellets that can serve as a subsequent whole-cell catalyst were resuspended in a 100 mL PBS buffer (in a 500 mL shake flask) containing 15 mg/mL ginsenoside substrate. Other experimental conditions included the concentration of IPTG, which was 0.5 mM, the induction temperature, which was 16 °C, and the catalytic temperature at 30 °C.

3.10. Reusability Assay of Surface Display System

After induction with 0.5 mM IPTG and 16 °C, whole cells were suspended in a PBS buffer and reacted with 15 mg/mL ginsenoside substrate at 30 °C. After the reaction, cells were centrifuged, and the supernatants were used to determine the ginsenoside CK concentration. The pellets were continued to be resuspended with a PBS buffer, and ginsenoside substrate was added to repeat the reaction.

4. Conclusions

In this study, an efficient β-glycosidase whole-cell catalyst YiaT-Bgp3 was obtained using the YiaT motif. The whole-cell catalyst overcomes the membrane permeability concerns of intracellular Bgp3 whole-cell catalysts and the high costs of purified Bgp3. The activity of the YiaT-Bgp3 system is similar to cell lysate with Bgp3, indicating a good display level. We also optimized the system and significantly increased the production of ginsenoside CK. Ultimately, the YiaT-Bgp3 system synthesized 5.18 ± 0.08 mg/mL ginsenoside CK with a conversion of 81.83 ± 1.34% when the concentration of IPTG was 0.5 mM, induction temperature was 16 °C, ginsenoside substrate concentration was 15 mg/mL, and catalytic temperature was 30 °C. Moreover, the YiaT-Bgp3 system can be reused several times, providing a valuable system for industrial ginsenoside CK production.

Supplementary Materials

The following supporting information can be downloaded at https://www.mdpi.com/article/10.3390/catal13101375/s1, Table S1: Primers used in this study; Figure S1: Agarose electrophoresis diagram. (a) Lane M: Trans2K Plus II DNA Marker; Lane 1: plasmid pET28a-bgp3 digested with Xho I and Bgl II. (b) Lane 2: plasmid pET28a-yiaT-bgp3 digested with Xho I and Bgl II; Lane M: Trans2K Plus II DNA Marker; Figure S2: The effect of IPTG concentration on specific enzyme activity; Figure S3: HPLC analysis. (a) Standard. (b) Sample (IPTG concentration: 0.5 mM; induction temperature: 16 °C; ginsenoside substrate concentration: 15 mg/mL; catalytic temperature: 30 °C; reaction time: 24 h).

Author Contributions

Conceptualization, L.G., T.L., G.G., Z.L., and N.H.; methodology, L.G., T.L., G.G., and Z.L.; validation, L.G.; formal analysis, L.G.; investigation, L.G.; resources, N.H.; data curation, L.G.; writing—original draft preparation, L.G.; writing—review and editing, T.L. and G.G.; visualization, L.G.; supervision, N.H.; project administration, G.G. and Z.L. All authors have read and agreed to the published version of the manuscript.

Funding

This study was supported by the National Key Research and Development Program of China (No. 2019YFA09005000), the Key Research and Development Program of Jiangsu Province (No. BE2020346), and the Six Talent Peaks Project in Jiangsu Province (No. 2019-NY-058).

Data Availability Statement

The obtained data will be available from the corresponding author upon reasonable request.

Acknowledgments

Not applicable.

Conflicts of Interest

The authors declare no conflict of interest.

References

  1. Wang, P.; Tang, C.; Liu, Y.; Yang, J.; Fan, D. Biotransformation of High Concentrations of Ginsenoside Substrate into Compound K by β-glycosidase from Sulfolobus solfataricus. Genes 2023, 14, 897. [Google Scholar] [CrossRef]
  2. Cui, C.-h.; Jeon, B.-M.; Fu, Y.; Im, W.-T.; Kim, S.-C. High-density Immobilization of a Ginsenoside-transforming β-glucosidase for Enhanced Food-grade Production of Minor ginsenosides. Appl. Microbiol. Biotechnol. 2019, 103, 7003–7015. [Google Scholar] [CrossRef]
  3. Sharma, A.; Lee, H.-J. Ginsenoside Compound K: Insights into Recent Studies on Pharmacokinetics and Health-promoting Activities. Biomolecules 2020, 10, 1028. [Google Scholar] [CrossRef]
  4. Yang, X.-D.; Yang, Y.-Y.; Ouyang, D.-S.; Yang, G.-P. A Review of Biotransformation and Pharmacology of Ginsenoside Compound K. Fitoterapia 2015, 100, 208–220. [Google Scholar] [CrossRef]
  5. Liu, J.; Wang, Y.; Yu, Z.; Lv, G.; Huang, X.; Lin, H.; Ma, C.; Lin, Z.; Qu, P. Functional Mechanism of Ginsenoside Compound K on Tumor Growth and Metastasis. Integr. Cancer Ther. 2022, 21, 1–13. [Google Scholar] [CrossRef]
  6. Chen, L.; Zhou, L.; Huang, J.; Wang, Y.; Yang, G.; Tan, Z.; Wang, Y.; Zhou, G.; Liao, J.; Ouyang, D. Single- and Multiple-Dose Trials to Determine the Pharmacokinetics, Safety, Tolerability, and Sex Effect of Oral Ginsenoside Compound K in Healthy Chinese Volunteers. Front. Pharmacol. 2018, 8, 965. [Google Scholar] [CrossRef]
  7. Oh, J.; Kim, J.-S. Compound K Derived from Ginseng: Neuroprotection and Cognitive Improvement. Food Funct. 2016, 7, 4506–4515. [Google Scholar] [CrossRef]
  8. Lu, C.; Yin, Y. Pulsed Electric Field Treatment Combined With Commercial Enzymes Converts Major Ginsenoside Rb1 to Minor Ginsenoside Rd. Innov. Food Sci. Emerg. Technol. 2014, 22, 95–101. [Google Scholar] [CrossRef]
  9. Zhong, F.-L.; Ma, R.; Jiang, M.; Dong, W.-W.; Jiang, J.; Wu, S.; Li, D.; Quan, L.-H. Cloning and Characterization of Ginsenoside-hydrolyzing β-glucosidase from Lactobacillus brevis That Transforms Ginsenosides Rb1 and F2 into Ginsenoside Rd and Compound K. J. Microbiol. Biotechnol. 2016, 26, 1661–1667. [Google Scholar] [CrossRef]
  10. Kim, M.-J.; Upadhyaya, J.; Yoon, M.-S.; Ryu, N.S.; Song, Y.E.; Park, H.-W.; Kim, Y.-H.; Kim, M.-K. Highly Regioselective Biotransformation of Ginsenoside Rb2 into Compound Y and Compound K by β-glycosidase Purified from Armillaria mellea mycelia. J. Ginseng Res. 2018, 42, 504–511. [Google Scholar] [CrossRef]
  11. Kim, S.A.; Shin, K.C.; Oh, D.K. Complete Biotransformation of Protopanaxadiol-type Ginsenosides into 20-O-β-glucopyranosyl-20(S)-protopanaxadiol by Permeabilized Recombinant Escherichia coli Cells Coexpressing β-glucosidase and Chaperone Genes. J. Agric. Food Chem. 2019, 67, 8393–8401. [Google Scholar] [CrossRef] [PubMed]
  12. Shin, K.C.; Kim, T.H.; Choi, J.H.; Oh, D.K. Complete Biotransformation of Protopanaxadiol-type Ginsenosides to 20- O-β-glucopyranosyl-20(S)-protopanaxadiol Using a Novel and Thermostable β-Glucosidase. J. Agric. Food Chem. 2018, 66, 2822–2829. [Google Scholar] [CrossRef] [PubMed]
  13. Tran, T.N.A.; Son, J.S.; Awais, M.; Ko, J.H.; Yang, D.C.; Jung, S.K. β-glucosidase and Its Application in Bioconversion of Ginsenosides in Panax ginseng. Bioengineering 2023, 10, 484. [Google Scholar] [CrossRef]
  14. Kim, S.Y.; Lee, H.N.; Hong, S.J.; Kang, H.J.; Cho, J.Y.; Kim, D.; Ameer, K.; Kim, Y.M. Enhanced Biotransformation of the Minor Ginsenosides in Red Ginseng Extract by Penicillium decumbens β-glucosidase. Enzym. Microb. Technol. 2022, 153, 109941. [Google Scholar] [CrossRef] [PubMed]
  15. Duan, Z.; Zhu, C.; Shi, J.; Fan, D.; Deng, J.; Fu, R.; Huang, R.; Fan, C. High Efficiency Production of Ginsenoside Compound K by Catalyzing Ginsenoside Rb1 Using Snailase. Chin. J. Chem. Eng. 2018, 26, 1591–1597. [Google Scholar] [CrossRef]
  16. Yan, Q.; Zhou, W.; Shi, X.; Zhou, P.; Ju, D.; Feng, M. Biotransformation Pathways of Ginsenoside Rb1 to Compound K by β-glucosidases in Fungus Paecilomyces Bainier sp. 229. Process Biochem. 2010, 45, 1550–1556. [Google Scholar] [CrossRef]
  17. Kim, D.; Ku, S. Bacillus Cellulase Molecular Cloning, Expression, and Surface Display on the Outer Membrane of Escherichia coli. Molecules 2018, 23, 503. [Google Scholar] [CrossRef]
  18. Zhou, R.; Dong, S.; Feng, Y.; Cui, Q.; Xuan, J. Development of Highly Efficient Whole-cell Catalysts of Cis-epoxysuccinic Acid Hydrolase by Surface Display. Bioresour. Bioprocess. 2022, 9, 92. [Google Scholar] [CrossRef]
  19. Han, L.; Zhao, Y.; Cui, S.; Liang, B. Redesigning of Microbial Cell Surface and Its Application to Whole-cell Biocatalysis and Biosensors. Appl. Biochem. Biotechnol. 2017, 185, 396–418. [Google Scholar] [CrossRef]
  20. Suzuki, H.; Thongbhubate, K.; Muraoka, M.; Sasabu, A. Agmatine Production by Escherichia coli Cells Expressing SpeA on the Extracellular Surface. Enzym. Microb. Technol. 2023, 162, 110139. [Google Scholar] [CrossRef]
  21. Kondo, A.; Tanaka, T.; Hasunuma, T.; Ogino, C. Applications of Yeast Cell-surface Display in Bio-refinery. Recent Pat. Biotechnol. 2010, 4, 226–234. [Google Scholar] [CrossRef] [PubMed]
  22. Kuroda, K.; Ueda, M. Cell Surface Engineering of Yeast for Applications in White Biotechnology. Biotechnol. Lett. 2011, 33, 1–9. [Google Scholar] [CrossRef] [PubMed]
  23. Narita, J.; Okano, K.; Tateno, T.; Tanino, T.; Sewaki, T.; Sung, M.-H.; Fukuda, H.; Kondo, A. Display of Active Enzymes on the Cell Surface of Escherichia coli Using PgsA Anchor Protein and Their Application to Bioconversion. Appl. Microbiol. Biotechnol. 2005, 70, 564–572. [Google Scholar] [CrossRef]
  24. Lee, S.Y.; Choi, J.H.; Xu, Z.H. Microbial Cell-surface Display. Trends Biotechnol. 2003, 21, 45–52. [Google Scholar] [CrossRef]
  25. Nakatani, H.; Hori, K. Cell Surface Protein Engineering for High-performance Whole-cell Catalysts. Front. Chem. Sci. Eng. 2017, 11, 46–57. [Google Scholar] [CrossRef]
  26. Georgiou, G.; Stephens, D.L.; Stathopoulos, C.; Poetschke, H.L.; Mendenhall, J.; Earhart, C.F. Display of Beta-lactamase on the Escherichia coli Surface: Outer Membrane Phenotypes Conferred by Lpp’-OmpA’-beta-lactamase Fusions. Protein Eng. 1996, 9, 239–247. [Google Scholar] [CrossRef] [PubMed]
  27. Han, M.J. Novel Bacterial Surface Display System Based on the Escherichia coli Protein MipA. J. Microbiol. Biotechnol. 2020, 30, 1097–1103. [Google Scholar] [CrossRef]
  28. Han, M.J.; Lee, S.H. An Efficient Bacterial Surface Display System Based on a Novel Outer Membrane Anchoring Element from the Escherichia coli Protein YiaT. FEMS Microbiol. Lett. 2015, 362, 1–7. [Google Scholar] [CrossRef]
  29. Quan, L.H.; Min, J.W.; Jin, Y.; Wang, C.; Kim, Y.J.; Yang, D.C. Enzymatic Biotransformation of Ginsenoside Rb1 to Compound K by Recombinant β-glucosidase from Microbacterium esteraromaticum. J. Agric. Food Chem. 2012, 60, 3776–3781. [Google Scholar] [CrossRef]
  30. Maurer, J.; Jose, J.; Meyer, T. Autodisplay: One-component System for Efficient Surface Display and Release of Soluble Recombinant Proteins from Escherichia coli. J. Bacteriol. 1997, 179, 794–804. [Google Scholar] [CrossRef]
  31. Xia, H.; Li, N.; Zhong, X.; Jiang, Y. Metal-organic Frameworks: A Potential Platform for Enzyme Immobilization and Related Applications. Front. Bioeng. Biotechnol. 2020, 8, 695. [Google Scholar] [CrossRef] [PubMed]
  32. Donovan, R.S.; Robinson, C.W.; Glick, B.R. Review: Optimizing Inducer and Culture Conditions for Expression of Foreign Proteins Under the Control of the lac Promoter. J. Ind. Microbiol. 1996, 16, 145–154. [Google Scholar] [CrossRef] [PubMed]
  33. Zarei Jaliani, H.; Farajnia, S.; Safdari, Y.; Mohammadi, S.A.; Barzegar, A.; Talebi, S. Optimized Condition for Enhanced Soluble-expression of Recombinant Mutant Anabaena Variabilis Phenylalanine Ammonia Lyase. Adv. Pharm. Bull. 2014, 4, 261–266. [Google Scholar] [CrossRef] [PubMed]
  34. Bhatwa, A.; Wang, W.; Hassan, Y.I.; Abraham, N.; Li, X.Z.; Zhou, T. Challenges Associated With the Formation of Recombinant Protein Inclusion Bodies in Escherichia coli and Strategies to Address Them for Industrial Applications. Front. Bioeng. Biotechnol. 2021, 9, 630551. [Google Scholar] [CrossRef] [PubMed]
  35. Ding, Q.; Ou, L.; Wei, D.; Wei, X. Optimum Induction of Recombinant Thymidine Phosphorylase and Its Application. Nucleosides Nucleotides Nucleic Acids 2011, 30, 360–368. [Google Scholar] [CrossRef]
  36. Chen, X.; Li, C.; Liu, H. Enhanced Recombinant Protein Production under Special Environmental Stress. Front. Microbiol. 2021, 12, 630814. [Google Scholar] [CrossRef]
  37. Juneja, V.K.; Mukhopadhyay, S.; Ukuku, D.; Hwang, C.A.; Wu, V.C.; Thippareddi, H. Interactive Effects of Temperature, pH, and Water Activity on the Growth Kinetics of Shiga Toxin-producing Escherichia coli O104:H4. J. Food Prot. 2014, 77, 706–712. [Google Scholar] [CrossRef]
  38. Cabilly, S. Growth at Sub-optimal Temperatures Allows the Production of Functional, Antigen-binding Fab Fragments in Escherichia coli. Gene 1989, 85, 553–557. [Google Scholar] [CrossRef]
  39. Huang, R.; Zhang, F.; Yan, X.; Qin, Y.; Jiang, J.; Liu, Y.; Song, Y. Characterization of the β-glucosidase Activity in Indigenous Yeast Isolated from Wine Regions in China. J. Food Sci. 2021, 86, 2327–2345. [Google Scholar] [CrossRef]
Figure 1. SDS-PAGE analysis: (a) SDS-PAGE analysis of recombinant bgp3. Lane M: marker; Lane 1: recombinant bgp3; (b) SDS-PAGE analysis of recombinant yiaT-bgp3. Lane M: marker; Lane 2: recombinant yiaT-bgp3.
Catalysts 13 01375 g001
Figure 2. SDS-PAGE analysis: (a) SDS-PAGE analysis of recombinant bgp3. Lane M: marker; Lanes 1–2: whole cells of intracellular Bgp3 expression system without and with trypsin treatment; Lanes 3–4: cell lysate of intracellular Bgp3 expression system without and with trypsin treatment; (b) SDS-PAGE analysis of recombinant yiaT-bgp3. Lane M: marker; Lanes 5–6: trypsin-untreated and treated whole cells expressing YiaT-Bgp3.
Catalysts 13 01375 g002
Figure 3. The effect of the inducer IPTG concentration: (a) SDS-PAGE analysis of the YiaT-Bgp3 expression. Lane M: marker; Lanes 1–10: each pair of lanes are trypsin-untreated and treated whole cells induced by IPTG with the concentrations of 1 mM, 0.8 mM, 0.5 mM, 0.2 mM, and 0 mM; (b) the effect of IPTG concentration on ginsenoside CK production. Induction temperature: 25 °C; ginsenoside substrate concentration: 5 mg/mL; catalytic temperature: 37 °C; reaction time: 24 h.
Catalysts 13 01375 g003
Figure 4. The effect of the induction temperature: (a) SDS-PAGE analysis of the YiaT-Bgp3 expression. Lane M: marker; Lanes 1–8: each pair of lanes are trypsin-untreated and treated whole cells with the induction temperatures 4 °C, 16 °C, 25 °C, and 37 °C; (b) the effect of induction temperature on specific enzyme activity; (c) the effect of induction temperature on ginsenoside CK production. IPTG concentration: 0.5 mM; ginsenoside substrate concentration: 5 mg/mL; catalytic temperature: 37 °C; reaction time: 24 h.
Catalysts 13 01375 g004
Figure 5. The effect of ginsenoside substrate concentration. IPTG concentration: 0.5 mM; induction temperature: 16 °C; catalytic temperature: 37 °C; reaction time: 24 h.
Catalysts 13 01375 g005
Figure 6. The effect of catalytic temperature. IPTG concentration: 0.5 mM; induction temperature: 16 °C; ginsenoside substrate concentration: 15 mg/mL; reaction time: 24 h.
Catalysts 13 01375 g006
Figure 7. Synthesis of ginsenoside CK in a 100 mL system. IPTG concentration: 0.5 mM; induction temperature: 16 °C; ginsenoside substrate concentration: 15 mg/mL; catalytic temperature: 30 °C; reaction time: 24 h.
Catalysts 13 01375 g007
Figure 8. Repeated use of whole cell (IPTG concentration: 0.5 mM; induction temperature: 16 °C; ginsenoside substrate concentration: 15 mg/mL; catalytic temperature: 30 °C; reaction time: 24 h): (a) whole cell with YiaT-Bgp3; (b) whole cell with Bgp3.
Catalysts 13 01375 g008
Table 1. Comparison of surface display and intracellular expression systems.
TypeSpecific Enzyme Activity (U/mg)Ginsenoside CK Production (mg/mL)Conversion (%)
Whole cell (pET28a-yiaT-bgp3)57.06 ± 0.951.07 ± 0.0550.48 ± 2.34
Lysate (pET28a-bgp3)56.10 ± 1.451.06 ± 0.0750.24 ± 3.35
Whole cell (pET28a-bgp3)10.91 ± 1.260.31 ± 0.0414.69 ± 2.01
Table 2. Strains and plasmids used in this study.
Strains or PlasmidsDescriptionsSource
E. coli DH5αClone strainVazyme
E. coli BL21(DE3)Expression strainVazyme
pET28apBR232 origin, lac I coding sequence, PT7, KmrLab stock
pET28a-bgp3pET28a derivative, PT7, Kmr, intracellular Bgp3 expressionThis study
pET28a-yiaT-bgp3pET28a derivative, PT7, Kmr, fusion expression of YiaT-Bgp3This study
Disclaimer/Publisher’s Note: The statements, opinions and data contained in all publications are solely those of the individual author(s) and contributor(s) and not of MDPI and/or the editor(s). MDPI and/or the editor(s) disclaim responsibility for any injury to people or property resulting from any ideas, methods, instructions or products referred to in the content.

