
Optimization of ZnO Nanoparticles’ Synthesis via Precipitation Method Applying Taguchi Robust Design
 ,
,  , and
, and 
Abstract
:1. Introduction
2. Results
2.1. Characterization of the Prepared ZnO Samples
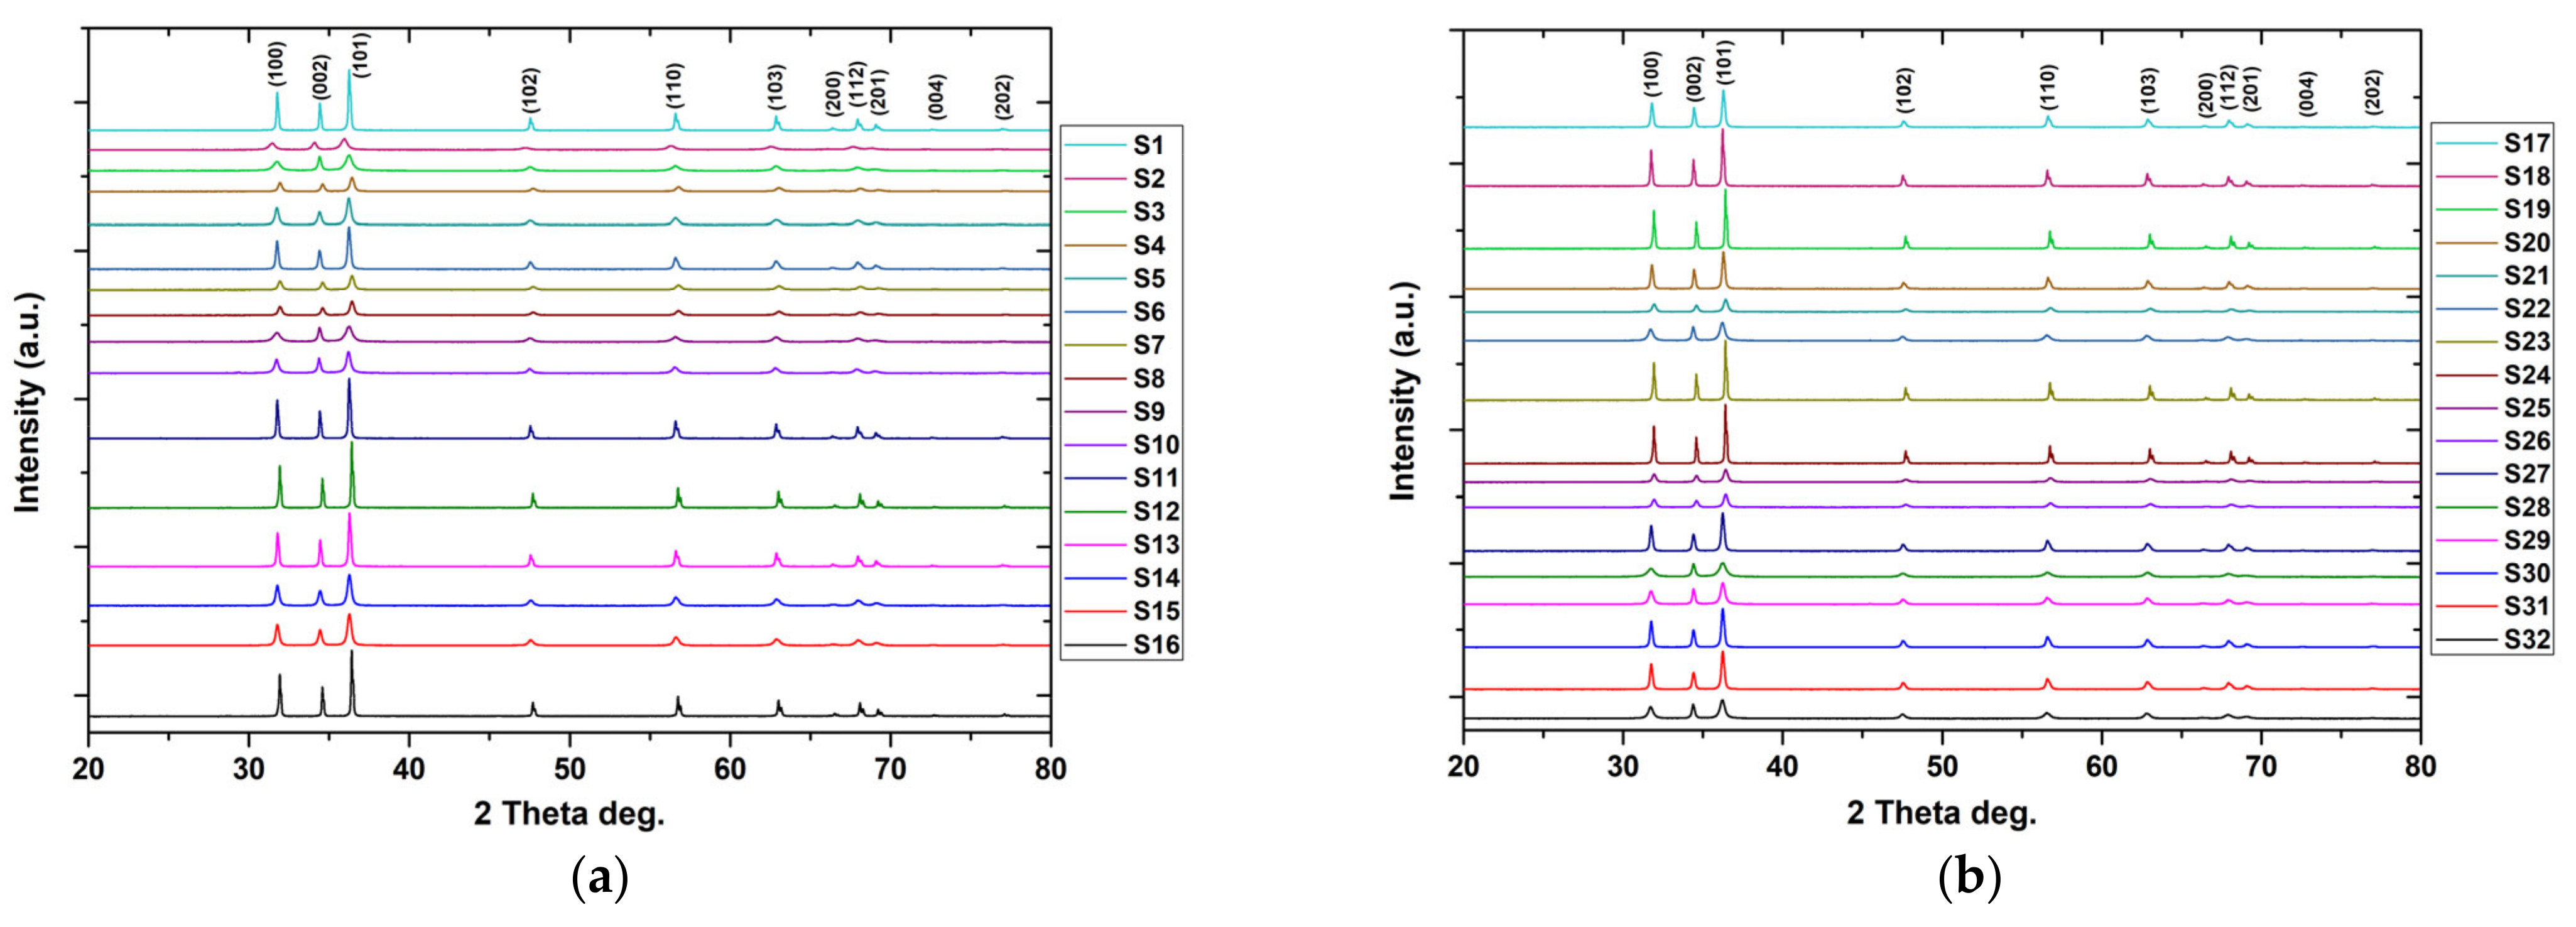
2.1.1. XRD Analysis
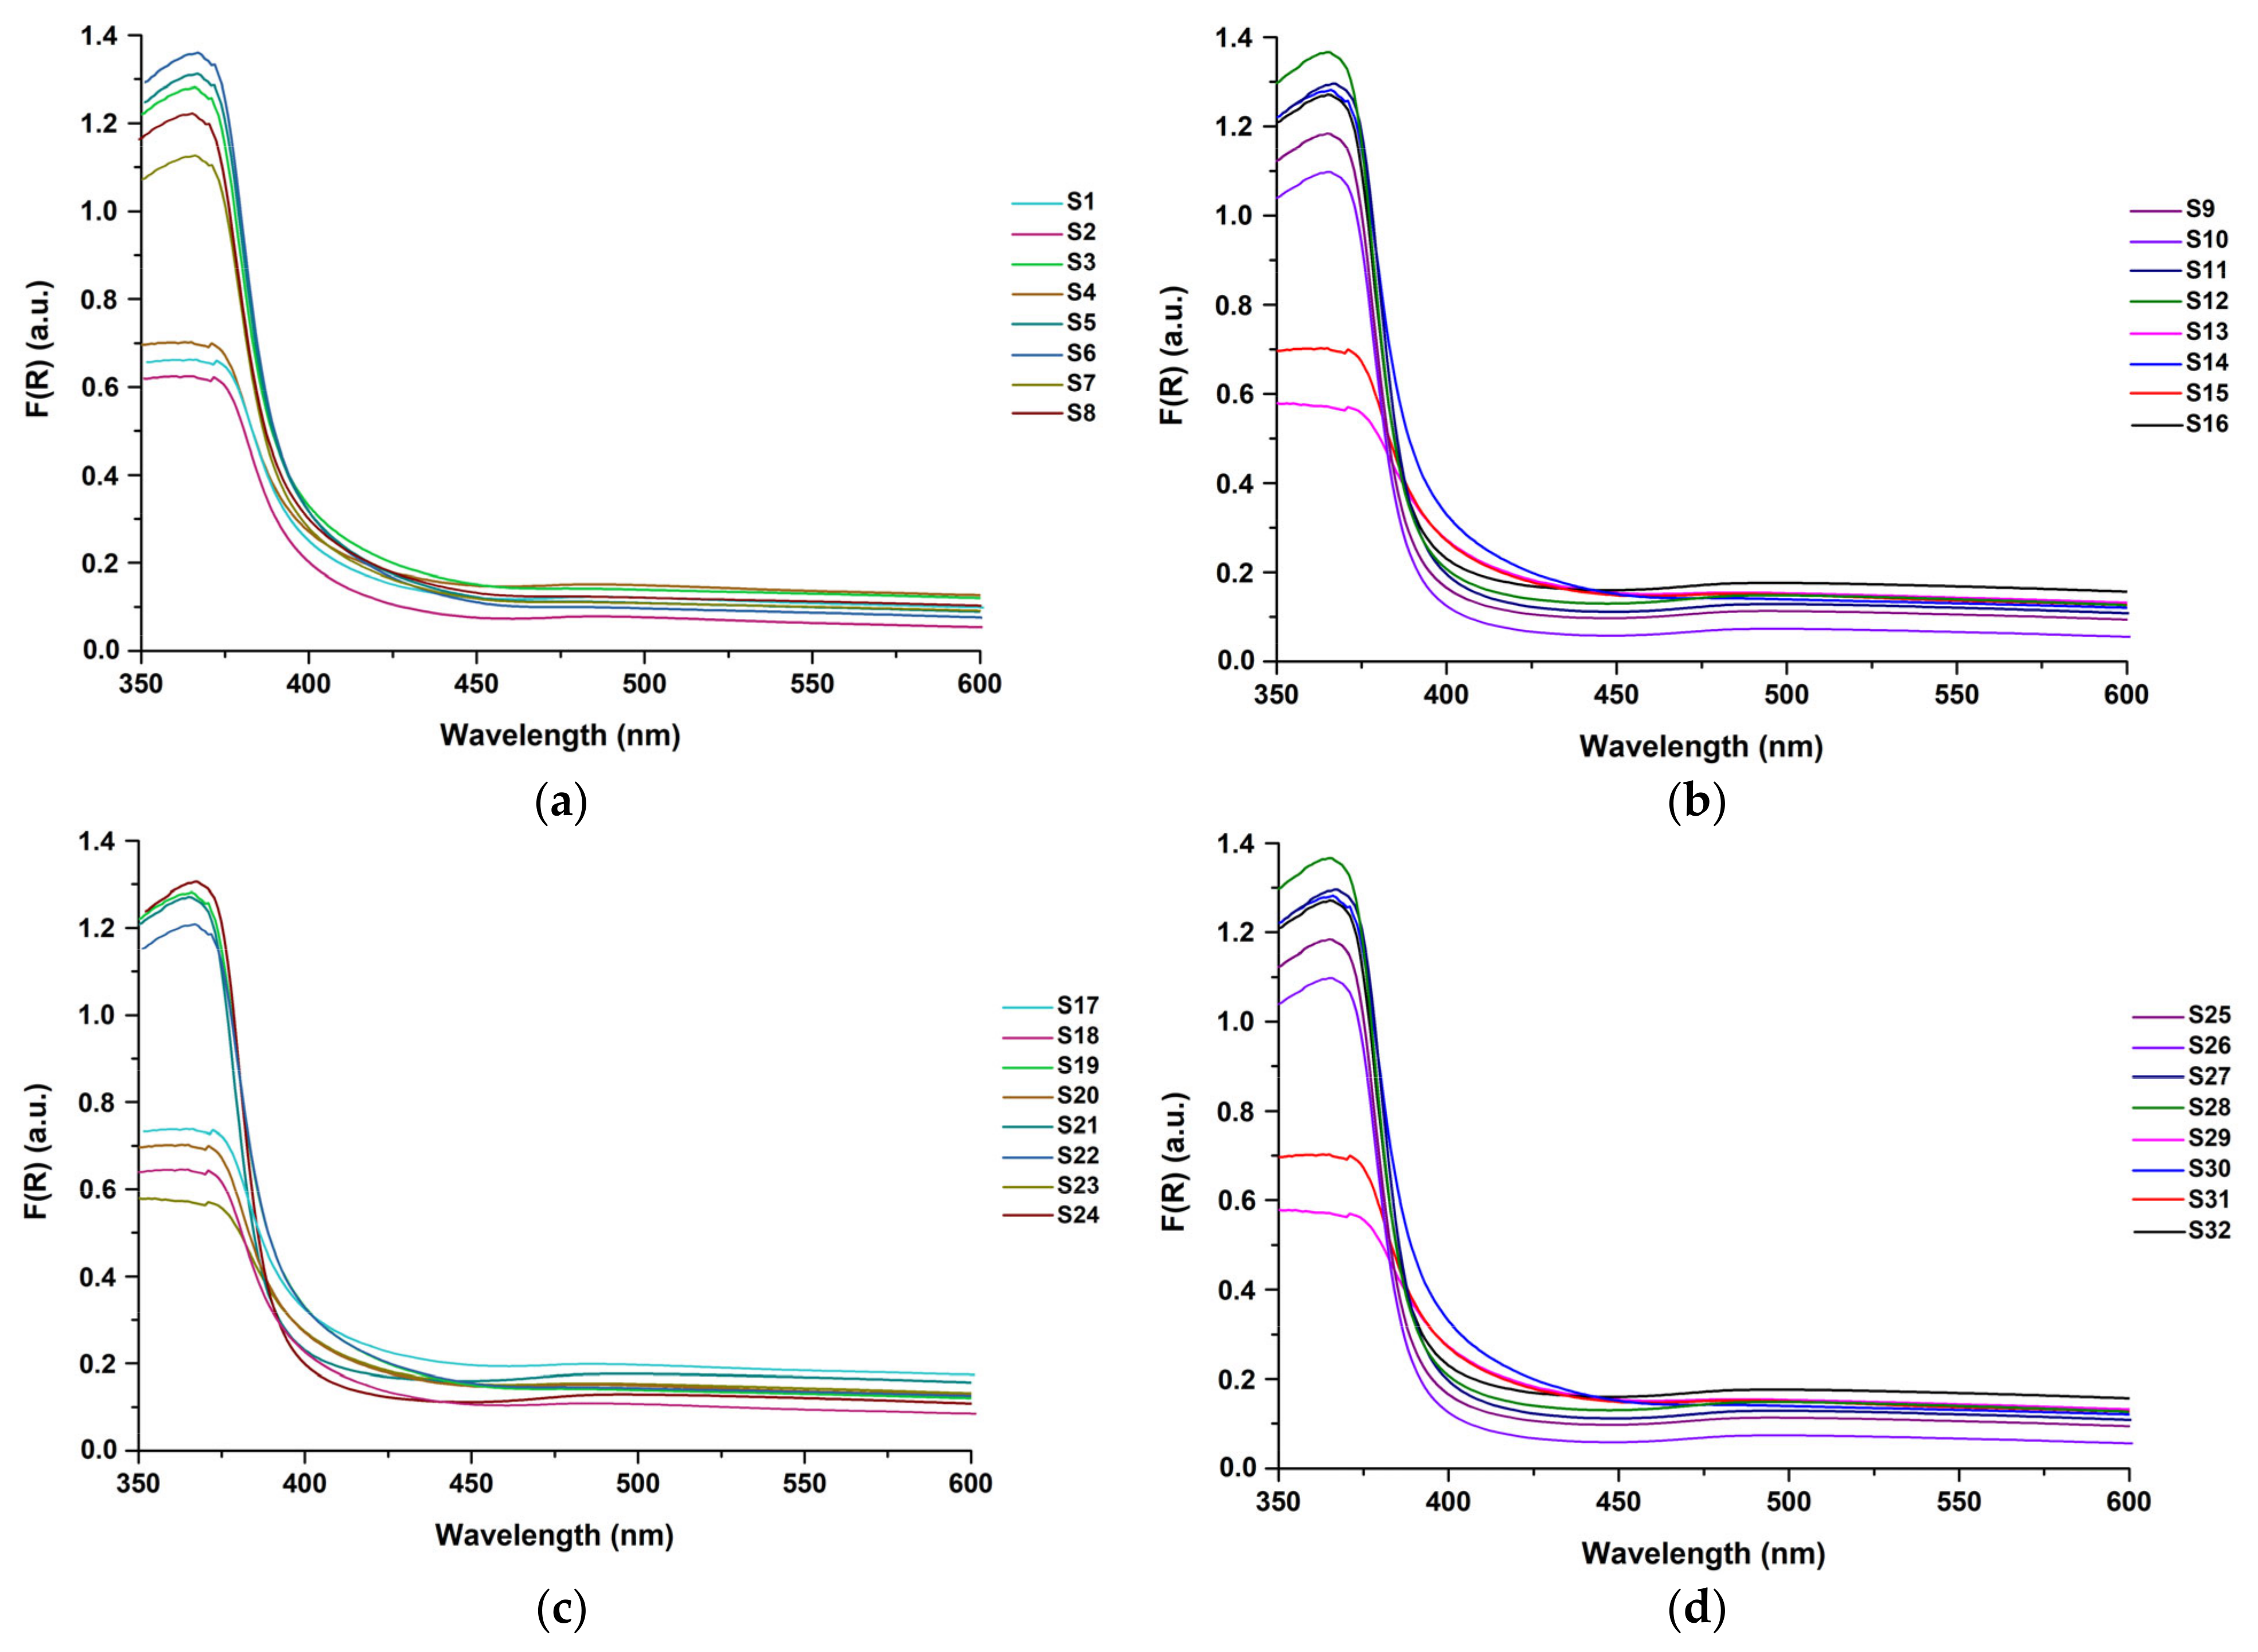
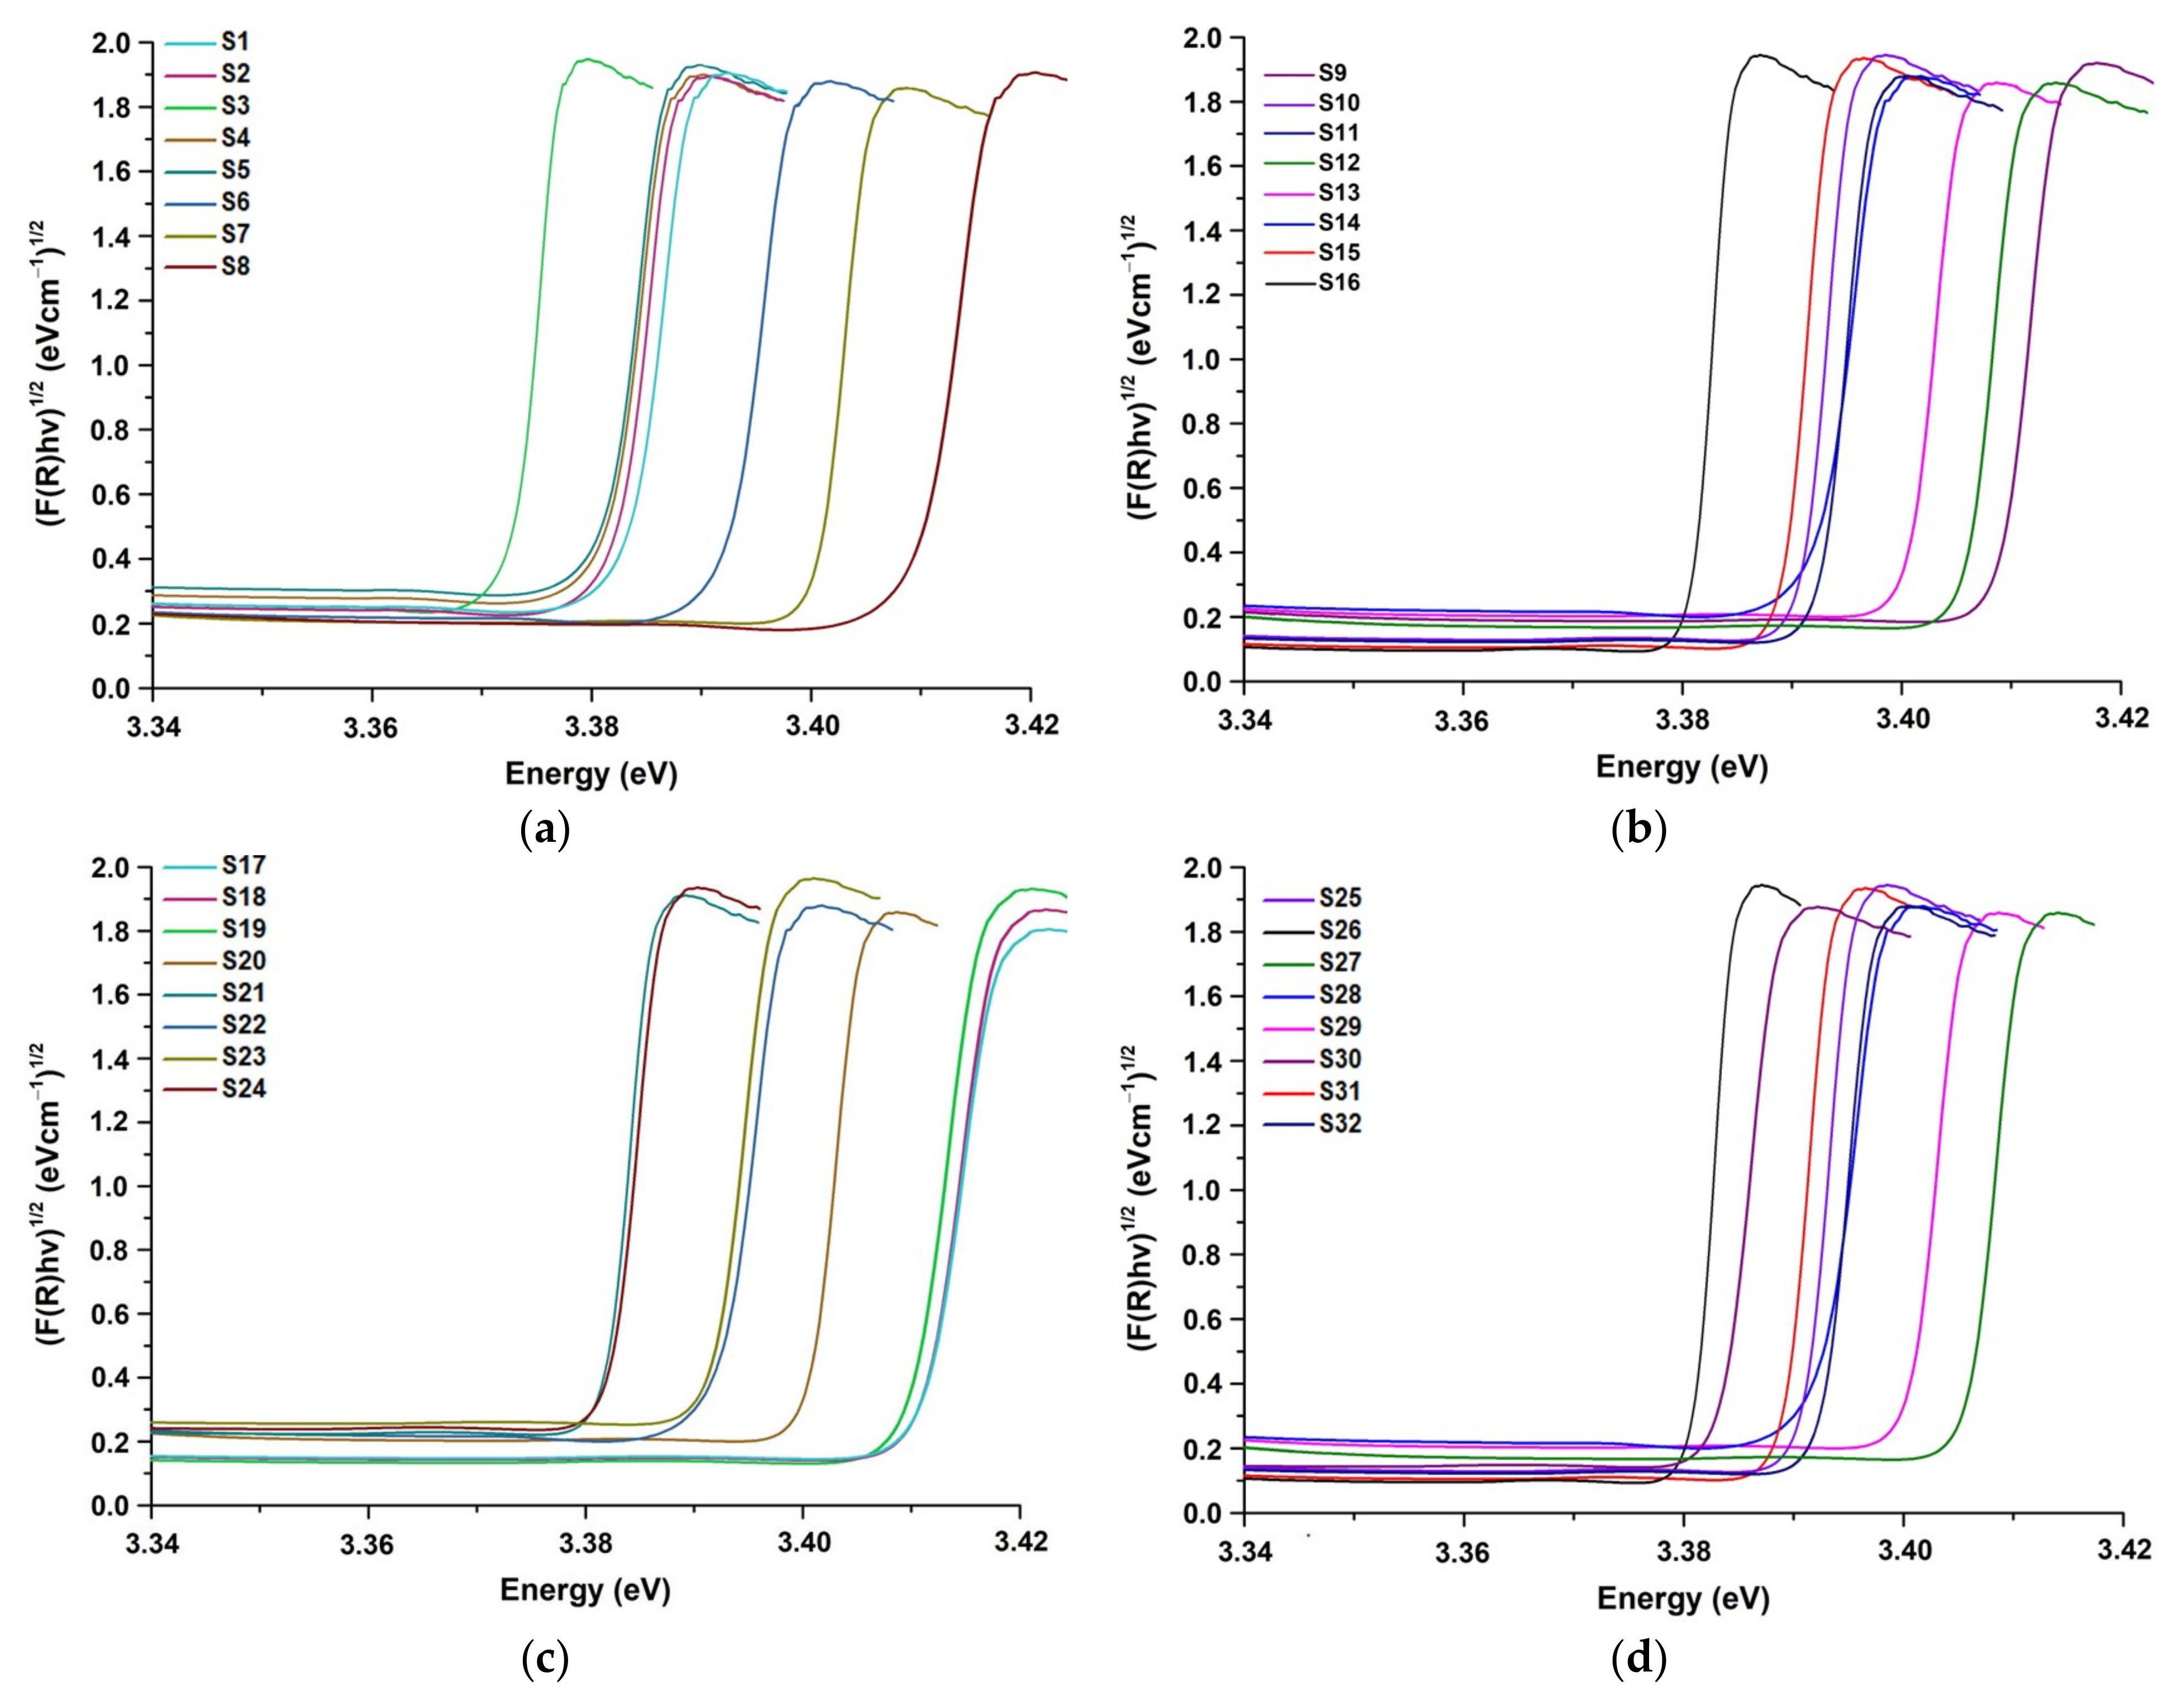
2.1.2. Diffuse Reflectance UV–Vis Spectroscopy Analysis (DRS)
2.2. Photocatalytic Activity of the Prepared ZnO Samples
2.3. Results Analysis Based on the Taguchi Approach
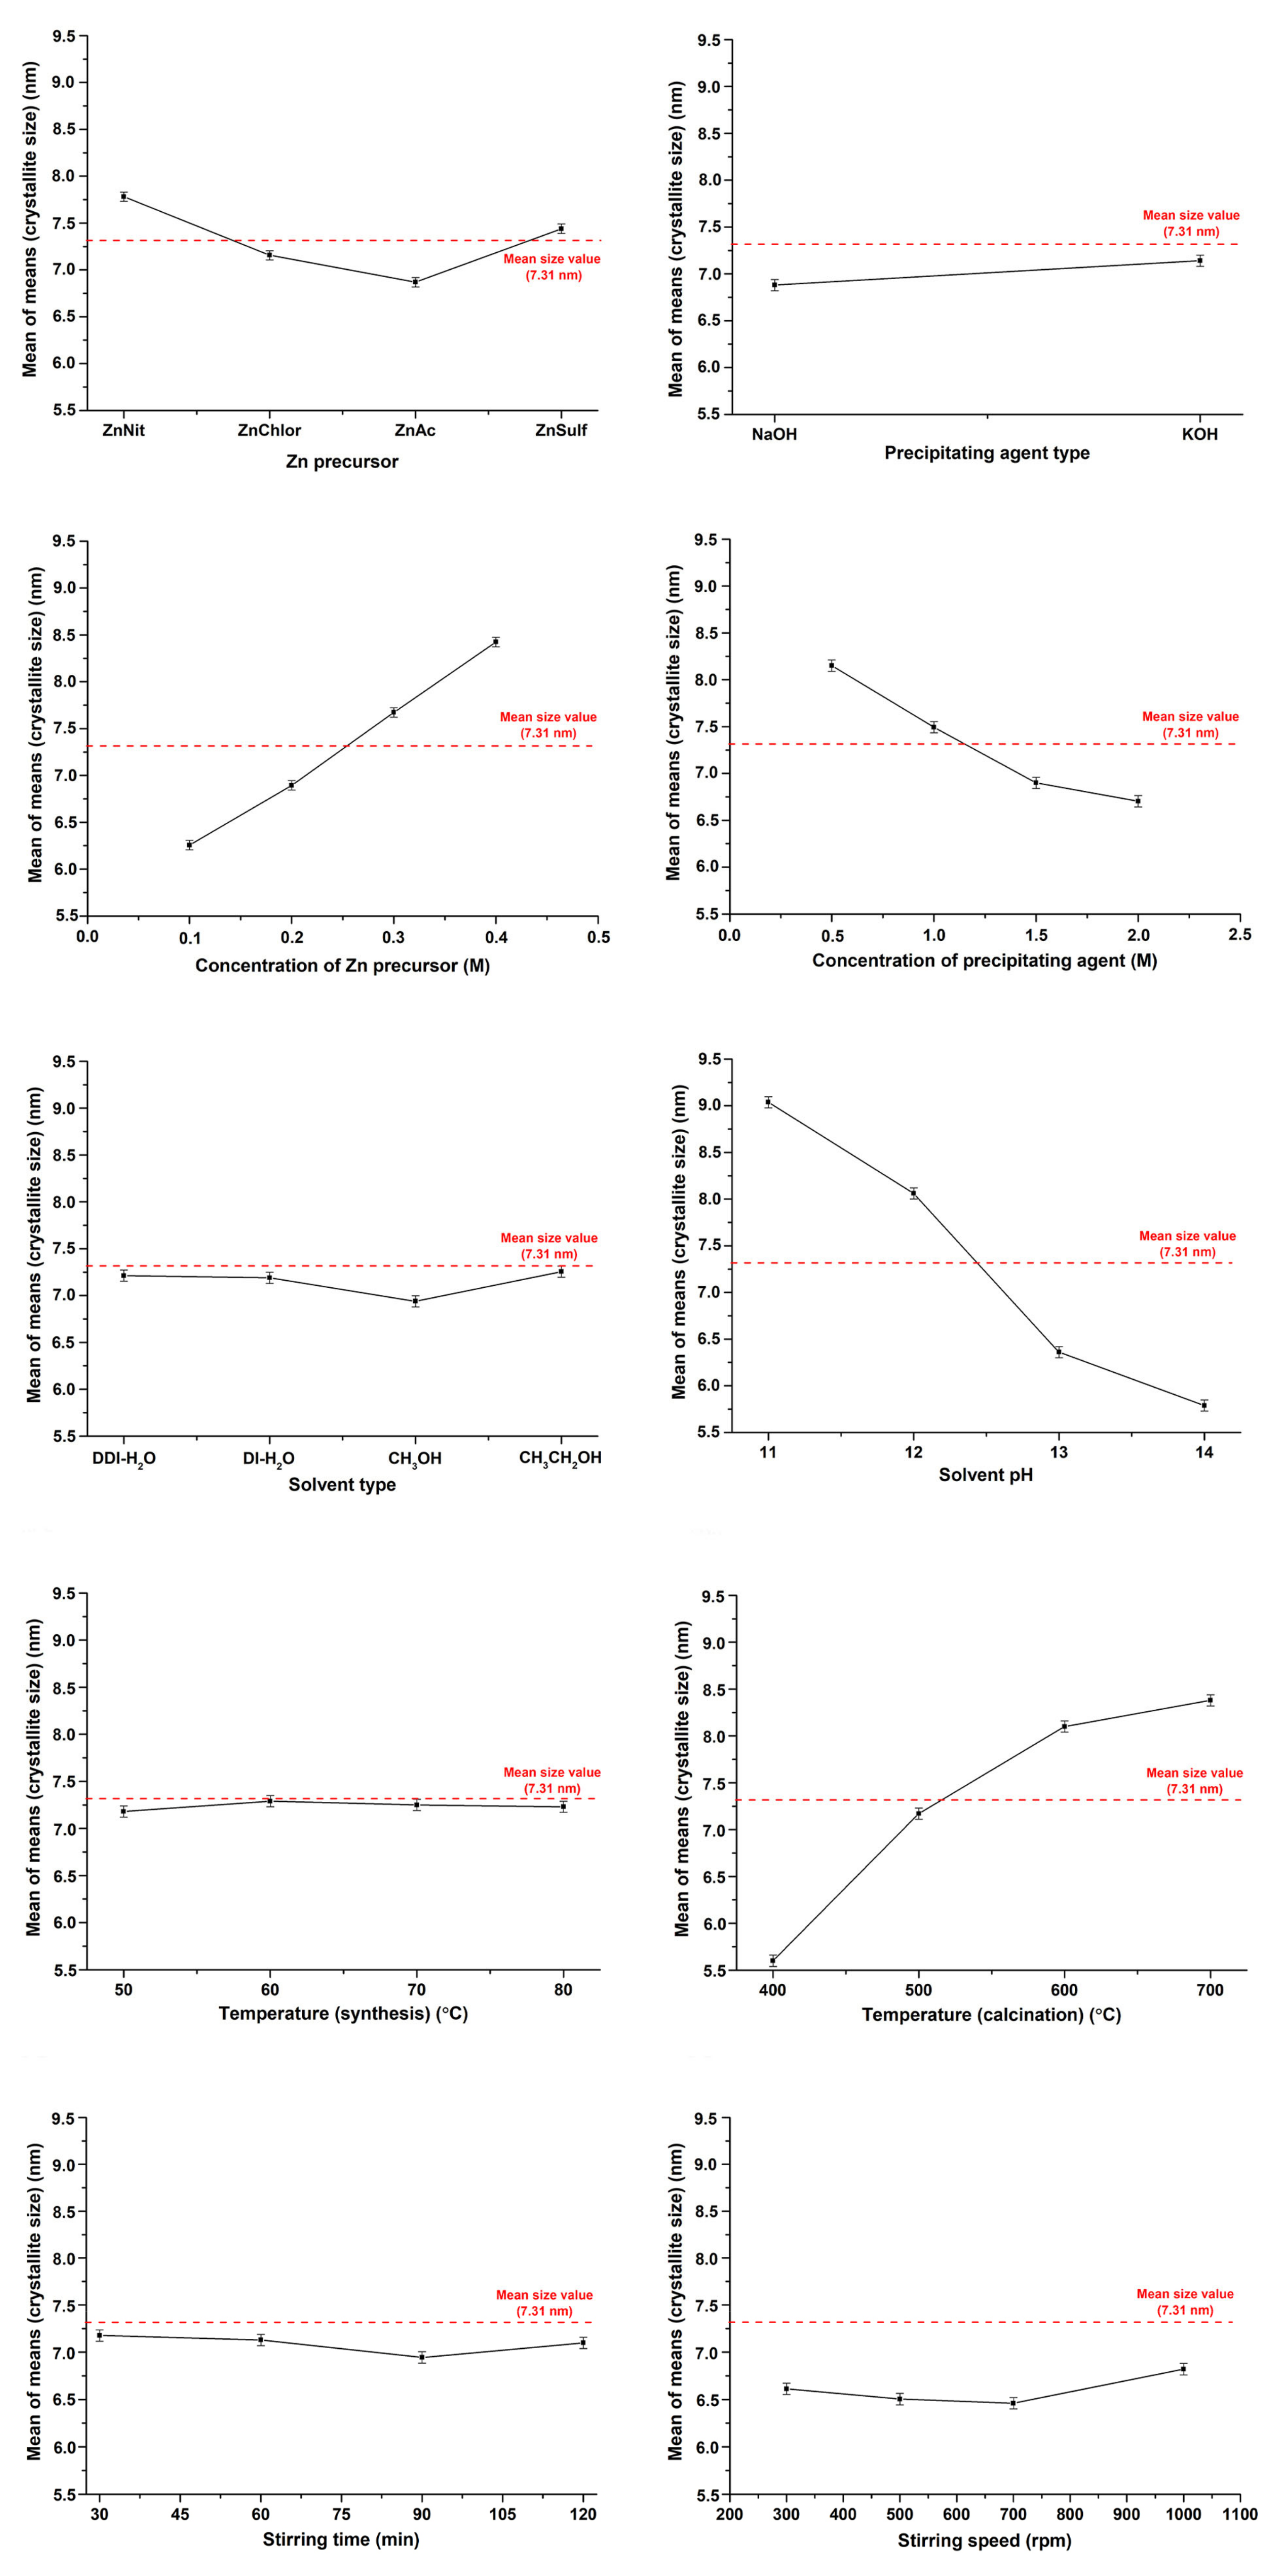
2.3.1. Average Crystallite Size
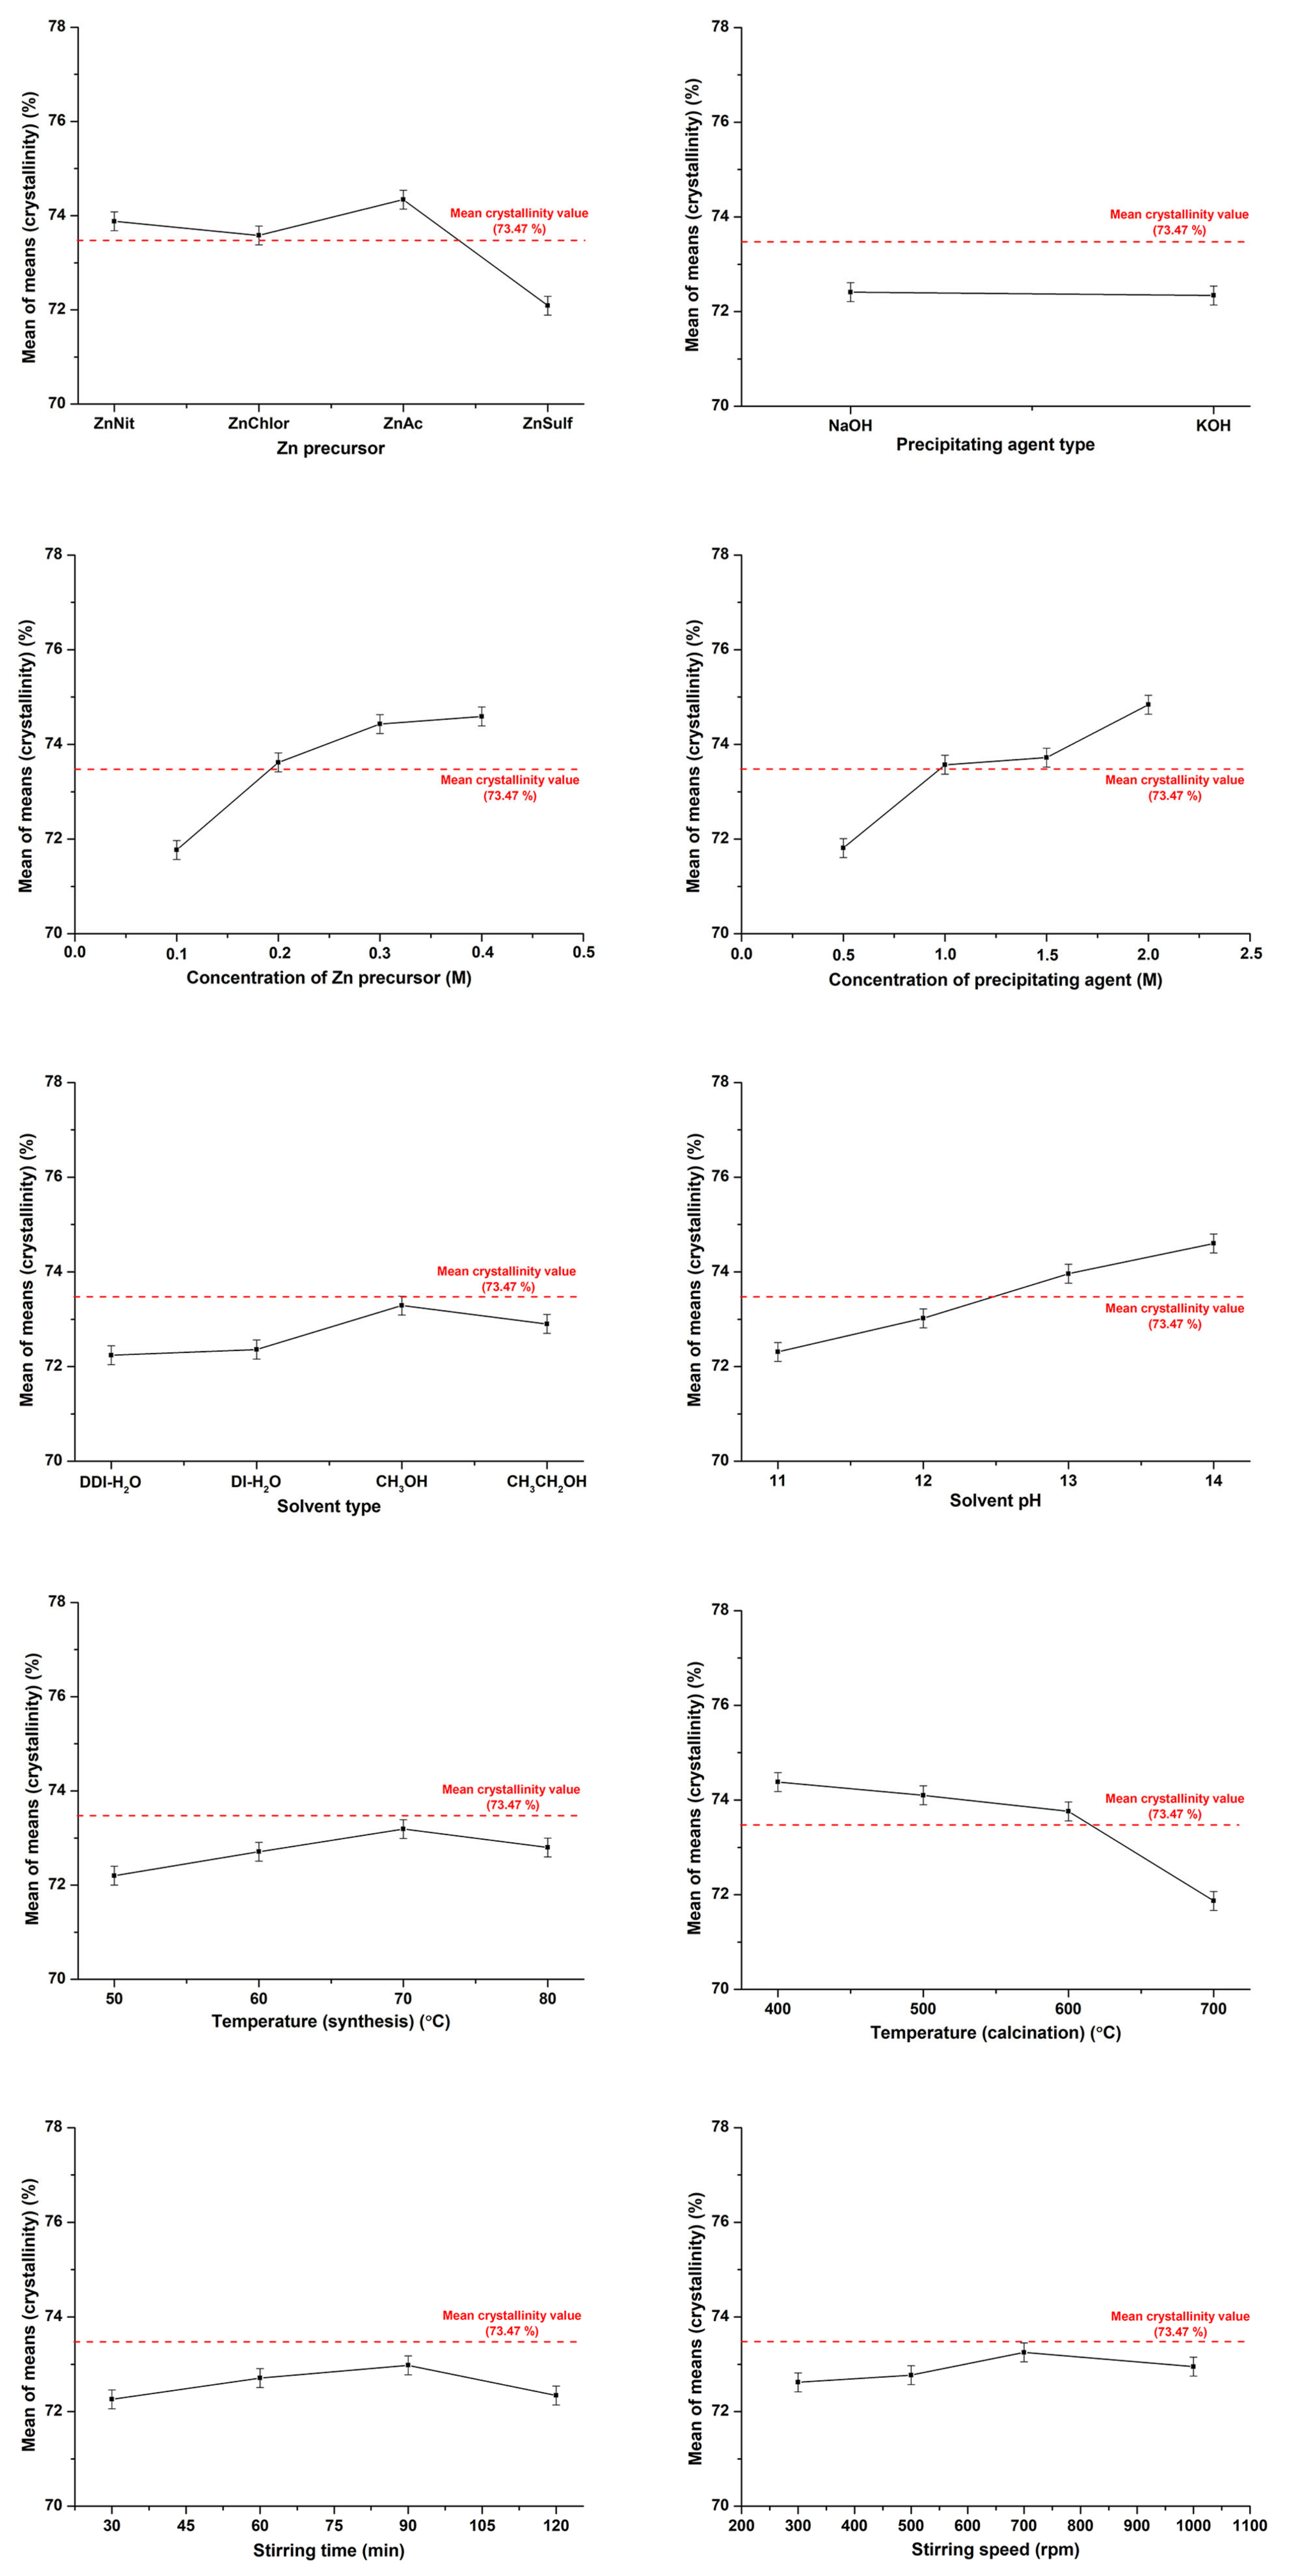
2.3.2. Crystallinity
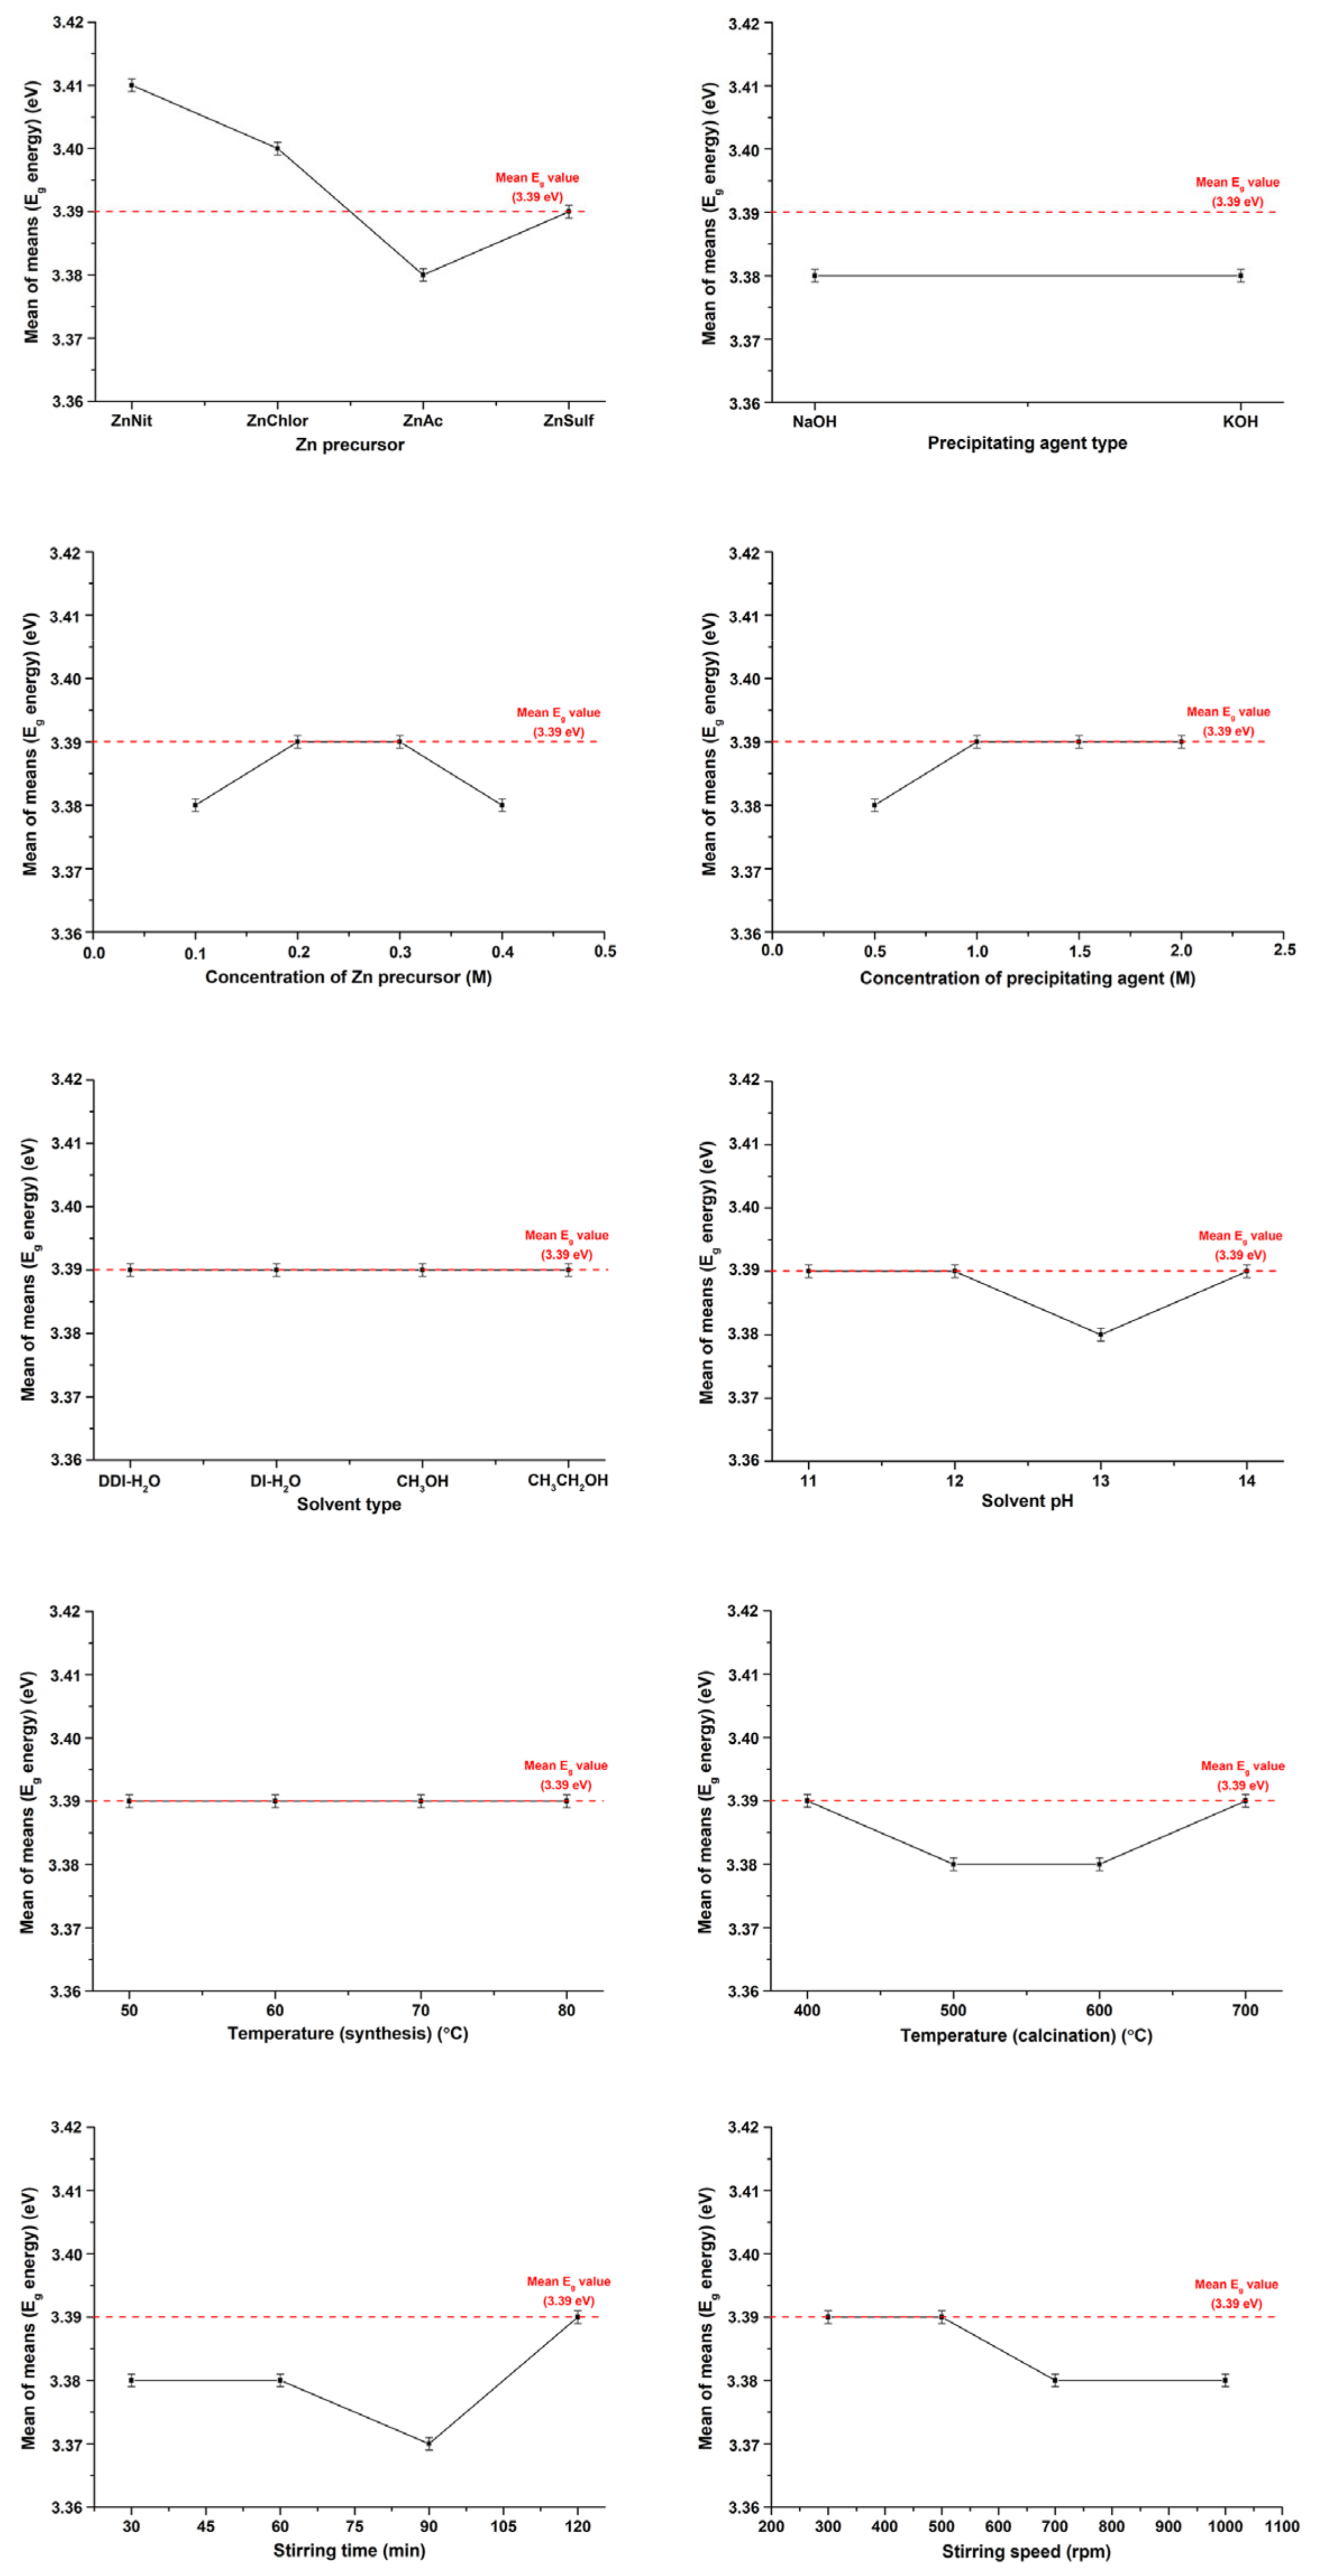
2.3.3. Energy Band Gap (Eg)
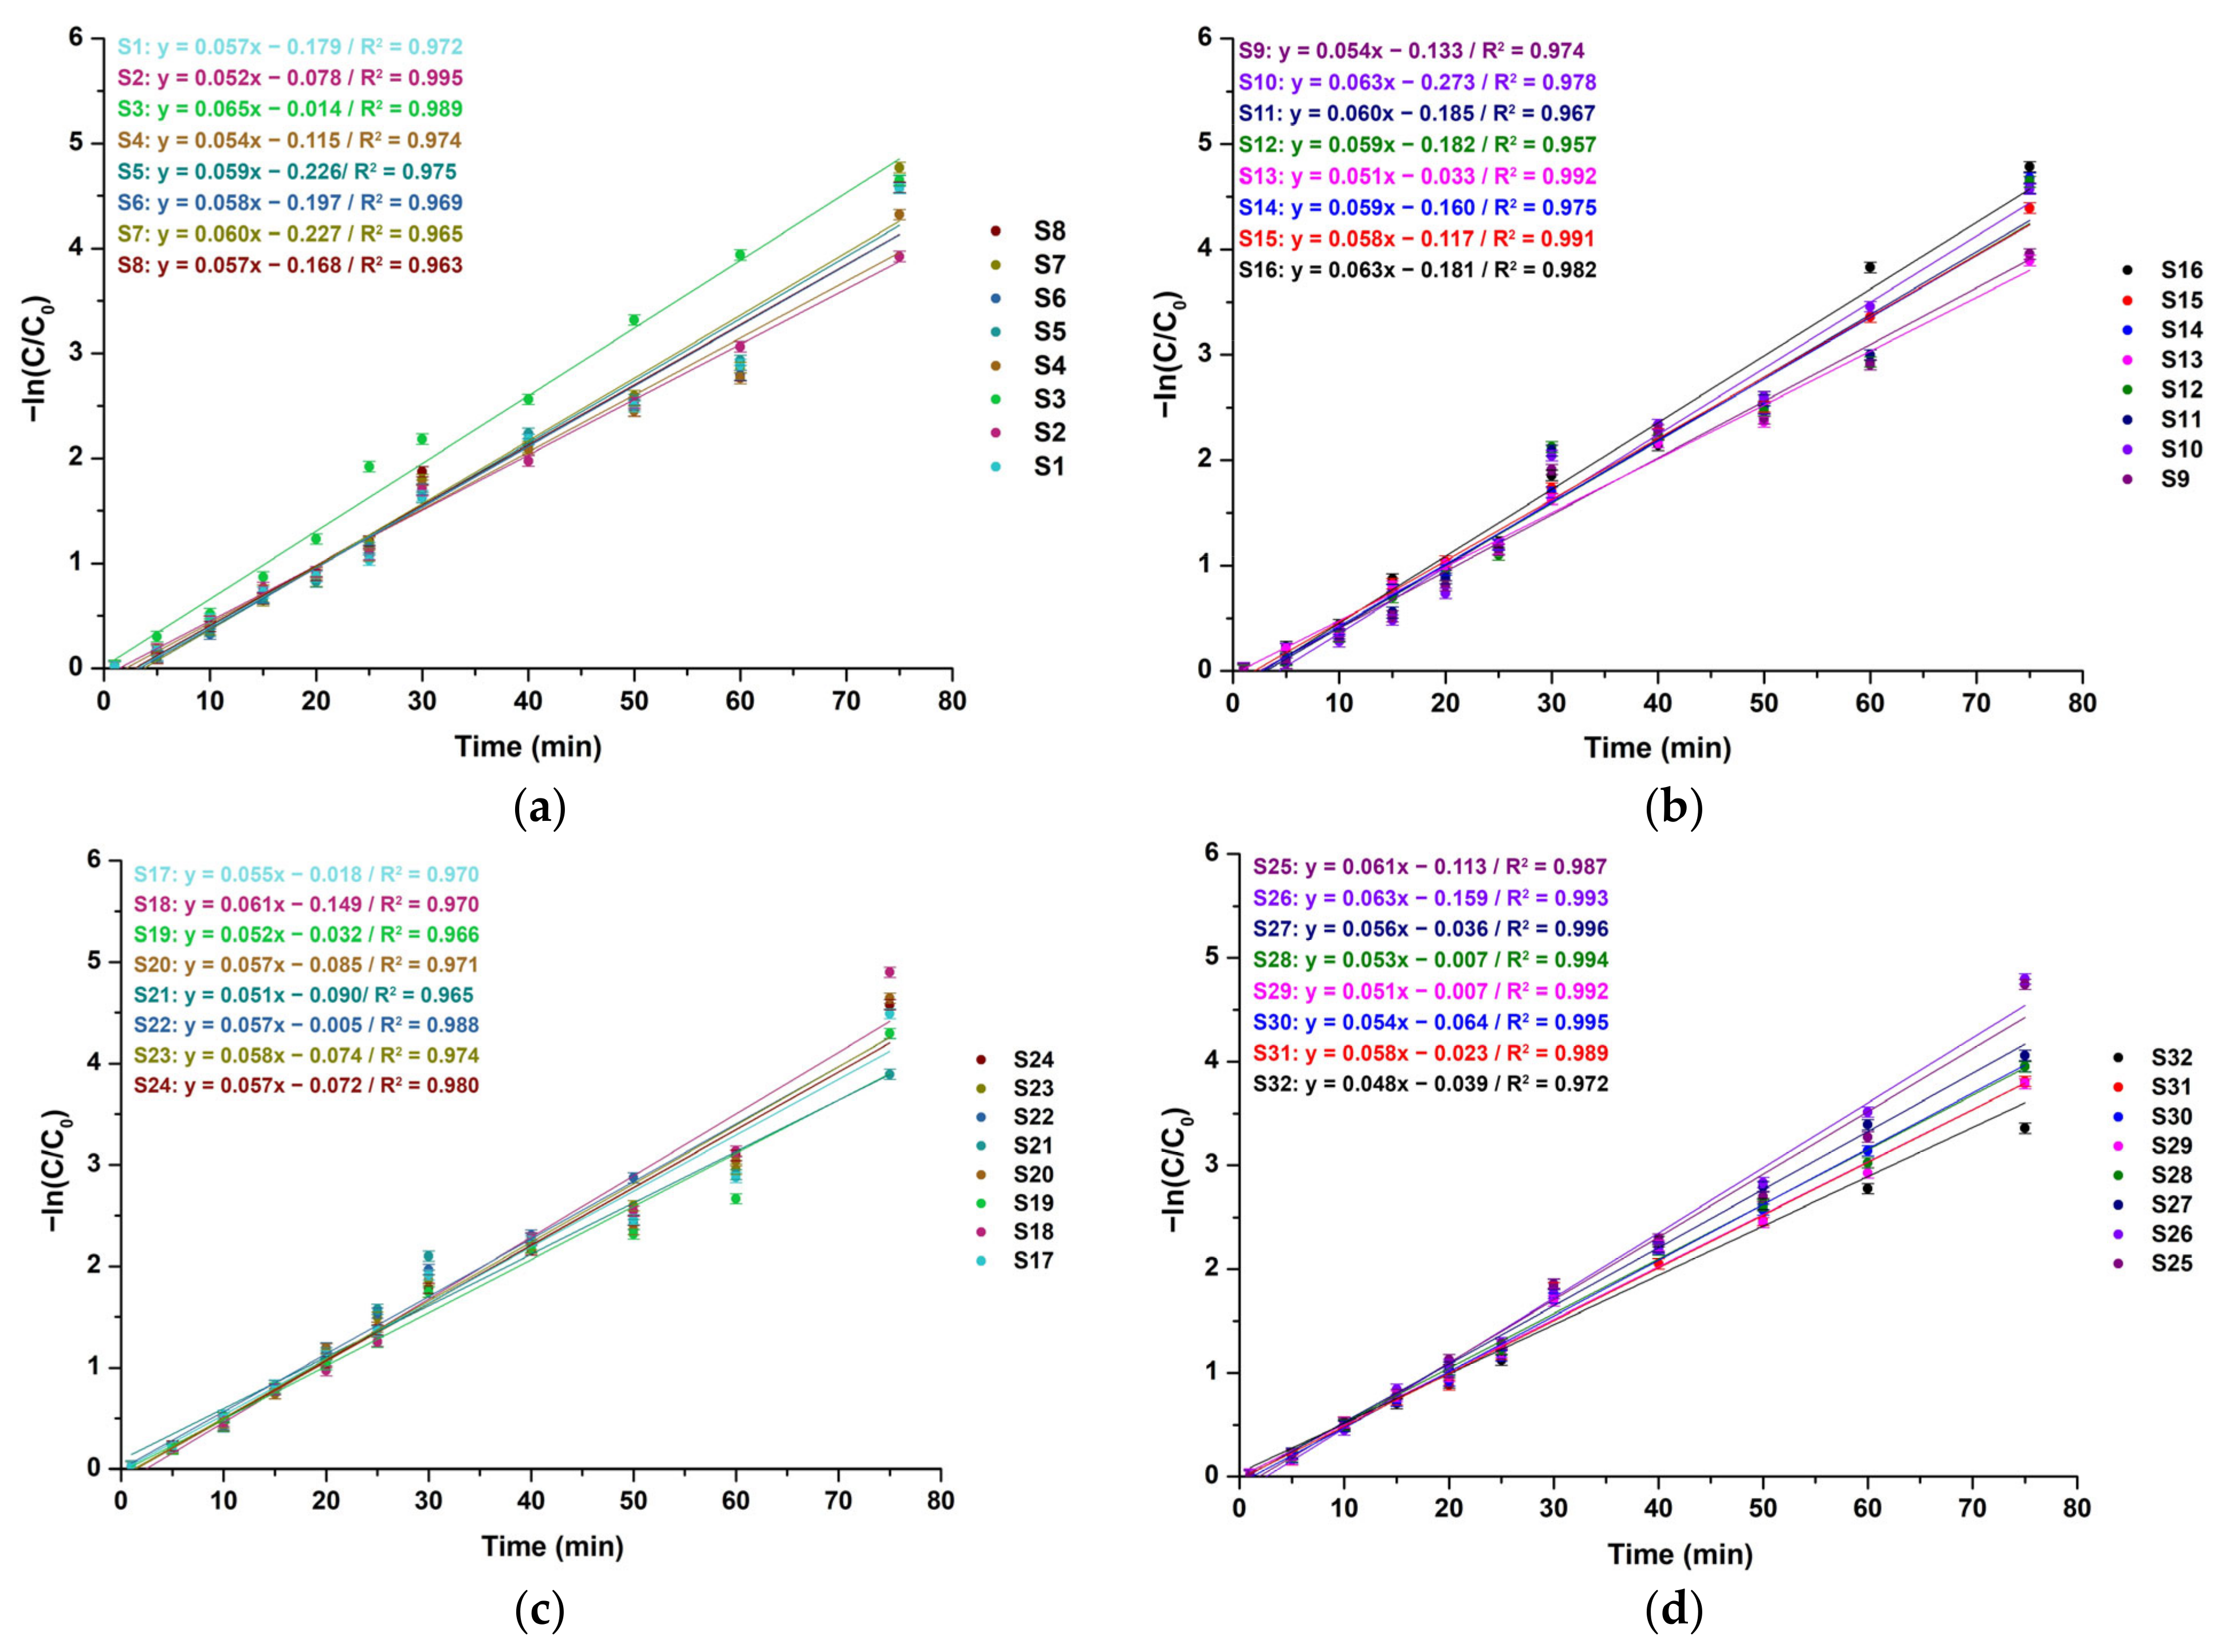
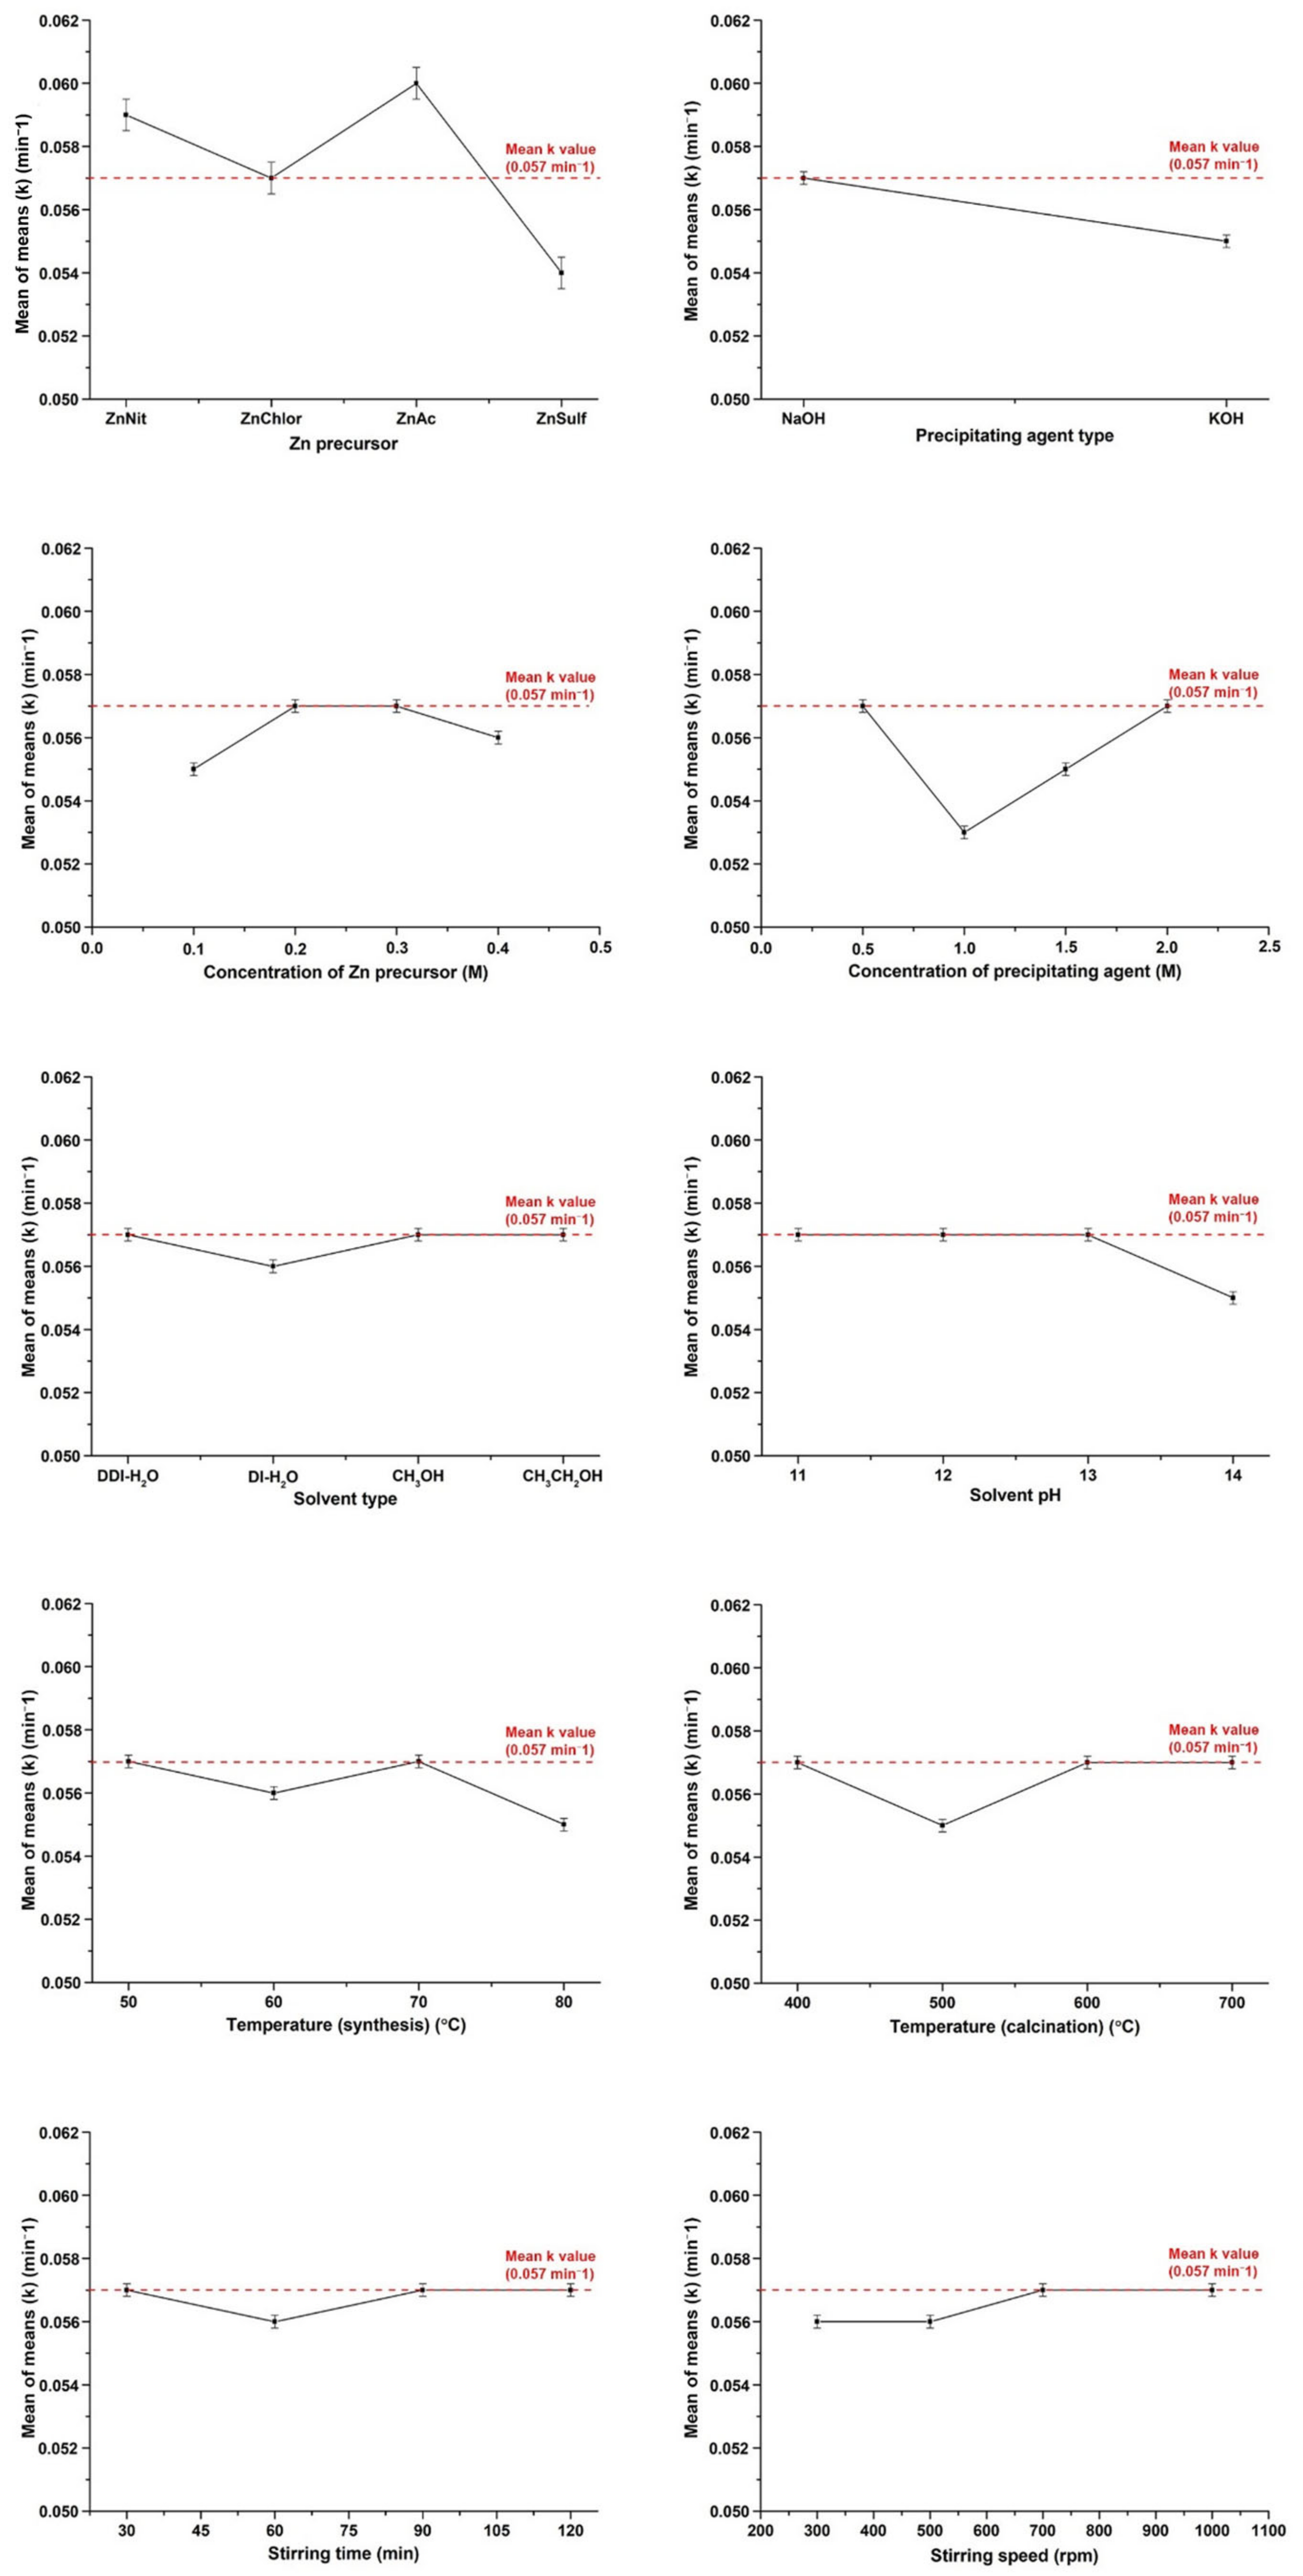
2.3.4. Apparent Rate Constant (k)
2.4. Synthesis and Characterization of the Optimized ZnO Sample According to the Taguchi Statistical Approach
2.4.1. Synthesis of the Optimized ZnO Sample
2.4.2. Characterization of the Optimized ZnO Sample
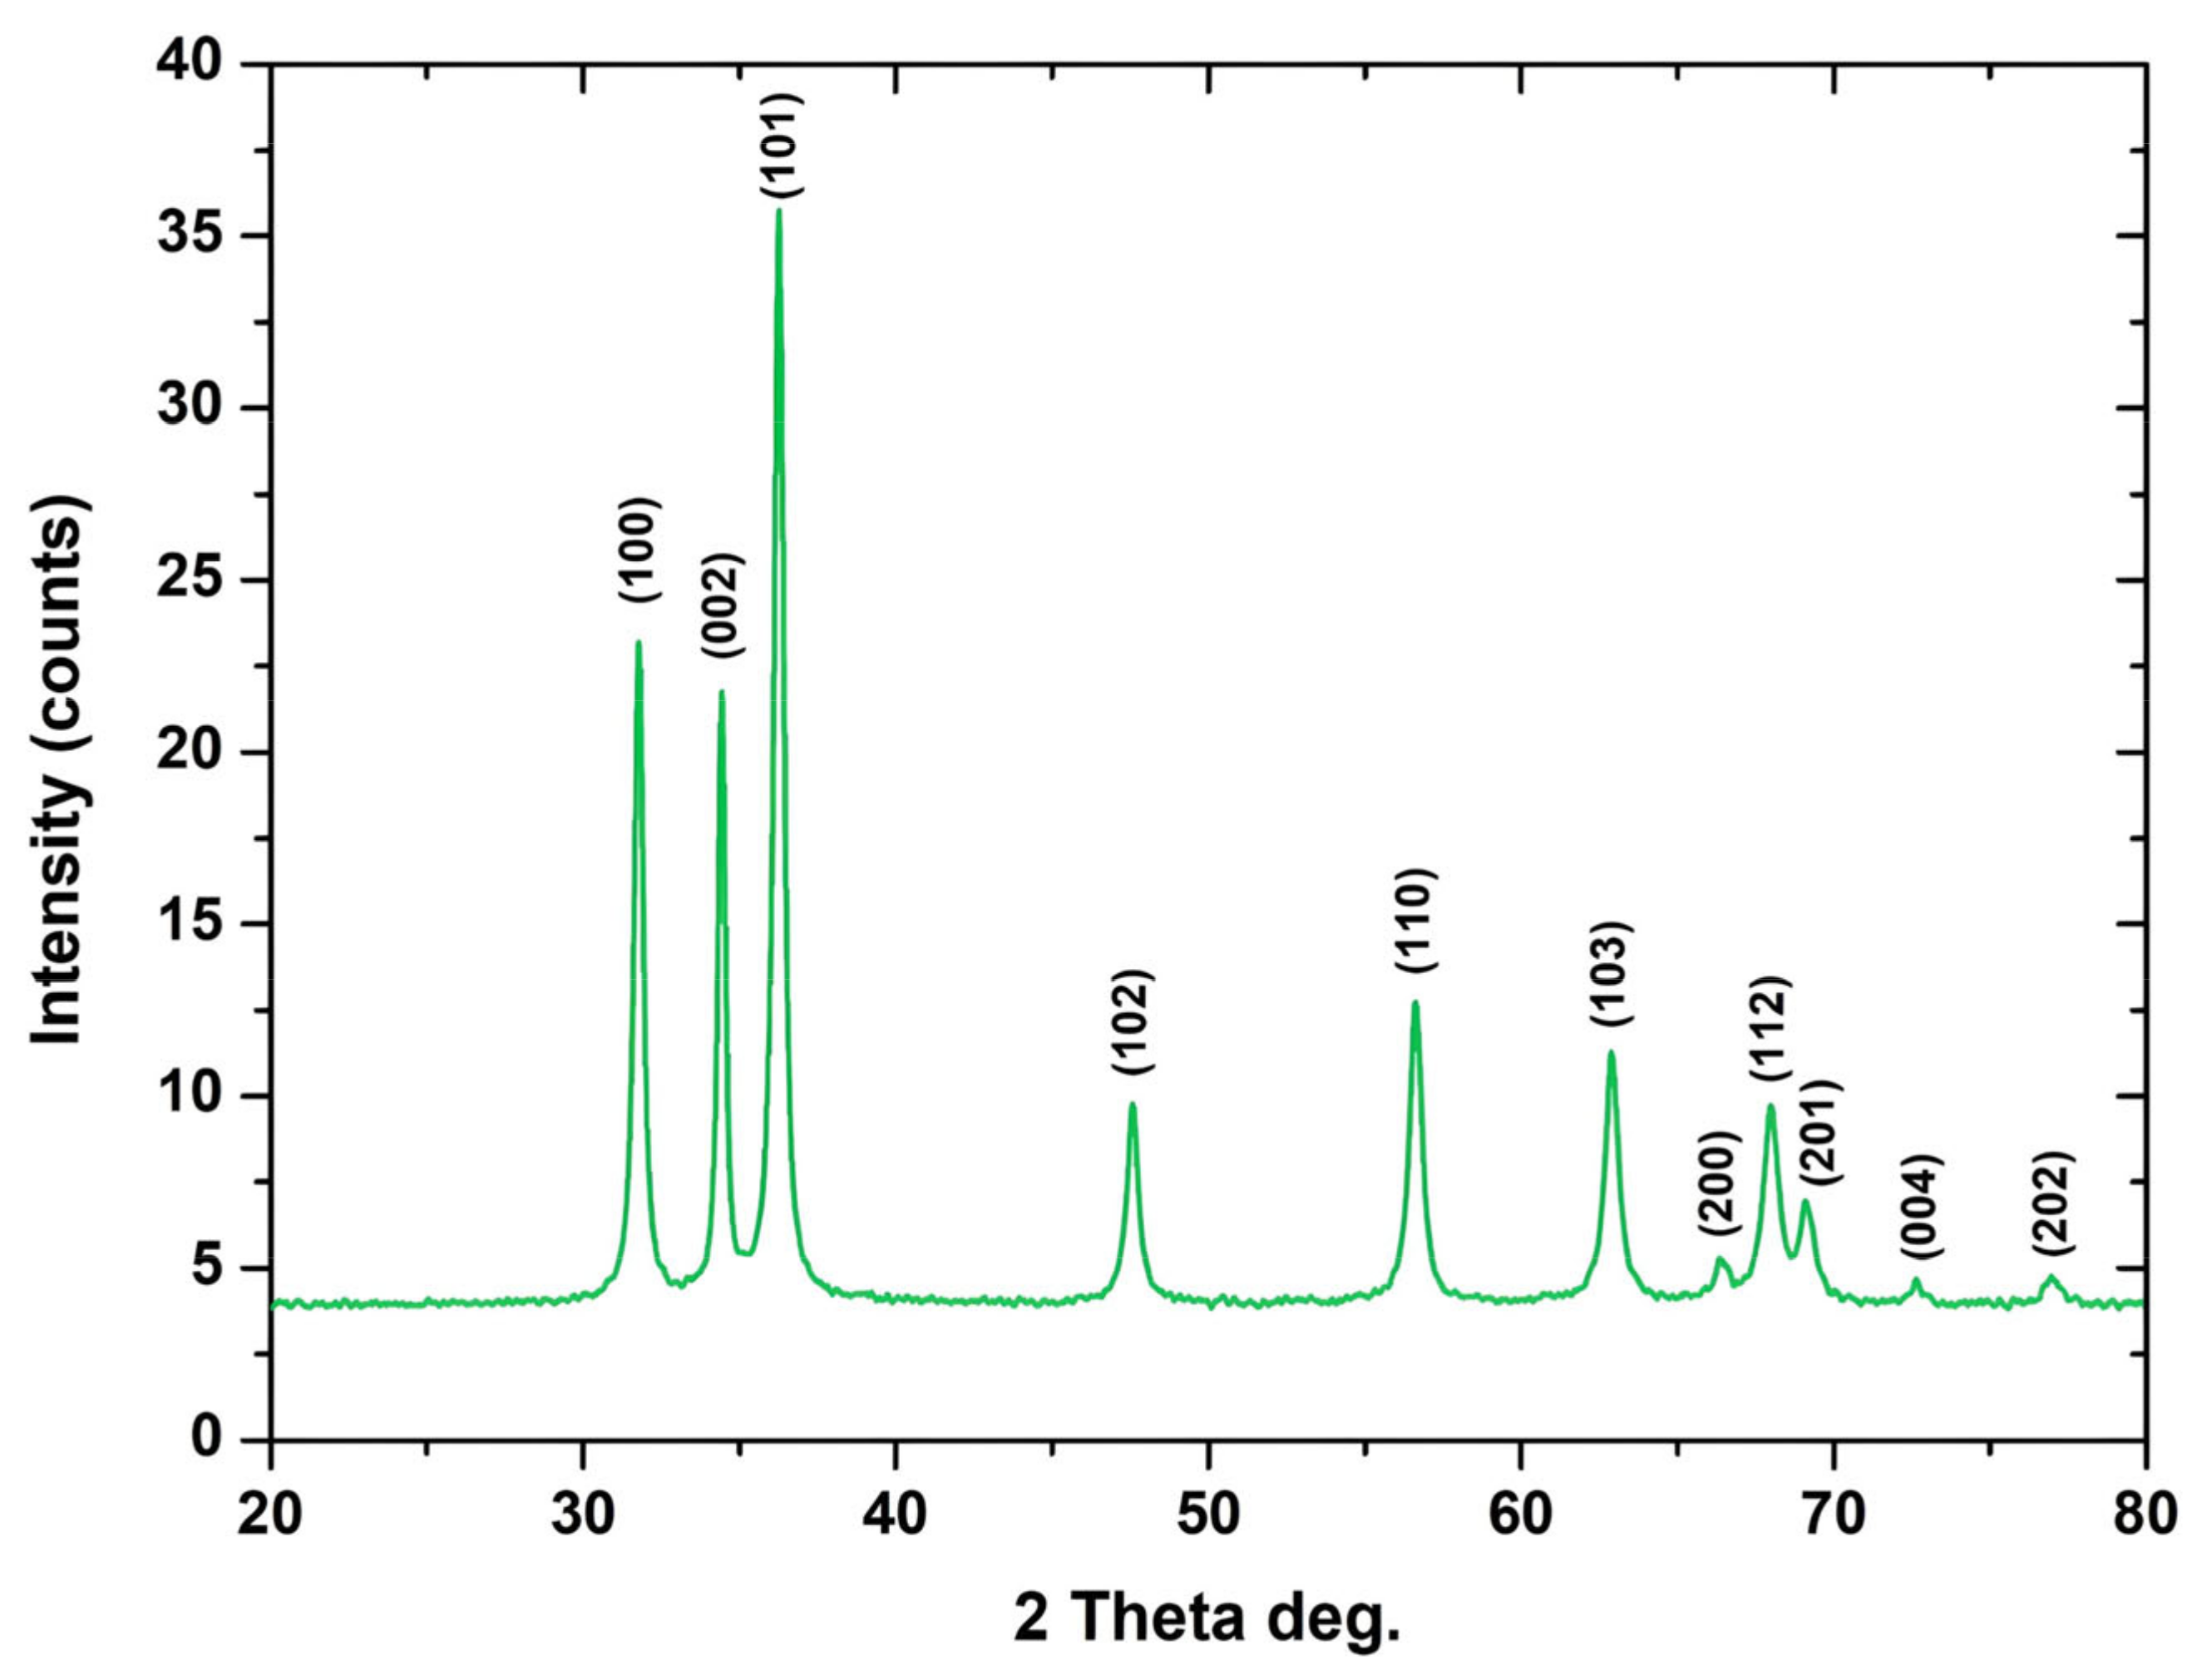
XRD Analysis
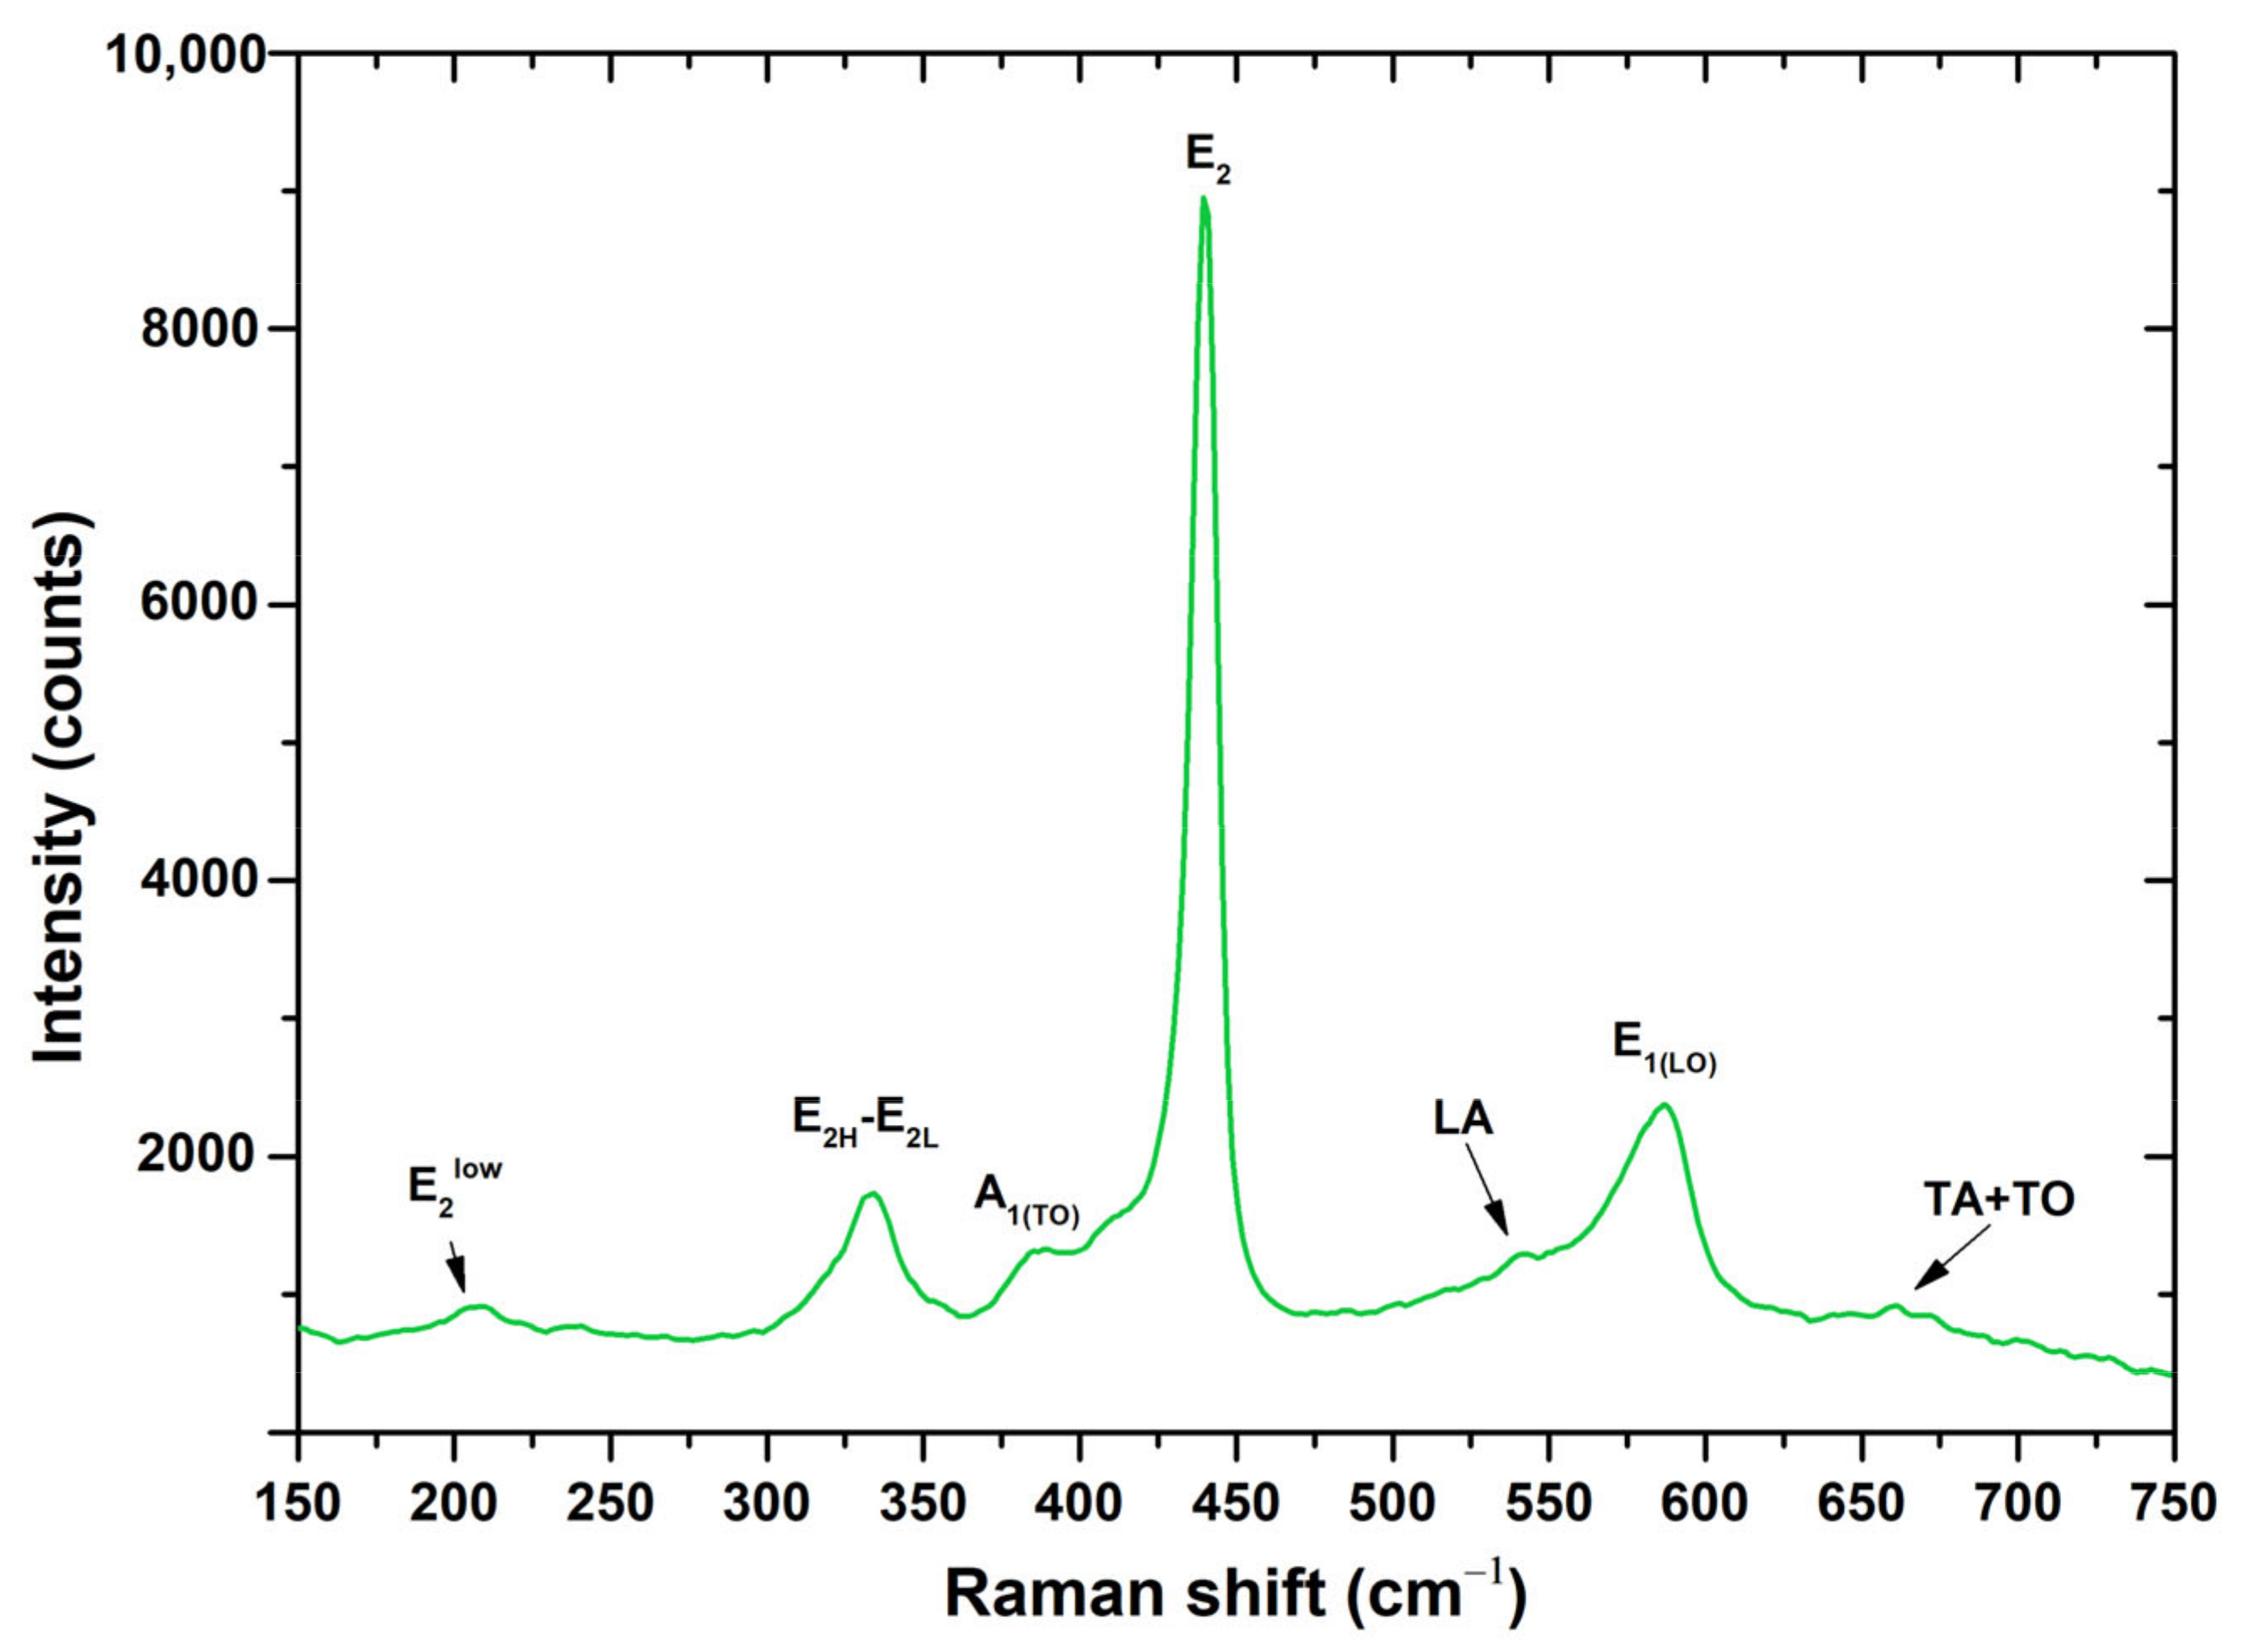
Micro-Raman Analysis
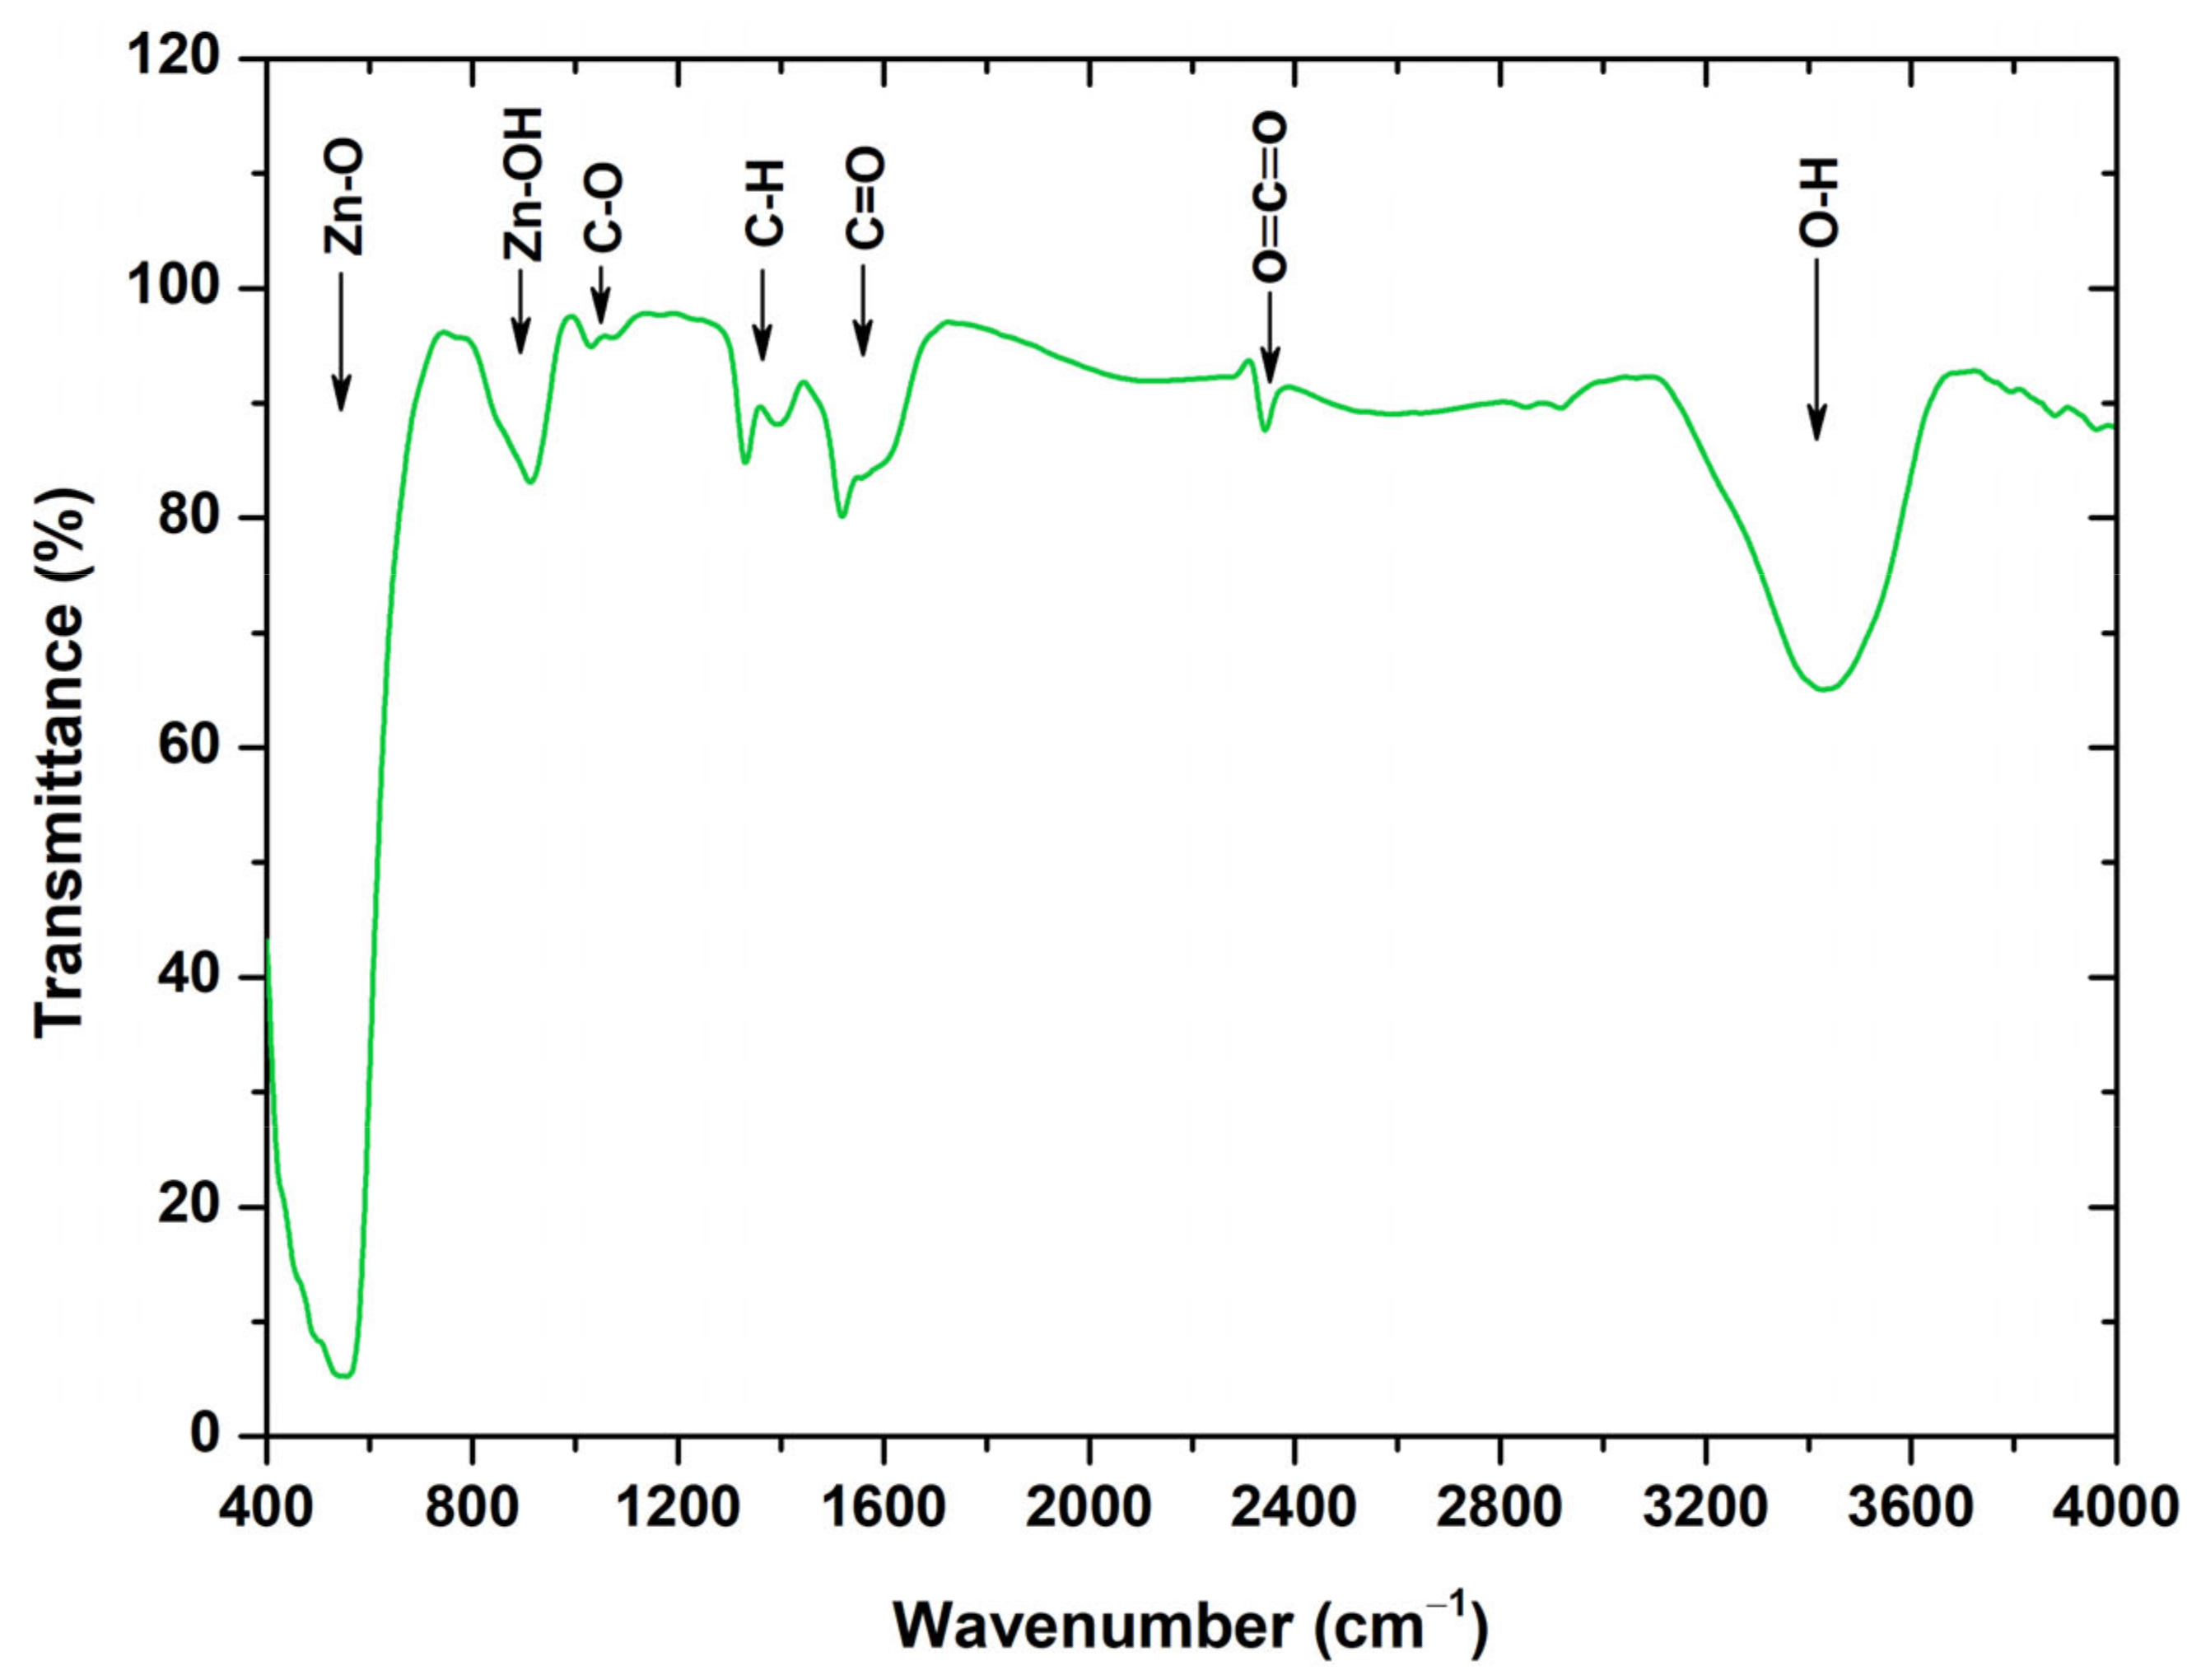
FT-IR Analysis
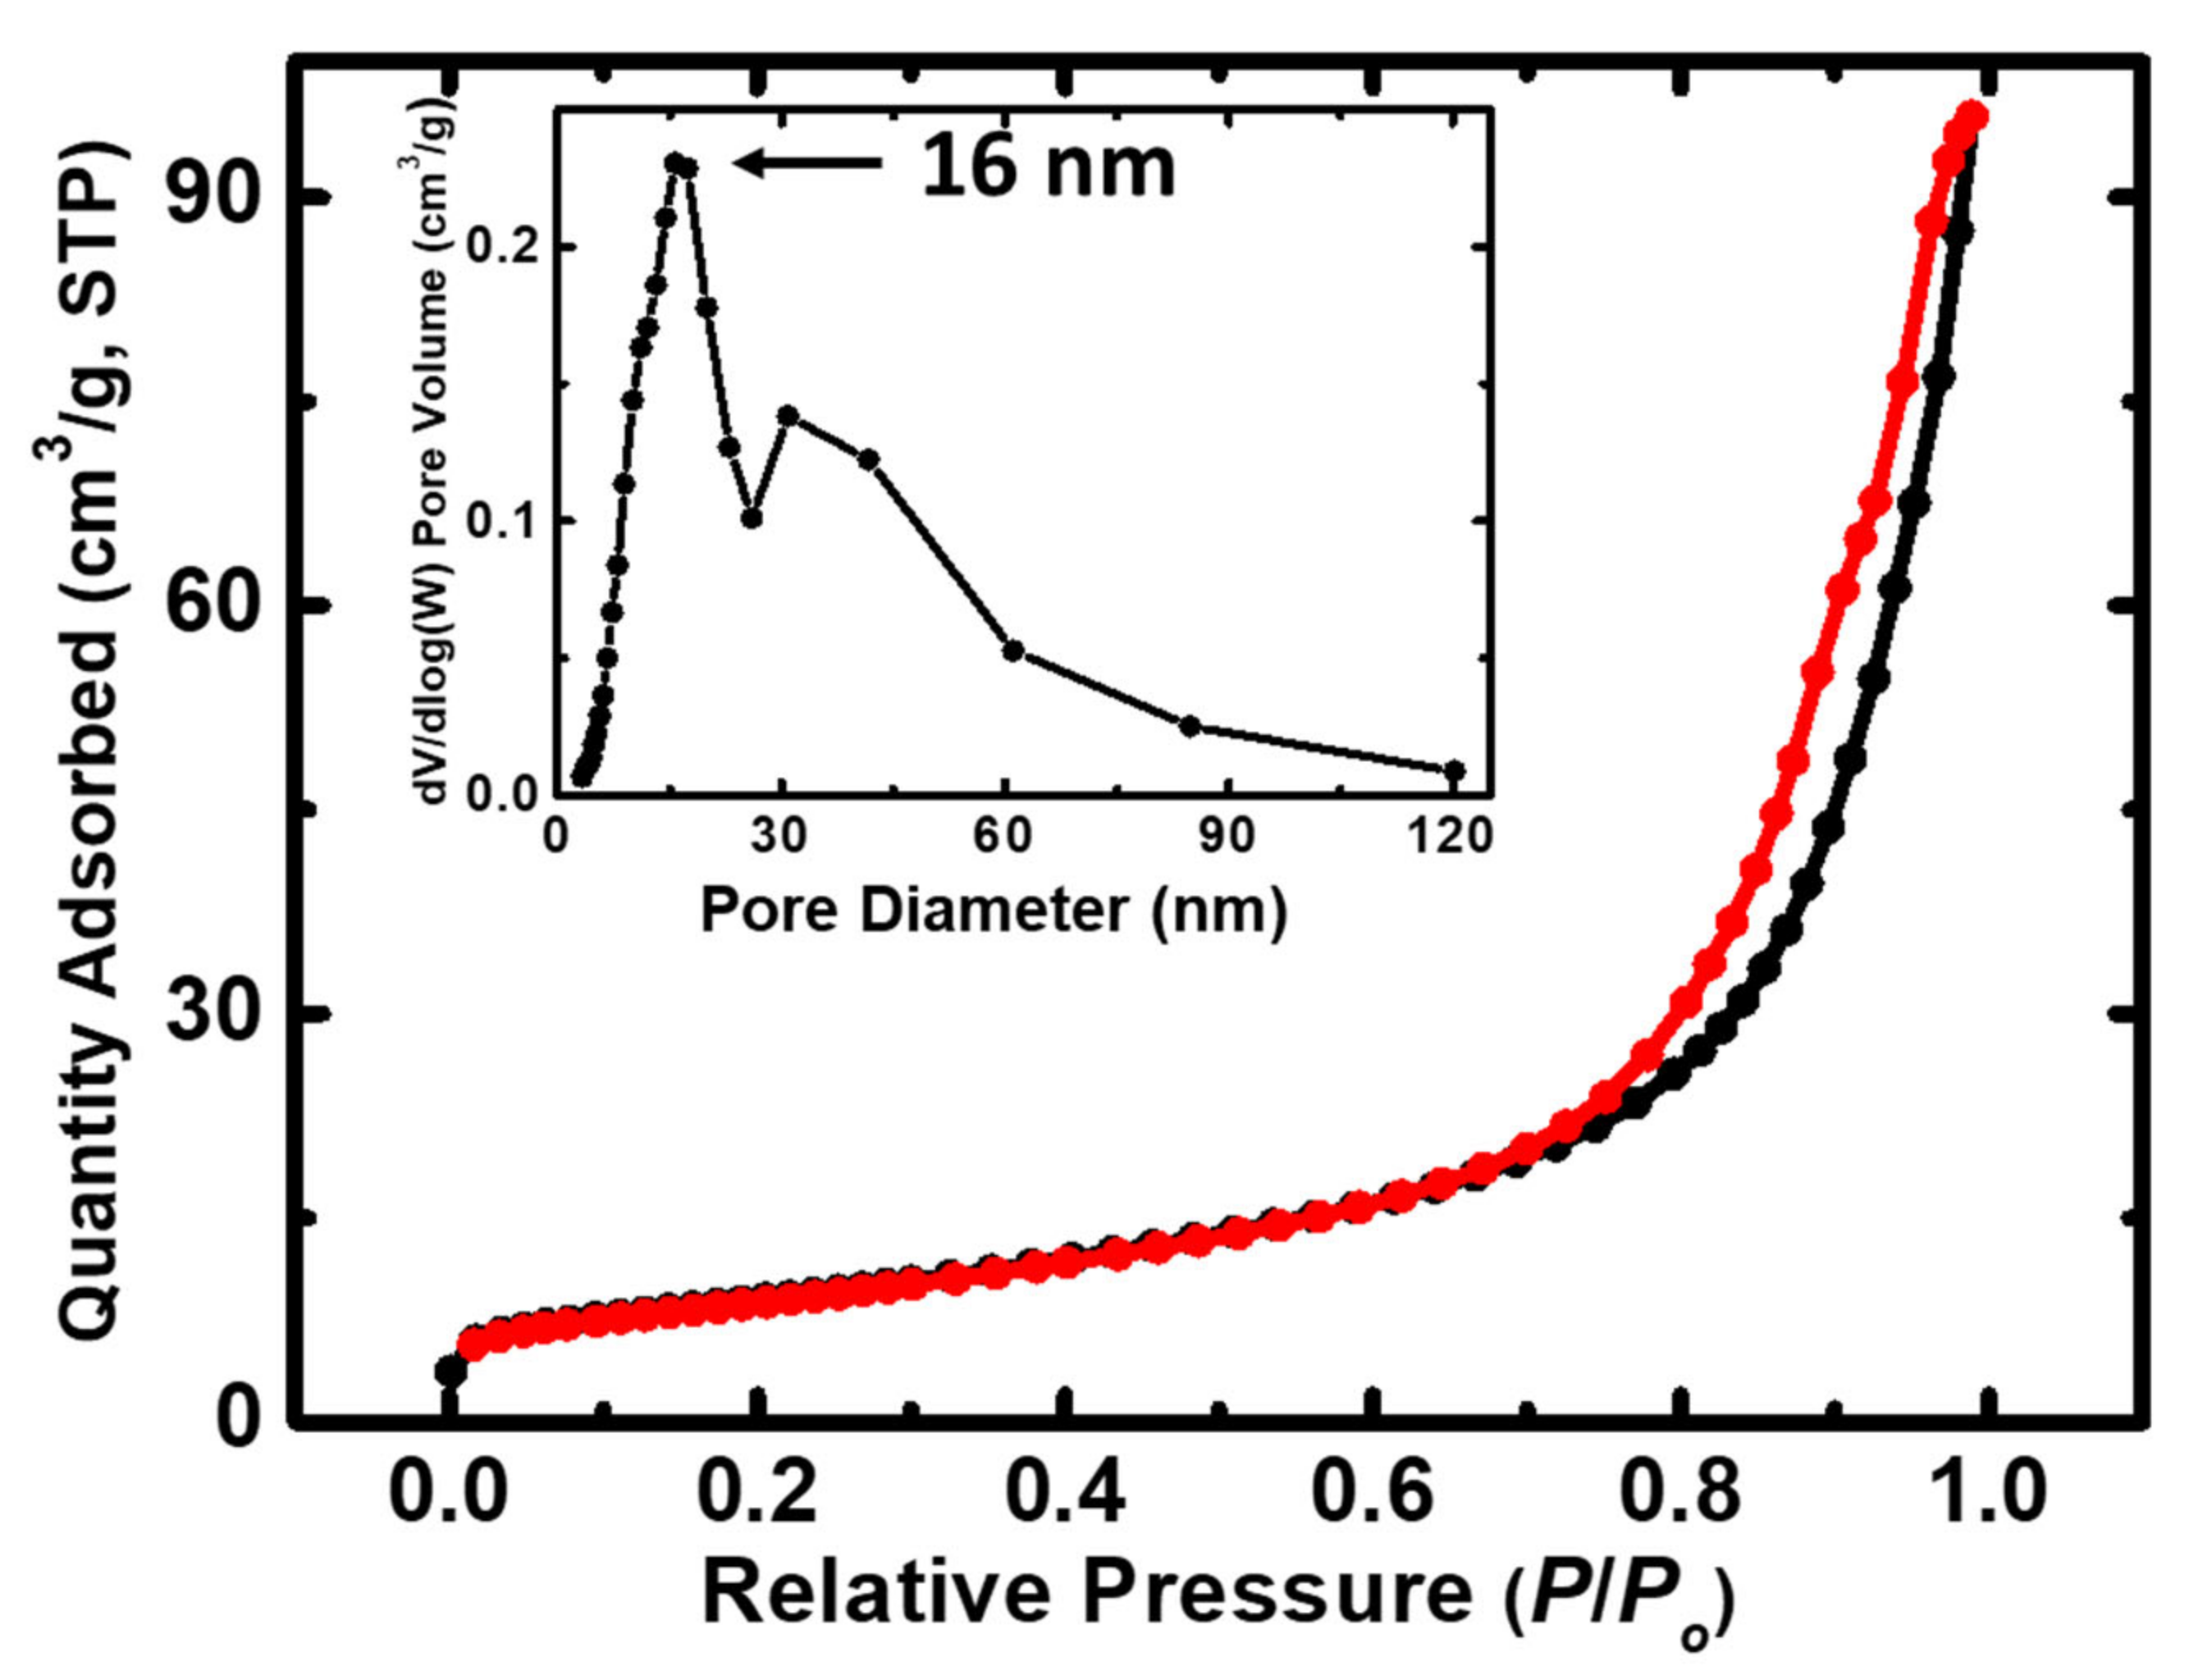
N2-Sorption Analysis
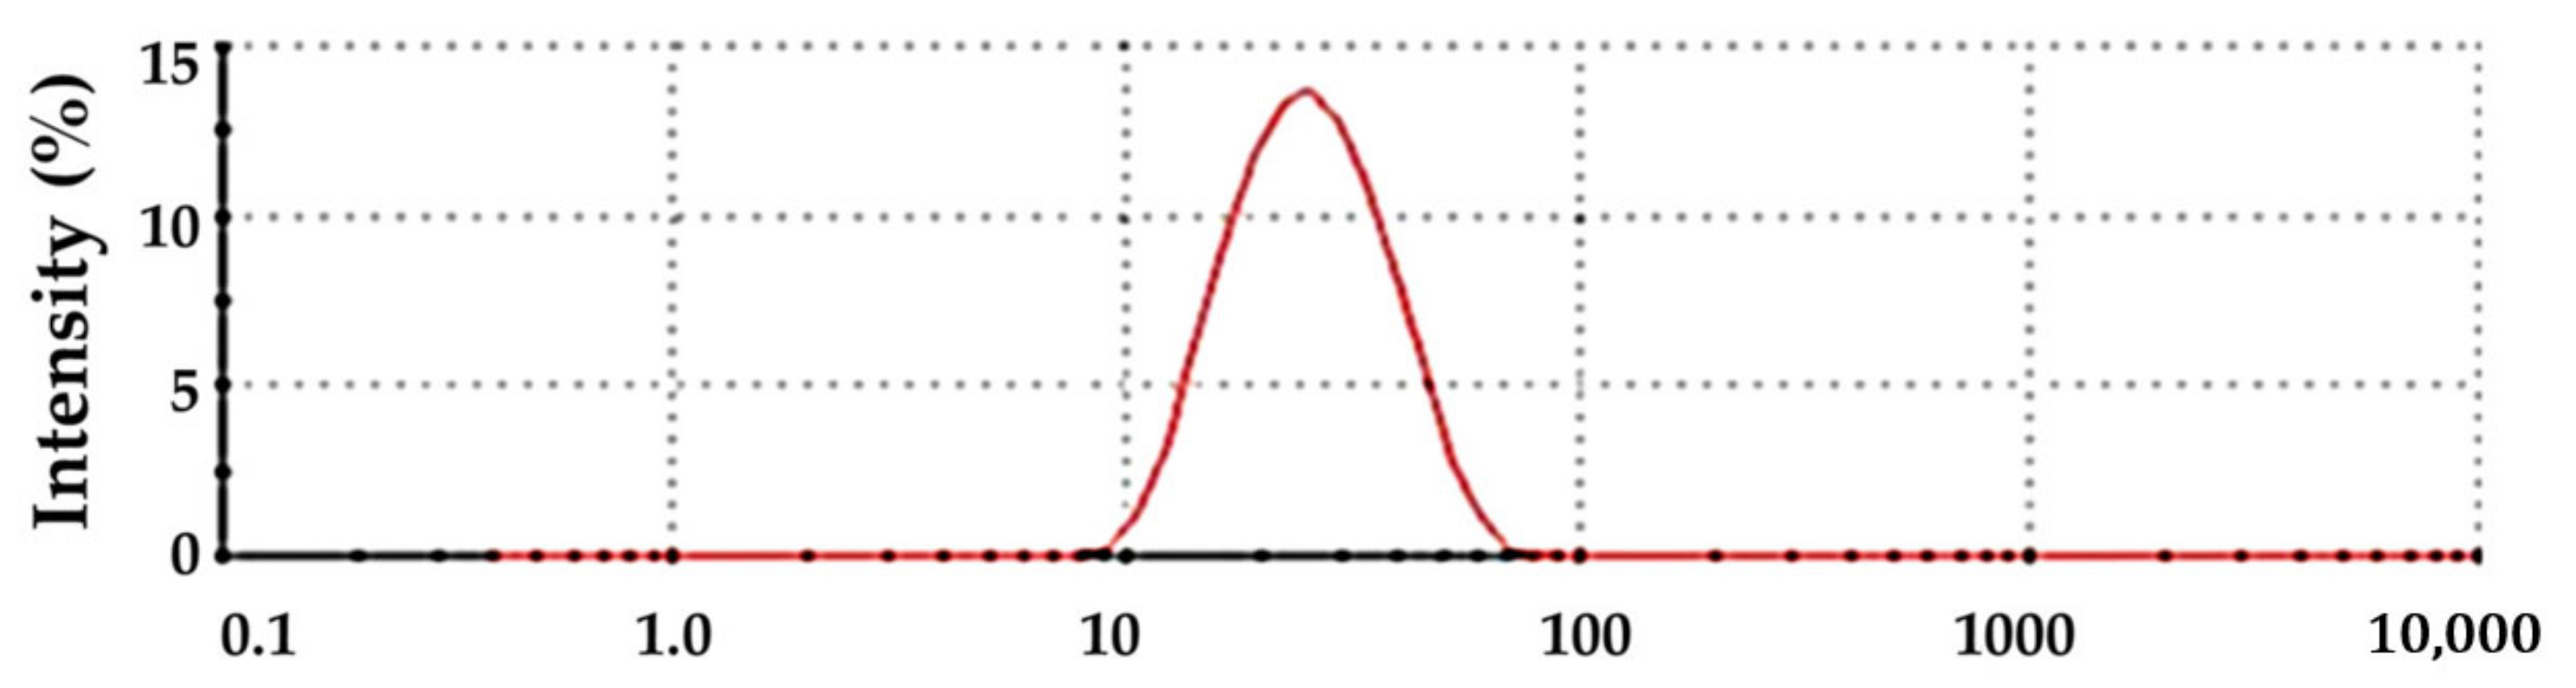
Dynamic Light Scattering (DLS) Analysis
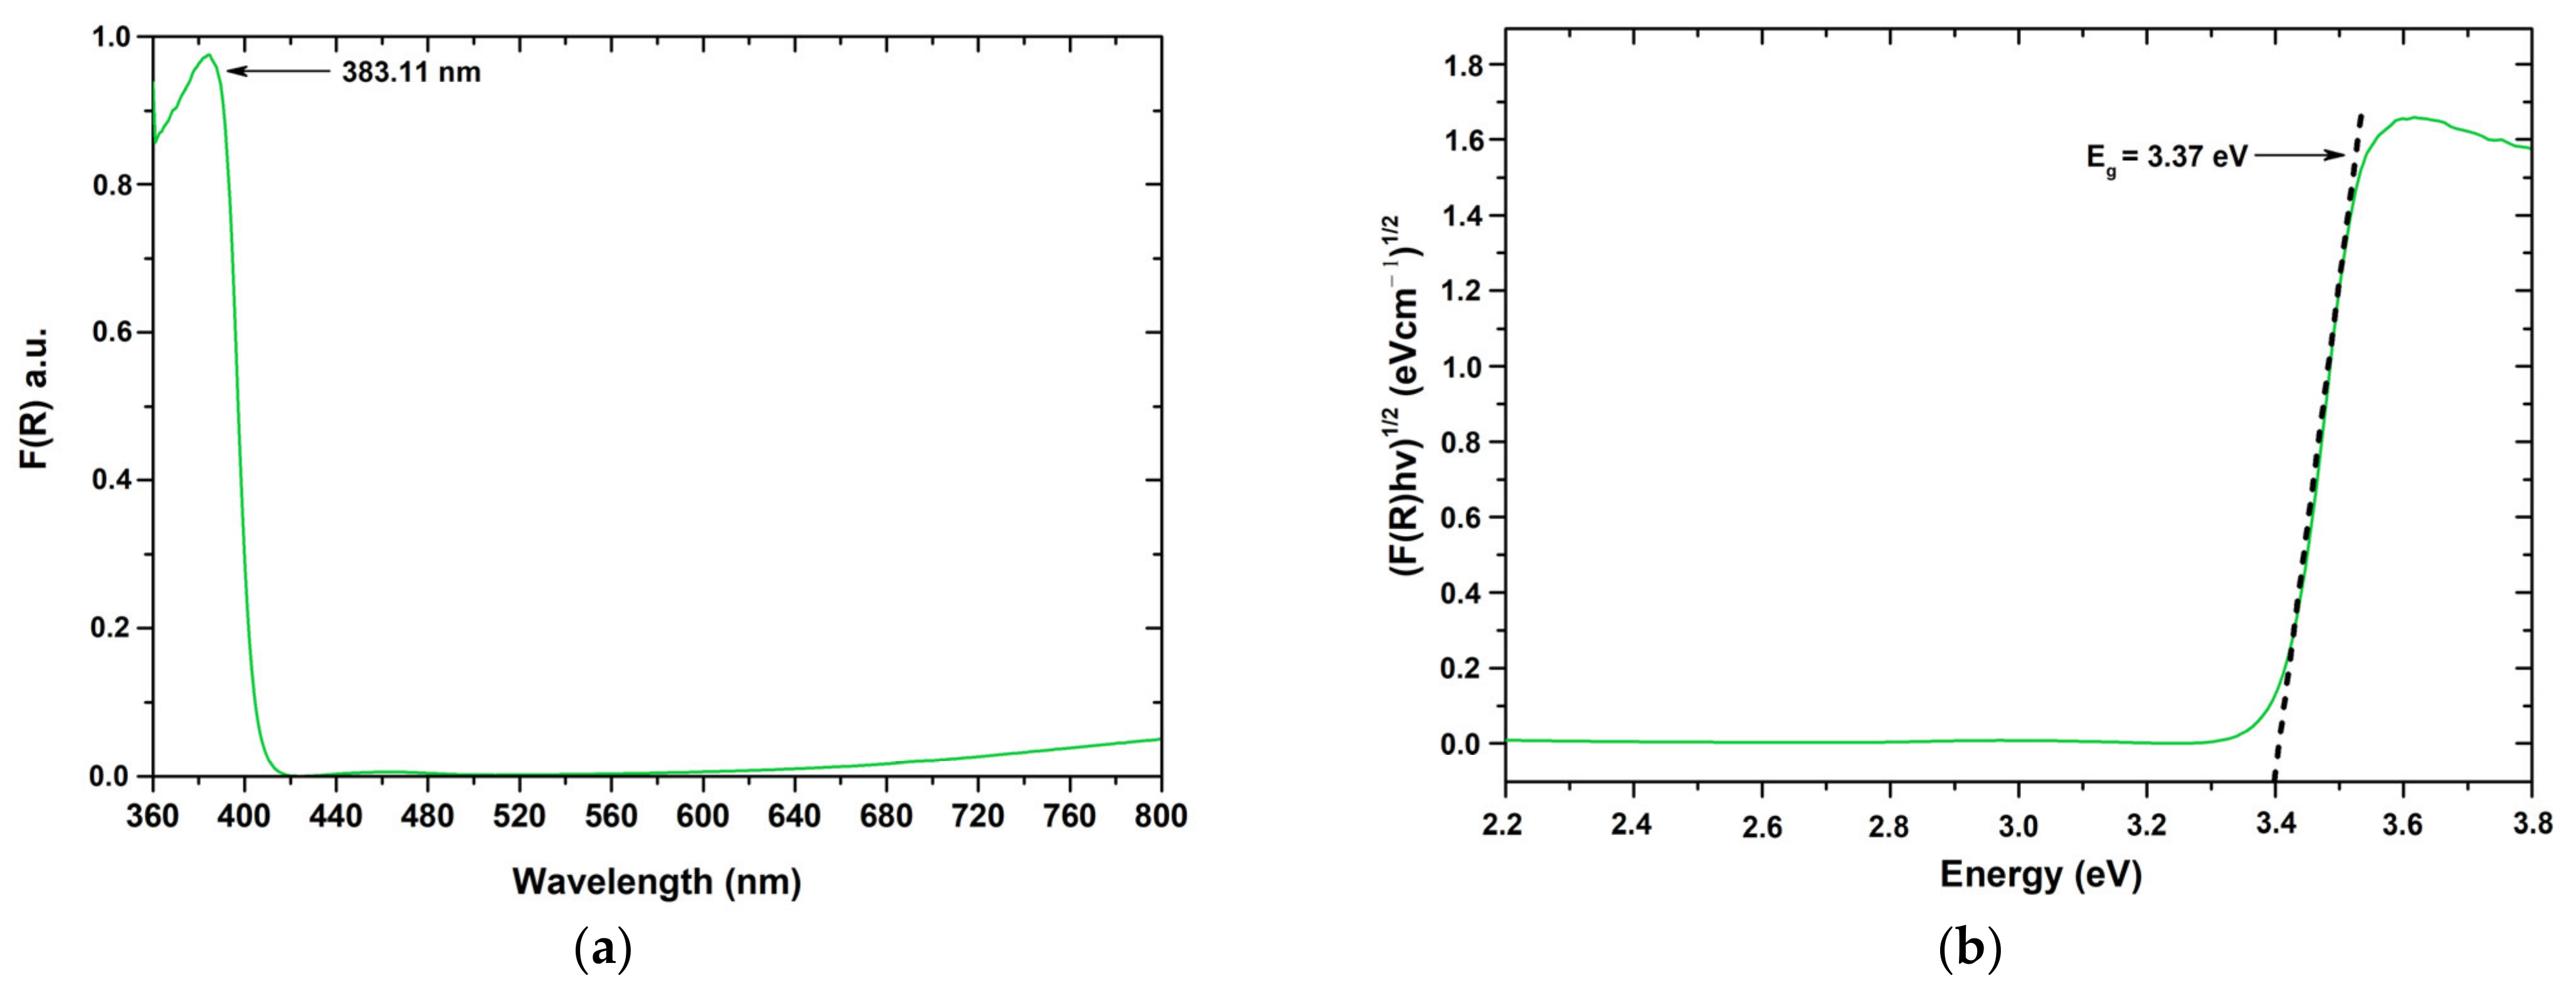
Diffuse Reflectance UV–Vis Spectroscopy Analysis (DRS)
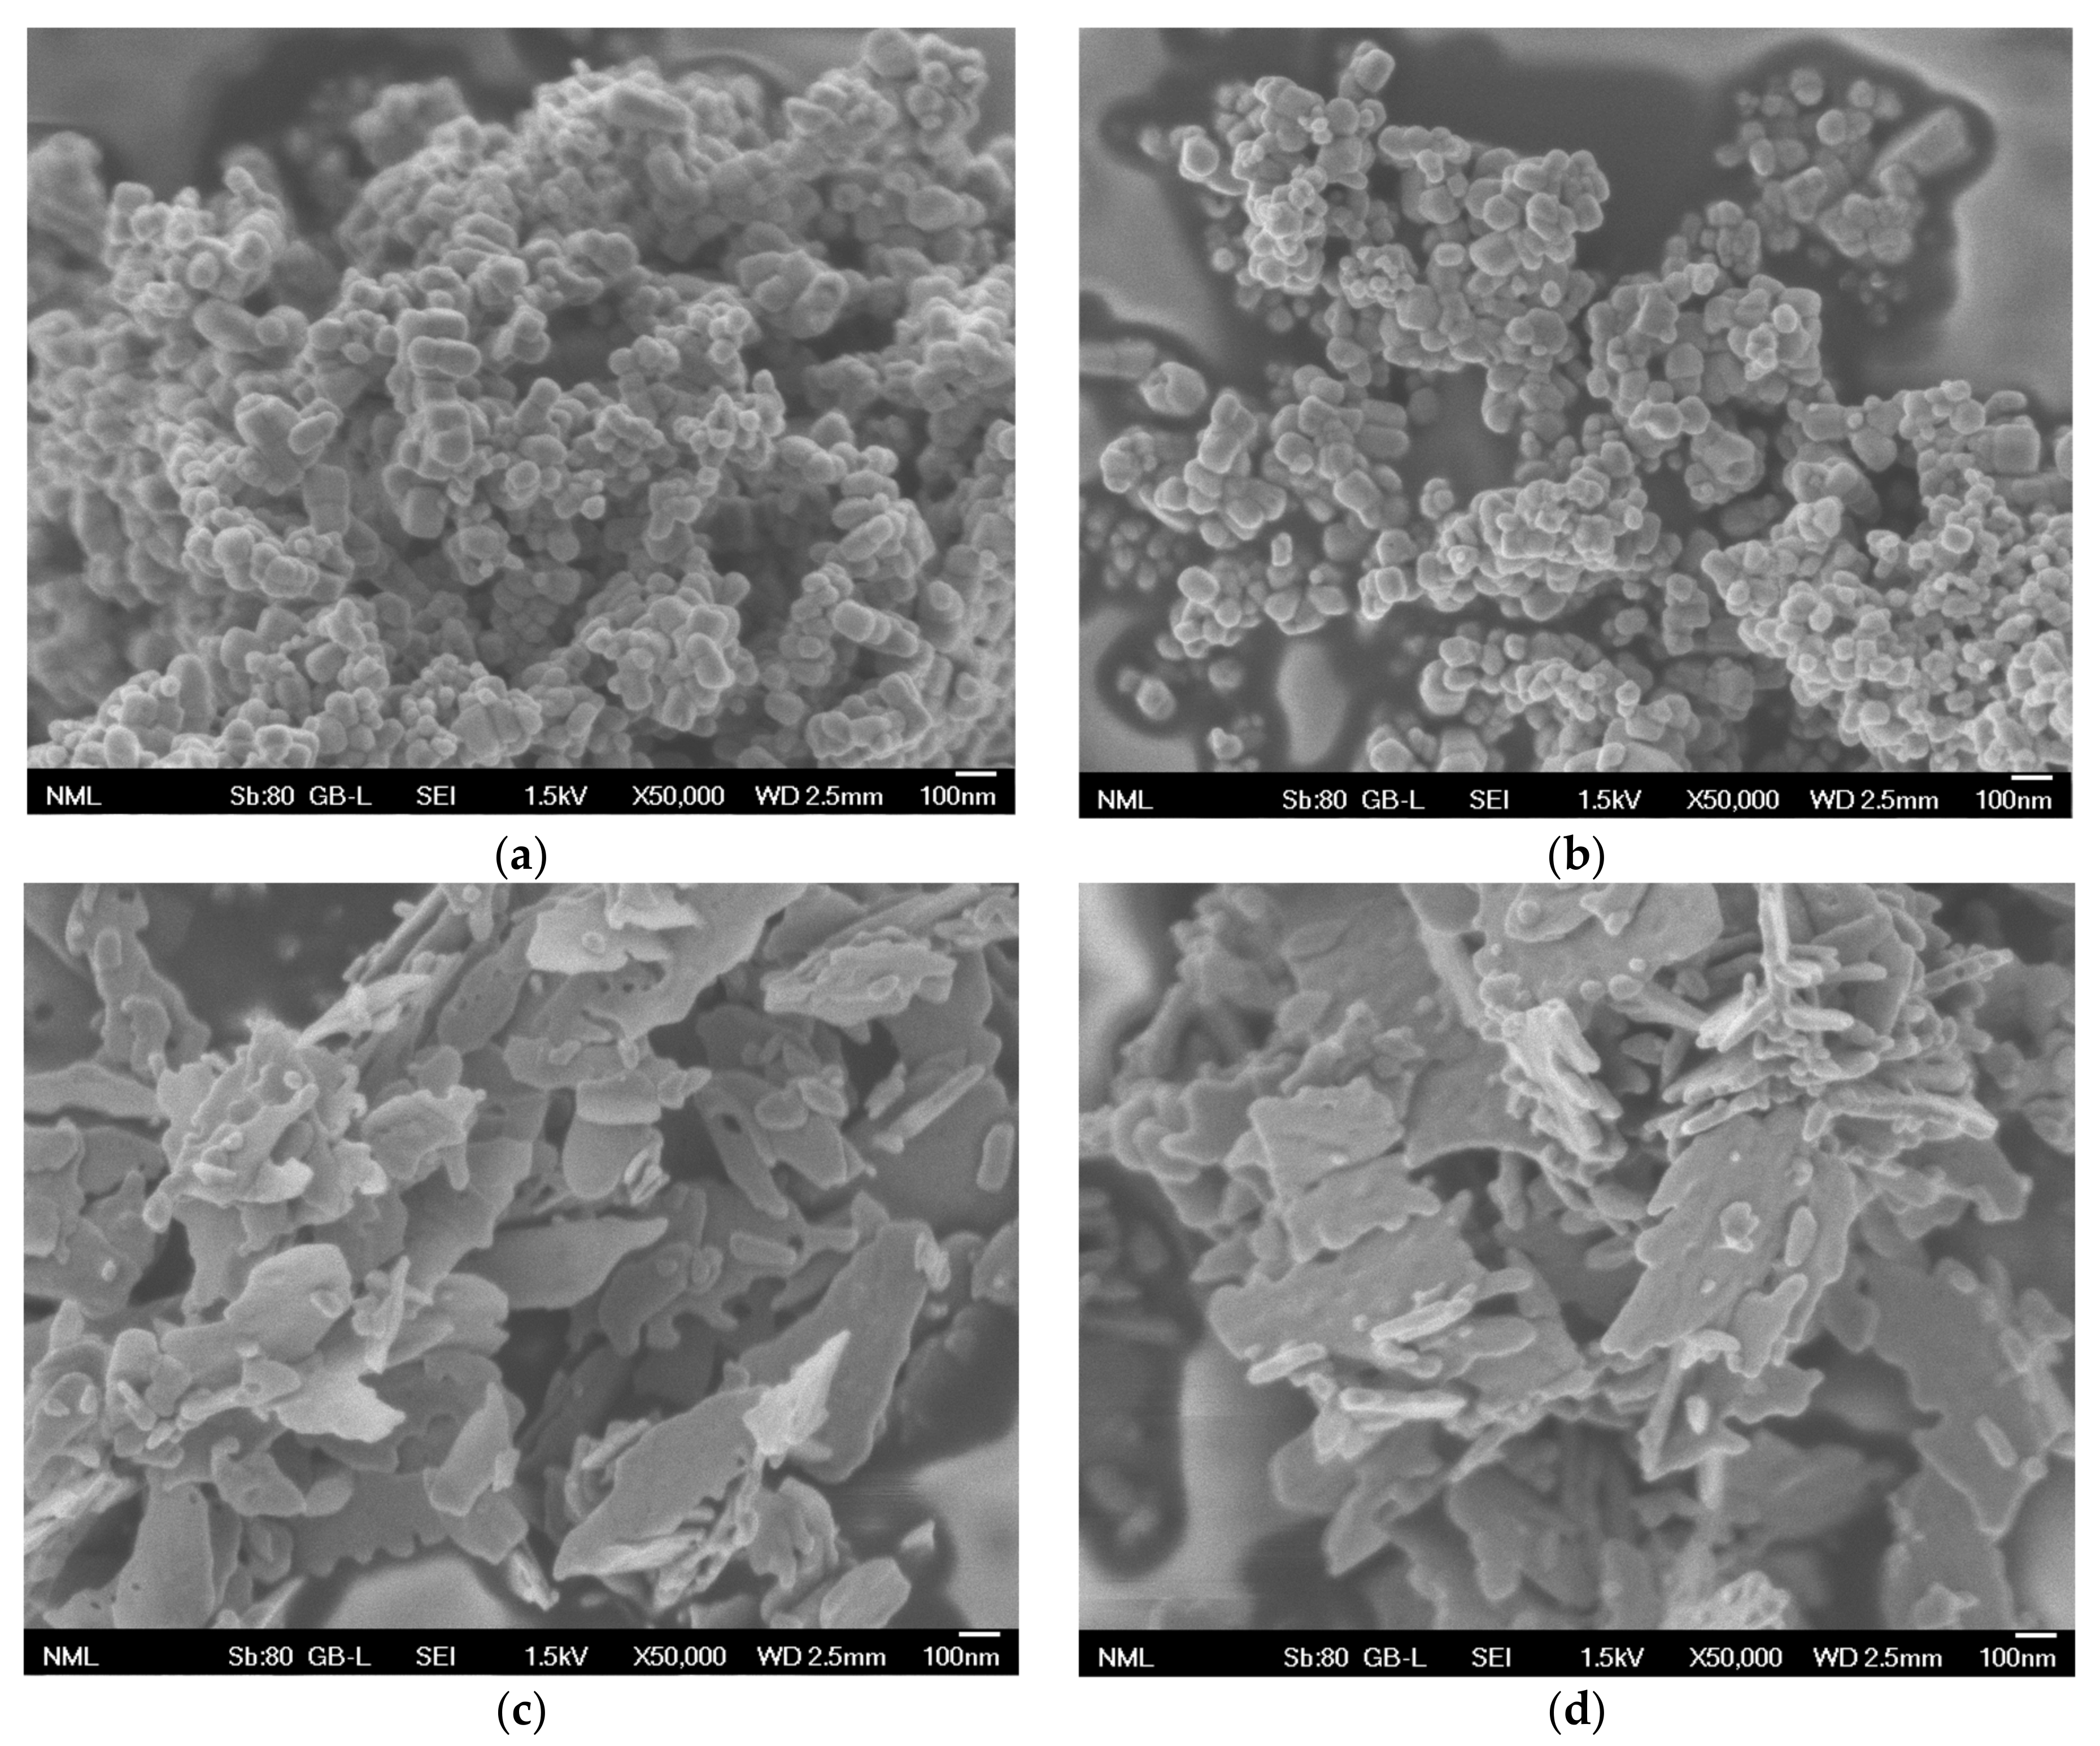
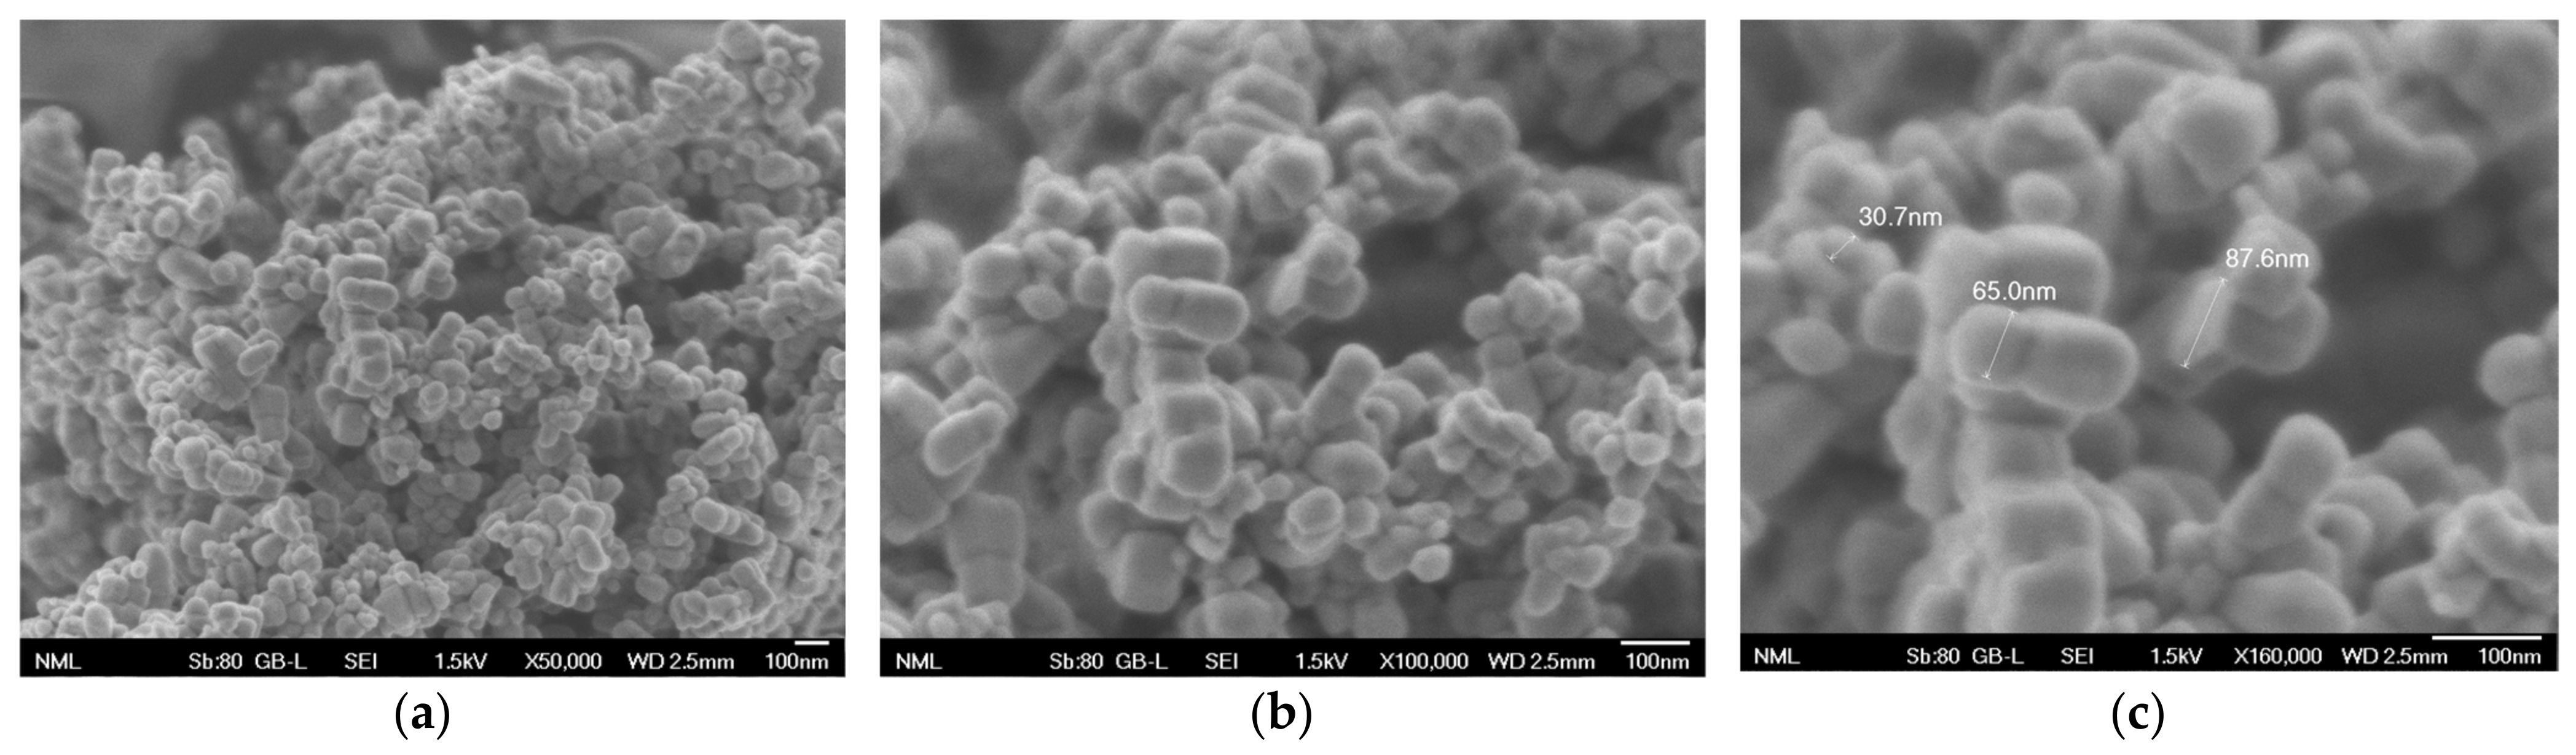
FESEM Analysis
2.4.3. Photocatalytic Study of the Optimized ZnO Sample
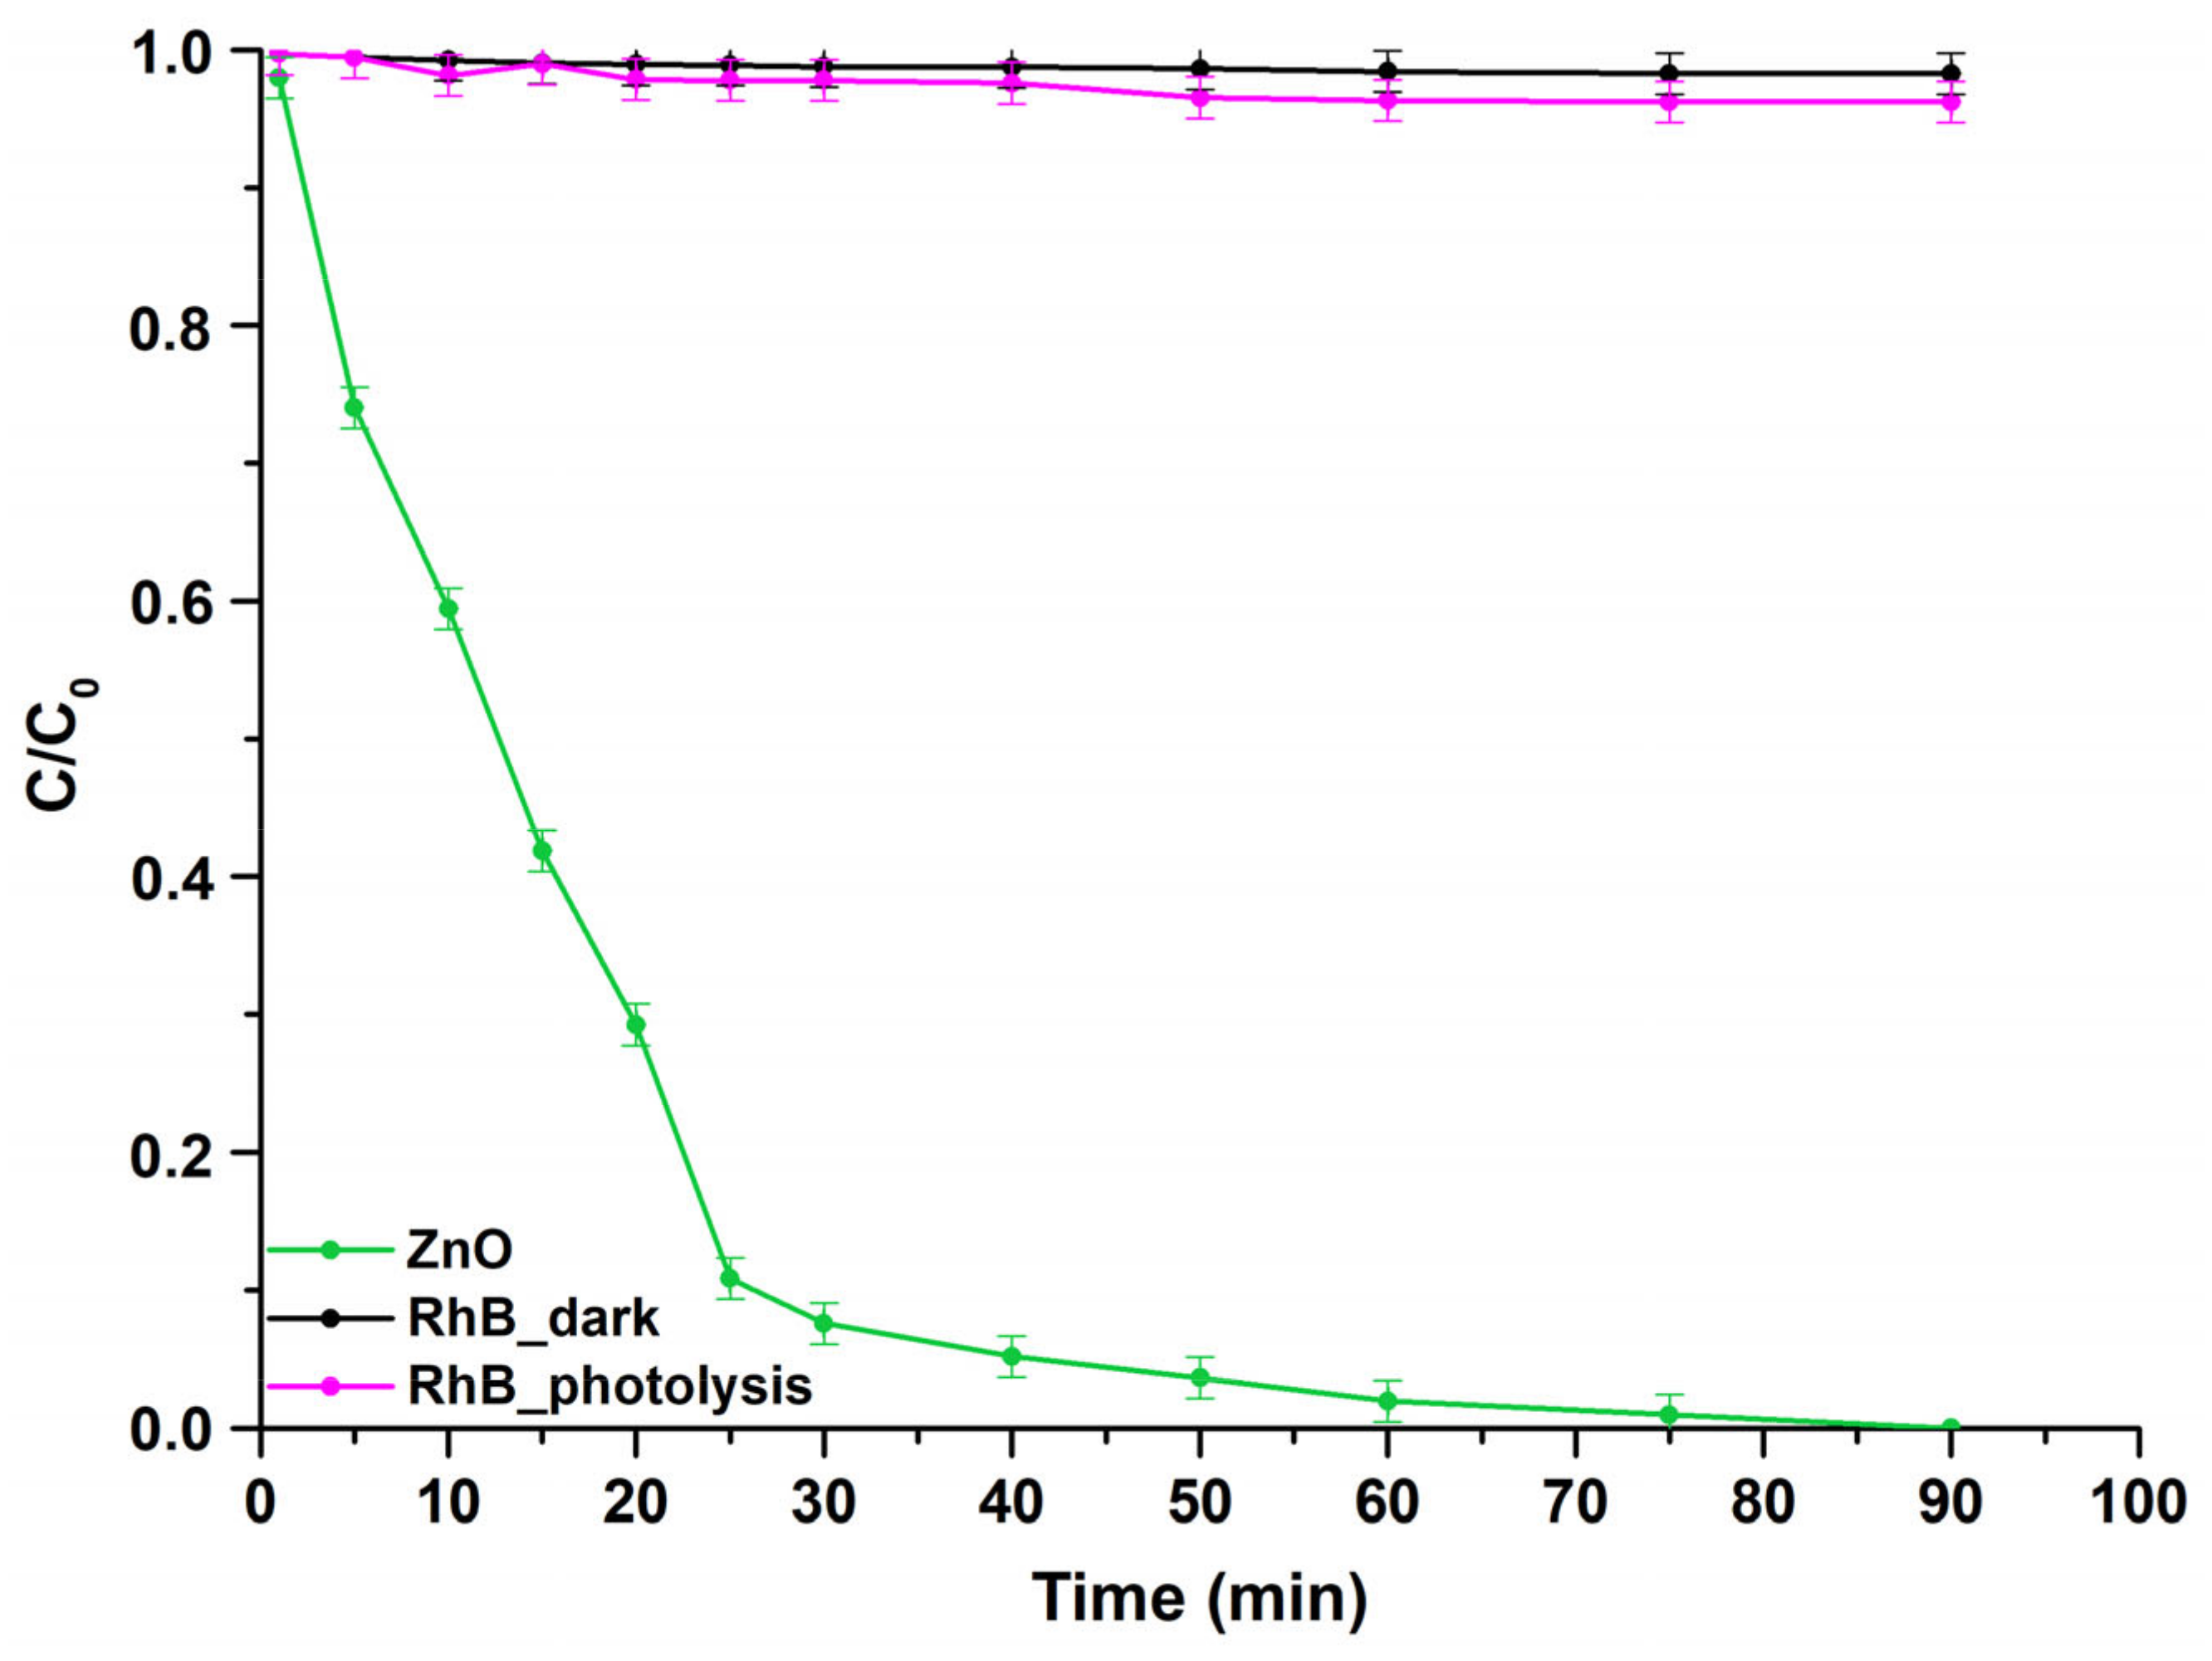
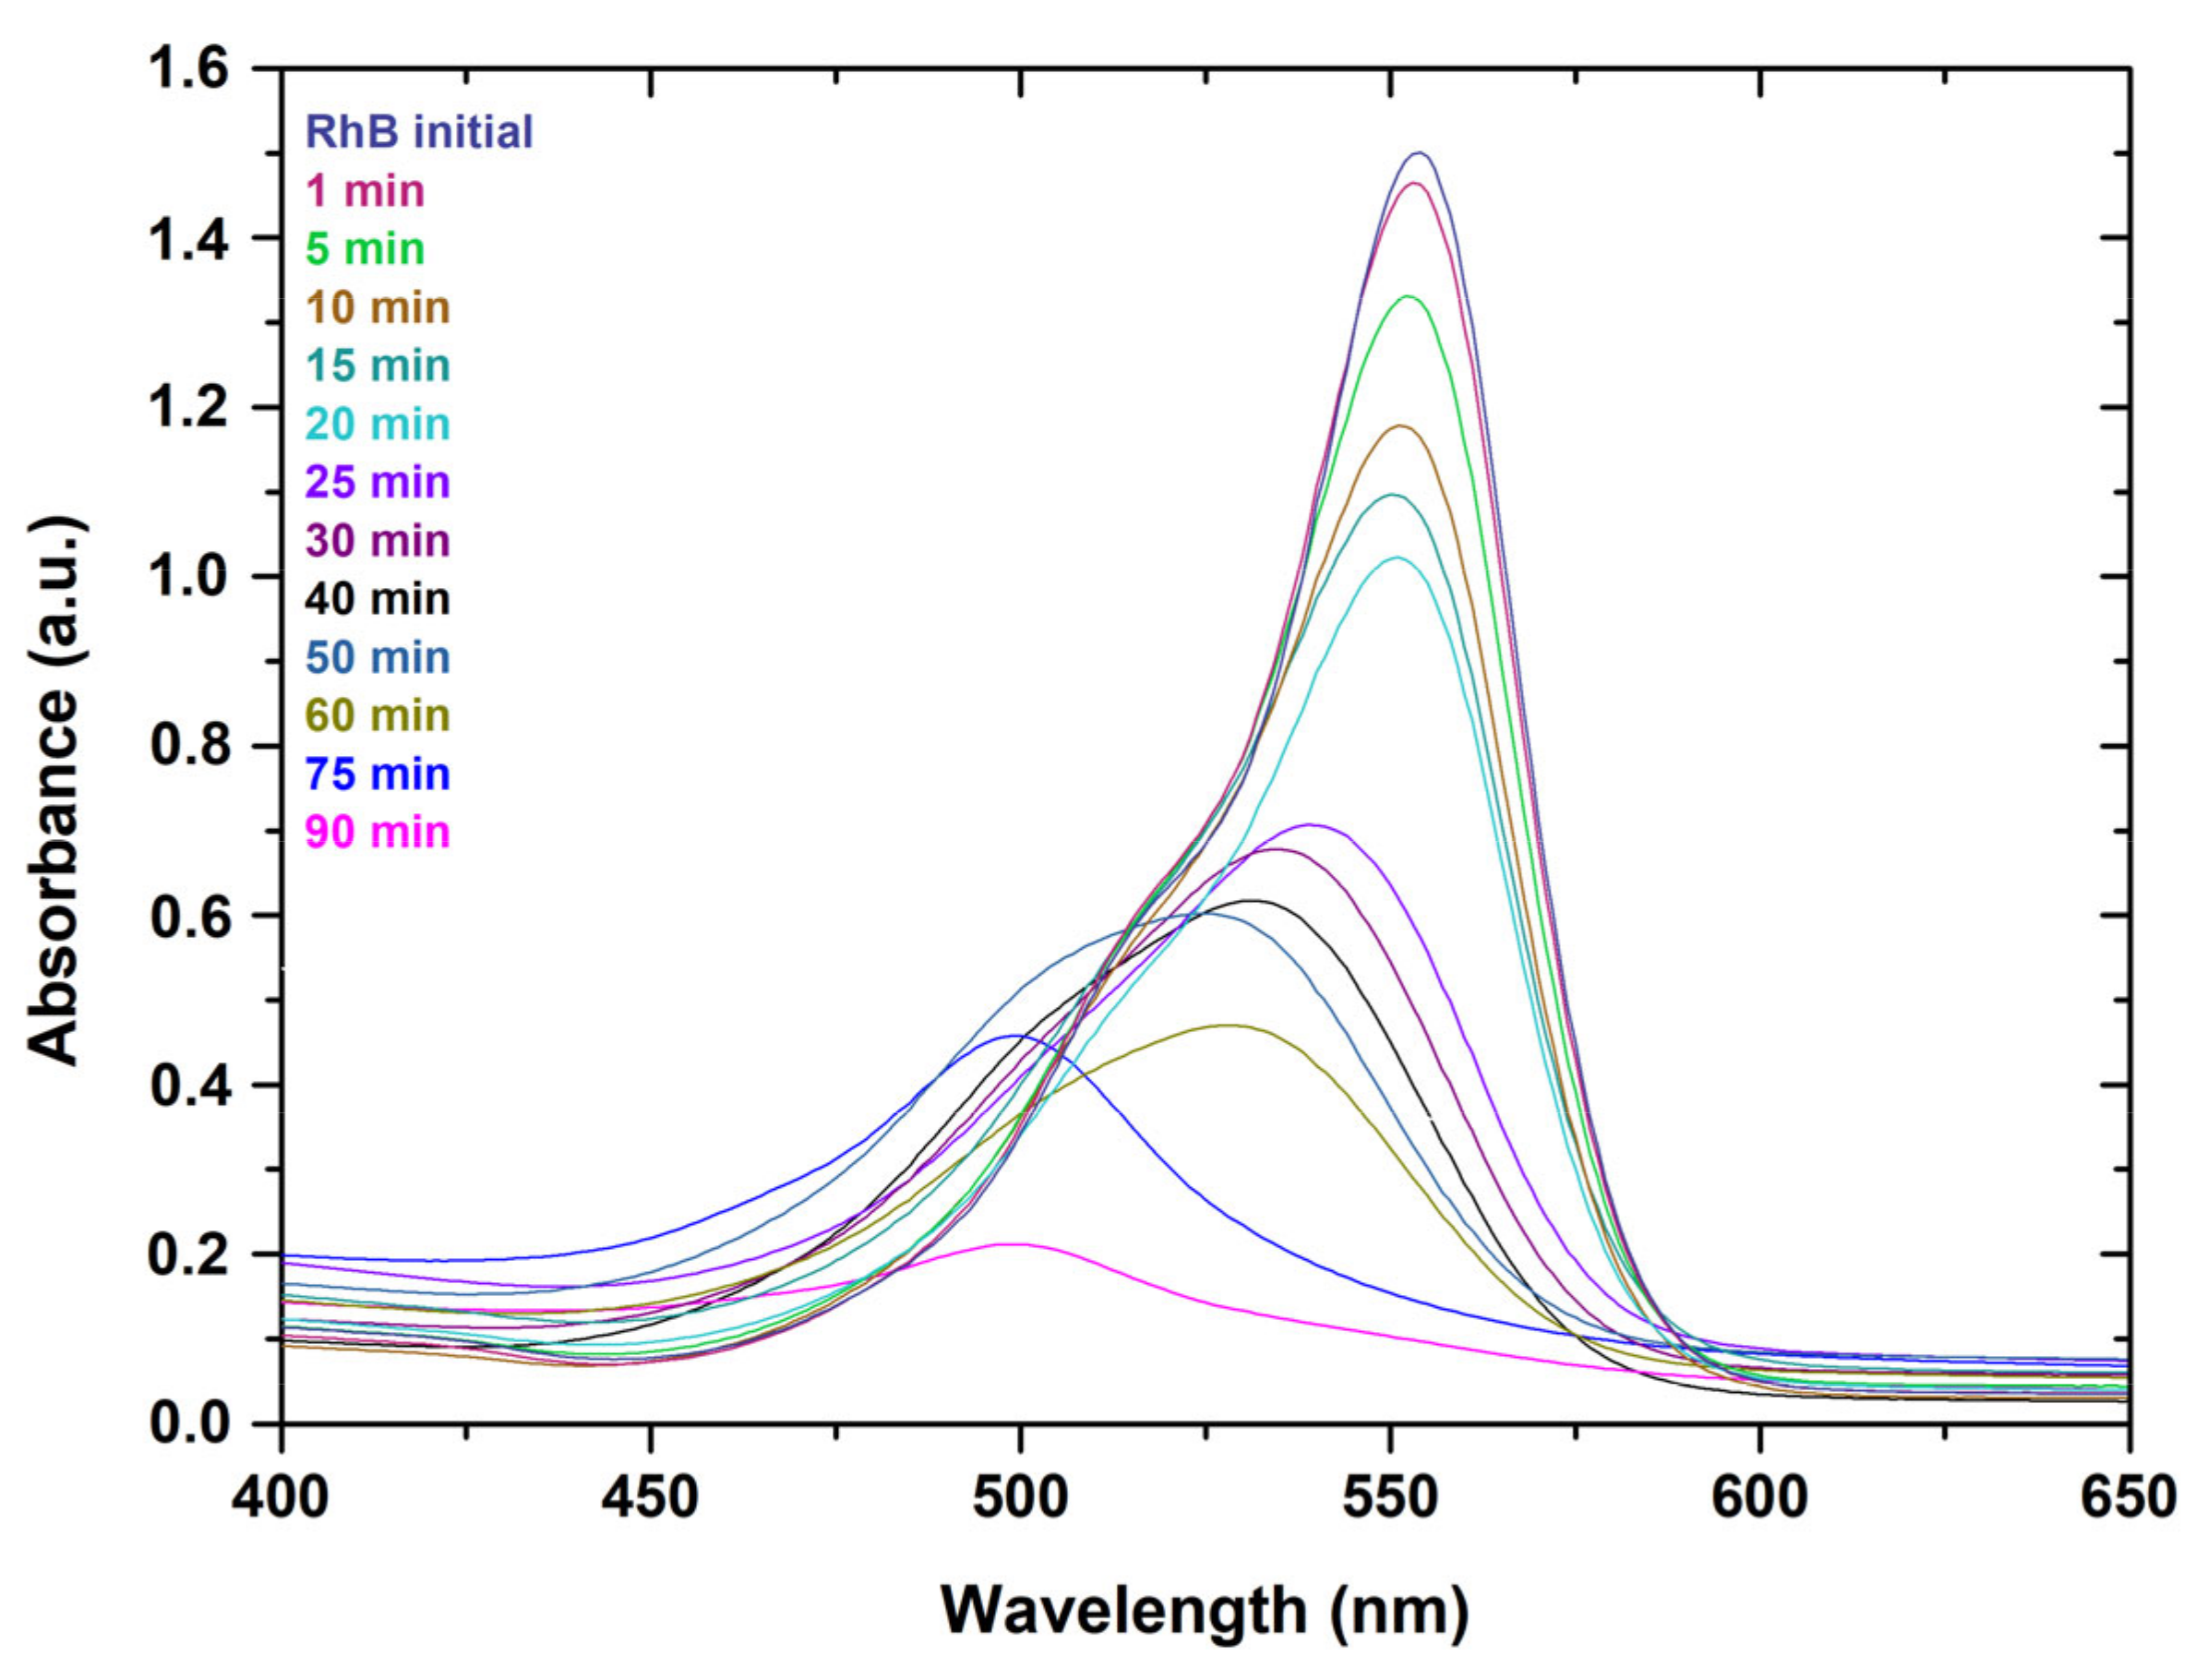
Study of the Photocatalytic Efficiency in Degradation of Rhodamine B
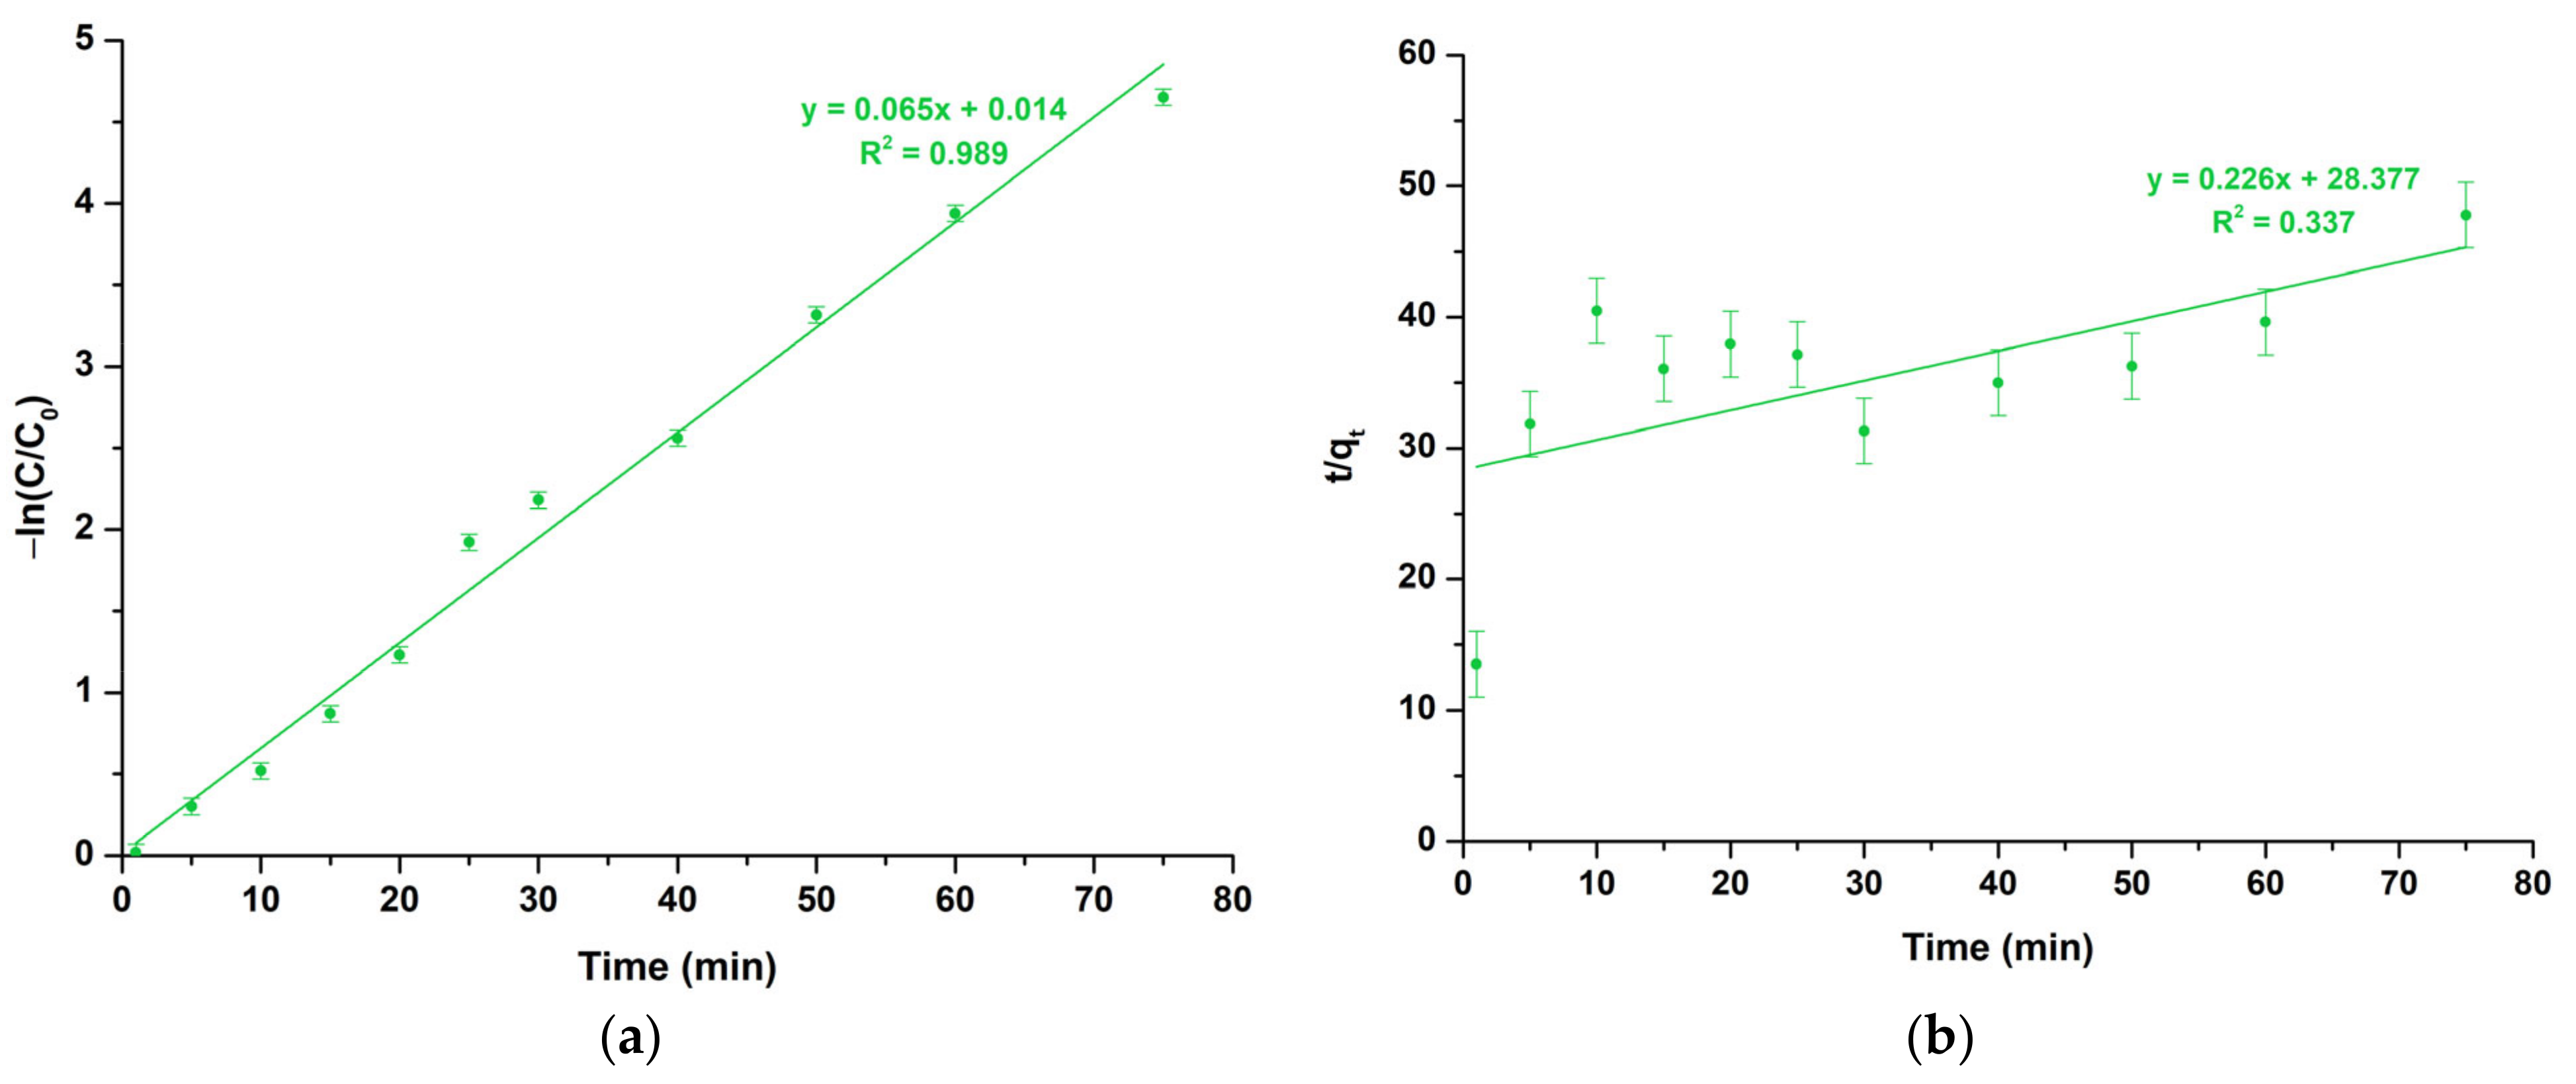
Kinetic Model Study
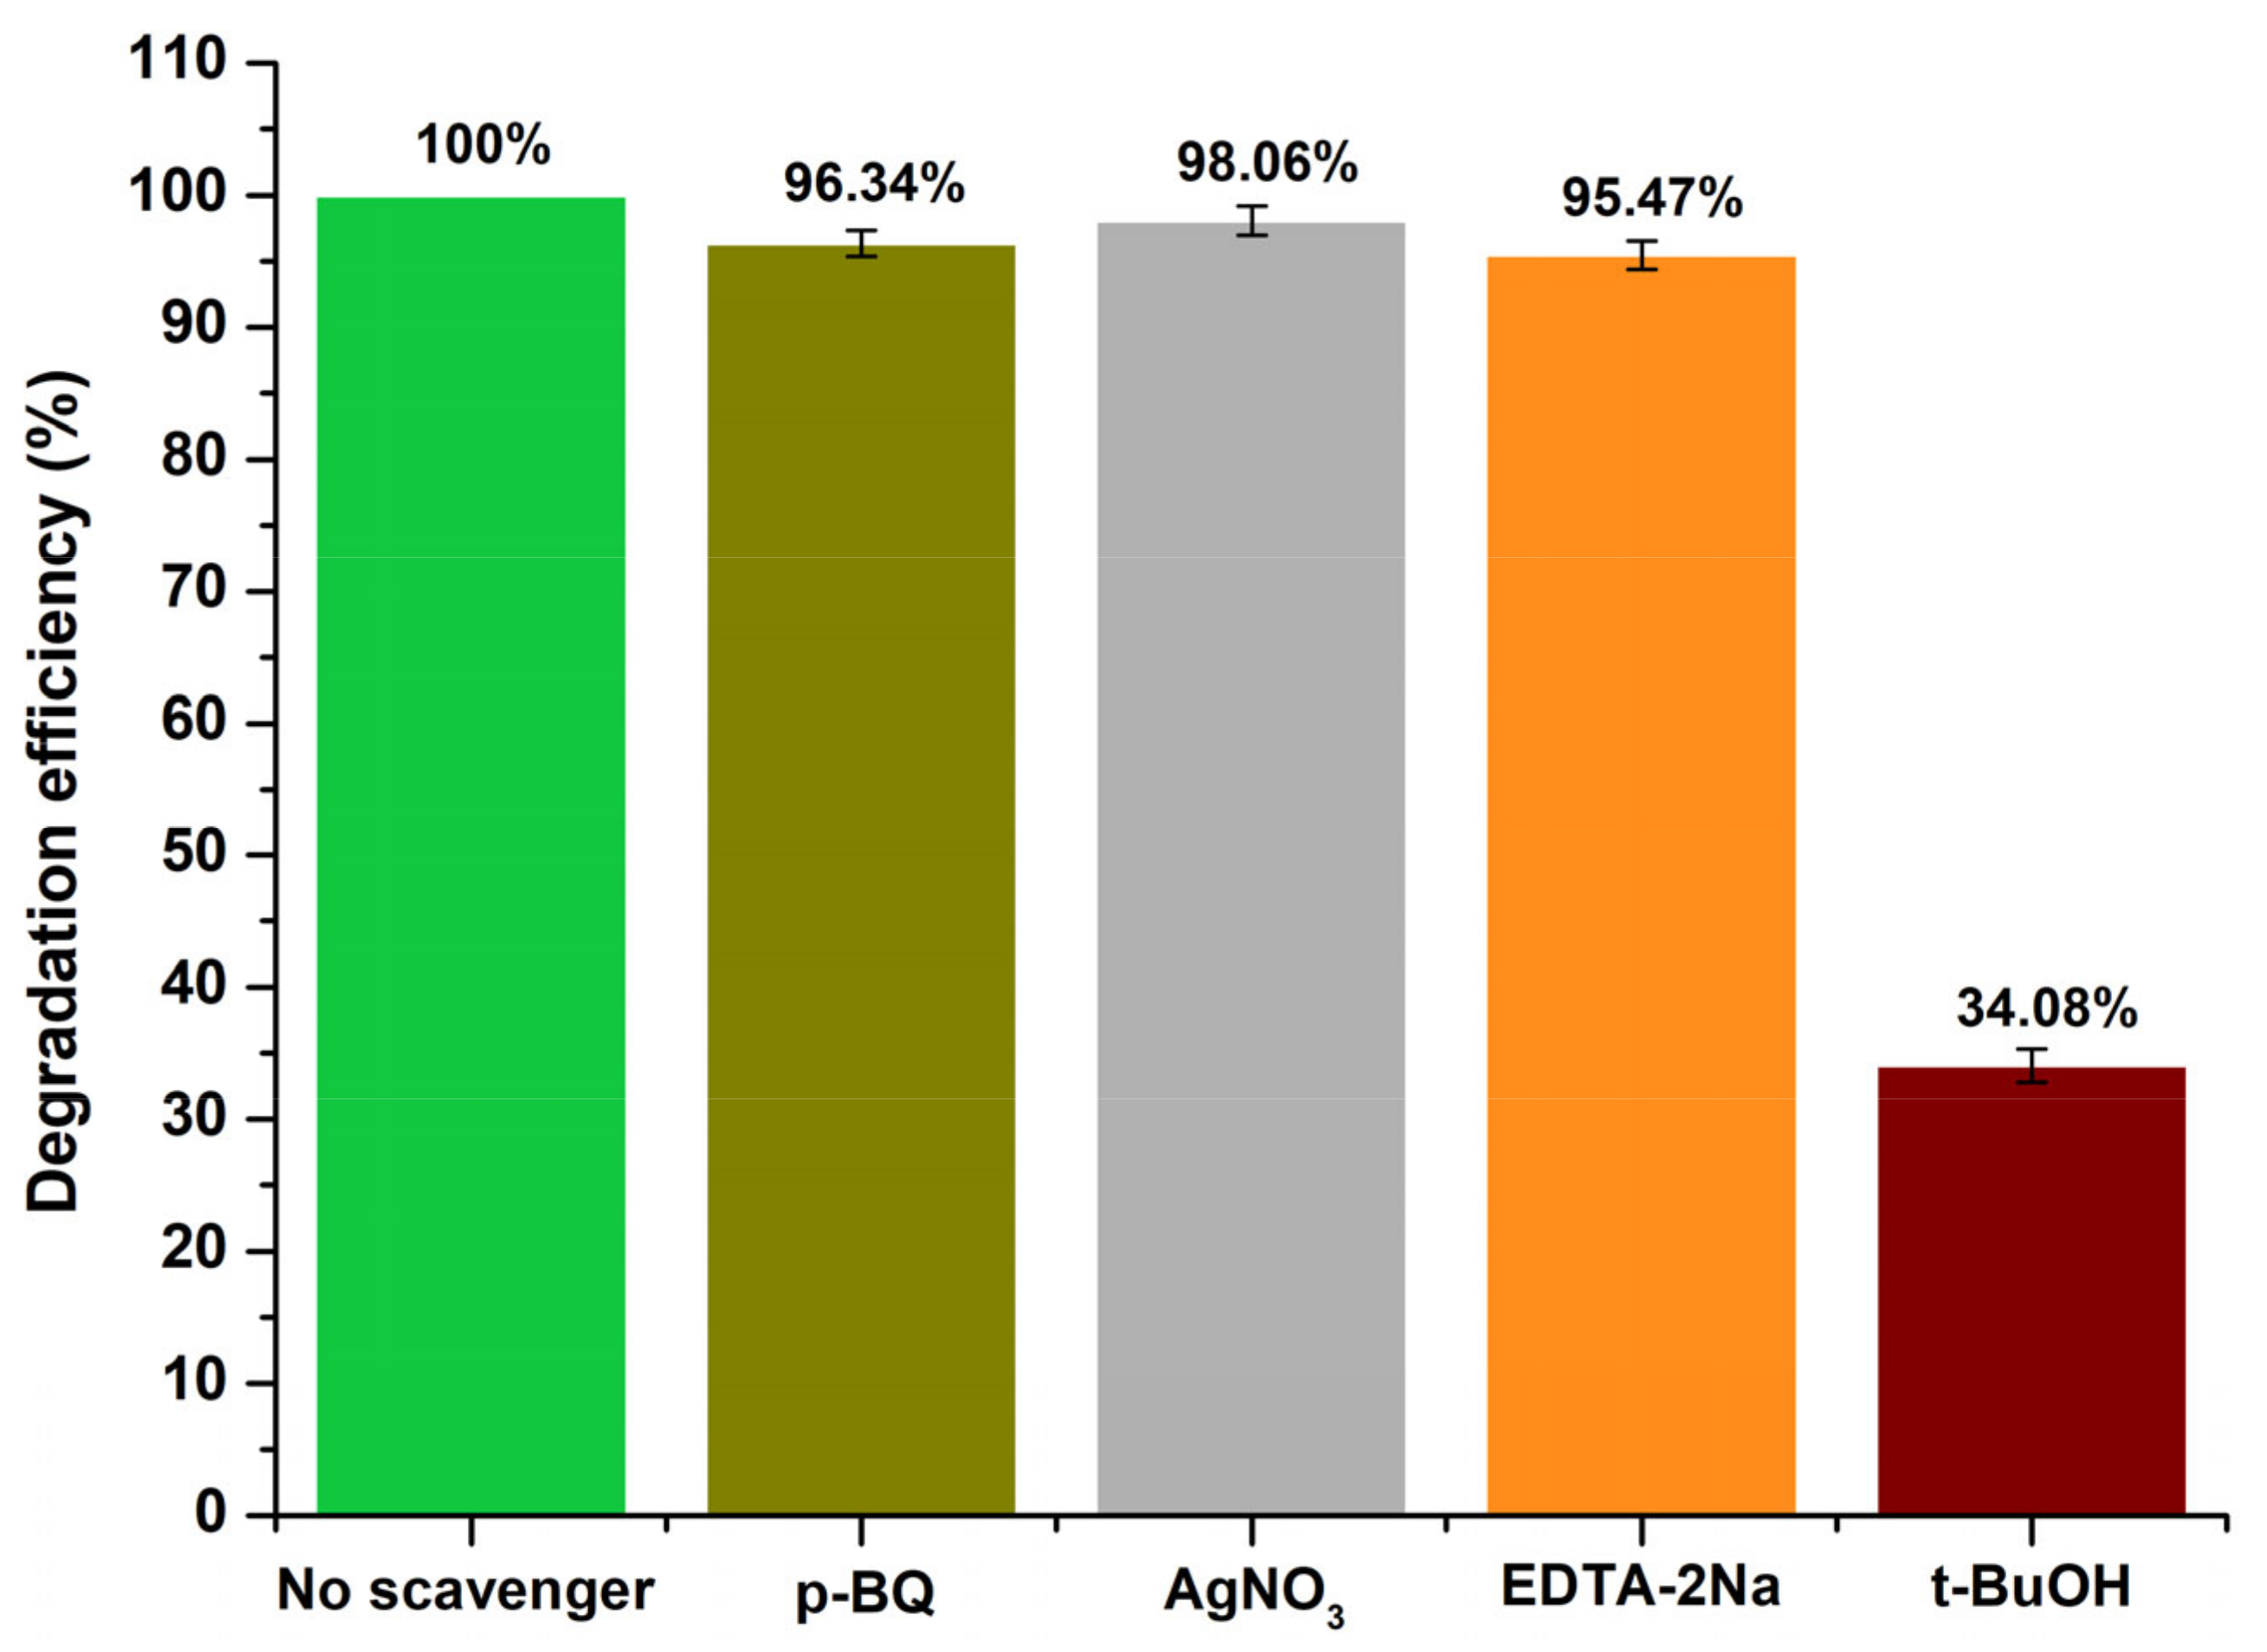
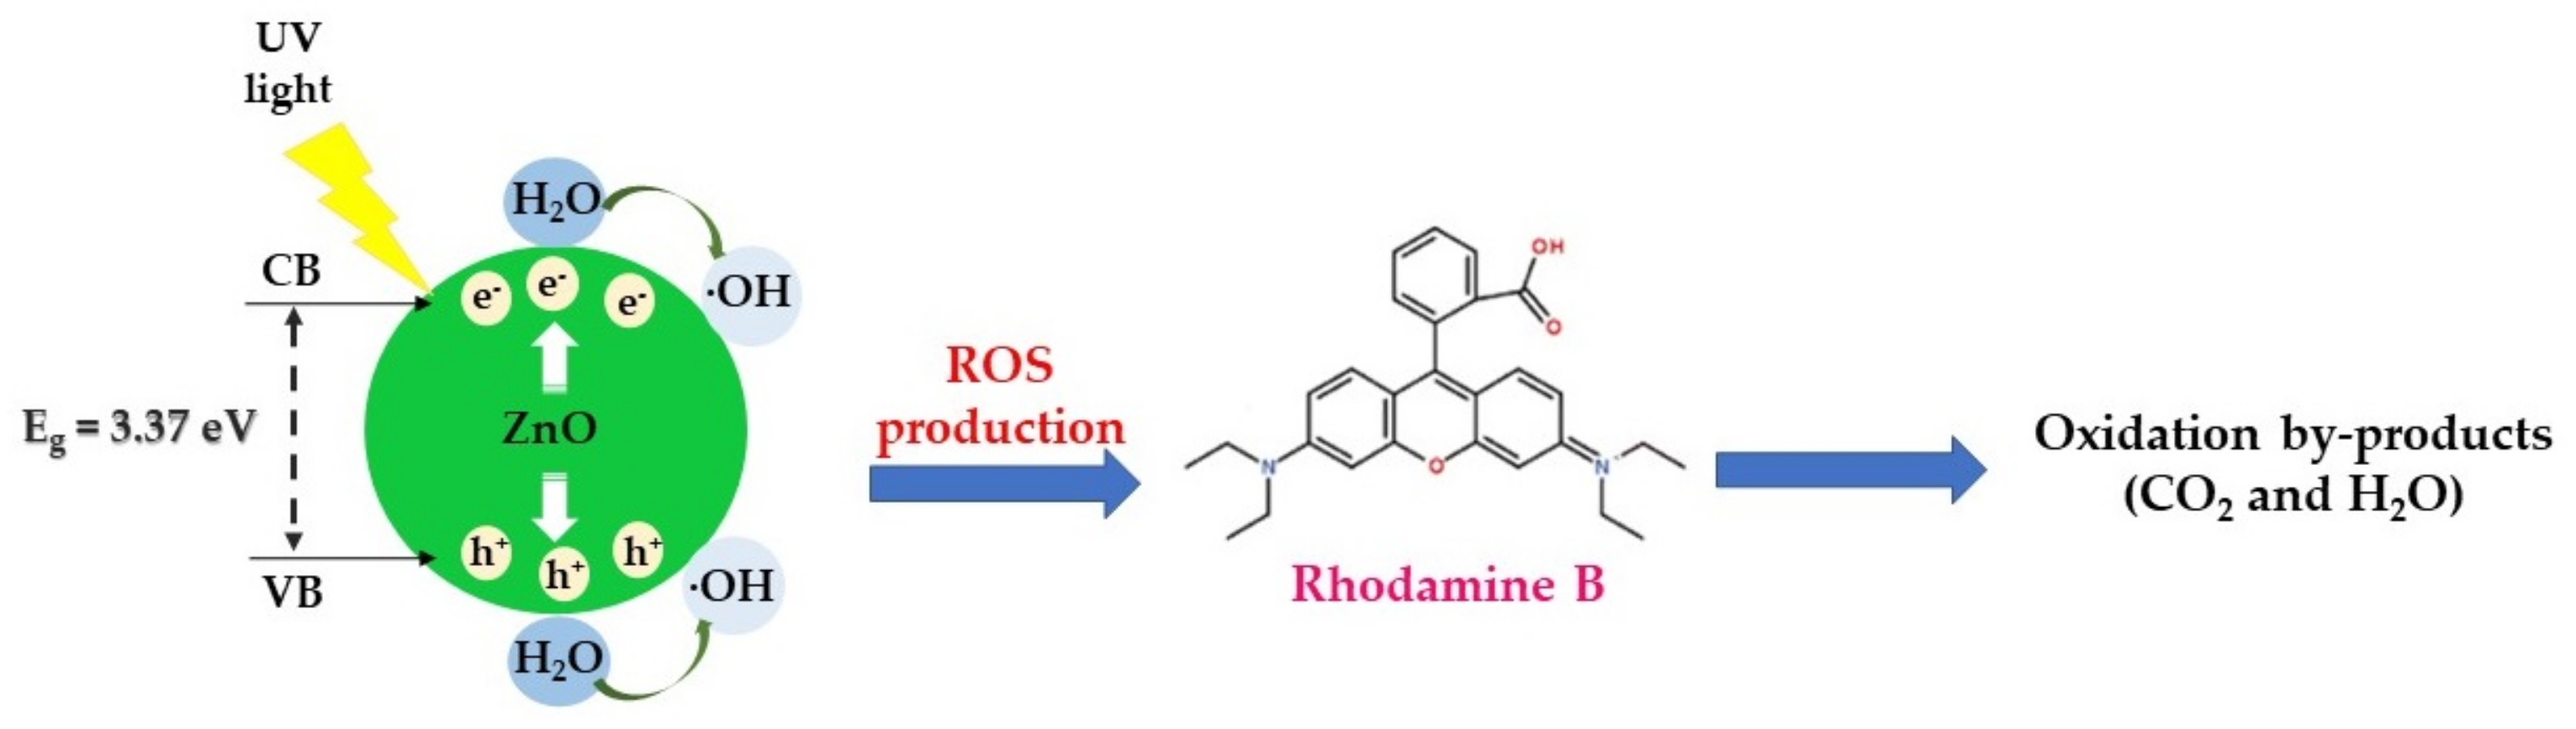
Mechanism Study
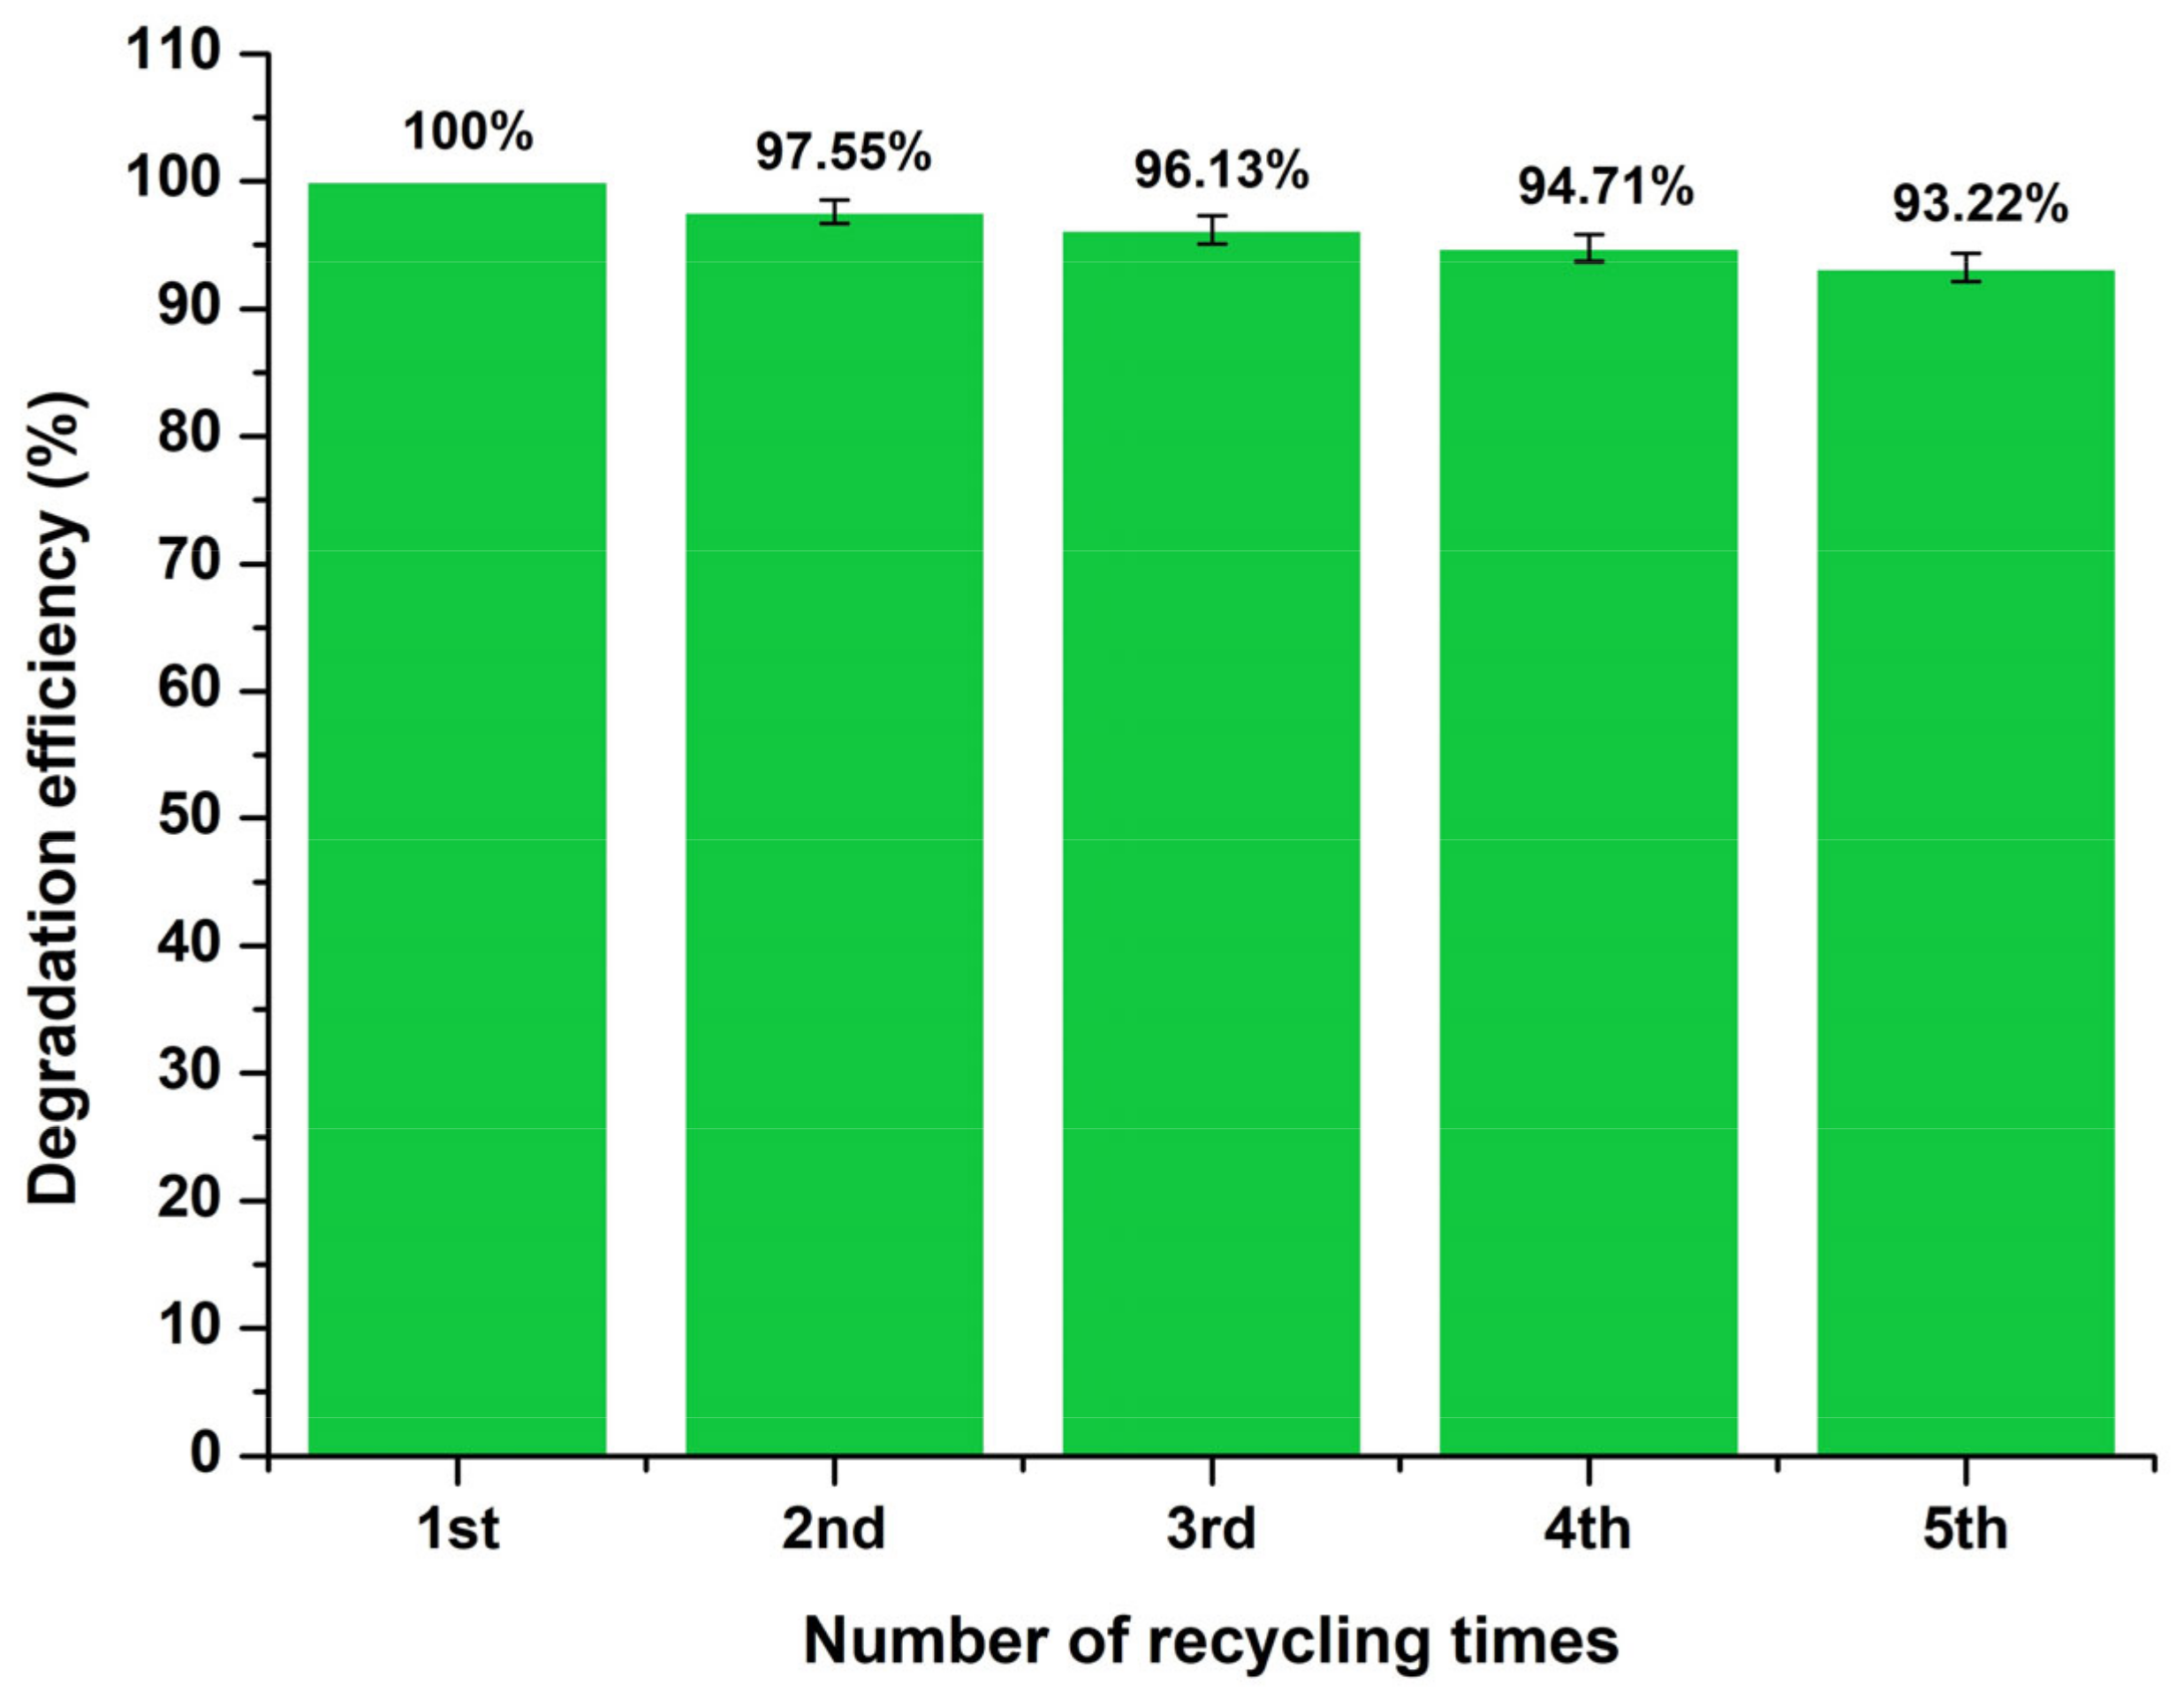
Reusability Study
3. Materials and Methods
3.1. Reagents
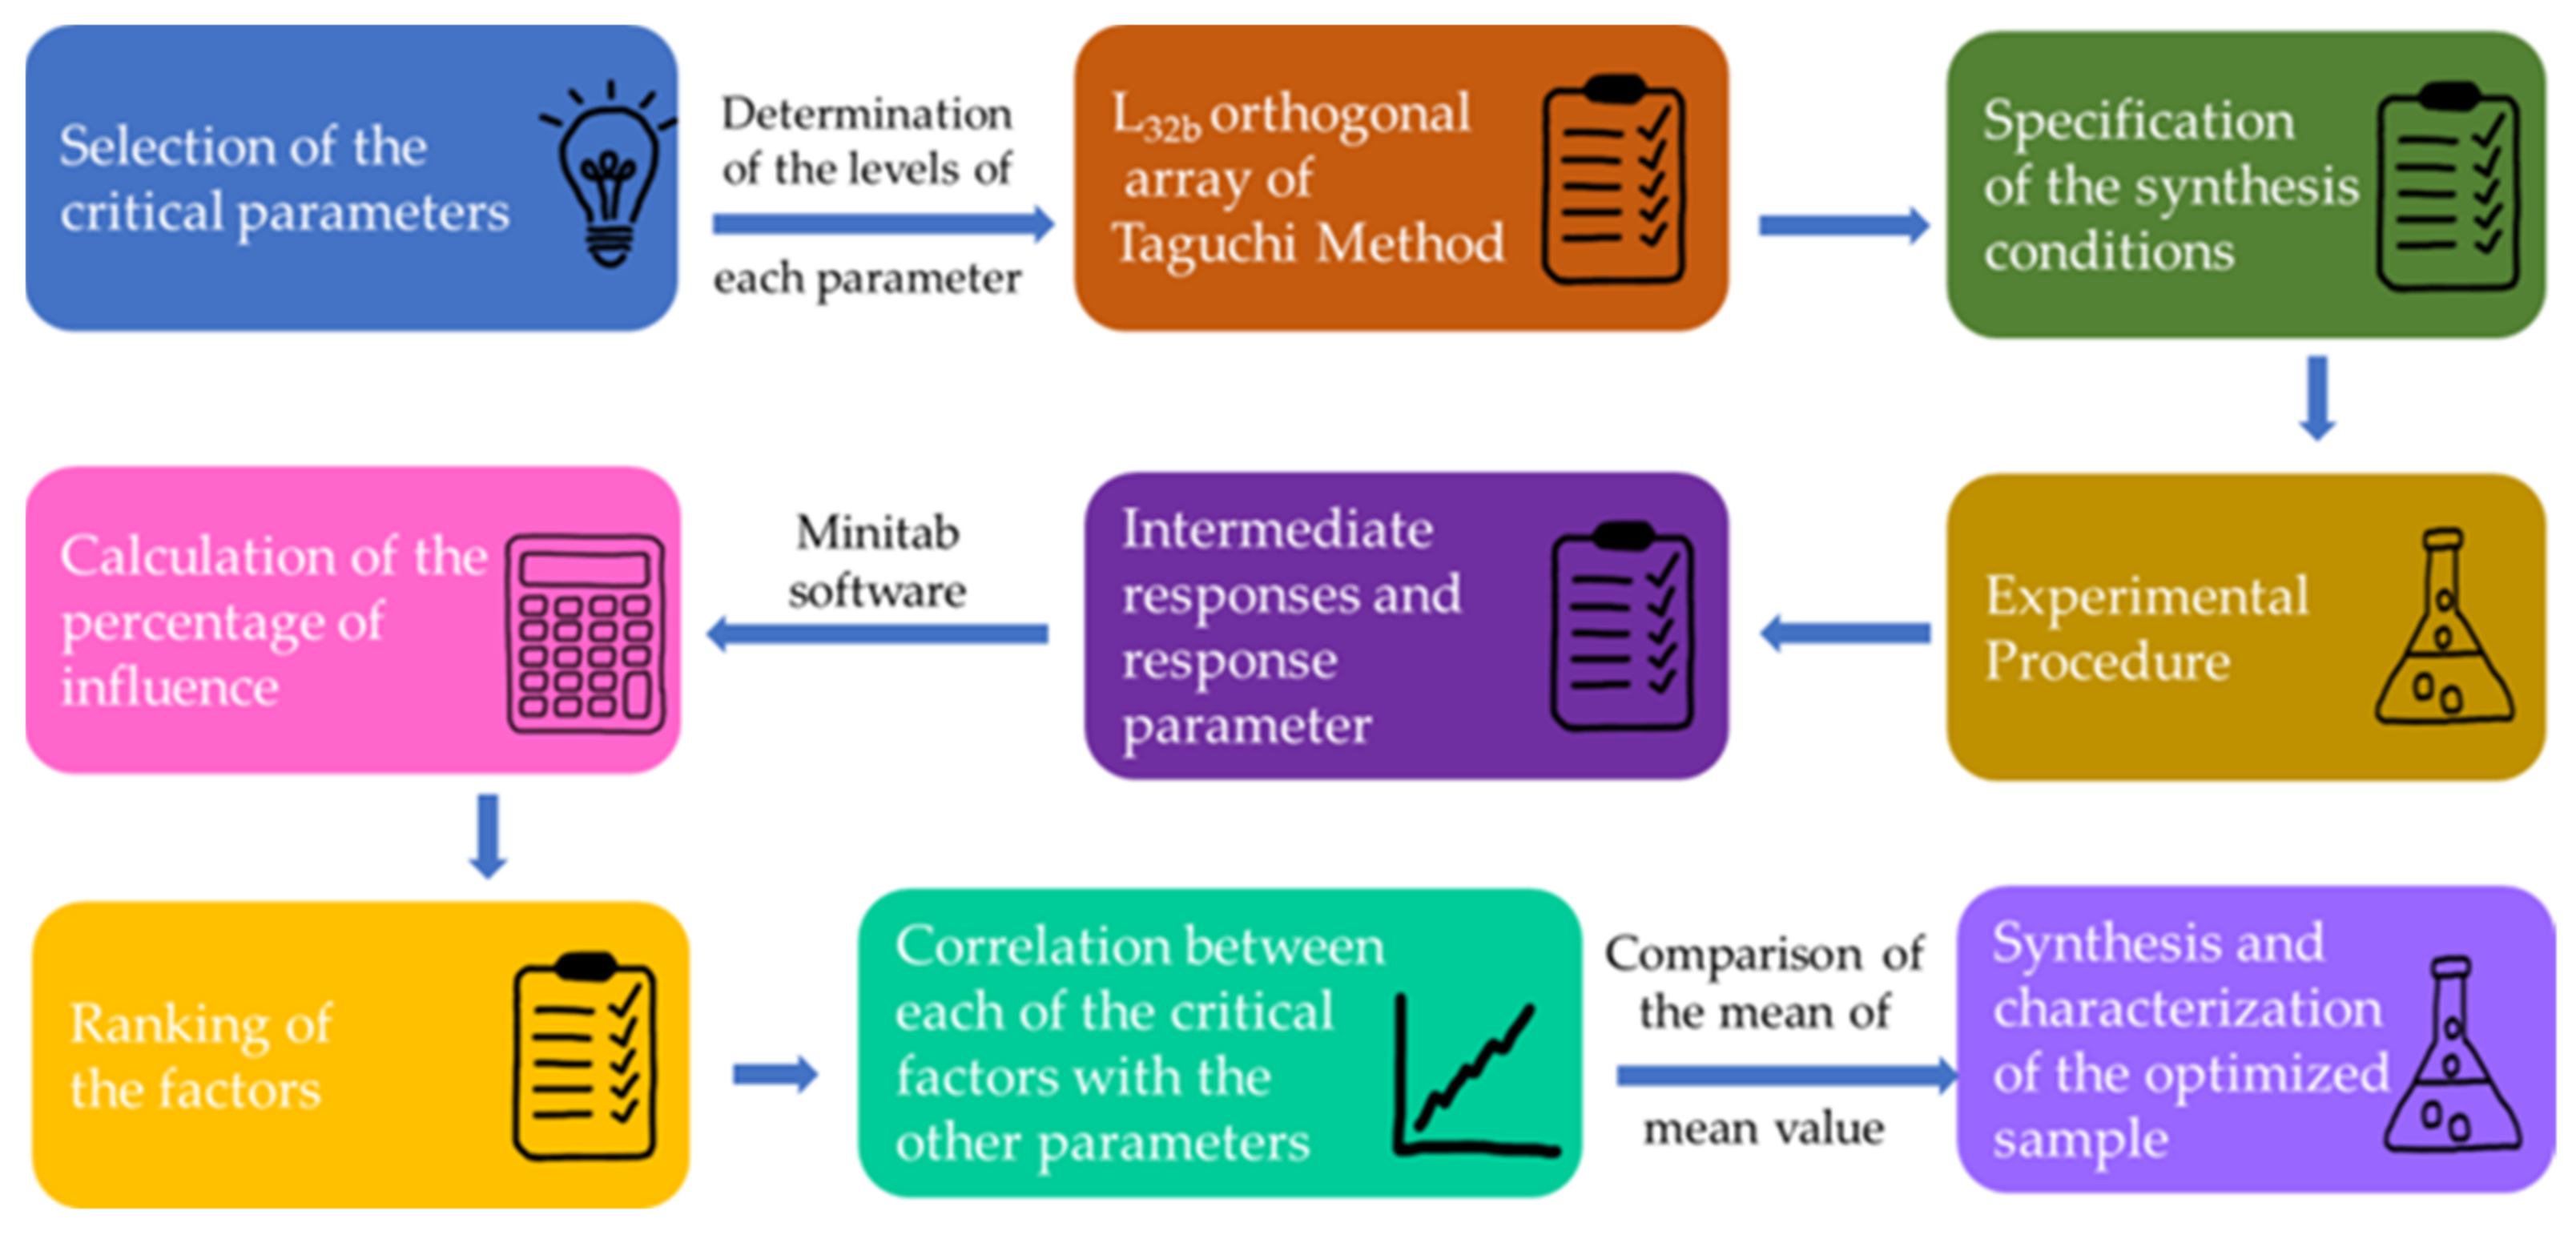
3.2. Experimental Procedure Design Based on the Taguchi Approach
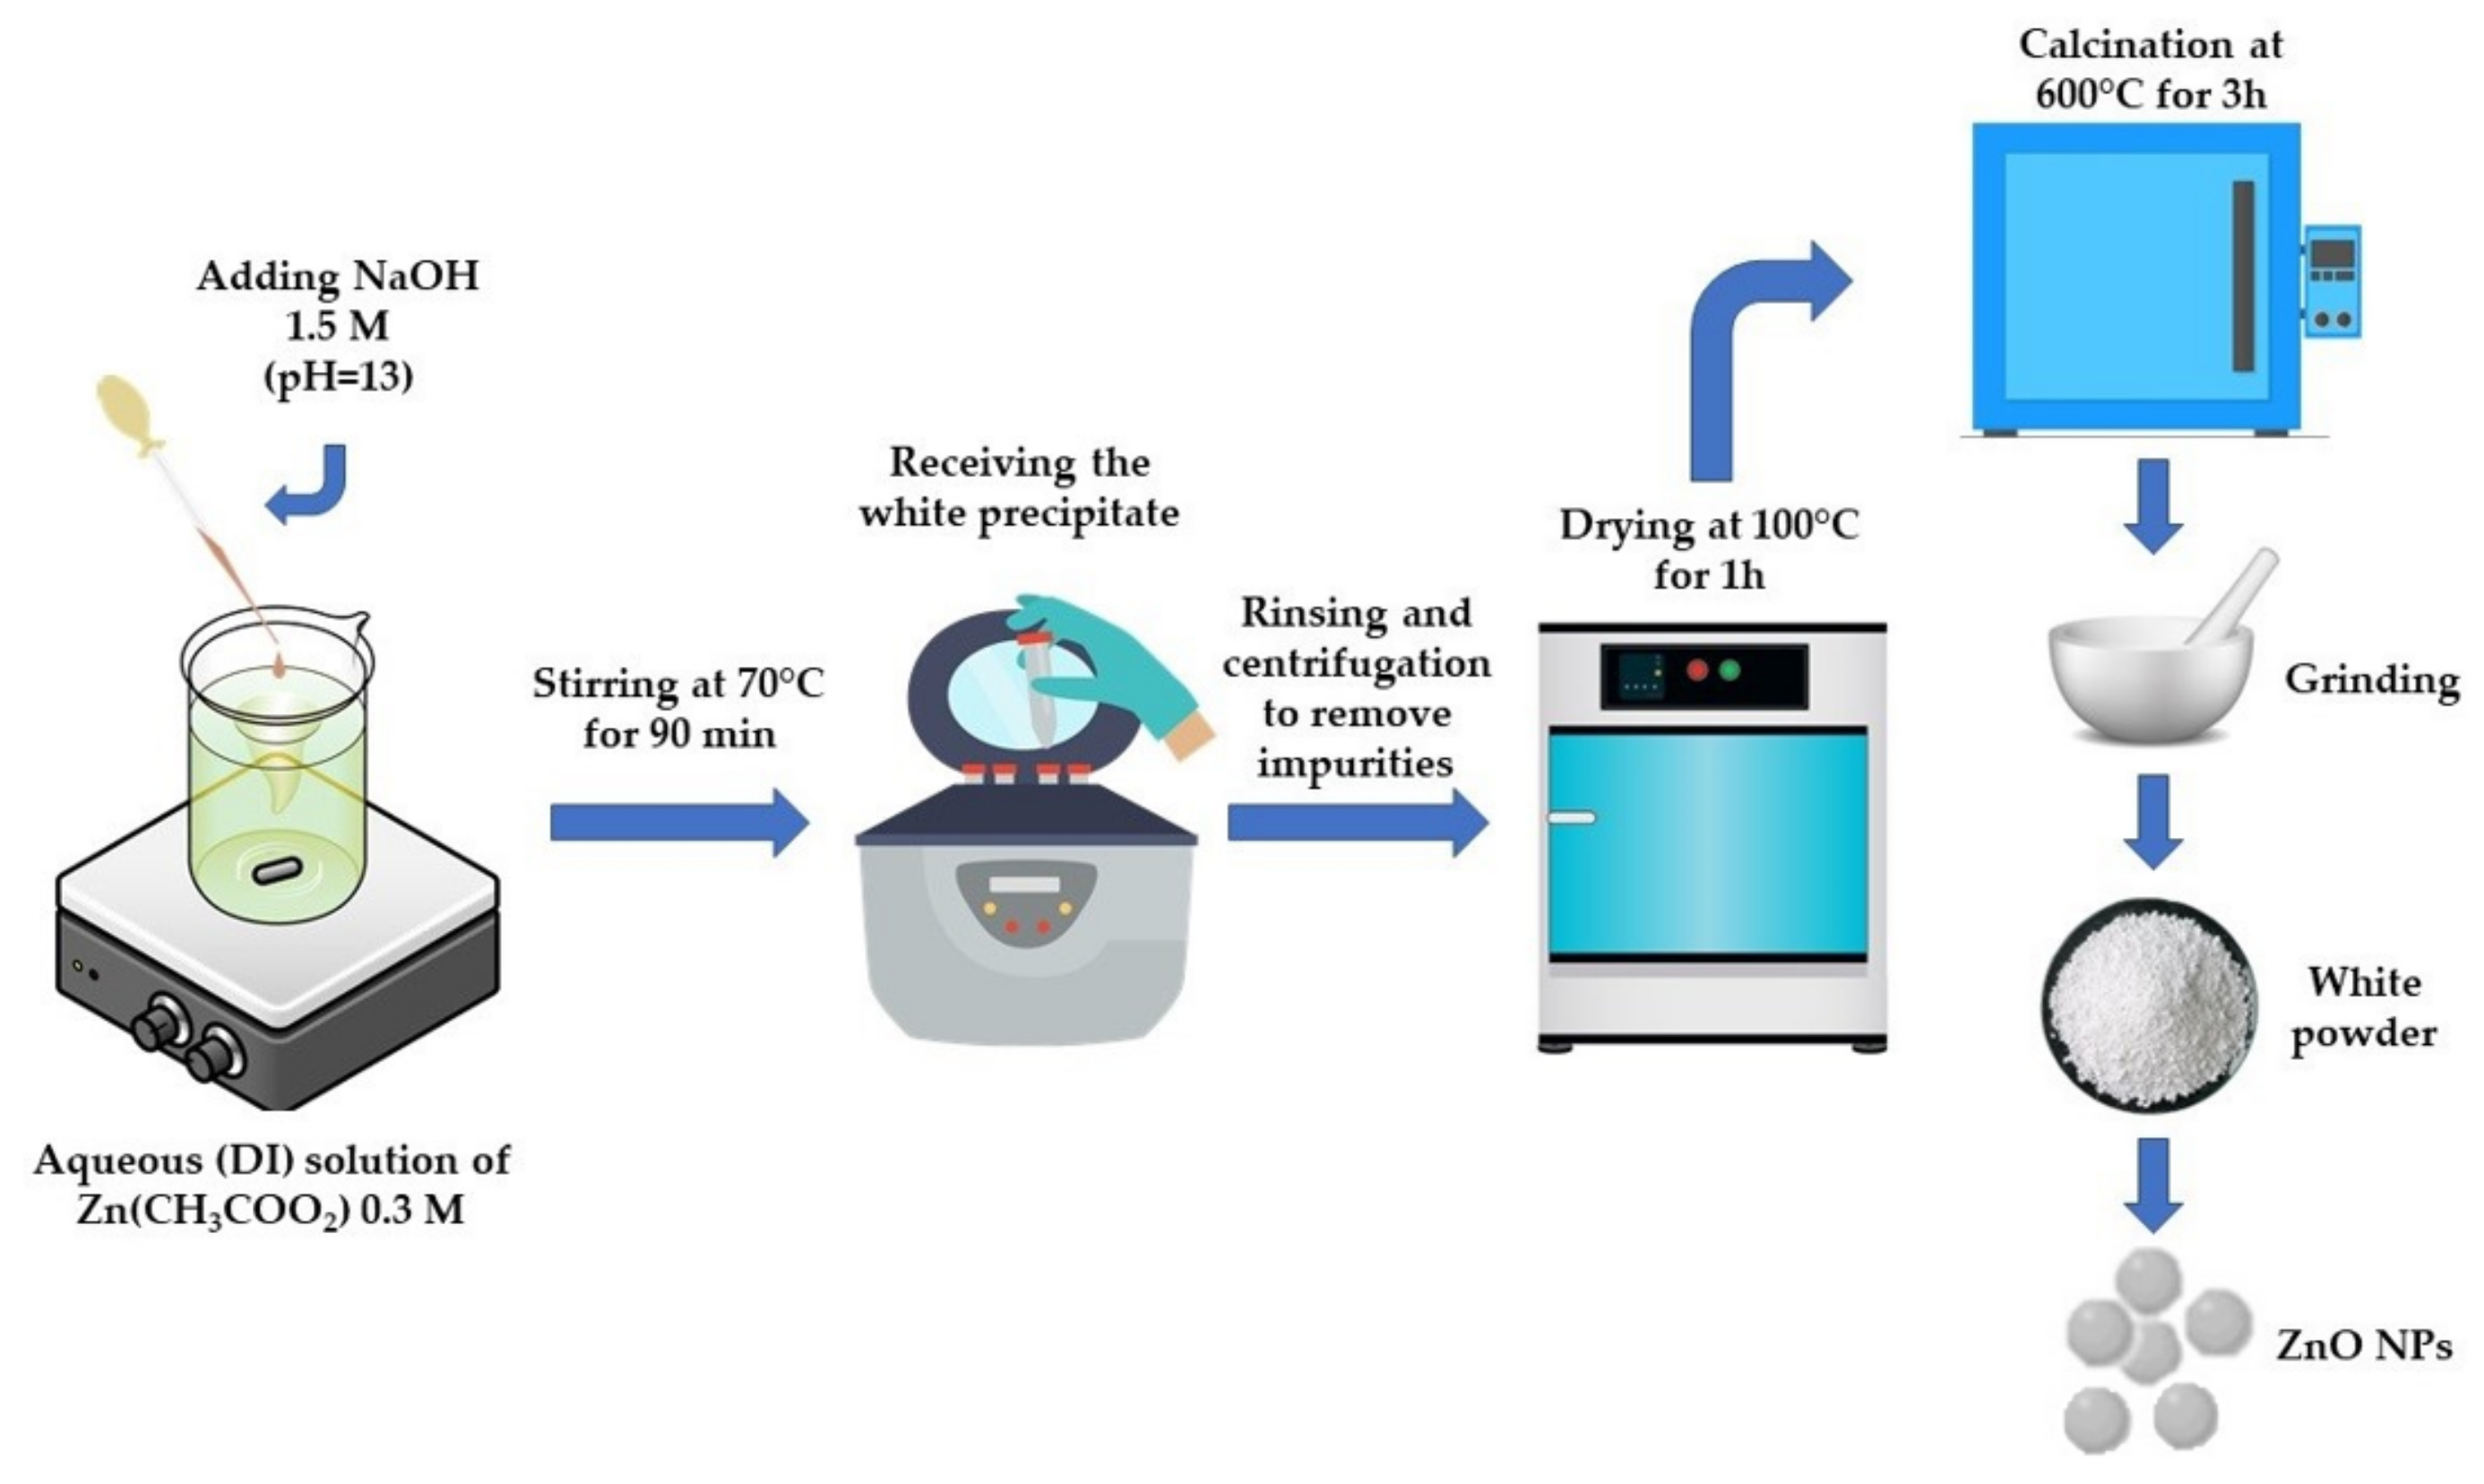
3.3. Preparation of the ZnO Samples
3.4. Characterization of the Prepared ZnO Samples
3.5. Photocatalytic Activity Study of the Prepared ZnO Samples
4. Conclusions
Author Contributions
Funding
Data Availability Statement
Acknowledgments
Conflicts of Interest
References
- UNESCO. The United Nations World Water Development Report 2020_ Water and Climate Change; UNESCO: Paris, France, 2020. [Google Scholar]
- Khan, S.; Malik, A. Toxicity Evaluation of Textile Effluents and Role of Native Soil Bacterium in Biodegradation of a Textile Dye. Environ. Sci. Pollut. Res. 2018, 25, 4446–4458. [Google Scholar] [CrossRef] [PubMed]
- Saeed, M.; Khan, I.; Adeel, M.; Akram, N.; Muneer, M. Synthesis of a CoO–ZnO photocatalyst for enhanced visible-light assisted photodegradation of methylene blue. New J. Chem. 2022, 46, 2224–2231. [Google Scholar] [CrossRef]
- Balcha, A.; Yadav, O.P.; Dey, T. Photocatalytic Degradation of Methylene Blue Dye by Zinc Oxide Nanoparticles Obtained from Precipitation and Sol-Gel Methods. Environ. Sci. Pollut. Res. 2016, 23, 25485–25493. [Google Scholar] [CrossRef] [PubMed]
- Dodoo-Arhin, D.; Asiedu, T.; Agyei-Tuffour, B.; Nyankson, E.; Obada, D.; Mwabora, J.M. Photocatalytic Degradation of Rhodamine Dyes Using Zinc Oxide Nanoparticles. Mater. Today Proc. 2021, 38, 809–815. [Google Scholar] [CrossRef]
- Sansenya, T.; Masri, N.; Chankhanittha, T.; Senasu, T.; Piriyanon, J.; Mukdasai, S.; Nanan, S. Hydrothermal Synthesis of ZnO Photocatalyst for Detoxification of Anionic Azo Dyes and Antibiotic. J. Phys. Chem. Solids 2022, 160, 110353. [Google Scholar] [CrossRef]
- Vaez, Z.; Javanbakht, V. Synthesis, characterization and photocatalytic activity of ZSM-5/ZnO nanocomposite modified by Ag nanoparticles for methyl orange degradation. J. Photochem. Photobiol. A 2020, 388, 112064. [Google Scholar] [CrossRef]
- Khataee, A.R.; Pons, M.N.; Zahraa, O. Photocatalytic Degradation of Three Azo Dyes Using Immobilized TiO2 Nanoparticles on Glass Plates Activated by UV Light Irradiation: Influence of Dye Molecular Structure. J. Hazard. Mater. 2009, 168, 451–457. [Google Scholar] [CrossRef]
- John Peter, I.; Praveen, E.; Vignesh, G.; Nithiananthi, P. ZnO Nanostructures with Different Morphology for Enhanced Photocatalytic Activity. Mater. Res. Express 2017, 4, 124003. [Google Scholar] [CrossRef]
- Zhang, D.E.; Ren, L.Z.; Hao, X.Y.; Pan, B.B.; Wang, M.Y.; Ma, J.J.; Li, F.; Li, S.A.; Tong, Z.W. Synthesis and photocatalytic property of multilayered Co3O4. Appl. Surf. Sci. 2015, 355, 547–552. [Google Scholar] [CrossRef]
- Ani, I.J.; Akpan, U.G.; Olutoye, M.A.; Hameed, B.H. Photocatalytic Degradation of Pollutants in Petroleum Refinery Wastewater by TiO2- and ZnO-Based Photocatalysts: Recent Development. J. Clean. Prod. 2018, 205, 930–954. [Google Scholar] [CrossRef]
- Sinar Mashuri, S.I.; Ibrahim, M.L.; Kasim, M.F.; Mastuli, M.S.; Rashid, U.; Abdullah, A.H.; Islam, A.; Asikin Mijan, N.; Tan, Y.H.; Mansir, N.; et al. Photocatalysis for Organic Wastewater Treatment: From the Basis to Current Challenges for Society. Catalysts 2020, 10, 1260. [Google Scholar] [CrossRef]
- Tanji, K.; Navio, J.A.; Chaqroune, A.; Naja, J.; Puga, F.; Hidalgo, M.C.; Kherbeche, A. Fast photodegradation of rhodamine B and caffeine using ZnO-hydroxyapatite composites under UV-light illumination. Catal. Today 2022, 388–389, 176–186. [Google Scholar] [CrossRef]
- Wu, J.; Xue, D. Progress of Science and Technology of ZnO as Advanced Material. Sci. Adv. Mater. 2011, 3, 127–149. [Google Scholar] [CrossRef]
- Piras, A.; Olla, C.; Reekmans, G.; Kelchtermans, A.-S.; De Sloovere, D.; Elen, K.; Carbonaro, C.M.; Fusaro, L.; Adriaensens, P.; Hardy, A.; et al. Photocatalytic Performance of Undoped and Al-Doped ZnO Nanoparticles in the Degradation of Rhodamine B under UV-Visible Light: The Role of Defects and Morphology. Int. J. Mol. Sci. 2022, 23, 15459. [Google Scholar] [CrossRef] [PubMed]
- Nandi, P.; Das, D. Photocatalytic Degradation of Rhodamine-B Dye by Stable ZnO Nanostructures with Different Calcination Temperature Induced Defects. Appl. Surf. Sci. 2019, 465, 546–556. [Google Scholar] [CrossRef]
- Munawar, T.; Yasmeen, S.; Hussain, F.; Mahmood, K.; Hussain, A.; Asghar, M.; Iqbal, F. Synthesis of Novel Heterostructured ZnO-CdO-CuO Nanocomposite: Characterization and Enhanced Sunlight Driven Photocatalytic Activity. Mater. Chem. Phys. 2020, 249, 122983. [Google Scholar] [CrossRef]
- Neena, D.; Kondamareddy, K.K.; Bin, H.; Lu, D.; Kumar, P.; Dwivedi, R.K.; Pelenovich, V.O.; Zhao, X.-Z.; Gao, W.; Fu, D. Enhanced Visible Light Photodegradation Activity of RhB/MB from Aqueous Solution Using Nanosized Novel Fe-Cd Co-Modified ZnO. Sci. Rep. 2018, 8, 10691. [Google Scholar] [CrossRef]
- Shidpour, R.; Simchi, A.; Ghanbari, F.; Vossoughi, M. Photo-degradation of organic dye by zinc oxide nanosystems with special defect structure: Effect of the morphology and annealing temperature. Appl. Catal. A 2014, 472, 198–204. [Google Scholar] [CrossRef]
- Kumaresan, N.; Ramamurthi, K.; Ramesh Babu, R.; Sethuraman, K.; Moorthy Babu, S. Hydrothermally grown ZnO nanoparticles for effective photocatalytic activity. Appl. Surf. Sci. 2017, 418 Pt A, 138–146. [Google Scholar] [CrossRef]
- Xie, J.; Wang, H.; Duan, M.; Zhang, L. Synthesis and photocatalysis properties of ZnO structures with different morphologies via hydrothermal method. Appl. Surf. Sci. 2011, 257, 6358–6363. [Google Scholar] [CrossRef]
- Wang, Y.; Li, X.; Wang, N.; Quan, X.; Chen, Y. Controllable synthesis of ZnO nanoflowers and their morphology-dependent photocatalytic activities. Sep. Purif. Technol. 2008, 62, 727–732. [Google Scholar] [CrossRef]
- Sun, H.; Yu, Y.; Luo, J.; Ahmad, M.; Zhu, J. Morphology-controlled synthesis of ZnO 3D hierarchical structures and their photocatalytic performance. CrystEngComm 2012, 14, 8626–8632. [Google Scholar] [CrossRef]
- Shaba, E.Y.; Jacob, J.O.; Tijani, J.O.; Suleiman, M.A.T. A critical review of synthesis parameters affecting the properties of zinc oxide nanoparticle and its application in wastewater treatment. Appl. Water Sci. 2021, 11, 48. [Google Scholar] [CrossRef]
- Rana, N.; Chand, S.; Gathania, A.K. Synthesis and characterization of flower-like ZnO structures and their applications in photocatalytic degradation of Rhodamine B dye. J. Mater. Sci. Mater. Electron. 2016, 27, 2504–2510. [Google Scholar] [CrossRef]
- Phan, C.M.; Nguyen, H.M. Role of capping agent in wet synthesis of nanoparticles. J. Phys. Chem. A 2017, 121, 3213–3219. [Google Scholar] [CrossRef]
- Sandeep, S.; Koteswara Rao, C.; Vijay Rajesh, A.; Sruthi, T.; Surya Prakash, D.V. Studies on characterization and optimization parameters of zinc oxide nanoparticles synthesis. Int. J. Curr. Res. Rev. 2022, 14, 6–11. [Google Scholar] [CrossRef]
- Kumar, S.S.; Venkateswarlu, P.; Rao, V.R.; Rao, G.N. Synthesis, characterization and optical properties of zinc oxide nanoparticles. Int. Nano Lett. 2013, 3, 30. [Google Scholar] [CrossRef]
- Indramahalakshmi, G. Characterization and antibacterial activity of zinc oxide nanoparticles synthesized using Opuntia ficus indica fruit aqueous extract. Asian J. Phys. Chem. Sci. 2017, 3, 1–7. [Google Scholar] [CrossRef]
- Khaghanpour, Z.; Naghibi, S. Application of the Taguchi approach to optimize ZnO synthesis via hydrothermally assisted sol-gel method. Turk. J. Chem. 2018, 42, 20. [Google Scholar] [CrossRef]
- Wang, C.-N.; Yang, F.-C.; Nguyen, V.T.T.; Vo, N.T.M. CFD Analysis and Optimum Design for a Centrifugal Pump Using an Effectively Artificial Intelligent Algorithm. Micromachines 2022, 13, 1208. [Google Scholar] [CrossRef]
- Khavekar, R.; Vasudevan, H.; Modi, B. A Comparative analysis of Taguchi methodology and Shainin system DoE in the optimization of injection molding process parameters. IOP Conf. Ser. Mater. Sci. Eng. 2017, 225, 012183. [Google Scholar] [CrossRef]
- Gandhi, P.J.; Murthy, Z.V.P.; Pati, R.K. Optimization of process parameters by Taguchi robust design method for the development of nano-crystals of sirolimus using sonication-based crystallization. Cryst. Res. Technol. 2012, 47, 53–72. [Google Scholar] [CrossRef]
- Singh, M.; Garg, H.K.; Maharana, S.; Yadav, A.; Singh, R.; Maharana, P.; Nguyen, T.V.T.; Yadav, S.; Loganathan, M.K. An experimental investigation on the material removal rate and surface roughness of a hybrid aluminum metal matrix composite (Al6O61/SiC/Gr). Metals 2021, 11, 1449. [Google Scholar] [CrossRef]
- JCPDS, Powder Diffraction File, Alphabetical Index, Inorganic Compounds; International Centre for Diffraction Data: Newtown Square, PA, USA, 1977.
- Al-Ariki, S.; Yahya, N.A.A.; Al-A’nsi, S.A.; Jumali, M.H.H.; Jannah, A.N.; Abd-Shukor, R. Synthesis and comparative study on the structural and optical properties of ZnO doped with Ni and Ag nanopowders fabricated by sol-gel technique. Sci. Rep. 2021, 11, 11948. [Google Scholar] [CrossRef] [PubMed]
- Garimella, L.B.V.S.; Dhiman, T.K.; Kumar, R.; Singh, A.K.; Solanki, P.R. One-Step Synthesized ZnO NP-Based Optical Sensors for Detection of Aldicarb via a Photoinduced Electron Transfer Route. ACS Omega 2020, 5, 2552–2560. [Google Scholar] [CrossRef]
- Aljabali, A.A.A.; Obeid, M.A.; Bakshi, H.A.; Alshaer, W.; Ennab, R.M.; Al-Trad, B.; Al Khateeb, W.; Al-Batayneh, K.M.; Al-Kadash, A.; Alsotari, S.; et al. Synthesis, Characterization, and Assessment of Anti-Cancer Potential of ZnO Nanoparticles in an In Vitro Model of Breast Cancer. Molecules 2022, 27, 1827. [Google Scholar] [CrossRef]
- Limón-Rocha, I.; Guzmán-González, C.A.; Anaya-Esparza, L.M.; Romero-Toledo, R.; Rico, J.L.; González-Vargas, O.A.; Pérez-Larios, A. Effect of the Precursor on the Synthesis of ZnO and Its Photocatalytic Activity. Inorganics 2022, 10, 16. [Google Scholar] [CrossRef]
- Supin, K.K.; Parvathy Namboothiri, P.M.; Vasundhara, M. Enhanced photocatalytic activity in ZnO nanoparticles developed using novel Lepidagathis ananthapuramensis leaf extract. RSC Adv. 2023, 13, 1497–1515. [Google Scholar] [CrossRef]
- Uribe-López, M.C.; Hidalgo-López, M.C.; López-González, R.; Frías-Márquez, D.M.; Núñez-Nogueira, G.; Hernández-Castillo, D.; Alvarez-Lemus, M.A. Photocatalytic activity of ZnO nanoparticles and the role of the synthesis method on their physical and chemical properties. J. Photochem. Photobiol. A Chem. 2021, 404, 112866. [Google Scholar] [CrossRef]
- Gatou, M.-A.; Lagopati, N.; Vagena, I.-A.; Gazouli, M.; Pavlatou, E.A. ZnO Nanoparticles from Different Precursors and Their Photocatalytic Potential for Biomedical Use. Nanomaterials 2023, 13, 122. [Google Scholar] [CrossRef]
- Cheng, Y.; Luo, F.; Jiang, Y.; Li, F.; Wei, C. The effect of calcination temperature on the structure and activity of TiO2/SiO2 composite catalysts derived from titanium sulfate and fly ash acid sludge. Colloids Surf. 2018, 554, 81–85. [Google Scholar] [CrossRef]
- Galata, E.; Georgakopoulou, E.A.; Kassalia, M.-E.; Papadopoulou-Fermeli, N.; Pavlatou, E.A. Development of Smart Composites Based on Doped-TiO2 Nanoparticles with Visible Light Anticancer Properties. Materials 2019, 12, 2589. [Google Scholar] [CrossRef]
- Ohira, T.; Yamamoto, O. Correlation between antibacterial activity and crystallite size on ceramics. Chem. Eng. Sci. 2012, 68, 355–361. [Google Scholar] [CrossRef]
- Nandiyanto, A.B.D.; Triawan, F.; Firly, R.; Kishimoto, K. Crystallite Size on Micromechanical Characteristics of WO3 Microparticles. J. Eng. Res. 2021, 9, 268–277. [Google Scholar] [CrossRef]
- Pourrahimi, A.M.; Liu, D.; Pallon, L.K.H.; Andersson, R.L.; Martínez Aba, A.; Lagarón, J.-M.; Hedenqvist, M.S.; Ström, V.; Gedde, U.W.; Olsson, R.T. Water-based synthesis and cleaning methods for high purity ZnO nanoparticles—Comparing acetate, chloride, sulphate and nitrate zinc salt precursors. RSC Adv. 2014, 4, 35568–35577. [Google Scholar] [CrossRef]
- Kaningini, A.G.; Azizi, S.; Sintwa, N.; Mokalane, K.; Mohale, K.C.; Mudau, F.N.; Maaza, M. Effect of Optimized Precursor Concentration, Temperature, and Doping on Optical Properties of ZnO Nanoparticles Synthesized via a Green Route Using Bush Tea (Athrixia phylicoides DC.) Leaf Extracts. ACS Omega 2022, 7, 31658–31666. [Google Scholar] [CrossRef]
- Alias, S.S.; Ismail, A.B.; Mohamad, A.A. Effect of pH on ZnO nanoparticle properties synthesized by sol–gel centrifugation. J. Alloys Compd. 2010, 499, 231–237. [Google Scholar] [CrossRef]
- Adedokun, O.; Bello, I.T.; Sanusi, Y.K.; Awodugba, A.O. Effect of precipitating agents on the performance of ZnO nanoparticles-based photo-anodes in dye-sensitized solar cells. Surf. Interfaces 2020, 21, 100656. [Google Scholar] [CrossRef]
- Mai, H.H. The influence of precursor concentration on the crystallinity and morphology of ZnO nanorods grown on the printed circuit board substrate. In Proceedings of the 2020 International Conference on Information Technology and Nanotechnology (ITNT), Samara, Russia, 26–29 May 2020; pp. 1–3. [Google Scholar] [CrossRef]
- Søndergaard, M.; Bøjesen, E.D.; Christensen, M.; Iversen, B.B. Size and Morphology Dependence of ZnO Nanoparticles Synthesized by a Fast Continuous Flow Hydrothermal Method. Cryst. Growth Des. 2011, 11, 4027–4033. [Google Scholar] [CrossRef]
- McBride, R.A.; Kelly, J.M.; McCormack, D.E. Growth of well-defined ZnO microparticles by hydroxide ion hydrolysis of zinc salts. J. Mater. Chem. 2003, 13, 1196–1201. [Google Scholar] [CrossRef]
- Ismail, A.M.; Menazea, A.A.; Kabary, H.A.; El-Sherbiny, A.E.; Samy, A. The influence of calcination temperature on structural and antimicrobial characteristics of zinc oxide nanoparticles synthesized by sol–gel method. J. Mol. Struct. 2019, 1196, 332–337. [Google Scholar] [CrossRef]
- Rafaja, D.; Wüstefeld, C.; Dopita, M.; Motylenko, M.; Baehtz, C. Capability of X-ray diffraction for the study of microstructure of metastable thin films. IUCrJ 2014, 1, 446–456. [Google Scholar] [CrossRef] [PubMed]
- Cuscó, R.; Alarcón-Lladó, E.; Ibáñez, J.; Artús, L.; Jiménez, J.; Wang, B.; Callahan, M.J. Temperature dependence of Raman scattering in ZnO. Phys. Rev. B Condens. Matter 2007, 75, 165202. [Google Scholar] [CrossRef]
- Kahouli, M.; Tounsi, N.; Mzabi, N.; Guermazi, H.; Guermazi, S. Enhanced structural and optical properties of ZnO nanopowder with tailored visible luminescence as a function of sodium hydroxide to zinc sulfate mass ratio. Adv. Powder Technol. 2018, 29, 325–332. [Google Scholar] [CrossRef]
- Kaningini, G.A.; Azizi, S.; Nyoni, H.; Nixwel Mudau, F.; Mohale, K.C.; Maaza, M. Green synthesis and characterization of zinc oxide nanoparticles using bush tea (Athrixia phylicoides DC) natural extract: Assessment of the synthesis process. F1000Research 2022, 10, 1077. [Google Scholar] [CrossRef]
- Al-Arjan, W.S. Zinc Oxide Nanoparticles and Their Application in Adsorption of Toxic Dye from Aqueous Solution. Polymers 2022, 14, 3086. [Google Scholar] [CrossRef]
- Thommes, M.; Kaneko, K.; Neimark, A.; Olivier, J.; Rodriguez-Reinoso, F.; Rouquerol, J.; Sing, K. Physisorption of gases, with special reference to the evaluation of surface area and pore size distribution (IUPAC Technical Report). Pure Appl. Chem. 2015, 87, 1051–1069. [Google Scholar] [CrossRef]
- Turcu, E.; Coromelci, C.G.; Harabagiu, V.; Ignat, M. Enhancing the Photocatalytic Activity of TiO2 for the Degradation of Congo Red Dye by Adjusting the Ultrasonication Regime Applied in Its Synthesis Procedure. Catalysts 2023, 13, 345. [Google Scholar] [CrossRef]
- Ghica, D.; Vlaicu, I.D.; Stefan, M.; Nistora, L.C.; Nistor, S.V. On the agent role of Mn2+ in redirecting the synthesis of Zn(OH)2 towards nano-ZnO with variable morphology. RSC Adv. 2016, 6, 106732–106741. [Google Scholar] [CrossRef]
- Manabeng, M.; Mwankemwa, B.S.; Ocaya, R.O.; Motaung, T.E.; Malevu, T.D. A Review of the Impact of Zinc Oxide Nanostructure Morphology on Perovskite Solar Cell Performance. Processes 2022, 10, 1803. [Google Scholar] [CrossRef]
- Fu, H.; Pan, C.; Yao, W.; Zhu, Y. Visible-Light-Induced Degradation of Rhodamine B by Nanosized Bi2WO6. J. Phys. Chem. B 2005, 109, 22432–22439. [Google Scholar] [CrossRef] [PubMed]
- Hu, X.; Mohamood, T.; Ma, W.; Chen, C.; Zhao, J. Oxidative Decomposition of Rhodamine B Dye in the Presence of VO2+ and/or Pt(IV) under Visible Light Irradiation: N-Deethylation, Chromophore Cleavage, and Mineralization. J. Phys. Chem. B 2006, 110, 26012–26018. [Google Scholar] [CrossRef] [PubMed]
- Trenczek-Zajac, A.; Synowiec, M.; Zakrzewska, K.; Zazakowny, K.; Kowalski, K.; Dziedzic, A.; Radecka, M. Scavenger-Supported Photocatalytic Evidence of an Extended Type I Electronic Structure of the TiO2@Fe2O3 Interface. ACS Appl. Mater. Interfaces 2022, 14, 38255–38269. [Google Scholar] [CrossRef] [PubMed]
- Noman, M.T.; Amor, N.; Petru, M.; Mahmood, A.; Kejzlar, P. Photocatalytic behaviour of zinc oxide nanostructures on surface activation of polymeric fibres. Polymers 2021, 13, 1227. [Google Scholar] [CrossRef]
- Nair, M.G.; Nirmala, M.; Rekha, K.; Anukaliani, A. Structural, optical, photo catalytic and antibacterial activity of ZnO and Co doped ZnO nanoparticles. Mater. Lett. 2011, 65, 1797–1800. [Google Scholar] [CrossRef]
- Kaur, J.; Singhal, S. Facile synthesis of ZnO and transition metal doped ZnO nanoparticles for the photocatalytic degradation of Methyl Orange. Ceram. Int. 2014, 40, 7417–7424. [Google Scholar] [CrossRef]
- Sultana, K.A.; Islam, M.D.T.; Silva, J.A.; Turley, R.S.; Hernandez-Viezcas, J.A.; Gardea-Torresdey, J.L.; Noveron, J.C. Sustainable synthesis of zinc oxide nanoparticles for photocatalytic degradation of organic pollutant and generation of hydroxyl radical. J. Mol. Liq. 2020, 307, 112931. [Google Scholar] [CrossRef]
- Kiwaan, H.A.; Atwee, T.M.; Azab, E.A.; El-Bindary, A.A. Efficient photocatalytic degradation of Acid Red 57 using synthesized ZnO nanowires. J. Chin. Chem. Soc. 2018, 66, 89–98. [Google Scholar] [CrossRef]
- Pingping, N.; Guanghui, W.; Pinghua, C.; Huitao, Z.; Qun, C.; Hualin, J. Optimization of Boron Doped TiO2 as an Efficient Visible Light-Driven Photocatalyst for Organic Dye Degradation With High Reusability. Front. Chem. 2020, 8, 172. [Google Scholar] [CrossRef]
- Tsoukleris, D.S.; Gatou, M.-A.; Lagopati, N.; Sygellou, L.; Christodouleas, D.C.; Falaras, P.; Pavlatou, E.A. Chemically Modified TiO2 Photocatalysts as an Alternative Disinfection Approach for Municipal Wastewater Treatment Plant Effluents. Water 2023, 15, 2052. [Google Scholar] [CrossRef]


| Synthesis Parameters | Notation | Unit | Levels of Parameters | |||
|---|---|---|---|---|---|---|
| Level 1 | Level 2 | Level 3 | Level 4 | |||
| Precipitating agent type | PAT | - | NaOH | KOH | - | - |
| Precursor of Zn | Znprec | - | ZnAc | ZnChlor | ZnNit | ZnSulf |
| Concentration of Zn precursor | CZn | M | 0.1 | 0.2 | 0.3 | 0.4 |
| Concentration of precipitation agent | CPA | M | 0.5 | 1.0 | 1.5 | 2.0 |
| Solvent type | Stype | - | DDI-H2O | DI-H2O | CH3OH | CH3CH2OH |
| Solvent pH | SpH | - | 11 | 12 | 13 | 14 |
| Temperature (synthesis) | Tsyn | °C | 50 | 60 | 70 | 80 |
| Temperature (calcination) | Tcalc | °C | 400 | 500 | 600 | 700 |
| Stirring time | Stt | min | 30 | 60 | 90 | 120 |
| Stirring speed | Sts | rpm | 300 | 500 | 700 | 1000 |
| Sample ID | PAT | Znprec | CZn | CPA | Stype | SpH | Tsyn | Tcalc | Stt | Sts |
|---|---|---|---|---|---|---|---|---|---|---|
| S1 | 1 | 1 | 1 * | 1 | 1 | 1 | 1 | 1 | 1 | 1 |
| S2 | 1 | 1 | 2 * | 2 | 2 | 2 | 2 | 2 | 2 | 2 |
| S3 | 1 | 1 | 3 * | 3 | 3 | 3 | 3 | 3 | 3 | 3 |
| S4 | 1 | 1 | 4 * | 4 | 4 | 4 | 4 | 4 | 4 | 4 |
| S5 | 1 | 2 | 1 | 1 | 2 | 2 | 3 | 3 | 4 | 4 |
| S6 | 1 | 2 | 2 | 2 | 1 | 1 | 4 | 4 | 3 | 3 |
| S7 | 1 | 2 | 3 | 3 | 4 | 4 | 1 | 1 | 2 | 2 |
| S8 | 1 | 2 | 4 | 4 | 3 | 3 | 2 | 2 | 1 | 1 |
| S9 | 1 | 3 | 1 | 2 | 3 | 4 | 1 | 2 | 3 | 4 |
| S10 | 1 | 3 | 2 | 1 | 4 | 3 | 2 | 1 | 4 | 3 |
| S11 | 1 | 3 | 3 | 4 | 1 | 2 | 3 | 4 | 1 | 2 |
| S12 | 1 | 3 | 4 | 3 | 2 | 1 | 4 | 3 | 2 | 1 |
| S13 | 1 | 4 | 1 | 2 | 4 | 3 | 3 | 4 | 2 | 1 |
| S14 | 1 | 4 | 2 | 1 | 3 | 4 | 4 | 3 | 1 | 2 |
| S15 | 1 | 4 | 3 | 4 | 2 | 1 | 1 | 2 | 4 | 3 |
| S16 | 1 | 4 | 4 | 3 | 1 | 2 | 2 | 1 | 3 | 4 |
| S17 | 2 | 1 | 1 | 4 | 1 | 4 | 2 | 3 | 2 | 3 |
| S18 | 2 | 1 | 2 | 3 | 2 | 3 | 1 | 4 | 1 | 4 |
| S19 | 2 | 1 | 3 | 2 | 3 | 2 | 4 | 1 | 4 | 1 |
| S20 | 2 | 1 | 4 | 1 | 4 | 1 | 3 | 2 | 3 | 2 |
| S21 | 2 | 2 | 1 | 4 | 2 | 3 | 4 | 1 | 3 | 2 |
| S22 | 2 | 2 | 2 | 3 | 1 | 4 | 3 | 2 | 4 | 1 |
| S23 | 2 | 2 | 3 | 2 | 4 | 1 | 2 | 3 | 1 | 4 |
| S24 | 2 | 2 | 4 | 1 | 3 | 2 | 1 | 4 | 2 | 3 |
| S25 | 2 | 3 | 1 | 3 | 3 | 1 | 2 | 4 | 4 | 2 |
| S26 | 2 | 3 | 2 | 4 | 4 | 2 | 1 | 3 | 3 | 1 |
| S27 | 2 | 3 | 3 | 1 | 1 | 3 | 4 | 2 | 2 | 4 |
| S28 | 2 | 3 | 4 | 2 | 2 | 4 | 3 | 1 | 1 | 3 |
| S29 | 2 | 4 | 1 | 3 | 4 | 2 | 4 | 2 | 1 | 3 |
| S30 | 2 | 4 | 2 | 4 | 3 | 1 | 3 | 1 | 2 | 4 |
| S31 | 2 | 4 | 3 | 1 | 2 | 4 | 2 | 4 | 3 | 1 |
| S32 | 2 | 4 | 3 | 1 | 2 | 4 | 2 | 4 | 3 | 1 |
| Sample ID | Average Crystallite Size (nm) * | Full Width at Half Maximum (FWHM) | Crystallinity (%) |
|---|---|---|---|
| S1 | 12.20 ± 5.3 × 10⁻³ | 0.1774 | 75.85 ± 2.3 × 10⁻³ |
| S2 | 3.52 ± 4.4 × 10⁻³ | 0.5166 | 73.57 ± 2.7 × 10⁻³ |
| S3 | 3.29 ± 4.3 × 10⁻³ | 0.5618 | 79.83 ± 1.1 × 10⁻³ |
| S4 | 5.27 ± 5.0 × 10⁻³ | 0.3236 | 65.20 ± 1.8 × 10⁻³ |
| S5 | 5.50 ± 6.3 × 10⁻³ | 0.3364 | 77.87 ± 1.7 × 10⁻³ |
| S6 | 8.07 ± 6.1 × 10⁻³ | 0.2282 | 76.67 ± 2.4 × 10⁻³ |
| S7 | 5.24 ± 6.2 × 10⁻³ | 0.3256 | 71.13 ± 2 × 10⁻³ |
| S8 | 4.97 ± 3.9 × 10⁻³ | 0.3436 | 71.84 ± 1.5 × 10⁻³ |
| S9 | 3.63 ± 3.1 × 10⁻³ | 0.5088 | 73.67 ± 1.7 × 10⁻³ |
| S10 | 5.08 ± 4.1 × 10⁻³ | 0.3680 | 73.87 ± 1.6 × 10⁻³ |
| S11 | 10.25 ± 4.1 × 10⁻³ | 0.1774 | 73.58 ± 2.2 × 10⁻³ |
| S12 | 10.69 ± 2.9 × 10⁻³ | 0.1595 | 74.48 ± 3.7 × 10⁻³ |
| S13 | 9.50 ± 3.9 × 10⁻³ | 0.1899 | 76.34 ± 3.1 × 10⁻³ |
| S14 | 5.76 ± 3.8 × 10⁻³ | 0.3162 | 70.23 × 10⁻³ |
| S15 | 5.57 ± 4.4 × 10⁻³ | 0.3272 | 72.69 ± 2.7 × 10⁻³ |
| S16 | 11.56 ± 7.0 × 10⁻³ | 0.1475 | 70.94 ± 4.4 × 10⁻³ |
| S17 | 8.16 ± 5.1 × 10⁻³ | 0.2206 | 69.77 ± 2.8 × 10⁻³ |
| S18 | 9.07 ± 5.4 × 10⁻³ | 0.2039 | 69.01 ± 2.1 × 10⁻³ |
| S19 | 12.32 ± 4.5 × 10⁻³ | 0.1385 | 71.32 ± 3.4 × 10⁻³ |
| S20 | 8.43 ± 4.5 × 10⁻³ | 0.2136 | 72.19 ± 5.7 × 10⁻³ |
| S21 | 5.15 ± 5.2 × 10⁻³ | 0.3316 | 75.55 ± 2.3 × 10⁻³ |
| S22 | 4.59 ± 4.0 × 10⁻³ | 0.4052 | 76.77 ± 2.8 × 10⁻³ |
| S23 | 13.27 ± 4.9 × 10⁻³ | 0.1285 | 76.21 ± 6.4 × 10⁻³ |
| S24 | 10.43 ± 4.3 × 10⁻³ | 0.1635 | 68.64 ± 5.1 × 10⁻³ |
| S25 | 5.64 ± 5.6 × 10⁻³ | 0.3026 | 69.83 ± 2.8 × 10⁻³ |
| S26 | 5.83 ± 5.6 × 10⁻³ | 0.2926 | 71.73 ± 3.4 × 10⁻³ |
| S27 | 9.01 ± 7.1 × 10⁻³ | 0.2042 | 75.49 × 10⁻³ |
| S28 | 4.82 ± 6.1 × 10⁻³ | 0.3838 | 76.02 ± 1.7 × 10⁻³ |
| S29 | 5.07 ± 6.0 × 10⁻³ | 0.3622 | 76.54 ± 1.4 × 10⁻³ |
| S30 | 8.43 ± 4.6 × 10⁻³ | 0.2182 | 73.76 ± 3.7 × 10⁻³ |
| S31 | 8.80 ± 4.4 × 10⁻³ | 0.2092 | 75.65 ± 3.4 × 10⁻³ |
| S32 | 4.82 ± 5.3 × 10⁻³ | 0.3862 | 74.88 ± 4.3 × 10⁻³ |
| Sample ID | Energy Band Gap (Eg, eV) | Sample ID | Energy Band Gap (Eg, eV) |
|---|---|---|---|
| S1 | 3.38 ± 2.1 × 10⁻³ | S17 | 3.41 × 10⁻³ |
| S2 | 3.38 × 10⁻³ | S18 | 3.41 × 10⁻³ |
| S3 | 3.37 × 10⁻³ | S19 | 3.41 × 10⁻³ |
| S4 | 3.38 ± 1.5 × 10⁻³ | S20 | 3.40 × 10⁻³ |
| S5 | 3.38 ± 2.3 × 10⁻³ | S21 | 3.38 ± 2.7 × 10⁻³ |
| S6 | 3.39 ± 2.7 × 10⁻³ | S22 | 3.39 ± 2.4 × 10⁻³ |
| S7 | 3.40 ± 1.2 × 10⁻³ | S23 | 3.39 ± 3.1 × 10⁻³ |
| S8 | 3.41 ± 1.7 × 10⁻³ | S24 | 3.38 ± 4.3 × 10⁻³ |
| S9 | 3.41 ± 0.9 × 10⁻³ | S25 | 3.38 ± 4.1 × 10⁻³ |
| S10 | 3.38 ± 1.1 × 10⁻³ | S26 | 3.38 ± 2.1 × 10⁻³ |
| S11 | 3.39 ± 0.8 × 10⁻³ | S27 | 3.40 ± 2.5 × 10⁻³ |
| S12 | 3.40 ± 3.7 × 10⁻³ | S28 | 3.39 × 10⁻³ |
| S13 | 3.40 ± 2.4 × 10⁻³ | S29 | 3.40 × 10⁻³ |
| S14 | 3.39 ± 2.3 × 10⁻³ | S30 | 3.38 × 10⁻³ |
| S15 | 3.39 ± 3.1 × 10⁻³ | S31 | 3.39 ± 2.2 × 10⁻³ |
| S16 | 3.38 × 10⁻³ | S32 | 3.39 × 10⁻³ |
| Sample ID | Apparent Rate Constant (k, min−1) | R2 | Sample ID | Apparent Rate Constant (k, min−1) | R2 |
|---|---|---|---|---|---|
| S1 | 0.057 | 0.972 | S17 | 0.055 | 0.970 |
| S2 | 0.052 | 0.995 | S18 | 0.061 | 0.970 |
| S3 | 0.065 | 0.989 | S19 | 0.052 | 0.966 |
| S4 | 0.054 | 0.974 | S20 | 0.057 | 0.971 |
| S5 | 0.059 | 0.975 | S21 | 0.051 | 0.965 |
| S6 | 0.058 | 0.969 | S22 | 0.057 | 0.988 |
| S7 | 0.060 | 0.965 | S23 | 0.058 | 0.974 |
| S8 | 0.057 | 0.963 | S24 | 0.057 | 0.980 |
| S9 | 0.054 | 0.974 | S25 | 0.061 | 0.987 |
| S10 | 0.063 | 0.978 | S26 | 0.063 | 0.993 |
| S11 | 0.060 | 0.967 | S27 | 0.056 | 0.996 |
| S12 | 0.059 | 0.957 | S28 | 0.053 | 0.994 |
| S13 | 0.051 | 0.992 | S29 | 0.051 | 0.992 |
| S14 | 0.059 | 0.975 | S30 | 0.054 | 0.995 |
| S15 | 0.058 | 0.991 | S31 | 0.051 | 0.989 |
| S16 | 0.063 | 0.982 | S32 | 0.048 | 0.972 |
| Factor | Znprec | PAT | CZn | CPA | Stype | |||||
|---|---|---|---|---|---|---|---|---|---|---|
| Parameter | % | Rank | % | Rank | % | Rank | % | Rank | % | Rank |
| D (nm) | 12 | 5 | 2 | 9 | 16 | 2 | 14 | 4 | 7 | 7 |
| Crystallinity (%) | 15 | 4 | 1 | 10 | 16 | 1 | 16 | 2 | 9 | 6 |
| Eg (eV) | 62 | 1 | 1 | 10 | 4 | 3 | 3 | 7 | 1 | 9 |
| k (min−1) | 56 | 1 | 6 | 5 | 7 | 3 | 9 | 2 | 1 | 9 |
| Factor | SpH | Tsyn | Tcalc | Stt | Sts | |||||
| Parameter | % | Rank | % | Rank | % | Rank | % | Rank | % | Rank |
| D (nm) | 18 | 1 | 1 | 10 | 15 | 3 | 7 | 8 | 8 | 6 |
| Crystallinity (%) | 15 | 3 | 4 | 8 | 13 | 5 | 2 | 9 | 9 | 7 |
| Eg (eV) | 3 | 6 | 1 | 8 | 4 | 5 | 7 | 2 | 4 | 4 |
| k (min−1) | 4 | 8 | 7 | 4 | 4 | 7 | 1 | 10 | 5 | 6 |
| Sample | Crystal Lattice Index (a = b ≠ c) | Average Crystallite Size (nm) * | FWHM | Crystallinity (%) | ||
|---|---|---|---|---|---|---|
| a | b | c | ||||
| S3 | 2.8152 | 2.8152 | 5.2055 | 3.290 ± 7.26 × 10⁻³ | 0.5618 | 79.83 |
| Bragg’s Angle | dhkl (Å) | dhkl (nm) | hkl | |
|---|---|---|---|---|
| 2θ | θ | |||
| 31.76 | 15.88 | 2.8152 | 0.28152 | 100 |
| 34.43 | 17.22 | 2.6027 | 0.26027 | 002 |
| 36.27 | 18.14 | 2.4748 | 0.24748 | 101 |
| 47.56 | 23.78 | 1.9103 | 0.19103 | 102 |
| 56.64 | 28.32 | 1.6238 | 0.16238 | 110 |
| 62.89 | 31.45 | 1.4766 | 0.14766 | 103 |
| 66.53 | 33.27 | 1.4043 | 0.14043 | 200 |
| 67.99 | 34.00 | 1.3777 | 0.13777 | 112 |
| 69.11 | 34.56 | 1.3581 | 0.13581 | 201 |
| 72.63 | 36.32 | 1.3007 | 0.13007 | 004 |
| 76.98 | 38.49 | 1.2377 | 0.12377 | 202 |
| Sample | (a) BET Surface Area (m2/g) | (b) Micropore Surface Area (m2/g) | (c) Cumulative Volume (1.7–300 nm) (cm3/g) | (d) Average Pore Diameter (nm) |
|---|---|---|---|---|
| S3 | 32 | 3 | 0.1 | 19 |
| Sample | Hydrodynamic Diameter (Dh) (nm) | PdI * |
|---|---|---|
| S3 | 27.33 ± 1.09 | 0.123 ± 0.011 |
| Sample | Pseudo-First-Order Kinetic Model | Pseudo-Second-Order Kinetic Model | ||
|---|---|---|---|---|
| k1 (min−1) | R2 | k2 (g/mg·min) | R2 | |
| S3 | 0.065 | 0.989 | 0.226 | 0.337 |
Disclaimer/Publisher’s Note: The statements, opinions and data contained in all publications are solely those of the individual author(s) and contributor(s) and not of MDPI and/or the editor(s). MDPI and/or the editor(s) disclaim responsibility for any injury to people or property resulting from any ideas, methods, instructions or products referred to in the content. |
© 2023 by the authors. Licensee MDPI, Basel, Switzerland. This article is an open access article distributed under the terms and conditions of the Creative Commons Attribution (CC BY) license (https://creativecommons.org/licenses/by/4.0/).
Share and Cite
Gatou, M.-A.; Kontoliou, K.; Volla, E.; Karachalios, K.; Raptopoulos, G.; Paraskevopoulou, P.; Lagopati, N.; Pavlatou, E.A. Optimization of ZnO Nanoparticles’ Synthesis via Precipitation Method Applying Taguchi Robust Design. Catalysts 2023, 13, 1367. https://doi.org/10.3390/catal13101367
Gatou M-A, Kontoliou K, Volla E, Karachalios K, Raptopoulos G, Paraskevopoulou P, Lagopati N, Pavlatou EA. Optimization of ZnO Nanoparticles’ Synthesis via Precipitation Method Applying Taguchi Robust Design. Catalysts. 2023; 13(10):1367. https://doi.org/10.3390/catal13101367
Chicago/Turabian StyleGatou, Maria-Anna, Katerina Kontoliou, Eleni Volla, Konstantinos Karachalios, Grigorios Raptopoulos, Patrina Paraskevopoulou, Nefeli Lagopati, and Evangelia A. Pavlatou. 2023. "Optimization of ZnO Nanoparticles’ Synthesis via Precipitation Method Applying Taguchi Robust Design" Catalysts 13, no. 10: 1367. https://doi.org/10.3390/catal13101367