Article

Development of an Improved Kinetic Model for CO2 Hydrogenation to Methanol

1
HySA Infrastructure Center of Competence, Center for Nanostructures and Advanced Materials (CeNAM), Chemicals Cluster, Council for Scientific and Industrial Research (CSIR), Pretoria 0001, South Africa
2
Center of Excellence in Carbon Based Fuels, School of Chemical and Minerals Engineering, Faculty of Engineering, North-West University, Private Bag X6001, Potchefstroom 2531, South Africa
3
Institute of Chemistry and Processes for Energy, Environment and Health (ICPEES), UMR 7515 CNRS-University of Strasbourg, 25 Rue Becquerel, CEDEX 02, 67087 Strasbourg, France
4
Department of Energy, Aalborg University, Pontoppidanstr. 111, 9220 Aalborg, Denmark
5
Department of Chemistry, University of Pretoria, Private Bag X20, Hatfield 0028, South Africa
6
Department of Mechanical Engineering Science, University of Johannesburg, Cnr Kingsway and University Roads, Auckland Park, Johannesburg 2092, South Africa
*
Authors to whom correspondence should be addressed.
Catalysts 2023, 13(10), 1349; https://doi.org/10.3390/catal13101349
Submission received: 7 September 2023 / Revised: 4 October 2023 / Accepted: 5 October 2023 / Published: 6 October 2023

Abstract

:
The kinetics of methanol synthesis remains debatable for various reasons, such as the lack of scientifically conclusive agreement about reaction mechanisms. The focus of this paper is on the evaluation of the intrinsic kinetics of the methanol synthesis reaction based on CO2 hydrogenation and the associated reverse water–gas shift as overall reactions. The industrial methanol synthesis catalyst, Cu/ZnO/Al2O3/MgO, was used for performing the kinetic studies. An optimal kinetic model was assessed for its ability to predict the experimental data from differential to integral conditions, contrary to the typical fitting of only the integral conditions’ data (common practice, as reported in the literature). The catalyst testing and kinetic evaluations were performed at various temperatures (210–260 °C) and pressures (40–77 bar), and for different stoichiometric numbers (0.9–1.9), H2/CO2 ratios (3.0–4.4) and carbon oxide ratios (0.9–1.0), in an isothermal fixed bed reactor, operated in a plug-flow mode. Experiments with CO in the feed were also generated and fitted. Different literature kinetic models with different assumptions on active sites, rate-determining steps, and hence, model formulations were fitted and compared. The original Seidel model appeared to fit the kinetic data very well, but it has twelve parameters. The modified model (MOD) we propose is derived from this Seidel model, but it has fewer (nine) parameters—it excludes CO hydrogenation, but it takes into consideration the morphological changes of active sites and CO adsorption. This MOD model, with three active sites, gave the best fit to all the data sets.

Graphical Abstract

1. Introduction

Methanol is a versatile chemical for both grid stabilization and valorization of CO2 [1,2]. It is industrially produced from a syngas mixture (CO/CO2/H2) over a Cu/ZnO/Al2O3 catalyst at 50–100 bar and 200–300 °C [1]. Recently, a trend to directly produce methanol from direct CO2 hydrogenation has gained serious momentum [3]. However, methanol synthesis from CO2 still requires improvements and an associated understanding of its science. Efficient catalysts for direct CO2 hydrogenation to methanol are sought after and a subject of extensive research. The detailed kinetics of methanol synthesis from CO2 is still under debate, primarily due to knowledge gaps, for example, in aspects pertaining to the reaction mechanism, surface coverages, morphological changes, and active sites of the catalysts. Furthermore, there are many discrepancies in the conditions and feed composition upon which these models are based, making one question the exact windows within which they are valid. These discrepancies could also be due to different catalyst formulations. Moreover, kinetics is influenced mainly by experimental conditions and catalyst parameters. Typically, to address some of the gaps, lumped parameters are used in the kinetic model formulation. However, such approaches come short because they do not explicitly describe the coverages of all the intermediates [4]. On the other hand, in situ methods are also used, such as in a recent study by Tarasov et al. [5], in which the adsorbed species during low-temperature methanol synthesis over Cu/ZnO/Al catalyst was quantified.
There exists a great challenge to transfer the knowledge generated using the in situ methods into usable mathematical models. First, before the sophisticated model, simplistic models such as semi-empirical power law models are typically used because they offer reduced model complexity. The validity range of these models is, however, a critical limitation. Furthermore, the model accuracy remains an issue. There is a trade-off between the model complexity and the accuracy in predicting experimental data, but this could be improved by developing simpler and more accurate models [6,7,8,9,10].
Model complexity is a serious concern when it comes to applying these models in reactor modeling using computational fluid dynamics (CFD) platforms because they can introduce a computationally tedious non-linear coupling [2]. However, with advances in artificial intelligence techniques such as neural networks, there are reasons to believe that the model complexity will be tackled. Moreover, additional parameters can be added via data-driven modeling approaches (e.g., via a precomputed rate expression or the so-called mapping spline approach as demonstrated by Votsmeier [11] and Klingenberger et al. [12]) even though these models still have a challenge of treating the reactor as a black box and thus limiting full reactor optimization potential. This must be linked to the catalyst and kinetic model development, which is concomitant and synergistic with advances in knowledge of methanol synthesis. Furthermore, it is critical that these models provide contributions in terms of formulation and/or the guiding of new experiments. Ultimately, the choice of the kinetic model will affect the techno-economics of the process. As final conclusions deciphering the reaction kinetics of the methanol synthesis process have not yet been reached, there is still much to be investigated regarding this [8]. The objective of this study is to develop an improved kinetic model for CO2 hydrogenation to methanol.

Statement of Originality

This paper compares different kinetic models for methanol synthesis under similar conditions and presents a better-performing model for the CO2 hydrogenation to methanol (CH3OH) with CO in the feed. The architecture of the modified model (herein referred to as MOD) follows that of the original model of Seidel et al. [13,14] (herein referred to as OR-SD) with consideration of morphological changes and three active sites, but excluding the CO hydrogenation (even though the CO adsorption is considered), yielding a model with fewer parameters (here nine) than the original model of Siedel et al. (there 12 parameters). As a key parameter, higher gas hourly space velocity (GHSV) values (516,000–774,000 h−1) are used to generate the new experimental data presented in this paper, thus rendering most experimental CO2 conversion over the commercial catalyst to be <10%, and hence, corresponding to differential conditions per the definition of differential conditions given by Skrzypek et al. [15] and Kubota et al. [16]. Integral conditions correspond to experimental data points with CO2 conversion >10%. To the authors’ knowledge, no reported work has yet presented a similar modified model and assessed its performance in comparison to other literature models.

2. Literature Review and Theory

Methanol is industrially produced from syngas following the three main equilibrium reactions, as expressed by Equations (1)–(3), over an industrial Cu/ZnO/Al2O3 catalyst. However, it has been recently demonstrated that methanol can also be successfully produced from a feed with pure CO2/H2 (via Equation (1)), even though the actual reaction mechanism and carbon source for methanol remains an active topic of debate [2,8,9,10,16,17,18,19,20].
CO2 + 3H2 ↔ CH3OH + H2O Δr298K = –49.43 kJ/mol
CO2 + H2 ↔ CO + H2O Δr298K = +41.12 kJ/mol
CO + 2H2 ↔ CH3OH Δr298K = −90.55 kJ/mol
Following Le Chatelier’s principle, thermodynamic simulations show that higher methanol yields are favorable at lower temperatures and higher pressures [21]. However, for the reason of enhancing kinetics, temperatures in the range 200–300 °C and pressures in the range 50–100 bar are used over the commercial Cu/ZnO/Al2O3 catalyst. The reverse water–gas shift (RWGS) reaction (Equation (2)) is the only endothermic reaction in the three main reactions expressed as Equations (1)–(3). It is, therefore, promoted as the temperature increases, thus leading to a significant amount of water in the case of a pure CO2/H2 feed. This then reduces the selectivity of methanol and the catalyst activity.
Consequently, significant research efforts have been devoted to the CO2 hydrogenation to methanol process, mostly to improve the catalyst conversion and selectivity [4]. The commercial Cu/ZnO/Al2O3-based catalyst is nonetheless likely to remain the best possible choice for quite some time due to its ability to give high yields (as a result of a favorable ratio between conversion and selectivity), its significant low cost, high stability and operation at reduced (close to optimal) reaction pressures [22]. Ruland et al. [22] established, using dynamic experimental conditions relevant to power-to-methanol (PtMeOH), that the industrial Cu/ZnO/Al2O3 catalyst is highly stable under the conditions of chemical energy storage with wet hydrogen produced from fluctuating renewable energy sources, thus indicating its relevance for application in PtMeOH. Besides the challenges associated with optimizing the catalyst to promote CO2/H2 to methanol, beyond what the commercially available catalyst can achieve, this reaction is attractive from an environmental perspective because a significant quantity of CO2 can be recycled. In addition, it is less exothermic compared to the CO hydrogenation to methanol reaction, thus making it slightly less difficult to manage the heat in the reactor and consequently reducing hot spot formation. Then, besides the CO formed from the RWGS, only a few other by-products (e.g., CH4, dimethyl ether (DME), etc.) are formed from the reactants [23].
The Langmuir–Hinshelwood/Hougen–Watson (LHHW) mechanism is commonly used for the kinetic model development of methanol synthesis. The generalized rate expression of the LHHW is illustrated by Equation (4).
r = k i n e t i c   f a c t o r · d r i v i n g   f o r c e a d s o r p t i o n   t e r m n
where n is the adsorption term exponent, LHHW demands some postulation about the reaction mechanism and the rate-determining step (RDS); as a result, typically, the model has lumped parameters fitted to experimental data [18,19]. Table 1 shows the validity range of some commonly LHHW-based models, which will be discussed in this article. LHHW-based models are highly sensitive to the validity range such that using such models beyond their validity range increases the prediction errors.
The macroscopic LHHW-based kinetic models reported in the literature include standard kinetic models for methanol synthesis: the model of van den Bussche and Froment [17] (herein referred to as VBF) and the model of Graaf et al. [24] (herein referred to as OR-GR). Recently, these models have been applied in the performance evaluation of direct CO2 hydrogenation to methanol. The OR-GR [24] model differs from the VBF model [17] in that the former includes both CO2 and CO hydrogenation steps, while the latter only considers the CO2 hydrogenation steps and the RWGS. The OR-GR [24] assumes a dual-site mechanism where CO and CO2 (both hydrogenated to methanol) competitively adsorb on one site (site 1), while H2 and H2O also competitively adsorb on another active site (site 2). The development of the VBF model was based on the assumption that the primary and sole source of carbon in methanol was CO2. It was assumed that both CO2 and H2 adsorb on the same active site. Furthermore, water inhibition was considered.
Park et al. [23] developed their 14-parameter kinetic model following the assumption of three types of adsorption sites by adding a different adsorption site for CO2. This multi-site model incorporates the methanol formation from both CO and CO2, the RWGS reaction, and the dehydration of methanol to DME. Díez-Ramírez et al. [25] developed three LHHW-based kinetic models for CO2 hydrogenation to methanol, assuming one type of competitive active site (model 1), two types of adsorption sites (model 2), and three types of adsorption sites (model 3), under atmospheric conditions, and for a Pd-Cu-Zn/SiC catalyst. Although all three models predicted the experiments well, from model discrimination, the three-site adsorption had the lowest residual sum of squares and hence performed better, meeting all the parameter constraints. Nonetheless, their 10-parameter model is complex.
The model of Ovesen et al. [26] considered the three overall reactions, with CO and CO2 having their own adsorption sites and the possibility of dynamic change in the nature of the active sites (typically referred to as morphological change) as a function of gas compositions [27,28,29,30,31,32,33,34,35,36,37,38]. For example, morphological changes can also be initiated by the adsorption of oxidizing or reducing components and temperature, all of which may exercise a change influence on the surface free energy and introduce a strain in the copper particles [4]. In this model, the morphological change was accounted for by making the total copper surface area a function of the gas-phase reduction potential and incorporating the Wulff construction to denote the shape of a crystal as a function of surface free energy minimization. The ratio of the exposed low-index planes depends dynamically on the gaseous atmosphere.
This model was further adopted by Peter [4], who compared it to the VBF model. Peter [4] deduced that although the model of Ovesen et al. [26] fitted the experimental data very well, it could still be improved by incorporation of the synergistic effect of the Cu-ZnO and coverage dependence of intermediates and possible inhibitions [31]. Grunwaldt et al. [31] deduced that the zinc coverage generally decreases with an increase in the CO2 to COy ratio (COy = CO + CO2). The dynamic changes gave insight into conflicting reaction orders. The model can also be used to describe the kinetic behavior under transient conditions.
Seidel et al. [13,14], in their OR-SD model, adopted the same reaction mechanism (with the three overall reactions) as in the OR-GR model [24] but considered three active sites instead of two, as well as the morphological change factor as introduced by Ovesen et al. [26]. They deduced that their model is applicable to both steady-state and dynamic conditions. However, this model is defined by 12 parameters at one temperature point, thus rendering it rather complex, with highly correlated parameters; it is difficult to adapt to different experimental setups.
Slotboom et al. [8] proposed a model (the Slotboom model) that follows the same mechanism as that of the VBF, but it considers CO adsorption and hence three active sites. They compared various literature models, including the OR-GR and VBF models, as well as the OR-SD model, by refitting them on the same data set. Following such fitting, they derived a ten- and six-parameter model, which showed good performance. The six-parameter model addresses the parameter identifiability problem, but improvements could still be made to better predict the methanol and water compositions in the product stream. They highlighted that it is not necessarily the inclusion of CO hydrogenation that improves the accuracy, but rather, it is the consideration of at least two or three active sites that increases the accuracy of the kinetic model. This has recently been confirmed by Li et al. [32], who compared the error variance of model correlation and the adsorbate coverage [28].
Hence, the models of Seidel et al. [13,14] and Slotboom et al. [8] fitted their data very well. Although the OR-SD model showed better accuracy, it was deduced by Slotboom et al. [8] as having a higher degree of complexity. Thus, following their aim of solving the parameter identifiability, this rendered the model developed by Slotboom et al. [8] attractive due to its simplicity and reduced parameters, making it easier to adapt to various experimental conditions and setups.
In the most recent work, Bissotti et al. [6,7], using the recent literature and industrial data, refitted the literature standard, the model of Graaf et al. [24] (the OR-GR model) to generate an updated model for methanol synthesis; this they referred to as ref-GR. They deduced that the ref-GR model provided better predictions and did not show any abnormal trend in the reaction rate profile for all the conditions considered in their study [6,7]. Furthermore, they deduced that their ref-GR model better predicts the methanol productivity than both the OR-GR and the VBF [17] models. The OR-GR and VBF models were said to underestimate and overestimate the methanol production rate, respectively [6,7]. They also highlighted the limitations in the predictive capability of the OR-GR and VBF models for some operating conditions (e.g., medium-low pressure and some feed compositions) [6,7]. Nonetheless, their model still has the same number of parameters as the OR-GR model and poorly predicts the COx conversion and CO formation. It is also possible that the dual prediction of the concentration of the same species, as identified by Bozzano and Manenti [20], exists in the model proposed by Bissotti et al. [6,7].
Nestler et al. [9,10], following the same mechanism as that of Graaf et al. [24] (i.e., including two competitive adsorption sites), proposed and further validated their nine-parameter kinetic model using a mini-plant setup that featured a non-isothermal polytropic reactor with highly resolved fiber optics for temperature measurements. Following the comparisons presented by Nestler et al. [10] of various literature models based on their capability to correctly predict the hot spot position inside the reactor, Nestler et al. [9] attempted to close the gap via the use of fiber optics to collect temperature profile data within the reactor, in an effort to improve the model performance. They presented this validated model as a modified version (Nestlerfit [9]) of their original model (Nestler et al. [10]) and compared it with other literature kinetic models, i.e., the refitted Graaf et al. and VBF models (denoted in their paper [9] as Graaffit and VBFfit models,). The Nestlerfit [9] is defined by only nine parameters; it considers two active sites and neglects the CO hydrogenation. Following the comparisons, the authors deduced that the Graaffit and Nestlerfit models showed comparable remaining errors. They attributed this to the similar mechanism and RDS between Nestlerfit [9] and Graaffit [9], although Nestlerfit neglected the CO hydrogenation reaction to methanol. To justify the neglect of this reaction, the authors deduced that the CO hydrogenation in the Nestlerfit can be neglected due to its low reaction rate (|rco| < 6.0 × 10⁻⁸ mol s−1 kgcat−1) compared to the CO2 hydrogenation (|rco2| > 3.2 × 10⁻³ mol s−1 kgcat−1) and RWGS (|rrwgs| > 1.5 × 10⁻³ mol s−1 kgcat−1) reactions. This agrees with other literature findings [33]. While the VBFfit model still showed large deviations in predicting the concentrations and temperature profiles. The Graaffit [9] and Nestlerfit [9] predicted the temperature profile with a mean error values of 1.4 K and 1.5 K, respectively, indicating an improved accuracy relative to the original models in Graaf et al. [24] and Nester et al. [10]. However, the authors did realize that the Nestlerfit model [9] had a slightly lower accuracy in calculating the product composition than the original model in Nester et al. [10]. Nonetheless, the original model in Nester et al. [10] was predicted to yield higher deviations in predicting the concentration profile at high carbon oxide ratio (COR) and high GHSV as discussed by the authors in Nester et al. [9], and this thus advocates for obtaining more experimental data in this direction.
Kyrimis et al. [2] compared the performance of recent models (with and without CO hydrogenation), including the model of Park et al. [23] and Nestler et al. [10], to establish the role of CO hydrogenation and to better understand which model performs better using a CFD model. The advantage of CFD modeling is that it gives important insights into the species concentrations, temperature profile, and reaction rate magnitude, which are not easy to derive from physical experiments [2]. From their work, following deductions from the literature regarding CO2 hydrogenation to methanol, CO2 is converted at an early stage in the packed bed to form methanol and water; thus, thermodynamic equilibrium is reached halfway through the axial reactor length. CO is thereafter converted either to CO2 via a forward gas shift reaction and subsequently to methanol or via direct CO hydrogenation. However, in the absence of CO in the feed, CO production via RWGS takes priority, as observed in both models and in the studies from Kyrimis et al. [2] and Gou et al. [35,36]. The contribution of CO hydrogenation to methanol formation was found to vary with the CO feed composition and conditions such as temperature and pressure. This finding is similar to that of Grabow and Mavrikakis [34], who, from their microkinetic modeling, also deduced that the contribution of CO2 and CO hydrogenation is dependent on the prevailing conditions. However, when considering the CO hydrogenation in the model formulation, the complexity of the model is increased due to the complex interaction of the three global reactions. Recently, de Oliveira Campos et al. [19] deduced from microkinetic modeling that the role of CO hydrogenation to methanol is negligible at high CO2/CO, and as a result, without CO hydrogenation, their six-parameter model predicted CO2-containing feed adequately. Such insights, as they will be first proven by refitting the Seidel et al. [14] model in this paper, and if true, then adopted in our model formulation, have already been considered in most recent models such as Nestler et al. [9,10]. The model of Nestler et al. [10] has a wider validity range than that of Park et al. [23], and its predictive capability is not far off, especially for experiments with higher CO2 in the feed (a higher COR), perhaps due to the assumption of more than one active site. The model of Nestler et al. [10] predicted a high-temperature variation profile even though the more exothermic CO hydrogenation is neglected [2]. On the other hand, the model of Park et al. [23] showed a low rate of CO hydrogenation early in the bed; however, its contribution to the temperature variation profile, due to its high exothermicity, was notable. It was deduced that none of these models best predict the temperature profile inside the reactor, indicating the need for more experimental data that capture not only the compositions but also the temperature profiles inside the reactor. The kinetic model should, however, be good at predicting in addition to fitting the known data set very well [8,39].
Other very important models are microkinetic models. Microkinetic models offer detailed modeling using surface reactions and insights into the reaction mechanism, taking surface energies into consideration [2,23,34]. Recently, de Oliveira Campos et al. [18] considered 690 data points, with others reported in the literature (139 data points from Seidel et al. [4,13], 98 data points from Park et al. [23], and 94 data points from Slotboom et al. [8]), to develop their three-site mean-field microkinetic model based on ab initio density function theory to simulate the conversion of syngas (H2/CO/CO2) to methanol. Their model considers both CO and CO2 hydrogenation as well as RWGS as overall reactions and morphological changes and fits all the experimental data well, with the mean error values of 8.0, 3.3, and 21.7% for CO, CO2, and methanol, respectively. The insights drawn from this model include the deduction that hydrogenation of formic acid is the RDS, with formate being the most sensitive species on the surface. However, there are discrepancies in the model performance at low temperatures, a high CO2/CO ratio in the feed, and a high GHSV. This motivates the fitting of more accurate data at low temperature, high CO2/CO, and high GHSV conditions; such a combination will typically render low conversion and, hence, possibly differential conditions [40]. In this paper, we consider experimental points generated under such conditions in the model fitting and develop an improved and simplified kinetic model for CO2 hydrogenation to methanol.

3. Results and Discussion

3.1. Diffusion Limitation Tests

The diffusion limitation results are presented in Table 2. The internal limitations are present between S3 = 125–250 µm and S2 = 63–125 µm, as shown by the difference (~5%) in CO2 conversion (see Table on the Section 3.2.2 Model of Graaf et al. (OR-GR)). The CO2 conversion difference for catalyst grain size S1 = 40–63 µm and S2 = 63–125 µm is <1%. For the grain size S2 = 63–125 µm, the internal diffusion could be excluded because it was found to not be significantly limiting, even though it is not zero. Thus, the kinetic studies were further performed with the particle sizes S2 = 63–125 µm. An experimental test with a bed containing only inert material was conducted to assess the wall effect. No conversion of reactants and formation of the liquid product were observed. Thus, the wall effect was assumed to be negligible in this study.
For external diffusion tests (see Table 2), the conversion evaluated for mc = 4.0 mg and flow rate 28.5 mL (STP) min−1 was very close to the conversion obtained when the mass and flow rate were doubled (2 × mc = 8.0 mg and 2Q = 57.0 mL (STP) min−1) at 260 °C. It is critical to note that the external diffusion is promoted by the gas velocity increase, but since the conversion obtained was almost similar for both cases, it was concluded that the external diffusion is not limiting for flow rates > 28.5 mL (STP) min−1 and temperatures < 260 °C. Thus, the kinetic measurements were not affected by the mass and heat transfer limitations.

3.2. Comparison of Models

Comparisons of the experimental and theoretical CO2 conversion, CH3OH, and CO formation were performed following the isothermal plug-flow reactor model and parameter fitting and adjustment. Each kinetic model was also fitted to the experimental data, and the results for CO2 conversion, CH3OH, and CO formation are plotted by means of parity plots. Table A1 (Appendix A) shows the experimental data points considered in the model fitting. Experiments 5 and 6 were performed under the same conditions in order to prove the replicability and reliability of the experimental data. Interestingly, the experimental results trend showed an increase in experimental CO2 conversion when CO was added to the feed. The trend is not expected if the assumption is that the adsorption of CO occurs on the same active site as CO2 (competitive adsorption), as it may inhibit the adsorption of CO2 and/or H2 on the active sites. Following this assumption, less H2 should be available for conversion of CO2 if CO hydrogenation occurs, as CO2 is more inert and difficult to convert. Thus, the fact that CO in the feed increases the conversion of CO2 can only be linked to the fact that CO will increase the reduction of active sites and, therefore, promote CO2 conversion. CO is the strongest reducing agent in the syngas feed [13,27,28,29,33,39]. On the other hand, the RWGS is less favorable in terms of thermodynamics in the presence of CO, thus resulting in less water formation, which further promotes the CO2 conversion. All of this is taken into account in the OR-SD and the MOD model introduced in this paper. This will thus be discussed further in Section 3.2.4 and Section 3.2.5. The original and fitted kinetic parameters for all the kinetic models considered in this study are found in the Supplementary Materials.

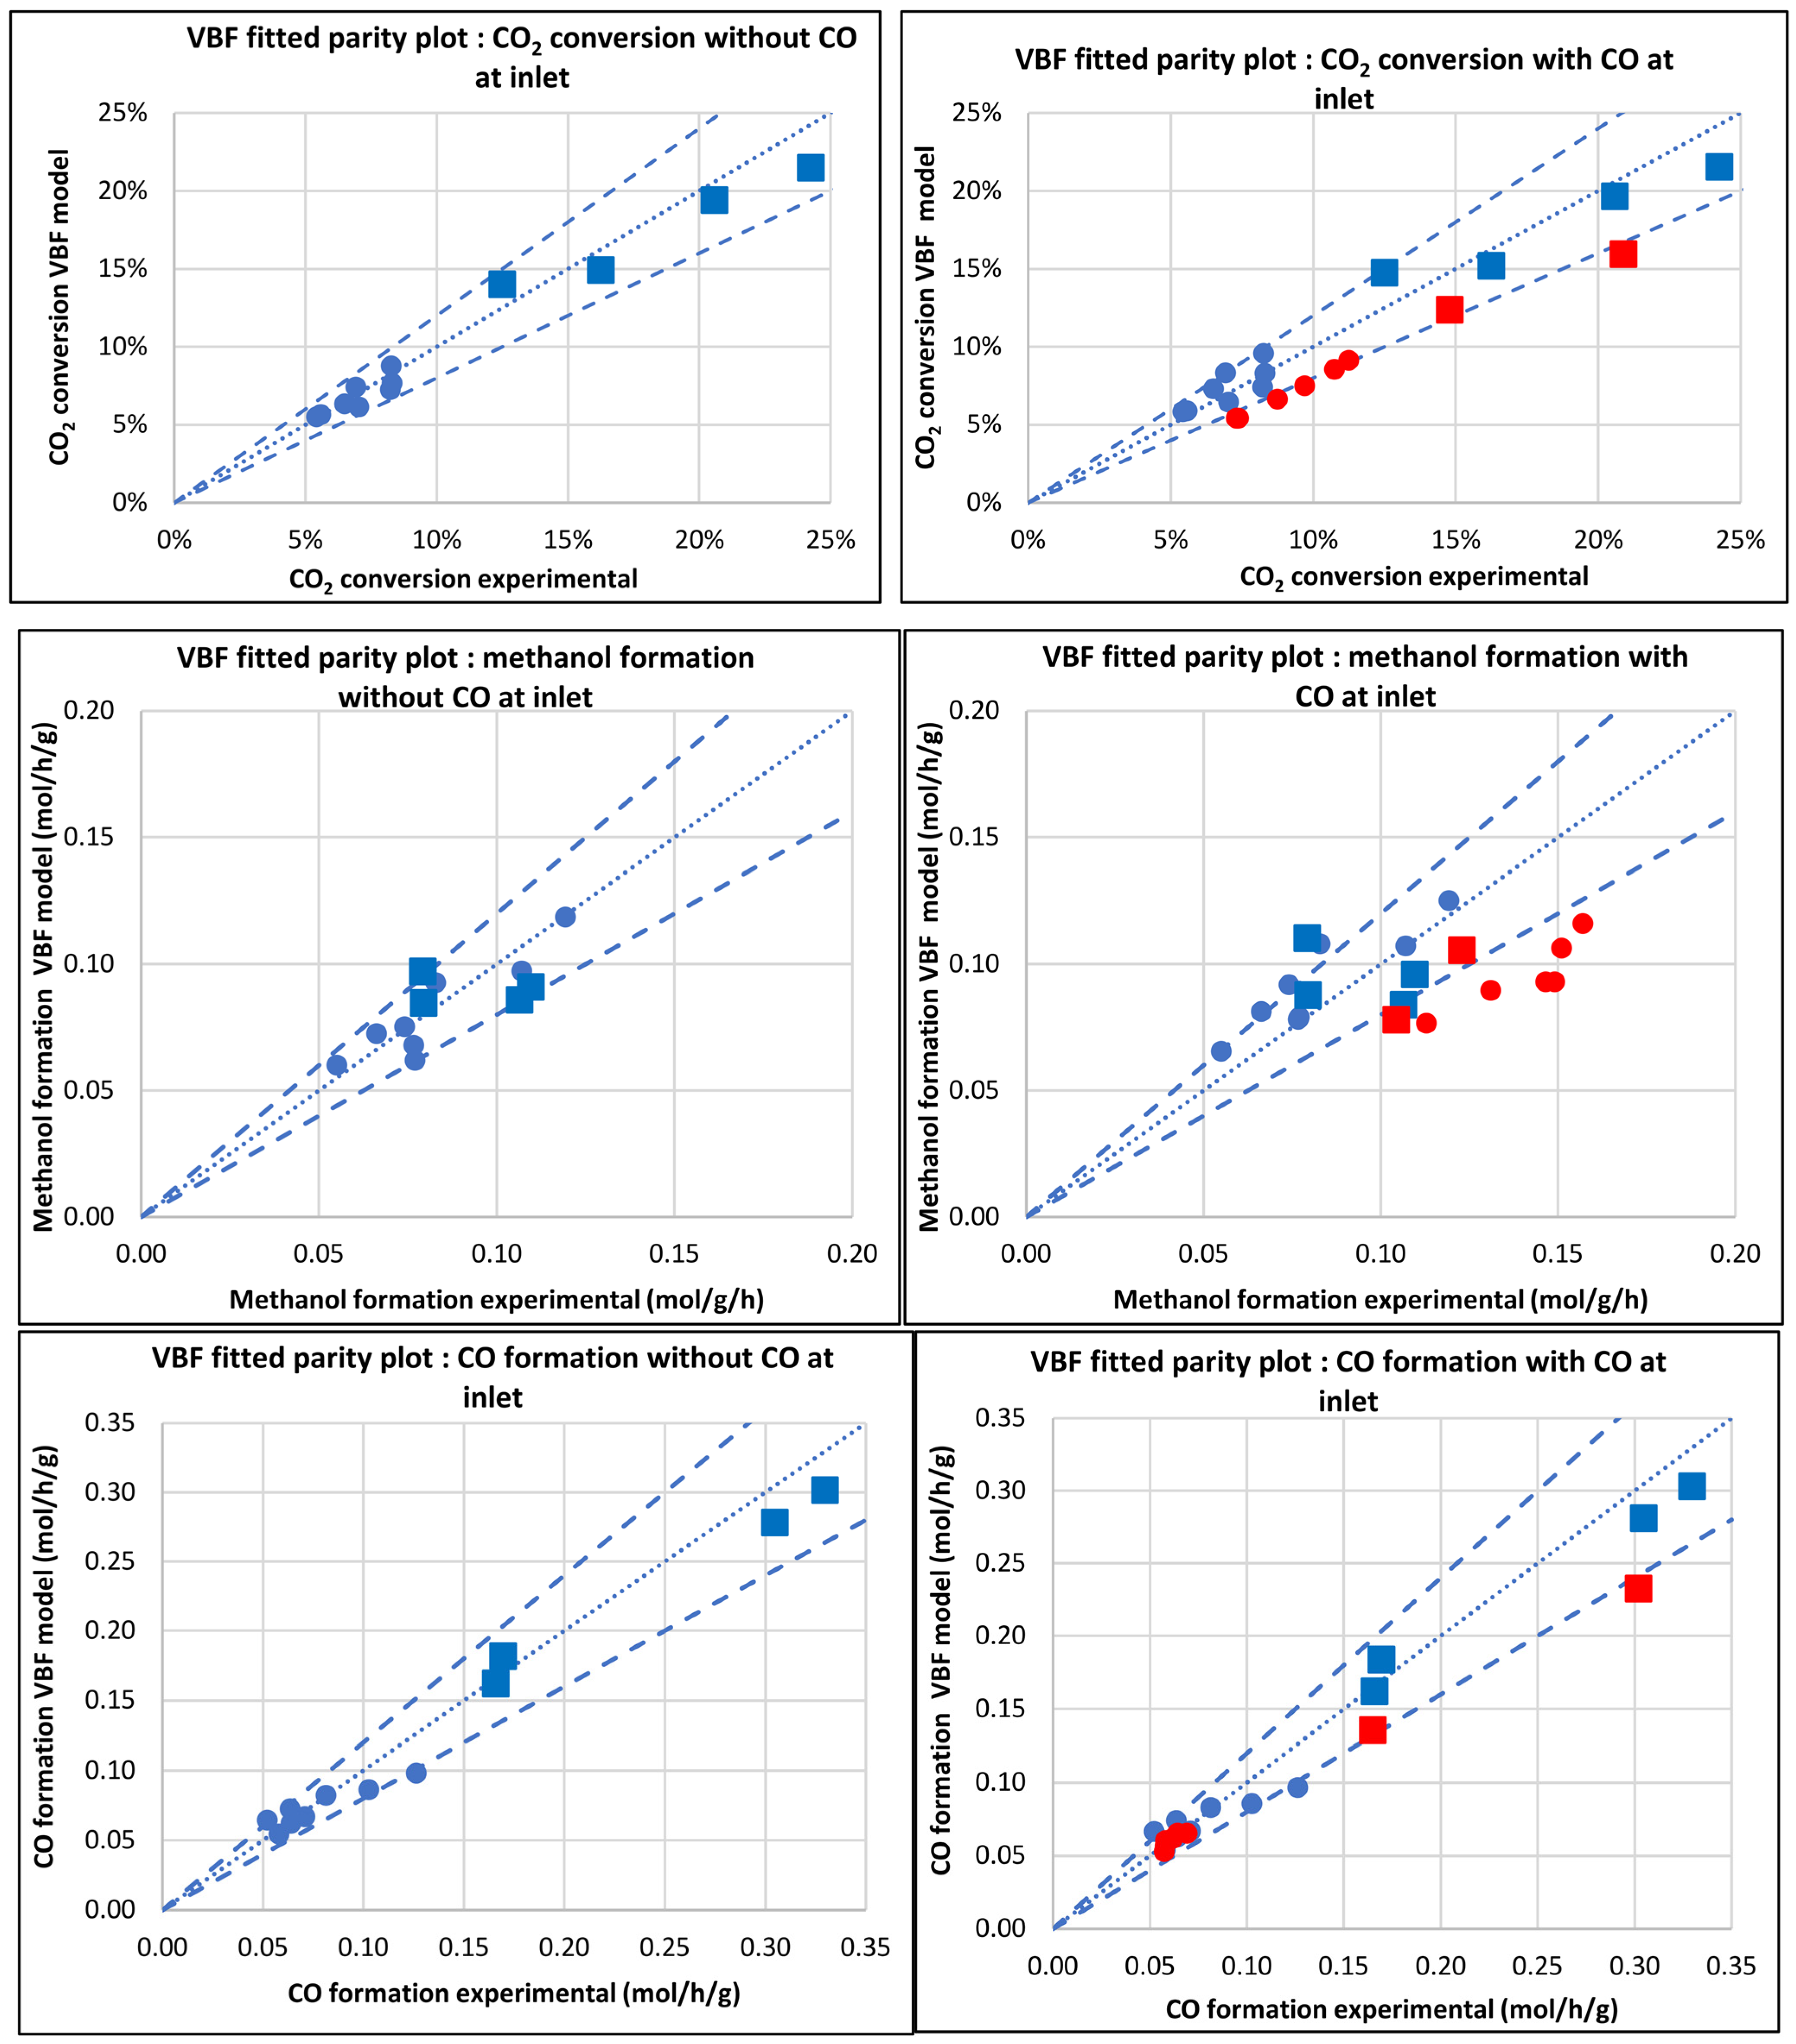
3.2.1. Model of van den Bussche and Froment (VBF)

The model architecture of the VBF model assumes one active site and neglects the CO hydrogenation reaction to methanol. The one active site is shared by CO2 hydrogenation and heterolytic decomposition of H2. The rate equations of the VBF model are given in Equations (5)–(7). Explanations of all the kinetic parameters for this and other models discussed in this paper are included in the nomenclature.
Figure 1 shows the parity plots, illustrating the ability of the VBF model to predict the experimental data generated in the experimental campaign considered herein. The VBF model is fitted to 20 experimental data sets generated from the experimental campaign described above. This model features six parameters at one temperature and ten parameters in total. The VBF model was fitted within a trust region line of 20%. The middle line in Figure 1 represents the 0% error line.
r C O 2 = k C O 2 p C O 2 p H 2 1 1 K P C O 2 ° T p H 2 O p C H 3 O H p H 2 3 p C O 2 Θ B F 3
r R W G S = k R W G S p C O 2 1 1 K R W G S ° T p H 2 O p C O p H 2 p C O 2 Θ B F
Θ B F = 1 + K H 2 O K H 2 K 8 K 9 p H 2 O p H 2 + K H 2 p H 2 0.5 + K H 2 O p H 2 O 1
The VBF model underestimates the experimental CO2 conversion for both scenarios, i.e., with and without considering CO in the feed. This finding is similar to that of Nestler et al. [9]. However, the VBF model predicts the experimental data with CO in the feed slightly more poorly than when CO is excluded in the feed. On the other hand, the VBF model fits both the methanol and CO experimental data poorly for both scenarios, but more especially when CO is taken into consideration. This could be explained by the insufficient mechanistic assumption on the VBF model, as previous authors have demonstrated that at least two active sites give a better fitting and mechanistically sound prediction of the methanol and RWGS (here represented by CO formation). On the other hand, the activation energy for the RWGS (reaction 2) and CO2-to-MeOH synthesis (reaction 1) decreases when experiments with CO are taken into consideration.
Thus, the reaction rate constant increases slightly when experiments with CO in the feed are taken into consideration, i.e., k C O 2 ¯ 1 , w C O > k C O 2 ¯ 1 , w / o C O and k R W G S ¯ 2 , w C O > k R W G S ¯ 2 , w / o C O ,   for reaction 1 and reaction 2, respectively (see Table 3). Here, the subscript w/o-CO refers to the case when only experiments without CO in the feed are considered, while w-CO refers to the scenario when all experiments, including those with CO in the feed, are taken into account. This could have an influence on thermodynamics since the addition of CO in the feed may also change the RWGS reaction [2]. This effect has also been reported by others [2,33,34,35,36,41,42,43,44].
The fit for CO formation using the VBF model is still relatively poor when CO is added to the feed. However, the model fit for CO formation is not too far off (still within the 20% interval) at low conversion with CO present in the feed. This can be attributed to the fact that this model was originally developed with data containing CO in the feed. In the absence of CO in the feed, the CO prediction is still within the 20% confidence interval. On the other hand, the model poorly predicts the methanol formation, more especially with CO in the feed. At SN < 2, the model poorly predicts the methanol formation, with notable deviations in CO2 conversion and CO formation for these points. Although the SN and COR validity range of the model has not been disclosed, it is possible that for the development of this model, the experiments with SN < 2 were not taken into consideration. As a result of poor prediction of the methanol formation, the percentage sum of the RSME is higher when considering experiments with CO at the inlet than when these are excluded for the VBF model, i.e., 7% and 3% for experimental data with and without CO at the inlet, respectively.

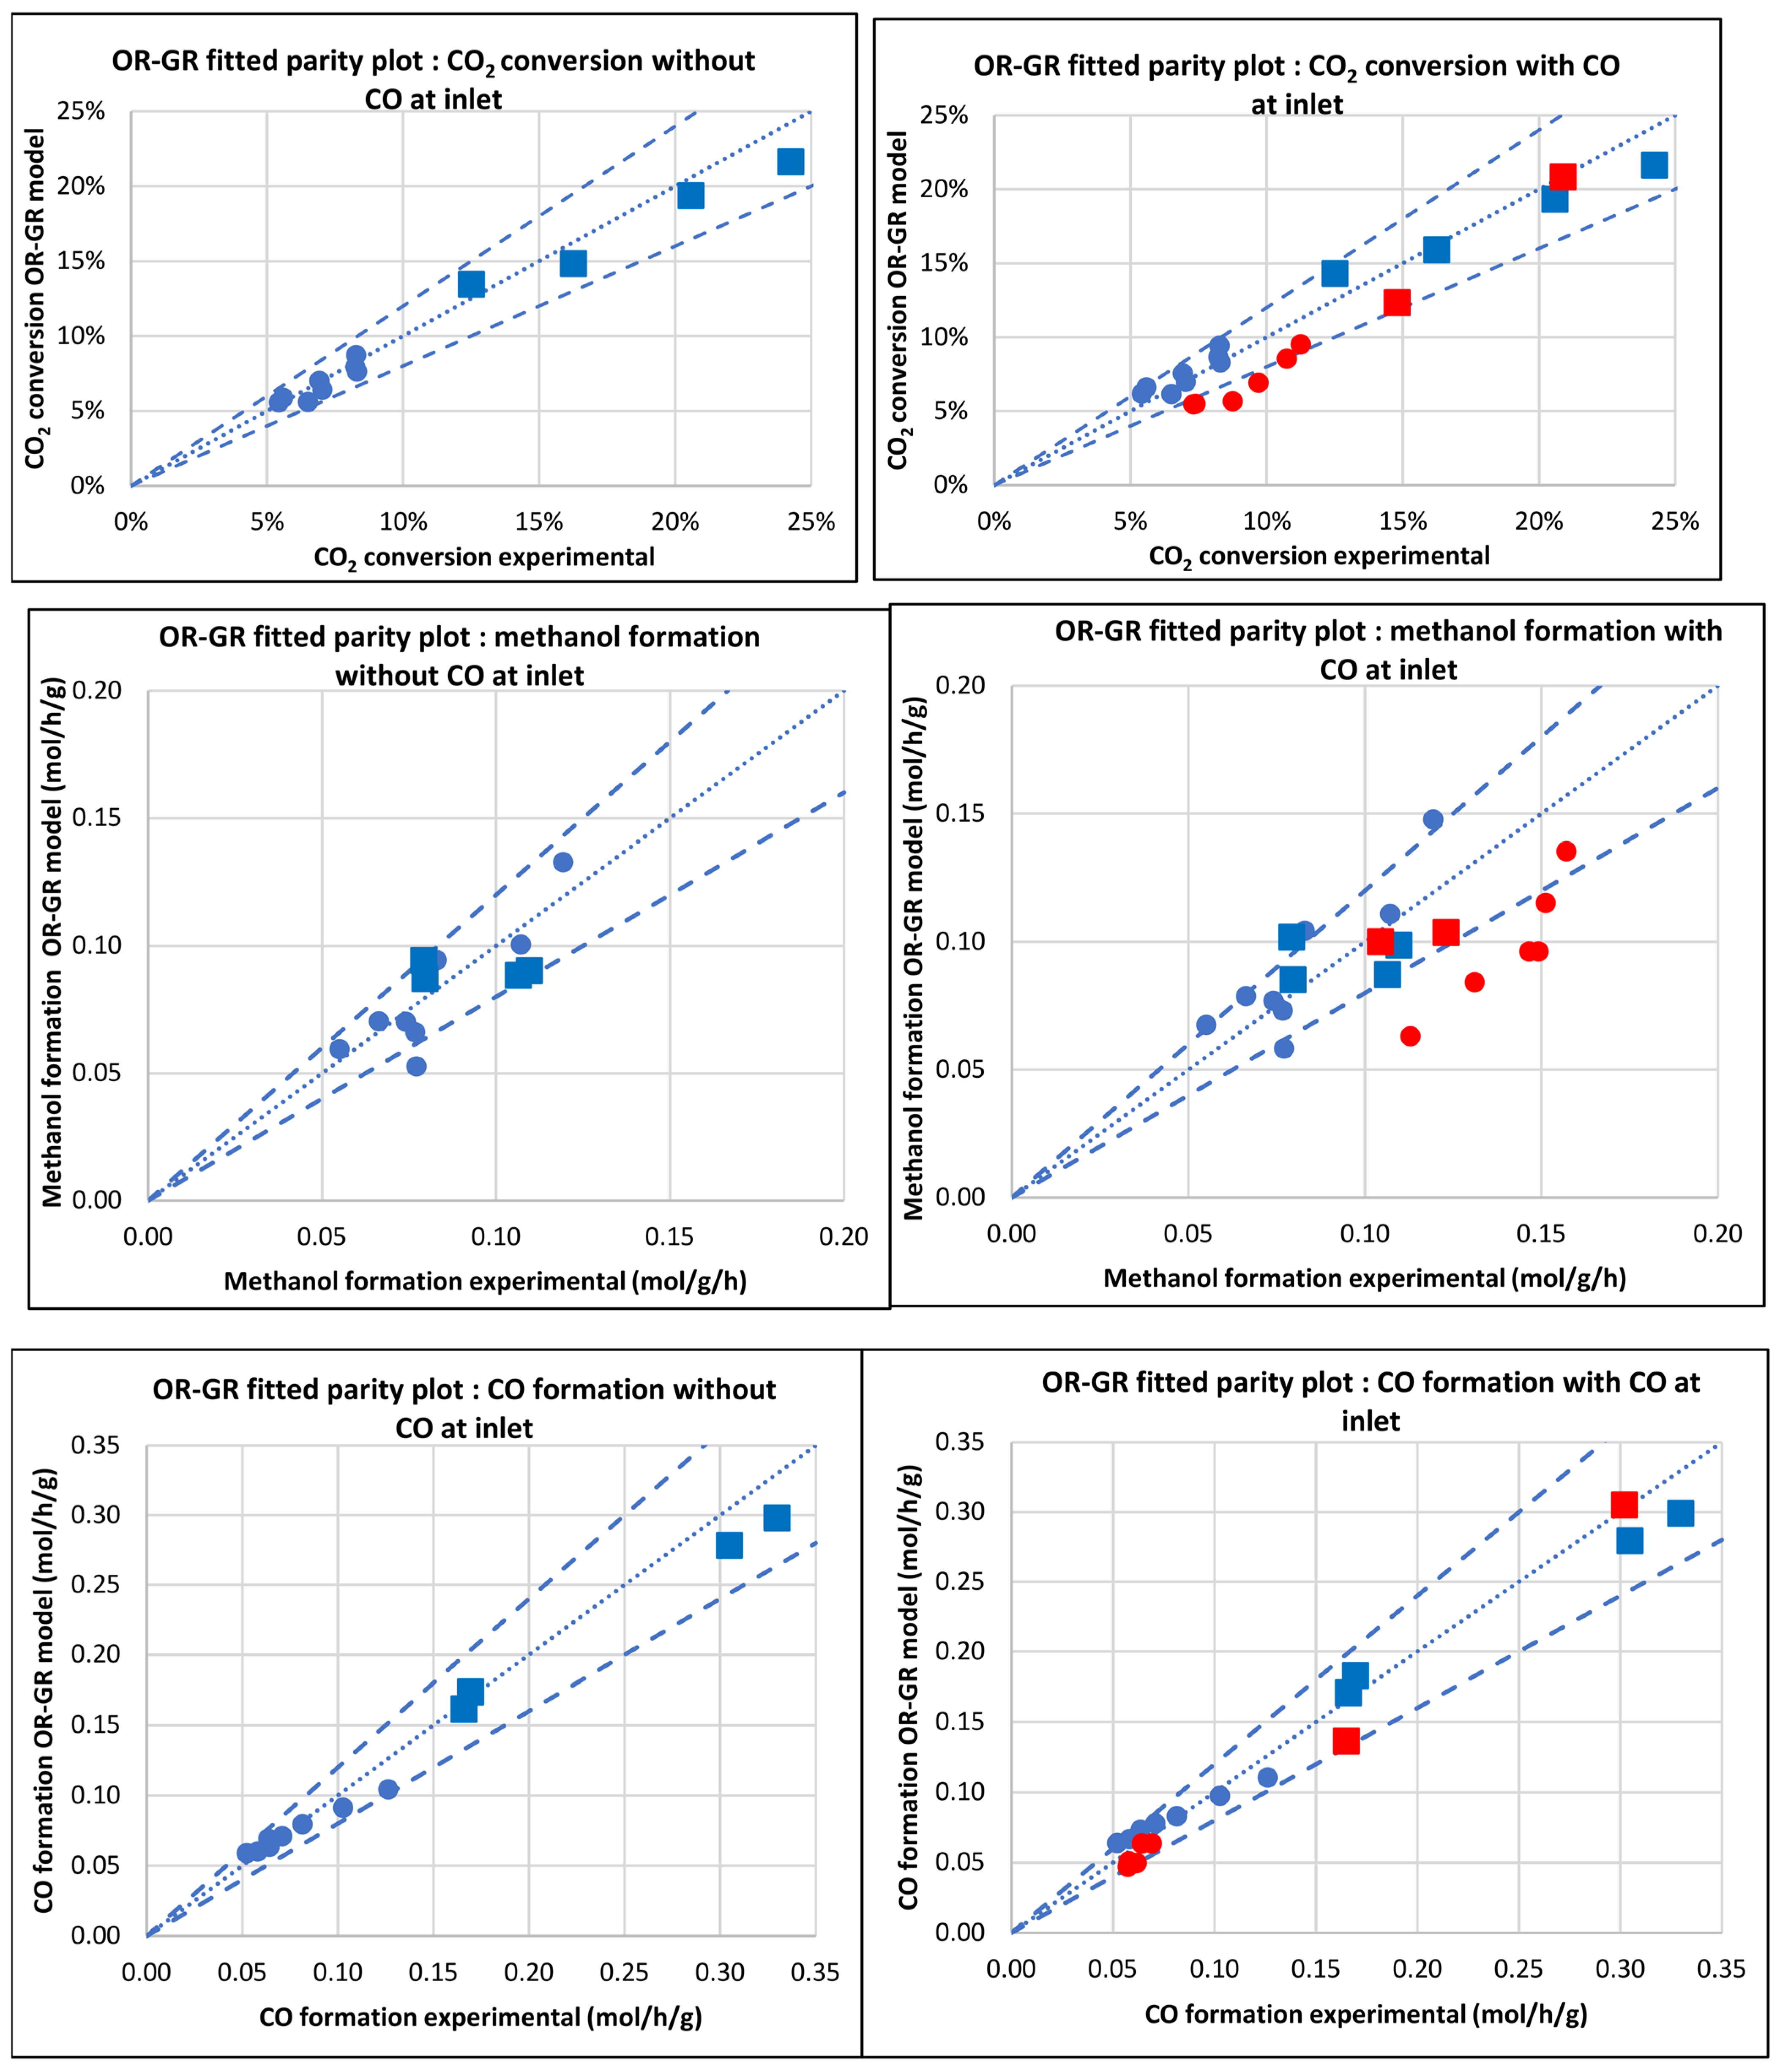
3.2.2. Model of Graaf et al. [12] (OR-GR)

The OR-GR model [12], fitted as shown in Figure 2, contains six parameters at one temperature and 12 parameters in total at all temperatures. The OR-GR model assumes CO hydrogenation as the major source of carbon for the methanol synthesis. The rate equations of the OR-GR model are given in Equations (8)–(12). The OR-GR model shows a poor fit for CO2 conversion for experiments with and without CO in the feed, more especially at low conversion.
r C O = k C O K C O   p C O p H 2 1.5 1 K P C O ° T p C H 3 O H p H 2 0.5 Θ G A θ G B
r C O 2 = k C O 2 K C O 2 p C O 2 p H 2 1.5 1 K P C O 2 ° T p H 2 O   p C H 3 O H p H 2 1.5 Θ G A θ G B
r R W G S = k R W G S k C O 2 p C O 2 p H 2 1 K P R W G S ° T p H 2 O p C O Θ G A θ G B
Θ G A = 1 + K C O p C O + K C O 2 p C O 2 1
θ G B = p H 2 0.5 + K H 2 O K H 2 0.5 p H 2 O 1
This could be associated with the assumption of one active site for both CO and CO2, resulting in a model where the presence of CO inhibits CO2 hydrogenation, especially when CO is present in the inlet. However, the prediction is not too far off. Furthermore, this model was regressed with an old commercial MK-101 catalyst (developed by Haldor Topsøe, Lyngby, Denmark) with potentially low activity; this has been demonstrated by various authors [6,7,8,9,10,23]. Nonetheless, the quality of fit for the CO2 conversion is almost similar to the VBF model, especially for experiments without CO in the feed. A similar effect was also observed by Nestler et al. [9,10]; they deduced that the carbon conversion at COR = 1.0 is almost similar for both the VBF and OR-GR models. However, at COR < 1.0, as represented by experiments with CO in the feed, the difference in the quality of the VBF and OR-GR models is clearly evident, with the OR-SR poorly fitting the CO2 conversion. The OR-GR model poorly fits the methanol formation data from the experiments for both scenarios, i.e., with and without CO in the feed compared to the VBF model. This could also be attributed to the insufficient mechanistic assumptions, in particular related to one active site for competitive adsorption of CO and CO2 hydrogenation, which is the feature of the OR-GR model architecture. The OR-GR model, as also illustrated by Bisotti et al. [7], might have been developed without filtering the outliers or gross errors, and it unsuitable for the prediction of methanol at low–medium pressure. The OR-GR model does not predict accurately at higher pressures (P > 50 bar). However, this model does show large deviations at the points of interest investigated in this study.
Furthermore, deviations are also seen for experimental points within the model applicability region, as also observed by Bisotti et al. [7]. This could also be attributed to the low activity of the MK-101 catalyst used to develop the model, as also observed by Nestler et al. [9,10]. The Section 3.2.4 Original Siedel et al. Model (OR-SD) presents a comparison of reaction rate constants corresponding to the OR-GR model. When considering all experiments, including those that have CO in the feed, the reaction rate constant for CO hydrogenation (reaction 3) gives a value of   k C O ¯ 3 > k C O 2 ¯ 1 (Table 4). Furthermore, from this model, the CO2 and CO hydrogenation steps seem to have the same order of magnitude of the reaction rate constants.
The percentage sum of the RSME for the CO and methanol formation is 8.21% when experiments with CO in the feed are taken into consideration. The fact that the CO hydrogenation is potentially a faster reaction for methanol synthesis in this model is in contradiction with other literature findings, in particular when considering the fact that the catalyst is mostly in a reduced state when the reaction commences [20,27,35]. A consequence of this observation is that the OR-GR model shows the lowest reaction constants for CO2 hydrogenation compared to all other models. This is so because, at high GHSV, the catalyst spends less time inside the reactor. Nonetheless, the addition of CO at a concentration <5 mol% seems to increase the CO2 conversion to methanol via a direct hydrogenation reaction. This was also observed in the data presented by Park et al. [23] and Kyrimis et al. [2]. However, Kyrimis et al., from their CFD modeling study, using the kinetic model of Park et al., highlighted the possibility of methanol decomposition to CO below the feed CO fraction of 2.5 mol%, contrary to other authors who have demonstrated that CO does not form from methanol decomposition [43,44].

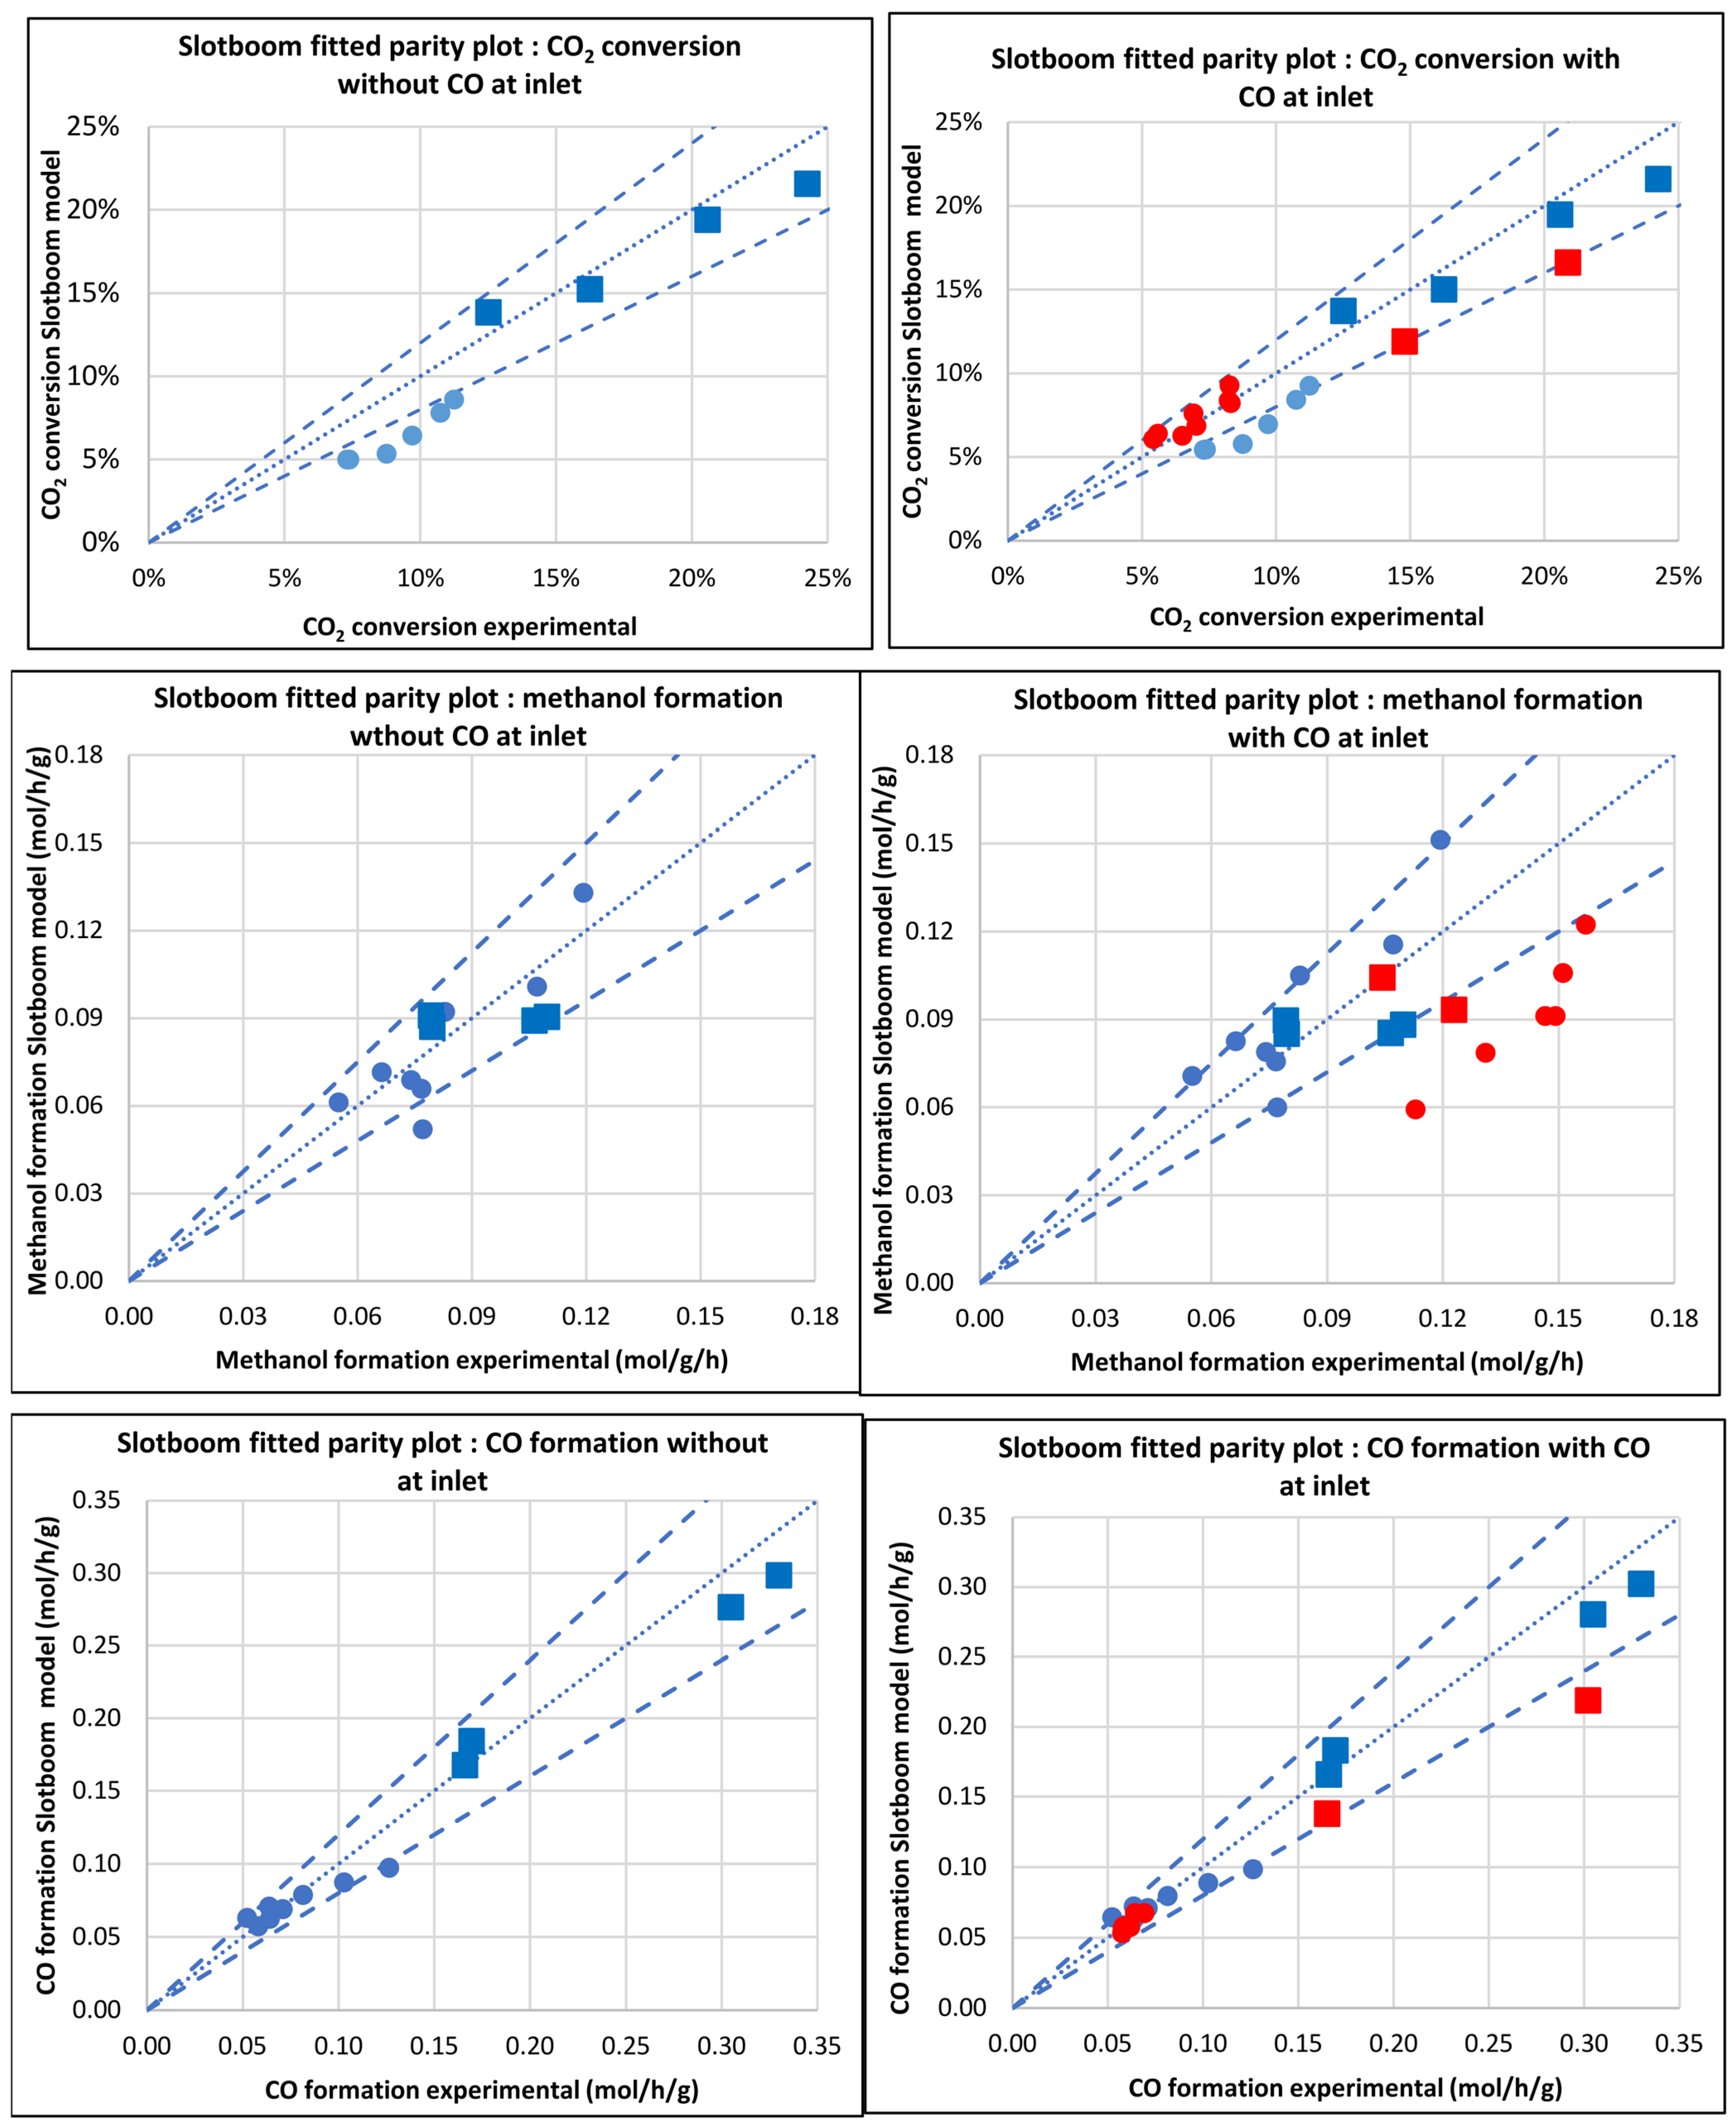
3.2.3. Model of Slotboom et al. [8] (Slotboom)

The Slotboom model features four parameters at a single temperature and a total of six parameters at all temperatures. Slotboom et al. [8] tried to reduce the number of parameters by lumping adsorption isotherms while retaining their statistical and physical meaningfulness. They neglected the structural changes in the active sites. They also reduced the number of parameters on the assumption that all hydrogen active sites are always occupied [8]. The rate equations of the Slotboom model are given in Equations (13)–(15):
r C O 2 = k C O 2 p C O 2 p H 2 2 1 1 K P C O 2 ° T p H 2 O p C H 3 O H p H 2 3 p C O 2 θ * 2
r R W G S = k R W G S p C O 2 p H 2 0.5 1 1 K R W G S ° T p H 2 O p C O p H 2 p C O 2 θ *
θ * = p H 2 0.5 k H 2 + p C H 3 O H + k H 2 O p H 2 O / 9 1
As previously discussed, this model follows the same mechanism as that of the VBF model but assumes the presence of three active sites instead of one active site (which is the basis for the VBF model). Setting the feed concentration of CO2/CH3OH/H2O to 50 ppm under pure CO/H2 feed experimental data points enabled the Slotboom model to successfully fit dry (CO/H2) feed results [8] even though the CO hydrogenation is neglected. This is in line with the early finding reported in the work of Skrzypek et al. [39], who stated that a trace amount of water initiates the methanol synthesis from the dry feed via first the water gas shift reaction and subsequently CO2 hydrogenation to methanol. Although a relatively good fit for CO2 conversion is predicted using this Slotboom model, the model seems to poorly fit the experimental methanol formation data.
Figure 3 shows the parity plots for CO2 conversion, methanol, and CO formation when fitting the Slotboom model to experiments with and without CO in the feed. The model fit for the methanol formation is poorer when experiments with CO are taken into consideration. However, it gives a relatively good fit for the CO formation for both cases, with and without CO in the feed. In their discussion, Slotboom et al. [8] did highlight the poor prediction of methanol formation using this model. This could be an underlying physical issue with the model as the authors did not test but assumed the physical validity of this six-parameter model based on their original ten-parameter model.
Alternatively, it could suggest that the experiments used to refine this model were probably not sufficiently discriminating. The good fit of CO2 conversion can either be attributed to the consideration of two different sites for CO and CO2 in the formulation of this model or to the fact that the model was regressed with more recent experimental data generated from catalysts with improved activity.
The percentage sum of the RSME for the CO and methanol formation is 9% when experiments with CO in the feed are taken into consideration, whereas when only experiments without CO in the feed are considered, the RSME is 5%. Table 5 shows a comparison of reaction rate constants corresponding to the Slotboom model.
For this model, similar to the VBF model, a slight increase in the reaction rate constants with the introduction of CO in the feed is observed, i.e., k C O 2 ¯ 1 , w C O > k C O 2 ¯ 1 , w / o C O and k R W G S ¯ 2 , w C O > k R W G S ¯ 2 , w / o C O for the reaction 1 and reaction 2, respectively.

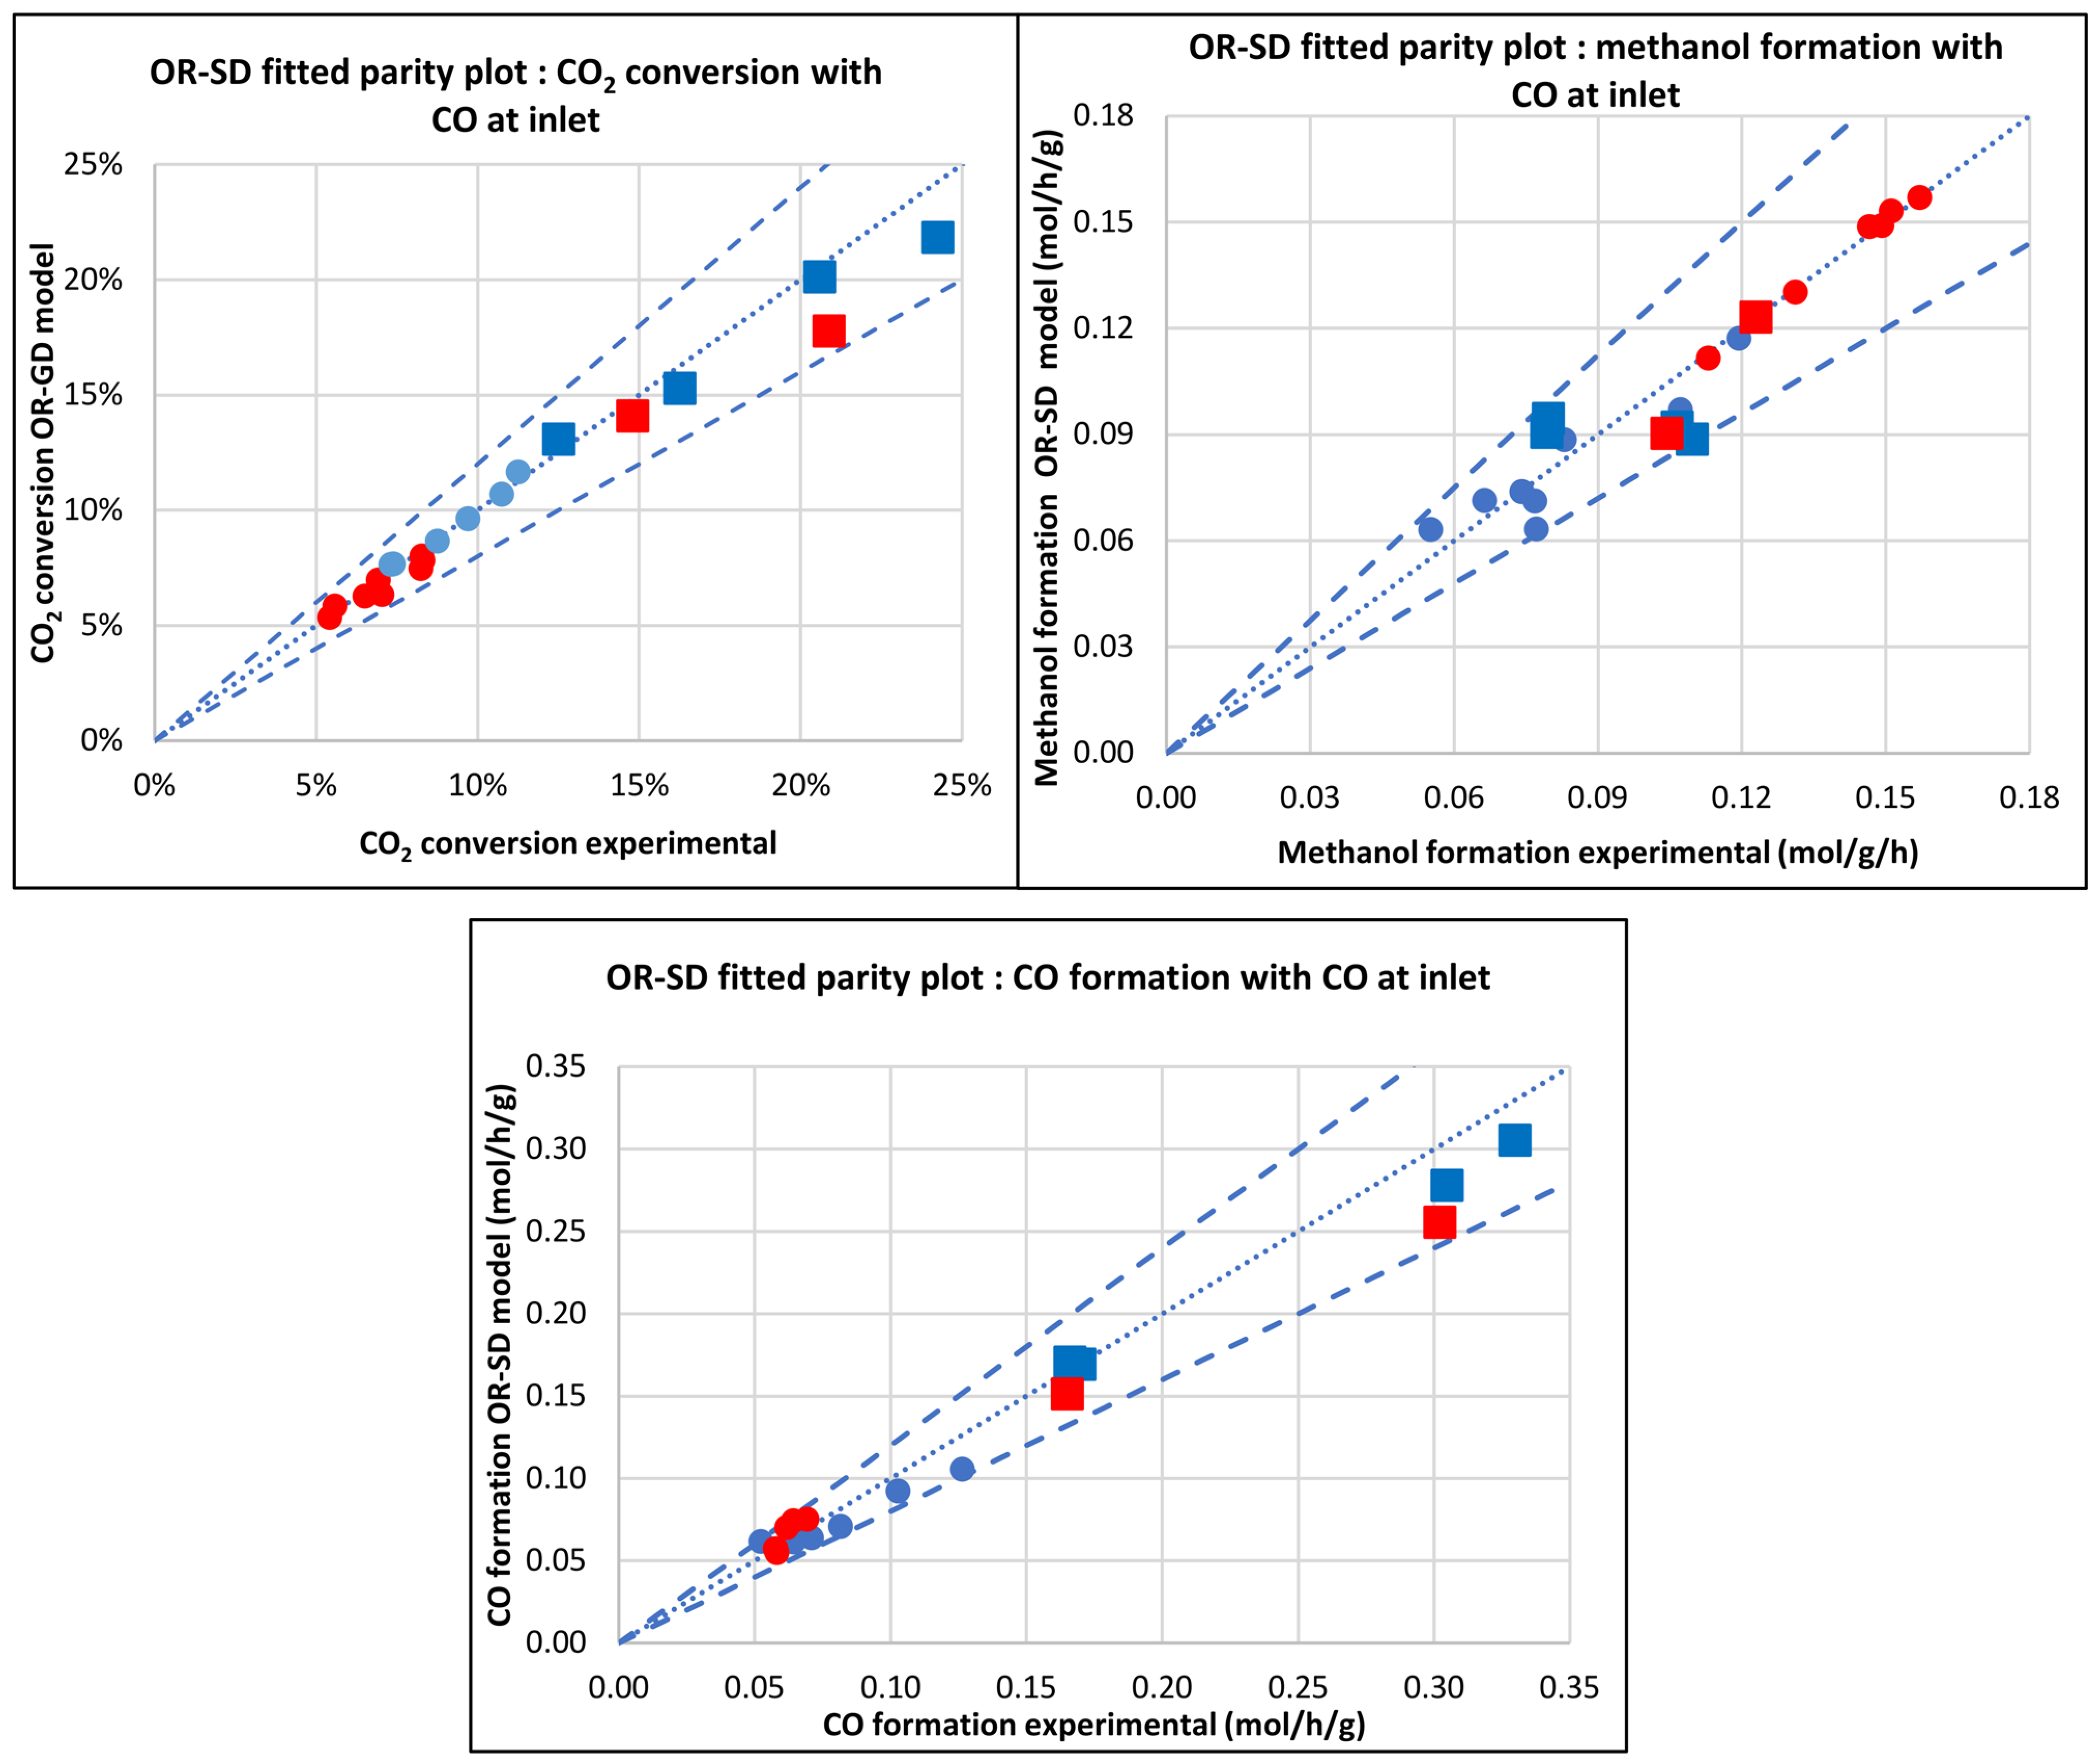
3.2.4. Original Siedel et al. [43] Model (OR-SD)

This model was built considering the mechanism and validation using 140 experimental data points generated under steady state and dynamic conditions by Vollbrecht [43]. Seventy experimental data points contained only pure CO feed; 46 experiments were based on mixed CO/CO2 feed, while the other 32 experimental data points were based on pure CO2 feed. Thus, this model covers a wide range of feed compositions, from pure CO to pure CO2. The OR-SD model takes three active centers into account: (i) oxidized surfaces assumed to be the active sites for CO hydrogenation, (ii) reduced surface sites assumed to be the active sites for CO2 hydrogenation, and (iii) additional active sites for heterolytic decomposition of hydrogen [27,28]. The rate equations of the OR-SD model are given in Equations (16)–(18). The kinetic rate constants were calculated according to Equation (23).
r C O = ( 1 ϕ ) k C O p C O p H 2 2 1 1 K p C O ° ( T ) p C H 3 O H p C O p H 2 2 Θ Θ 4
r C O 2 = ϕ 2 k C O 2 p C O 2 p H 2 2 1 1 K p C O 2 ° ( T ) p C H 3 O H p H 2 O p C O 2 p H 2 3 Θ * 2 Θ 4
r R W G S = ϕ 1 ϕ k R W G S p C O 2 1 1 K p R W G S ° ( T ) p C O p H 2 O p C O 2 p H 2 Θ * Θ
The surface coverages are given by Equations (19)–(22).
Θ = 1 + K C O p C O 1
Θ * = 1 + K H 2 O K O p H 2 O K H 2 p H 2 + K C O 2 p C O 2 + K H 2 O p H 2 O 1
Θ = 1 + K H 2 P H 2 1
ϕ W = 1 2 1 γ * γ 0
γ * γ 0 = 1 K 1 K 2 p H 2 p C O p H 2 O p C O 2 1 + K 1 K 2 p H 2 p C O p H 2 O p C O 2
where   γ * γ 0 is the relative surface contact free energy of Cu and Zn, ϕ W is the fraction of reduced surface centers and 1 ϕ W is thus the fraction of oxidized surface centers. A maximum coverage of 90% reduced centers, as also in the OR-SD model [13,14], was assumed and used for the inlet conditions where no water is present and CO2 is high at the inlet, as deduced by de Oliveira Campos et al. [19]. Following the OR-SD model, the K1 and K2 were calculated using Equations (24) and (25).
K 1 = e x p Δ G 1 R T
K 2 = e x p Δ G 2 R T
ϕ = ϕ W 0.1
Θ represents the oxidized sites, taken as active centers for CO hydrogenation,   Θ * represents the reduced sites, taken as active centers for CO2 hydrogenation, Θ represents the active sites, taken as active centers for heterolytic decomposition of hydrogen, and ϕ refers to the total amount of relative reduced surface centers. These symbols represent the different active sites. The simplified OR-SD model features eight parameters at a single temperature and a total of 12 parameters at all temperatures [13,14]. This simplified and steady-state version of the OR-SD model was fitted to both steady-state and dynamic experiment data with varying feed ratios. Figure 4 shows the parity plots when the OR-SD model was considered for the data generated from the experimental campaign in this study. The model fits all the data points very well in the presence and absence of CO at the inlet. A very good fit is shown for the CO2 conversion. A good fit is also observed for methanol formation with CO at the inlet. This may be attributed to good physical assumptions that are the foundations of these models. Several authors have observed that methanol synthesis from CO2 is a structure-sensitive reaction, and thus, changes in the number of oxygen vacancies between the Zn-[]-Cu have been shown to influence the catalyst morphology [43]. This aspect is accounted for in the OR-SD model [13,14]. In addition, this model fits the CO data better than other models. However, although the OR-SD model fits the experimental data well, it remains very complex, with highly correlated parameters and a total of 12 parameters.
In considering the CO hydrogenation, the optimization led to an insignificant value for the reaction rate constant of CO ( k C O ¯ 3 ) hydrogenation reaction compared to the CO2 hydrogenation reaction. In addition, the sensitivity of kCO was very low, indicating that the CO hydrogenation should not be considered for this model, at least at higher CO2/CO feed, as also deduced by de Oliveira Campos et al. [19]. Table 6 shows a comparison of reaction rate constants corresponding to the OR-SD model. The percentage sum of the RSME for the CO and methanol formation is 1.66% when experiments with CO in the feed are taken into consideration. For this model, the higher reaction rate constant of CO2 hydrogenation reaction with the introduction of CO in the feed is observed, i.e., k C O 2 ¯ 1 , w C O > k C O ¯ 3 ,   w C O and k R W G S ¯ 2 ,   w C O compared to the reactions 3 and 2, respectively. The trend points to the fact that CO2 hydrogenation is the dominant reaction for methanol synthesis, and it is faster than the reverse gas shift reaction.

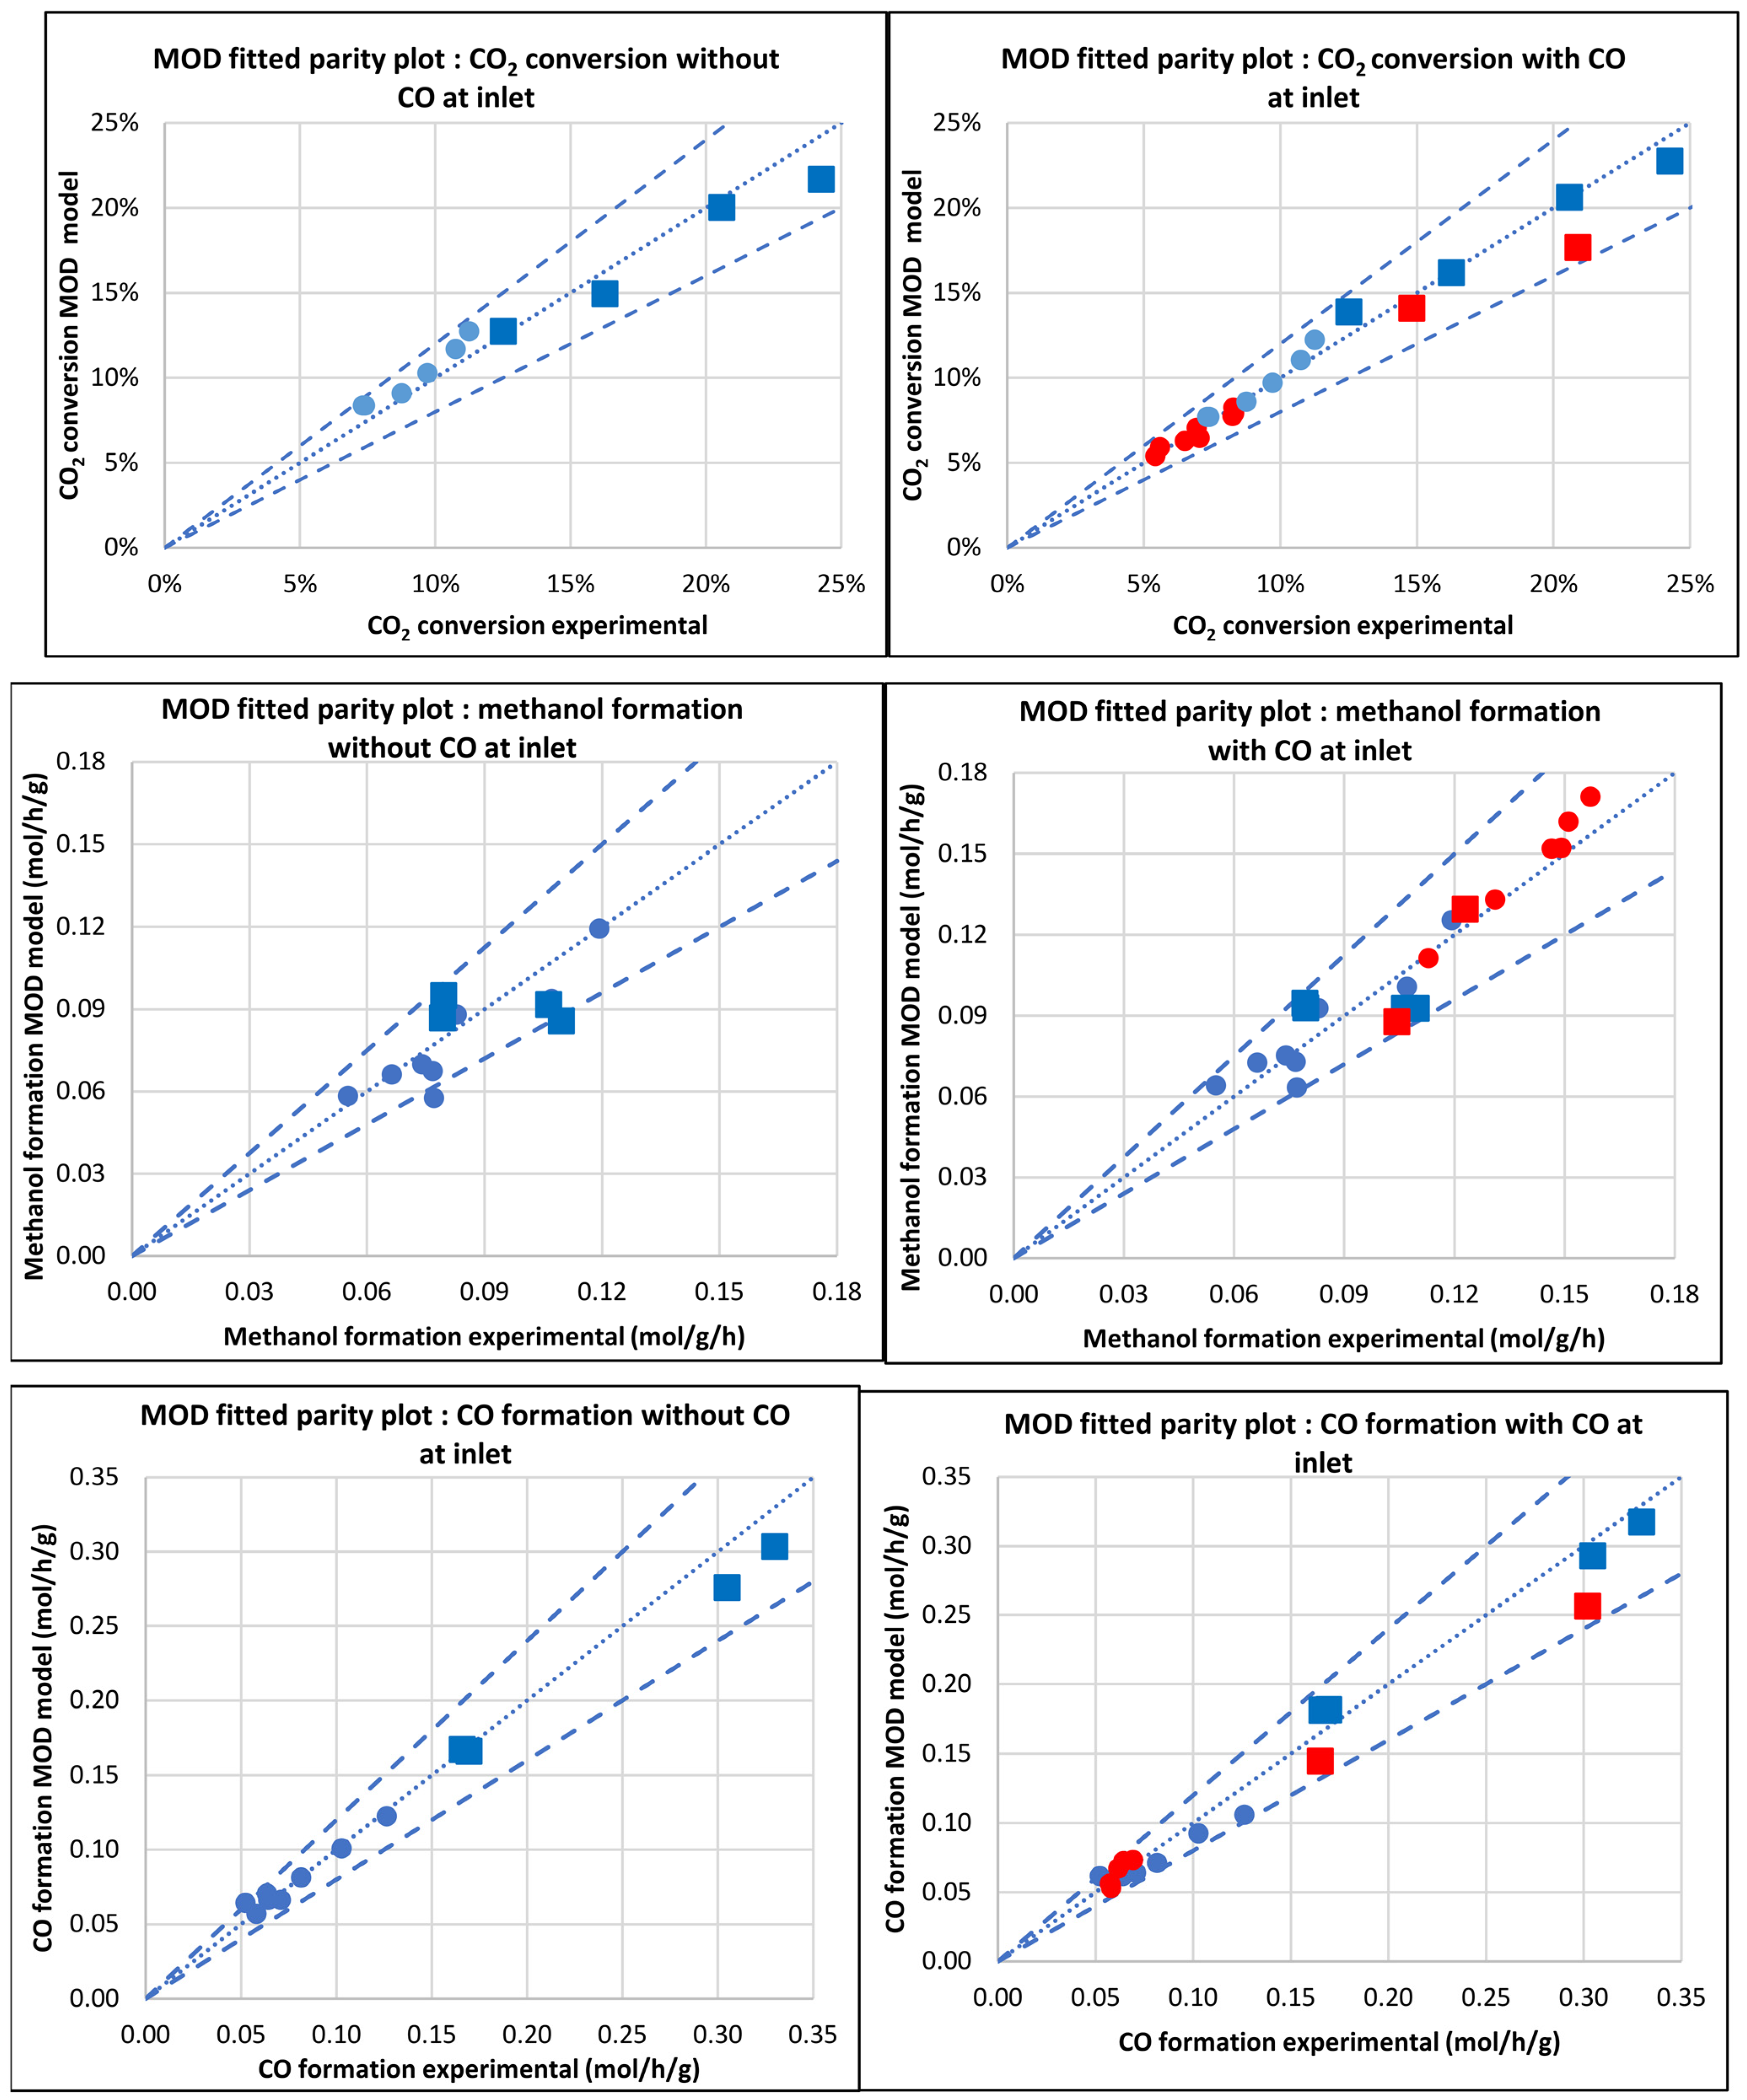
3.2.5. Modified Model (MOD)

This adapted model, the MOD model, follows the same architecture as the OR-SD model. The main difference is that here, the CO hydrogenation is now neglected, thus resulting in a model with a reduced number of parameters: six parameters at a single temperature and nine parameters at all temperatures.
This follows the recent microkinetic simulation of de Oliveira Campos et al. [18,19], in which it was deduced that the contribution of direct CO hydrogenation to the methanol synthesis is only significant at low CO2 content in the feed because formate (a common intermediate for CO2 to methanol) binds strongly on the copper surface, almost completely inhibiting the CO hydrogenation. To further understand the rationality of the MOD model, Figure 5 shows the parity plots for CO2 conversion, methanol, and CO formation considering the MOD model with and without CO in the feed. The MOD model has the same mechanism as that of the OR-SD, but the CO hydrogenation is neglected. The rate equations of the MOD model are given as Equations (27) and (28). The kinetic rate constants were calculated according to Equation (39), while only Equations (36)–(38) were used for thermodynamic constants calculation. The surface coverages are given using Equations (19)–(22). The MOD model gives a good fit for experiments both with and without the CO at the inlet. Thus, the MOD can predict the CO2 conversion with an improved degree of accuracy. This is the only model that explains the higher CO2 conversion with CO at the inlet, even though CO2 hydrogenation is less thermodynamically favored and results in low site coverage. The optimum carbon conversion for a given CO/CO2 ratio can be explained using an optimal mix of oxidized and reduced active sites. For this model, a maximum coverage of 90% for the reduced centers was assumed, as in the OR-SD model. The lower conversions at lower CO2 concentrations are due to over-reduction of the surface, while at higher CO2 levels, this species strongly covers the active sites, thus decreasing catalyst activity. Furthermore, the conversion is also strongly influenced by the ratio of CO/H2, as also observed by Park et al. [23]. In recent work by Wang and Zhang [42], it was also shown that H2 variation has an influence on morphological changes of active sites as well as on the rate-determining steps. This change in RDS is supported by changes in apparent activation energies at different hydrogen pressures [42]. Wang and Zhang [42] deduced that at hydrogen pressure > 0.7 MPa, the reaction follows the Langmuir–Hinshelwood model with HCOO* hydrogenation as the RDS, whereas at hydrogen partial pressure < 0.7 MPa (0.15 MPa–0.7 MPa H2), CO2 adsorbed on the unoccupied sites (*) as the elementary step was determined to be kinetically relevant [42].
r C O 2 = ϕ 2 k C O 2 p C O 2 p H 2 2 1 1 K p C O 2 ° ( T ) p C H 3 O H p H 2 O p C O 2 p H 2 3 Θ * 2 Θ 4
r R W G S = ϕ 1 ϕ k R W G S p C O 2 1 1 K p R W G S ° ( T ) p C O p H 2 O p C O 2 p H 2 Θ * Θ
In this study, the hydrogen partial pressure was >0.7 MPa for all experiments. This is also a typical case in industrial methanol synthesis practice. However, the optimum ratio of CO/H2 still requires further investigation (these are both reducing agents), as does further discrimination of their influence on the morphological changes with variation in their ratio. Of note here is that as CO2 and H2O increase, the fraction of the reduced centers decreases. On the other hand, the model fit, with almost equivalent quality, the methanol and CO formation as the OR-SD model for all experiments with and without CO in the feed. The MOD model fits all methanol and CO data within a trust region line of 20% and is very close to the zero lines. The difference in the percentage sum of RMSE between the OR-SD and MOD models is very small (±0.06) and considered negligible. When experiments with CO in the feed are taken into consideration, the percentage sum of the RSME for the CO and methanol formation is 1.72%. On the other hand, when taking into consideration only the experiments without CO in the feed, the percentage sum of the RSME is 2.21%.
Table 7 shows a comparison of the reaction rate constants corresponding to the MOD model. For this model, the higher reaction rate constants with the introduction of CO in the feed are observed, i.e., k C O 2 ¯ 1 ,   w C O > k C O 2 ¯ 1 ,   w / o C O   and   k R W G S ¯ 2 , w C O > k R W G S ¯ 2 , w / o C O for the reaction 1 and reaction 2, respectively. The difference in the percentage sum of the RMSE is also perhaps due to a reduction in the number of experimental points, as more (in fact all) the experimental points are considered for the scenario with CO in the feed rather than in the case when CO is excluded.

3.3. Kinetic and Statistical Parameters

All kinetic parameters, as shown in Table 8, are of the same order of magnitude as those reported in the literature (based on kinetic studies using the same catalyst) [25]. The values of the activation energies given in Table 8 are in the same range as values published in literature: 25–70 kJ/mol for methanol synthesis from CO2 hydrogenation and 95–155 kJ/mol for the RWGS reaction over Cu/ZnO/Al2O3-based catalysts [15,23,24,25,40]. The accuracy of parameter estimation is represented by the parity plots, as discussed in the previous Section 3.2.4 and Section 3.2.5. The values of the adsorption constant we found for CO and CO2 adsorption are in a similar order to the ones found by Henkel [41].
Table 8 shows that the order of magnitude for each kinetic parameter is retained for both OR-SD and MOD models. The procedure of fitting experiments derived from the experimental campaign in this study and considering CO at the inlet has significantly changed the adsorption and reaction constants and reduced the activation energy for the methanol synthesis from CO2 hydrogenation. This yields a model that better predicts methanol formation, CO formation, and CO2 conversion, both in the presence and absence of the CO at the inlet. Furthermore, a notable reduction in model inaccuracies is observed. On the other hand, the methanol adsorption constant was found to be equal to zero for this model, which corresponds to a negligible CO adsorption, thus confirming the fact that methanol is not a source of CO formation, as was highlighted in the model of Park et al. [23]. Similar to the findings of Siedel et al. [13,14], the adsorption constant of CO2 here can be considered null.
Where ER1 is the activation energy of reaction 1, ER2 is the activation energy of reaction 2, ER3 is the activation energy of reaction 3, k1 is the kinetic constant for reaction 1, k2 is the kinetic constant for reaction 2, and k3 is the kinetic constant for reaction 3 from the fitting performed in this study. b-i is the adsorption constant of component i.
Standard residual errors for both methanol and CO formation were calculated; results show reduced errors for the MOD model for the methanol formation, CO formation, and CO2 conversion. Table 9 presents the Sumres for all the models considered. In statistics, there is a simple rule that can be used to select the best model. According to this rule, the model with the least number of parameters and which is still able to predict the experimental data with one standard deviation must be chosen [8].
In all cases, the errors for all models are still <10%. The residual errors were reduced by 75%, 79%, and 81% for the residual sum when comparing the MOD model to the VBF, OR-GR, and Slotboom models, respectively. The VBF, OR-GR, and Slotboom models showed poorer fitting and, hence, high residuals in the order of increasing residual errors. Thus, the now proposed MOD model shows lower residual errors with respect to all other models considered and similar performance to the OR-SD model but with fewer parameters.

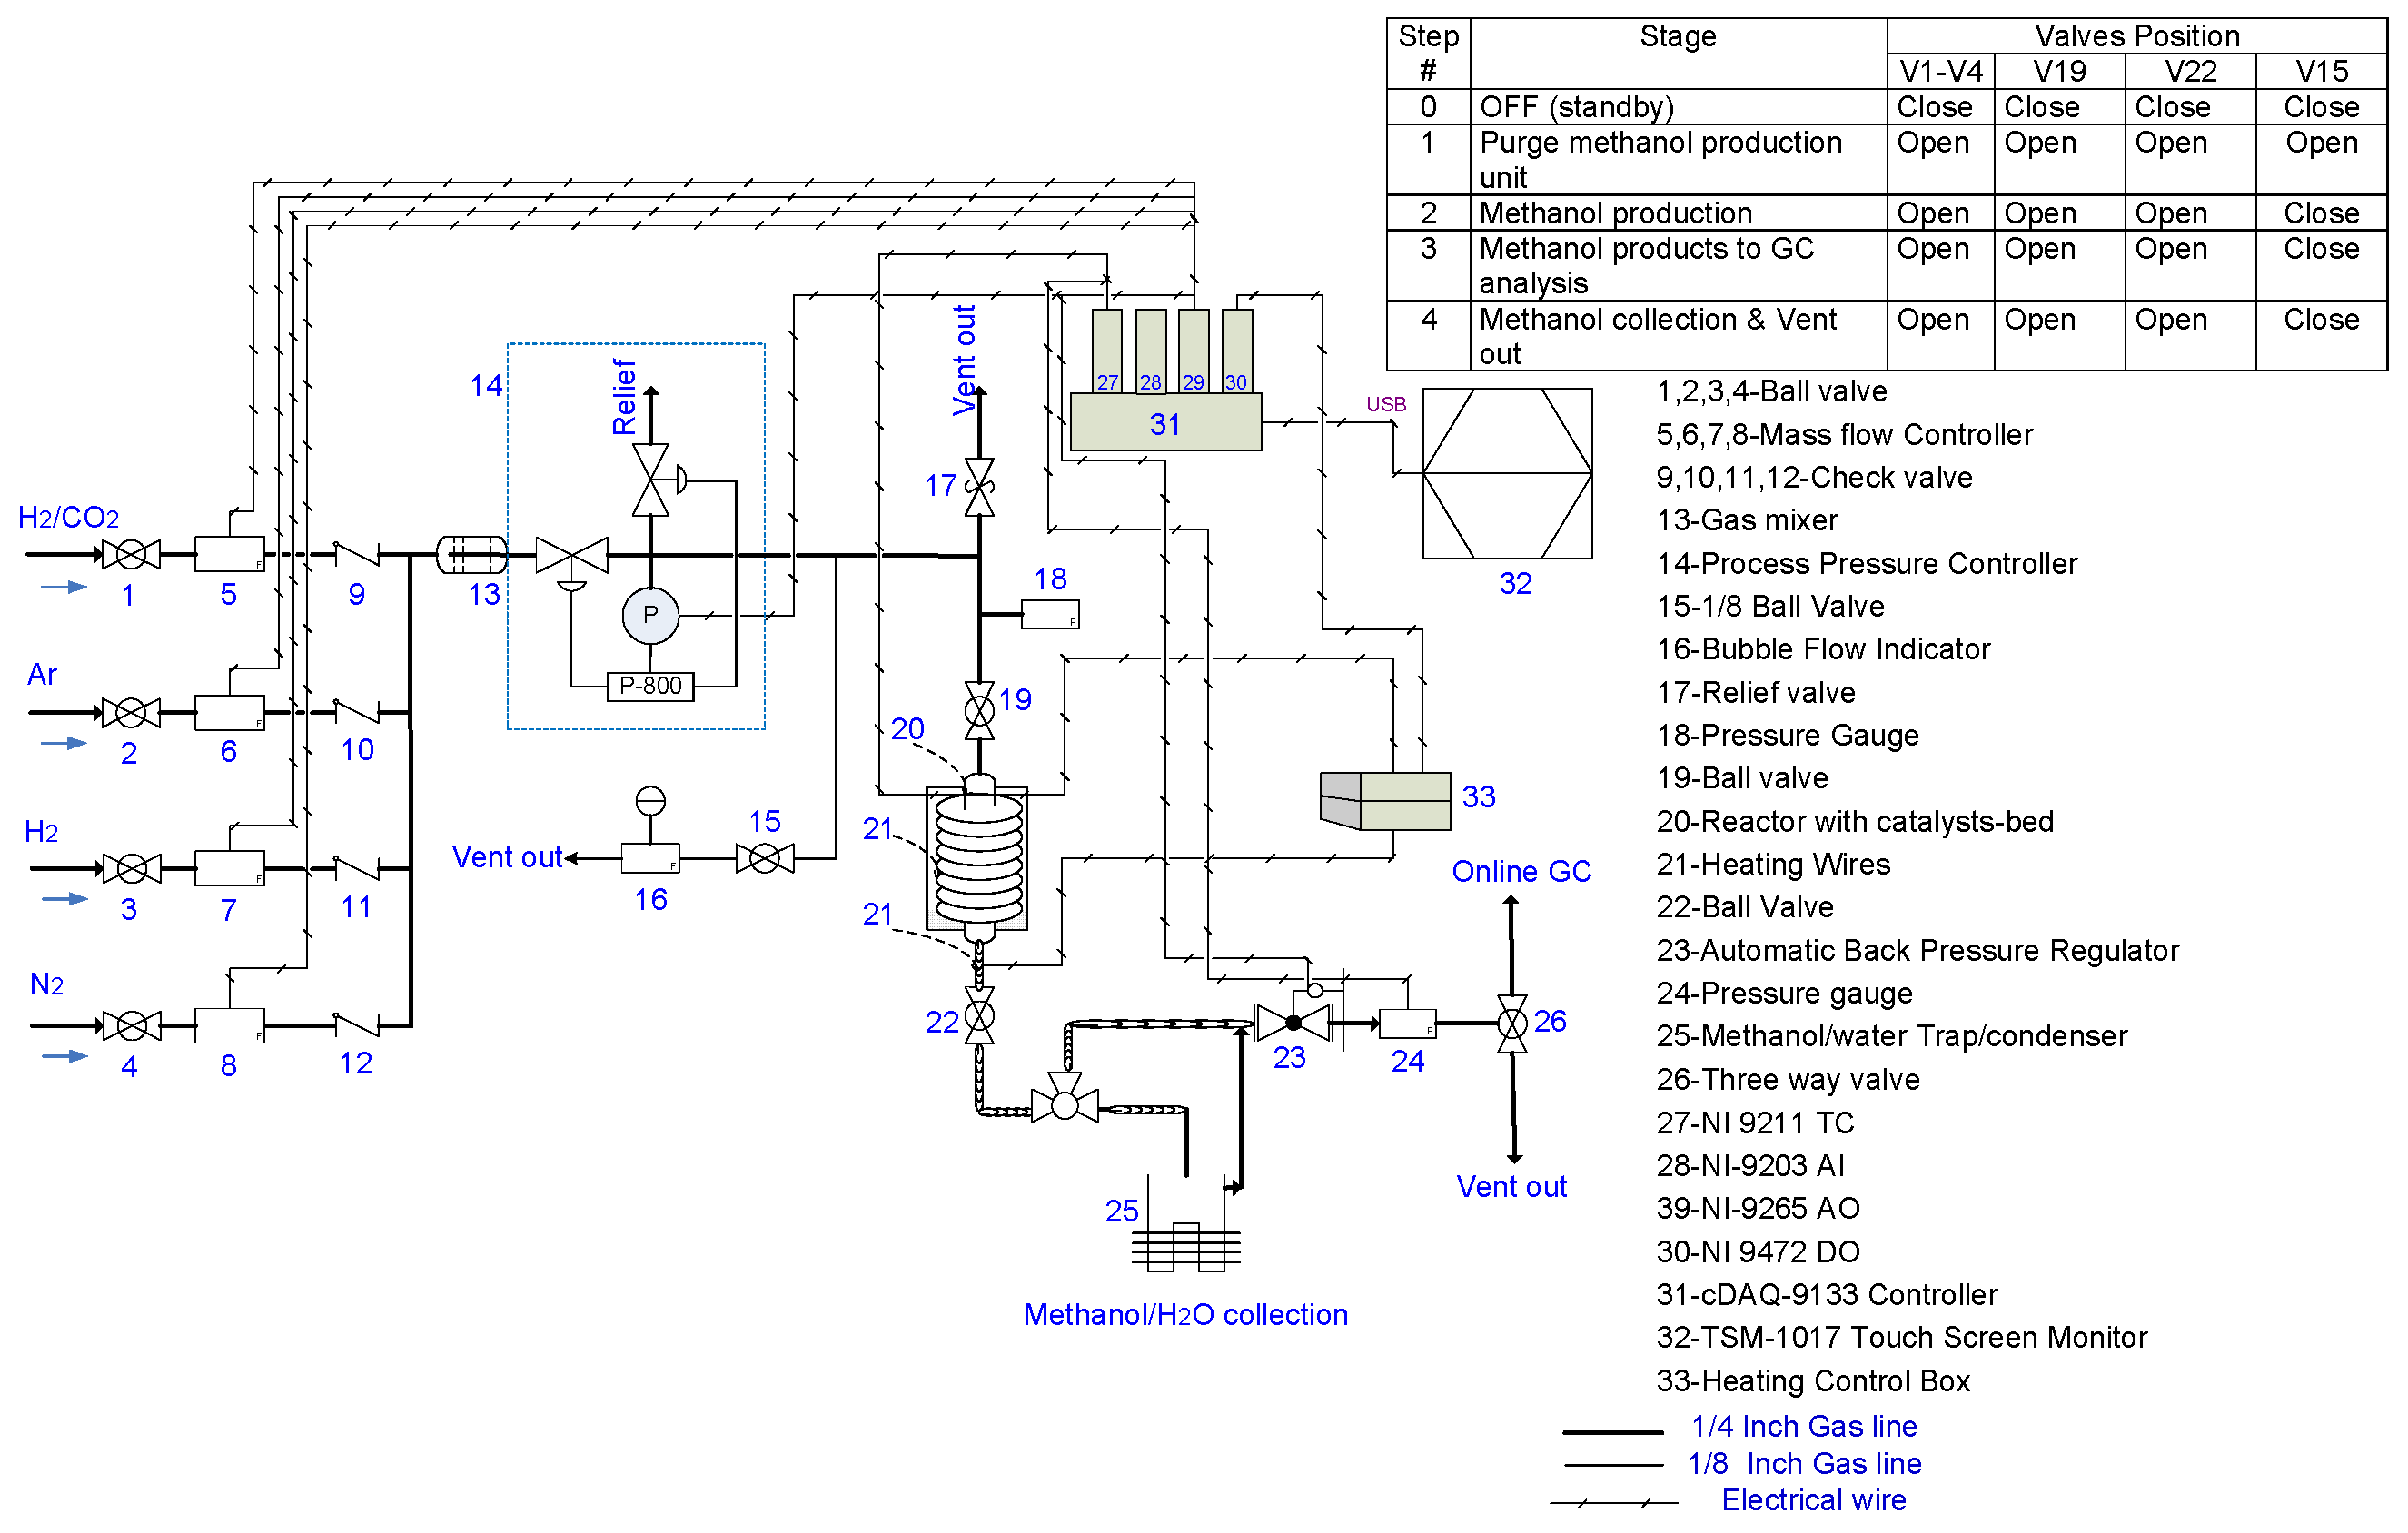
4. Experimental Procedure and Apparatus

The commercial Cu/ZnO/Al2O3/MgO catalyst from Alfa Aesar (Haverhill, MA, USA) was used for the kinetic experiments. The catalytic tests were performed using a continuous tubular-flow fixed-bed micro-reactor operated in plug-flow and isothermal mode. The plug-flow assumption was verified theoretically by the absence of axial dispersion (hbed/dp > 20) and radial dispersion (dt/dp > 10); see Table S6 in the Supplementary Materials. Where hbed is the catalyst bed height, dp is the catalyst particle diameter, and dt is the reactor tube diameter. The initial kinetic tests were performed by operating the reactor in differential mode (i.e., by reducing the amount of the catalyst in the bed in order to reach the lowest conversion possible: ≤10%), and thereafter, the integral conditions experiments were considered.
The effect of catalyst deactivation was neglected in the study. The catalyst testing was performed at temperatures 210–260 °C and pressures 40–77 bar, stoichiometric number (SN): 1.9–3.8 and COR: 0.9–1.0. The high COR accounts for the inhibitory effect of high water content in the products. The choice of the conditions corresponds to the known validity range in terms of temperature and pressure [23,24] but with very high GHSV values (516,000–774,000 h−1) considered. Dry feed (CO/H2 only, without CO2) was not considered in this study since the aim was to develop an improved model for CO2 hydrogenation with CO only hypothetically introduced via recycling. Furthermore, considering pure CO/H2 feed does not contribute to providing a universal model for methanol synthesis.
As the first step, the mass and heat transfer limitations were checked to identify the conditions where they are absent or negligible, thus enabling the generation of intrinsic kinetic data. The internal and external diffusion limitations were tested at 260 °C (maximum temperature of the kinetic measurements) and 50 bar. To check for the absence of external transport (mass and heat) resistances, the catalyst mass and feed flow rate were varied whilst keeping constant the gas hourly space velocity (GHSV) (the ratio: flow rate/catalyst mass, i.e., GHSV = 110,348 h−1 and gas composition of CO2: 24%, H2: 72.1% and Ar: 3.9%). Table 10 summarizes the conditions applied for external diffusion limitations tests. To check for the absence of internal diffusion limitations, the size of the catalyst particles was varied. Internal diffusion limitations tests were performed to select the appropriate size to be used for the catalyst evaluation, and corresponding to conditions where the diffusion limitations can be excluded.
Where Q is the volumetric flow rate at the inlet of the reactor, different grain sizes were used to evaluate its effect on the catalytic performance characteristic of the internal diffusion. The pelletized Cu/ZnO/Al2O3/MgO catalysts were crushed into powder form and sieved to produce three samples (S) of uniform sizes: S1 = 40–63 µm, S2 = 63–125 µm and S3 = 125–250 µm. These samples were all experimentally tested to assess the internal diffusion limitations. Table 11 shows the test conditions used for the internal diffusional limitation tests.
The catalyst samples were diluted with inert SiC particles, which are not catalytically active, in order to obtain a catalytic bed volume of 0.307 cm3, then packed into a stainless steel reactor with internal and external diameters of 1.01 cm and 1.27 cm, respectively, and a total length of 21 cm. Quartz wool was used to support the catalyst bed and ensure equal gas distribution. Catalyst dilution with SiC particles limits the formation of hot spots and increases the length of the bed, allowing plug-flow behavior. To ensure isothermal operation, the catalyst bed was mixed with inert particles while being continuously heated using electrical heating set at the desired constant controlled temperature. The temperature was stable when the reaction feed was introduced into the reactor. The heating coil and thermal probe were mounted on the outer walls of the reactor. The relative pressure drop over the catalyst bed was negligible. The catalyst was reduced using a pure hydrogen flow of 25 Nml/min, while the temperature was increased from room temperature, at a rate of 5 °C/min, to a predetermined reduction point of 280 °C for a duration of 12 h. The catalyst was cooled under the same flow to 70 °C. The reactor was then pressurized to a desired total pressure under the gas flow. The back-pressure controller regulates the pressure in the reactor.
Once the system was stable, the blank sample was analyzed online using the Agilent GC-7890B gas chromatograph, and this sample corresponds to the reactor inlet feed composition. Thereafter, the temperature was ramped at 5 °C/min to the desired reaction temperature. Once the desired temperature is reached, this is defined as the starting point of the reaction. The liquid products from the reaction were trapped before sending the gaseous product to the gas chromatograph. The collected liquids were analyzed by manual injection using the same instrument. The temperature of the trap was set equal to the room temperature of water used to cool the trap and was measured to be around 25 °C, and the pressure in the trap was similar to the system operating set-point pressure at particular experimental conditions, e.g., 50 bar. A very small amount of gases was dissolved in the methanol/water mixture due to the fact that less liquid was condensed in the trap at these high GHSV, as considered in this study, and thus, the effect of dissolved gases was assumed to be negligible. The gaseous reaction products were analyzed in an online system using the Agilent GC–7890B, featuring a flame-ionization detector coupled with an HP-5 column (Agilent Technologies, Waldbronn, Germany) installed (to detect and separate the hydrocarbons) as well as two thermal conductivity detectors (TCDs). One TCD with hydrogen as carrier gas was used for detecting CO, Ar, CO2 and other components, while the other TCD with nitrogen as carrier gas was used for detecting the hydrogen. No other components were detected, indicating that side reactions (e.g., dehydration of methanol to DME, methanation, etc.) are negligible. A schematic of the experimental apparatus used in this study is shown in Figure 6. Results of experimental tests provided new data for the state-of-the-art industrial catalysts and subsequently aided in developing the kinetic parameters to be used for reactor modeling, process simulation and scale-up.
For treatment of the experimental data, assuming direct CO2 hydrogenation and RWGS as the only global reactions, the conversions ( X C O 2 ) were calculated as average values for the total test duration
X C O 2 = n ˙ C H 3 O H , o u t + n ˙ C O , o u t n ˙ C O 2 . i n
where is the molar flow of the component, and the subscripts in and out refer to the flow entering and leaving the reactor, respectively.
Following the assumption that direct CO2 hydrogenation is the main methanol synthesis reaction, the productivity (Y in mol/g/h) of methanol and CO were calculated as follows:
Y CH3OH   =   n C H 3 O H m c a t a l y s t × t
Y CO = C O o u t C O i n m c a t a l y s t
where t is the reaction time, the stoichiometric number, i.e., SN defined by Equation (32), is an excellent measure of the H2 content in the feed; it is usually maintained at SN > 2.0 to reduce side product formation. The ratio of CO2 within the carbon oxide content in the feed (COx) is defined by Equation (33) below as the COR. Conventional syngas have COR < 0.5, while sustainable pathways are expected to have COR values close to 1.00, as they will have a high CO2 content.
SN = y H 2 2 y C O + 3 y C O 2
COR = y C O 2   i n y C O i n + y C O 2   i n
The standard GHSV is calculated (under normal conditions: T0 0 °C and P0 1 atm) using Equation (34)
GHSV 0   ( h 1 )   =   ρ c a t 1 ε Q v , 0 m c

5. Parameter Estimation

The pseudo-homogenous plug-flow reactor model (Equation (35)) was developed to represent the reactor. All parameters for the VBF, OR-GR, Slotboom, OR-SD, and MOD models were fitted to ensure fair comparison.
m A r d w i d x = M w i j = 1 3 v i , j 1 ε ρ c a t r j
Calculations of the thermodynamic constants were performed using Equations (36)–(38), as adopted from the literature [14,38,39] for all models. Moreover, Equation (14) can be rewritten as: K p C O = K p C O 2 / K p R W G S
log K p C O 2 = 15.0921 + 1581.7 T 8.7639 log T + 2.1105 × 10 3 T 1.9303 × 10 7 T 2
log K p R W G S = 1.2777 2167 T + 0.5194 log T 1.037 × 10 3 T + 2.331 × 10 7 T 2
log K p C O = 13.8140 + 3784.4 T 9.2833 log T + 3.1475 × 10 3 T 4.2613 × 10 7 T 2
The kinetic rate constants were fitted for the temperature 250 °C. However, for other temperatures, the kinetic rate constants were calculated according to the reformulated Arrhenius Equation (39).
k j = e x p A j B j T r e f T 1
where Tref = 523.15 K.
To ensure that the values for the model parameters have physical meaning, the following criteria were used:
-
Rule 1: k > 0 imposed by logarithmic Arrhenius form.
-
Rule 2: Ea > 0 or bi > 0, imposed by bounds.
-
Rule 3: ΔH°ads < 0, imposed by bounds.
-
Rule 4: 0 < –ΔS°ads < S°gas.
Here, k stands for the reaction rate constant, Δads is the heat of adsorption, and Ea is the activation energy.

Regression Method

The parameter estimation was carried out using a regression method called the sum of root mean squared errors over N measurements and normalized on the unit standard deviation, as depicted by Equation (40) [10].
Sum RMSE = R M S E c o + R M S E M e O H
where RMSE represents the root mean square error on the simulated value compared to each experimentally measured value; it includes the deviation from the GC calibration curve. The global minimum was obtained utilizing the global optimization tool in Microsoft Excel in order to estimate the kinetic parameters. The algorithm used is Levenberg–Marquardt. The RMSE is expressed by Equation (41) and shows how concentrated the data points are across the line of best fit [10].
RMSE i = y i , c a l c y i , e x p 2 N p o i n t s
where the subscript i refers to components CO and MeOH.

6. Conclusions and Recommendations for Future Work

In this paper, we have demonstrated the importance of an experimental data basis in the development of kinetic models. Although twenty experimental points were generated at high GHSV and used to fit and compare the models, the deductions are assumed to be sufficient. This deduction follows from the fact that these models have been fitted to various experimental points, mostly from integral experiments. The foundational model of Siedel et al. [13,14] (OR-SD) formed the basis of the nine-parameter modified (MOD) model presented in this work. This multi-site model gives good prediction of methanol synthesis. It was established that the MOD can predict the CO2 conversion with an improved degree of accuracy. Furthermore, it was established that it is imperative to highlight the importance of morphological changes in the catalyst under steady-state, deduced to be a strong function of the feed composition and conditions.
The VBF, OR-GR, and Slotboom models fall short in terms of fitting the experimental data presented here, particularly for the formation of methanol and CO. Upon comparison of the intrinsic MOD model to the VBF, OR-GR, and Slotboom models; the residual errors were reduced by 75%, 79% and 81% for the SumRMSE, respectively. VBF, OR-GR, and Slotboom models showed poorer fitting and, hence, the high SumRMSE in the order of increasing SumRMSE. Thus, our proposed model shows lower errors with respect to all other models considered and similar performance to the OR-SD model but with fewer parameters.
It emerged that at least at CO < 5 mol% in the feed, the CO hydrogenation can be neglected. For the CO2-rich streams, the direct CO2 hydrogenation is faster than either the indirect or direct CO hydrogenation to methanol reaction. Except for the original model of Siedel et al., the MOD model, and the VBF model, all other models compared in this study show the formation of CO to be potentially faster over the Cu/ZnO/Al2O3-based catalyst. The VBF model shows a similar order of magnitude of the kinetic rate constants for the direct CO2 hydrogenation and the formation of CO via RWGS. Furthermore, the best fit of the MOD model reveals that methanol synthesis is indeed a structure-sensitive reaction. This is the only model that explains the higher CO2 conversion with CO at the inlet, even though the CO2 hydrogenation is less thermodynamically favored and results in low site coverage.
However, additional experimental data is required to further validate the model, especially under more discriminating dynamic conditions, since, for this study, only a quasi-static fraction of reduced active centers on the catalyst surfaces was assumed—dynamic experiments will aid in further tuning the model.
Future studies should consider dosing water in the feed and assessing changes in the surface basicity or acidity and the actual cut-off point for water concentration in relation to the operating conditions. This could be a critical approach to adopt in both steady-state and dynamic operations of the methanol synthesis reaction to optimize the methanol yield. It is critical that a wide range of conditions are considered in order to derive data for the kinetic model developments.
Furthermore, it is paramount to look at using more realistic PtMeOH feed streams in developing the kinetic model, considering the fact that future methanol synthesis feed streams will likely contain a lot of inerts and have slightly different compositions than the conventional syngas from natural gas and coal. Dynamic experiments give a better direct picture of potential reactors and process improvements required for sustainable PtMeOH. Future work should also include a focus on analyzing the predictive capability for the derived model/s in terms of temperature profile and hot-spot temperature. It needs to be determined whether or not the MOD model predicts the temperature profile accurately for feeds with and without initial CO content, as well as for pure CO/H2 feed. In addition, dynamic changes in the RDS with changes in reaction conditions must be considered in model development. Finally, future work should also consider the possibility of applying the developed model to the design of different reactor geometries. We think this model will be useful in the accurate modeling of the methanol synthesis reactor in the context of power to methanol with high CO2 content in the feed and adaptation to complex models, such as the computational fluid dynamic modeling, of the said reactor.

Supplementary Materials

The following supporting information can be downloaded at: https://www.mdpi.com/article/10.3390/catal13101349/s1, Table S1: Graaf et al. original (Graaf et al., 1988) vs. Fitted; Table S2: Vanden Bussche and Froment original (van den Bussche & Froment, 1996) vs. fitted; Table S3: Slotboom et al. original 6 parameter model (Slotboom et al., 2020) vs. fitted; Table S4: Seidel et al. original (Seidel et al., 2018; Seidel et al., 2020) vs. fitted; Table S5: MOD parameters; Table S6. Plug flow calculation, this follows the criteria discussed in reference (Ertl et al., 1997; Delgado, 2006) [8,13,14,17,24,45,46].

Author Contributions

Conceptualization, S.M. and S.T.; methodology, S.T. and A.-C.R.; validation, B.L., S.T., A.-C.R., N.M., R.E., H.L., J.R. and X.C.; investigation, S.M., K.P. and S.T.; resources, B.L. and N.M.; data curation, S.T., A.-C.R., S.M., N.M. and K.P.; writing—original draft preparation, S.M. and S.T.; writing—review and editing, S.M., S.T., A.-C.R., N.M. and B.L.; supervision, H.L., R.E. and S.T.; funding acquisition, N.M. and B.L. All authors have read and agreed to the published version of the manuscript.

Funding

This work was supported by the South African Department of Science and Innovation (DSI) for research activities under the HySA Infrastructure Center of Competence (KP5 program, Project No. CNMH17X) and also by the Council for Scientific and Industrial Research (CSIR) (Project Nos: C1GEN25, C8GOH26).

Data Availability Statement

The data are available in the article.

Acknowledgments

This work was supported by the South African Department of Science and Innovation (DSI) for research activities under the HySA Infrastructure Center of Competence (KP5 program, Project No. CNMH17X) and also by the Council for Scientific and Industrial Research (CSIR) (Project Nos: C1GEN25, C8GOH26). Special thanks to Ashton Swaartbooi, a colleague at CSIR, for assisting in the building and troubleshooting of the experimental apparatus. Special thanks to the Institute of Chemistry and Processes for Energy, Environment and Health (ICPEES, Strasbourg, France), most especially to Anne Clémence Aun for contributions in terms of the building of the experimental apparatus.

Conflicts of Interest

The authors declare no conflict of interest.

Nomenclature

Abbreviation/SymbolMeaning (Unit)
Ar Area of the fixed bed reactor (m2)
biLogarithmic Arrhenius constants(–)
ΔG Gibbs free energy (J mol−1)
ΔHr Heat of reaction (kJ mol−1)
CORCarbon oxide ratio (–)
GHSV0Gas hourly space velocity at nominal standard conditions (h−1)
GHSVGas hourly space velocity (NL.h−1.gcat−1)
Kpj° (T) Temperature dependent equilibrium constant (–)
kj Reaction rate constant (–)
Ki Adsorption constant (–)
M w i Molecular weight (kg mol−1)
mcMass of the catalyst (kg)
miMass of component (kg)
Npoints Number of experimental points (–)
Np Number of parameters (–)
Qv,0Standard volume flow (293 K and 1·105 Pa) (NmL min−1)
R Ideal gas constant (J mol−1K−1)
RMSEiroot mean square error of molar fractions for component i (–)
rj Reaction rate (mol/kgcat/s)
m Mass flowrate (kg/s),
SNStoichiometric number (–)
T Temperature (K)
νi,jStoichiometric reaction rate constant (–)
xAxial distance in the reactor (m)
wiWeight fraction (–)
yi Mole fraction (–)
ε Fixed bed porosity (–)
∗γ, γ0Relative surface contact free energy (–)
Θi Fraction of free surface centers (–)
ρcatCatalyst density (kg m−3)
ϕ Total amount of relative reduced surface centers (–)
γVolume flow contraction (–)

Appendix A. Experimental Data

The original and fitted kinetic parameters for all the kinetic models considered in this study are found in the Supplementary Information.
Table A1. Experimental data points taken into account in the kinetic models fitting.
Partial Pressures Inlet (bar) Outlet (mol/h/gcat)
ExperimentGHSV0
(h−1)
Pressure (bar)T (°C)H2CO2COArCO2 Conversion (%)H2/CO2 RatioCOCH3OH
1774,0005021035.910.10.04.05.43.67.1 × 10−26.6 × 10⁻²
2774,0005021035.98.10.06.05.94.45.8 × 10−25.5 × 10⁻²
3774,0006021043.314.30.02.37.03.01.0 × 10−11.1 × 10⁻¹
4774,0007721055.618.40.03.08.23.01.3 × 10−11.2 × 10⁻¹
5774,0005021035.411.71.01.97.43.06.9 × 10−21.5 × 10⁻¹
6774,0005021035.411.71.01.97.13.06.4 × 10−21.5 × 10⁻¹
7516,0005021036.111.90.02.06.93.05.2 × 10−27.7 × 10⁻²
8516,0005023536.111.90.02.012.53.08.2 × 10−28.3 × 10⁻²
9516,0005026036.111.90.02.020.63.85.8 × 10−21.1 × 10⁻¹
10516,0005021038.210.20.01.68.33.85.8 × 10−21.5 × 10⁻¹
11516,0005023538.210.20.01.616.33.86.2 × 10−21.6 × 10⁻¹
12516,0005026038.210.20.01.624.33.86.4 × 10−27.4 × 10⁻²
13516,0005021035.411.71.01.99.73.01.7 × 10−17.9 × 10⁻²
14516,0005023535.411.71.01.914.83.03.3 × 10−18.0 × 10⁻²
15516,0005026035.411.71.01.920.93.06.4 × 10−27.7 × 10⁻²
16516,0004021028.99.60.01.56.53.01.7 × 10−11.1 × 10⁻¹
17516,0006521046.915.60.02.58.33.03.1 × 10−11.1 × 10⁻¹
18516,0004021028.49.30.81.58.73.05.8 × 10−21.3 × 10⁻¹
19516,0006521046.015.21.32.510.73.01.7 × 10−11.2 × 10⁻¹
20516,0007521053.117.51.52.911.23.03.0 × 10−11.0 × 10⁻¹

References

  1. Kobl, K.; Thomas, S.; Zimmermann, Y.; Parkhomenko, K.; Roger, A.-C. Power-law kinetics of methanol synthesis from carbon dioxide and hydrogen on copper–zinc oxide catalysts with alumina or zirconia supports. Catal. Today 2016, 270, 31–42. [Google Scholar] [CrossRef]
  2. Kyrimis, S.; Potter, M.E.; Raja, R.; Armstrong, L.-M. Understanding catalytic CO2 and CO conversion into methanol using computational fluid dynamics. Faraday Discuss. 2021, 230, 100–123. [Google Scholar] [CrossRef] [PubMed]
  3. Prakash, G.K.S.; Olah, G.; Goeppert, A. Beyond Oil and Gas: The Methanol Economy, 3rd Updated and Enlarged ed.; John Wiley & Sons: Hoboken, NJ, USA, 2018. [Google Scholar]
  4. Peter, M. Mechanistic Modeling of Reaction Kinetics and Dynamic Changes in Catalyst Morphology on a Mesoscopic scale. Ph.D. Thesis, Technische Universität München, Munich, Germany, 2012. Available online: http://nbn-resolving.de/urn/resolver.pl?urn:nbn:de:bvb:91-diss-20120712-1095829-1-3 (accessed on 1 September 2023).
  5. Tarasov, A.V.; Seitz, F.; Schlögl, R.; Frei, E. In Situ Quantification of Reaction Adsorbates in Low-Temperature Methanol Synthesis on a High-Performance Cu/ZnO:Al Catalyst. ACS Catal. 2019, 9, 5537–5544. [Google Scholar] [CrossRef]
  6. Bisotti, F.; Fedeli, M.; Prifti, K.; Galeazzi, A.; Dell’angelo, A.; Manenti, F. Impact of Kinetic Models on Methanol Synthesis Reactor Predictions: In Silico Assessment and Comparison with Industrial Data. Ind. Eng. Chem. Res. 2022, 61, 2206–2226. [Google Scholar] [CrossRef]
  7. Bisotti, F.; Fedeli, M.; Prifti, K.; Galeazzi, A.; Dell’angelo, A.; Barbieri, M.; Pirola, C.; Bozzano, G.; Manenti, F. Century of Technology Trends in Methanol Synthesis: Any Need for Kinetics Refitting? Ind. Eng. Chem. Res. 2021, 60, 16032–16053. [Google Scholar] [CrossRef]
  8. Slotboom, Y.; Bos, M.; Pieper, J.; Vrieswijk, V.; Likozar, B.; Kersten, S.; Brilman, D. Critical assessment of steady-state kinetic models for the synthesis of methanol over an industrial Cu/ZnO/Al2O3 catalyst. Chem. Eng. J. 2020, 389, 124181. [Google Scholar] [CrossRef]
  9. Nestler, F.; Müller, V.P.; Ouda, M.; Hadrich, M.J.; Schaadt, A.; Bajohr, S.; Kolb, T. A novel approach for kinetic measurements in exothermic fixed bed reactors: Advancements in non-isothermal bed conditions demonstrated for methanol synthesis. React. Chem. Eng. 2021, 6, 1092–1107. [Google Scholar] [CrossRef]
  10. Nestler, F.; Schütze, A.; Ouda, M.; Hadrich, M.; Schaadt, A.; Bajohr, S.; Kolb, T. Kinetic modelling of methanol synthesis over commercial catalysts: A critical assessment. Chem. Eng. J. 2020, 394, 124881. [Google Scholar] [CrossRef]
  11. Votsmeier, M. Efficient implementation of detailed surface chemistry into reactor models using mapped rate data. Chem. Eng. Sci. 2009, 64, 1384–1389. [Google Scholar] [CrossRef]
  12. Klingenberger, M.; Hirsch, O.; Votsmeier, M. Efficient interpolation of precomputed kinetic data employing reduced multivariate Hermite Splines. Comput. Chem. Eng. 2017, 98, 21–30. [Google Scholar] [CrossRef]
  13. Seidel, C.; Jörke, A.; Vollbrecht, B.; Seidel-Morgenstern, A.; Kienle, A. Kinetic modeling of methanol synthesis from renewable resources. Chem. Eng. Sci. 2018, 175, 130–138, Erratum in Chem. Eng. Sci. 2020, 223, 115724. [Google Scholar] [CrossRef]
  14. Seidel, C.; Nikolic, D.; Felischak, M.; Petkovska, M.; Seidel-Morgenstern, A.; Kienle, A. Optimization of Methanol Synthesisunder Forced Periodic Operation. Processes 2021, 9, 872. [Google Scholar] [CrossRef]
  15. Skrzypek, J.; Lachowska, M.; Moroz, H. Kinetics of methanol synthesis over commercial copper/zinc oxide/alumina catalysts. Chem. Eng. Sci. 1991, 46, 2809–2813. [Google Scholar] [CrossRef]
  16. Kubota, T.; Hayakawa, I.; Mabuse, H.; Mori, K.; Ushikoshi, K.; Watanabe, T.; Saito, M. Kinetic study of methanol synthesis from carbon dioxide and hydrogen. Appl. Organomet. Chem. 2001, 15, 121–126. [Google Scholar] [CrossRef]
  17. van den Bussche, K.M.; Froment, G.F. A steady-state kinetic model for methanol synthesis and the water gas shift reaction on a commercial Cu/ZnO/Al2O3 catalyst. J. Catal. 1996, 161, 1–10. [Google Scholar] [CrossRef]
  18. de Oliveira Campos, B.L.; Herrera Delgado, K.; Wild, S.; Studt, F.; Pitter, S.; Sauer, J. Surface reaction kinetics of the methanol synthesis and the water gas shift reaction on Cu/ZnO/Al2O3. React. Chem. Eng. 2021, 6, 1483–1486. [Google Scholar] [CrossRef]
  19. de Oliveira Campos, B.L.; Herrera Delgado, K.; Pitter, S.; Sauer, J. Development of consistent kinetic models derived from a microkinetic model of the methanol synthesis. Ind. Eng. Chem. Res. 2021, 60, 15074–15086. [Google Scholar] [CrossRef]
  20. Bozzano, G.; Manenti, F. Efficient methanol synthesis: Perspectives, technologies and optimization strategies. Prog. Energy Combust. Sci. 2016, 56, 71–105. [Google Scholar] [CrossRef]
  21. Angelo, L.; Kobl, K.; Tejada, L.M.M.; Zimmermann, Y.; Parkhomenko, K.; Roger, A.-C. Study of CuZnMOx oxides (M = Al, Zr, Ce, CeZr) for the catalytic hydrogenation of CO2 into methanol. Comptes Rendus Chim. 2015, 18, 250–260. [Google Scholar] [CrossRef]
  22. Ruland, H.; Song, H.; Laudenschleger, D.; Stürmer, S.; Schmidt, S.; He, J.; Kähler, K.; Muhler, M.; Schlögl, R. CO2 Hydrogenation with Cu/ZnO/Al2O3: A Benchmark Study. ChemCatChem 2020, 12, 3216–3222. [Google Scholar] [CrossRef]
  23. Park, N.; Park, M.-J.; Lee, Y.-J.; Ha, K.-S.; Jun, K.-W. Kinetic modeling of methanol synthesis over commercial catalysts based on three-site adsorption. Fuel Process. Technol. 2014, 125, 139–147. [Google Scholar] [CrossRef]
  24. Graaf, G.; Stamhuis, E.; Beenackers, A. Kinetics of low-pressure methanol synthesis. Chem. Eng. Sci. 1988, 43, 3185–3195. [Google Scholar] [CrossRef]
  25. Díez-Ramírez, J.; Díaz, J.; Dorado, F.; Sánchez, P. Kinetics of the hydrogenation of CO2 to methanol at atmospheric pressure using a Pd-Cu-Zn/SiC catalyst. Fuel Process. Technol. 2018, 173, 173–181. [Google Scholar] [CrossRef]
  26. Ovesen, C.; Clausen, B.; Schiøtz, J.; Stoltze, P.; Topsøe, H.; Nørskov, J. Kinetic Implications of Dynamical Changes in Catalyst Morphology during Methanol Synthesis over Cu/ZnO Catalysts. J. Catal. 1997, 168, 133–142. [Google Scholar] [CrossRef]
  27. Choi, Y.; Futagami, K.; Fujitani, T.; Nakamura, J. The difference in the active sites for CO2 and CO hydrogenations on Cu/ZnO-based methanol synthesis catalysts. Catal. Lett. 2001, 73, 27–31. [Google Scholar] [CrossRef]
  28. Kamsuwan, T.; Guntida, A.; Praserthdam, P.; Jongsomjit, B. Differences in Deterioration Behaviors of Cu/ZnO/Al2O3 Catalysts with Different Cu Contents toward Hydrogenation of CO and CO2. ACS Omega 2022, 7, 25783–25797. [Google Scholar] [CrossRef]
  29. Shi, Y.-F.; Kang, P.-L.; Shang, C.; Liu, Z.-P. Methanol Synthesis from CO2/CO Mixture on Cu–Zn Catalysts from Microkinetics-Guided Machine Learning Pathway Search. J. Am. Chem. Soc. 2022, 144, 13401–13414. [Google Scholar] [CrossRef]
  30. Hoang, T.T.N.; Tsai, D.-H. Low-temperature methanol synthesis via (CO2 + CO) combined hydrogenation using Cu-ZnO/Al2O3 hybrid nanoparticle cluster. Appl. Catal. A Gen. 2022, 645, 118844. [Google Scholar] [CrossRef]
  31. Grunwaldt, J.-D.; Molenbroek, A.; Topsøe, N.-Y.; Topsøe, H.; Clausen, B. In Situ Investigations of Structural Changes in Cu/ZnO Catalysts. J. Catal. 2000, 194, 452–460. [Google Scholar] [CrossRef]
  32. Li, H.-X.; Yang, L.-Q.; Chi, Z.-Y.; Zhang, Y.-L.; Li, X.-G.; He, Y.-L.; Reina, T.R.; Xiao, W.-D. CO2 Hydrogenation to Methanol Over Cu/ZnO/Al2O3 Catalyst: Kinetic Modeling Based on Either Single- or Dual-Active Site Mechanism. Catal. Lett. 2022, 152, 3110–3124. [Google Scholar] [CrossRef]
  33. Nielsen, N.D.; Jensen, A.D.; Christensen, J.M. The roles of CO and CO2 in high pressure methanol synthesis over Cu-based catalysts. J. Catal. 2021, 393, 324–334. [Google Scholar] [CrossRef]
  34. Grabow, L.C.; Mavrikakis, M. Mechanism of methanol synthesis on Cu through CO2 and CO hydrogenation. ACS Catal. 2011, 1, 365–384. [Google Scholar] [CrossRef]
  35. Guo, S.-J.; Wang, H.; Qin, Z.-F.; Li, Z.-K.; Wang, G.-F.; Dong, M.; Fan, W.-B.; Wang, J.-G. Conversion of the CO and CO2 mixture to alcohols and hydrocarbons by hydrogenation under the influence of the water-gas shift reaction, a thermodynamic consideration. J. Fuel Chem. Technol. 2023, 51, 482–491. [Google Scholar] [CrossRef]
  36. Guo, S.; Wang, H.; Qin, Z.; Li, Z.; Wang, G.; Dong, M.; Fan, W.; Wang, J. Feasibility, Limit, and Suitable Reaction Conditions for the Production of Alcohols and Hydrocarbons from CO and CO2 through Hydrogenation, a Thermodynamic Consideration. Ind. Eng. Chem. Res. 2022, 61, 17027–17038. [Google Scholar] [CrossRef]
  37. Wilkinson, S.; van de Water, L.; Miller, B.; Simmons, M.; Stitt, E.; Watson, M. Understanding the generation of methanol synthesis and water gas shift activity over copper-based catalysts—A spatially resolved experimental kinetic study using steady and non-steady state operation under CO/CO2/H2 feeds. J. Catal. 2016, 337, 208–220. [Google Scholar] [CrossRef]
  38. Skrzypek, J.; Lachowska, M.; Grzesik, M.; Słoczyński, J.; Nowak, P. Thermodynamics and kinetics of low pressure methanol synthesis. Chem. Eng. J. Biochem. Eng. J. 1995, 58, 101–108. [Google Scholar] [CrossRef]
  39. Bernardi, A.; Gomoescu, L.; Wang, J.; Pantelides, C.C.; Chadwick, D.; Chachuat, B. Kinetic Model Discrimination for Methanol and DME Synthesis using Bayesian Estimation. IFAC-PapersOnLine 2019, 52, 335–340. [Google Scholar] [CrossRef]
  40. Bukhtiyarova, M.; Lunkenbein, T.; Kähler, K.; Schlögl, R. Methanol Synthesis from Industrial CO2 Sources: A Contribution to Chemical Energy Conversion. Catal. Lett. 2017, 147, 416–427. [Google Scholar] [CrossRef]
  41. Henkel, T. Modellierung von Reaktion und Stofftransport in geformten Katalysatoren am Beispiel der Methanolsynthese. Ph.D. Thesis, Technical University of Munich, Munich, Germany, 2011. [Google Scholar]
  42. Wang, X.; Zhang, H. Kinetically relevant variation triggered by hydrogen pressure: A mechanistic case study of CO2 hydrogenation to methanol over Cu/ZnO. J. Catal. 2022, 406, 145–156. [Google Scholar] [CrossRef]
  43. Vollbrecht, B. Zur Kinetik der Methanolsynthese an einem technischen Cu/ZnO/Al2O3 Katalysator. Ph.D. Thesis, Universität Magdeburg, Magdeburg, Germany, 2007. [Google Scholar]
  44. Kunkes, E.L.; Studt, F.; Abild-Pedersen, F.; Schlögl, R.; Behrens, M. Hydrogenation of CO2 to methanol and CO on Cu/ZnO/Al2O3: Is there a common intermediate or not? J. Catal. 2015, 328, 43–48. [Google Scholar] [CrossRef]
  45. Delgado, J.M.P.Q. A critical review of dispersion in packed beds. Heat Mass Transf. 2006, 42, 279–310. [Google Scholar] [CrossRef]
  46. Ertl, G.; Knözinger, H.; Weitkamp, J. (Eds.) Handbook of Heterogeneous Catalysis; Wiley-VCH: New York, NY, USA, 1997. [Google Scholar]
Figure 1. Parity plots for CO2 conversion and MeOH and CO formation considering the VBF model, with and without CO in the feed. The parity lines are 20%. The middle line represents the 0% error line. Points ●: T = 210 °C; ■: T > 210 °C; blue represents points without CO inlet, while red represents points with CO inlet.
Catalysts 13 01349 g001
Figure 2. Parity plots for CO2 conversion and MeOH and CO formation, considering the OR-GR model with and without CO in the feed. The parity lines are 20%. The middle line represents the 0% error line. Points ●: T = 210 °C; ■: T > 210 °C; blue represents points without CO inlet while red represents points with CO inlet.
Catalysts 13 01349 g002
Figure 3. Parity plots for CO2 conversion and MeOH and CO formation, considering the Slotboom model with and without CO in the feed. The parity lines are 20%. Points ●: T = 210 °C; ■: T > 210 °C; blue represents points without CO inlet while red represents points with CO inlet.
Catalysts 13 01349 g003
Figure 4. Parity plots for CO2 conversion, MeOH, and CO formation considering the original OR-SD model with and without CO in the feed. The parity lines are 20%. Points ●: T = 210 °C; ■: T > 210 °C; blue represents points without CO inlet while red represents points with CO inlet.
Catalysts 13 01349 g004
Figure 5. Parity plots for CO2 conversion, MeOH, and CO formation considering MOD model with and without CO in the feed. The parity lines are 20%. Points ●: T = 210 °C; ■: T > 210 °C; blue represents points without CO inlet while red represents points with CO inlet.
Catalysts 13 01349 g005
Figure 6. Schematic representation of the kinetic experimental apparatus.
Catalysts 13 01349 g006
Table 1. Prominent kinetic models and their validity ranges.
Database/AuthorNo of Exper. PointsReactorPress.
(bar)
Temp.
(°C)
GHSV
(NL.h−1.gcat−1)
H2 Feed
(%v/v)
CO2 Feed
(%v/v)
CO Feed
(%v/v)
Inert Feed
(%v/v)
COx Convers.
(%)
OR-GR89SBR 115–50210–2450.36–25.263–892.1–260–22--
VBF276PFFR 215–51180–280------
de Oliveira Campos et al. [18]359PFFR40–60210–26024–4035–600–203–3020–500.9–30.9
Slotboom et al. [8]234PFFR20–70178–2601.3–6.566–8012–25-0–110.4–9.6
Seidel et al. [13,14]139CSTR 330–70230–2603.660–760–130–2115–162.9–52.6
Park et al. [23]98PFFR50–90230–3408–4050–832–167–290–285.1–56
1 SBR: spinning basket reactor. 2 PFFR: plug-flow fixed-bed reactor operated under integral conditions. 3 CSTR: continuous stirred fixed-bed reactor.
Table 2. Internal and external diffusion limitation results.
Internal Diffusion LimitationExternal Diffusion Limitation
Test 3Test 4Test 5Test 1Test 2
ParameterGrain size:
40–63 µm
Grain size:
63–125 µm
Grain size:
125–250 µm
Flow: 28.5 mL/minFlow: 57.0 mL/min
CO2 conversion (%)16.115.510.415.515.0
Table 3. Comparison of reaction rate constants corresponding to the VBF model.
Reaction Rate ConstantUnitsExperiments
Without   CO   in   Feed All with CO in Feed
1 k C O 2 ¯ 1 m o l s . k g 3.72 × 10 3 5.41 × 10 2  
2 k R W G S ¯ 2 m o l s . k g 1.83 × 10 2 4.29 × 10 2  
Table 4. Comparison of reaction rate constants corresponding to the OR-GR model.
Reaction Rate ConstantUnitsExperiments
Without   CO   in   Feed All with CO in Feed
1 k C O 2 ¯ 1 m o l s . k g 2.88 × 10 4 3.97 × 10 4  
2 k R W G S ¯ 2 m o l s . k g 1.78 × 10 3 2.51 × 10 3  
3 k C O ¯ 3 m o l s . k g 0.005.19 × 10 4
Table 5. Comparison of reaction rate constants corresponding to the Slotboom model.
ReactionReaction Rate ConstantUnitsExperiments
Without   CO   in   Feed All with CO in Feed
1 k C O 2 ¯ 1 m o l s . k g 1.61 × 10 3 3.89 × 10 3  
2 k R W G S ¯ 2 m o l s . k g 2.04 × 10 2 3.04 × 10 2  
Table 6. Comparison of reaction rate constants corresponding to the OR-SD model.
Reaction Rate ConstantUnitsFor All Experiments, Including Those with CO in Feed
1 k C O 2 ¯ 1 m o l h . b a r 2 2.377
2 k R W G S ¯ 2 m o l h . b a r 2 8.56 × 10 3
3 k C O ¯ 3 m o l h . b a r 2 9.97 ×   10 4
Table 7. Comparison of reaction rate constants corresponding to the MOD model.
Reaction Rate ConstantUnitsExperiments:
Without   CO   in   Feed With CO in Feed
1 k C O 2 ¯ 1 m o l h . b a r 2 2.76 × 10 1 7.45 × 10 1  
2 k R W G S ¯ 2 m o l h . b a r 2 7.92 × 10 3 8.62 × 10 3
Table 8. Comparison of activation energies, kinetic parameters, and adsorption constants at reference temperature 250 °C: MOD and OR-SD models.
ParametersUnitsMODOR-SD
ER1kJ.mol−125.0 5.4
ER2kJ.mol−198.2 76.4
ER3kJ.mol–1-12
k1mol/h/g/bar27.45 × 10−1 2.377 × 10⁻¹
k2mol/h/g/bar28.62 × 10−3 8.56 × 10⁻³
k3mol/h/g/bar2-9.97 × 10−4
b-CObar−10.743 0.147
b-H2Obar−10.058 0.030
b-H2-3786 bar−0.51361 bar−1
b-O-178 1600
b-CO2bar−100
Table 9. The % SumRMSE for all kinetic models is considered here.
ModelSumres
(%)
No of Parameters
VBF710
OR-GR8.212
Slotboom96
OR-SD1.712
MOD1.79
Table 10. External diffusion limitations: test conditions.
ParametersUnitsTest 1Test 2
Mass of catalyst mg4.08.0
QNml/min28.557.0
Temperature°C260260
Pressurebar5050
Sample sizeµm63–125 63–125
Table 11. Internal diffusion limitations: test conditions.
ParametersUnitsTest 3Test 4Test 5
Particle sizeµmS1 = 40–63 S2 = 63–125S3 = 125–250
mcmg8.08.08.0
QNml/min575757
Temperature°C260 260 260
Disclaimer/Publisher’s Note: The statements, opinions and data contained in all publications are solely those of the individual author(s) and contributor(s) and not of MDPI and/or the editor(s). MDPI and/or the editor(s) disclaim responsibility for any injury to people or property resulting from any ideas, methods, instructions or products referred to in the content.

