Article

Plasma Jet Sputtering as an Efficient Method for the Deposition of Nickel and Cobalt Mixed Oxides on Stainless-Steel Meshes: Application to VOC Oxidation

1
Institute of Chemical Process Fundamentals of the Czech Academy of Sciences, Rozvojová 135, 165 02 Prague, Czech Republic
2
Institute of Physics of the Czech Academy of Sciences, Na Slovance 2, 182 21 Prague, Czech Republic
3
Faculty of Mathematics and Physics, Charles University, V Holešovičkách 2, 180 00 Prague, Czech Republic
4
Central Laboratories, University of Chemistry and Technology, Technická 5, 166 28 Prague, Czech Republic
5
Department of Solid State Chemistry, University of Chemistry and Technology, Technická 5, 166 28 Prague, Czech Republic
*
Author to whom correspondence should be addressed.
Catalysts 2023, 13(1), 79; https://doi.org/10.3390/catal13010079
Submission received: 14 November 2022 / Revised: 15 December 2022 / Accepted: 25 December 2022 / Published: 30 December 2022
(This article belongs to the Section Environmental Catalysis)

Abstract

:
Hollow cathode plasma sputtering is an advantageous method of preparing catalysts in the form of thin oxide films on supports. Such catalysts are particularly suitable for processes such as catalytic total oxidation of volatile organic compounds (VOCs), representing an economically feasible and environmentally friendly method of VOC abatement. Catalysts with Ni:Co molar ratios of 1:4, 1:1, and 4:1 were prepared on stainless-steel meshes and compared with single-component Ni and Co oxide catalysts. The properties of the catalysts were characterized by EDX, SEM, powder XRD, temperature-programmed reduction (H2-TPR), Raman spectroscopy, and XPS. Powder XRD revealed the formation of various crystalline phases that were dependent on molar the Ni:Co ratio. NiO and Co3O4 were identified in the single-component Ni and Co oxide catalysts, whereas Ni-Co mixed oxides with a spinel structure, together with NiO, were found in the catalysts containing both Ni and Co. Raman spectra of the catalysts prepared at high working pressures showed a slightly lower intensity of bands, indicating the presence of smaller oxide particles. The TPR profiles confirmed the improved reducibility of the Ni-Co oxide catalysts compared to the single-component Ni and Co catalysts. Catalytic activity was investigated in the deep oxidation of ethanol and toluene, which were used as model volatile organic compounds. In ethanol oxidation, the activity of sputtered catalysts was up to 16 times higher than that of the commercial Cu-Mn oxide catalyst EnviCat® VOC-1544. The main benefits of the sputtered catalysts are the much lower content of Ni and Co oxides and a negligible effect of internal diffusion. Moreover, the process of plasma jet sputtering can be easily implemented on a large scale.

1. Introduction

Mixed oxides of transition metals are used as catalysts in many chemical reactions, such as hydrogenation, oxidation, and water gas shift, or as gas purification adsorbents. They also make an important contribution to improving the quality of the environment because they are used in the oxidation of volatile organic compounds (VOCs). In particular, oxides of Mn, Co, Cu, Ni, V, Cr, Fe, and their various mixtures are active catalysts in this process [1]. We previously showed that cobalt oxide [2], Co-Mn mixed oxides [3], and Co-Cu oxides [4] prepared by precipitation and subsequent calcination or by magnetron sputtering are active in the complete oxidation of ethanol in air, arising, e.g., from pharmaceutical plants. In these processes, pelletized catalysts are most commonly used, but a significant part of the active mass in the pellets is unused in the process due to the large effect of internal diffusion limitations.
The nickel–cobalt oxide system is most commonly used in the process of dry reforming of methane (DRM) to produce synthesis gas [5,6,7], selective hydrogenation of pyrolysis gasoline [8], or ethanol decomposition reactions [9]. Owing to their similar electronic configuration, Co and Ni can easily form alloyed bimetallic particles that exhibit superior performance in DRM reactions. Such catalysts show outstanding performance, which is ascribed to the strong metal-support interaction and synergy between Ni and Co active metals. Moreover, the presence of Co in Ni-Co catalysts eliminates carbon deposition due to the enhancement of CO2 adsorption/reaction in DRM. It has been proven that Ni-Co catalysts contain an active phase with small particle size and excellent dispersion [10]. Recently, Jianrui Niu et al. [11] demonstrated that NiCo2O4 spinel was very efficient for toluene oxidation.
Low-temperature plasma sputtering is one of the most important methods used in industry to deposit thin films on various substrates. Using a planar magnetron, thin films of metals or dielectrics can be reliably prepared over large areas [12]. This deposition system is used to deposit, e.g., tribological, catalytic, optical, or decorative coatings [13,14,15]. An alternative deposition method based on sputtering the use of a metal nozzle with a flowing gas has attracted attention in the past. Inside the nozzle, a very intense discharge is ignited, and the working gas (typically argon) flows into a vacuum chamber, where a so-called plasma jet [16] entrains the plasma. It should be noted that the pressure inside the hollow cathode is up to two orders of magnitude higher than that in the vacuum chamber, leading to the formation of nanoclusters of sputtered particles that are deposited on the substrate, forming nanostructured thin films [17]. Extensive diagnostics of plasma jets have been performed in the past, showing, for example, a different EEDF compared to a magnetron [18]. Plasma jet sputtering is a technique that has also been widely investigated for thin film deposition; for example, textured ZnO thin films [19], high-quality polycrystalline Si thin films [20], nanostructured Co3O4 thin films with a large surface area [21], piezoelectric PZT ceramics on a polymer substrate [22], and nanostructured Fe2O3 thin films as photoanodes for solar water splitting [23] have been prepared. However, plasma jets have not been applied for the preparation of heterogeneous catalysts.
In the view of the activity of Ni-Co catalysts in the abovementioned reactions, we focused on the study of supported Ni-Co oxide catalysts deposited as thin films on stainless steel. Stainless-steel meshes were chosen as a support, as they have a lower pressure drop of the catalytic bed than the bed of shaped pellets. Catalysts in the form of meshes are used especially when large linear velocities of reactants are applied in catalytic reactors.
In this study, we aimed to investigate the effect of the Ni:Co molar ratio on the properties of Ni-Co oxide catalysts prepared by plasma jet sputtering. The selected active components, i.e., nickel and cobalt, are readily available metals from which the targets required for sputtering can be well prepared; therefore, the process can thus be easily implemented on a large scale. The influence of the working conditions of catalyst preparation, especially the working gas pressure, on the oxide deposition process was also investigated in detail. Catalysts with different Ni:Co molar ratios were designated as NiCo14, NiCo11, and NiCo41 (the numbers indicate the intended Ni:Co molar ratio). Single-component Ni and Co oxide catalysts (labeled as Ni and Co, respectively) were also prepared. To reveal the effect of the gas pressure applied during thin film deposition on the properties of the catalysts, the catalysts were prepared at different pressures. The pressure (in Pa) at which the sample was prepared was indicated by a suffix in the sample name, e.g., NiCo1115. In addition to the standard deposition time of 120 min, the NiCo1115 catalyst was also prepared with an extended deposition time of 370 min to achieve an increased amount of oxides on the support. This sample was designated as NiCo1115*. For the same purpose, the NiCo11160 catalyst was prepared using a higher working pressure of 160 Pa and a deposition time of 200 min. Details of the catalyst preparation process are given in the Experimental section.

2. Results

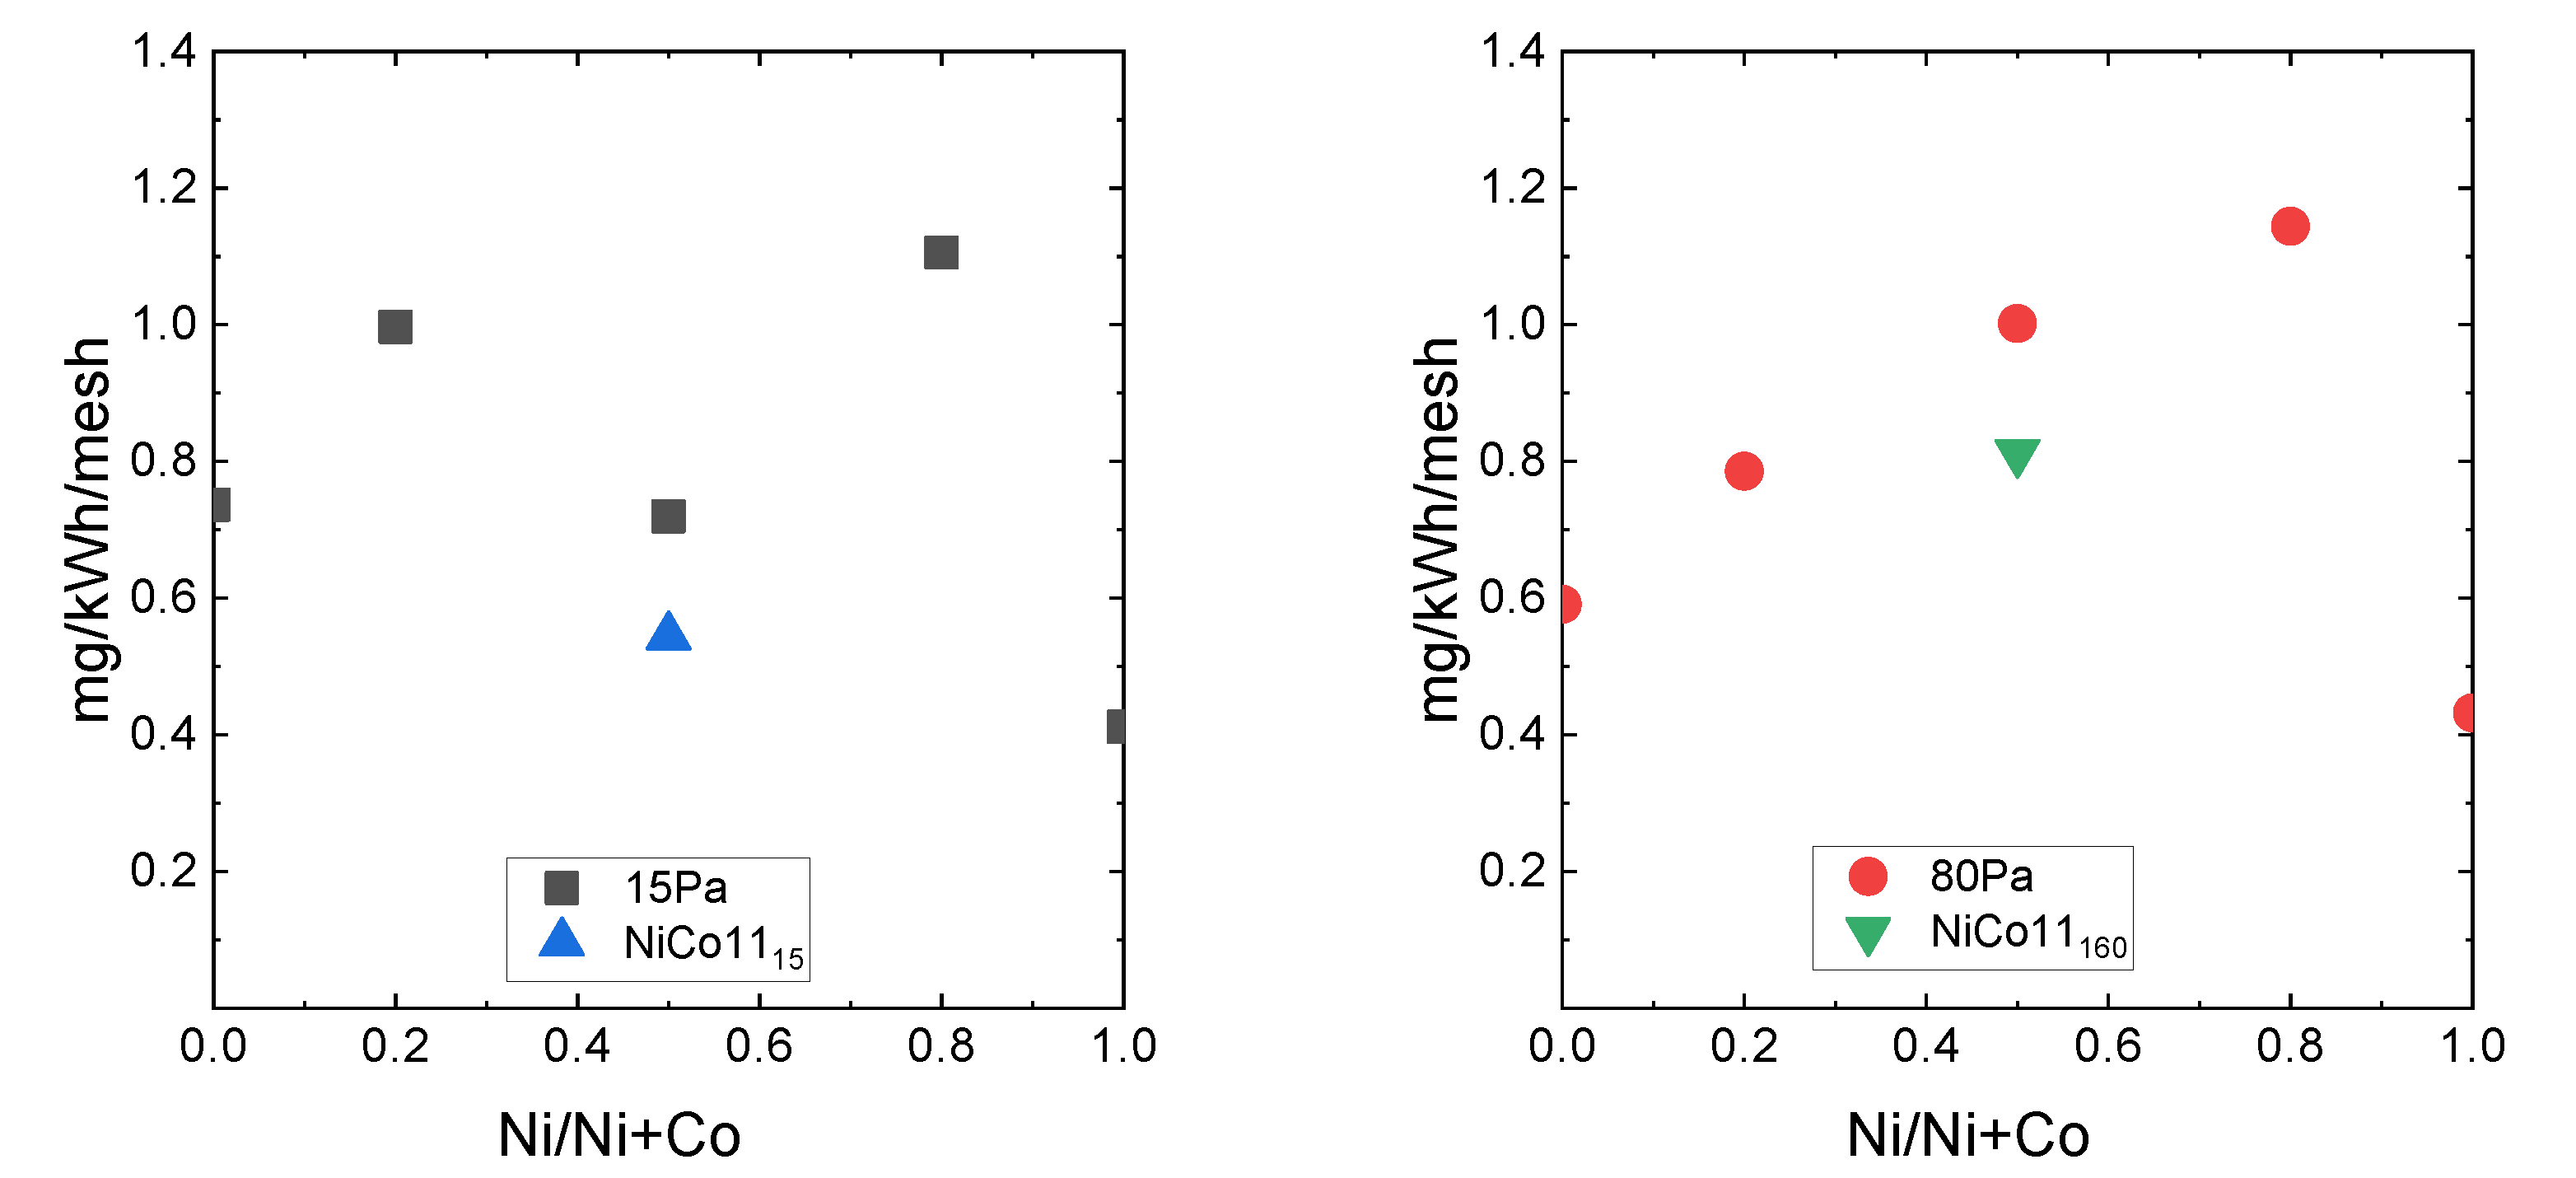
2.1. Plasma Jet Sputtering of Ni-Co Oxides on Stainless-Steel Meshes

The key parameters affecting the amount of metal oxide thin film deposited on the support are composition of the hollow cathode, deposition pressure, power absorbed in the discharge, and deposition time. Deposition experiments revealed that the material composition of the hollow cathode has a significant impact on the discharge behavior. For example, in the case of a pure Ni hollow cathode, we observed that parasitic discharge is often ignited, which causes plasma instability and aggravates the sputtering of the hollow cathode. Therefore, we used a lower discharge current of 1.05 A to suppress undesired parasitic discharge and ensure more stable deposition conditions.
To determine the effect of the material composition of the hollow cathode on the deposition rate of the thin metal oxide film, we calculated the amount of deposited material normalized to kWh of energy delivered to the discharge of the hollow cathode. The mass deposited on the support per kWh as a function of the hollow cathode alloy is shown in Figure 1. For a deposition pressure of 80 Pa, the mass deposited on the mesh increased linearly from 0.6 mg/kWh to 1.15 mg/kWh with increasing amount of nickel in the hollow cathode alloy increased, followed by a sudden drop to 0.45 mg/kWh for the pure nickel cathode. A lower deposition pressure of 15 Pa resulted in a slightly different deposition rate depending on the material of the hollow cathode. The pure Co hollow cathode and Ni20Co80 alloy exhibited a roughly 20% higher deposition rate (mg/kWh) compared to the 80 Pa deposition pressure, whereas the deposition rates for pure Ni and Ni80Co20 alloy were virtually comparable to those for the 80 Pa deposition pressure. On the other hand, we observed an approximately 50% decrease in deposition rate for Ni50Co50 alloy at a deposition pressure of 15 Pa, possibly due to the plasma instability. The same is true for the pure Ni hollow cathode, which had the lowest deposition rate.

2.2. Composition of the Catalysts

A commonly used method for the investigation of catalyst composition, i.e., the determination of Ni and Co concentrations by atomic absorption spectroscopy (AAS) after the dissolution of the samples could not be used because the stainless-steel support contained nickel as one of the major components. Moreover, the amount of oxides deposited on the mesh was very low compared to the total weight of the catalyst. Therefore, the sputtered catalysts were analyzed by EDX (Table S1). Analysis of the bare stainless-steel support showed that it contained 6.50 at.% Ni and; therefore, the EDX analysis of catalytically active oxide layers had to be corrected accordingly. The Ni/Fe intensity ratio (Kα line) for the mesh was equal to 0.07. Because the Fe in all samples originated from the support, the Ni intensity in the samples was reduced by the Fe intensity multiplied by the Ni/Fe intensity ratio (from the support itself). This procedure allowed us to determine an approximate correction to the Ni concentration as the ratio between the reduced and measured Ni intensity (Kα). This correction was performed for an approximate and rapid determination of the Ni content in the deposited oxide layers, although it may have led to a reduced accuracy of the determination. The Ni:Co molar ratios in the deposited oxides determined by the EDX method were close to the nominal values in the used cathodes (Table 1).

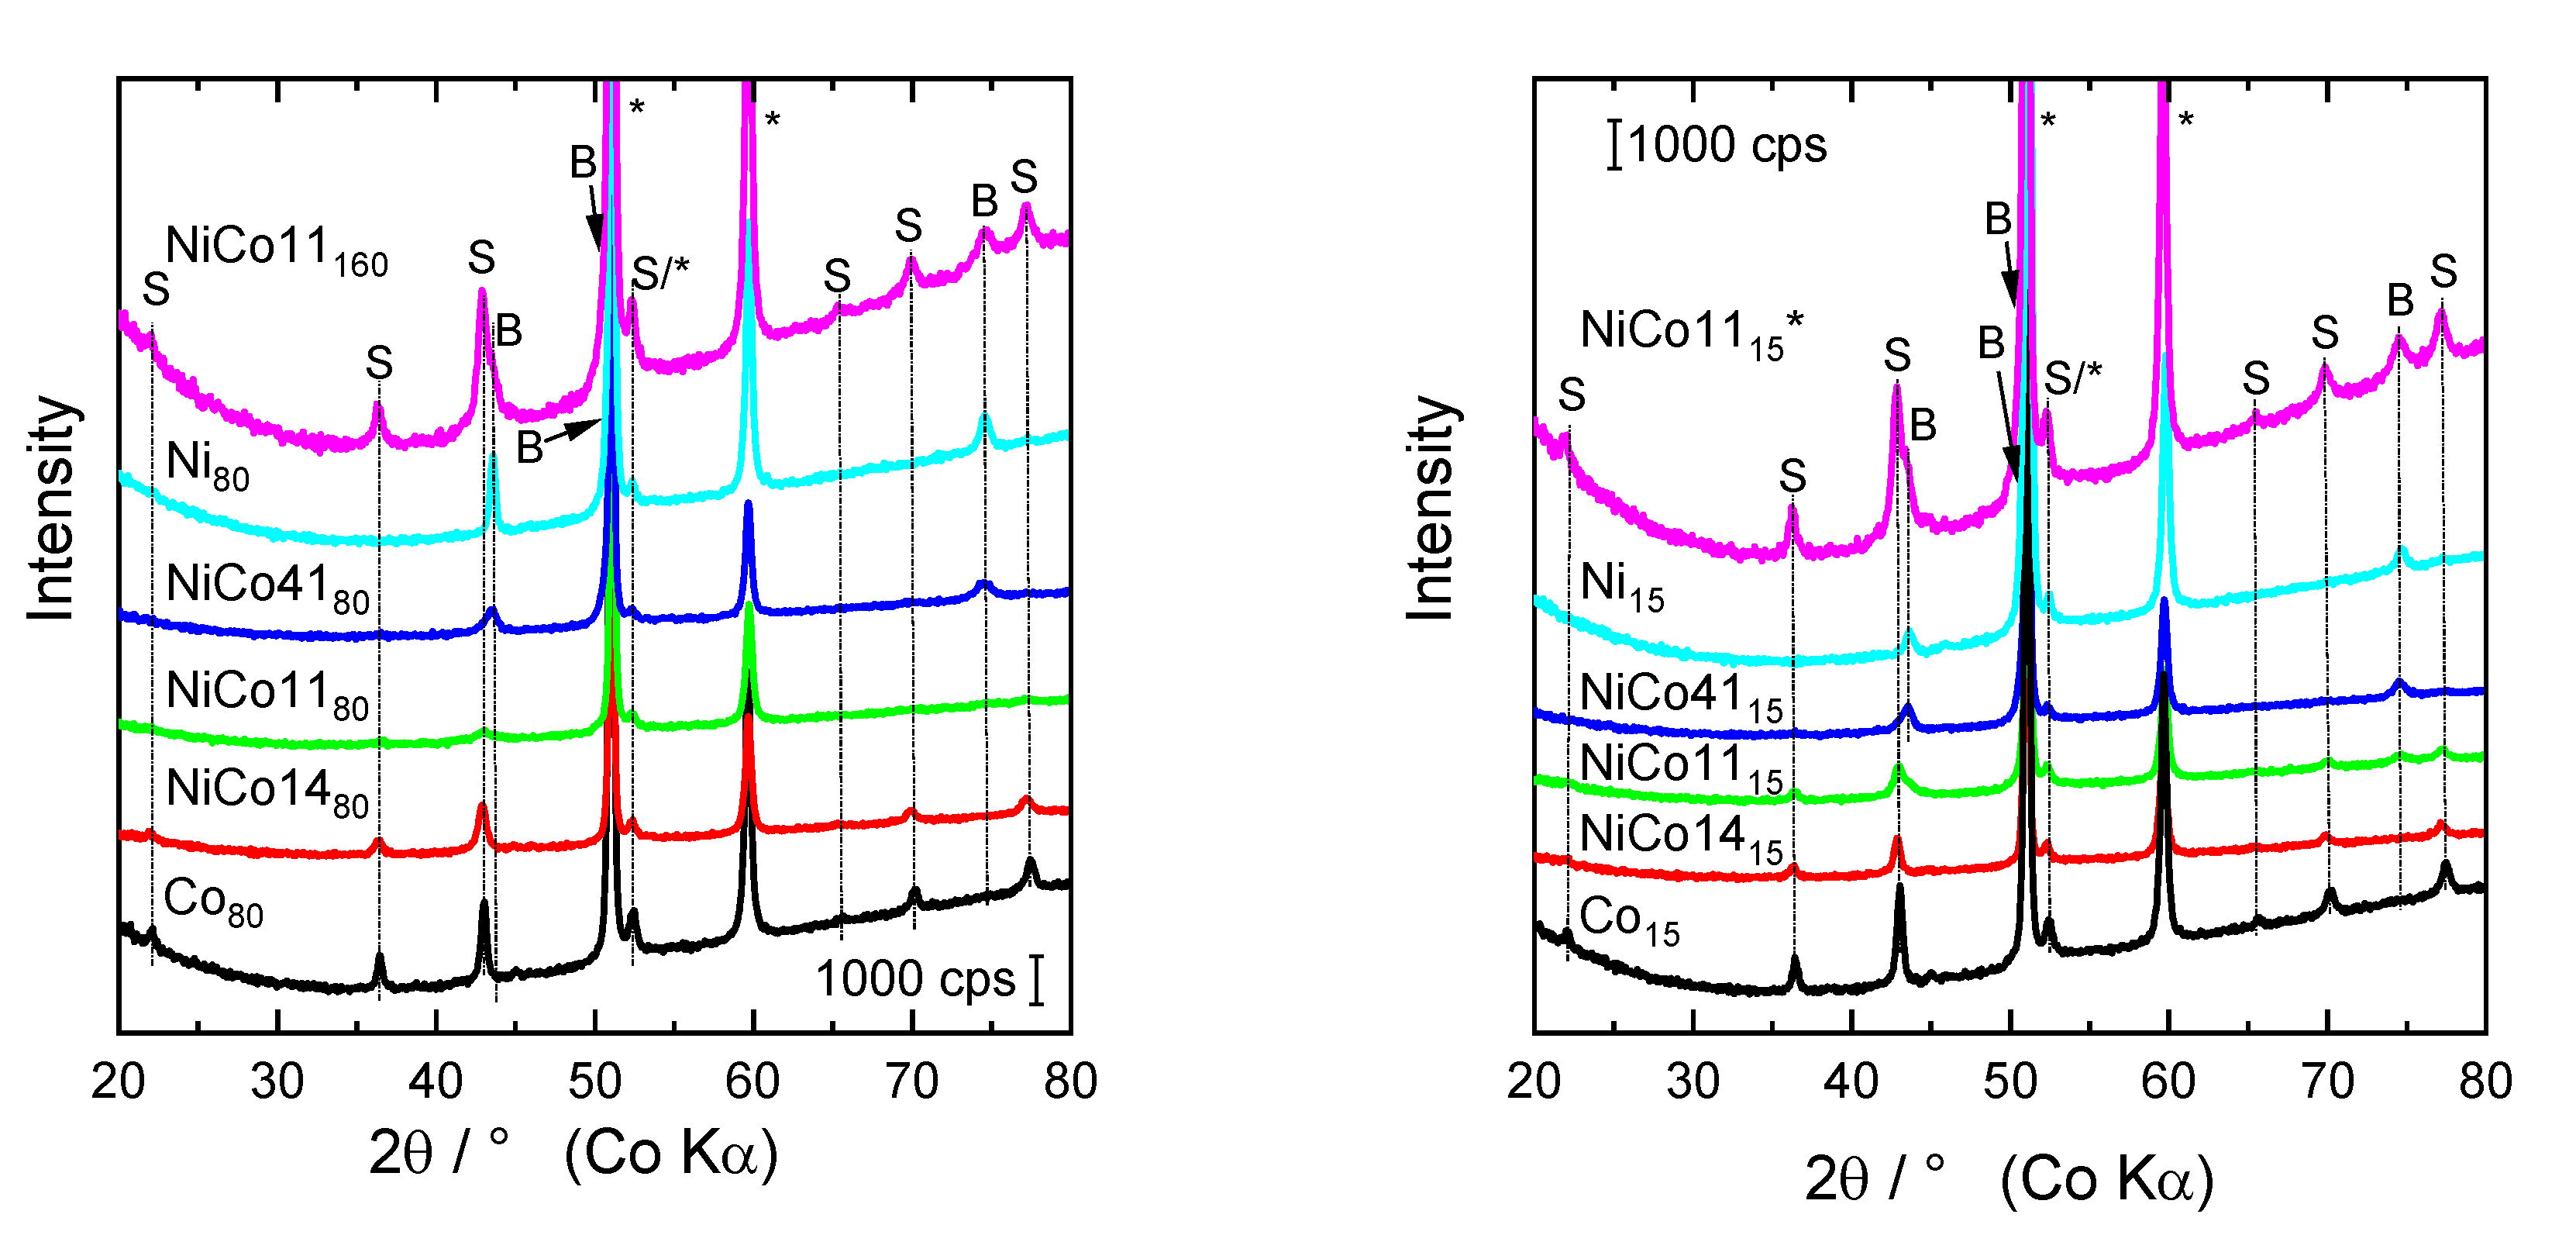
2.3. Powder X-ray Diffraction

Powder XRD patterns of catalysts prepared using hollow cathode plasma jet sputtering in the oxidation Ar+O2 atmosphere and calcined at 500 °C in air are shown in Figure 2. The most intensive diffraction lines observed in powder XRD patterns of all catalysts at 51.0° and 59.7° 2θ corresponded to iron (PDF 04–014–0264) or various iron-containing alloys such as Fe0.65Cr0.1Ni0.25 (PDF 04–019–2390) and were ascribed to the stainless-steel support. The Ni15 and Ni80 catalysts showed diffraction peaks characteristic of NiO (bunsenite) at approximately 43.6 and 74.7° 2θ (PDF 04–005–4472); the most intensive NiO diffraction line at approximately 50.6° 2θ coincided with that of the stainless-steel support. Powder XRD patterns of the Co15 and Co80 catalysts contained diffraction peaks at 22.1, 36.4, 43.1, 52.4, 65.6, 70.2, and 77.5° 2θ, corresponding to Co3O4 with a spinel structure (PDF 04–014–7752).
In the catalysts combining Ni and Co active components, both NiO-like and spinel-type mixed oxides (e.g., Co3O4, Ni0.82Co2.18O4, and NiCo2O4) were revealed. Their relative content and lattice parameters were dependent on the Ni:Co molar ratio in the deposited oxides (Table 2). The catalysts with low Ni content prepared at 15 Pa (NiCo1415 and NiCo1115) contained only spinel-like NiCo2O4 (PDF 04–013–0797), whereas the NiCo4115 with high Ni content showed only relatively low and broad diffraction peaks corresponding to NiO. The NiCo1115* catalyst prepared using a longer deposition time, which led to an increased amount of deposited oxides, contained NiO and Ni-Co spinel. The catalysts prepared at a higher working pressure (80 Pa) contained analogous crystalline phases to those of samples prepared at 15 Pa; a small amount of Ni-Co spinel was also identified in the NiCo4180 sample. The catalysts prepared under a deposition pressure of 160 Pa (NiCo11160 sample) with a longer deposition time (NiCo1115* sample) showed more intensive diffraction peaks compared to other samples due to higher content of deposited oxides. Both these samples contained Ni-Co spinel, together with NiO.
Lattice parameters of the oxide phases present in the catalysts were evaluated according to their powder XRD patterns (Table 2). The NiO and spinel lattice parameters were calculated as the average value of all identified diffraction peaks. The NiO-like phase in the Ni-Co samples showed lattice parameters ranging from 4.171 to 4.181 Å. Fedorov et al. [24] reported a lattice parameter of 4.173 Å for nickel oxide on alumina. The slightly larger values found in the NiCo4115 and NiCo4180 samples could be explained by the partial incorporation of larger cobalt cations into the NiO lattice (Co+ and Ni2+ ionic radii of 0.72 and 0.69 Å, respectively). Analogously, the changes in the spinel lattice parameters from 8.104 to 8.129 Å were likely connected with various contents of Ni and Co cations in the Ni-Co mixed oxides.
The mean coherence lengths evaluated according to powder XRD data reflected the ordering of the structure of the crystalline oxide phases and can be considered as approximate crystallite sizes. The values were calculated based on the integral width (Bobs) of the diffraction lines determined by HighScore Plus software once the powder XRD patterns were subjected to standard profile fitting. The next step involved calculating the crystallite sizes using the Scherrer equation, taking into account the integral width values of each diffraction peak. The largest spinel crystallite size (24.2 nm) was found for the NiCo1480 sample, and the smallest crystallite size (11.4 nm) was associated with the NiCo4180 catalyst (Table 2). Structure ordering of the spinel-type Ni-Co mixed oxides, reflecting their calculated crystallite sizes, could be affected by the interaction between NiO and Co3O4 arising during plasma jet sputtering and following calcination, resulting in mixed oxide formation. This interaction could also explain the observed slight change in the spinel lattice parameters. On the contrary, differences in the crystallite size of the NiO-like phase were not so significant.

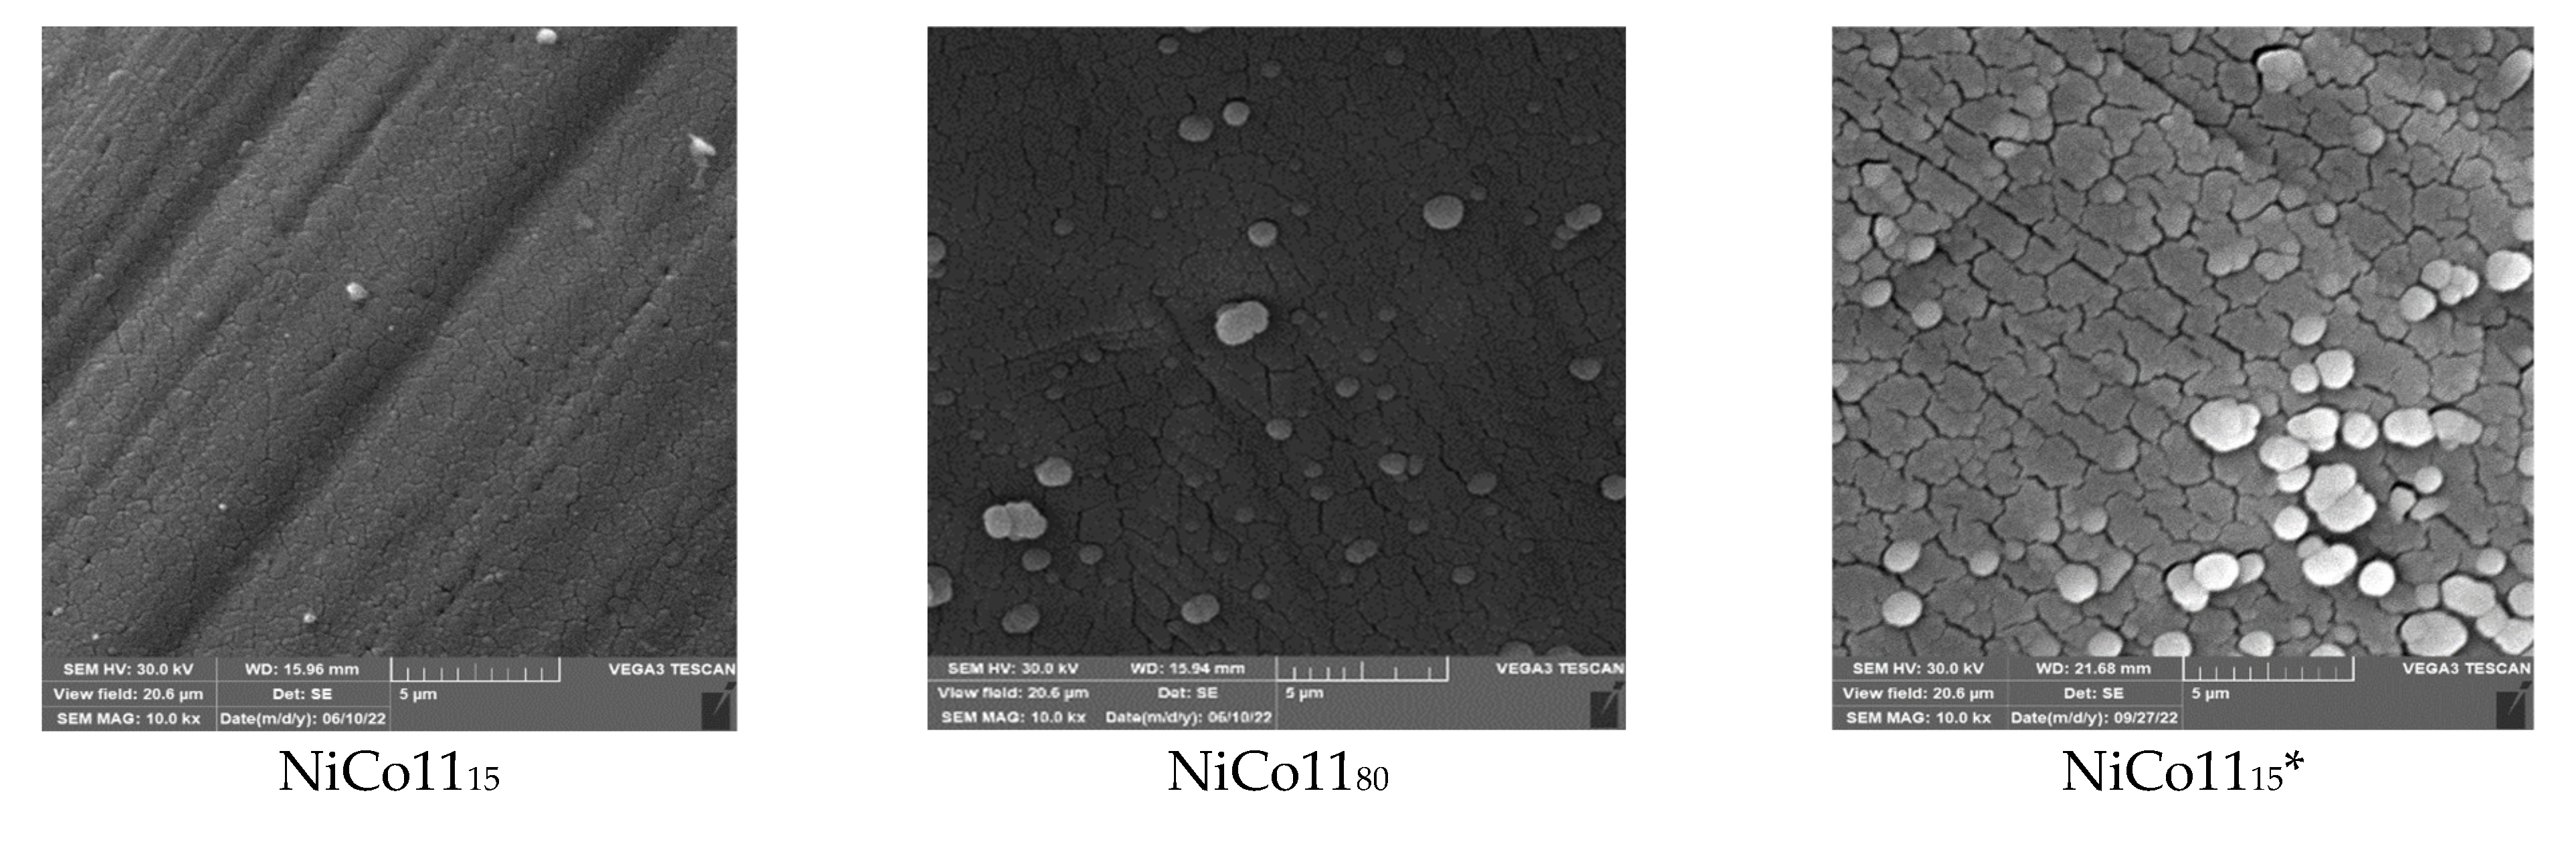
2.4. Surface Morphology and Textural Properties

SEM images of the meshes with deposited NiCo11 oxide layers prepared using the gas pressure of 15 and 80 Pa are shown in Figure 3. These two samples were compared with NiCo1115* also prepared under 15 Pa but with three times longer deposition time than the NiCo1115 catalyst. The appearance of oxide particles in the samples was very similar; in the case of the NiCo1115 catalyst, the small clusters of oxides were connected with even smaller particles, forming a homogeneous layer covering the mesh. Using a higher working pressure (80 Pa) to prepare the NiCo1180 catalyst of identical composition, the larger particles formed a thicker layer, which indicated a tendency to crack. Such a process is more distinguishable at in the image of the NiCo1115* catalyst. A detailed SEM image of this sample shows a cracked oxide layer due to the increased thickness. There were small, almost spherical particles on the oxide layer covering the surface of the mesh, which seem to have led to the formation of a new oxide layer.
Figure 3 (bottom) shows images of the two NiCo14 catalysts prepared at 15 and 80 Pa and of the NiCo11160 catalyst, which was prepared at a working pressure of 160 Pa. On the surface of the NiCo1415 catalyst, significantly larger particles can be clearly distinguished compared to the NiCo1180 catalyst. Finally, the surface of the NiCo11160 catalyst is similar to that of the NiCo1115* catalyst.
The difference in the size of the deposited particles shown in Figure 3 was reflected in their textural properties (Table 3). The surface area of oxides deposited on the meshes varied from 2.2 to 10.0 m2 goxide−1. The lowest surface area was associated with the single-component Co and Ni catalysts prepared at both deposition pressures, whereas the catalysts prepared with the Ni-Co alloys as hollow cathode material showed the highest values. An approximately linear dependence of the absolute value of the surface area on the amount of oxides deposited on the meshes was found.

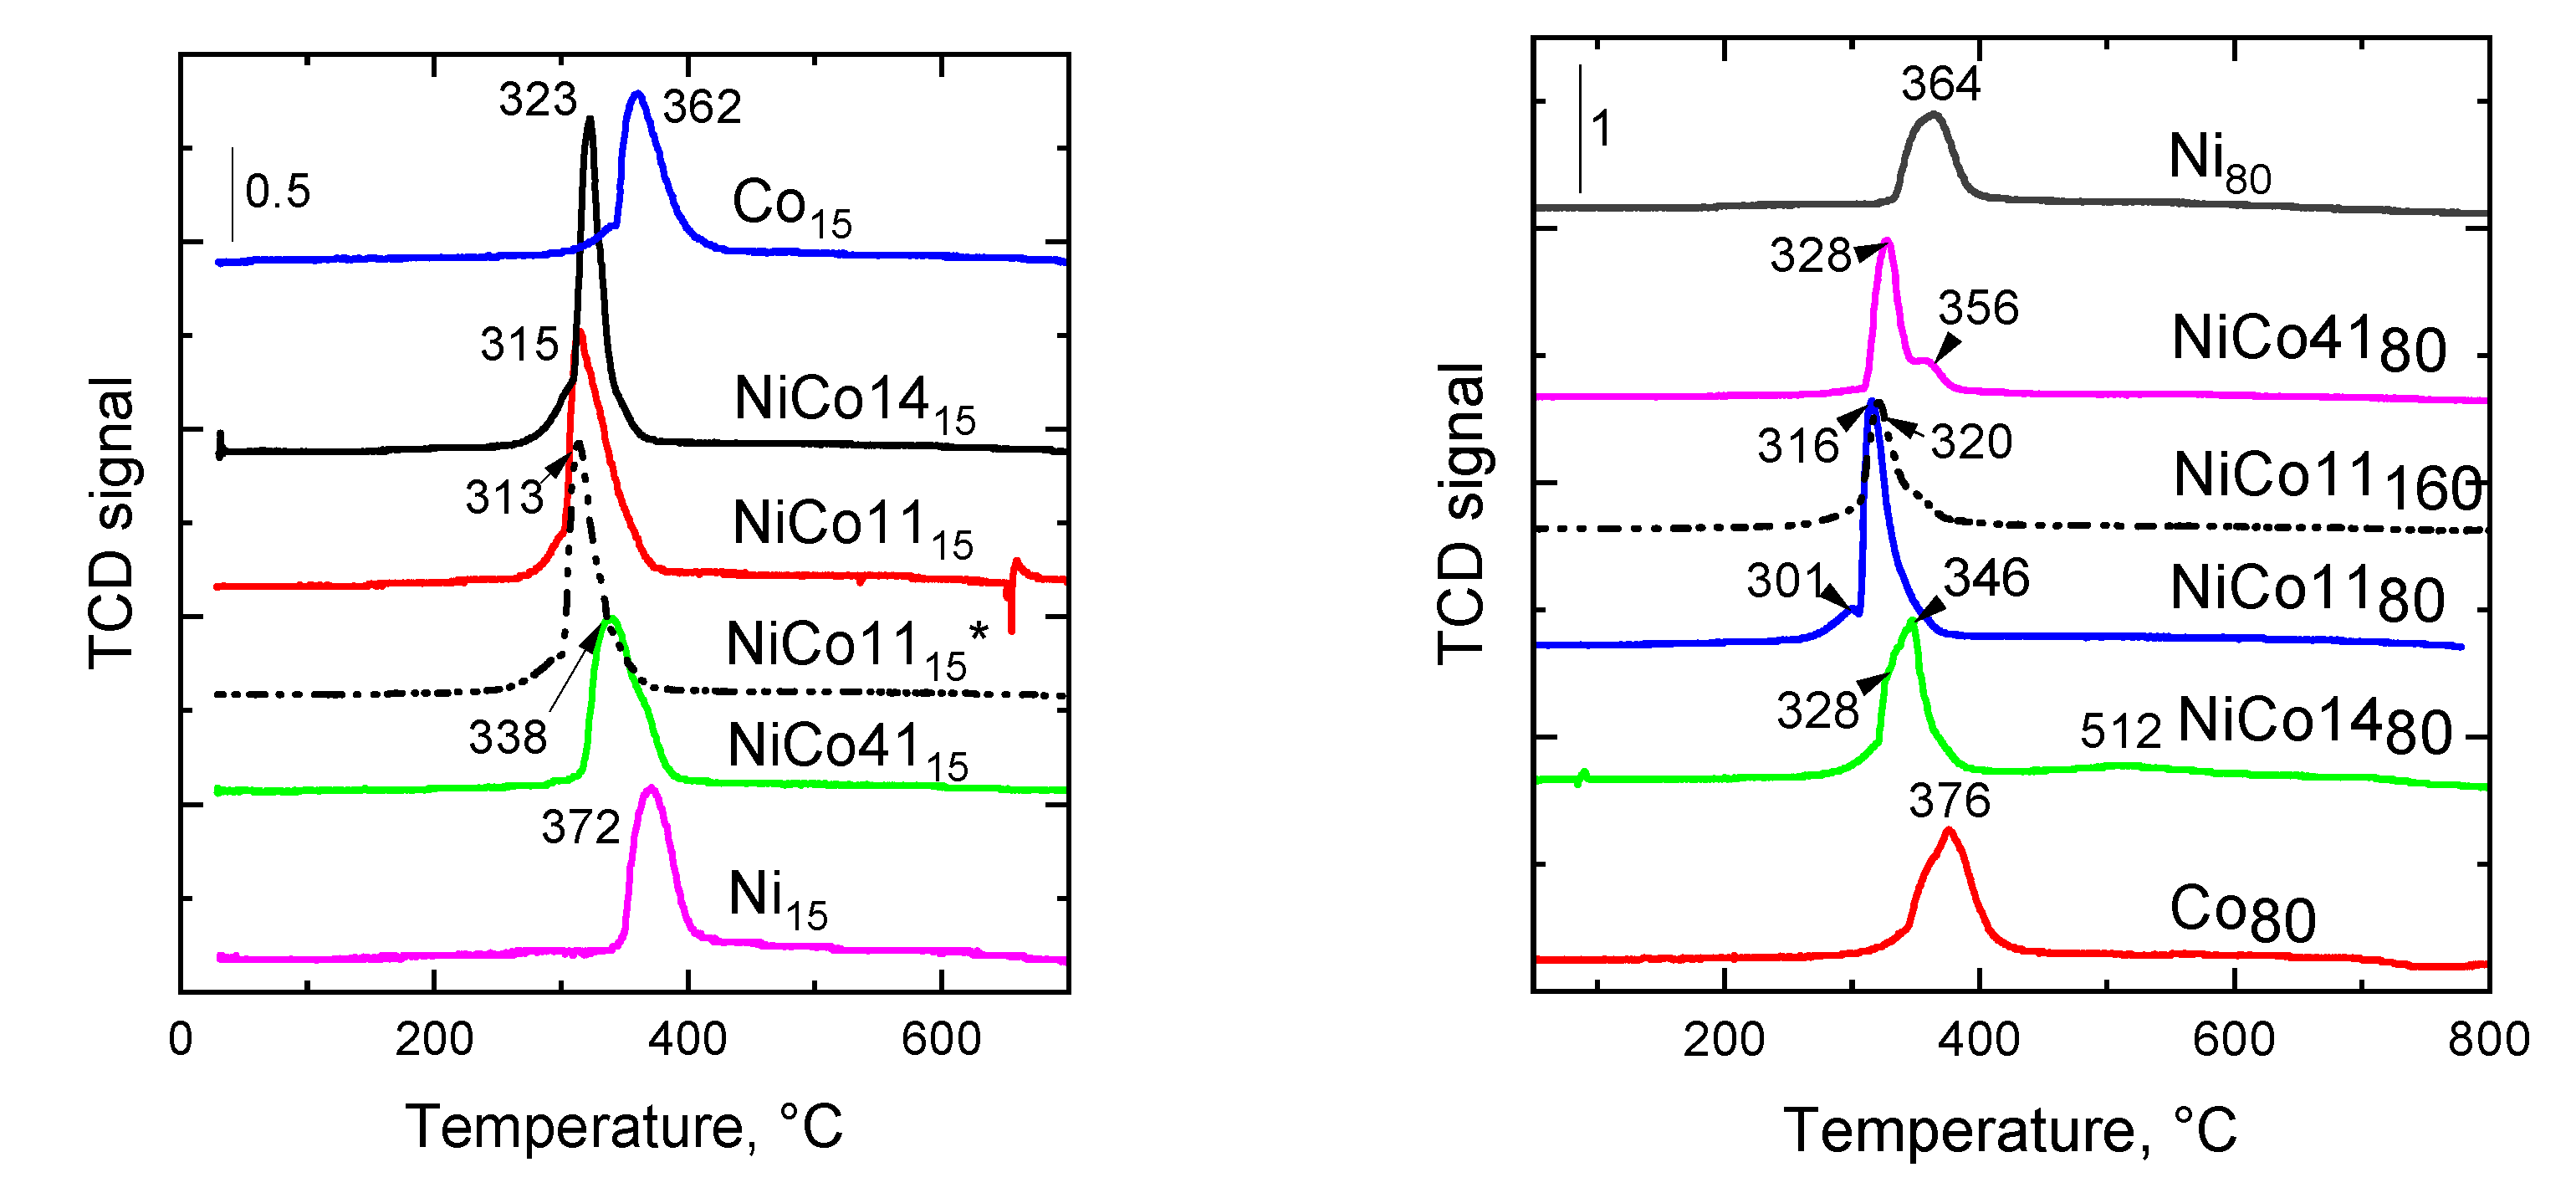
2.5. Temperature-Programmed Reduction
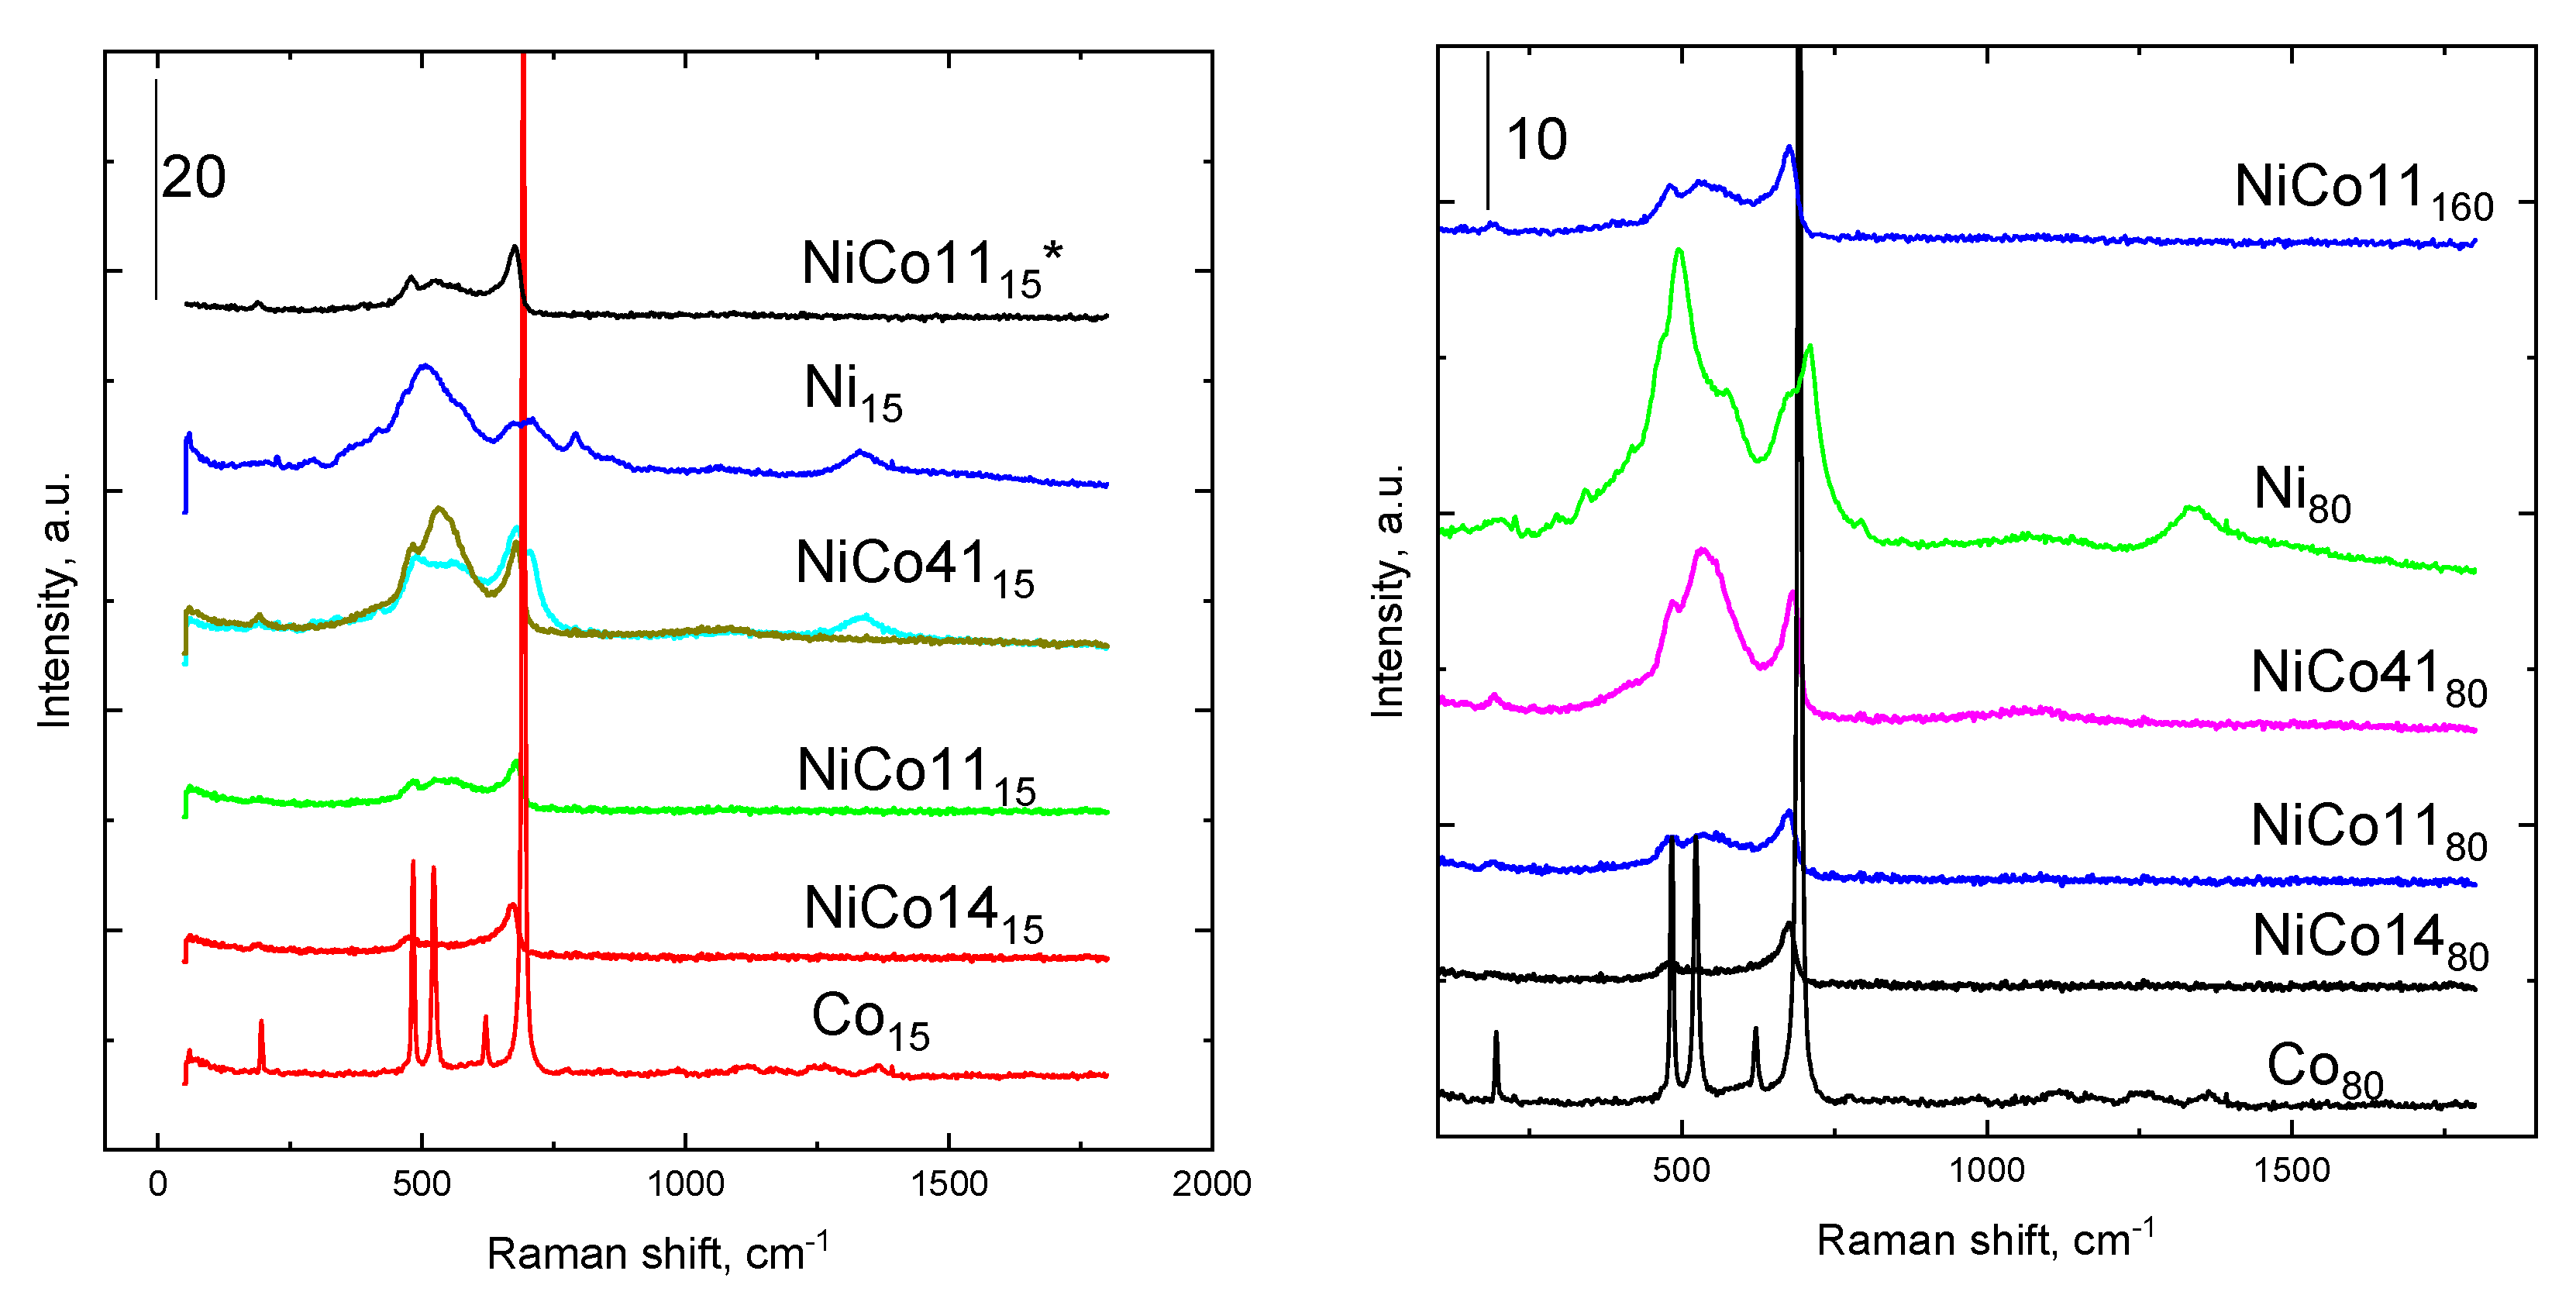
The reduction properties of the catalysts were investigated using H2 temperature-programmed reduction. The maximum in the profiles corresponds to the maximum of the reduction rate, and the shift of the position of temperature maximum indicates a change in the metal–oxygen bond strength [25]. The TPR profiles (Figure 4) reflect the differing contents of Ni and Co in the catalysts. The single-component Co catalyst prepared at 15 Pa showed one main reduction peak with Tmax 362 °C, similarly to our previously published results [26]. This peak was attributed to the unresolved reduction of Co3+ to Co2+ and Co2+ to Co0 [25,27]. The reduction profile of the single-component Ni catalyst also showed one unresolved peak with maximum at 372 °C. According to Richardson et al. [28], the nickel oxide reduction mechanism includes direct Ni0 and H2O formation. Thus, the higher reduction temperature maximum of the Ni oxide-based catalyst shows poorer reducibility than the Co-based catalyst. Garces et al. [29] observed the same behavior.
Numerous studies on Ni-Co mixed oxide reduction by the H2-TPR method have been reported. For example, Goncalves et al. [30] found that the reduction of Ni-Co oxides supported on alumina depends on the molar ratio of Ni:Co and that the reduction of Ni-Co oxide particles was easier than the reduction of Ni and Co oxides alone. As shown in Figure 4, the TPR profiles of the examined Ni-Co catalysts sputtered at 15 Pa changed depending on the phase composition. The Ni-Co mixed oxides were reduced at lower temperatures of between 315 and 338 °C. Their reduction peaks were sharp; only the profile of NiCo4115 showed enlargement towards higher temperatures, indicating possible reduction of another phase—probably NiO—which was identified in the catalyst by XRD (Figure 2).
The catalysts prepared at 80 Pa exhibited a very similar course of reduction as those prepared at 15 Pa, with a slight shift to higher temperatures with an increasing amount of cobalt in the catalysts. The reduction of the binary Ni-Co oxide catalysts showed an indication of peak splitting into two parts, which may involve either the reduction of several different components present in the catalysts or the reduction of particles of different sizes.

2.6. Raman Spectra

The Raman spectra of all catalysts (Figure 5) exhibited an intense band at 674 cm−1, which corresponds to the presence of Co3O4 [31,32], and a band at 484 cm−1 that can be ascribed to the first-order transverse optical phonon mode of NiO [33,34]. The spectra of NiCo4115 and NiCo4180 catalysts featured an intense Raman band at 530 cm−1, corresponding to the first-order longitudinal optical vibrational mode of NiO [33,34]. This vibration was also present as a broad, weak band in the spectra of the NiCo1115 and NiCo1180 catalysts but less pronounced in the spectra of the NiCo1415 and NiCo1480 catalysts. The broad band at 1090 cm−1 in the spectra of the NiCo4115 and NiCo4180 catalysts, together with the shoulder at 706 cm−1 in the spectrum of the NiCo4115 catalyst, can be attributed to the combination of transverse and longitudinal second-order optical vibrational modes of NiO [35]. Finally, the band at 193 cm−1, which is particularly pronounced in the spectra of the NiCo4115 and NiCo4180 catalysts, can be attributed to the tetrahedral sites of Co3O4 [4].
There is a significant difference in the width and intensity of the bands. The broadening of the peaks and shifts in the positions of the peak maxima compared to the Co3O4 spectrum indicate the formation of Ni-Co spinel, which is consistent with the results of XRD measurements.
As the intensity is also connected with the size of particles [35], we can conclude that the binary Ni-Co oxide catalysts contain smaller particles than the single-component Ni and Co catalysts. According to the Raman spectra, the smallest particles were revealed in the NiCo1480 catalyst.

2.7. Surface Composition of the Catalysts

XPS measurements were used to determine the surface composition of the catalysts (Figure S1). XPS results corresponding to the binding energies (BE) of several core levels (C 1s, Ni 2p, Co 2p, and O 1s), surface molar fractions of each element, and atomic ratios obtained for the examined catalysts are summarized in Table 4. No iron signal was detected in any of the spectra of the examined samples.
XPS measurements were complicated by the fact that the samples were in the form of meshes. The signal of the measured carbon largely originated from the underlying carbon tape, which was easily accessible through the mesh. This large excess of carbon originating from the carbon tape led to increased uncertainty upon carbon calibration (setting the main peak position to 284.8 eV), as the carbon on the surface of the mesh may have a spectrum slightly differently shifted than the spectrum from the carbon tape. Binding energies of approximately 287 and 288 eV were observed in the carbon spectrum, which are usually assigned to C−O and C=O bonds.
Binding energies of Ni and Co in the catalysts were observed at 853.7 and 855.2 eV (main lines for Ni 2p3/2) and at 779.5 and 781.0 eV (main lines for Co 2p3/2), respectively, which are typical for the oxidation states of Ni2+ and Co3+/Co2+. For some samples, the binding energy of Ni 2p3/2 was shifted towards higher energies than those reported in the literature [36] for NiO. This may indicate the presence of Ni hydroxide, as its peak could be found at higher energy levels than the oxide peak (approximately 854.6 eV). Because the spectra have a similar shape to that of NiO, the shift was probably due to the formation of OH groups on the surface after exposure to air. The Ni and Co concentrations did not correspond to the expected composition of NiCo1115 and NiCo1180 catalysts. Remeasurement of these samples showed the same spectra for Co and Ni. The ratios of the Ni and Co surface and bulk concentrations are presented in Table 4. A comparison of these quantities with EDX analysis showed that the surface of the catalysts was enriched with Ni. For both NiCo1415 and NiCo1480 catalysts, the surface concentration of nickel was found to be 1.5 times higher than the bulk concentration. This ratio decreased to 1.1 with increasing nickel content in the catalysts.
The oxidation state of Co and Ni in the catalysts was determined by deconvolution of the XPS spectra. Deconvolution of the Ni 2p spectra of all catalysts (Figure S1) showed no difference between the spectra (except for the intensity of the peaks). The results (Table 5) led to the conclusion that Ni was present only in the form of NiO, which was confirmed by the structure of the Ni 2p3/2 line fitted by two nearby peaks and a satellite contribution. The determined NiO position (853.7 eV) is consistent with the reported literature data [36].
However, it is not possible to distinguish between NiO and Ni-containing oxide with a cubic spinel structure (e.g., NiFe2O4), as demonstrated by Biesinger et al. [37]. The similarity of spectra was also demonstrated between Ni(OH)2 and spinels with a tetragonal structure, such as NiCr2O4. According to our data, the Ni 2p spectrum resembles that of NiO and/or cubic spinel for the NiCo4115 and NiCo4180 samples. On the other hand, the spectra of NiCo14 catalysts more closely resemble those of Ni(OH)2 and/or tetragonal spinel. XRD measurements confirm the difference in the composition of crystalline phases between the two samples (Table 2). XRD measurements revealed the presence of Ni-Co spinel in NiCo1480 and NiCo1180 catalysts, with the closest match from the PDF database with NiCo2O4.
Cobalt can occur as Co2+ or Co3+ in catalysts, as Co2+ species can also be partially oxidized to Co3+ species. Co2p spectral deconvolution revealed the presence of both Co2+ and Co3+; the Co3+/Co2+ ratio varied from 0.85 to 1.35 (Table 5). The observed position of the most intense Co 2p3/2 line corresponded to the position of Co3O4. The structure of the satellite peaks observed at 940 and 943 eV also confirmed the presence of Co3O4. The average values of binding energies of the Co 2p3/2 published in the literature are 780.17, 780.39, and 779.90 eV for Co3O4, CoO, and Co2O3, respectively [36]. The oxidation state of cobalt changed only slightly with catalyst composition (Figure S1). In some catalysts, the Co3+ oxidation state was slightly predominant (Table 5)—more frequently in the catalysts prepared at 80 Pa.
To confirm the abovementioned findings, LMM spectra (Figure S2) were measured, which are more sensitive to changes in Ni and Co oxidation states and bonding. The spectra of NiCo11 and NiCo41 samples were equally interleaved so that the samples had the same oxidation state of Ni corresponding to NiO. NiCo1415 and NiCo1480 samples had a slightly different spectral shape corresponding to Ni(OH)2, which appears to occur on the catalyst surface after exposure to air.
The deconvolution of oxygen spectra of the samples is shown in Figure S3 and summarized in Table 5. There are three peaks in the spectra, with binding energies of 529.1–529.3, 530.6–530.9, and 532.0–532.7eV. Oxygen at 529.2 eV corresponds to metal oxides. Atomically, the concentration of this oxygen is equal to the sum of the concentrations of Co and Ni. Biesinger et al. [37] identified oxygen at 531eV as defect sites, adsorbed oxygen, and hydroxides, with most emphasis on the defect sites. According to [37], the binding energy of oxygen in NiO is 529.3 eV and that in CoO is 529.8 eV. Oxygen at 531 eV in the deconvoluted spectra corresponded to C=O bonds or to oxygen bound to metal as O or OH. The other oxygen appeared at position 533 eV, corresponding to C-O bonds. About one-third to one-half of oxygen may originate from the carbon tape and other carbon impurities. The 532.8eV peak was determined as adsorbed H2O or O2. The first peak at 529.2eV is not sufficient to satisfy the oxygen demand for Co and Ni; therefore, some of the oxygen from the second peak must be bound to the metal. However, the sum of the first and second peaks would probably result in excessive oxygen. Therefore, it follows that the second peak contributes only partially to the metal-bound oxygen, with the remainder probably occurring in the form of a hydroxyl group. However, some defects may also shift the oxygen binding energy.

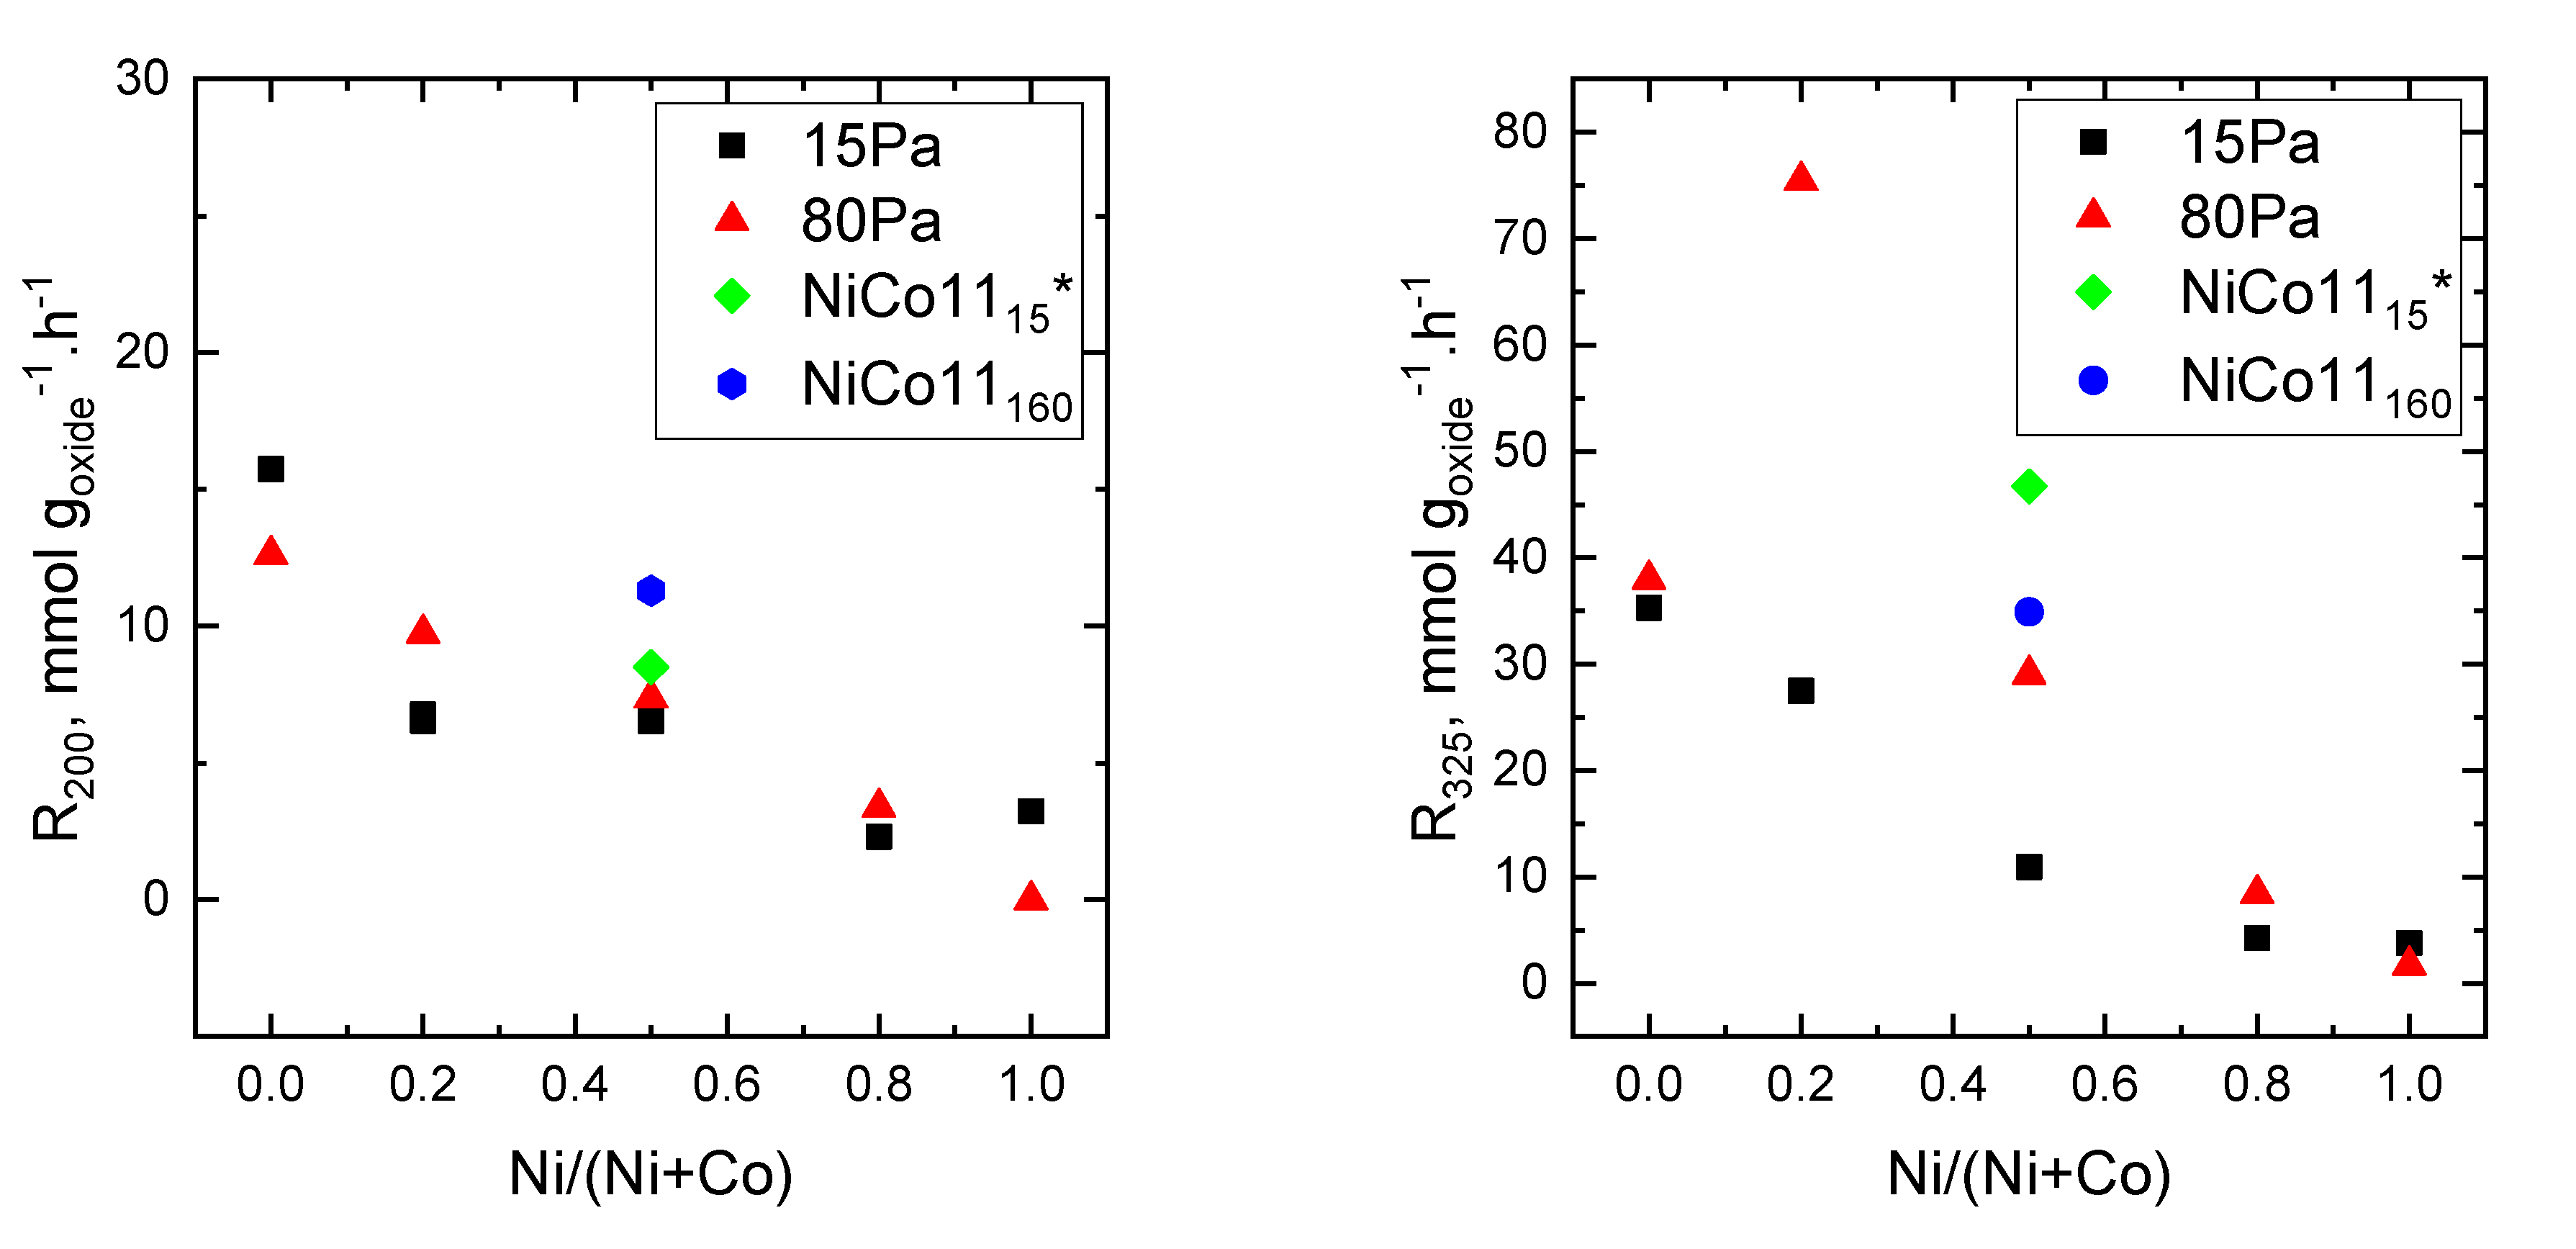
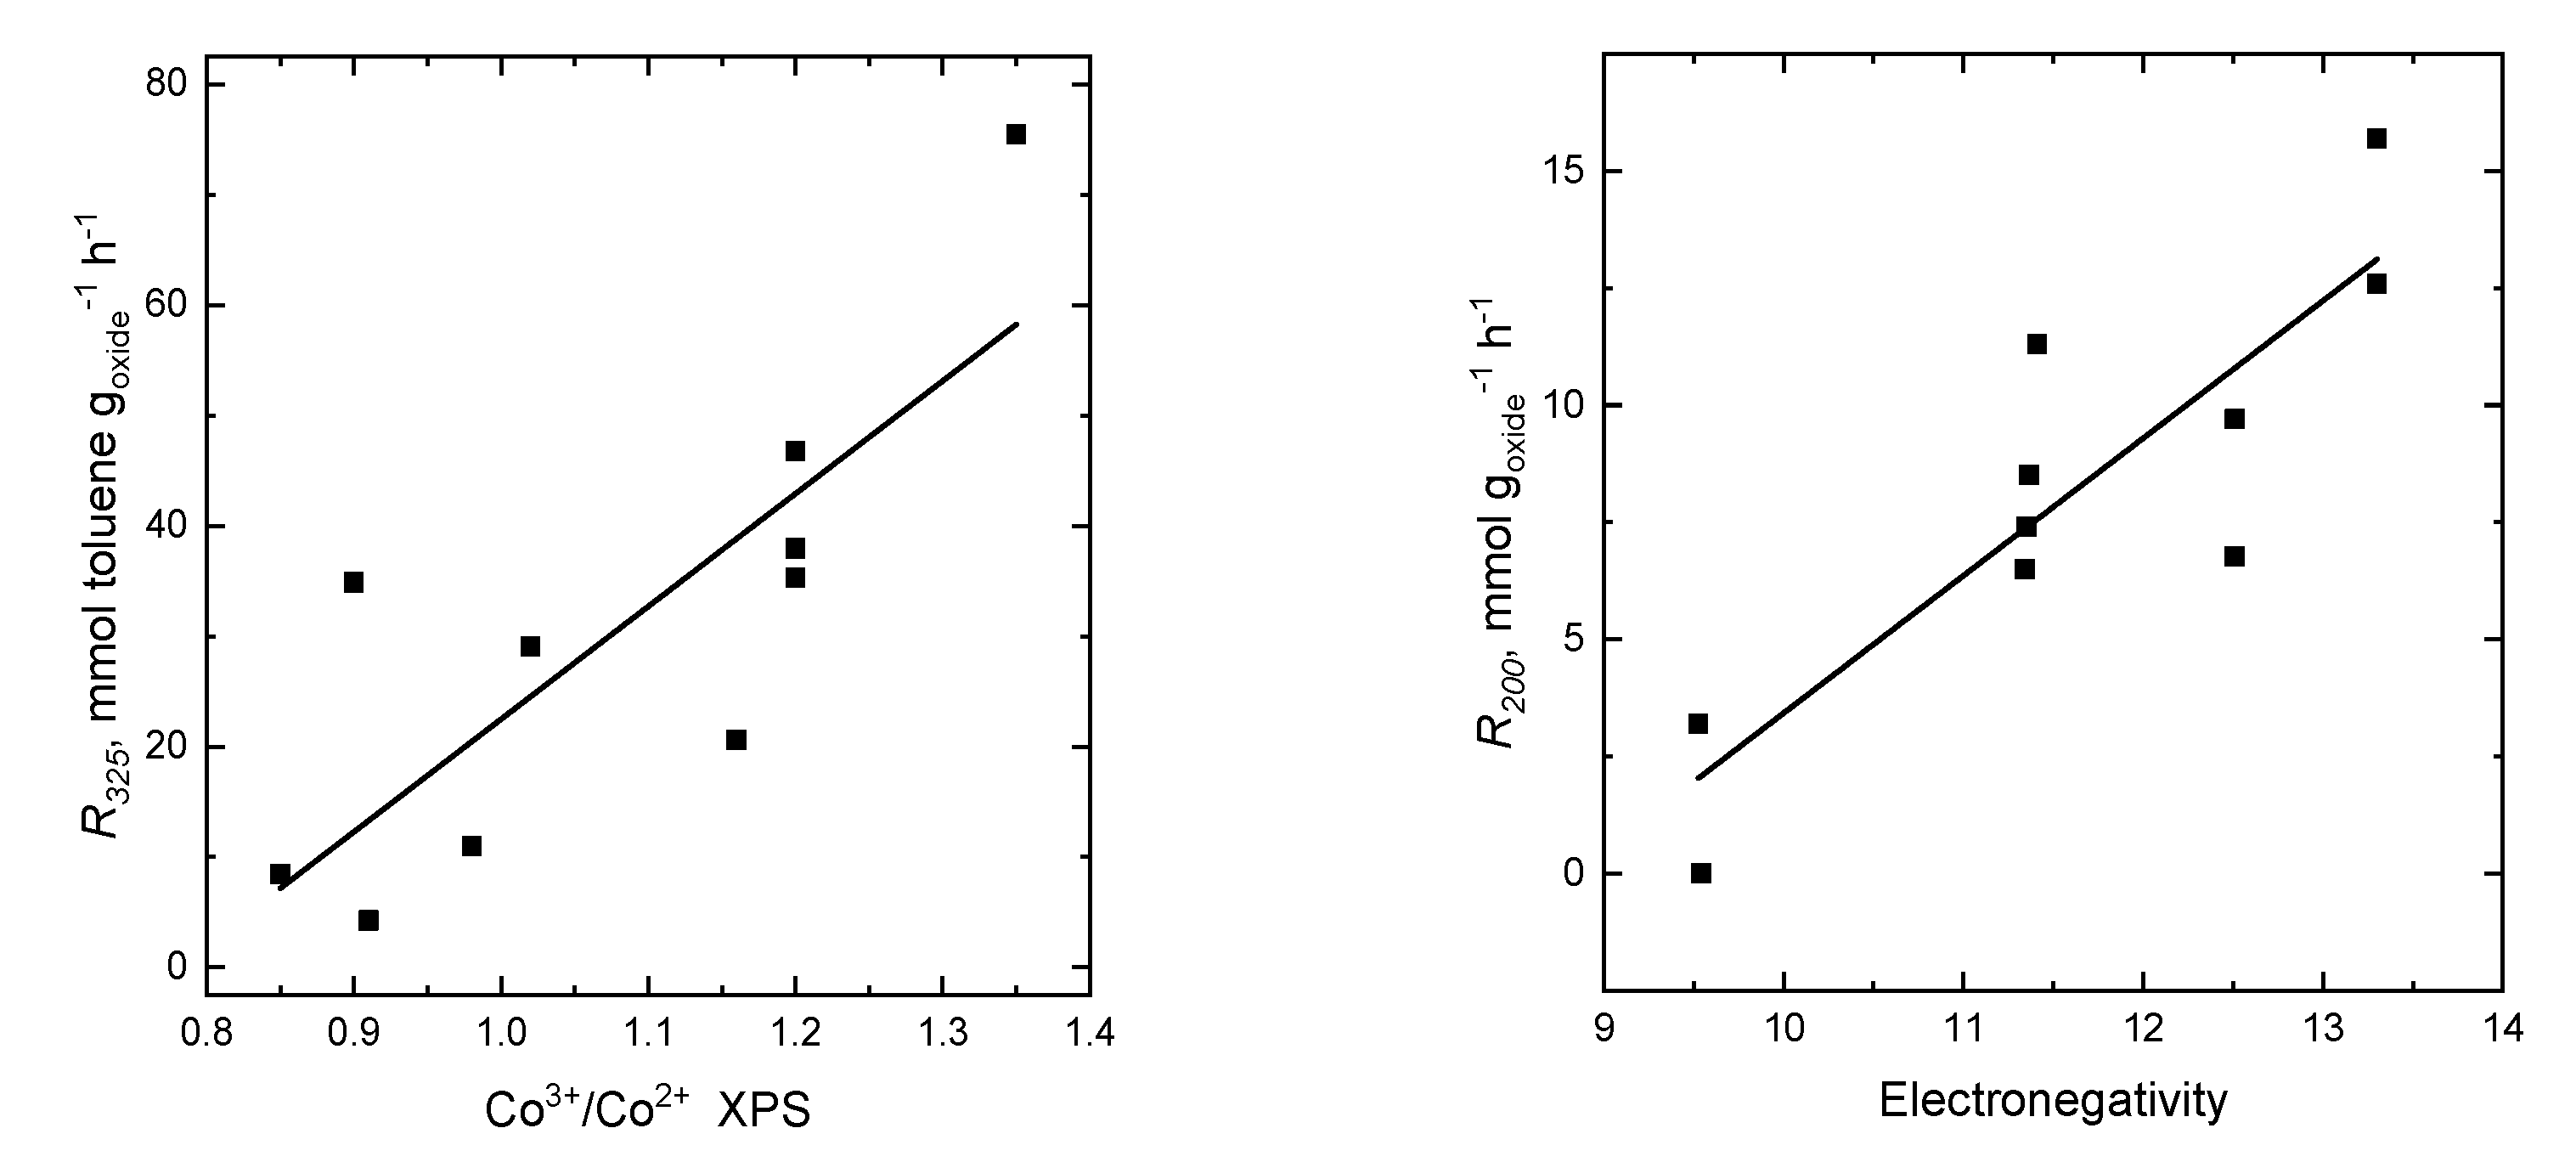
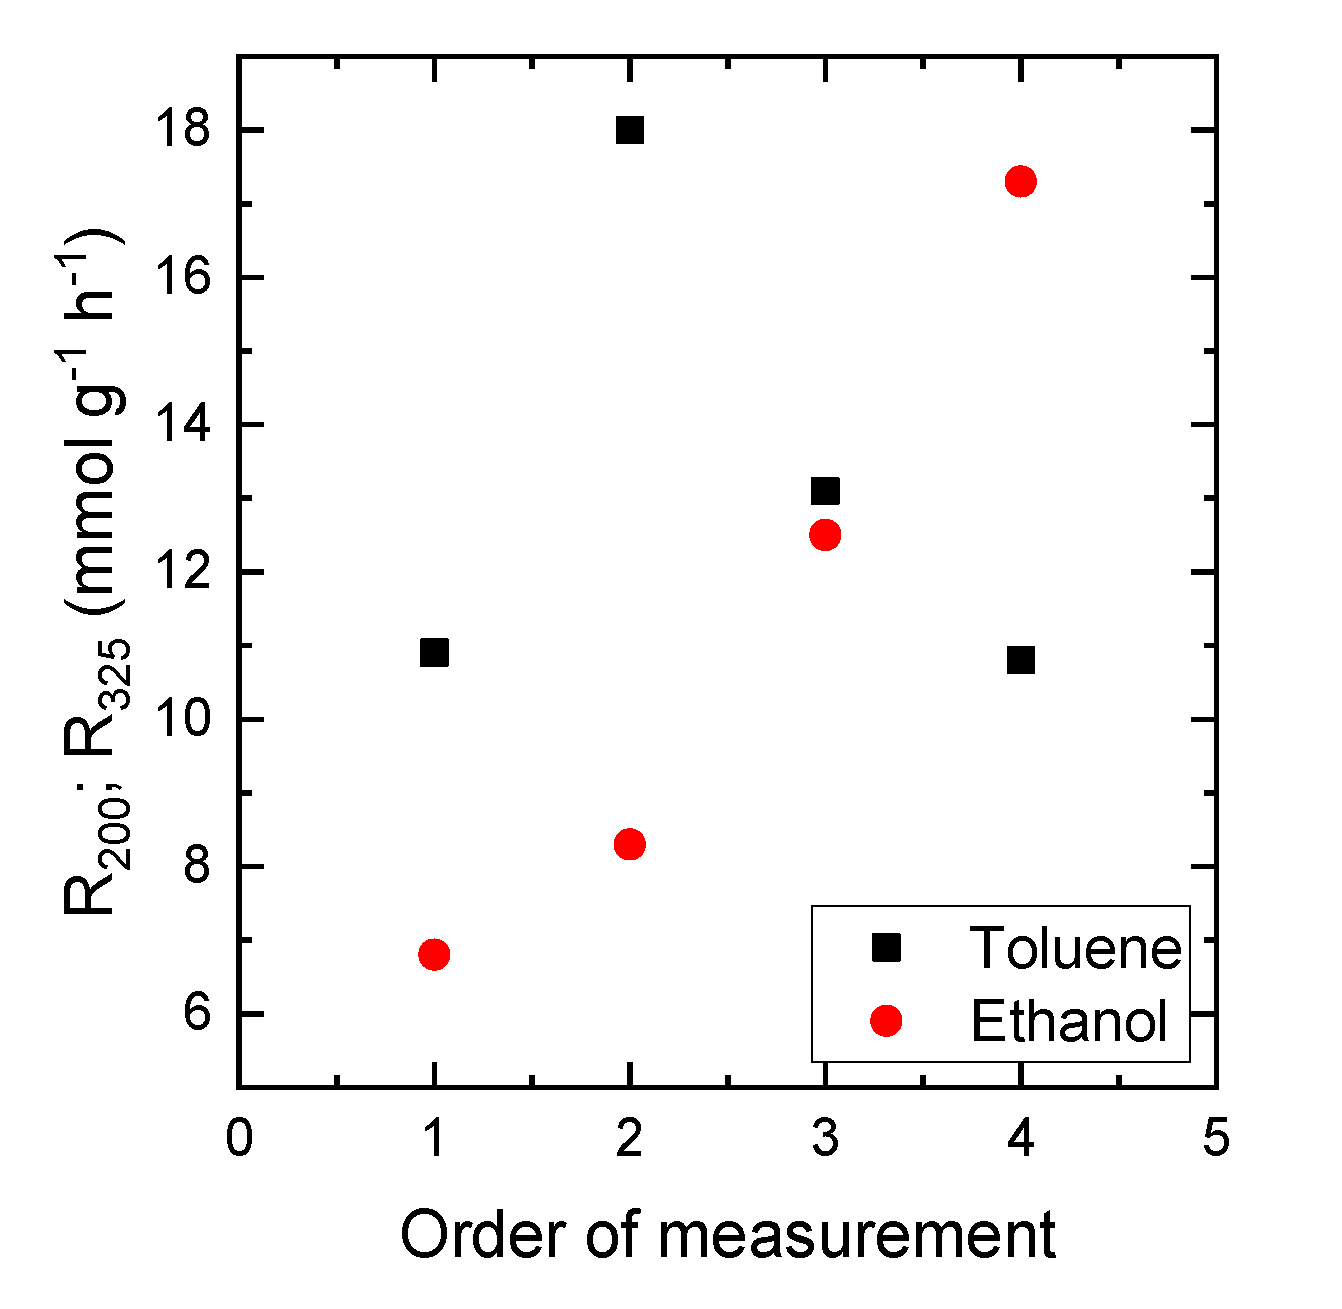
2.8. Catalytic Activity

The objective of this study was to determine the effect of the preparation conditions of plasma jet sputtering and Ni:Co molar ratio in the oxide catalysts on their catalytic activity in the total oxidation of ethanol and toluene. The light-off curves of ethanol and toluene oxidation are shown in Figure S4. It can be seen that for ethanol oxidation, the conversion curves of the catalysts prepared at 15 and 80 Pa are very similar; the NiCo1115* and NiCo11160 catalysts are the most active, and single-component Ni15 and Ni80 catalysts are the least active. A similar trend was observed for the oxidation of toluene.
At first, the activity of the catalysts was evaluated according to the T50 temperature (the temperature at which the conversion of the reactant reaches 50%), which is a frequently used parameter in this field of catalysis. The T50 values obtained in the oxidation of ethanol and toluene as a function of the Ni/(Ni+Co) molar ratio are summarized in Table 6. According to the T50 values, the composition of catalysts did not considerably affect their activity in either reaction, which could indicate that the T50 parameter is not very sensitive to changes in the catalyst composition. The oxidation of toluene on Ni, Co, and Ni-Co oxides was more difficult than the oxidation of ethanol; the temperature required to achieve 50% conversion of toluene was approximately 80–100 °C higher. However, both single-component Ni catalysts (Ni15 and Ni80) needed the highest temperature to achieve 50% conversion of both reactants (ethanol and toluene).
The T90CO2 temperature, reflecting the temperature required to achieve 90% conversion of reactants to CO2, seems to be a more important parameter when evaluating the performance of catalysts designed for VOC total oxidation. The T90CO2 temperatures for the catalysts with different Ni:Co molar ratios are presented in Table 6. The values show that the catalysts with Ni/(Ni + Co) = 0.5 prepared at both 15 and 80 Pa have the lowest T90CO2 temperature. In the case of toluene oxidation, the minimum temperature was reached for the catalysts with the a Ni/(Ni + Co) ratio of 0.2–0.5.
The activity of the catalyst components in the oxidation of ethanol and toluene can be more accurately compared when specific reaction rates (moles of reactant converted per gram of active components per hour) are used, as the amount of oxides varied from catalyst to catalyst. The specific reaction rate (R) was calculated for two reaction temperatures because oxidation of toluene proceeded at higher temperatures than the oxidation of ethanol. Therefore, R200 was chosen for ethanol oxidation, and R325 was used for the oxidation of toluene. Figure 6 shows that in the series of catalysts prepared under identical conditions differing only in the value of the working pressure, both single-component Co catalysts were the most active, and both single-component Ni catalysts were the least active in the oxidation of ethanol. The activity of binary Ni-Co catalysts decreased with an increasing amount of Ni in the mixed oxides.
In the oxidation of toluene, a similar dependence of catalyst activity on molar Ni/(Ni + Co) ratio was found for the catalysts prepared at 15 Pa (Figure 6); the specific reaction rates decreased proportionally with an increasing amount of Ni in the catalysts. However, the catalysts prepared at 80 Pa showed quite different behavior. The NiCo1480 catalyst and the NiCo1115* and NiCo11160 catalysts prepared under slightly different conditions—either nearly three times longer deposition time (370 min) or substantially higher working pressure (160 Pa)—were significantly more active than the analogous catalysts prepared at 15 Pa. The value of R325 for toluene oxidation reached maximum for the NiCo1480 catalyst. It is worth mentioning that the dependence of the T90CO2 values on catalyst composition roughly corresponded to that revealed for the specific reaction rates.

3. Discussion

The plasma jet sputtering experiments showed that the amount of oxides deposited on the meshes from the hollow cathodes depends essentially on the deposition rate (Figure 1), defined as mg/kWh. Beyond the scope of this work, further research on the sputtering process from hollow cathodes is required. Plasma sputtering of metallic materials, especially alloys, is a very complex process involving the interaction of high-energy noble gas ions with ordered material composed of different atoms. For example, the hollow cathode alloy Ni50Co50 was used to deposit a thin film of oxides on the support with a higher deposition pressure of 160 Pa. The deposition rate was reduced by 20% compared to a deposition pressure of 80 Pa. Thus, it can be assumed that an increase in the deposition pressure leads to a lower deposition rate of thin films (normalized to energy consumed in the discharge). As shown in Table 7 and described in detail in the Experimental section, the cathode voltage at the hollow cathode is approximately -300 V for a pressure of 15 Pa, −350 V for a pressure of 80 Pa, and −320 V for a pressure of 160 Pa. Then, the sputtering yields (Y) of argon ions bombarding the surface of the hollow cathode with energies of 300 eV and 350 eV for pure Ni and Co metals are YNi300 = 0.74, YCo300 = 0.7, YNi350 = 0.84, and YCo350 = 0.79, respectively [38]. However, our experiments show that a higher sputtering rate (sputtering yield times of the ion flux at the hollow cathode surface given by the discharge current) in the case of higher deposition pressure does not yield the expected higher deposition rate (see Figure 1). This phenomenon can be explained by the fact that higher deposition pressure probably leads to more diffusive dispersion of the sputtered particles, which affects the number of sputtered particles that reach the mesh.
The physicochemical properties of the active components in sputtered catalysts prepared at two working pressures (15 and 80 Pa) differ in some cases. Increasing the amount of nickel in the deposited Ni-Co oxides led to the formation of various oxide phases (Ni-Co mixed oxides with a spinel structure and NiO-like oxides) in the calcined samples. The formation of Ni-Co mixed oxides was also confirmed by Raman spectroscopy. Their content in the catalysts varied depending on the molar ratio of Ni:Co.
In the H2-TPR experiments, all catalysts were reduced before reaching 500 °C (Figure 2). The Ni-Co catalysts exhibited lower Tmax temperatures than the single-component Ni and Co catalysts. The difference in Tmax values was greater for the catalysts containing more nickel. On the other hand, for the catalysts with higher Co content, a new reduction peak around 340 °C appeared, in addition to the main reduction peak at approximately 300 °C. The preparation of the sputtered catalysts with a higher amount of cobalt possibly resulted in the formation of smaller nickel–cobalt oxide particles, which were reduced at lower temperatures. This assumption is supported by the surface area values, which are the highest for the NiCo1480 and NiCo1180 catalysts. Smaller particles in these sputtered catalysts can be also seen in the SEM images (Figure 3), and the low intensity of the bands in the in Raman spectra of these catalysts also indicates the presence of small particles [35].
The XPS measurements proved the presence of Ni2+, Co2+, and Co3+ species on the catalyst surfaces. Surface and bulk Ni and Co concentrations slightly varied with Co content. Surprisingly, higher surface concentrations of Ni were found for the catalysts with higher Co content.
Because the activity of Co oxide in oxidation reactions is higher than that of Ni oxide [39], it can be expected that catalysts with higher Ni content in Ni-Co catalysts will exhibit lower values. This assumption was confirmed by the R200 values for ethanol oxidation over the catalysts prepared at 15 Pa and 80 Pa, which decrease with a decreasing amount of Co in the catalysts. In the case of toluene oxidation, similar dependence was found for the R325 values obtained over the catalysts prepared at 15 Pa. However, the activity of catalysts prepared at 80 Pa showed a completely different dependence on the molar ratio of Ni:Co, as it reached a maximum for the NiCo1480 catalyst (Figure 6). The explanation for this finding may lie in the different physicochemical properties of the samples. The XRD measurements revealed the presence of spinel-like Ni-Co components in the catalysts with a low Ni/(Ni+Co) molar ratio (≤ 0.5) prepared at a working pressure of 80 Pa (Table 2), and deconvolution of the Co 2p line of XPS spectra demonstrated the presence of Co3+ and Co2+ species in the catalysts (Figure S1 in, Table 5). Therefore, the high catalytic activity of NiCo1480 in toluene oxidation could be attributed to the higher content of Co3+ ions in the catalyst. A roughly proportional dependence of the R325 on the Co3+/Co2+ ratio was found for all sputtered catalysts prepared either at 80 or 15 Pa working pressure (Figure 7). The NiCo1480 catalyst with the highest Co3+/Co2+ ratio showed the highest activity in the oxidation of toluene. Therefore, it can be concluded that in the oxidation of toluene, the oxidation/reduction properties of the catalysts are important.
In the case of ethanol, such dependence of R200 on Co3+/Co2+ was not revealed, possibly because this reaction proceeds via another mechanism in which acid–base properties of catalysts are important. Therefore, electronegativity may be an important parameter for assessment of ethanol oxidation activity because acidity is related to the electronegativity of metal ions present in the mixed oxides of transition metals. There is a direct relationship between the acidity of binary metal oxides and their electronegativity. The electronegativity (X) of a binary oxide [40,41] can be calculated as an average of the two metal cations using Pauling’s scale of electronegativity of metals:
Xion = (1 + 2z) Xmetal
where z is the valence of the metal cation.
The electronegativity of Ni and Co mixed oxides was calculated according to the electronegativity of the corresponding metal ions (Xion) under the assumption of additive behavior of this property and using molar fractions of metal species as weights:
X= xNiXNi2+ + xCoXCo3+
In our calculations, we assumed that the valence of Ni is 2 and the valence of Co is 3 (although Co2+ is also present in the samples, as shown by XPS). The calculated values of electronegativity and their relation to catalytic activity in ethanol oxidation (R200) can be seen in Figure 8. Based on the dependence presented in Figure 8, it can be concluded that the activity of Ni-Co catalysts in the oxidation of ethanol is higher when their acidity is higher. It is well accepted that oxidation of ethanol starts with its adsorption on the oxide surface [42], and a higher concentration of adsorbed ethanol then leads to a higher oxidation rate.
The deconvolution of the O 1s line of the XPS spectra of the catalysts showed three oxygen forms: the neutral singlet O2 and the ionic O2 and O species, which are strongly electrophilic reactants that attack the organic molecule in the region of its highest electron density. Electrophilic oxygen O2 and O species present at the surface lead to the total oxidation of hydrocarbons [39]. Unfortunately, the differentiation between individual oxygen species determined by XPS could not reveal a clear dependence of the activity on the concentration of oxygen forms. This may be due to problems both in the actual XPS measurement (contamination of the samples by adsorbed carbon and carbon originating from the underlying tape) or in the deconvolution of the O 1s spectra.
With respect to the stability of sputtered catalyst activity, it was monitored for the NiCo1115 catalyst. As shown in Figure 8, in repeated measurements, the specific reaction rate of ethanol oxidation gradually increased from 6.8 to 17.2 mmolEtOH g−1 h−1. For toluene oxidation, the specific reaction rate increased slightly in the second experiment, but the catalyst activity began to decrease in subsequent experiments. The reason for the differing behavior of the two reactants is probably the reaction temperature, which is sufficiently low for ethanol (up to 300 °C) and much higher for toluene (up to 450 °C). At a low reaction temperature, the properties of the active components seem to be optimized, but at high temperatures, a decrease in the surface area of the active components can proceed.
The efficiency of the studied catalysts in the oxidation of ethanol was compared with that of the EnviCat® VOC-1544 catalyst [43]. This commercial Cu-Mn/Al2O3 catalyst contains 5.4 wt.% Mn and 3.3 wt.% Cu. In ethanol oxidation (1000 ppm at the GHSV of 71 L gcat −1 h−1), the T50 temperature was reached at 142 °C. This result may seem to be better than that obtained with the Ni-Co oxide catalysts on meshes (the T50 varied between 240–270 °C). However, the amount of metal oxides in the catalytic bed was much higher for the EnviCat® VOC-1544 catalyst (1.39 g compared to 0.3–0.5 g for the sputtered catalysts). The conversion of ethanol achieved with the EnviCat® VOC-1544 catalyst at 200 °C was 87.5 %; therefore, the catalytic activity (R200) was 3.5 mmol goxides−1 h−1. The specific activity (R200) of the Ni-Co oxide catalysts varied from 1 to 16 mmol goxides−1 h−1 during ethanol oxidation, with the highest value observed for the Co80 catalyst.

4. Conclusions

Ni-Co oxide catalysts were prepared by plasma jet sputtering on stainless-steel meshes using a hollow cathode at two working pressures (15 ad 80 Pa) and thoroughly characterized and tested in the oxidation of model volatile organic compounds (ethanol and toluene).
Powder XRD revealed the formation of Ni-Co mixed oxides with a spinel structure, together with NiO-like oxides; their contents and cation composition varied with the molar ratio of Ni:Co in the prepared samples. The formation of Ni-Co mixed oxides was confirmed by the Raman spectroscopy. Moreover, the catalysts prepared at a higher working pressure showed slightly lower intensity of the Raman peaks, indicating smaller particles. The TPR profiles confirmed better reducibility of the Ni and Co components in the Ni-Co catalysts compared to that in the single-component Ni and Co oxides.
The sputtered catalysts containing very low concentrations of active components (approximately 0.3–0.5 wt.%) were active in the total oxidation of ethanol and toluene. Ethanol was 90% converted at temperatures between 250 and 300 °C, whereas the temperatures required for the conversions of toluene were 100 °C higher. Regardless of the selected working pressure, the single-component nickel oxide catalysts showed the lowest activity of all catalysts in both ethanol and toluene oxidation. The catalysts containing only Co (i.e., the Co15 and Co80 samples) showed the highest activity in ethanol oxidation. The catalytic activity of the Ni-Co catalysts decreased with increasing nickel content in the catalysts, probably due to strong interactions between the active components. In the oxidation of toluene, the NiCo1480 catalyst showed the highest catalytic activity, in contrast to ethanol oxidation. The catalytic activity of all the investigated catalysts was roughly proportional to the surface Co3+/Co2+ ratio during toluene oxidation, whereas during ethanol oxidation, the activity was proportional to the acidity of the catalysts.
In ethanol oxidation, the activity of the sputtered catalysts was higher than that of the commercial Cu-Mn oxide catalyst EnviCat® VOC-1544— up to 16 times higher for the sputtered single-component Co catalyst. The main benefit of sputtered catalysts is considerably lower content of active Ni and Co components and a negligible effect of internal diffusion.

5. Experimental

5.1. Preparation of Catalysts

A plasma-aided deposition method based on sputtering of a hollow cathode, which was partially described in our recent report [23], was used to prepare the catalysts. Circular stainless-steel meshes (71 wt. % Fe, 16 wt. % Cr, 11 wt. % Ni, 2 wt. % Mn; mesh size: 0.40 mm; wire diameter: 0.22 mm) with an outer diameter of 25 mm were used as supports. A standard washing procedure (initial washing in a detergent and thorough rinsing in distilled water, followed by degreasing in acetone and ethanol for 10 minutes in an ultrasonic bath and final rising in distilled water) was applied on the meshes prior to the deposition of the thin oxide layer.
A high-vacuum sputtering system equipped with one hollow cathode plasma source was used to coat the stainless-steel meshes with Ni, Co, and Ni-Co oxide thin films. The hollow cathode plasma jet sputtering gun was horizontally mounted in a cylindrical vacuum chamber evacuated by a turbomolecular pump to a base pressure lower than 10−3 Pa. Hollow cathodes differing in composition were used as sources for thin oxide films with various Ni:Co molar ratios. Specifically, we used hollow cathodes with an outer diameter of 12 mm, an inner diameter of 5 mm, and a length of 60 mm made of Ni, Co, and Ni-Co alloys (Ni:Co molar ratios of 80:20, 50:50, and 20:80) with 99.95% purity (Kurt J. Lesker). The hollow cathodes were fixed in a water-cooled copper block connected to a direct-current (DC) power supply. The argon mass flow rate through the hollow cathode was held at 100 mL min-1 under standard conditions, and oxygen was supplied to the reactor by a separated port with a mass flow rate of 100 mL min-1 under standard conditions to ensure the same Ar+O2 oxidation atmosphere for all the experiments. A working pressure in the range of 15 Pa to 160 Pa was set by a gate valve, which throttled the turbomolecular pump. Discharge in the hollow cathode was generated by a TDK-Lambda GEN 600-2.6 DC power supply (TDK Co., Japan) connected to the cathode via a 100 Ω resistor. The DC power supply was regulated in constant current mode (CC), holding constant discharge current at values of 1.05, 1.5, or 1.6 A. The voltage on the cathode was measured using a digital oscilloscope with a voltage probe (Tektronix P5100A).
Then, 10 meshes were placed in a vacuum chamber on an electrically grounded circular rotating substrate holder (rotation speed: 5 rpm), allowing all 10 samples to be deposited under the same process conditions. The direct distance between the hollow cathode outlet and the mesh was 55 mm. This distance ensured a homogeneity of the film thickness better than 10% for all the meshes placed on the holder. The meshes were not intentionally heated, and their temperature was lower than 60 °C during the deposition process. The deposition process by plasma jet sputtering was carried out for 120 min and repeated on both sides of the meshes to ensure that both sides were evenly covered. Details of deposition conditions can be seen in Table 7.
After the deposition, the coated meshes were calcined in air at 500 °C for 4 h. The prepared samples with various Ni:Co molar ratios were labeled as NiCo14, NiCo11, and NiCo41 (numbers denote the intended Ni:Co molar ratio). Single-component Ni and Co oxide catalysts (labeled as Ni and Co, respectively) were also prepared. To reveal the effect of the gas pressure applied during the thin film deposition on the properties of the catalysts, the catalysts were prepared at different pressures. The pressure (in Pa) at which the samples were prepared are indicated by a suffix in the sample name, e.g., NiCo1115.
In addition to the standard deposition time of 120 min, the NiCo1115 catalyst was also prepared with an extended deposition time of 370 min to achieve a higher amount of oxides on the support. This sample was designated as NiCo1115*. For the same purpose, the NiCo11160 catalyst was prepared using a higher working pressure of 160 Pa and a deposition time of 200 min. Because our deposition experiments proved that the deposition rate of nickel oxide was significantly lower than that of other investigated cathode compositions, the deposition time for nickel oxide catalysts (samples Ni15 and Ni80) was doubled in comparison to the standard deposition time to obtain a comparable amount of nickel oxide on the meshes.

5.2. Characterization of Catalysts

The Ni and Cu contents in the deposited oxides were determined by energy-dispersive X-ray spectroscopy (EDX, Quantax 200, Bruker, Billerica, MA, USA).
Powder X-ray diffraction (XRD) patterns were recorded using a Bruker AXS D8 diffractometer (Bruker, Berlin, Germany) with Co Kα radiation (λ = 0.179 nm) in the 2θ range of 20–80°, with a step size of 0.02°. Qualitative analysis was performed with the HighScore Plus 4.8 software package (PANanalytical, Malvern, Almelo, The Netherlands, 2018). Lattice parameters were evaluated using cell refinement and profile fitting. The mean coherence lengths (considered as approximate crystallite sizes) were evaluated using the Scherrer equation.
The surface morphology of the oxide particles deposited on the stainless-steel supports was investigated using a Tescan FERA 3 scanning electron microscope (Tescan Indusem, Tescan Brno s.r.o., Brno, Czech Republic).
The surface area of the sputtered catalysts was determined according to the adsorption isotherms of physisorbed krypton at T = 77 K using the BET equation relative to the mass of oxides present on the meshes. An ASAP device (Norcross, Atlanta, GA, Micromeritics, USA) and a specially designed stainless-steel vessel were used for the characterization of bulky catalysts [44], enabling measurements of surface area of large samples (<30 mm). The samples were outgassed in a vacuum at 150 °C prior to data collection.
H2-TPR was performed using 10 mol. % H2 in nitrogen with a 20 °C min−1 temperature ramp. Changes in H2 concentration were detected with a katharometer. The grained CuO (0.160–0.315 mm) was reduced to calculate absolute values of the hydrogen consumed during reduction of the samples. Prior to the measurements, the meshes were cut into small pieces with dimensions of approximately 1 × 1 mm.
Raman spectra were measured using a dispersive Raman spectrometer (DXR Raman microscope, Thermo Scientific, Brno, Czech Republic) equipped with an Olympus confocal microscope and a thermoelectrically cooled CCD detector. A solid-state Nd:YAG laser (wavelength, 532 nm; maximum power, 10 mW) was used as an excitation source. The following parameters were used to collect the spectra: 900 lines/mm grating, 50× magnification objective, laser power of 0.3 mW, acquisition time of 30 s per scan, and 40 repetitions.
Surface elemental analyses were performed using a Kratos ESCA 3400 X-ray photo-808 electron spectrometer (X-ray photoelectron spectroscopy ESCA 3400, Kratos, Manchester, UK). Ni, Co, O, and C elements were detected. A piece of mesh (approximately 8 × 8 mm) was cut from the original sample and placed on carbon tape. All spectra were corrected by shifting the main carbon C 1s peak to 284.8 eV. The Shirley background was subtracted, and elemental compositions of the layers were calculated from corresponding areas.

5.3. Catalytic Experiments

The Ni-Co oxides deposited on stainless-steel meshes were tested in a fixed-bed reactor with an inner diameter of 25 mm. Eight pieces of circular stainless-steel meshes with an outer diameter of 25 mm were used for the measurements. The catalytic tests in total oxidation of ethanol and toluene were performed with 760 ppm of ethanol and 780 ppm of toluene in air at GHSV of 21 L gcat−1 h−1 using a temperature ramp of 2 °C min−1. An Agilent 8890 gas chromatograph coupled with a mass spectrometer was used for analysis of the composition of reaction products. The T50 temperature at which 50% conversion of ethanol or toluene was achieved was used to compare the performance of the catalysts. Catalytic activity was evaluated as the amount of ethanol or toluene converted per gram of oxides and hour at selected reaction temperatures (200 and 325 °C in oxidation of ethanol and toluene, respectively). The T90(CO2) temperature at which 90% conversion to CO2 was achieved was employed to compare the effectiveness of the catalysts in the total oxidation of both model volatile organic compounds.

Supplementary Materials

The following supporting information can be downloaded at: https://www.mdpi.com/article/10.3390/catal13010079/s1. Table S1: Average atomic concentrations of components deposited on stainless-steel meshes by plasma jet sputtering determined by EDX. Figure S1: Decomposition of the Ni 2p spectra (left) and Co 2p spectra (right) for the catalysts prepared at 15 Pa (top) and 80 Pa (bottom) with various Ni:Co molar ratios. Figure S2: LMM spectra of the Ni-Co oxide catalysts prepared by plasma jet sputtering at 15 Pa (left) and 80 Pa (right). Figure S3: Deconvolution of O 1s spectra of the investigated samples. Figure S4: Conversion curves of ethanol (top) and toluene (bottom) obtained on the catalysts prepared at 15 Pa (left) and 80 Pa (right). Reaction conditions: ca. 3.8 g of catalysts in the form of meshes; 760 ppm of ethanol or 780 ppm of toluene; GHSV 21 L gcat−l h−l; temperature ramp: 2 °C min−l.

Author Contributions

Conceptualization, M.Č. and F.K.; methodology, K.J., Z.H., M.Č. and M.K.; validation, M.K., J.M., F.K. and K.J.; investigation, I.N., A.O., J.B., M.K., P.T. and K.S.; data curation, J.B., K.S., T.B. and M.K.; writing—original draft preparation, K.J. and M.Č.; writing—review and editing, K.J., F.K., M.Č., M.K., Z.H. and P.T.; supervision, M.Č.; project administration, M.Č., F.K. and K.J. All authors have read and agreed to the published version of the manuscript.

Funding

The authors thank the Czech Science Foundation (project No. 21-04477S) for financial support.

Institutional Review Board Statement

Not applicable.

Informed Consent Statement

Not applicable.

Data Availability Statement

Data will be made available on request at K. Jiratova (jiratova@icpf.cas.cz).

Acknowledgments

The authors thank H. Šnajdaufová for the measurement of surface area of the catalysts and Ladislav Lapčák for measurement of Raman spectra.

Conflicts of Interest

The authors declare no conflict of interest.

Abbreviations

VOCVolatile organic compound
XRDX-ray diffraction
SEMScanning electron microscopy
TPRTemperature-programmed reduction
XPSX-ray photoelectron spectroscopy
EtOHEthanol

References

  1. Zhang, K.; Ding, H.; Pan, W.; Mu, X.; Qiu, K.; Ma, J.; Zhao, Y.; Song, J.; Zhang, Z. Reserarch progress of a composite metal oxide catalyst for VOC degradation. Environ. Sci. Technol. 2022, 56, 9220–9236. [Google Scholar] [CrossRef] [PubMed]
  2. Jirátová, K.; Balabánová, J.; Kovanda, F.; Klegová, A.; Obalová, L.; Fajgar, R. Cobalt Oxides Supported Over Ceria–Zirconia Coated Cordierite Monoliths as Catalysts for Deep Oxidation of Ethanol and N2O Decomposition. Catal. Lett. 2017, 147, 1379–1391. [Google Scholar] [CrossRef]
  3. Topka, P.; Jirátová, K.; Dvořáková, M.; Balabánová, J.; Koštejn, M.; Kovanda, F. Hydrothermal deposition as a novel method for the preparation of Co–Mn mixed oxide catalysts supported on stainless steel meshes: Application to VOC oxidation. Environ. Sci. Pollut. 2022, 29, 5172–5183. [Google Scholar] [CrossRef]
  4. Kupková, K.; Topka, P.; Balabánová, J.; Koštejn, M.; Jirátová, K.; Lamonier, J.-F.; Maixner, J.; Kovanda, F. Co-Cu mixed oxide catalysts for VOC abatement: Effect of Co:Cu ratio on performance in ethanol oxidation. Catalysts 2023. submitted. [Google Scholar]
  5. Yentekakis, I.V.; Panagiotopoulou, P.; Artemakis, G. A Review of Recent Efforts to Promote Dry Reforming of Methane (DRM) to Syngas Production via Bimetallic Catalyst Formulations. Appl. Catal. B. Enviroment. 2021, 296, 120210. [Google Scholar] [CrossRef]
  6. Abdollahifar, M.; Haghighi, M.; Sharifi, M. Dry Reforming of Methane over Nanostructured Co/Y Catalyst for Hydrogen Production: Effect of Ultrasound Irradiation and Co Loading on Catalyst Properties and Performance. Energ. Convers Manag. 2015, 103, 1101–1112. [Google Scholar] [CrossRef]
  7. Zhao, Y.; Li, H.; Li, H. NiCo@SiO2 core-shell catalyst with high activity and long lifetime for CO2 conversion through DRM reaction. Nano Energy 2018, 45, 4101–4108. [Google Scholar] [CrossRef]
  8. Xiang, J.F.; Wen, X.; Zhang, F.Z. Supported Nickel-Cobalt Bimetallic Catalysts Derived from Layered Double Hydroxide Precursors for Selective Hydrogenation of Pyrolysis Gasoline. Ind. Eng. Chem. Res. 2014, 53, 5600–15610. [Google Scholar] [CrossRef]
  9. Ashok, A.; Kumar, A.; Ponraj, J.; Mansour, S.A.; Tarlochan, F. Effect of Ni incorporation in cobalt oxide lattice on carbon formation during ethanol decomposition reaction. Appl. Catal. B. Environ. 2019, 254, 300–311. [Google Scholar] [CrossRef]
  10. Horlyck, J.; Lawrey, C.; Lovell, C.E.; Amal, R.; Scott, J. Elucidating the impact of Ni and Co loading on the selectivity of bimetallic NiCo catalysts for dry reforming of methane. Chem. Eng. J. 2018, 352, 572–580. [Google Scholar] [CrossRef]
  11. Niu, J.; Liu, H.; Zhang, Y.; Wang, X.; Han, J.; Yue, Z.; Duan, E. NiCo2O4 spinel for efficient toluene oxidation: The effect of crystal plane and solvent. Chemosphere 2020, 259, 127427. [Google Scholar] [CrossRef]
  12. Mattox, D.M. Handbook of Physical Vapor Deposition (PVD) Processing; Elsevier: Boston, MA, USA, 2010; pp. 2–6. [Google Scholar]
  13. Lin, J.; Sproul, W.D.; Moore, J.J. Tribological behavior of thick CrN coatings deposited by modulated pulsed power magnetron sputtering. Surf. Coat. Technol. 2012, 206, 2474–2483. [Google Scholar] [CrossRef]
  14. Wiatrowski, A.; Obstarczyk, A.; Mazur, M.; Kaczmarek, D.; Wojcieszak, D. Characterization of HfO2 Optical Coatings Deposited by MF Magnetron Sputtering. Coatings 2019, 9, 106. [Google Scholar] [CrossRef] [Green Version]
  15. Abreu, C.S.; Matos, J.; Cavaleiro, A.; Alves, E.; Barradas, N.P.; Vaz, F.; Torrell, M.; Gomes, J.R. Tribological characterization of TiO2/Au decorative thin films obtained by PVD magnetron sputtering technology. Wear 2015, 330, 419–428. [Google Scholar] [CrossRef]
  16. Hubička, Z. Hollow Cathodes and Plasma Jets for Thin Film Deposition in Low Temperature Plasmas; Wiley-VCH: Weinheim, Germany, 2008. [Google Scholar]
  17. Perekrestov, R.; Kudrna, P.; Tichý, M. The deposition of titanium dioxide nanoparticles by means of a hollow cathode plasma jet in dc regime. Plasma Sources Sci. Technol. 2015, 24, 035025. [Google Scholar] [CrossRef]
  18. Tichý, M.; Hubička, Z.; Šícha, M.; Čada, M.; Olejníček, J.; Churpita, O.; Jastrabík, L.; Virostko, P.; Adámek, P.; Kudrna, P.; et al. Langmuir probe diagnostics of a plasma jet system. Plasma Sources Sci. Technol. 2009, 18, 014009. [Google Scholar] [CrossRef]
  19. Čada, M.; Hubička, Z.; Adámek, P.; Ptáček, P.; Šíchová, H.; Šícha, M.; Jastrabík, L. Investigation of RF and DC plasma jet system during deposition of highly oriented ZnO thin films. Surf. Coat. Technol. 2003, 174, 627–631. [Google Scholar] [CrossRef]
  20. Hubička, Z.; Přibil, G.; Soukup, R.J.; Ianno, N.J. Investigation of the rf and dc hollow cathode plasma-jet sputtering systems for the deposition of silicon thin films. Surf. Coat. Technol. 2002, 160, 114–123. [Google Scholar] [CrossRef]
  21. Olejníček, J.; Šmíd, J.; Perekrestov, R.; Kšírová, P.; Rathouský, J.; Kohout, M.; Dvořáková, M.; Kment, Š.; Jurek, K.; Čada, M. Co3O4 thin films prepared by hollow cathode discharge. Surf. Coat. Technol. 2019, 366, 303–310. [Google Scholar] [CrossRef]
  22. Hubicka, Z.; Cada, M.; Adamek, P.; Virostko, P.; Olejnicek, J.; Deyneka, A.; Jastrabik, L.; Jurek, K.; Suchaneck, G.; Guenther, M.; et al. Investigation of the RF pulse modulated plasma jet system during the deposition of Pb(ZrxTi(1-x))O3 thin films on polymer substrates. Surf. Coat. Technol. 2005, 200, 940–946. [Google Scholar] [CrossRef]
  23. Hubička, Z.; Kment, Š.; Olejníček, J.; Čada, M.; Kubart, T.; Brunclíková, M.; Kšírová, P.; Adámek, P.; Remeš, Z. Deposition of hematite Fe2O3 thin film by DC pulsed magnetron and DC pulsed hollow cathode sputtering system. Thin Solid Films 2013, 549, 184–191. [Google Scholar] [CrossRef]
  24. Fedorov, A.V.; Kukushkin, R.G.; Yeletsky, P.M.; Bulavchenko, O.A.; Chesalov, Y.A.; Yakovlev, V.A. Temperature-programmed reduction of model CuO, NiO and mixed CuO-NiO catalysts with hydrogen. J. Alloy. Compds. 2020, 844, 156135. [Google Scholar] [CrossRef]
  25. Hurst, N.W.; Gentry, S.J.; Jones, A.; McNicol, B.D. Temperature Programmed Reduction. Catal. Rev. Sci. Eng. 1982, 24, 233–309. [Google Scholar] [CrossRef]
  26. Jirátová, K.; Perekrestov, R.; Dvořáková, M.; Balabánová, J.; Koštejn, M.; Veselý, M.; Čada, M.; Topka, P.; Pokorná, D.; Hubička, Z.; et al. Modification of Cobalt Oxide Electrochemically Deposited on Stainless Steel Meshes with Co-Mn Thin Films Prepared by Magnetron Sputtering: Effect of Preparation Method and Application to Ethanol Oxidation. Catalysts 2021, 11, 1453. [Google Scholar] [CrossRef]
  27. Lin, H.-Y.; Chen, Y.-W. The mechanism of reduction of cobalt by hydrogen. Mater. Chem. Phys. 2004, 85, 171–175. [Google Scholar] [CrossRef]
  28. Richardson, J.T.; Lei, M.; Turk, B.; Forster, K.; Twigg, M.V. Reduction of model steam reforming catalysts: NiO/α-Al2O3. Appl. Catal. General 1994, 110, 217–237. [Google Scholar] [CrossRef]
  29. Garces, L.J.; Hincapie, B.; Zerger, R.; Suib, S.L. The Effect of Temperature and Support on the Reduction of Cobalt Oxide: An in Situ X-ray Diffraction Study. J. Phys. Chem. C 2015, 119, 5484–5490. [Google Scholar] [CrossRef]
  30. Goncalves, V.O.O.; Talon, W.H.S.M.; Kartnaller, V.; Venancio, F.; Cajaiba, J.; Cabioc’h, T.; Clacens, J.M.; Richard, F. Hydrodeoxygenation of m-cresol as a depolymerized lignin probe molecule: Synergistic effect of NiCo supported alloys. Catal. Today 2021, 377, 135–144. [Google Scholar] [CrossRef]
  31. Hadjiev, V.G.; Iliev, M.N.; Vergilov, I.V. The Raman spectra of Co3O4. J. Phys. C: Solid State Phys. 1988, 21, L199–L201. [Google Scholar] [CrossRef]
  32. Tang, C.-W.; Wang, C.-B.; Chien, S.-H. Characterization of cobalt oxides studied by FT-IR, Raman, TPR and TG-MS. Thermochim. Acta 2008, 473, 68–73. [Google Scholar] [CrossRef]
  33. Mironova-Ulmane, N.; Kuzmin, A.; Steins, I.; Grabis, J.; Sildos, I.; Pärs, M. Raman scattering in nanosized nickel oxide NiO. J. Phys. Conf. Ser. 2007, 93, 012039. [Google Scholar] [CrossRef]
  34. Wang, W.; Liu, Y.; Xu, C.; Zheng, C.; Wang, G. Synthesis of NiO nanorods by a novel simple precursor thermal decomposition approach. Chem. Phys. Lett. 2002, 362, 119–122. [Google Scholar] [CrossRef]
  35. Bala, N.; Singh, H.K.; Verma, S.; Rath, S. Magnetic-order induced effects in nanocrystalline NiO probed by Raman spectroscopy. Phys. Rev. B 2020, 102, 024423. [Google Scholar] [CrossRef]
  36. NIST X-ray Photoelectron Spectroscopy Database, NIST Standard Reference Database 20, Version 3.5. Available online: http://srdata.nist. [CrossRef]
  37. Biesinger, M.C.; Payne, B.G.P.; Lau, L.W.M.; Gerson, A.; Smart, R.S.C. X-ray photoelectron spectroscopic chemical state quantification of mixed nickel metal, oxide and hydroxide systems. Surf. Interface Anal. 2009, 41, 324–332. [Google Scholar] [CrossRef]
  38. Yamamura, Y.; Tawara, H. Energy dependence of ion-induced sputtering yields from monoatomic solids at normal incidence. At. Data Nucl. Data Tables 1996, 62, 149–253. [Google Scholar] [CrossRef]
  39. Bielanski, A.; Haber, J. Oxygen in Catalysis; Marcel Dekker, Inc.: New York, NY, USA, 1990. [Google Scholar]
  40. Shibata, K.; Kioyma, T.; Kitagawa, J.; Sumiyoshi, T.; Tanabe, K.K. Acidic properties of binary metal oxides. Bull. Chem. Soc. Japan 1973, 46, 2985–2988. [Google Scholar] [CrossRef] [Green Version]
  41. Tanaka, K.; Ozaki, A. Acid-base properties and catalytic activity of solid surfaces. J. Catal. 1967, 8, 1–7. [Google Scholar] [CrossRef]
  42. Idriss, H.; Seebauer, E.G. Reactions of ethanol over metal oxides. J. Mol. Catal. A Chem. 1999, 152, 201–212. [Google Scholar] [CrossRef]
  43. Matějová, L.; Topka, P.; Jirátová, K.; Šolcová, O. Total oxidation of model volatile organic compounds over some commercial catalysts. Appl. Catal. A 2012, 443, 40–49. [Google Scholar] [CrossRef]
  44. Topka, P.; Jirátová, K.; Soukup, K.; Goliáš, J. Device for Measuring Specific Surface of Large Samples, Method of Measurement and Its Use. Czech Patent CZ308606, 30 December 2020. [Google Scholar]
Figure 1. Oxide deposition rate per mesh as a function of the Ni/Co molar ratio of the hollow cathode material. Mesh weight: 0.46 g.
Catalysts 13 00079 g001
Figure 2. Powder XRD patterns of the sputtered Ni-Co oxide catalysts. B—NiO (bunsenite), S—Ni-Co spinel, *—stainless-steel support.
Catalysts 13 00079 g002
Figure 3. SEM images of catalysts prepared under different plasma sputtering conditions (top: NiCo11 catalysts prepared under different conditions; bottom: NiCo14 catalysts prepared at 15 and 80 Pa and the NiCo11160 catalyst).
Catalysts 13 00079 g003aCatalysts 13 00079 g003b
Figure 4. Temperature-programmed reduction of the catalysts prepared at deposition pressures of 15 and 80 Pa.
Catalysts 13 00079 g004
Figure 5. Raman shifts observed with the catalysts.
Catalysts 13 00079 g005
Figure 6. Dependence of specific reaction rates (R200) for ethanol oxidation and R325 for toluene oxidation on molar Ni/(Ni + Co) ratio for the catalysts prepared at 15 and 80 Pa and two NiCo11 catalysts prepared under different conditions.
Catalysts 13 00079 g006
Figure 7. Dependence of the value of R325 (left) observed during toluene oxidation on sputtered catalysts prepared at 15 or 80 Pa on the Co3+/Co2+ parameter and the dependence of the value of R200 observed during ethanol oxidation on the calculated electronegativity (Xi) of the respective oxides (right).
Catalysts 13 00079 g007
Figure 8. The change in specific reaction rates with increasing order of measurement. Reaction conditions for the NiCo1115 catalyst: ca. 3.8 g of sputtered catalysts; 760 ppm of ethanol or 780 ppm of toluene; GHSV 21 L gcat−l h−l; temperature ramp: 2 °C min−l.
Catalysts 13 00079 g008
Table 1. Ni and Co concentrations in the oxide layers deposited on meshes in at% (determined by EDX).
SampleNia
at. %
Co
at. %
Ni/(Ni+Co)EDX
mol mol−1
Ni:CoEDX
mol mol−1
Co150.031.501:0
NiCo14157.528.50.211:3.80
NiCo111515.614.70.521:0.92
NiCo411527.26.80.804:1
Ni1529.80.210:1
NiCo1115 *20.219.50.501:0.97
Co800.028.101:0
NiCo14806.324.00.211:3.80
NiCo118018.517.60.511:0.96
NiCo418028.17.20.804:1
Ni8027.20.310:1
NiCo1116019.019.20.501:1.01
a Ni average atomic concentration in the respective catalysts (correction factor applied) (at%); NiCo1115 * deposition time: 370 min.
Table 2. Crystallite sizes (D) and lattice parameters (a) of the NiO-like and Ni-Co spinel-type oxides evaluated according to the powder XRD patterns of the catalysts. The NiCo1115 * catalyst was prepared with an extended deposition time of 370 min.
SampleNiO Ni-Co Spinel
D (nm)a (Å)D (nm)a (Å)
NiCo1415--20.38.119
NiCo1115--19.68.104
NiCo411517.54.180--
NiCo1115 *15.44.17517.18.120
NiCo1480--24.28.122
NiCo118018.74.17115.88.109
NiCo418014.24.17911.48.104
NiCo1116015.34.18117.38.129
NiCo1115 * catalyst was prepared with an extended deposition time of 370 min.
Table 3. Surface area, initial reduction temperatures (Tonset), reduction temperature of maxima (Tmax), and H2 consumption determined during TPR measurements for the Ni-Co catalysts.
SampleSBET
m2 goxide−1
Tonset
°C
Tmax
°C
mmol H2 goxide−1
Co152.624235916.4
NiCo14158.116332317.6
NiCo11157.914731519.8
NiCo41158.819033914.2
Ni152.231437115.7
NiCo1115 *2.924031415.1
Co802.816237620.0
NiCo14809.4195328; 346; (512)18.4
NiCo118010.0137301; 31622.8
NiCo41809.4199328; 35612.4
Ni804.134236413.1
NiCo111602.824532012.5
* Deposition time: 370 min.
Table 4. Surface concentrations of elements (in at. %) and comparison of the surface (XPS), bulk (EDX), and nominal bulk concentrations expressed as Ni/(Ni+Co) molar ratios.
SampleC 1sO 1sCo 2pNi 2pNi/(Ni + Co)nomNi/(Ni + Co)EDXNi/(Ni + Co)XPS
At.%At.%At.%At.%mol/molmol/molmol/mol
Co1550.7938.0211.19000-
NiCo141554.6232.948.074.380.20.210.35
NiCo111550.4734.426.638.480.50.520.56
NiCo411545.6133.282.3418.780.80.80.89
Ni1547.9434.71017.3511-
NiCo1115 *50.6632.755.3411.240.50.500.68
Co8052.2736.7410.99000-
NiCo148053.5734.368.323.750.20.210.31
NiCo118042.6436.005.5315.830.50.510.74
NiCo418049.2231.922.1416.710.80.800.89
Ni8052.9530.97016.0811-
NiCo1116049.4336.055.329.20.50.500.63
The NiCo1115* catalyst was prepared with an extended deposition time of 370 min.
Table 5. Relative atomic concentration of deconvoluted Co 2p and O 1s peaks (at. %), molar ratio of Co3+/Co2+, and oxygen vacancies Ov related to surface concentration of (Ni+Co) ions.
SampleCo3+Co2+Co2+Co3+/Co2+OlOvOwOv/(Ni+Co)
BE, eV779.5 ± 0.1781.0783.1Peak 1/(2 + 3)529.0–529.9530.5–531.0531.7–533.0
Co1534.4425.992.831.234.50.065.50.0
NiCo141533.3923.445.421.1641.324.234.51.9
NiCo111530.7925.246.040.9842.522.335.21.5
NiCo411525.8121.766.530.9150.525.524.01.2
Ni15----44.523.332.31.3
NiCo1115 *32.0723.873.031.246.319.334.41.2
Co8033.9525.152.31.234.00.066.00.0
NiCo148035.7024.012.41.3542.125.632.32.1
NiCo118031.2926.44.41.0252.029.318.81.4
NiCo418022.8721.625.360.8545.324.430.31.3
Ni80----38.918.542.61.2
NiCo1116028.3325.566.20.932.43.863.80.3
Table 6. T50 and T90CO2 temperatures in the oxidation of ethanol and toluene. Reaction conditions: ca. 3.8 g of sputtered catalysts; 760 ppm of ethanol or 780 ppm of toluene; GHSV 21 L gcat−l h−l; temperature ramp: 2 °C min−l.
CatalystNi/(Ni + Co)EthanolToluene
mol mol−1T50, °CT90CO2, °CT50, °CT90CO2, °C
Co150260324345402
NiCo14150.2265335334359
NiCo11150.5274329364355
NiCo41150.8269332363396
Ni151296402455>480
NiCo1115 *0.5249301343342
Co800258324343379
NiCo14800.2252329328356
NiCo11800.5274324338382
NiCo41800.8270329356389
Ni801296402430>450
NiCo111600.5247294314346
NiCo1115 *—deposition time: 370 min.
Table 7. Conditions of catalyst preparation.
SampleHollow Cathode MaterialNi/(Ni+Co)
Molar Ratio
Cathode Voltage (V)Discharge Current
(A)
Absorbed Power in Plasma
(W)
Deposition Pressure (Pa)Deposition Time (min)Average Thin Film Weight (mg)
Co15Co0−3121.6499151201.47
NiCo1415Ni20Co800.2−3121.6499151201.99
NiCo1115Ni50Co500.5−3061.6490151201.41
NiCo4115Ni80Co200.8−3141.6502151202.22
Ni15Ni1−3181.05334152401.10
NiCo1115 *Ni50Co500.5−3361.5504153703.38
Co80Co0−3561.6567801201.34
NiCo1480Ni20Co800.2−3361.6538801201.69
NiCo1180Ni50Co500.5−3401.6544801202.18
NiCo4180Ni80Co200.8−3541.6566801202.59
Ni80Ni1−3451.05362802401.25
NiCo11160Ni50Co500.5−3201.54801602002.60
The NiCo1115 * catalyst was prepared with an extended deposition time of 370 min.
Disclaimer/Publisher’s Note: The statements, opinions and data contained in all publications are solely those of the individual author(s) and contributor(s) and not of MDPI and/or the editor(s). MDPI and/or the editor(s) disclaim responsibility for any injury to people or property resulting from any ideas, methods, instructions or products referred to in the content.

