Article

Effect of Nitrogen Doping in GO as Support in ZnO/GO-N Compounds and Their Photocatalytic Assessment to Degrade the Lignin Molecule

1
División de Estudios de Posgrado de la Facultad de Ingeniería Química, Universidad Michoacana de San Nicolás de Hidalgo, Morelia 58030, Michoacán, Mexico
2
Departamento de Física Aplicada, Centro de Investigación y de Estudios Avanzados del Instituto Politécnico Nacional-Unidad Mérida, Mérida 97310, Yucatán, Mexico
3
Departamento de Investigación en Física, Universidad de Sonora, Luis Rosales Encinas, Hermosillo 83000, Sonora, Mexico
*
Author to whom correspondence should be addressed.
Catalysts 2023, 13(1), 69; https://doi.org/10.3390/catal13010069
Submission received: 30 November 2022 / Revised: 20 December 2022 / Accepted: 27 December 2022 / Published: 30 December 2022

Abstract

:
Control of the recombination process and improvement of transport charge carriers could be achieved in photocatalysts by modifying the catalytic support. In the present study, our goal was to study the effect of nitrogen doping on graphene oxide sheets using doping sources such as urea, thiourea, or ethylenediamine to produce GO-N catalytic supports which were used to form ZnO/GO-N systems. The synthesis of ZnO and GO-N was carried out through a hydrothermal process under microwave heating. The ZnO/GO-N compounds were tested to study the degradation of the lignin molecule under UV irradiation. A set of characterization techniques were used to study the ZnO/GO-N compounds, including XPS analyses which confirmed the N-doping in the samples. The ZnO compound reached 40% of lignin degradation in 70 min, while the ZnO/GO-N compound produced 79% of lignin degradation, also in 70 min evidencing the positive effect of the GO-N support. The best results of degradation were obtained when thiourea was used as the N-doping media.

Graphical Abstract

1. Introduction

The electron-hole (e-h+) pairs recombination generated in a semiconductor is one of the main challenges in photocatalytic processes [1,2]. These semiconductors offer great potential as promoters of degradation of organic pollutants dissolved in water media and, therefore, for the purification of the environment through the indirect conversion of radiant energy into chemical energy [3]. This opens up the need to develop photocatalysts having efficiency values that might justify their application as an alternative to conventional compounds currently included in methods of wastewater treatment [4,5]. For that reason, improvement of the photocatalytic efficiency, through the synthesis of new compounds capable of delaying the recombination of charge carriers, or able to expand their range of energy absorption, is essential [6].
Some semiconductors already used for the degradation of organic pollutants include TiO2 [7], CeO2 [8], CdS [9], Bi2MoO6 [10], and ZnO [11,12], among many others. ZnO has demonstrated superior photocatalytic performance in pollutant degradation studies of complex molecules, including lignin degradation [13]. ZnO is a semiconductor that has a forbidden band of 3.37 eV, a value close to the near UV. It is a non-toxic material with outstanding thermal and chemical stability. In addition, it shows high electron mobility and, due to its high availability, ZnO is a material with huge applications [14], including photocatalysis.
In this regard, when ZnO has been tested as a photocatalyst, one of the drawback issues limiting their use is the rapid recombination of the e-h+ generated pairs [15]. Among the possible methods for developing more stable photocatalysts capable of overcoming these shortcomings, the synthesis of semiconductors, coupled with other materials or elements, is a current task. In this sense, the creation of energy levels above the valence band (VB) through anion doping in a semiconductor attempts to improve the separation of the photogenerated charge in addition to extending its absorption range of radiant energy [16]. Furthermore, other methods consisting of the synthesis of heterostructures, combined with other stable semiconductors [17], or noble metals [18] to prevent the recombination of the e-h+ pairs, have been reported. In the same way, the use of supporting materials can modify the surface of a semiconductor, facilitating the transmission and acceptance of photogenerated electrons [19].
Since its global appearance in 2004, graphene and its derivatives (reduced graphene oxide (rGO) and graphene oxide (GO) have become materials of great interest, due to the outstanding chemical and physical features provided by their 2D carbon hexagonal structure [20,21,22,23]. Unlike graphene, GO harbors a series of functional groups in the basal plane of their hexagonal lattice, including carboxylic acid, hydroxyl groups, and epoxides [24,25]. These functional groups disrupt the electronic density distribution by modifying the π-π configuration, producing significant differences in their electronic properties, benefiting the electron separation and transmission process in a semiconductor [26]. Nitrogen doping has been a reported procedure used to modify and improve the electronic properties of GO by significantly increasing the conductivity of electrons and improving their electron donor properties [27]. Fascinatingly, after nitrogen doping, the acquired properties of GO may change depending on the nitrogen source used as a precursor and the particular synthesis method [28].
In this regard, the present work shows the synthesis stages of ZnO/nitrogen-doped GO compounds (GO-N) to be tested as photocatalysts to degrade lignin. One of the main purposes of this project was to study the effect of using three precursors to achieve nitrogen doping in the catalytic support, that is to say, GO, under the purpose of improving its outstanding electronic mobility [29] and photocatalytic activity [30]. Thus, the used precursors as nitrogen sources were urea (GO-U), ethylenediamine (GO-E), and thiourea (GO-T). The ZnO/GO-U, ZnO/GO-E, and ZnO/GO-T supported compounds were tested in a photocatalytic process to study the degradation of lignin and methylene blue (MB) under UV energy irradiation. The exposed results demonstrate changes in the photocatalytic activity behavior of ZnO after interacting with the GO-N catalytic supports, evidencing a favorable synergistic effect.

2. Results and Discussion

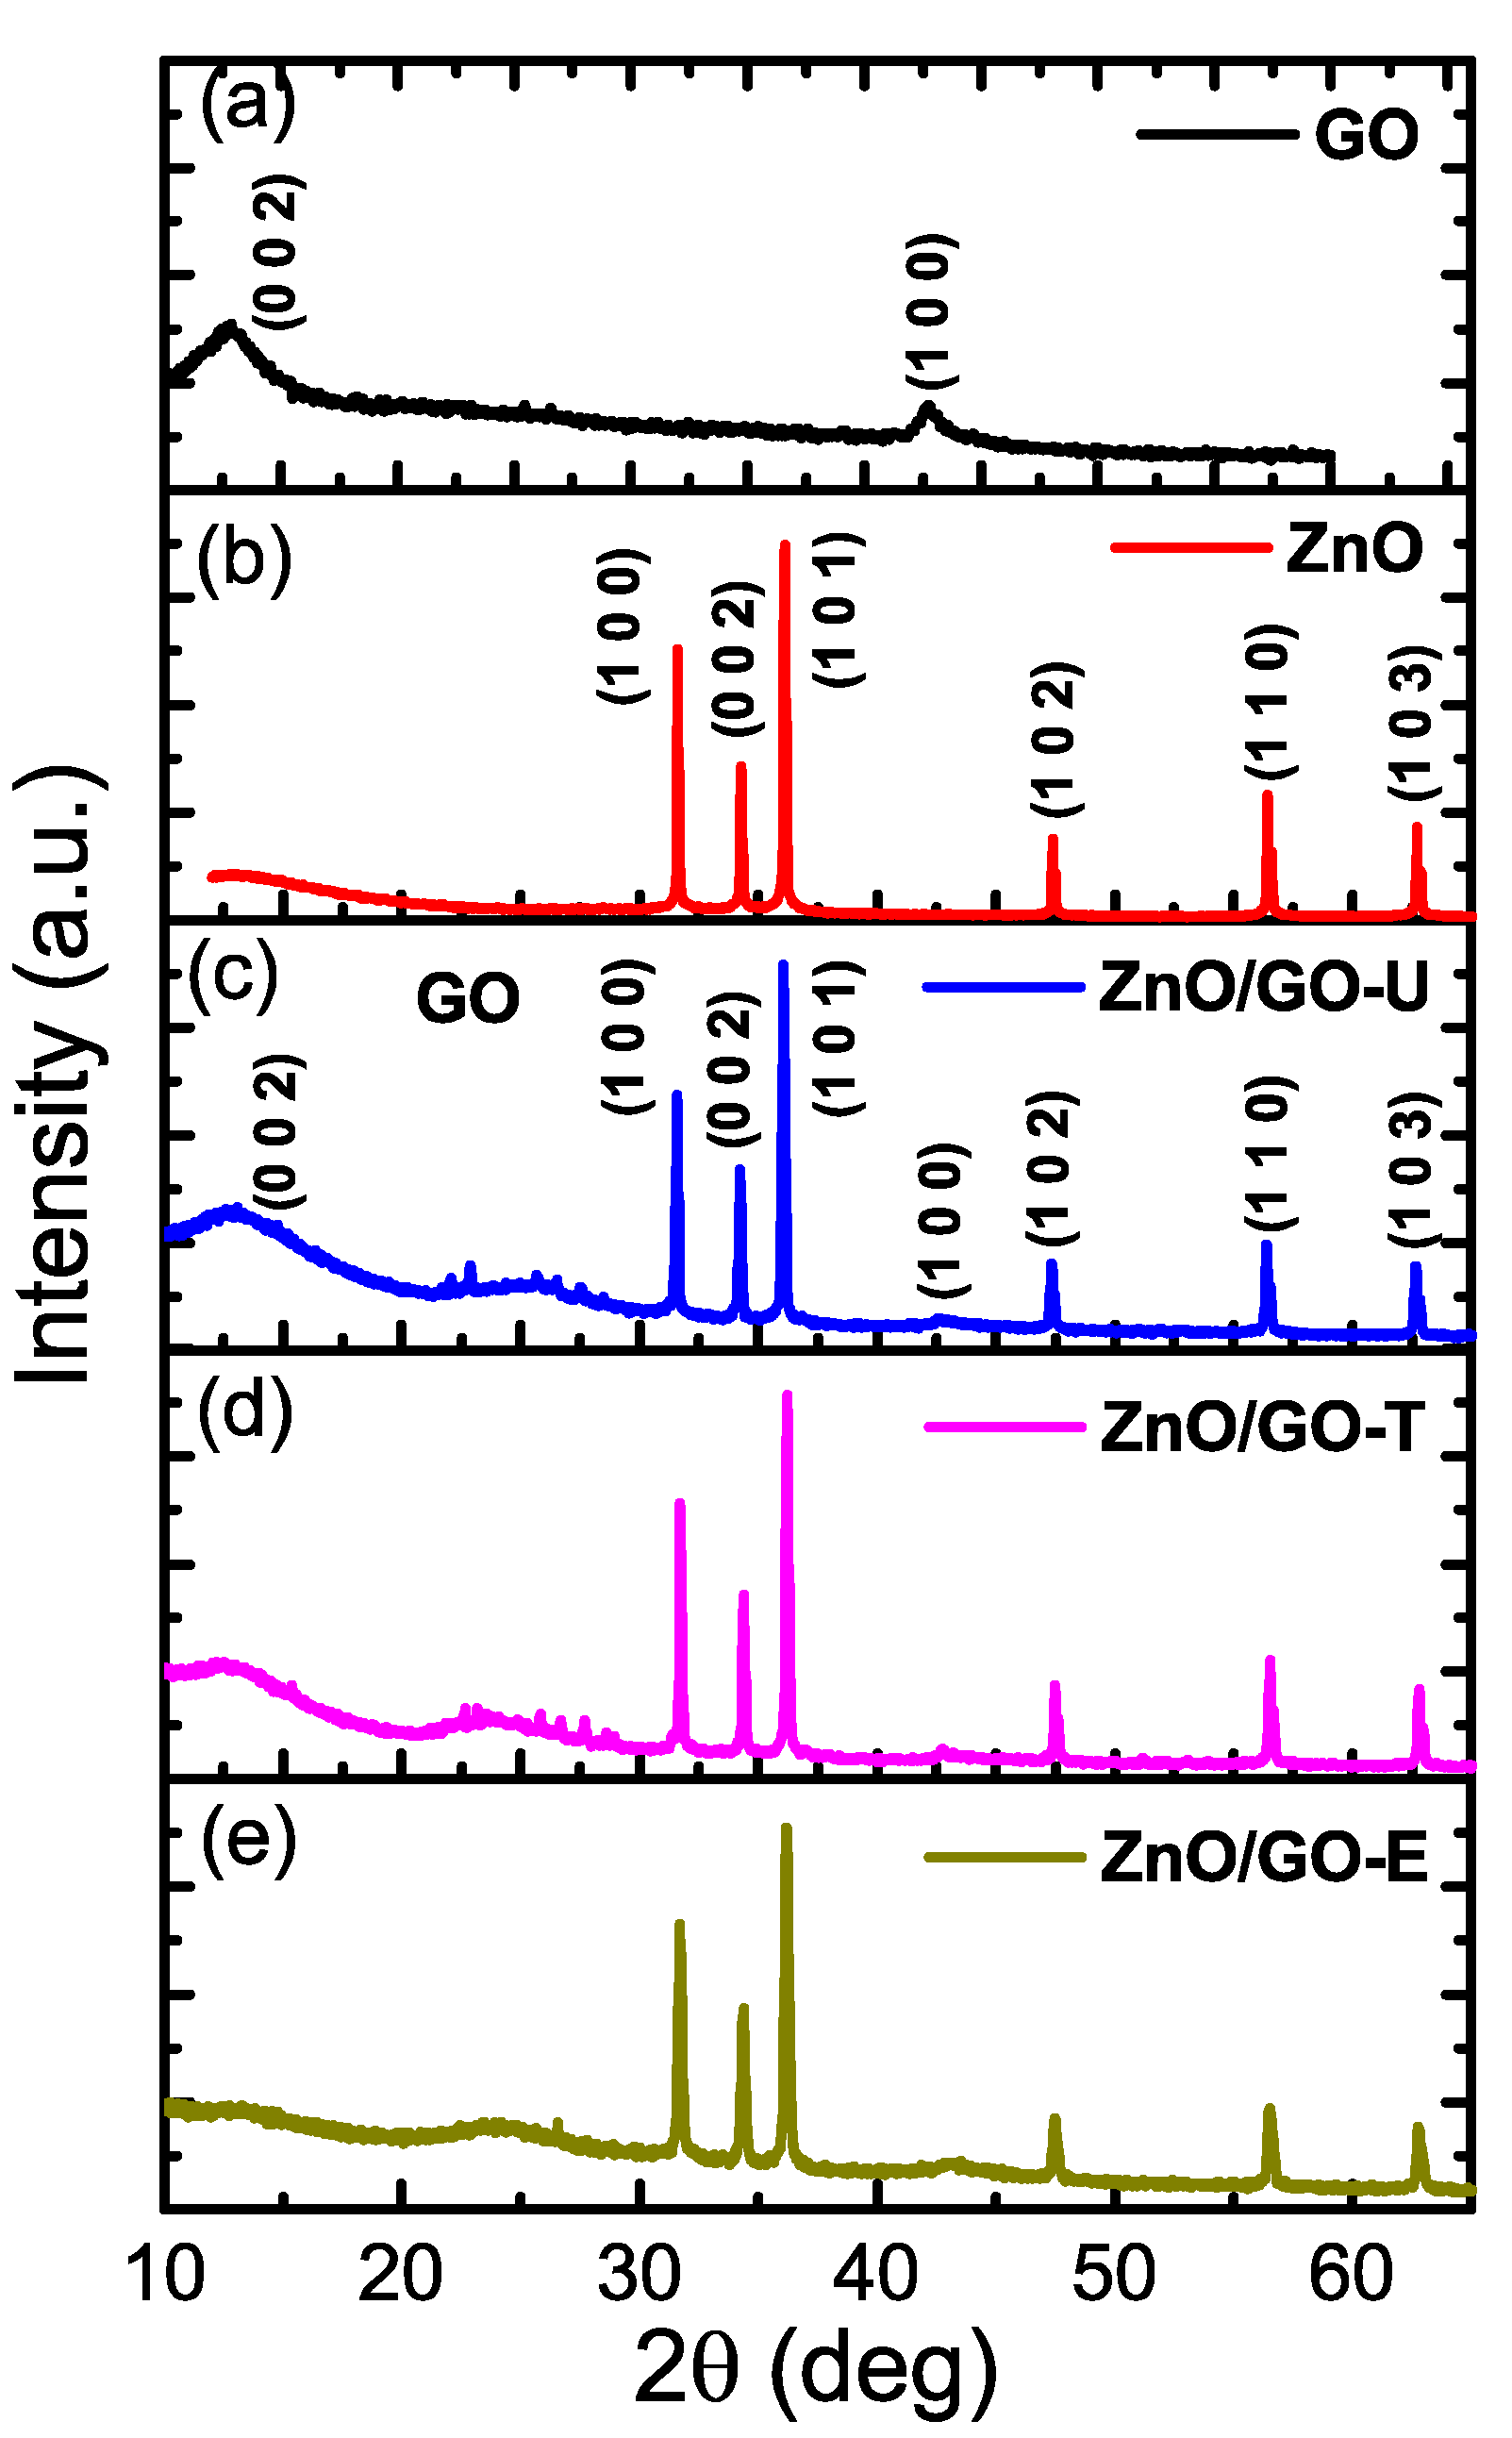
2.1. X-ray Diffraction

X-ray diffraction studies were carried out to corroborate the crystalline structures. Figure 1 shows the diffraction patterns of the synthesized materials. In Figure 1a, the diffraction pattern of GO can be seen. Graphite exhibits an intense peak at 2θ = 26.4° that denotes the hexagonal graphite phase [31]. However, in Figure 1a, the appearance of the two characteristic peaks of GO can be observed, which are located at 2θ = 12° and 2θ = 43° due to graphite oxidation corroborating the formation of GO. The peaks found at 12° and 43° correspond to the (0 0 2) and (1 0 0) planes, respectively [32]. The XRD spectrum of ZnO is shown in Figure 1b. The peaks’ positions from the diffraction pattern match well with the 2θ values from the database of the JCPDS PDF card No. 36-1451. Therefore, is concluded that the sample solely consists of the hexagonal wurtzite structure. Using the Scherrer equation [d = (κλ)/(βcos θ)] and the (1 0 1) plane, the average crystallite size of the ZnO particle was calculated, obtaining an approximate value of 54 nm. Figure 1c–e present the diffraction spectra of the ZnO/GO-N compounds. ZnO diffraction peaks can be observed for all the compounds, indicating that the ZnO particles were properly distributed on GO-N. However, it can be observed that the diffraction peaks belonging to GO decreased notably, suggesting partial reduction of GO and probably due the hydrothermal treatment and the interaction with amine groups [1].
The optical properties of the ZnO were measured by UV–vis diffuse reflectance spectroscopy. The Kubelka–Munk method was applied to the reflectance data obtained and the Eg was approximated from the intercept of the straight portion of [F(R)hν]2 vs. plots with the X-axis. Thus, the Eg value obtained for the ZnO was 3.31 eV.

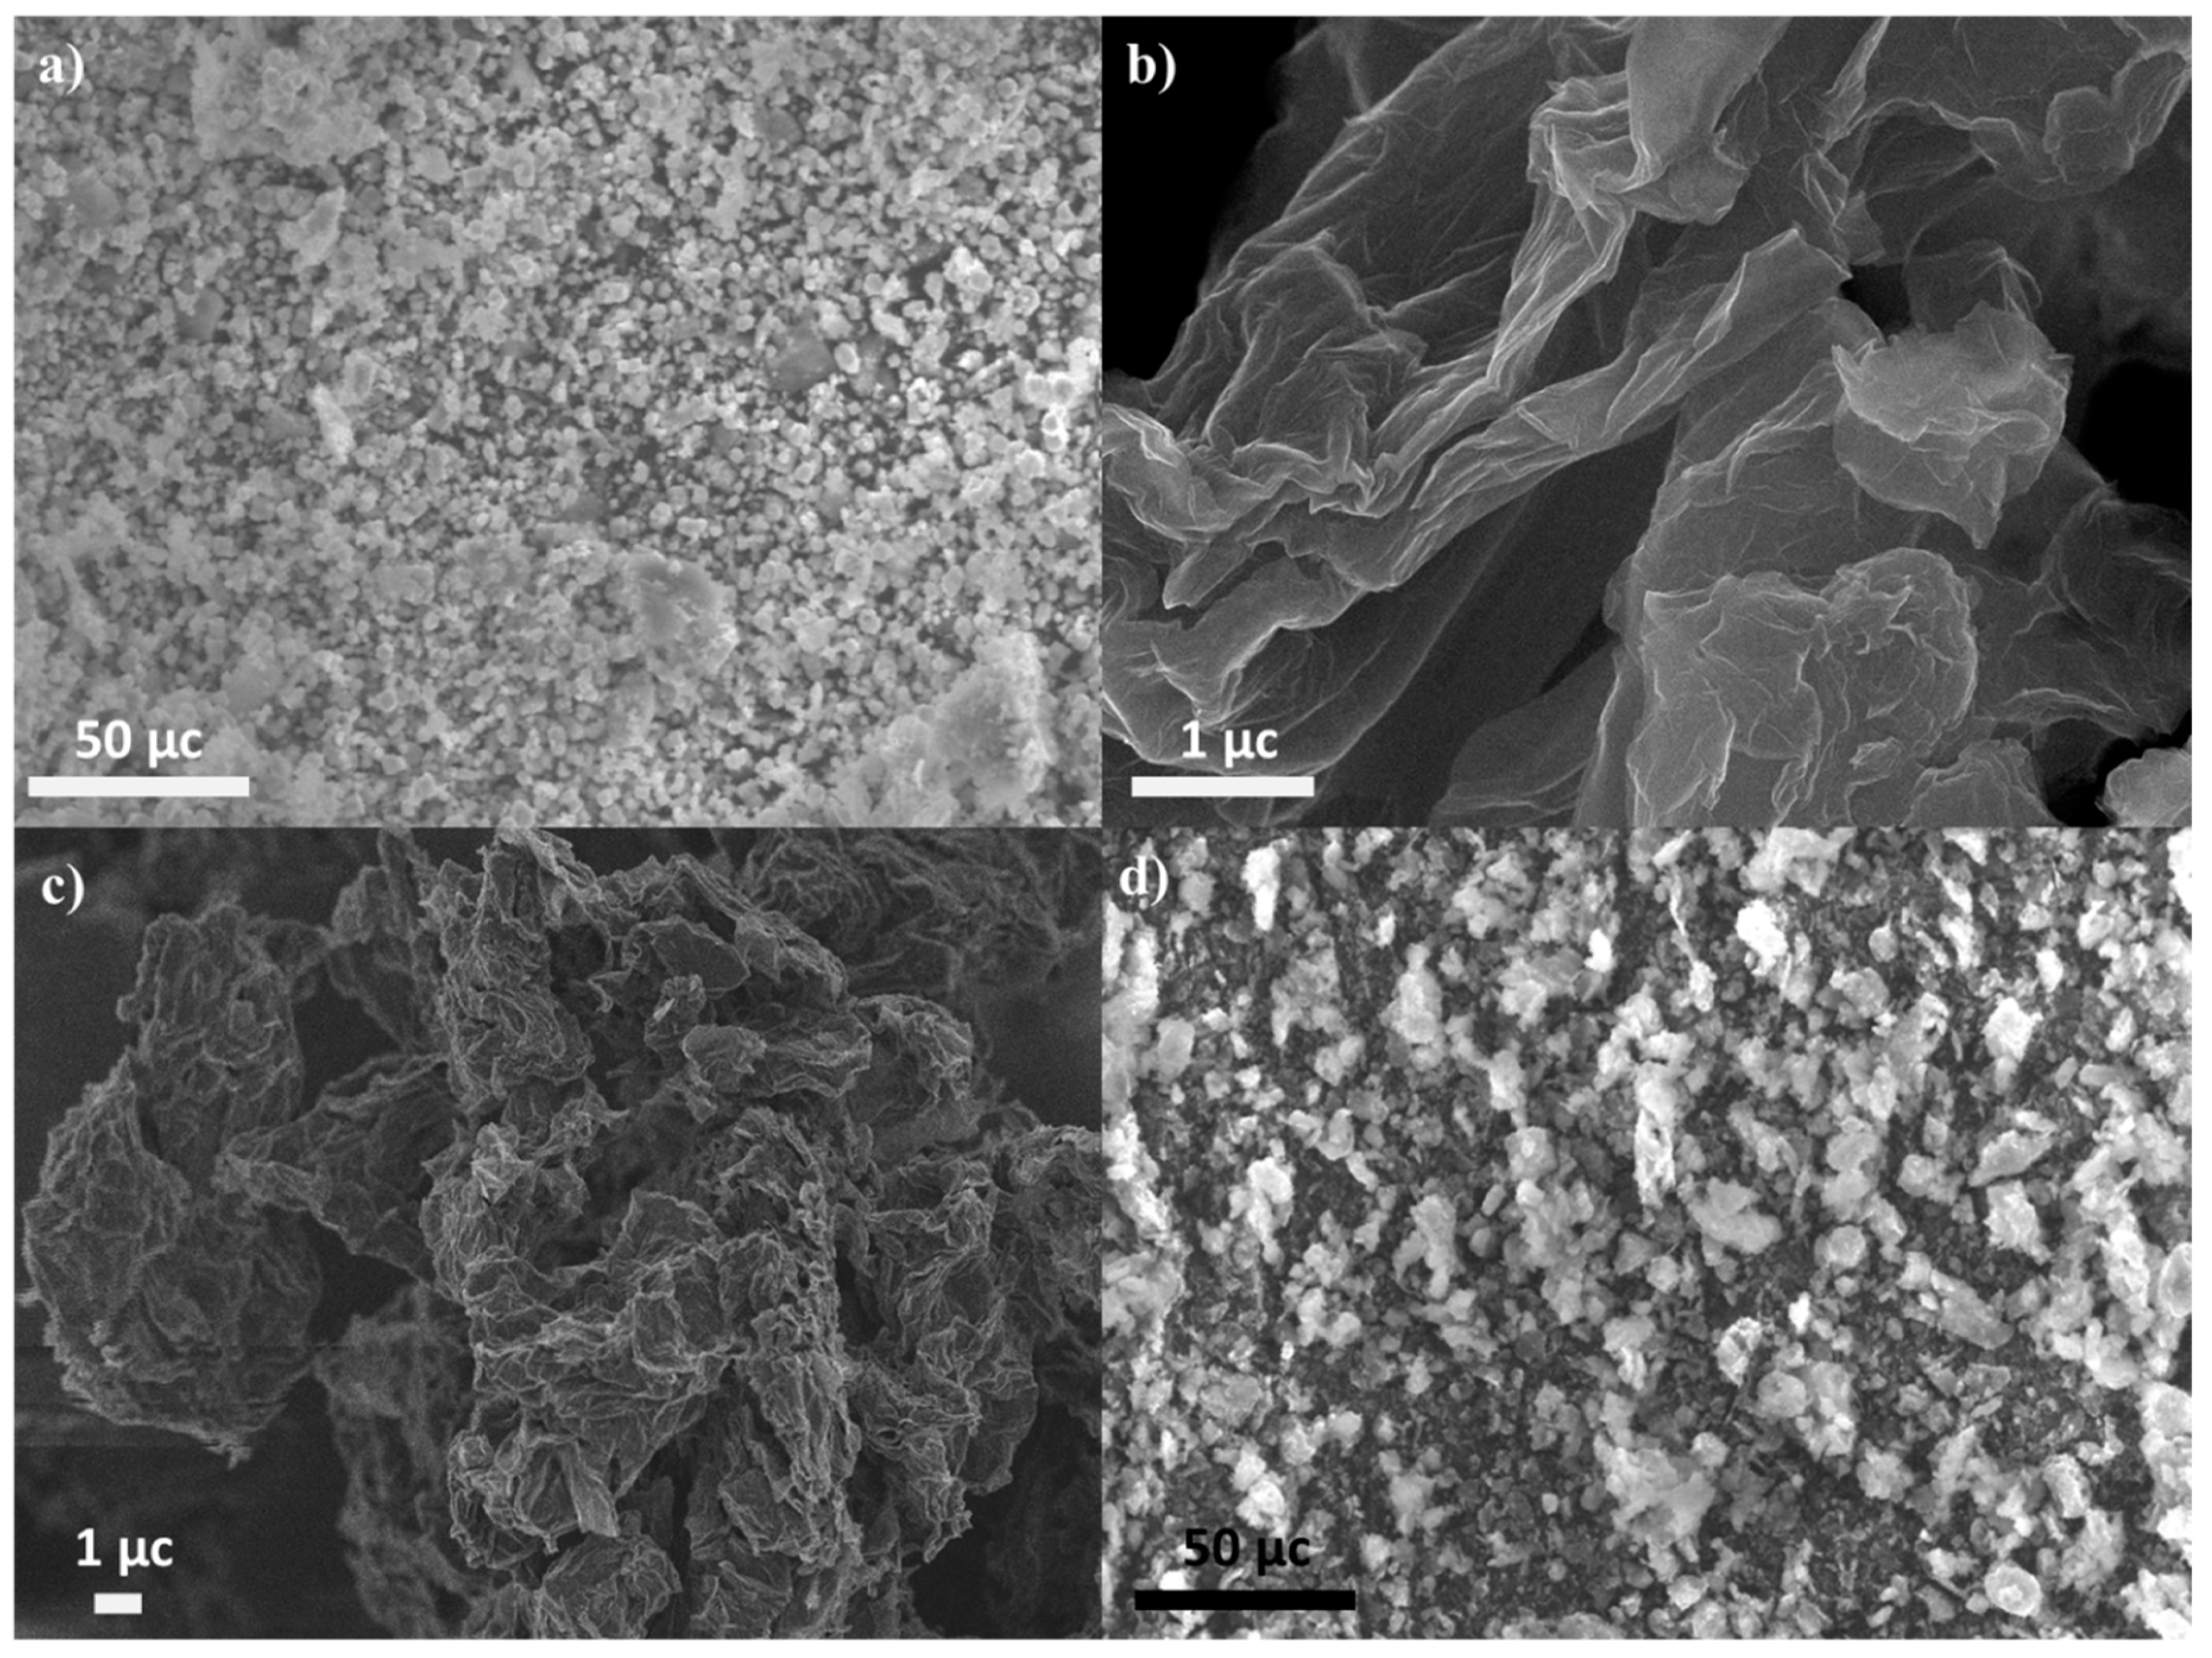
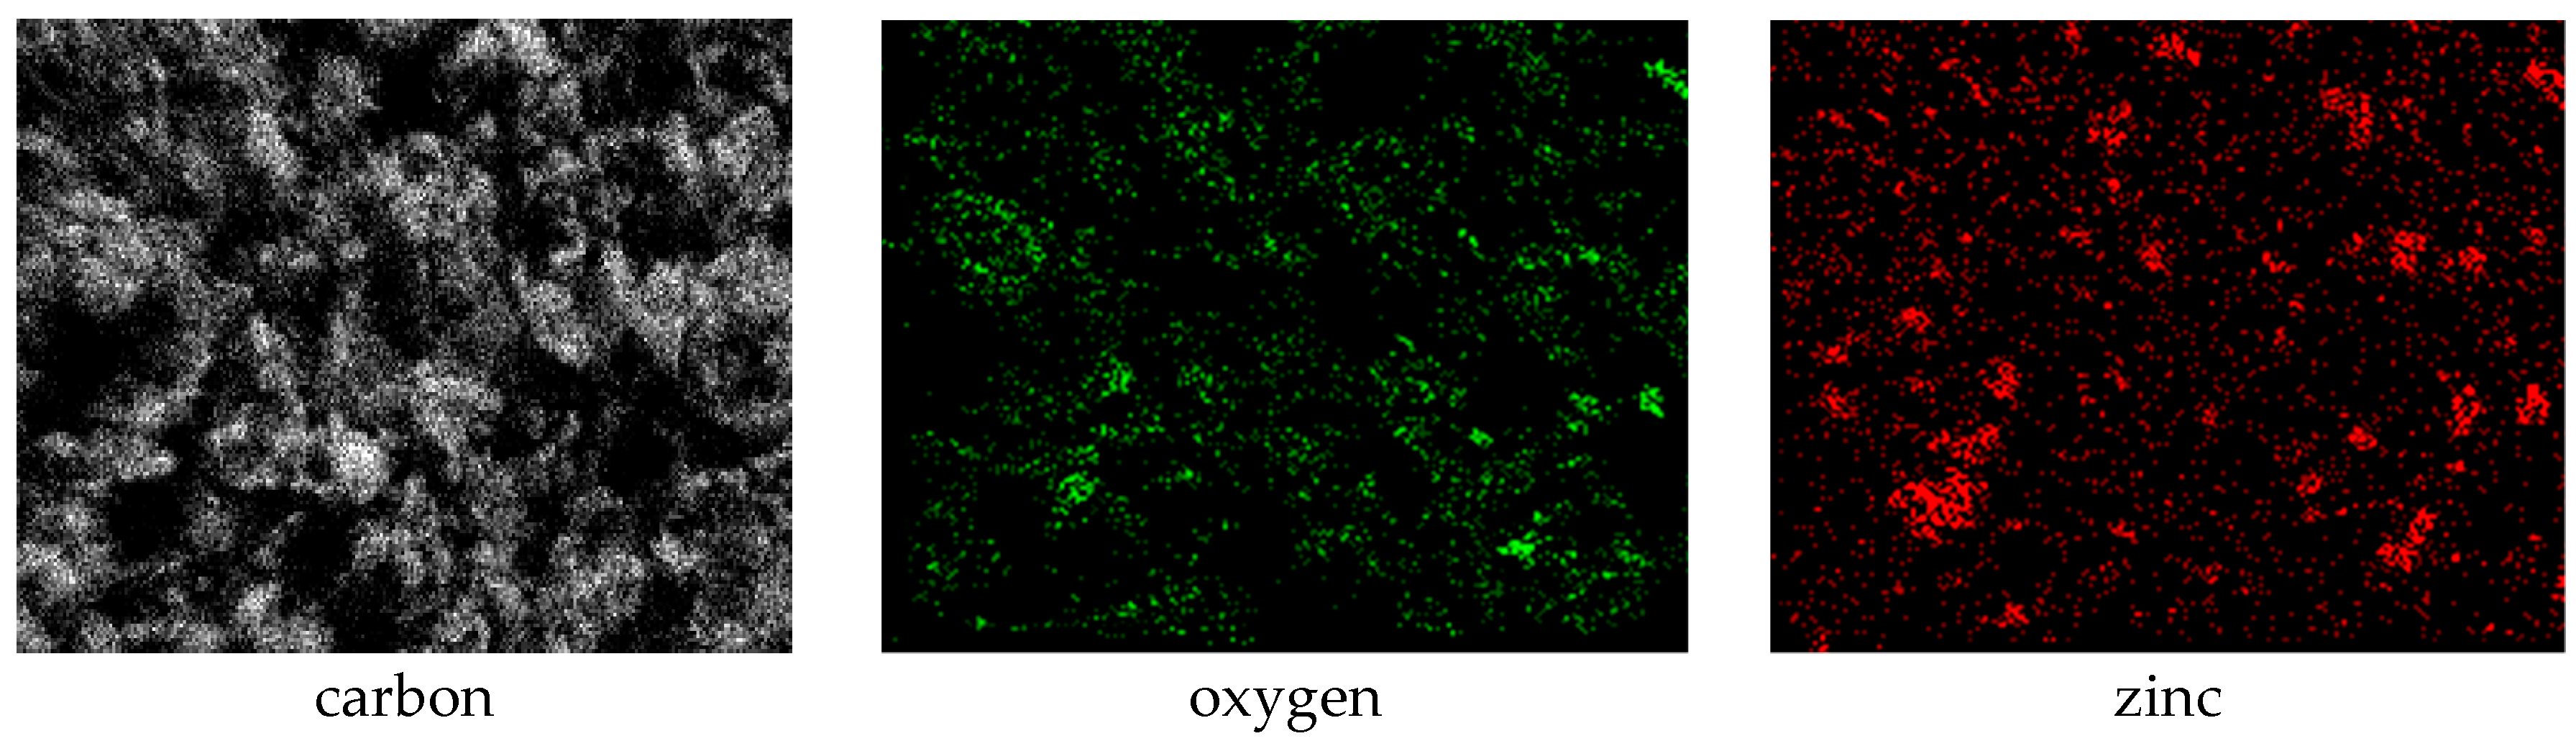
2.2. Field Emission Scanning Electron Microscopy

Figure 2 shows the morphology studies. Images were obtained by field emission scanning electron microscopy. Figure 2a shows the obtained image for the ZnO and shows hexagonal particles with sizes of about 0.5–1 µm, although some structures of bigger dimensions were also detected. In Figure 2b,c, the images corresponding to GO and GO-T are shown. It can be seen that both compounds have a laminar configuration with stacked thin layers of irregular surfaces shaped as wrinkles. The GO-U and GO-E compounds showed similar morphology. The image of the ZnO/GO-T compound is presented in Figure 2d. Thoroughly distributed ZnO particles can be observed on the surface of the GO after the sonication procedure was carried out.
We also achieved EDS analyses and a general mapping of the elements in samples with the purpose of demonstrating the proper dispersion of ZnO nanoparticles on graphene sheets. As an example, the following Figure 3 shows the carbon (mostly from the graphene compound), oxygen, and zinc distribution in the samples.

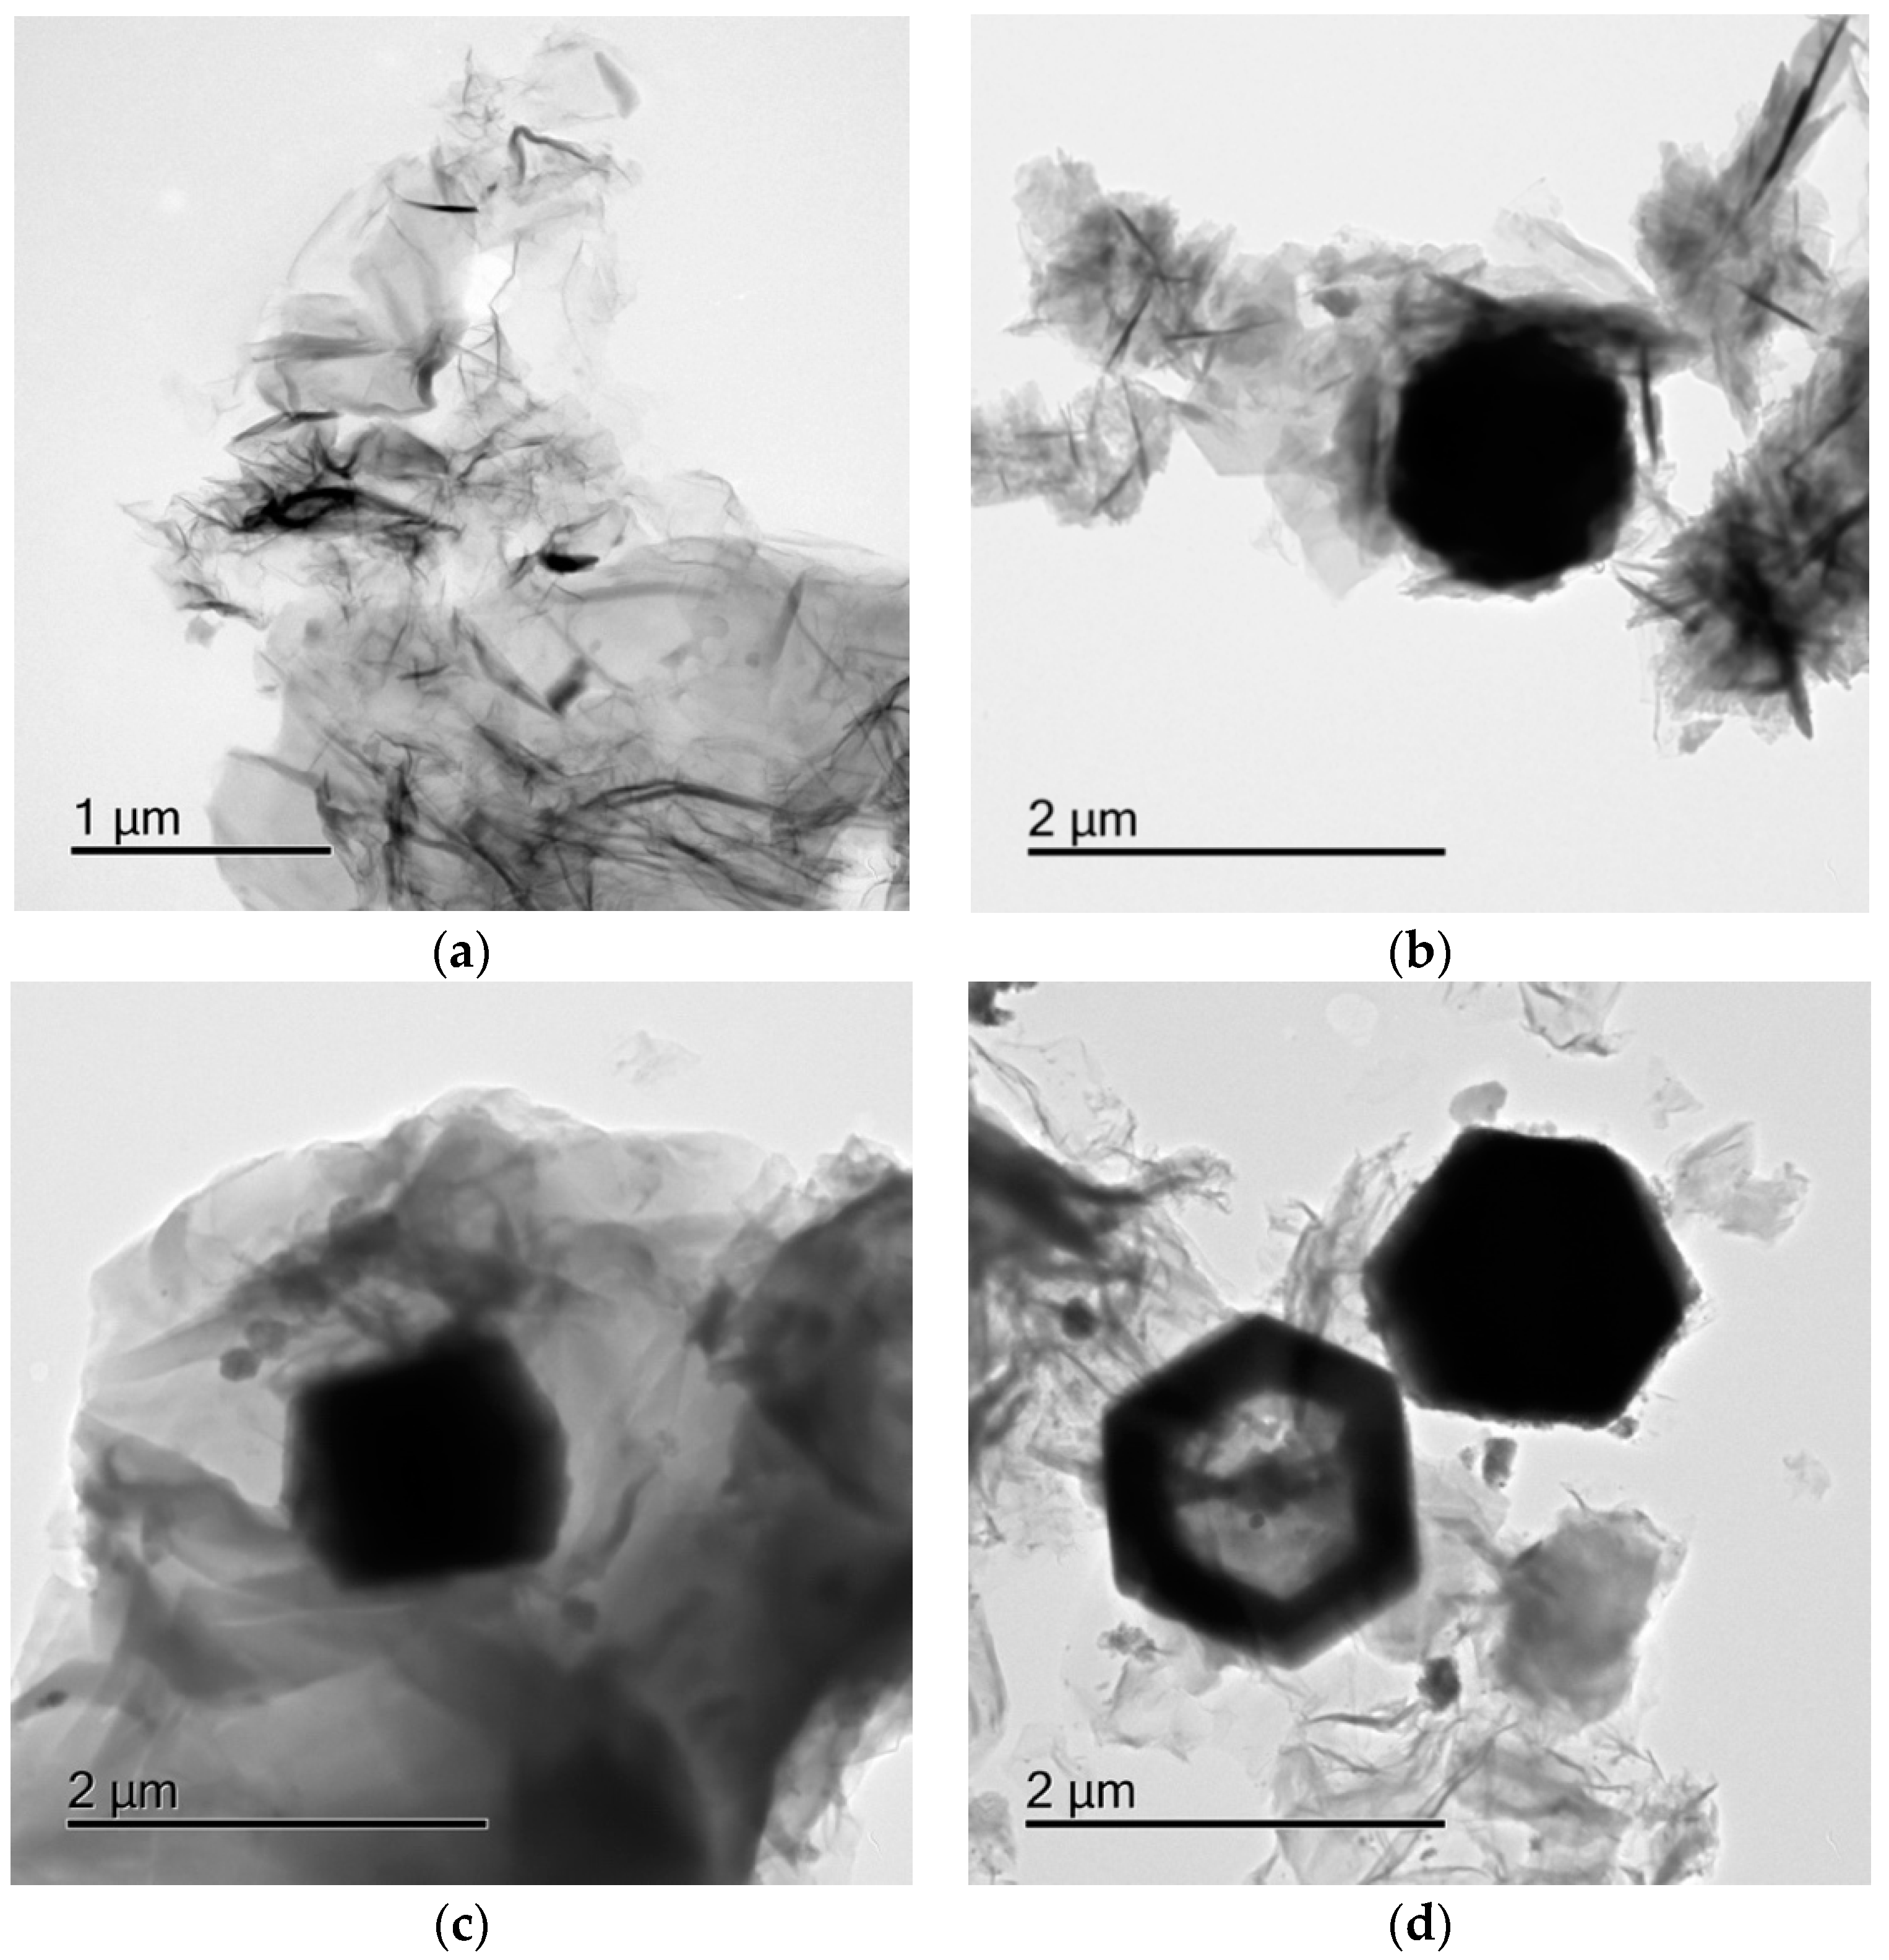
2.3. Transmission Electron Microscopy Studies

Transmission electronic images were attained for some samples to show a general scheme of the ZnO particle and the graphene oxide size, see Figure 4. Figure 4a corresponds to the pristine GO compound were the ZnO nanoparticles were dispersed. For the ZnO/GO-N samples, the particle size of ZnO was between 1–2 µm which were found dispersed on the GO sheets, see Figure 4b–d. The GO oxide sheets in some cases, appear as small fragments. This is because the catalysts were lightly ground and passed through a 100-mesh sieve (Tyler series) prior to their observation.

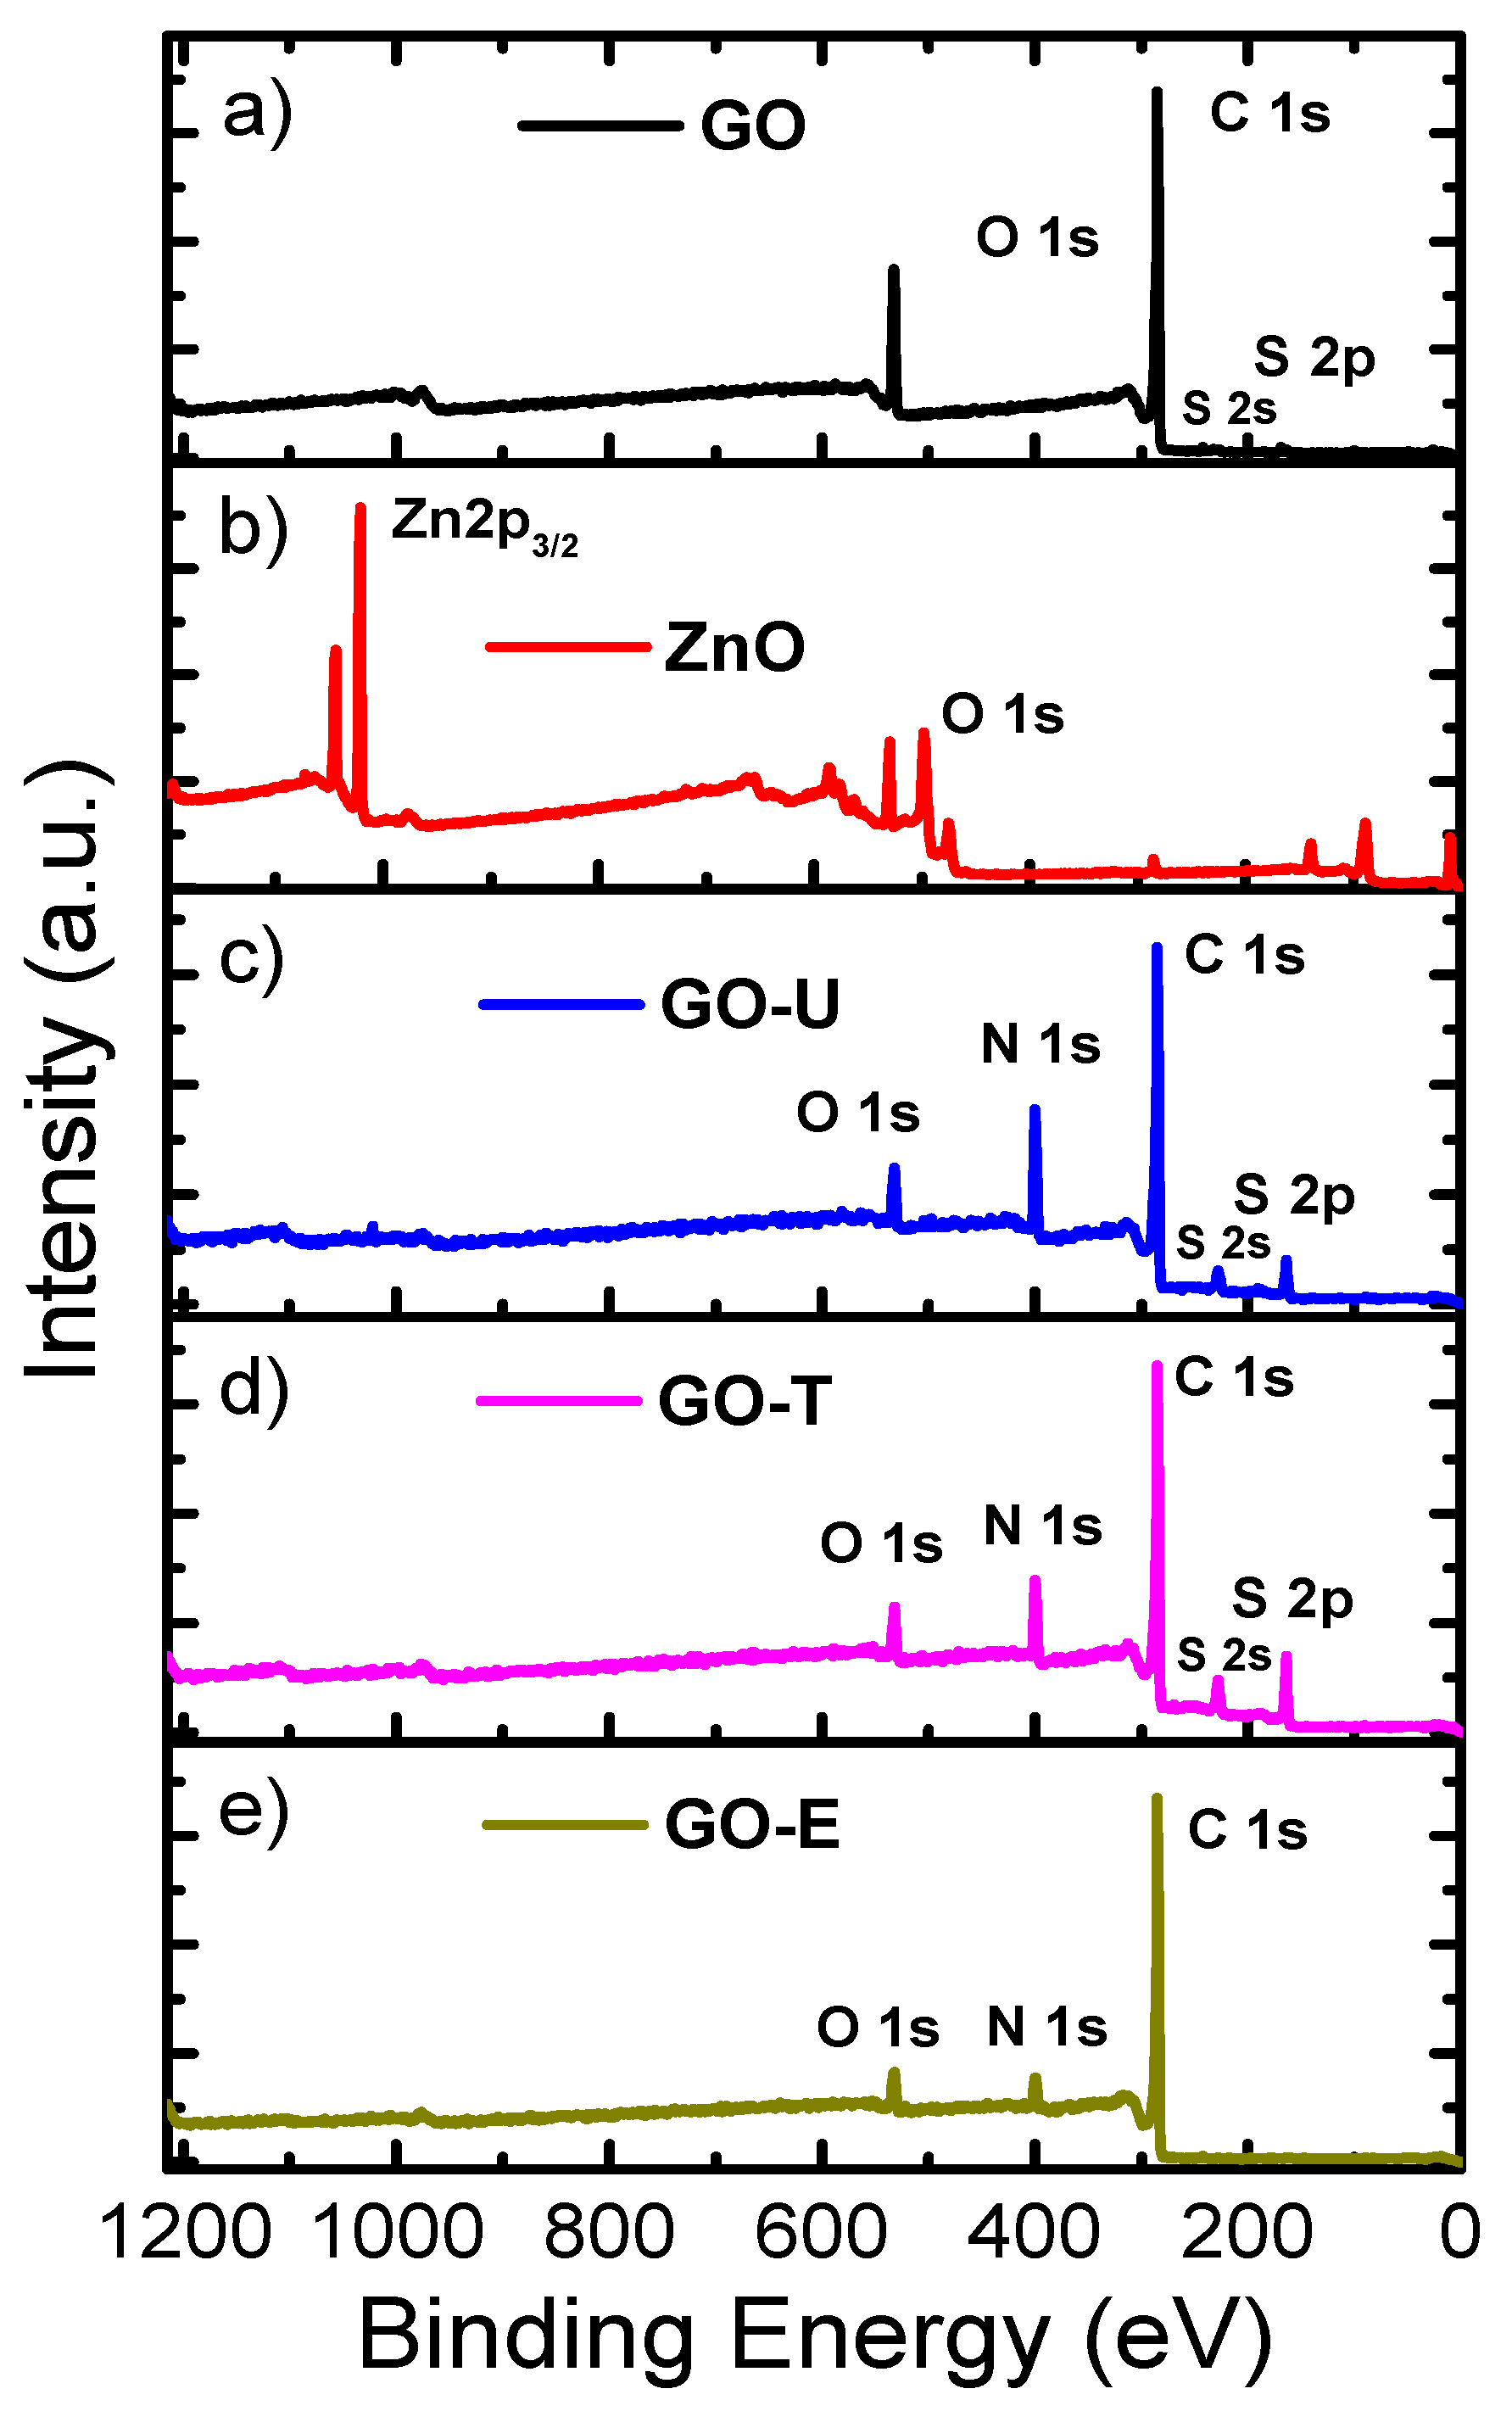
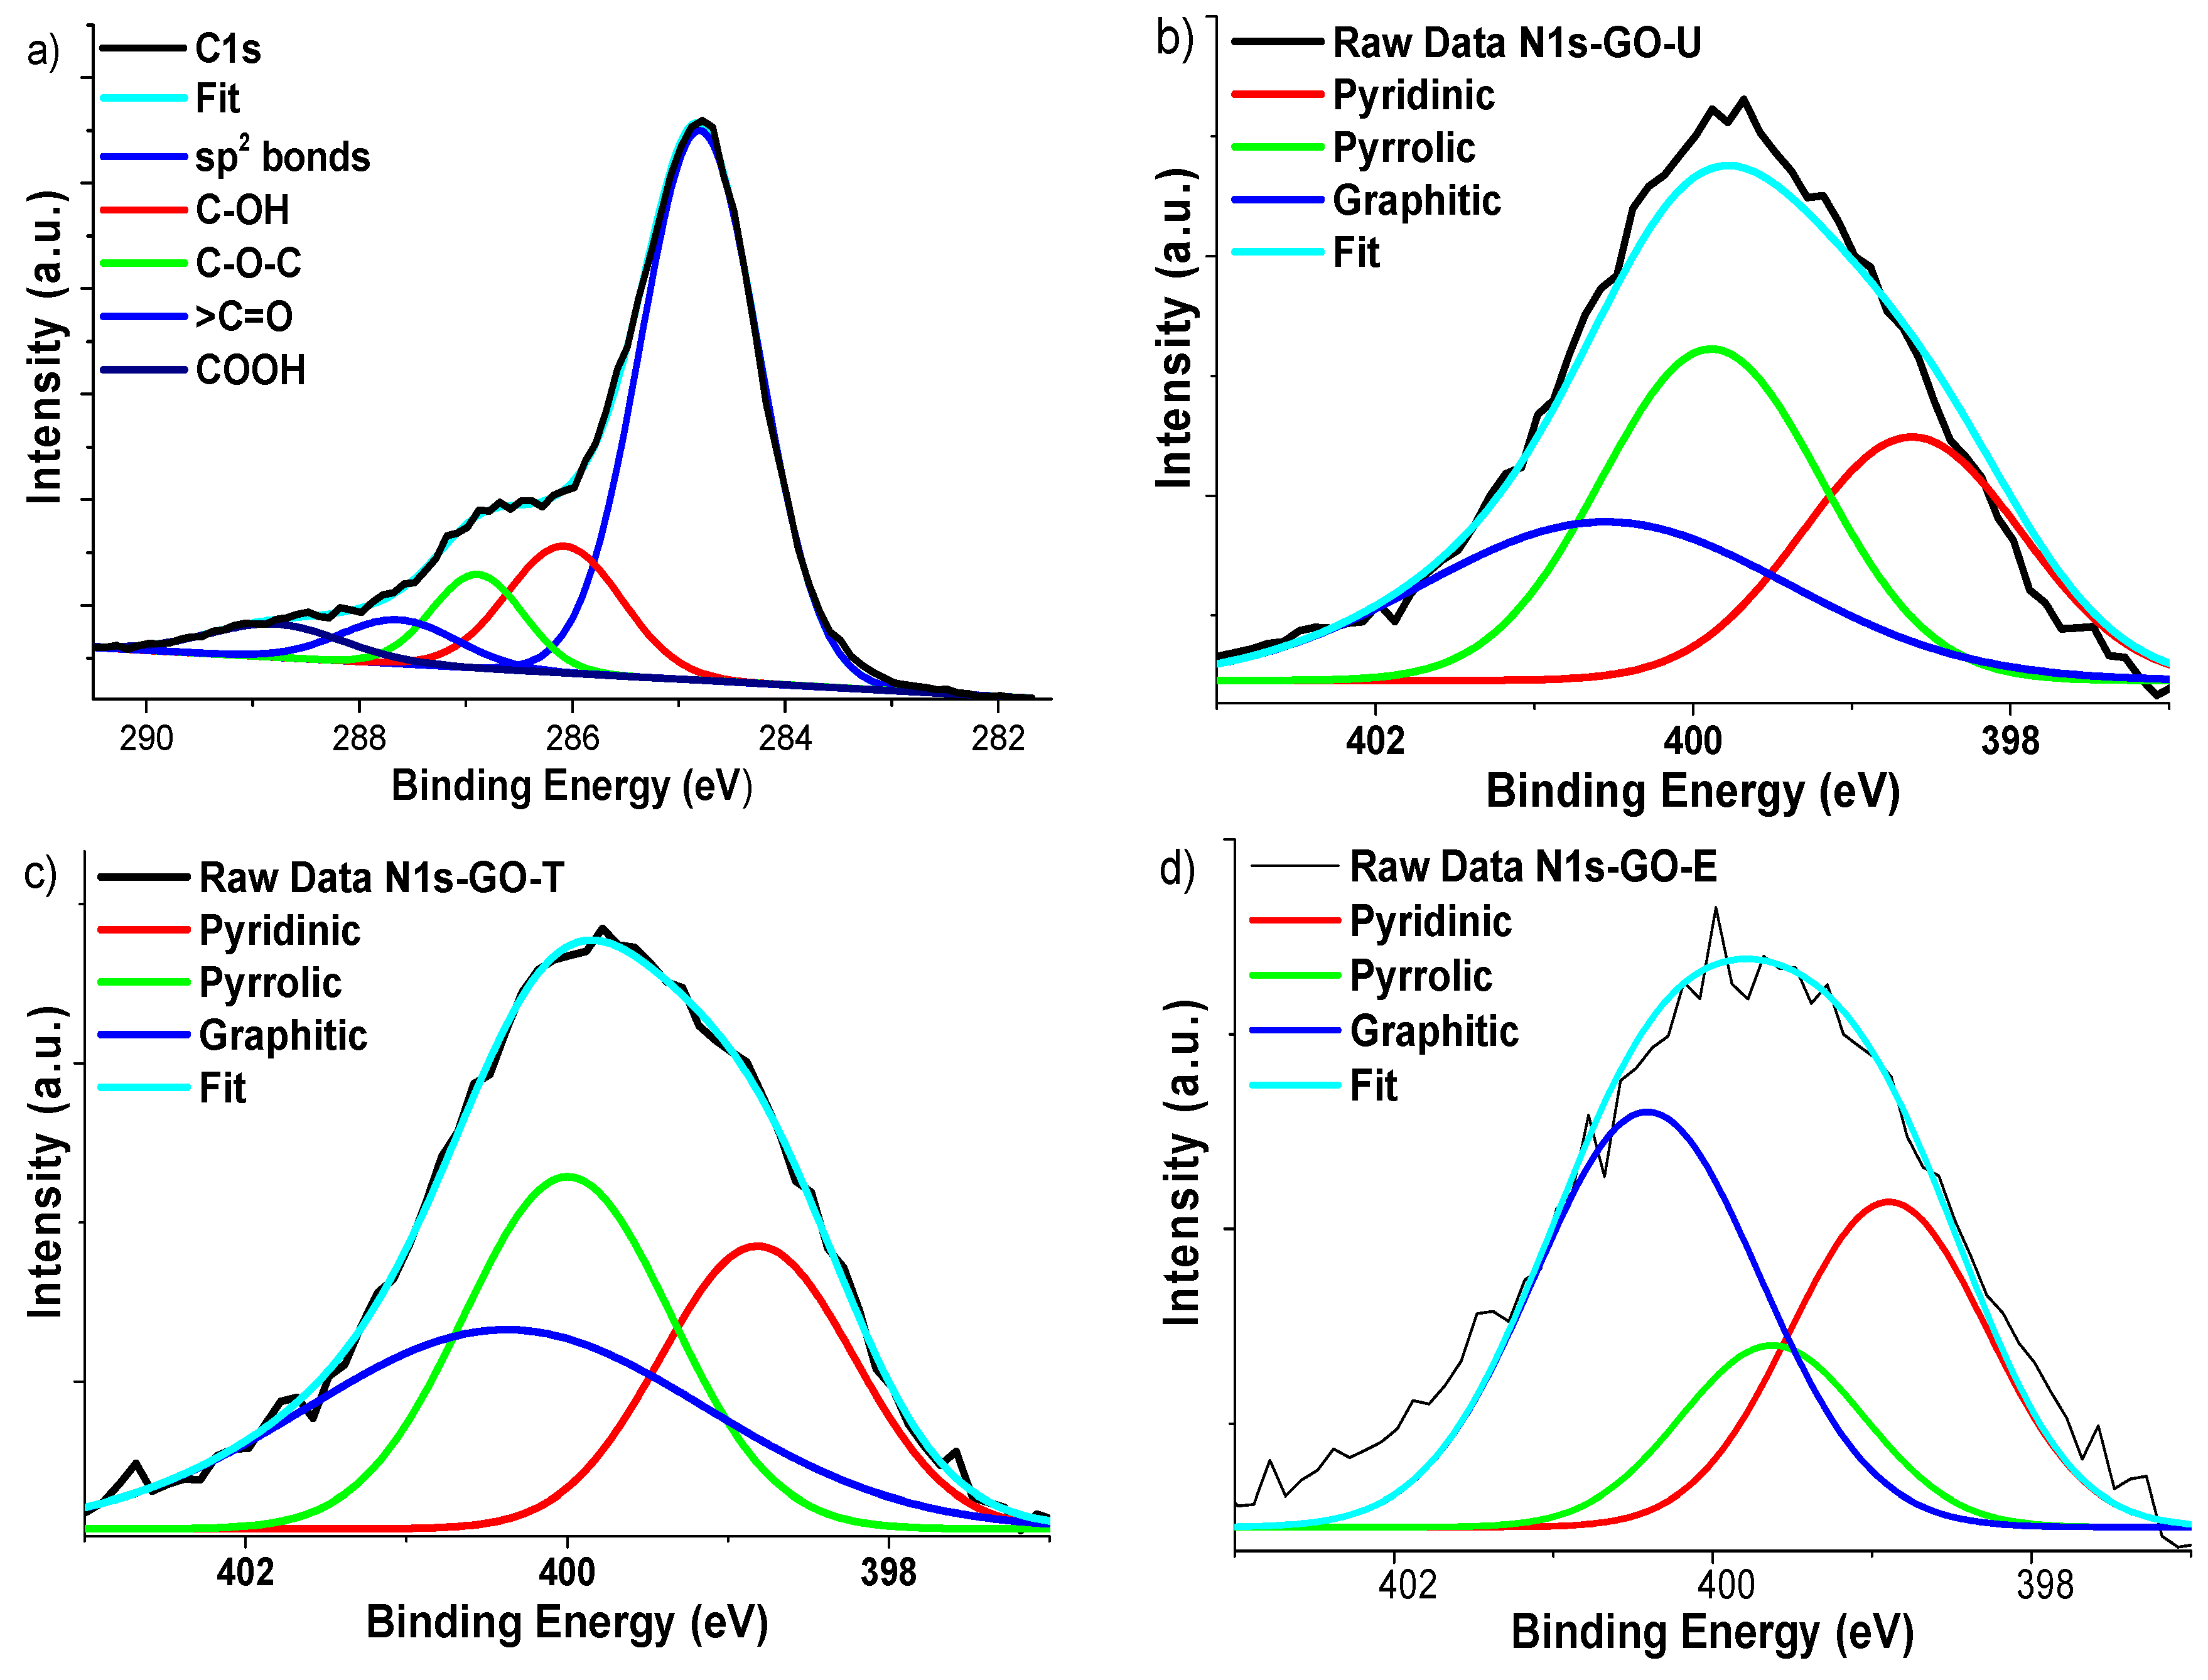
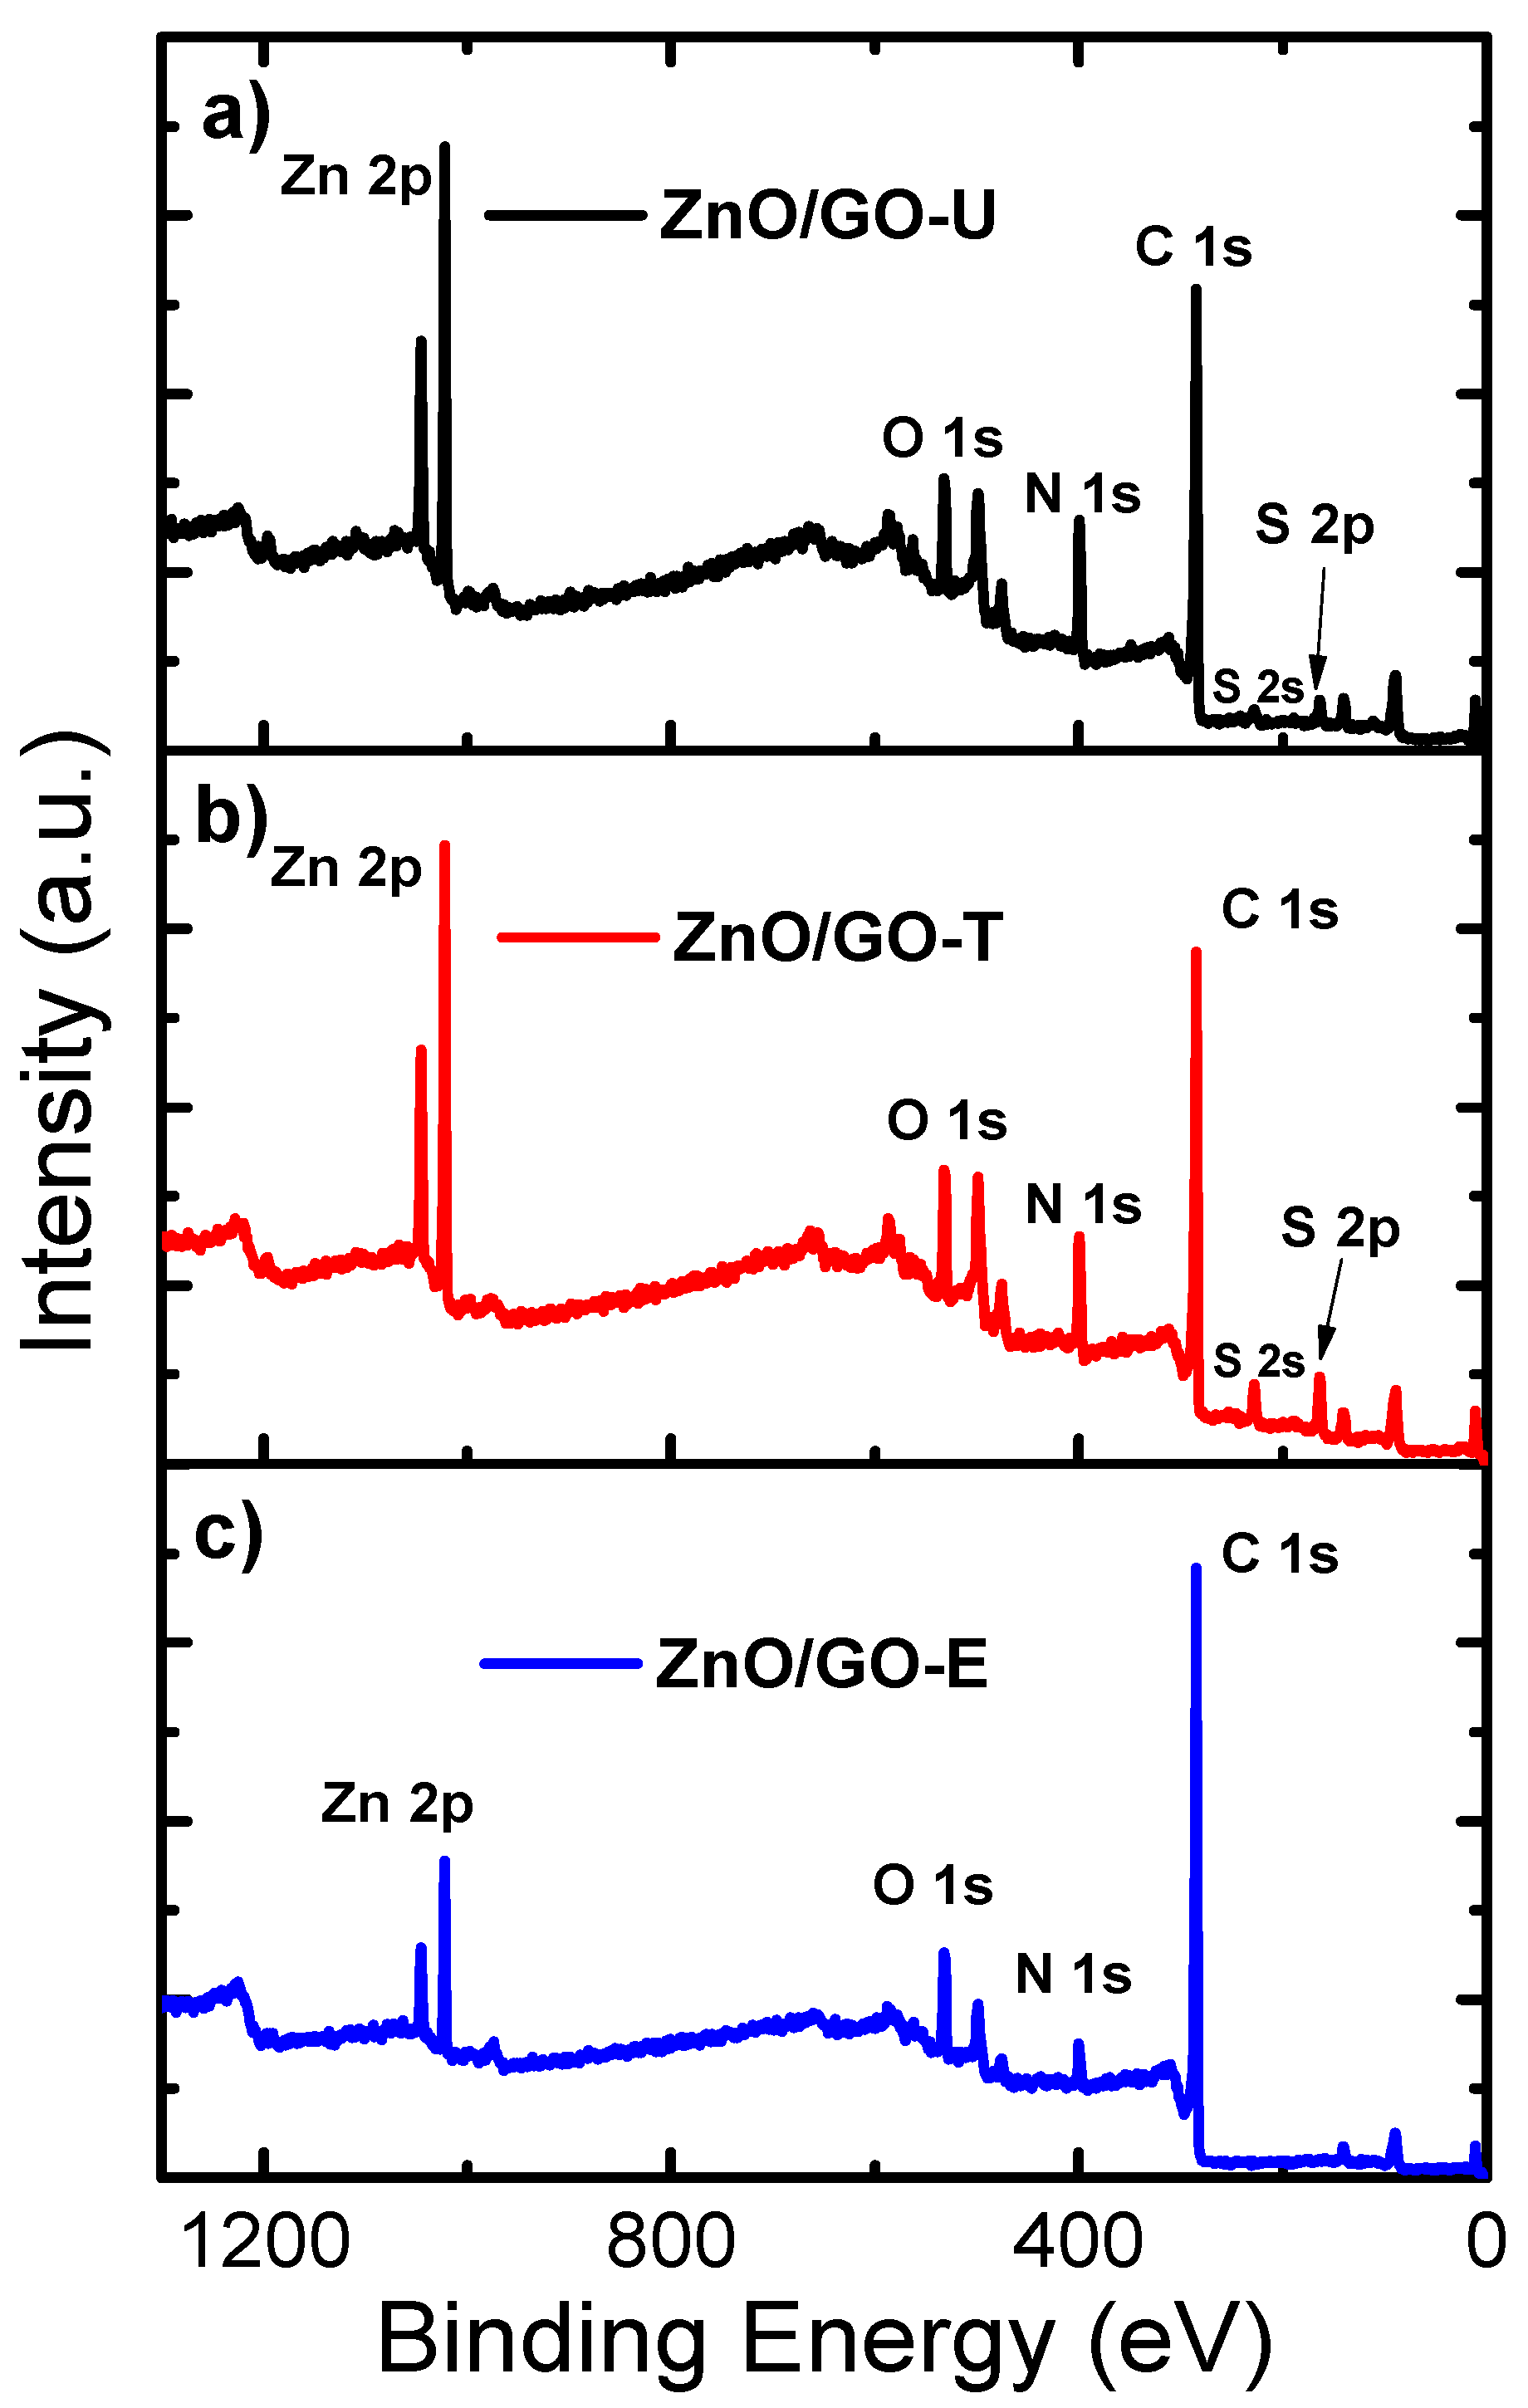
2.4. X-ray Photoelectron Spectroscopy

Surface chemical composition studies were performed by XPS analysis to confirm the presence of the major elements on each of the synthesized compounds, and to confirm the presence of nitrogen on the doped samples. The GO presented central lines at 533.08 eV and 285.08 eV corresponding to O 1s and C 1s, respectively (see Figure 5a). No signal from any other element, including nitrogen was detected. In Figure 5b, the general XPS spectrum of ZnO is presented. The spectral lines of Zn 2p3/2 and O 1s can be observed at 1021.08 eV and 530.08 eV, respectively. These values are associated with Zn2+ cations and O2− anions [33]. After the doping treatment, XPS analysis was performed to confirm the presence of nitrogen in the GO-N compounds. From the analysis results, binding energy (BE) values of 399 ± 0.1 eV associated with N 1s were detected in the three samples. Furthermore, the survey spectrum, Figure 5c–e, shows the presence of C and O in their 1s state. The peak at 164 eV and 230 eV in Figure 5c,d could be assigned to elemental S 2p and S 2s orbitals, respectively, which are associated with residues from GO synthesis [34,35]. In addition, a remarkable decrease in the intensity signal of O 1s due to the exfoliation of the GO sheets and the reduction of oxygenated groups should be noticed. These results are consistent with those of the XRD analyses.
Chemical composition of the main elements present in the ZnO, GO, and ZnO/GO-N compounds are presented in Table 1, where it can be observed that the concentration of nitrogen in the supported compounds varies from 5.32% to 14.08%.
High-resolution spectra were performed on the GO and GO-N compounds at the binding energy values corresponding to C 1s and N 1s, respectively, in order to determine the oxygen and nitrogen species present in the samples. The O present in GO is associated with the following functional groups: C-OH (hydroxyl groups), O-C-O (epoxy groups), C=O (carbonyl groups), and COOH (carboxyl groups) due to graphite oxidation (see Figure 6a) [25]. The mathematical deconvolution adjustments in the GO-N samples, provided three contributions assigned to different species of N, see Figure 6b–d. The first and second contributions focused on 398.9 ± 0.2 eV and 399.8 ± 0.2 eV corresponding to pyridinic-N and pyrrolic-N, respectively [36,37]. In both cases, N shares bonds with two C atoms and donates one or two electrons to the π aromatic system, the pyridinic-N in the basal plane, and the pyrrolic-N at the edges of the hexagonal structure. The third contribution, centered at 400.4 ± 0.2 eV, is attributed to the graphitic-N bond [37,38]. In this type of bond, the N establishes three bonds with the carbon atoms, replacing carbon atoms within the hexagonal graphene network. Table 2 shows the atomic percentage of N for each of the GO-N samples and the percentage of each species. In Table 2, it can be observed that the nitrogen atomic % present on each sample depends on the precursor used. The GO-U sample was the one with the highest atomic % of N. It can also be seen that the graphitic-N configuration is predominant in the GO-T and GO-E samples according to the area calculated for each compound.
Once the nitrogen doping was confirmed, the ZnO particles were supported on the GO-N systems. The survey spectra (see Figure 7) presented the main distinguishing lines of the Zn 2p3/2, O 1s, N 1s, and C 1s elements in the samples as well as their characteristic BE values located at 1022 ± 0.1 eV, 531 ± 0.1 eV, 399 ± 0.1 eV, and 285 ± 0.1 eV, confirming the formation of the ZnO/GO-U, ZnO/GO-T, and ZnO/GO-E supported compounds [39].

2.5. Specific Surface Area Determination

Surface area measurement studies were carried out using the Brunauer–Emmett–Teller (BET) method. The obtained results for the ZnO/GO-N compounds were as follows: ZnO/GO-U = 14.45 m2g−1, ZnO/GO-T = 15.31 m2g−1, and ZnO/GO-E = 20.60 m2g−1. The attained value for GO was 11 m2g−1, while for the ZnO compound it was 19.9 m2g−1. For all the cases, the values for supported systems are minor in comparison to the ZnO compound which could be due to the small amount of ZnO dispersed on the GO (20%, w/w).

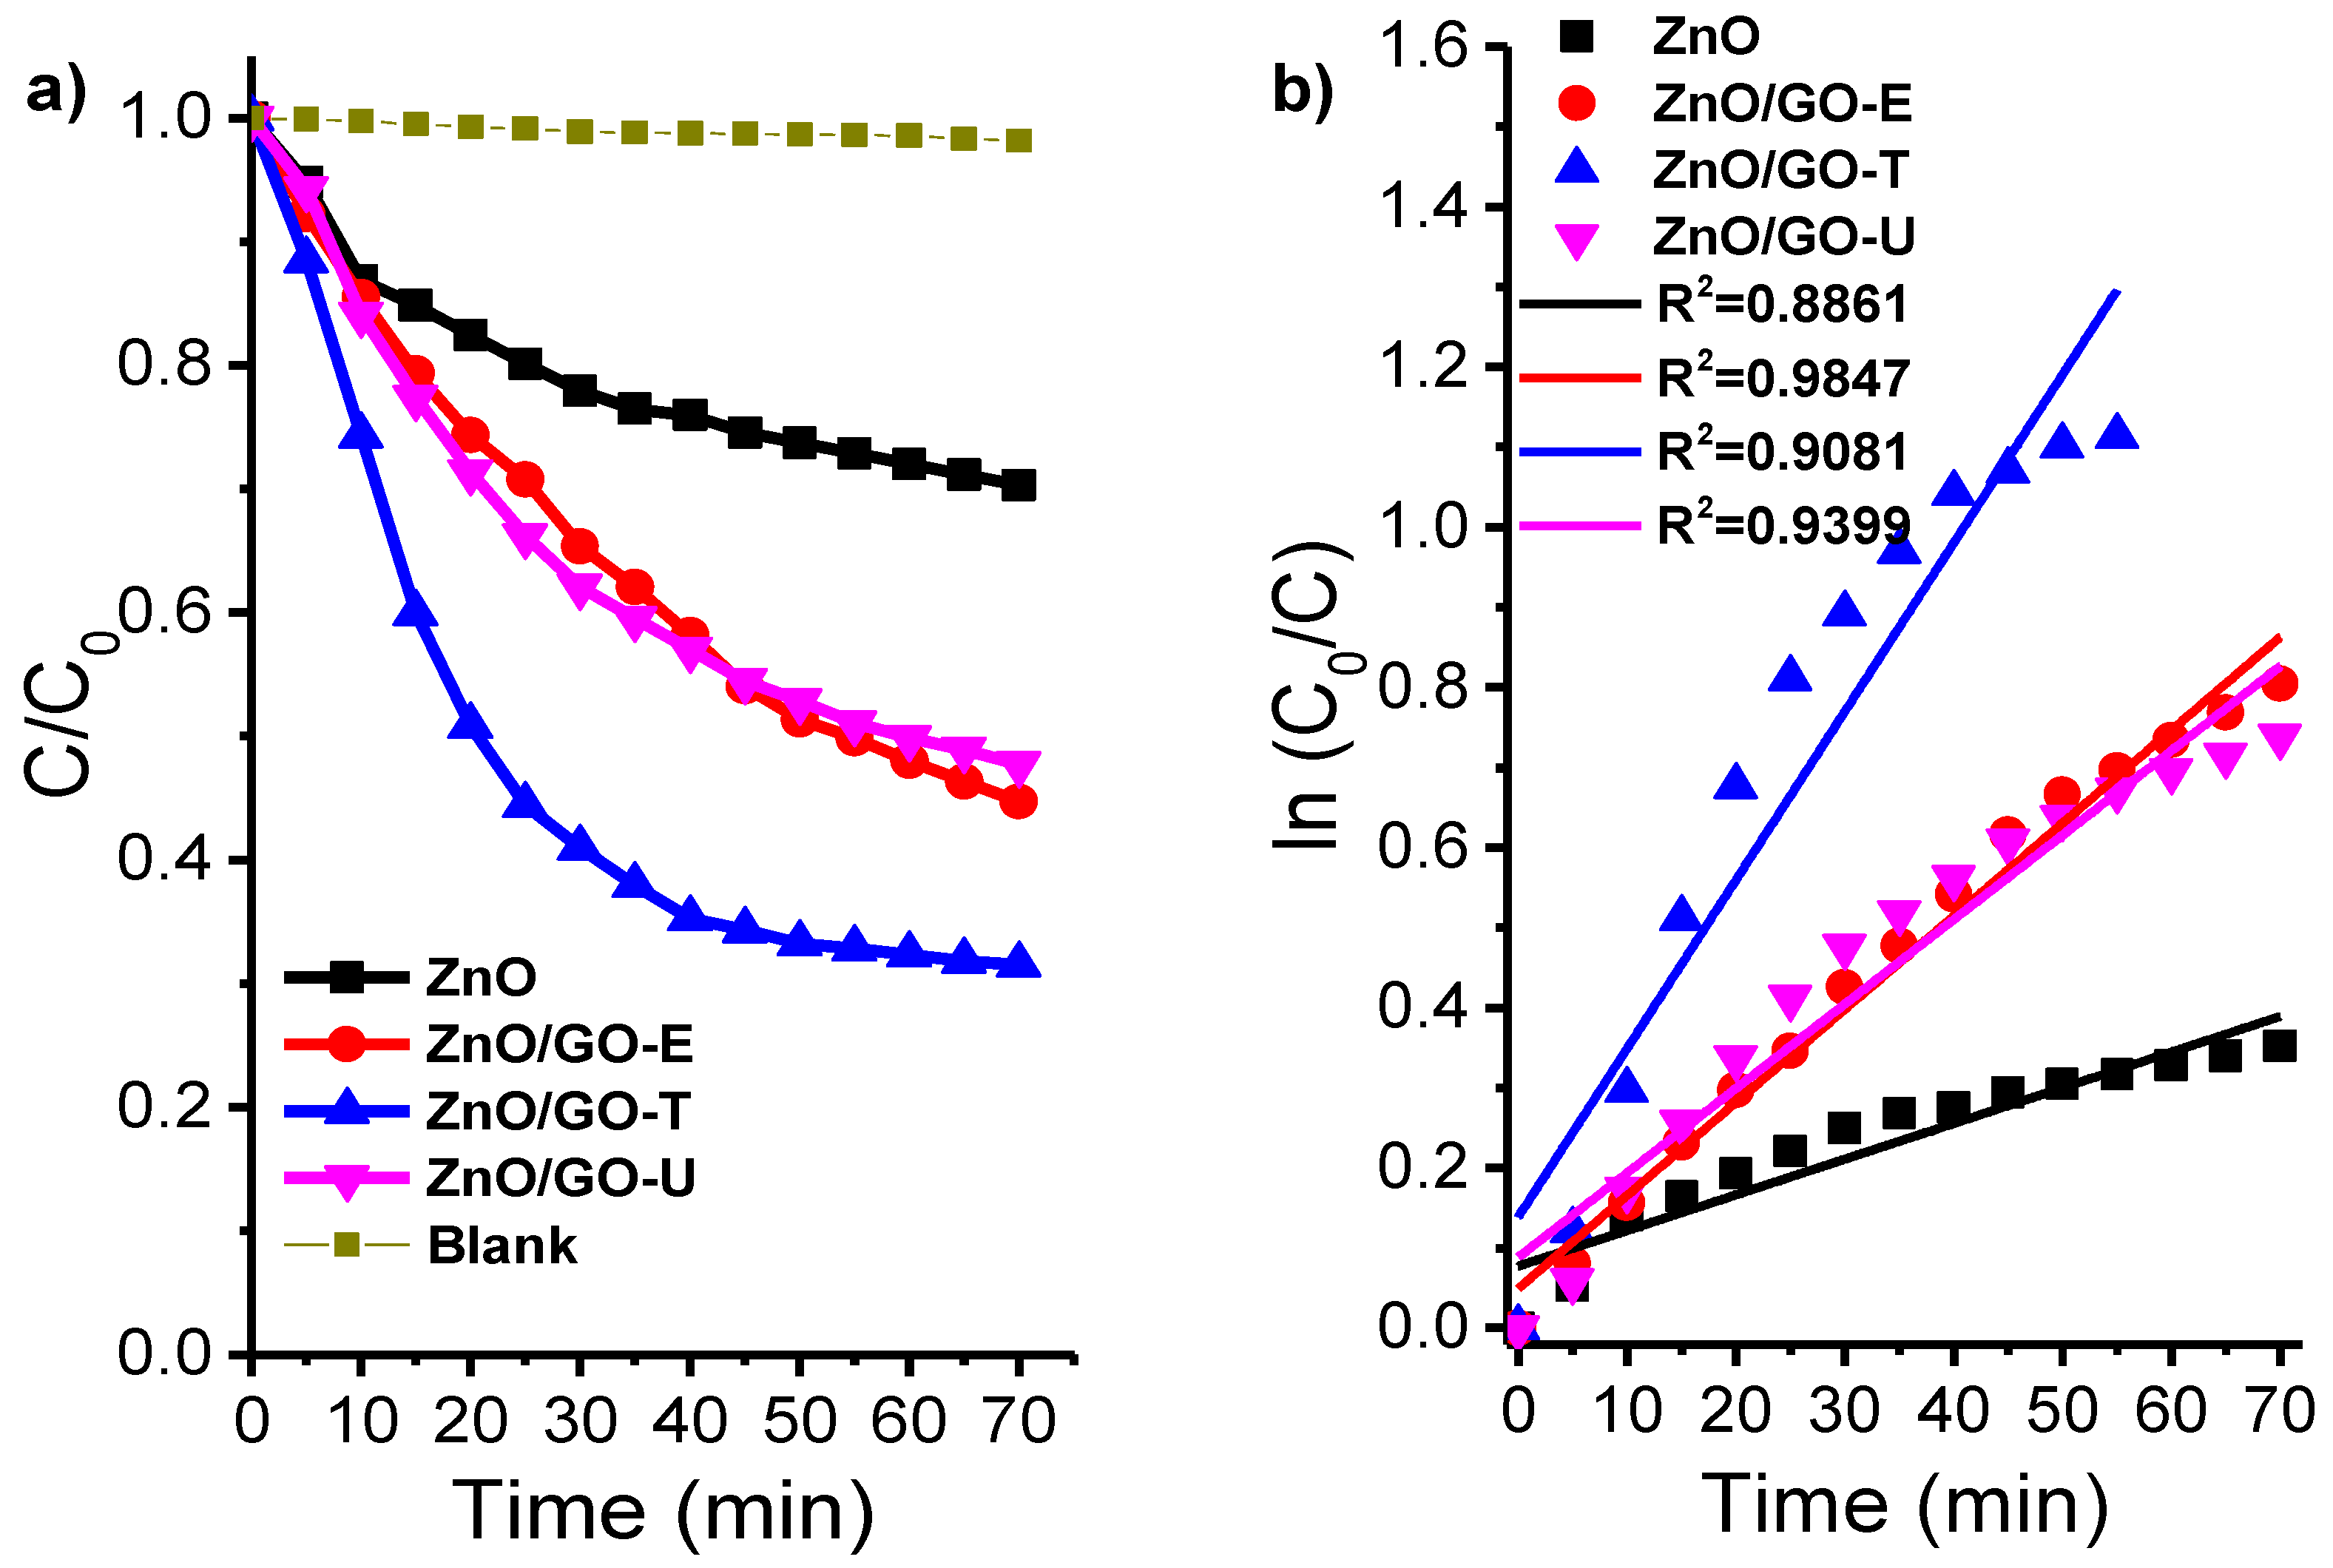
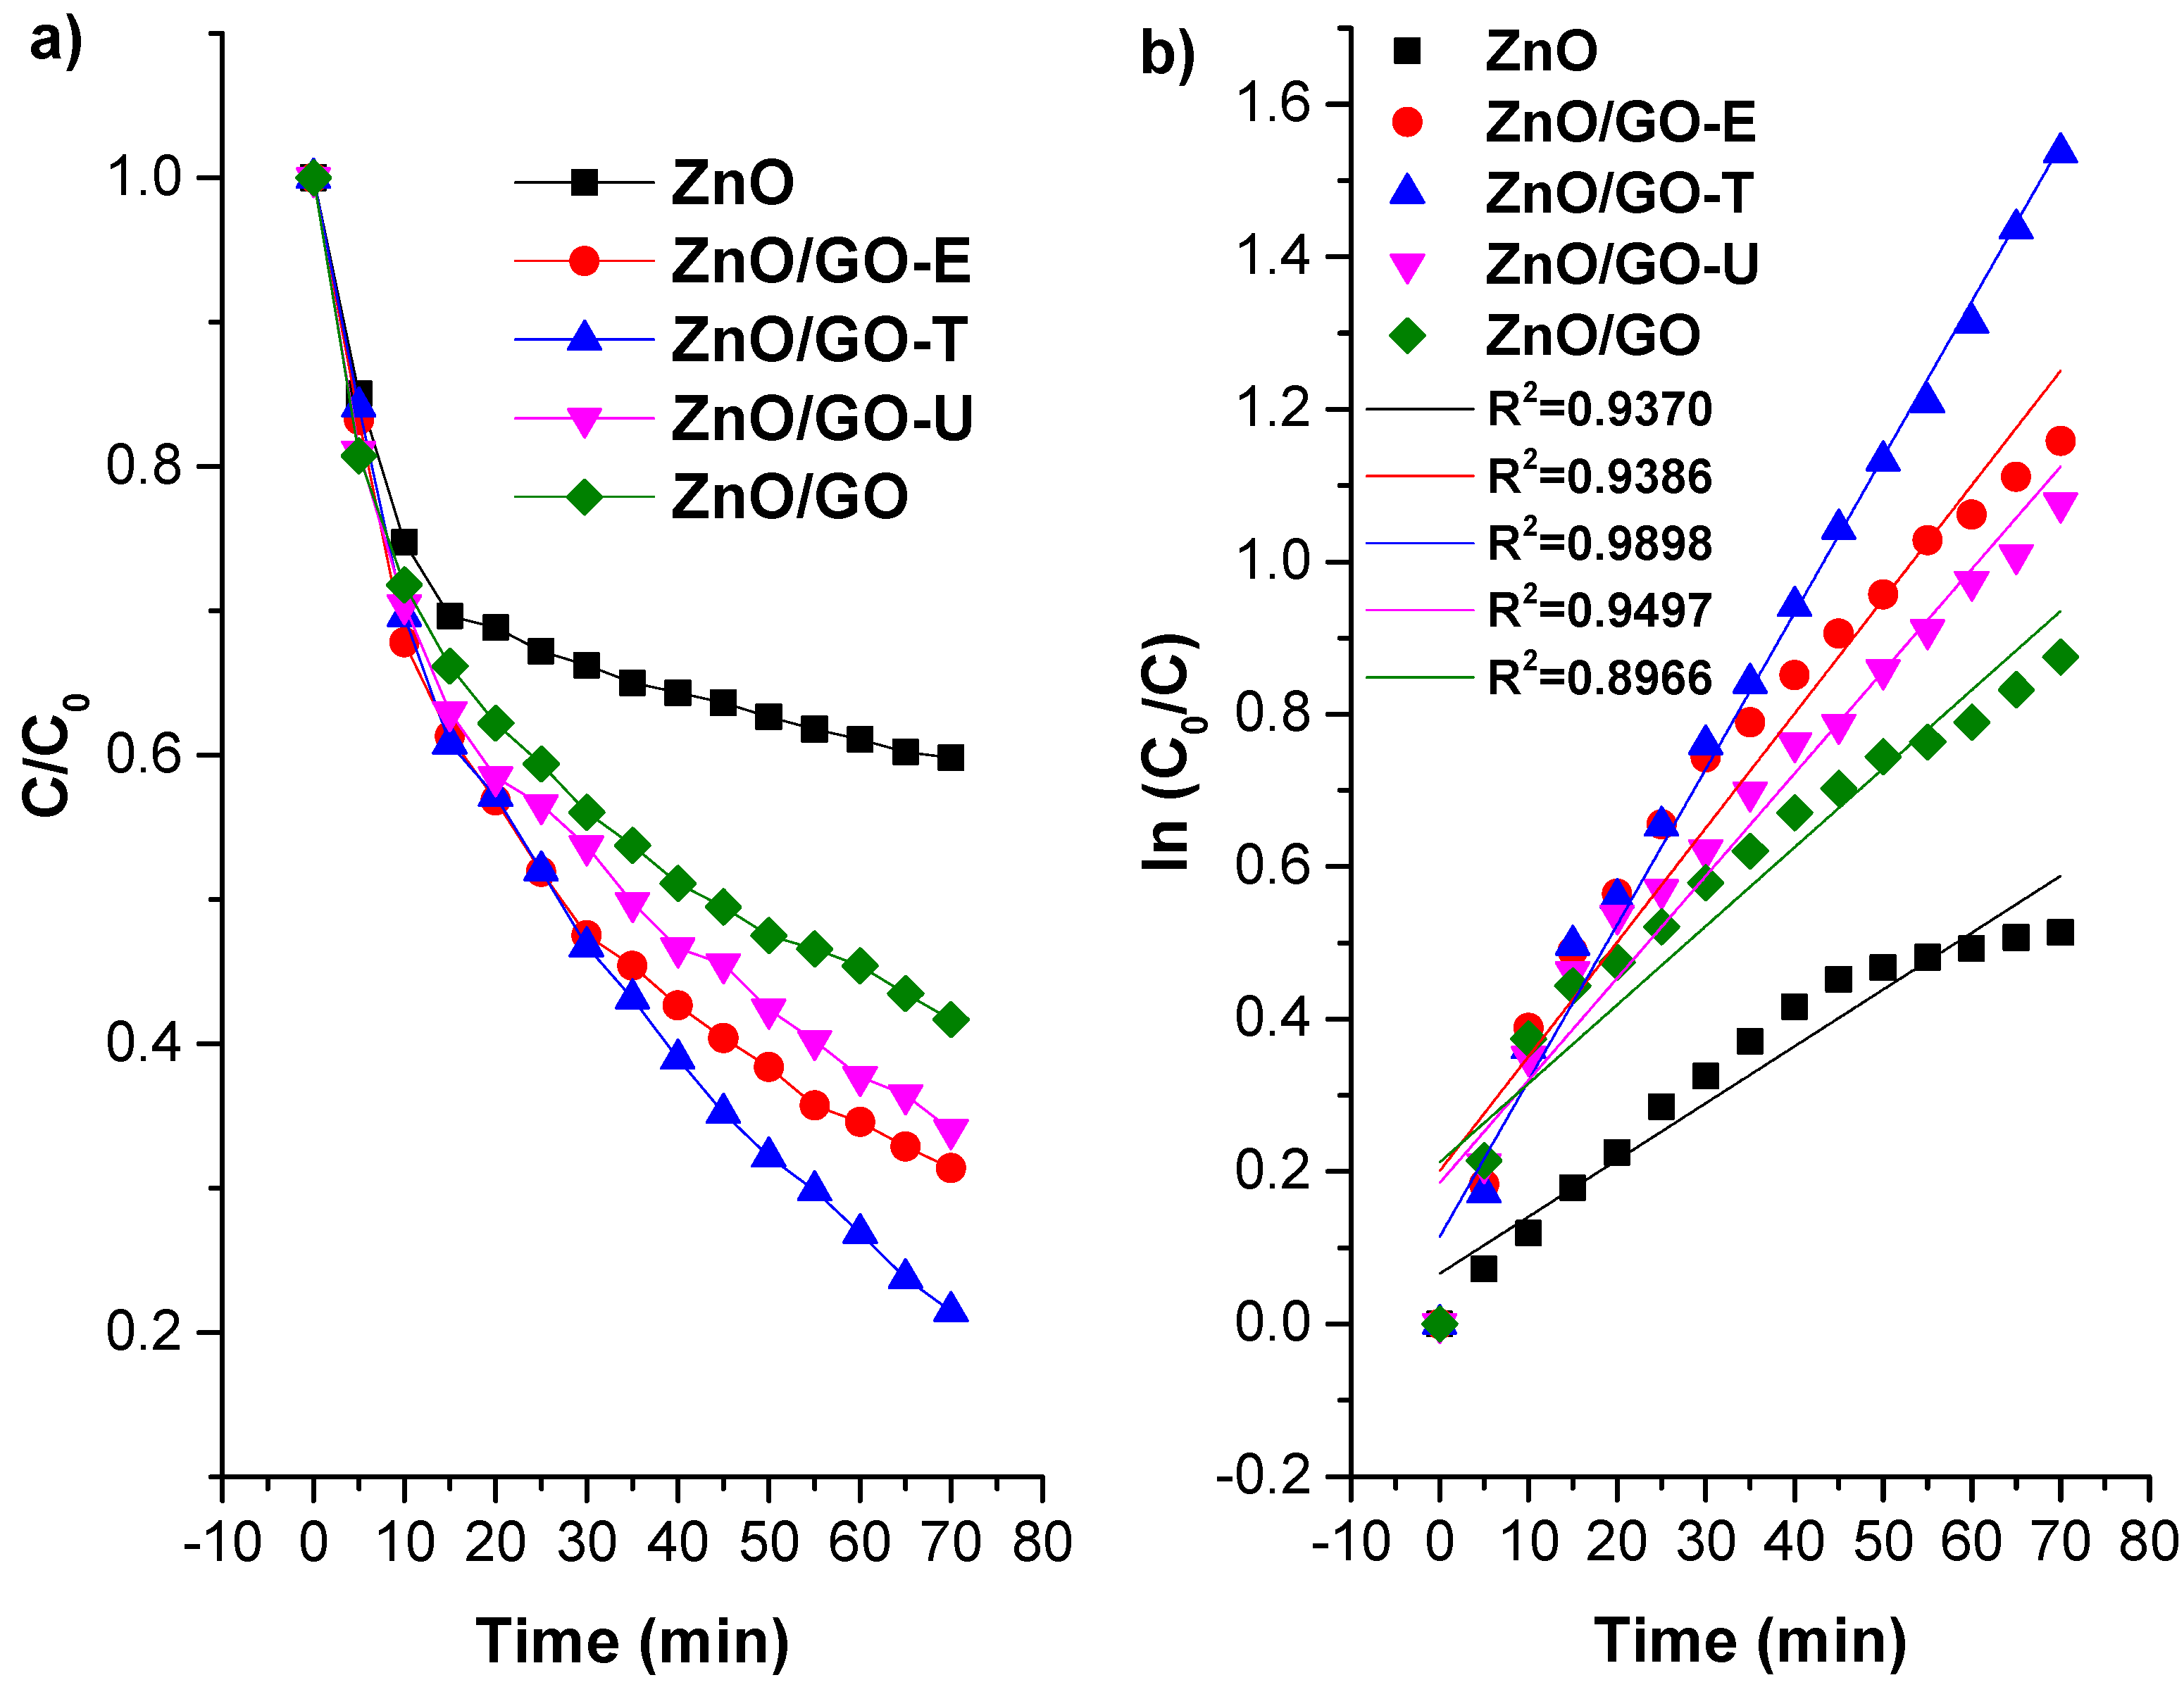
3. Photocatalytic Activity Tests

The synthesized compounds were evaluated with a photocatalytic process, firstly, using a reference compound such as methylene blue (MB) and, secondly, using lignin, which is a more complex molecule and considered an unwanted by-product, as discussed earlier. Both processes were evaluated under UV energy irradiation according to the methodology described before. The degradation percentage η was calculated from the following equation: η = (1 − C/C0) × 100, where C is the instantaneous concentration for an irradiation interval (t), and C0 represents the initial concentration. Figure 8a shows the change in MB concentration under UV energy irradiation. It can be seen that the MB concentration change is marginal in the absence of irradiation (blank test). On the other hand, a decrease in MB concentration is observed in the presence of ZnO, reaching 29% of MB degradation in 70 min. Conversely, the ZnO photocatalysts supported on GO-N showed better photocatalytic performance, degrading up to 70% from their starting concentration. The rate constant (κ) values calculated for ZnO, ZnO/GO-U, ZnO/GO-E, and ZnO/GO-T were 0.0045 min−1, 0.0105 min−1, 0.0116 min−1, and 0.021 min−1, respectively. The R-statistics value for the considered first reaction order, ln (C0/C) = κ t, was close to 0.93 ± 0.05 (see Figure 8b). According to the achieved degradation and the obtained κ values, the ZnO/GO-T compound presented a faster photocatalytic performance, approximately 4.6 times higher than that observed for ZnO, demonstrating the increase in the degradation rate.
In Figure 9a, the results in lignin concentration in the presence of the synthesized photocatalysts under UV irradiation are displayed. Photolysis studies were carried out initially to rule out lignin degradation in the absence of UV energy irradiation, showing negligible changes in its concentration. In Figure 9a, it can be seen that the supported systems showed a high rate of lignin degradation compared to ZnO. The pristine ZnO compound reached 40% degradation in 70 min, while the ZnO/OG-T achieved 79% degradation for similar time values. On the other hand, the study of lignin degradation under UV irradiation was carried out using the ZnO/GO compound in order to confirm the positive influence of N doping. In Figure 9, it can be seen that the ZnO/GO compound achieved a degradation of 58% in 70 min, a lower percentage than the ZnO/GO-N compounds. The corresponding κ values were calculated following a first-order kinetic model obtaining 0.0075 min−1, 0.0134 min−1, 0.015 min−1, 0.0205 min−1, and 0.010 min−1 for ZnO, ZnO/GO-U, ZnO/GO-E, ZnO/GO-T, and ZnO/GO, respectively. The R-statistics values for the reaction order considered are shown in Figure 9b, which resulted from the fitting procedure whose values were close to 0.94 ± 0.04.
The results suggest a promising method of combining ZnO particles with N-doped GO for various photocatalytic applications. Concerning this, the beneficial role of GO-N acts first as an additional adsorbent for contaminant molecules which then diffuse to the phase boundary or interface to undergo effective decomposition [40,41]. In this sense, oxygenated functional groups, such as carboxyl, epoxy, and hydroxyl groups, lead to a higher ionic–electro interaction and, therefore, to a better adsorption capacity [42]. When radiant energy comes into contact with the ZnO surface, electrons (e) in the valence band (VB) are promoted to the conduction band (CB), leaving positively charged holes (h+) in the VB. At this stage, e must migrate to the surface, effectively competing with the recombination process. The incorporation of N in the GO leads to more effective separation of charge by significantly increasing the conductivity and donor properties of e [27]. This leads to the possibility of more interactions between the e-h+ pair and the organic molecules H2O and O2 dissolved in the reaction medium. The e and h+ react with H2O and O2 to form hydroxyl radicals (OH•) [43]. OH• radicals are the main oxidizing species responsible for the photodegradation of most organic compounds. As can be seen, the supported compounds showed higher photocatalytic activity and different lignin and MB removal percentages. It can be assumed that the properties acquired in GO can change depending on the nitrogen source used as a precursor.

4. Materials and Methods

4.1. Chemicals

Graphite powder, synthetic lignin, methylene blue, and ethylenediamine (C2H8N2) were purchased from Sigma-Aldrich, while sulfuric acid (H2SO4) 98% and urea (CH₄N₂O) 98% were provided by Golden Bell reagents. Sodium hydroxide (NaOH) 98%, potassium permanganate (KMnO4), thiourea (CH4N2S), and ethylene glycol (HOCH2CH2OH) 99% were from JT Baker. Hydrogen peroxide (H2O2), 30% (w/w) was from Karal. Hydrochloric acid (HCl) 38% was from Mallinckrodt Chemicals. Zinc acetate [Zn(C2H3O2)2·2H2O] 98% was from Alyt chemicals. All reagents were used without any further treatment.

4.2. ZnO Synthesis

In a beaker containing 15 mL of H2O, 5.95 g of zinc acetate was dissolved using magnetic stirring. The clear solution was left under constant stirring for 40 min with the temperature controlled at 40 °C. Subsequently, 10 mL of a 10% (w/w) solution of ethylene glycol and 10 mL of a 0.2 M solution of NaOH were added. To complete the synthesis of the ZnO particles, the solution was transferred to a Teflon vial, placed in a microwave reactor, and subsequently heated up to 140 °C with a heating ramp of 10 °C min−1. The reaction was carried out for 40 min. Afterwards, the solution was filtered and washed several times, and the product was dried at 100 °C overnight. The obtained white powder was ground in an agate mortar and sieved [44].

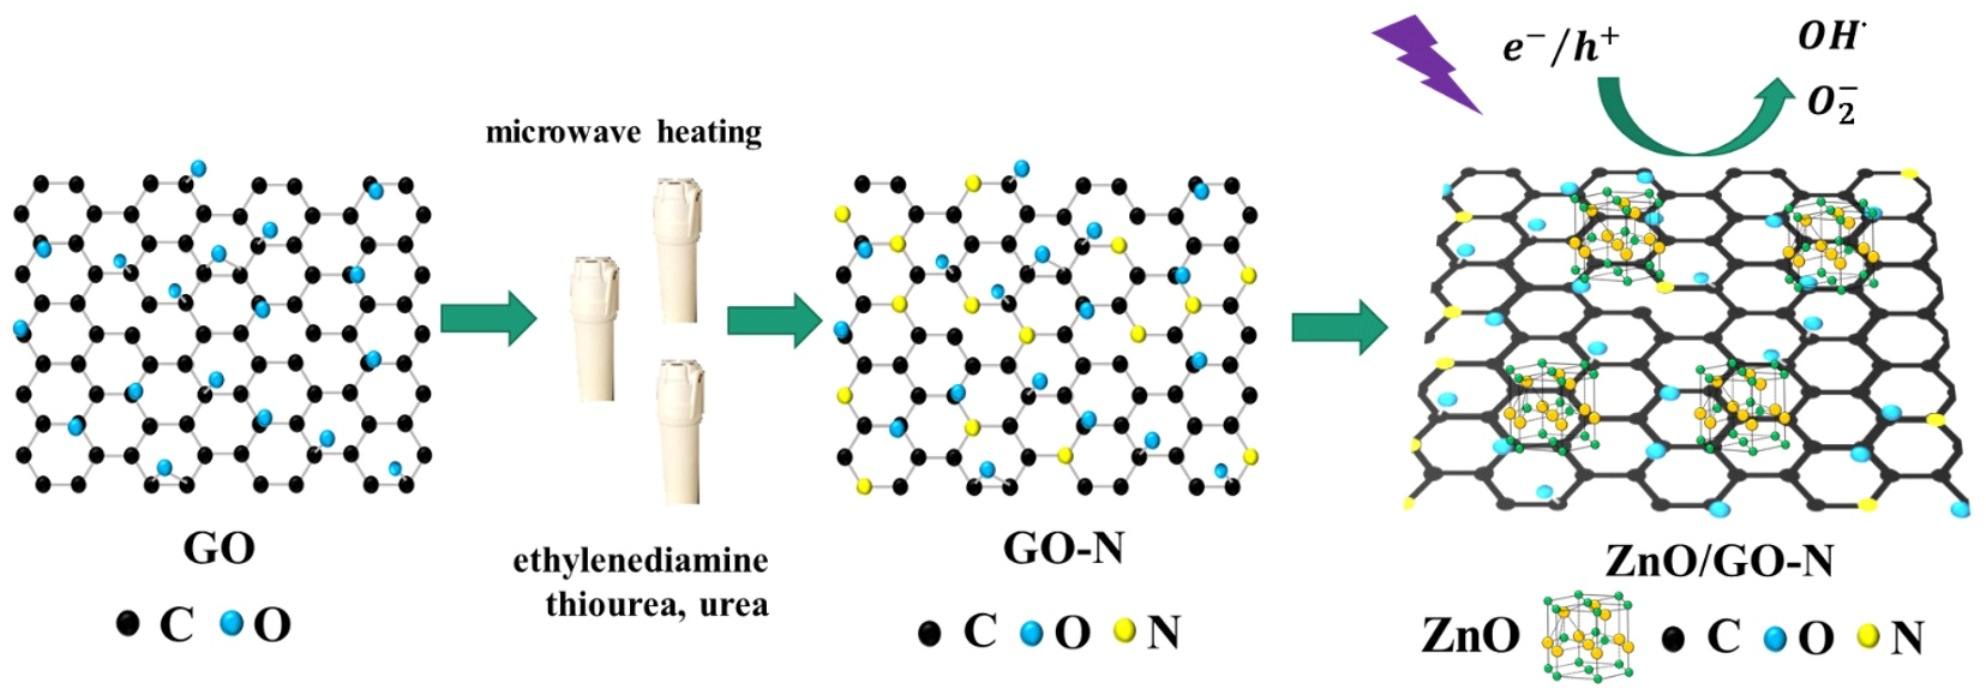
4.3. Synthesis of Graphene Oxide and Nitrogen-Doping

To prepare the graphene oxide sheets, the Hummers methodology was followed starting with graphite powder, as described in the references [44,45]. The procedure to carry out the N-doping was the following. In a beaker containing 10 mL of ethylene glycol, 15 mL of deionized water was slowly added. After 5 min of continuous magnetic stirring, 0.2 g of graphene oxide was incorporated. The mixture was transferred to an ultrasonic stirrer for 1 h. The beaker was placed on a magnetic heating plate, and 20 mL of a 4 M solution of thiourea was dropwise added. The solution remained under magnetic stirring for about 1 h before being transferred to a Teflon vial container and placed in a microwave reactor adjusted to a temperature of 140 °C for a period of 30 min. The solution was cooled to room temperature and thoroughly washed before being later dried at 90 °C for 36 h. The procedure was repeated for the nitrogen doping of the graphene oxide sheets with a 4 M solution of ethylenediamine then urea.

4.4. Synthesis of ZnO/GO-N Systems

The ZnO particles were supported on the GO-N sheets in a nominal 20/80 (w/w) ratio. In a glass vial, 5 mL of isopropyl alcohol, 0.2 g of ZnO, and 0.8 g of GO-N were added. The mixture was transferred to ultrasonic equipment and the solution was sonicated for 2 h. Subsequently, the solution was dried at 80 °C overnight.

4.5. Characterization

For the synthesis of the ZnO and GO-N compounds, a microwave reaction system was used. A Synthons 3000 microwave reactor from the Anton Paar company was used. The reaction conditions for all the syntheses were: 18 atm pressure and 600 W power using a heating ramp of 10 °C min−1. The band gap energy (Eg) was determined from diffuse reflectance spectra. An Avantes UV-Vis spectrometer, model AvaSpec-2048 Fiber Optic Spectrometer, was used and provided with a deuterium halogen source model AvaLight-DH-S-BAL from Avantes equipped with an integrating sphere model ISP-50-8-R-GT from Ocean Optics company. In addition, UV-Vis equipment was used to monitor degradation reactions following the absorbance spectra. BET specific surface area measurements were performed using Micrometrics Gemini model 2060 RIG-100 equipment. The study of the crystalline phases of the compounds was performed by X-ray diffraction (XRD) (Philips X’Pert analytical diffractometer, Amsterdam, the Netherlands) using Cu-Kα radiation (λ =0.154 nm). Field emission scanning electron microscopy (FE-SEM, JEOL JSM 7601F, Tokyo, Japan) was used to determine morphology in the samples. X-ray photoelectron spectroscopy (XPS) was used for surface chemical analysis, and a K-Alpha Thermo Scientific equipment was used for that purpose. Every sample was eroded for 15 s with argon to remove surface impurities.

4.6. Degradation Studies

The degradation procedures were carried out using a quartz reactor and a 200 W mercury UV lamp with an emission peak at 250 nm. In all the degradations, the lamp was placed 10 cm above the quartz cell, and they were carried out with constant magnetic stirring. The degradations were monitored using a UV-Vis spectrophotometer, and the absorbance readings were recorded at 299 nm for lignin and 664 nm for MB (40 ppm). The lignin solution was prepared by diluting 0.02 g of synthetic lignin into 5 mL of a previously prepared NaOH solution (0.05 M). The pH = 8 value of the solution was adjusted with a 0.05 M solution of NaOH [46]. In each experiment, 20 mL of a solution (lignin or MB) and 0.0125 g of photocatalyst were used. Once the photocatalyst had been added, the solution was left under constant stirring for 20 min and in darkness. Subsequently, the solution was irradiated with UV energy, achieving absorbance readings every 5 min. The degradation studies were carried out under constant stirring.

5. Conclusions

In the present work, the adequate preparation of supported ZnO/GO-N compounds has been demonstrated. The consequences of nitrogen doping of graphene oxide (GO-N) using urea, thiourea, or ethylenediamine has been discussed. These compounds were successfully used as catalytic supports for ZnO. N-doping of GO was confirmed through XPS analyses. The synthesized compounds were tested in a photocatalytic process to study the degradation of MB and lignin. The obtained results showed that the ZnO/GO-N compounds provide an improved photocatalytic behavior compared to pristine ZnO. The noticeable increase in degradation is attributed to electronic interactions between the ZnO and GO-N compounds. N-doping improved the electronic performance of GO, endorsing an increase in the conductivity of the photogenerated charge carriers in ZnO. The differences in the attained photocatalytic degradation values are attributed to the nitrogen source used as a precursor: the ZnO/GO-T system, the one that showed the best response in terms of lignin degradation. Our results demonstrate that GO-supported materials are viable for their use in environmental applications. The results motivate us to optimize the doping process to improve the photocatalytic degradation process.

Author Contributions

Conceptualization, R.R. and A.R.-C.; Methodology, R.R., A.R.-C., P.Q. and P.B.-P.; Validation, R.R., A.R.-C., P.Q. and P.B.-P.; Formal analysis, J.E. and P.Q.; Investigation, R.R. and P.B.-P.; Resources, J.E.; Data curation, R.R. and P.B.-P.; Writing—original draft, R.R.; Writing—review & editing, R.G.; Supervision, R.G.; Funding acquisition, R.G. All authors have read and agreed to the published version of the manuscript.

Funding

This research received no external funding.

Data Availability Statement

Data is unavailable due to privacy.

Acknowledgments

R. Rangel acknowledges CIC-UMSNH under project 2022. A. Ramos acknowledges CONACYT for the scholarship provided.

Conflicts of Interest

The authors declare that they have no known competing financial interests or personal relationships that could have appeared to influence the work reported in this paper.

References

  1. Kashinath, L.; Namratha, K.; Byrappa, K. Microwave Assisted Facile Hydrothermal Synthesis and Characterization of Zinc Oxide Flower Grown on Graphene Oxide Sheets for Enhanced Photodegradation of Dyes. Appl. Surf. Sci. 2015, 357, 1849–1856. [Google Scholar] [CrossRef]
  2. Pei, L.Z.; Wei, T.; Lin, N.; Yu, H.Y. Synthesis of Zinc Oxide and Titanium Dioxide Composite Nanorods and Their Photocatalytic Properties. Adv. Compos. Lett. 2016, 25, 9–15. [Google Scholar] [CrossRef]
  3. Hsieh, S.H.; Chen, W.J.; Yeh, T.H. Degradation of Methylene Blue Using ZnSe-Graphene Nanocomposites under Visible-Light Irradiation. Ceram. Int. 2015, 41, 13759–13766. [Google Scholar] [CrossRef]
  4. Li, H.; Lei, Z.; Liu, C.; Zhang, Z.; Lu, B. Photocatalytic Degradation of Lignin on Synthesized Ag-AgCl/ZnO Nanorods under Solar Light and Preliminary Trials for Methane Fermentation. Bioresour. Technol. 2015, 175, 494–501. [Google Scholar] [CrossRef]
  5. Oros, G.; Forgacs, E.; Cserha, T. Removal of Synthetic Dyes from Wastewaters: A Review. Environ. Int. 2004, 30, 953–971. [Google Scholar] [CrossRef]
  6. Feng, H.; Zhou, W.; Zhang, X.; Zhang, S.; Liu, B.; Zhen, D. Synthesis of Z-Scheme Mn-CdS/MoS2/TiO2 Ternary Photocatalysts for High-Efficiency Sunlight-Driven Photocatalysis. Adv. Compos. Lett. 2019, 28, 1–10. [Google Scholar] [CrossRef] [Green Version]
  7. Ferreira, V.R.A.; Azenha, M.A.; Pereira, C.M.; Silva, A.F. Preparation of Molecularly Imprinted Hollow TiO2 Microspheres for Selective Photocatalysis. Chem. Eng. J. Adv. 2021, 5, 100071. [Google Scholar] [CrossRef]
  8. Mehdi Sabzehmeidani, M.; Karimi, H.; Ghaedi, M. CeO2 Nanofibers-CdS Nanostructures n–n Junction with Enhanced Visible-Light Photocatalytic Activity. Arab. J. Chem. 2020, 13, 7583–7597. [Google Scholar] [CrossRef]
  9. Huang, Y.; Sun, F.; Wu, T.; Wu, Q.; Huang, Z.; Su, H.; Zhang, Z. Photochemical Preparation of CdS Hollow Microspheres at Room Temperature and Their Use in Visible-Light Photocatalysis. J. Solid State Chem. 2011, 184, 644–648. [Google Scholar] [CrossRef]
  10. Zhang, X.; Ren, G.; Zhang, C.; Xue, J.; Zhao, Q.; Li, R.; Wang, Y.; Fan, C. Assisting Bi2MoO6 Microspheres with Phenolic Resin-Based ACSs as Attractive Tailor-Made Supporter for Highly-Efficient Photocatalytic CO2 Reduction. Green Energy Environ. 2021, 6, 693–702. [Google Scholar] [CrossRef]
  11. Di Mauro, A.; Farrugia, C.; Abela, S.; Refalo, P.; Grech, M.; Falqui, L.; Privitera, V.; Impellizzeri, G. Synthesis of ZnO/PMMA Nanocomposite by Low-Temperature Atomic Layer Deposition for Possible Photocatalysis Applications. Mater. Sci. Semicond. Process. 2020, 118, 105214. [Google Scholar] [CrossRef]
  12. Kubiak, A.; Żółtowska, S.; Gabała, E.; Szybowicz, M.; Siwińska-Ciesielczyk, K.; Jesionowski, T. Controlled Microwave-Assisted and PH-Affected Growth of ZnO Structures and Their Photocatalytic Performance. Powder Technol. 2021, 386, 221–235. [Google Scholar] [CrossRef]
  13. Ohnishi, H.; Matsumura, M.; Tsubomura, H.; Iwasaki, M. Bleaching of Lignin Solution by a Photocatalyzed Reaction on Semiconductor Photocatalysts. Ind. Eng. Chem. Res. 1989, 28, 719–724. [Google Scholar] [CrossRef]
  14. Yogamalar, R.; Bose, A. Synthesis, Dopant Study and Device Fabrication of Zinc Oxide Nanostructures: Mini Review. Prog. Nanotechnol. 2013, 2, 1–20. [Google Scholar]
  15. Adegoke, K.A.; Iqbal, M.; Louis, H.; Bello, O.S. Synthesis, Characterization and Application of CdS/ZnO Nanorod Heterostructure for the Photodegradation of Rhodamine B Dye. Mater. Sci. Energy Technol. 2019, 2, 329–336. [Google Scholar] [CrossRef]
  16. Ramos-Corona, A.; Rangel, R.; Alvarado-Gil, J.J.; Bartolo-Pérez, P.; Quintana, P.; Rodríguez-Gattorno, G. Photocatalytic Performance of Nitrogen Doped ZnO Structures Supported on Graphene Oxide for MB Degradation. Chemosphere 2019, 236, 124368. [Google Scholar] [CrossRef]
  17. Kavil, J.; Alshahrie, A.; Periyat, P. CdS Sensitized TiO2 Nano Heterostructures as Sunlight Driven Photocatalyst. Nano-Struct. Nano-Objects 2018, 16, 24–30. [Google Scholar] [CrossRef]
  18. Meng, X.; Zong, P.; Wang, L.; Yang, F.; Hou, W.; Zhang, S.; Li, B.; Guo, Z.; Liu, S.; Zuo, G.; et al. Au-Nanoparticle-Supported ZnO as Highly Efficient Photocatalyst for H2O2 Production. Catal. Commun. 2020, 134, 105860. [Google Scholar] [CrossRef]
  19. Liu, S.H.; Wei, Y.S.; Lu, J.S. Visible-Light-Driven Photodegradation of Sulfamethoxazole and Methylene Blue by Cu2O/RGO Photocatalysts. Chemosphere 2016, 154, 118–123. [Google Scholar] [CrossRef]
  20. Novoselov, K.S.; Jiang, D.; Schedin, F.; Booth, T.J.; Khotkevich, V.V.; Morozov, S.V.; Geim, A.K. Two-Dimensional Atomic Crystals. Proc. Natl. Acad. Sci. USA. 2005, 102, 10451–10453. [Google Scholar] [CrossRef] [Green Version]
  21. Yang, W.D.; Li, Y.R.; Lee, Y.C. Synthesis of R-GO/TiO2 composites via the UV-Assisted Photocatalytic Reduction of Graphene Oxide. Appl. Surf. Sci. 2016, 380, 249–256. [Google Scholar] [CrossRef]
  22. Avouris, P.; Dimitrakopoulos, C. Graphene: Synthesis and Applications. Mater. Today 2012, 15, 86–97. [Google Scholar] [CrossRef]
  23. Praxedes, F.M.; Moreno, H.; Simões, A.Z.; Teixeira, V.C.; Nunes, R.S.; Amoresi, R.A.C.; Ramirez, M.A. Interface Matters: Design of an Efficient CaCu3Ti4O12-RGO Photocatalyst. Powder Technol. 2022, 404, 117478. [Google Scholar] [CrossRef]
  24. Kwan, Y.C.G.; Ng, G.M.; Huan, C.H.A. Identification of Functional Groups and Determination of Carboxyl Formation Temperature in Graphene Oxide Using the XPS O 1s Spectrum. Thin Solid Films 2015, 590, 40–48. [Google Scholar] [CrossRef]
  25. Ikram, R.; Jan, B.M.; Ahmad, W. An Overview of Industrial Scalable Production of Graphene Oxide and Analytical Approaches for Synthesis and Characterization. J. Mater. Res. Technol. 2020, 9, 11587–11610. [Google Scholar] [CrossRef]
  26. Gocyla, M.; Pisarek, M.; Holdynski, M.; Opallo, M. Electrochemical Detection of Graphene Oxide. Electrochem. commun. 2018, 96, 77–82. [Google Scholar] [CrossRef]
  27. Liu, L.; Dong, C.; Wu, K.; Ye, Y.; Wei, X. Synthesis of Nitrogen-Doped Graphene–ZnO Nanocomposites with Improved Photocatalytic Activity. Mater. Lett. 2014, 129, 170–173. [Google Scholar] [CrossRef]
  28. Rajbongshi, B.M.; Ramchiary, A.; Samdarshi, S. Influence of N-Doping on Photocatalytic Activity of ZnO Nanoparticles under Visible Light Irradiation. Mater. Lett. 2014, 134, 111–114. [Google Scholar] [CrossRef]
  29. Li, B.; Liu, T.; Wang, Y.; Wang, Z. ZnO/Graphene-Oxide Nanocomposite with Remarkably Enhanced Visible-Light-Driven Photocatalytic Performance. J. Colloid Interface Sci. 2012, 377, 114–121. [Google Scholar] [CrossRef]
  30. Samadi, M.; Zirak, M.; Naseri, A.; Khorashadizade, E.; Moshfegh, A.Z. Recent Progress on Doped ZnO Nanostructures for Visible-Light Photocatalysis. Thin Solid Films 2016, 605, 2–19. [Google Scholar] [CrossRef] [Green Version]
  31. Chamoli, P.; Das, K.M.; Kar, K. Temperature Dependence Green Reduction of Graphene Oxide by Urea. Adv. Mater. Lett. 2017, 8, 217–222. [Google Scholar] [CrossRef]
  32. Liu, S.; Sun, H.; Suvorova, A.; Wang, S. One-Pot Hydrothermal Synthesis of ZnO-Reduced Graphene Oxide Composites Using Zn Powders for Enhanced Photocatalysis. Chem. Eng. J. 2013, 229, 533–539. [Google Scholar] [CrossRef] [Green Version]
  33. Meng, F.; Ge, F.; Chen, Y.; Xu, G.; Huang, F. Local Structural Changes Induced by Ion Bombardment in Magnetron Sputtered ZnO: Al Films: Raman, XPS, and XAS Study. Surf. Coatings Technol. 2019, 365, 2–9. [Google Scholar] [CrossRef]
  34. Al, B.S.M.; Al, F.; Al, B.; Kuvarega, A.T.; Al, S.M.Z.; Kim, Y.; Selvaraj, R. Hydrothermal Synthesis of CdS Sub-Microspheres for Photocatalytic Degradation of Pharmaceuticals. Appl. Surf. Sci. 2018, 457, 559–565. [Google Scholar] [CrossRef]
  35. Guo, C.; Tian, K.; Wang, L.; Liang, F.; Wang, F.; Chen, D.; Ning, J.; Zhong, Y.; Hu, Y. Approach of Fermi Level and Electron-Trap Level in Cadmium Sulfide Nanorods via Molybdenum Doping with Enhanced Carrier Separation for Boosted Photocatalytic Hydrogen Production. J. Colloid Interface Sci. 2021, 583, 661–671. [Google Scholar] [CrossRef]
  36. Wang, H.; Maiyalagan, T.; Wang, X. Review on Recent Progress in Nitrogen-Doped Graphene: Synthesis, Characterization, and Its Potential Applications. ACS Catal. 2012, 2, 781–794. [Google Scholar] [CrossRef]
  37. Wang, Y.; Shao, Y.; Matson, D.W.; Li, J.; Lin, Y. Nitrogen-Doped Graphene and Its Biosensing. ACS Nano 2010, 4, 1790–1798. [Google Scholar] [CrossRef]
  38. Gao, H.; Song, L.; Guo, W.; Huang, L.; Yang, D.; Wang, F.; Zuo, Y.; Fan, X.; Liu, Z.; Gao, W.; et al. A Simple Method to Synthesize Continuous Large Area Nitrogen-Doped Graphene. Carbon 2012, 50, 4476–4482. [Google Scholar] [CrossRef]
  39. Khan, M.E.; Khan, M.M.; Cho, M.H. CdS-Graphene Nanocomposite for Efficient Visible-Light-Driven Photocatalytic and Photoelectrochemical Applications. J. Colloid Interface Sci. 2016, 482, 221–232. [Google Scholar] [CrossRef]
  40. Putri, L.K.; Tan, L.L.; Ong, W.J.; Chang, W.S.; Chai, S.P. Graphene Oxide: Exploiting Its Unique Properties toward Visible-Light-Driven Photocatalysis. Appl. Mater. Today 2016, 4, 9–16. [Google Scholar] [CrossRef]
  41. Ramos-Corona, A.; Rangel, R.; Espino, J.; Lara, J.; Nuñez, R.; Bartolo-Pérez, P.; Alvarado-Gil, J.J. High-Yield of Lignin Degradation under N-ZnO/Graphene Oxide Compounds. Catal. Today 2022, 392–393, 81–92. [Google Scholar] [CrossRef]
  42. Nguyen-Phan, T.-D.; Pham, V.H.; Shin, E.W.; Pham, H.-D.; Kim, S.; Chung, J.S.; Kim, E.J.; Hur, S.H. The Role of Graphene Oxide Content on the Adsorption-Enhanced Photocatalysis of Titanium Dioxide/Graphene Oxide Composites. Chem. Eng. J. 2011, 170, 226–232. [Google Scholar] [CrossRef]
  43. Qin, H.; Li, W.; Xia, Y.; He, T. Photocatalytic Activity of Heterostructures Based on ZnO and N-Doped ZnO. ACS Appl. Mater. Interfaces 2011, 3, 3152–3156. [Google Scholar] [CrossRef] [PubMed]
  44. Rangel, R.; Cedeño, V.; Ramos-Corona, A.; Gutiérrez, R.; Alvarado-Gil, J.J.; Ares, O.; Bartolo-Pérez, P.; Quintana, P. Tailoring Surface and Photocatalytic Properties of ZnO and Nitrogen-Doped ZnO Nanostructures Using Microwave-Assisted Facile Hydrothermal Synthesis. Appl. Phys. A 2017, 123, 552. [Google Scholar] [CrossRef]
  45. Chen, D.; Feng, H.; Li, J. Graphene Oxide: Preparation, Functionalization, and Electrochemical Applications. Chem. Rev. 2012, 112, 6027–6053. [Google Scholar] [CrossRef] [PubMed]
  46. Dahm, A.; Lucia, L.A. Titanium Dioxide Catalyzed Photodegradation of Lignin in Industrial Effluents. Ind. Eng. Chem. Res. 2004, 43, 7996–8000. [Google Scholar] [CrossRef]
Figure 1. X-ray spectrum of (a) GO, (b) ZnO (c) ZnO/GO-U, (d) ZnO/GO-T, and (e) ZnO/GO-E compounds.
Catalysts 13 00069 g001
Figure 2. Photomicrographs FE-SEM of (a) ZnO obtained at 500×, (b) GO obtained at 20,000×, (c) GO-T obtained at 5000×, and (d) ZnO/GO-T obtained at 500×.
Catalysts 13 00069 g002
Figure 3. Element mapping distribution from the energy dispersive analysis for the ZnO/GO-T sample.
Catalysts 13 00069 g003
Figure 4. Transmission electron microscopy images of the (a) GO, (b) ZnO/GO-U, (c) ZnO/GO-T, and (d) ZnO/GO-E compounds.
Catalysts 13 00069 g004
Figure 5. XPS spectrum for the (a) GO, (b) ZnO, (c) GO-U, (d) GO-T, and (e) GO-E compounds.
Catalysts 13 00069 g005
Figure 6. HR-spectra for the (a) C 1s of GO and N 1s of (b) GO-U, (c) GO-T, and (d) GO-E compounds.
Catalysts 13 00069 g006
Figure 7. XPS spectrum of the (a) ZnO/GO-U, (b) ZnO/GO-T, and (c) ZnO/GO-E compounds.
Catalysts 13 00069 g007
Figure 8. (a) Photocatalytic degradation of MB under UV irradiation using the ZnO and ZnO/GO-N compounds; (b) first-order reaction kinetic curves for the ZnO, ZnO/GO-E, ZnO/GO-T, and ZnO/GO-U compounds; and MB degradation under UV irradiation.
Catalysts 13 00069 g008
Figure 9. (a) Photocatalytic degradation of lignin under UV irradiation using the ZnO, ZnO/GO-N, and ZnO/GO compounds; and (b) first-order reaction kinetic curves showing degradation of lignin under UV irradiation for compounds of ZnO, ZnO/GO-E, ZnO/GO-T, ZnO/GO-U, and ZnO/GO.
Catalysts 13 00069 g009
Table 1. Element content from the XPS analysis for the ZnO, GO, ZnO/GO-U, ZnO/GO-T, and ZnO/GO-E compounds.
CompoundAtomic Content N (%)Atomic Content C (%)Atomic Content O (%)Atomic Content Zn (%)
ZnO--52.6647.34
GO-84.5215.48-
ZnO/GO-U14.0870.849.155.93
ZnO/GO-T12.1472.779.525.57
ZnO/GO-E5.3283.718.442.53
Table 2. Bond energy percentage from the high-resolution (HR) spectrum of N 1s in the GO-N compounds.
CompoundAtomic Content of N (%)Pyridinic-N (%)Pyrrolic-N (%)Graphitic-N (%)
GO-U16.864.896.665.29
GO-T12.453.284.384.77
GO-E6.362.131.113.11
Disclaimer/Publisher’s Note: The statements, opinions and data contained in all publications are solely those of the individual author(s) and contributor(s) and not of MDPI and/or the editor(s). MDPI and/or the editor(s) disclaim responsibility for any injury to people or property resulting from any ideas, methods, instructions or products referred to in the content.

