Review

Review of Improving the NOx Conversion Efficiency in Various Diesel Engines fitted with SCR System Technology

by
Muhammad Khristamto Aditya Wardana
1,2 and
Ocktaeck Lim
3,*
1
Graduate School of Mechanical Engineering, University of Ulsan, Ulsan 680-749, Republic of Korea
2
Research Centre of Smart Mechatronic, National Research and Innovation Agency (BRIN), Jl Sangkuriang Kawasan Sains dan Teknologi Samadikun BRIN, Cisitu, Bandung 40135, Indonesia
3
School of Mechanical Engineering, University of Ulsan, Ulsan 680-749, Republic of Korea
*
Author to whom correspondence should be addressed.
Catalysts 2023, 13(1), 67; https://doi.org/10.3390/catal13010067
Submission received: 25 October 2022 / Revised: 21 December 2022 / Accepted: 25 December 2022 / Published: 29 December 2022
(This article belongs to the Special Issue Exclusive Review Papers in Catalytic Materials)

Abstract

:
The diesel engine is utilized in most commercial vehicles to carry items from various firms; nevertheless, diesel engines emit massive amounts of nitrogen oxides (NOx) which are harmful to human health. A typical approach for reducing NOx emissions from diesel engines is the selective catalytic reduction (SCR) system; however, several reasons make reducing NOx emissions a challenge: urea particles frequently become solid in the injector and difficult to disseminate across the system; the injector frequently struggles to spray the smaller particles of urea; the larger urea particles from the injector readily cling to the system; it is also difficult to evaporate urea droplets because of the exhaust and wall temperatures (Tw), resulting in an increase in solid deposits in the system, uncontrolled ammonia water solution injection, and NOx emissions problems. The light-duty diesel engine (LDD), medium-duty diesel engine (MDD), heavy-duty diesel engine (HDD), and marine diesel engine use different treatments to optimize NOx conversion efficiency in the SCR system. This review analyzes several studies in the literature which aim to increase NOx conversion in different diesel engine types. The approach and methods demonstrated in this study provide a suitable starting point for future research into reducing NOx emissions from diesel engines, particularly for engines with comparable specifications.

1. Introduction

During the last few decades, engine development has been influenced by efforts to reduce emissions and fuel consumption [1,2]. The major objective has been to protect the financial interests of car owners. The second is a legal requirement that is occasionally strengthened by tax incentives for green engines or smart engines with lower emissions. A shift from steady-state to transient cycles, and the management of research components are all trends in emissions laws and certification [3]. They are motivated by a greater knowledge of environmental effects and a desire to remedy the problems as soon as feasible.
Automotive emissions, industry pollutants, and the reactivity of any contaminant influence their impacts on the atmosphere [4]. Preserving air quality is essential, especially in densely populated urban and industrial areas where air pollution has a significant negative impact on both human health and the environment [5,6]. To decrease and reduce air pollution, authorities and environmental organizations are attempting to implement new emission regulations [7]. Even though air pollution has decreased in recent years as a result of tight emission laws, there is still a major air quality problem since the number of vehicles on the road is rising every day. Citizens are becoming increasingly concerned about the situation [8].
The detrimental impacts on health and the environment prompted lawmakers to pass laws regulating emission levels. The majority of vehicle types, including passenger vehicles, buses, trucks, trains, lorries, seagoing ships, etc., should adhere to current regulations. The new rules do not apply to vehicles that are currently on the road. The beginning of the 1990s saw the introduction of European emission regulations and the implementation of science [9,10]. Emissions restrictions are established in phases and get more stringent with time. Light-duty vehicles (LDV) and heavy-duty vehicles (HDV) go through stages such as Euro I and so on [11]. Euro VI is the current emission standard for HDVs. It received approval from the conference on Pollution and Energy in January 2012 and the World Forum in June 2012. After gradually starting to operate in January 2013, for all engine manufacturers, the reduction in permitted nitrogen oxide emissions from the previous Euro V standard to the current Euro VI standard presented a considerable technological hurdle [12].
Global combined test methods were introduced in Euro VI, encompassing standard driving conditions throughout the European Union, Australia, and Korea. Even if the same rules are not utilized, countries including China, Brazil, India, Japan, and the United States have emission regulations to control their emissions, as seen in Figure 1 [13]. In the global Heavy-Duty Transient Cycle, a second-based series of normalized torque and speed data are included (WHTC). There are 13 operating modes for heavy-duty vehicles in the World Heavy-Duty Steady-State Cycle (WHSC) test, which blends different engine torque levels and speeds. SI (gasoline) engines only use transient cycle testing, but CI (diesel) engines use both tests. Real driving emissions (RDE) will be a part of the upcoming Euro 6 emission standard for the years 2017 to 2020. The idea behind RDE is that rather than utilizing a pre-planned drive cycle, the vehicle will be assessed across a wide range of performance maps; in other words, RDE will take place in actual traffic using a random driving route.
Due to their numerous benefits, including their greater thermal efficiency, higher fuel economy, and reduced greenhouse gas emissions, diesel engines are quite popular [14,15,16]. No viable alternatives to diesel-powered vehicles exist for heavy-duty transportation [17]. Both fuel efficiency and NOx emissions have grown in the latest generation of diesel engines [18]. One of the worst environmental pollutants that the transportation sector produces is this hazardous NOx. A powerful aftertreatment system is required to lower NOx emissions while maintaining high fuel efficiency. For heavy-duty diesel cars, engine tuning can help to achieve compliance with the latest EURO 3 emission standards. Several in-engine technologies, including intercooling, turbocharging, injection rate shaping, injection pressure, injection time, development of smart controllers, and exhaust gas recirculation (EGR) have been employed to comply with legal requirements [19,20]. While some of these technologies are still in the development stage, others, such as homogeneous charge compression ignition (HCCI), suggest that future legislation will call for an aftertreatment system to reduce NOx and PM emissions to the necessary levels [21,22]. Among the factors included are restrictions placed on the combustion process, or research costs.
Diesel particulate filters (DPFs) seem to be effective in removing PM [23,24]. DPFs have a short lifespan due to ash accumulation and a rise in back pressure [25]. While SCR converters lower PM, DPFs have minimal impact on NOx levels. Additionally, a particular level of NOx is needed for DPFs to operate properly. Exhaust aftertreatment technology is now required to be incorporated by engine manufacturers in order to meet the growing problem of adopting progressive compact emission standards, such as Euro 6. The most popular approach for reducing the nitrogen oxides (NOx) emissions in the automotive sector is selective catalytic reduction (SCR), which is capable of meeting most emissions criteria [26]. The generated NOx and NH3 become nitrogen (N2) gas and water (H2O) in the SCR system [27]. Urea is used as the precursor of NH3 gas, which is simple to handle and transport despite the fact that NH3 is a poisonous chemical that is harmful to human health [28]. AdBlue or urea–water solution is a combination of 32.5 percent urea and 67.5 percent water [29].
The breakdown of urea–water solution droplets is a thermally triggered phenomenon that starts with water evaporating from the solution, thereby separating the urea components [30]. Then, the molecules of urea decompose into ammonia gas [31]. The decomposition of urea is not always uniform. Intermediate phases can react with undecomposed urea during the decomposition process, producing a variety of undesirable complex polymers [32,33]. These urea deposits accumulate inside injectors, on SCR walls, catalyst surfaces, and mixing fans, thereby lowering catalyst filtration efficiencies and reducing NOx conversion [34,35], despite the fact that urea deposits disintegrate at extremely high exhaust temperatures [36,37,38].
The most challenging features of urea–SCR systems include urea distribution and the minimization of solid deposits [39,40]. Though contemporary urea–SCR systems use a narrow exhaust pipe design, there remains uncontrolled urea injection and difficulties in the mixing process [41,42]. When the liquid evaporates, the deposit formation rises and occurs with reductions in temperatures [43]. Uncontrolled air pressure on the SCR injector produces reduces urea particle injection [23], a problem that inhibits the breakup of urea to become small particles, and instead, produces large drops [44]. The wall surface conditions may also be used as a parameter to help the urea droplets break apart and become finer droplets [45,46,47]. Spray–wall impingement occurs as a result, and spray cooling occurs throughout the injection period [48,49,50,51]. Spray cooling creates a liquid film which is the precursor to the formation of solid deposits [52,53]. This research is aimed at NOx conversion from the varieties of diesel engines. As a consequence, this study provides a useful starting point for future research into NOx emissions reductions from diesel engines, particularly engines with similar specifications.

2. Diesel Engines (1000 cc–6000 cc)

2.1. Diesel Engine 1000 cc

This research reviews the 1000 cc two-cylinder engine from Mahindra (Maxximo), a 4-stroke CRDI diesel engine with an open ECU (NIRA) which has a power rating of 18.4 kW at 3600 rpm. The engine and emission data were recorded once the engine had reached steady-state conditions for varied loadings (0–80%) at a constant speed of 2000 rpm. Experiments were conducted using a honeycomb Rhodium catalyst to decrease engine emissions and the schematic diagram was showing at Figure 2 [54].
When NOx is exposed to the environment in the presence of UV light, it undergoes a sequence of reactions that result in photochemical smog and, in certain circumstances, acid rain [55]. This study shows that SCR technology was employed to remove these dangerous pollutants from the environment before they were discharged into the atmosphere. Because NOx (NO and NO2) generation is a direct result of temperature and oxygen availability, a growing trend in NOX emissions may be seen as load increases [56]. Increased NOx emissions are caused by a small amount of intrinsic oxygen in P30 (1.5–3.3 percent) [3]. As seen in Figure 3, the adoption of EGR and SCR methods significantly reduced NOX emissions [54]. Figure 4 depicts the NOx reduction capability in a much more apparent way [54]. At 60% load, an ammonia flow rate of 0.5 kg/hr resulted in a maximum NOx reduction efficiency of 36.8%. As a result, a flow rate of 0.5 kg/hr of ammonia was readily determined to be optimal for maximal NOx removal [57,58,59]. A slightly lower flow rate produced ammonia shortages in the usual SCR reaction, whereas a slightly higher flow rate induces desorption and pore-clogging effects [60]; both of these factors contribute to lower SCR performances [31]. Reduced residence time and higher temperatures may be responsible for a reduction in NOx conversion efficiency at 80 percent loading. The ideal temperature range for the SCR catalyst was determined to be 240–280 °C, and this may be used for light and medium-load applications. [55,61,62]. In addition, for EGR operation with load, there is no significant change in NOx conversion efficiency.

2.2. Diesel Engine 1800 cc

This study investigated an 1800 cc diesel engine with an SCR system for reducing NOx emissions. Figure 5 depicts the overall layout of the experimental setup, which includes a diesel engine, dynamometer, and SCR aftertreatment system [63]. The 4-cylinder diesel engine has an 18:1 compression ratio and a power output of 29 kW at 3000 rpm [63]. The catalyst was a vanadium catalyst with dimensions of 190 mm × 155 mm and a pressure of 400 cpsi [64,65,66]. The urea solution had a mass concentration of 32.5 percent. In Figure 5, the No.1 NOx sensor measured the NOx concentration upstream of the catalyst, while the No.2 NOx sensor measured the NOx concentration downstream of the catalyst. After the gas had passed through the CuSO4 solution, the NOx concentration downstream of the catalyst was measured using the No.3 NOx sensor. NH3 is a water-soluble chemical that may combine with CuSO4, even though NO is insoluble in water, and the NO2 concentration in NOx is low. CuSO4 solution was placed in front of the No.3 NOx sensor to eliminate the effects of ammonia slip [56]. The diesel particulate filter (DPF) is a technology that is used to decrease the effects of particulate matter (PM) on nozzle blockage and catalyst deactivation [67,68].
To achieve the requisite catalyst temperature and space velocity, the diesel engine’s operating conditions were modified. After the diesel engine’s operating state had been steady for 10 min, the urea solution was injected. The NOx concentration obtained by the No.1 NOx sensor was used to estimate the injection amount of the urea solution [69]. The impacts of NH3/NOx on NOx conversion and the state of ammonia slip and storage were explored by examining the readings of the No.1 and No.2 NOx sensors [70,71].
The diesel engine’s operating conditions were regulated to maintain the temperature and gas velocity. The urea solution was injected at an NH3/NOx ratio of 2. When the NOx gas measured by the No.2 and No.3 sensors had achieved stable prespecified levels, injection is ended [72]. Assuming that the catalyst temperature was 350 °C and the space velocity was 15,000/h, Figure 6 shows the changes in NOx concentrations recorded by the No.2 and No.3 sensors [63]. Because CuSO4 affects exhaust pressure stabilization, the NOx concentration curves recorded by the No.3 sensor were relatively smooth, as illustrated in Figure 7 [63]. After the injection started, the NOx concentration measured by the No.2 sensor progressively stabilized at around 133 × 10−6 and gradually recovered to the starting value when the injection ended. After the start of injection, the NOx concentration recorded by the No.3 sensor progressively stabilized at about 84 × 10−6. Furthermore, ammonia slip was determined to have been initiated when the NOx concentration measured by the No.2 sensor reached the value measured by the No.3 sensor, eliminating the initial disagreement between the sensors. The ammonia leakage took 36 s. Ammonia slip occurred when the catalyst temperature was at 300 °C, 350 °C, and 400 °C, as shown in Figure 7, and was accompanied by a change in space velocity downstream of the catalyst [63,73,74]. As the catalyst temperature or space velocity grows, the ammonia slip begins to increase, as seen in Figure 7. Ammonia slip occurs as the temperature of the catalyst rises, resulting in a decrease in ammonia saturation storage. As the space velocity rises, it becomes more difficult for NH3 to distribute properly inside the catalyst. As a result, the likelihood of NH3 adsorption, desorption, and SCR reactions at the active site of the catalyst is reduced [75]. As a result, even though NH3 has not diffused adequately to the active site and had not completely reacted, it was overwhelmed by the exhaust. The NOx concentration that had not reacted was obtained by integrating the NOx concentration detected by the No.3 sensor from the time injection began until the time that the ammonia slip occurs. Thus, the restored NOx concentration is the difference between the NOx concentration in the exhaust and the unreacted NOx concentration. All reactions are required to conform to the standard SCR reaction methodology. The amount of NH3 that has reacted can be measured using a chemical reaction mechanism. The ammonia saturation storage is the difference between the provided NH3 concentration and the concentration of NH3 that has reacted. Figure 7 depicts the ammonia saturation storage change rule together with space velocities at 300, 350, and 400 °C. The ammonia saturation storage of the catalyst decreases as the temperature rises, as seen in Figure 7 [39,76]. At low temperatures, ammonia saturation storage is more common [77,78,79,80]. It generally diminishes as the space velocity rises. As the temperature rises, it becomes more difficult for ammonia to be adsorbed in the catalyst. Ammonia adsorption is decreased due to the increased space velocity [81].
At a space velocity of 15,000/h, Figure 8 depicts the NOx real-time conversion efficiency and ammonia accumulative storage at various catalyst temperatures [63]. It is assumed that ammonia storage rises proportionally. As shown in Figure 8, as the accumulative ammonia storage grows, the NOx real-time conversion efficiency climbs and gradually stabilizes [82,83]. Because of the early error and the installation site, the NOx conversion efficiency measured by the No.2 sensor is higher at first than that of the No.3 sensor but finally declines. The reaction time is shorter for the No. 2 sensor since it is closer to the catalyst than the No. 3 sensor, resulting in a higher NOx conversion efficiency. The reaction rate is slower at lower temperatures because the catalyst activity is decreased [84,85]. As the amount of stored ammonia grows, the concentration of ammonia on the catalyst’s surface rises, increasing the reaction rate. The effectiveness of NOx real-time conversion is gradually improving. Ammonia saturation storage decreases as the temperature rises. The rise in catalyst activity, on the other hand, becomes more noticeable. As a result, the chemical reaction rate accelerates, and the NOx real-time conversion efficiency improves consistently. If the urea solution is increased after the NOx conversion efficiency reaches its optimum, the ammonia accumulative storage rises but the NOx conversion efficiency remains the same. Ammonia slip occurs when ammonia storage exceeds the saturation value [76]. The NOx conversion efficiency measured by sensor No.2 continues to fall and is now lower than that obtained by sensor No.3. It is acceptable to utilize this catalyst feature to improve ammonia preservation in low-temperature circumstances in order to raise NOx conversion efficiency. However, in terms of security, it is important to keep ammonia within a specific range. Otherwise, when the temperature rises fast, ammonia saturation storage will decrease. It will result in ammonia leakage and secondary contamination.
The effects of NH3/NOx on the NOx real-time conversion efficiency and ammonia slip in the system were evaluated. The influences of catalyst temperature and gas velocity on SCR reaction rate, ammonia slip, ammonia storage, and the changing rule of NOx real-time conversion efficiency with ammonia storage were investigated. The NOx conversion efficiency increased when the NH3/NOx ratio increased, and ammonia slip started at a ratio of 1.4; an increase in temperature improved the SCR reaction rate significantly while an increase in space velocity had no effect, and ammonia slip increased as catalyst temperature or space velocity increased [63]. Then, when the catalyst temperature or space velocity increased, the ammonia storage decreased. Finally, when ammonia accumulative storage increased, the NOx real-time conversion efficiency rose and gradually achieved its maximum value.

2.3. Diesel Engine 2000 cc

This research used a 2.0-liter diesel engine without EGR, which produced high NOx levels that were easily quantifiable. This is an unusual design in which the DPF was positioned upstream of a DOC [69]. The length of the DOC regulated the NO2:NOx ratio, and a reaction between NO2 and soot on a downstream DOC was avoided [67,86]. A flow straightener, expansion box, and converging nozzle were all injected with ammonia gas [30,87]. This ensured that the ammonia was appropriately mixed with the exhaust stream and that the intake of a long ten-degree diffuser cone received a constant velocity profile. As a result, the intake of the SCR catalyst brick had a uniform velocity profile, and the trials were effectively one-dimensional. Because the fittings were modular, different lengths of brick could be placed into the exhaust. A kind of copper zeolite was employed as the SCR catalyst in these tests. Instrumentation sampling ports were installed in the test exhaust, as shown in Figure 9 [82,88,89]. The gas analysis equipment was either a Combustion CLD analyzer with a fast reaction time of 2.0 ms capable of detecting NO and NO2, or a Horiba 6000 FT gas analyzer capable of measuring N2O [28,82]. Because the Horiba analyzer had a slower reaction time, data were recorded at 1 s intervals in experiments where it was used. During the transient testing, data were recorded at 0.01 s intervals using the faster CLD analyzer.
There were two sorts of testing carried out. The engine was allowed to attain steady-state conditions in the first series of tests that employed the quick response analyzers. The steady-state conditions for this set of experiments are summarized in Table 1 [82]. After 20 s of steady-state recording, the engine was ramped up from 1500 rpm for the required time of either 10 s or 20 s. The engine was then kept at full load for the same length of time as the previous condition before being ramped down for the same amount of time. The SCR brick used in these studies was made up of two short bricks, 45 mm and 45 mm long, for a total length of 91 mm. The DOC was 45 mm long (0.5 DOC) or 91 mm long (1.0 DOC). This produced two unique NO2:NOx scenarios; the NO2:NOx ratios changed during the trials, and their traces are shown in Figure 10 for reference [82]. The NO level rises with engine load, while the NO2 level rises in direct proportion to the temperature rise and the DOC’s response to the shift in circumstances [18,67]. This results in the form of the NO2:NOx ratio curves in Figure 10. Since the combustion NOx analyzer is susceptible to ammonia cross-talk, measurements were taken just downstream of the SCR in this series of experiments. Furthermore, ammonia dosage was insufficient, resulting in ammonia levels downstream of the SCR in the tests seldom exceeding a few ppm. Figure 11 depicts the temperatures upstream of the SCR during these experiments [82]. Figure 11 shows that when a rising ramp is promptly followed by a falling ramp, the temperature difference is negligible because the higher load is not held for long enough for a high temperature to develop. It should be noted that the mass flow rate of exhaust fluctuated during the transients due to changes in the engine’s operational conditions. At the start of the experiment, the ammonia level in the exhaust upstream of the SCR was measured under steady-state conditions at the lower engine load and remained nominally fixed throughout [82]. However, as the mass flow rate increased during the transient period of each experiment, the ammonia level decreased due to dilution. Since the instantaneous mass flow rate was given as the input, the change in ammonia level was accounted for throughout the simulation.
Figure 12 shows the consumed ratios during a 20 s transient from 0 and 100 s as the provided NO2:NOx ratio varies [82]. The given ratio for the single DOC instance is about 0.5, whereas the consumed ratio is somewhat greater but remains constant throughout the test. The given ratio was initially at 0.25 for the 0.5 DOC instance, but the consumed ratio was greater than 0.6 and remained almost constant across the test. When the supplied NO2:NOx ratio was close to 0.5, NOx conversion was near 50% throughout, whereas when there was proportionately less NO2, conversion was just over 40% at first, dropped to near 30%, and then rose to near 60% by the end, at which point the supplied NO2:NOx ratio had also continued to rise, although it remained below the 50%.
In the studies with 0.5 and 1 DOC, the SCR was given some NO2 as well as NO. The Olsson kinetics and the modified kinetics both seemed to be equally competent in forecasting downstream species levels when the mixture was 50 percent NO and 50 percent NO2. Their predictions all were precise. This is because the rapid reaction dominates under these conditions, and the adjusted kinetic scheme does not affect this rate. The other three SCR responses only had a small impact. The kinetic method had to be changed when 25 percent of the NOx was NO2. The changed standard reaction kinetics, as well as adsorption modifications, were incorporated [60]. However, in the simulations, the sluggish response rate had to be increased by a factor of 20 to boost the NO2 consumption and to reach a balance between the NO and NO2 consumption shown in the tests. The top limit of what might be considered a fair adjustment is a factor of 20. To guarantee that the model consumes enough NO2, the slow reaction may need to be multiplied by 4 or 5, and the N2O production reaction may need to be increased by a ratio. The latter may be validated by measuring N2O, which is something that will be done in future research. The main issue is that more NO2 is burned than projected, necessitating a change in the kinetic scheme to account for this. This investigation is still ongoing, and further trials identical to those described in this study are being carried out. The next type of study is currently in process, with a separate upward and downward ramp and with DOC values of 0.5 and 1.0, implying that the supply is a mix of NO and NO2. The observations of these tests may assist in explicating the variations in kinetics that are necessary to provide a universal interpretation of the data. To get an extremely close agreement, the ammonia adsorption parameter must be adjusted at this time. Furthermore, the amount by which the slow reaction rate must be increased to get accurate predictions when NO2 is present in levels less than 50% has to be investigated further [63,75,90].

2.4. Diesel Engine 3900 cc

This study investigated an SCR system in a 3900 cc diesel engine with engine operation at 2600 rpm [74]. The experimental setup for the urea–SCR investigation is shown in Figure 13. It is equipped with a dynamometer, a diesel engine, temperature and NOx sensors, and a urea–SCR system [74]. The catalyst was 153.5 mm from the package entrance (V2O5/TiO2, 190.5 mm × 355.6 mm, 300 CPSI) [74].
Table 2 shows the parameter values for an exhaust flow rate of 431 kg/h, exhaust temperature of 328 °C, and an NH3/NOx feed ratio spanning from 0.6 to 1.4 [74]. The generation of NH3 before the catalyst continuously improved as the supply of UWS rose. As a result, the conversion rate and the ammonia slip may be investigated objectively. [91,92]. Figure 14 shows how variables vary as the NH3/NOx ratio varies [74]. The rate of NOx conversion does not increase in lockstep with the increase in NH3 supply, as one might assume. The conversion tends to remain steady as the NH3/NO feed ratio approach 1.0 [93,94] since the catalyst is operating at maximum capacity. Similar findings may be seen in another study. According to the literature, the maximum capacity was attained when the NH3/NO input ratio reached 1.2 [44,95]. The discrepancy might be due to the various catalysts’ ability to store NH3 [96,97]. Furthermore, when the NH3/NOx input ratio rises, the amount of liquid film mass and ammonia slip increases [63]. These occurrences show that an excess of UWS does not react with NOx in the exhaust. It may be converted to NH3, producing ammonia slip instead, or it may turn into a liquid film, increasing the risk of crystallization. The results suggest that the NH3/NOx feed ratio should be about 1.0. As the NH3/NOx input ratio exceeds 1.0, the risk of crystallization and NH3 slip increases dramatically [98,99,100].
The distribution of variables as the exhaust temperature rises from 300 °C to 500 °C, due to the rapid breakdown of UWS at higher temperatures, is shown in Table 3 (condition: NH3/NOx feed ratio 1.0, exhaust flow rate 431 kg/h, NOx volume percent 707 × 10−6). Because of the enhanced reactive rates at higher temperatures and NH3 oxidation, the NH3 volume fraction before the catalyst shows a little decrease due to the quick consumption [22,101]. The mixer is intended to prevent homogeneity from being disturbed in the variables being studied. Figure 15 indicates that until the temperature exceeds 400 °C, the conversion rises rapidly. The conversion then indicates a small reduction at 500 °C compared to 400 °C. The variation in conversion rate is caused by the activity of the catalyst at various temperatures [36,75,95]. As a result, the catalyst activity, which is temperature sensitive, dominates the changes. Comparable results have been obtained in other investigations. The sole findings of this study were the effects of temperature on catalyst activity and NOx conversion. The study, however, overlooked the crucial process of evaporation and motion of the droplets [60]. As the evaporation intensifies due to the rise in exhaust temperature, the liquid film bulk decreases quickly. In this case, the greater exhaust temperature aids crystallization resistance. The volume percentage of NH3 at the catalyst’s output rises at first and then falls sharply. Due to the breakdown of the UWS and the reducing agent’s reduction reaction increase with increasing exhaust temperature, there is a trade-off relationship between NH3 generation and consumption [21,102].
In this work, we built a urea–SCR model based on an experiment, and we investigated the major elements that impact the system’s performance. The NH3 and velocity homogeneity effects are eliminated by using the mixer. (1) The ideal NH3/NO input ratio is close to 1.0; the increasing supply of UWS just adds to the risk of crystallization and ammonia slip. (2) The increased exhaust temperature can help to speed up the catalytic processes by facilitating the evaporation of UWS. crystallization resistance improves as the temperature rises. The higher flow rate reduces agent waste and significantly increases contamination [74].

2.5. Diesel Engine 5100 cc

The 5100 cc YC4112ZLQ diesel engine is the subject of this investigation. Table 4 contains the engine’s specifications; and the schematic engine test was show in the Figure 16. Samples of gaseous emissions and particulate matter were taken before and after the catalyst from raw exhaust streams [103]. An AVL CEBII was used to detect NOx, THC, and CO emissions, while an AVL SPC 472 was used to collect particulates and quantify PM emissions [103,104]. Ethanol was delivered via a fuel pump to the fuel rail where the ethanol pressure was maintained at around 0.3 MPa [104]. The electronic control module (ECM) can adjust the ethanol flow rate automatically depending on engine speed, load, and average SCR temperatures (calculated from the thermocouples before and after SCR) [103,104]. In addition, the ECM may be controlled manually, enabling the pulse width to be altered as required. The atomization and dispersion of the ethanol spray were aided by high-pressure air from the engine air compressor [82,88]. The temperature was then held constant for around 10 min to produce a steady-state before proceeding to the next phase. In addition, a bypass valve was used to keep the space velocity constant [103].
In this work, which used the Ag/Al2O3 catalyst to improve PM emissions, the engine-out PM sampled before and after the catalyst was measured at different catalyst inlet temperatures under the circumstances of SV = 50,000 h ̶ 1 and nE: nNOx = 1.5 [103,105,106]. When exhaust gas passes through the Ag/Al2O3 catalyst, the SOF is reduced over the whole range of intake temperatures; furthermore, the reduction in SOF increases as the inlet temperature rises. This is mostly due to the Ag/Al2O3 catalyst’s propensity to oxidize. Consequently, across the entire temperature range, the DS was almost identical before and after the SCR catalyst. When the input temperature was below 410 °C, the sulfate concentration reduced somewhat; nevertheless, as the intake temperature rises, the sulfate concentration decreased. The sulfate concentration rapidly increased when the input temperature was 470 °C. This was because sulfate is easily absorbed on the surface of the catalyst at low temperatures and desorbed at high temperatures, meaning that the catalytic activation loss caused by sulfur poisoning may be recovered by a high-temperature desulfurization technique [69,107,108]. When the catalyst intake temperature was 336 °C, the PM emission may decrease by more than half, but it can be somewhat increased when the input temperature reaches 470 °C. Because the majority of the sulfate in PM is derived from fuel sulfur, the final effect of the Ag/Al2O3 catalyst on PM emissions is controlled by temperature and fuel sulfur concentration [68,103]. The Ag/Al2O3 catalyst aging test findings, as well as the effect of the PM emission test, show that the sulfur content of the diesel has a substantial impact on catalyst activation, and eventually, tailpipe emissions. As a result, when using the Ag/Al2O3 catalyst as an aftertreatment, low sulfur fuel is required [55,109].
According to this research as shows in the Figure 17, increasing the ethanol dosage will improve the NOx conversion efficiency while significantly increasing CO and THC emissions. Because CO is a byproduct of selective NOx reduction, an additional oxidation catalyst is necessary to reduce the CO [110]. A revolutionary catalyst with SV = 30,000 h ̶ 1 may provide a high NOx conversion (up to 90%) in the range of 350–450 °C, but it is reduced beyond that range. However, following a 30h aging test, the NOx conversion was reduced. The sulfur absorbed on the catalyst surface is one of the primary causes of decreased catalyst activation [111]. Even when the space velocity was less than 50,000 h ̶ 1, the input temperature was 400 °C, and the nE:nNOx ratio was 1.5, the NOx conversion may remain greater than 70%. However, when the space velocity increases, the NOx conversion falls linearly, and at SV = 80,000 h ̶ 1, the NOx conversion is less than 50% [103].

3. Heavy-Duty Diesel Engine (6000 cc–12000 cc)

3.1. Heavy-Duty Diesel Engine 6500 cc

The 6500 cc YUCHAI YC6J180-42 diesel engine fitted with the commercial V2O5-WO3/TiO2 catalyst is the subject of this investigation. Table 5 contains the engine’s specifications [112]. Figure 18 shows a schematic representation of the diesel engine and its aftertreatment system [112]. As shown in Figure 19, one ESC includes 13 operation modes, including one idle mode and 12 additional modes (varying from 25% to 100% each load) at speeds (Speed A: 1325 rpm; Speed B: 1750 rpm; Speed C: 2175 rpm). The durations are 4 min (for the initial low idle) and 130 s (for the second low idle) (other operation modes). Figure 20 shows the exhaust flow rate and temperature profiles, which demonstrate the exhaust temperature range from 273 K to 740 K; each temperature rise influenced the catalytic activity and ammonia storage capacity of the catalytic converter’s surface as well as the required ammonia coverage ratio that must be used for NOx emissions and ammonia slip [112]. Figure 21 depicts the patterns of upstream NOx emissions at the SCR catalyst input over the ESC test. According to the findings of a few studies, exhaust temperature has a major impact on NOx conversion efficiency, It is also critical in predicting the maximum NOx conversion efficiency relative to engine operating conditions [112]. Although it drops slightly at very high temperatures (such as operation mode 2, temperature: >450 °C), the NOx conversion efficiency increases as the reaction temperature rises. Furthermore, the effectiveness of NOx conversion may be influenced by the exhaust flow rate. The optimal solution is matched with various engine operating modes with the highest NOx conversion efficiency to get the lower limit of the ammonia coverage ratio and the requisite value to validate simulated NMPC performance. Furthermore, there is a large difference between the upper and lower limits of the ammonia coverage ratio, and the ammonia storage capacity is quite large while the temperature is relatively low, for the following reasons. The lowest limit of the ammonia coverage ratio corresponds to the maximum NOx conversion efficiency, resulting in an ammonia slip of roughly 10 ppm, while the upper limit is also just 10 ppm (ammonia slip), resulting in a considerable amount of adsorbed NH3 due to the huge discrepancy [21,113,114]. In contrast, the minor variation at high temperatures indicates an inadequate ammonia storage space, and the ammonia contribution amount must be strictly controlled, in this case, to optimize the NOx conversion efficiency and avoid any substantial ammonia slip [45,67].
The observed NH3 concentrations were significantly lower, especially at low exhaust temperatures, and the underlying reasons were largely due to a mismatched model plant and inadequate urea breakdown [115]; The NOx conversion efficiency may be ideal in various engine operating modes, according to the findings of that test, and the NMPC controller guarantees that the majority of the cycle complies with NOx emission requirements; furthermore, the downstream ammonia concentration was less than the limit, and the total mean ammonia slip was 9.7 ppm, which is near to the provided limit [28,112,113,116].

3.2. Heavy-Duty Diesel Engine 6600 cc

Data was collected from dynamometer testing using a 6600 cc YUCHAI YC6L-42 diesel engine fitted with a commercial V2O5-WO3/TiO2 catalyst [92,112]. The primary parameters of the experimental engine and the dynamometer are listed in Table 6 [92]. The testing used an eddy current dynamometer and associated equipment to measure engine speed and torque, with fuel supplied directly from the CAN bus every cycle. NOx emissions and ammonia slip were measured using an AVL 4000 and LDS6 equipment, respectively [75,92], with engine operation from 900 rpm to 2600 rpm (with a step size of 100 rpm) and engine loads ranging from 10% to 100%. Table 7 shows a portion of these [92].
Three prediction models were created using the modeling and optimization approaches mentioned in Section 2. One was a model for projecting engine upstream NOx emissions. The other two models were an SCR model for projecting downstream NOx emissions and one for ammonia slip at different phases during operation [117]. Figure 22 depicts the difference between actual outputs and model forecasts for upstream NOx emissions [92]. Figure 23 also depicts the degree of fit between the actual outputs and the model forecast [92]. Figure 22 confirms that the curves for actual and predicted values are almost identical. Figure 23 also demonstrates that all of the points are consistently distributed along the line where the projected values nearly matched the actual values. Figure 24 and Figure 25 provide similar figures for downstream NOx emissions and ammonia slip, both of which demonstrate high forecast accuracy [92].
In addition to the downstream NOx emissions test dataset, which was deemed adequate for forecasting outputs, calculating the MAPE for the ammonia slip was fruitless since the true value of the ammonia slip may be zero at specific working points and the MAPE could not be defined theoretically [45,91,92]. In this specific case, no urea is injected, and there is no ammonia slip. The RMES were 44.01 × 10⁻⁶, 21.87 × 10⁻⁶, and 2.22 × 10⁻⁶ for three models of upstream NOx emissions, downstream NOx emissions, and ammonia slip, respectively, with squared correlation values of 0.99, 0.99, and 0.98. This suggested that the accuracies of the three models were adequate for estimating upstream and downstream NOx emissions, as well as ammonia slip [63,82,112]. Table 8 also displays the degree of fit for the three models, as well as the RMES and MAPE for the test datasets [92]. The following are the primary causes behind this: First, it was challenging to include all of the operation conditions of the diesel engine while selecting training sets for the model, which had a negative impact on forecast accuracy. Second, in the parameter selection and data processing, there were some subjective variables. Finally, with such a vast amount of experimental data, there may be some outliers. Furthermore, there was no assurance that the experimental data would be acquired in a perfectly stable condition, which may lead to mistakes in prediction [92].

3.3. Heavy-Duty Diesel Engine 7100 cc

This study investigated a 7100 cc diesel engine with SCR for reducing NOx emissions [18,67,114]. The SCR system used a urea injection control unit (DCU and ammonia oxidation catalyst (AOC)) to prevent ammonia leakage [118]. The corresponding specification and comprehensive information regarding the test bench are included in Table 9 and Figure 26 [114]. To evaluate torque and speed, soot emissions, NOx and O2 concentrations, and NH3, tests were conducted using a dynamometer, an opacimeter, and a gas analyzer (Exhaust gas and NH3 gas) [40,53,82]. The specifics of these instruments are listed in Table 10 [114].
To correctly represent the actual concentration of ammonia leakage during the initial calibration process, the AOC is not included in the SCR catalyst [76,120]. The WHTC test cycle is 1800 s long and is separated into three sections: cold start, hot dipping, and hot start. A complete cold start WHTC test is required first, followed by 10 min of hot dip time (closed and without data acquisition engine), and lastly a hot start WHTC test. The cold start and hot start weightings are utilized to establish the engine’s ultimate emission values, and the cold start and hot start weight factors are 14 % and 86 % [52,121]. Table 11 describes the NOx emission limit after weighting as 2.8 g/m3 (kWh). Because the degradation coefficient is set to 1.1 in real-world operation, the final NOx emission values must not exceed 2.52 g/(kW h) [114].
The exhaust temperatures measured by the conventional diesel engine equipped with the SCR system over three European Transient Cycle (ETC) test cycles [41] and the cold and hot start WHTC were compared in Figure 27 [114]. 92.8 % of the ETC test cycle is spent with an exhaust temperature of at least 200 degrees Celsius. The exhaust temperature is more than 200 °C from the start of the ETC cycle, which fulfills the urea injection criterion; the average exhaust temperature for the ETC test cycle can exceed 298 °C. The exhaust temperature of 59.3 percent of the cold start WHTC working conditions is less than 200 °C [55,103,114]. In the ETC test cycle, the exhaust temperature of the hot start and cold start in the WHTC test cycle is essentially below 280 °C. The ETC cycle’s catalyst conversion efficiency is greater than that of the WHTC cycle’s hot start and cold start. Figure 28 shows the effect of exhaust temperature on NOx and ammonia slip conversion efficiency. When the exhaust temperature exceeds 200 °C, urea droplets and the catalyst have a certain activity that improves substantially as the temperature rises. When the temperature surpasses 280 °C, NOx conversion efficiency reaches its peak. As a result, the exhaust temperature rises to around 280 °C; therefore, the active regulation of exhaust temperature is primarily focused on temperatures less than 280 °C [114].

3.4. Heavy-Duty Diesel Engine 12,000 cc
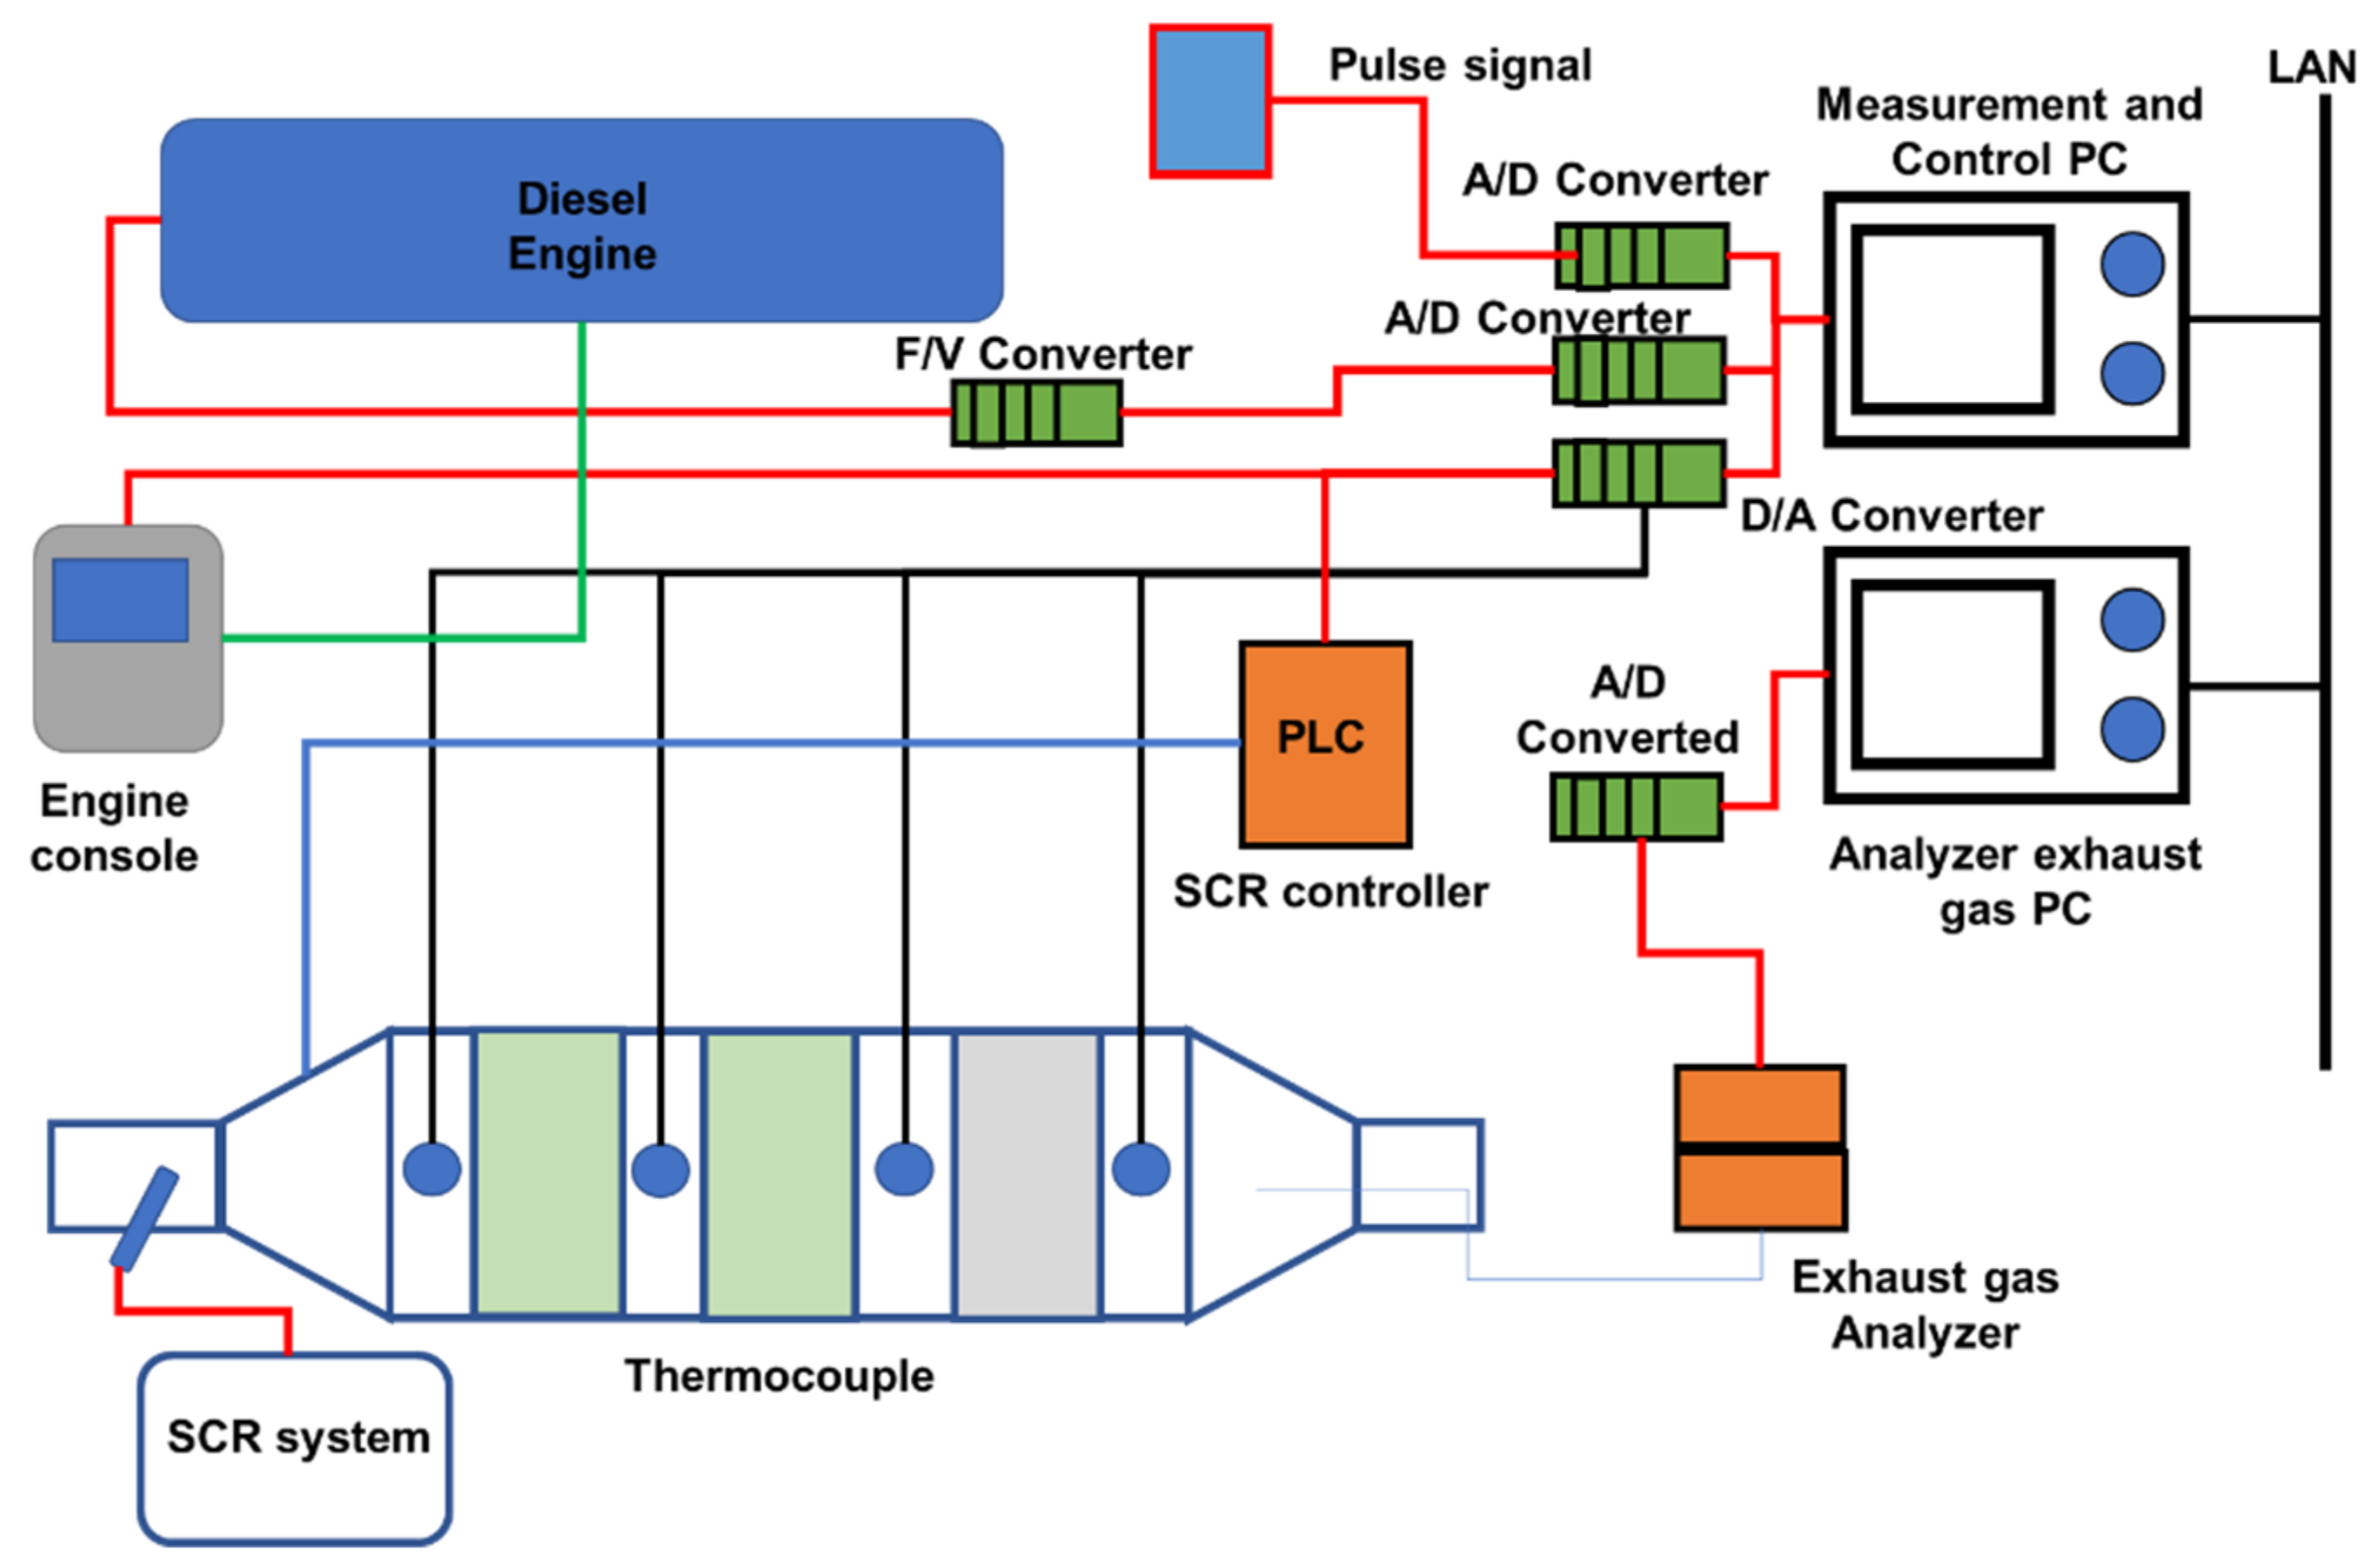
This study investigated a 12,000 cc diesel engine with SCR for reducing NOx emissions. The engine used in these testing was a six-cylinder four-stroke heavy-duty diesel engine with natural aspiration and water cooling was showing in Table 12. The Hyundai D6CC diesel engine emits a high concentration of NOx at 1000 rpm, with an exhaust mass flow rate of 513 kg/h and a NOx value of 1,330 ppm with the NO2/NOx feed ratio (0–1) and the NH3/NOx feed ratio alpha = 1 [10,122]. Before the experiment, the gas analyzer calculated the exhaust gas concentration. The uncertainty of a gas analyzer’s exhaust gas coefficients was 5% or 1.0 m [75]. Figure 29 and Figure 30 depict the current study’s experimental setup and schematic diagram.
The UWS, with a flowrate of 1319 mL/h at an ambient temperature of 298 K (Tg), was injected into the system with an engine-out exhaust temperature of 686 K. A mixing process between NOx emissions and ammonia gas took place from the point of urea injection to the catalyst surface [123,124,125]. After the SCR process, a gas analyzer reported the concentration of NOx emissions using an exhaust gas sample pipe. This process proved the comparative effectiveness of the urea injector models L and I. The sampling for that experiment was repeated ten times in a row. The main goal of this research was to see if the model I urea injector was more successful in the urea breakdown process than the model L injector (which was used in the D6CC engine originally) [39,122]. Figure 31 and Figure 32 show the two urea injector models used in this work, and Figure 32 also shows the solid deposit inside the injector. As illustrated in Figure 31B, the deposit formed as a result of an injector component impeding exhaust flow. The urea dispersion throughout the system was slowed by these solid deposits. Model L injectors produced less urea than the model I injectors because of this.
The 19 sensors on the catalyst surface (Figure 33) and the ammonia concentration measurement from the gas analyzer is shown in Figure 34 [39]. The catalyst type used in this study was a vanadium catalyst. The model I urea injector (blue bars) generated more ammonia than the model L (red bars) urea injector; greater ammonia in an SCR system indicates higher NOx conversion. Figure 35 depicts the NOx conversion rates for the two injectors used in the experiment [39]. The model I injector converted more NOx than model L, corroborating the simulation results from the previous section that model I produced more ammonia and delivered greater system saturation. This suggests that the model I urea injector has a favorable urea injection form, which results in better urea particle conversion to ammonia and fewer solid deposits. As a result, the model I urea injector is suggested for improving NOx conversion in heavy-duty diesel engines, particularly the Hyundai D6CC [39,122].
The concentration of ammonia gas in the system is the primary indication of improved NOx conversion. The chemical process that converts NOx to N2 and H2O requires an equivalent quantity of ammonia gas, and the system should be able to create enough ammonia gas to meet that requirement. The urea injector model I shows a rising amount of ammonia gas by modeling and testing with 19 gas sensors on the catalyst surface [39,122]. The NOx conversion results in this research confirmed that the ammonia delivery from injector model I reduced NOx emissions more effectively than the model L injector. These results indicated that the urea injector model I should be utilized in heavy-duty diesel engines, namely the Hyundai D6CC. As a result of this revelation, further research into lowering NOx emissions from heavy-duty diesel engines will be crucial.

4. Marine Engine

This study investigated a marine engine fitted with SCR for reducing NOx emissions. Figure 36 shows the experimental SCR system setup. Sample A is the low-temperature catalyst. HORIBA MEXA-1600DEGR and HORIBA MEXA-6000FT exhaust gas analyzers were used to detect exhaust gas components during testing [18,28,126]. The experimental SCR system’s SV value was around 5000 h ̶ 1. A four-stroke medium-speed marine diesel engine powered this experimental installation [41,127,128]. This 6-cylinder test engine had a 190 mm bore and 260 mm stroke and a rated power output of 750 kW at 1000 rpm. In this study, TiO2 and V2O5 catalysts were used, the type with resistance to deterioration by SOx and which have excellence performance at low gas temperatures. Table 13 shows the engine specifications [28].
The engine and experimental SCR system functioning data were monitored and recorded, including engine speed, load, and temperatures. As shown in Figure 36, the SCR controller and PC regulate the amount of reducing agent administered [28]. By measuring the NOx concentration and exhaust gas flow rate, the controller determines the quantity of reducing agent to inject. The concentration of used NOx is measured without the use of a gas analyzer. In most cases, the carbon balance approach is used to calculate the exhaust gas flow rate [114,129,130]. To determine the flow rate of exhaust gas using the carbon balance technique, various parameters must be measured precisely, including fuel consumption, fuel properties, and CO2 and CO concentrations in the exhaust gas. However, it is not acceptable to measure multiple data points correctly for a ship. As a consequence, we used an exhaust gas flow rate calculated by combining engine speed, charge air pressure, and charge air temperature. In terms of managing the quantity of reducing chemicals supplied, our technique was uncomplicated and exact [131,132].
NOx reduction values for the experimental SCR system using urea–water solution and ammonia gas are shown in Figure 37 and Figure 38 [28,133]. The proportion of the ship’s typical load is used to separate the measurement data. These figures show how each reducing agent, ammonia gas or urea solution, transforms NOx appropriately at each load. Table 14 shows the exhaust gas temperature at each load. Figure 39 and Figure 40 illustrate the NOx conversion rate as a function of the equivalence ratio with ammonia gas and urea solution. The equivalence ratio is the proportion of the measured value to desired urea flow rate for a 100% reduction in NOx. Figure 39 and Figure 40 show that the rate of NOx conversion is exactly related to the equivalence ratio for each reducing agent (ammonia gas or urea solution) [36,134,135]. These findings show that the type of reducing agent used is not affected by the high exhaust gas temperatures and that the SCR system performs well. Experiments to adjust the temperature of the catalyst in the micro-reactor will be performed in the next stage of work to compare the NOx removal efficiency of diesel engines fitted with the micro-reactor, from which the Ka values will be calculated [28,97,136].

5. Conclusions

The NOx conversion results from various diesel engines were investigated in this study. The various models and approaches employed in this SCR system study can serve as a base for future researchers to improve SCR performance and decrease NOx emissions from diesel engines. The major conclusions drawn from this study are as follows:
a)
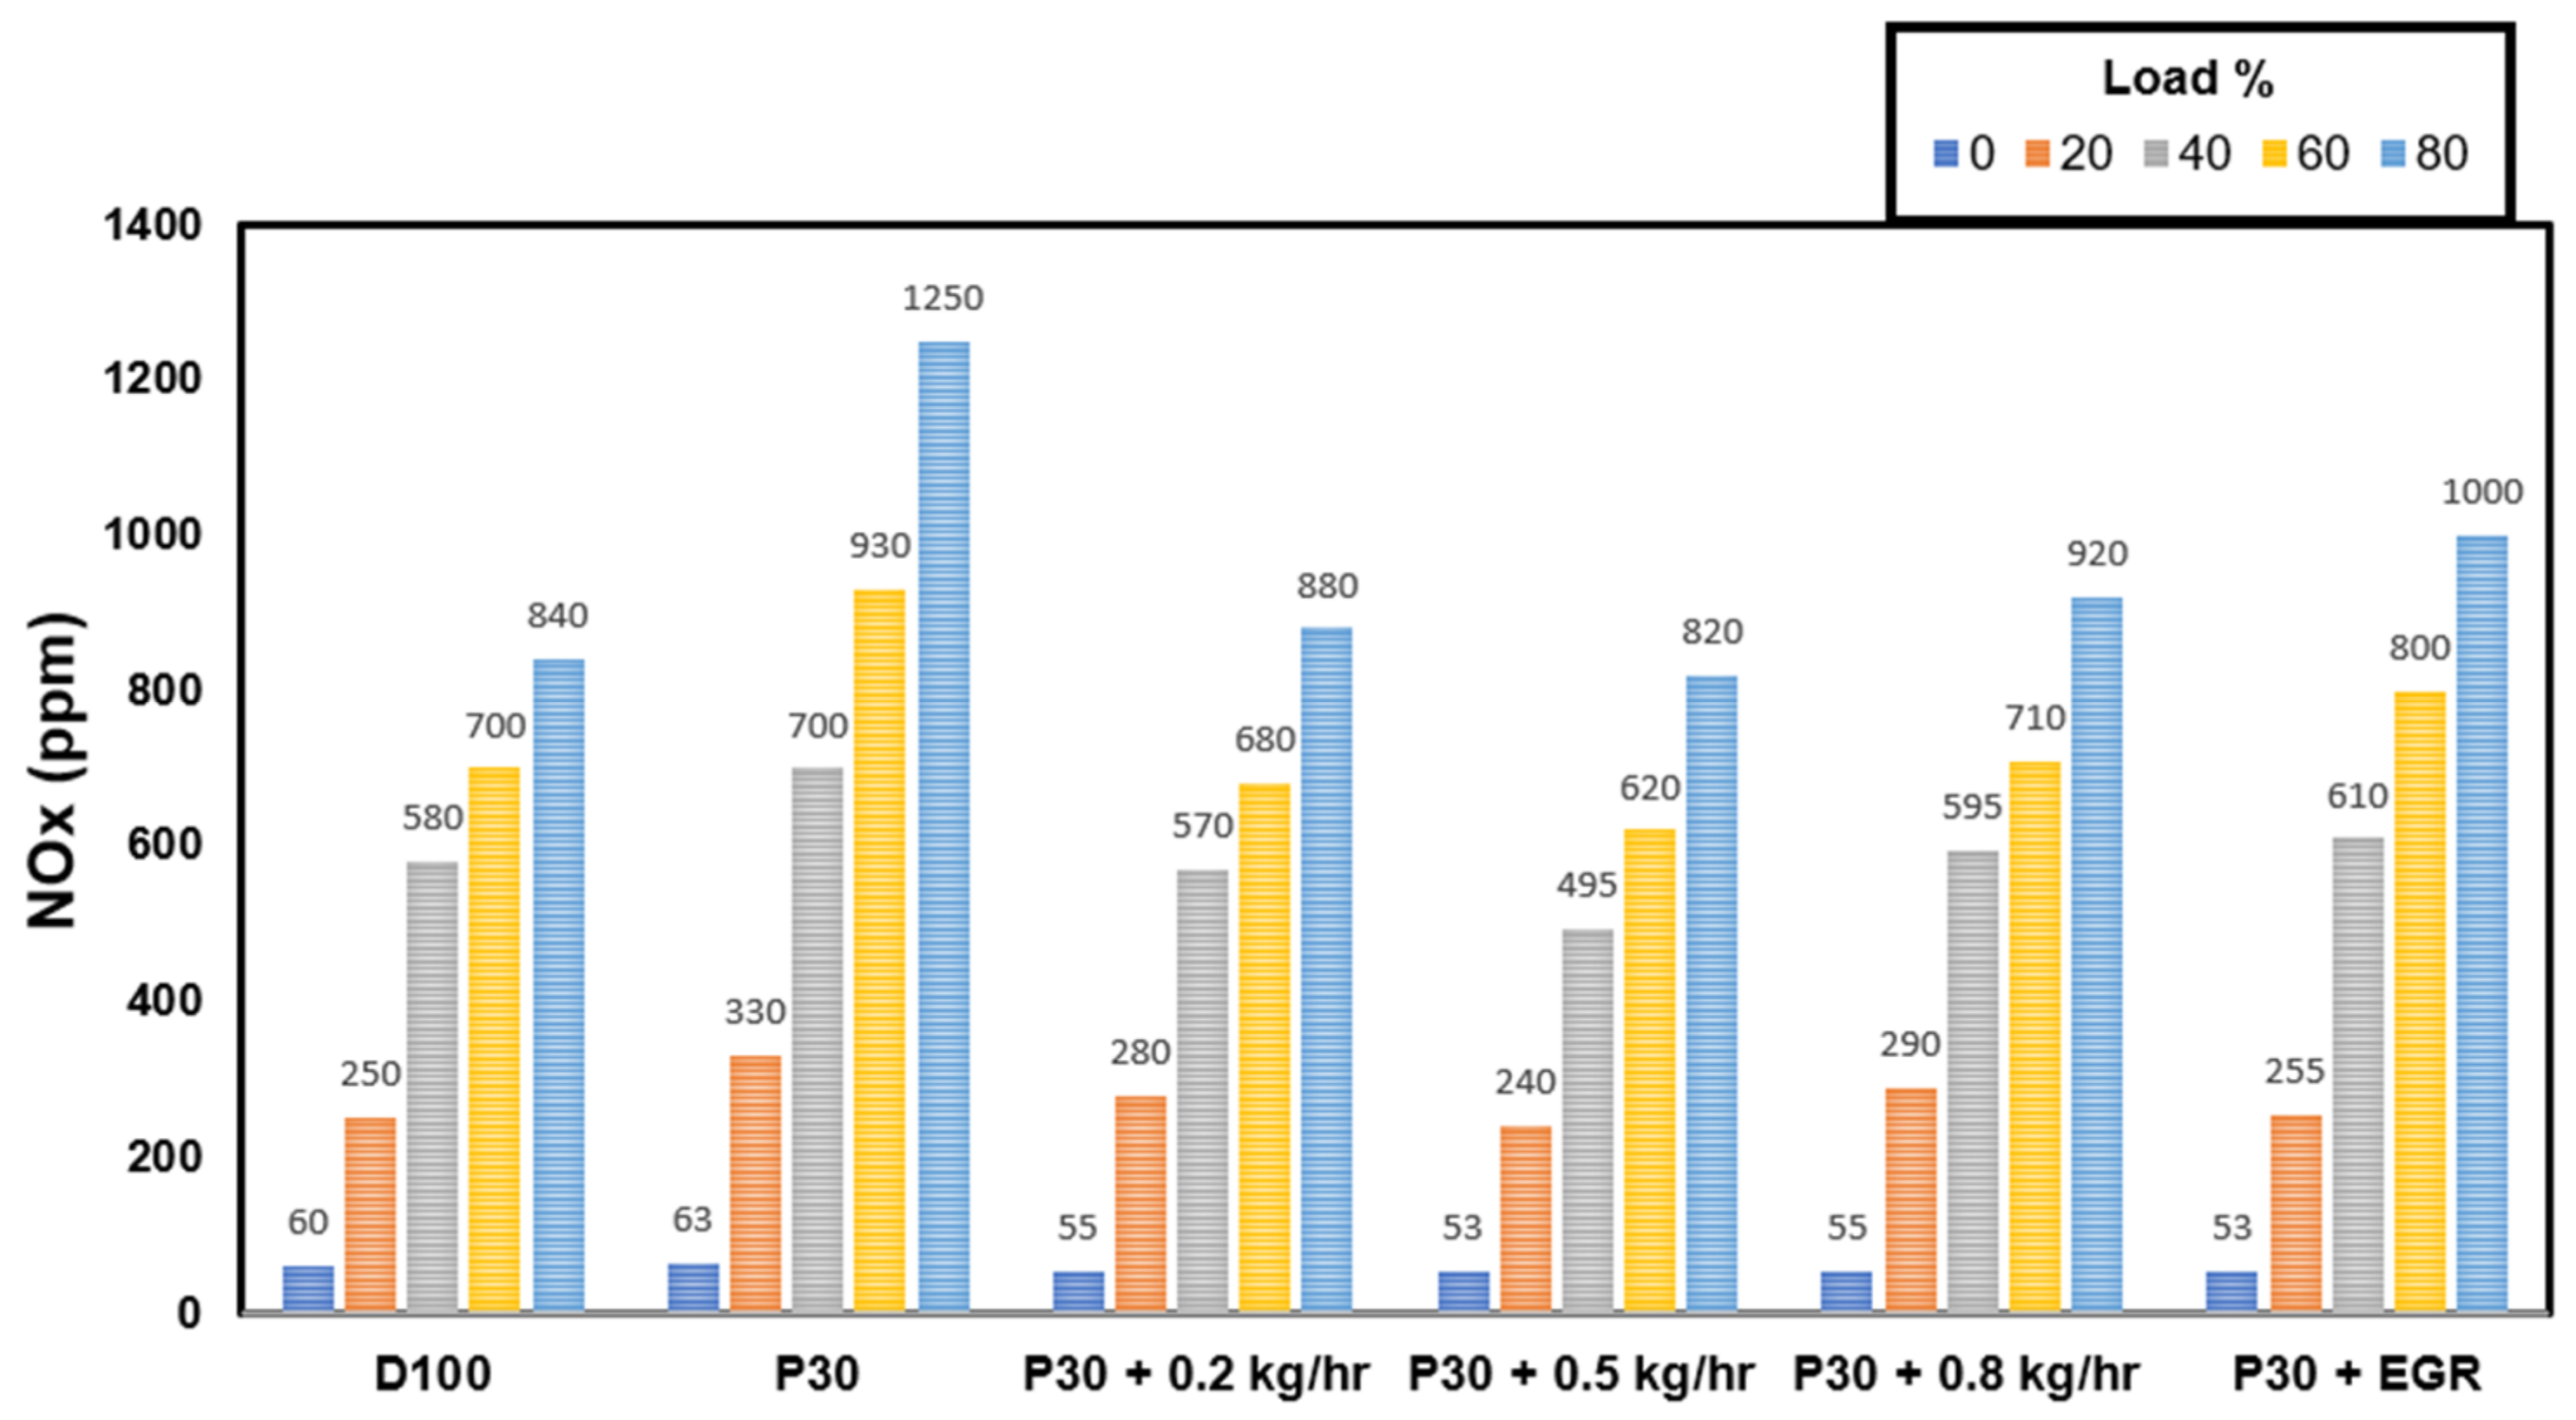
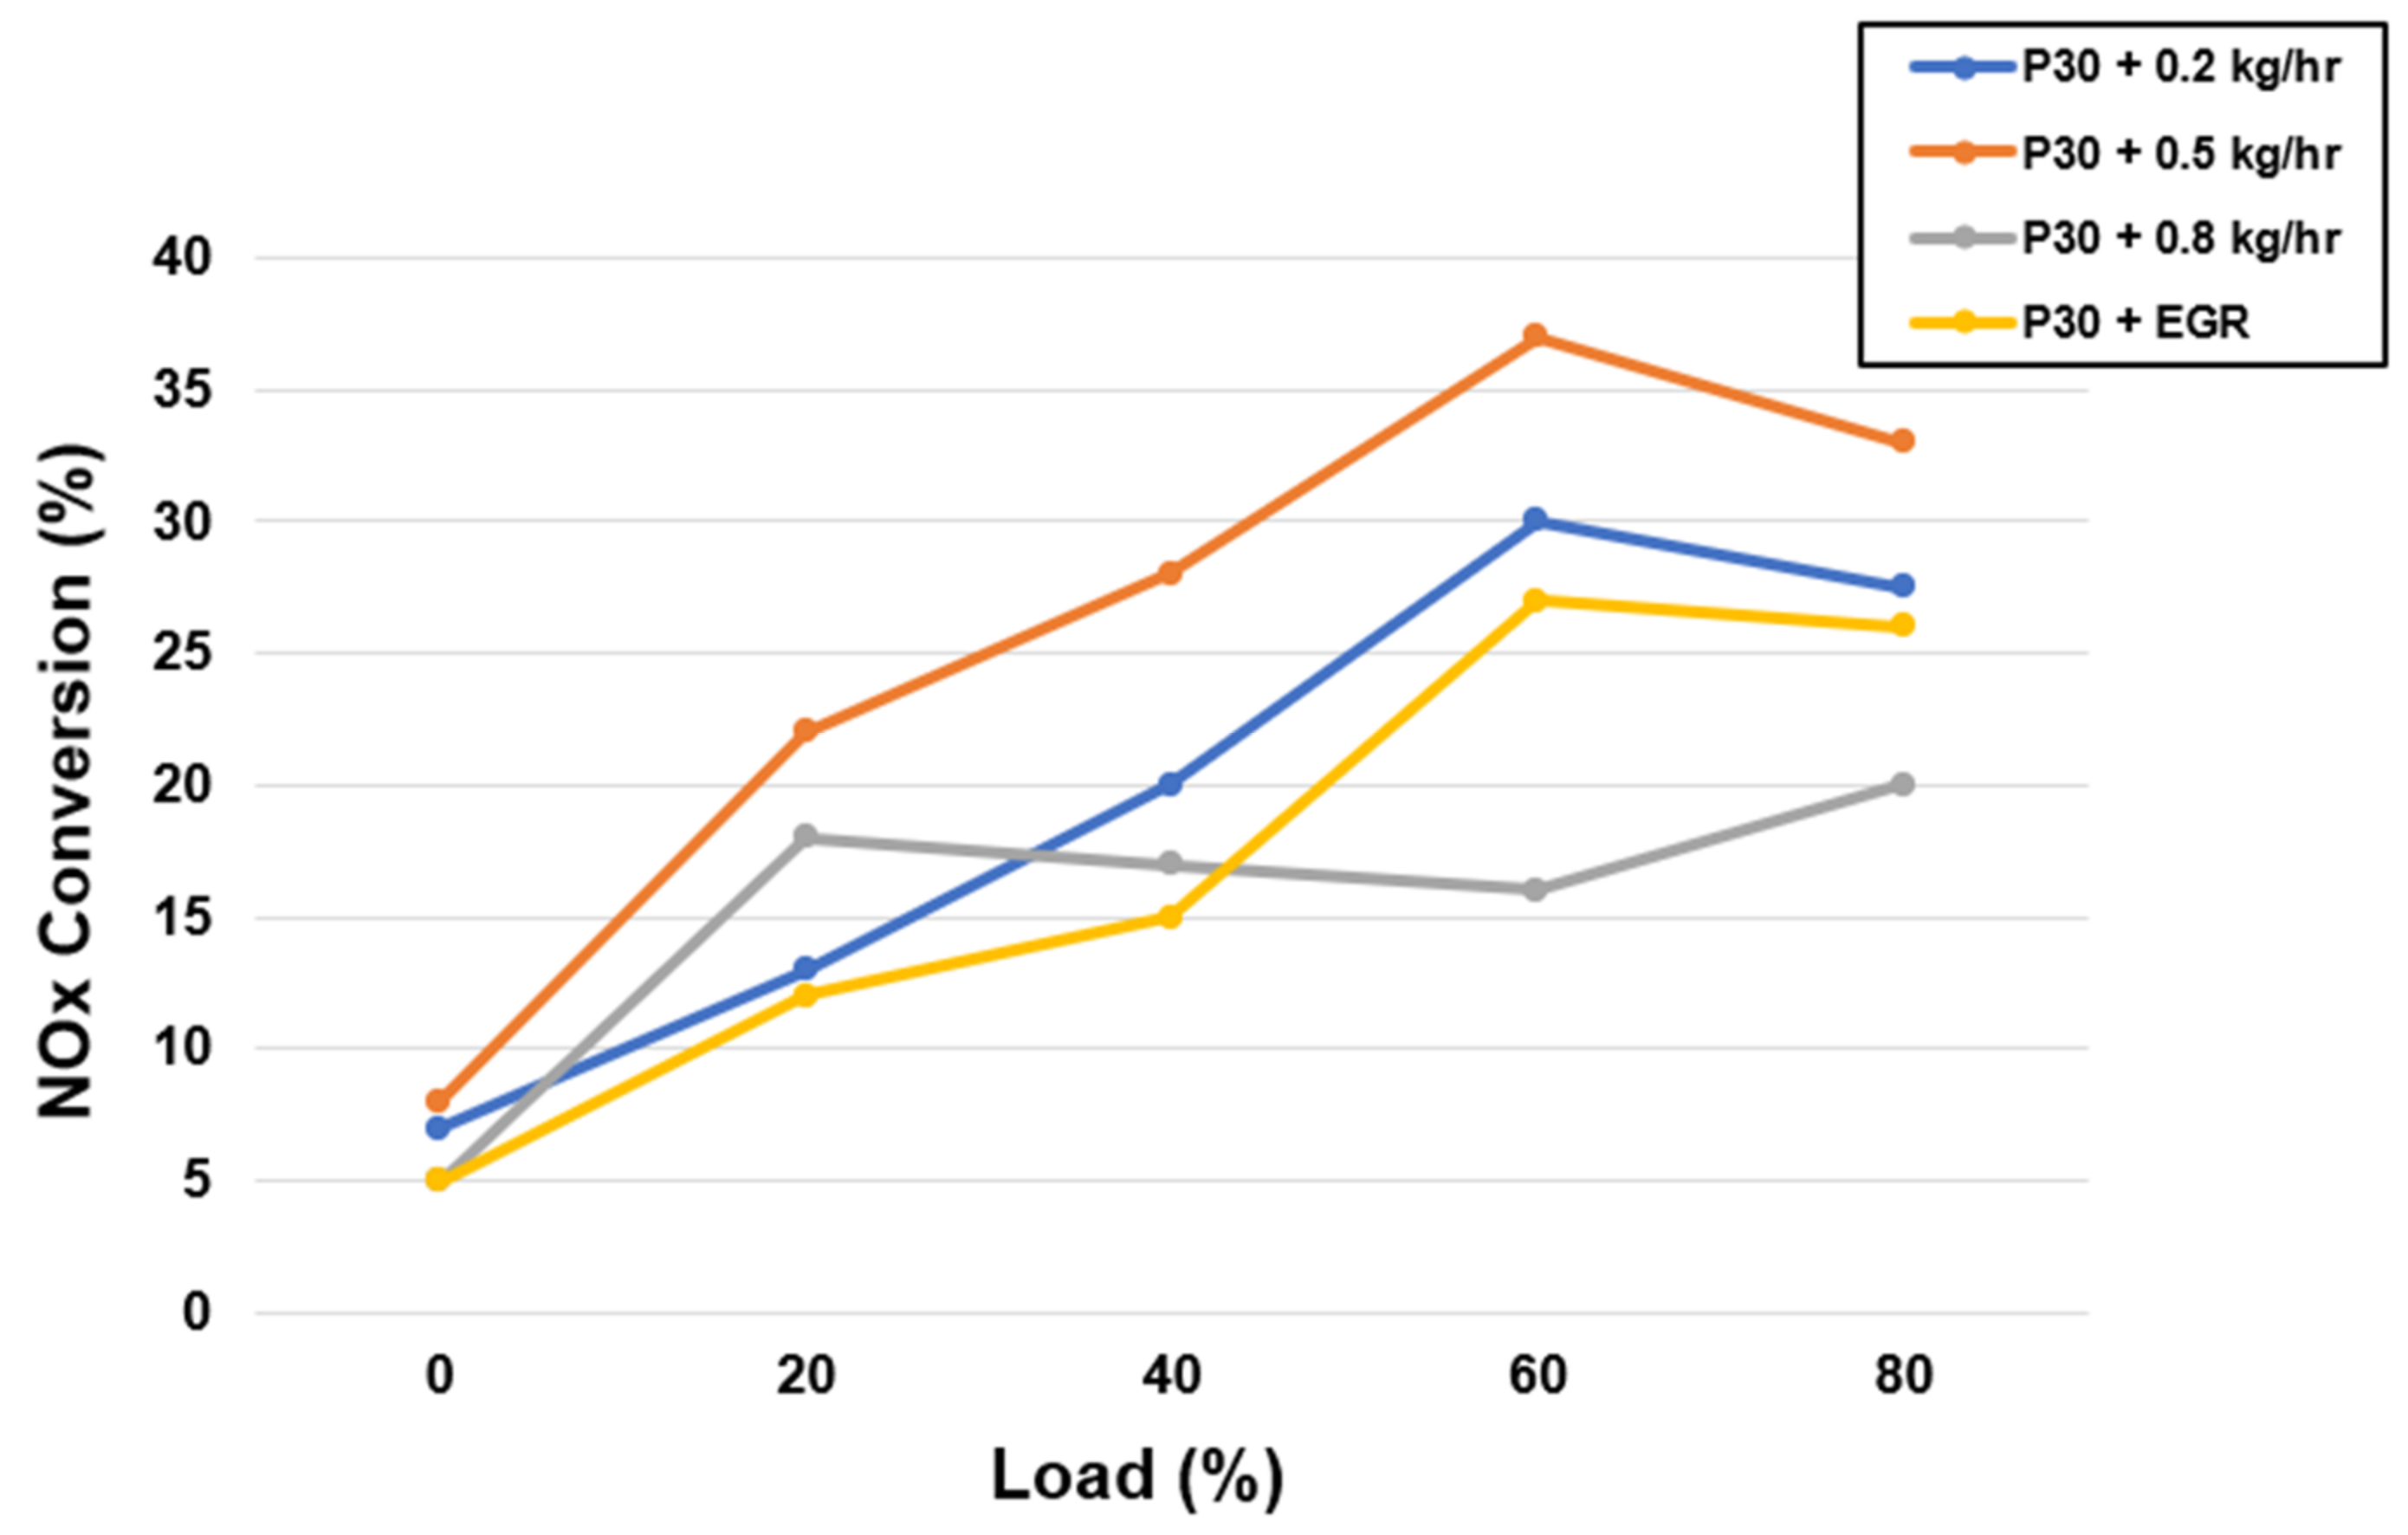
The light diesel engine with a 1000 cc engine capacity was tested with different loadings (0–80%) at a constant speed of 2000 rpm. The maximum NOx reduction achieved by the SCR system was 36.8% at 60% engine load. The improvement of the desorption process of ammonia gas by the optimization of SCR catalyst temperatures in the range of 240 °C to 280 °C increases NOx conversion up to 0.5 kg/h (650 ppm).
b)
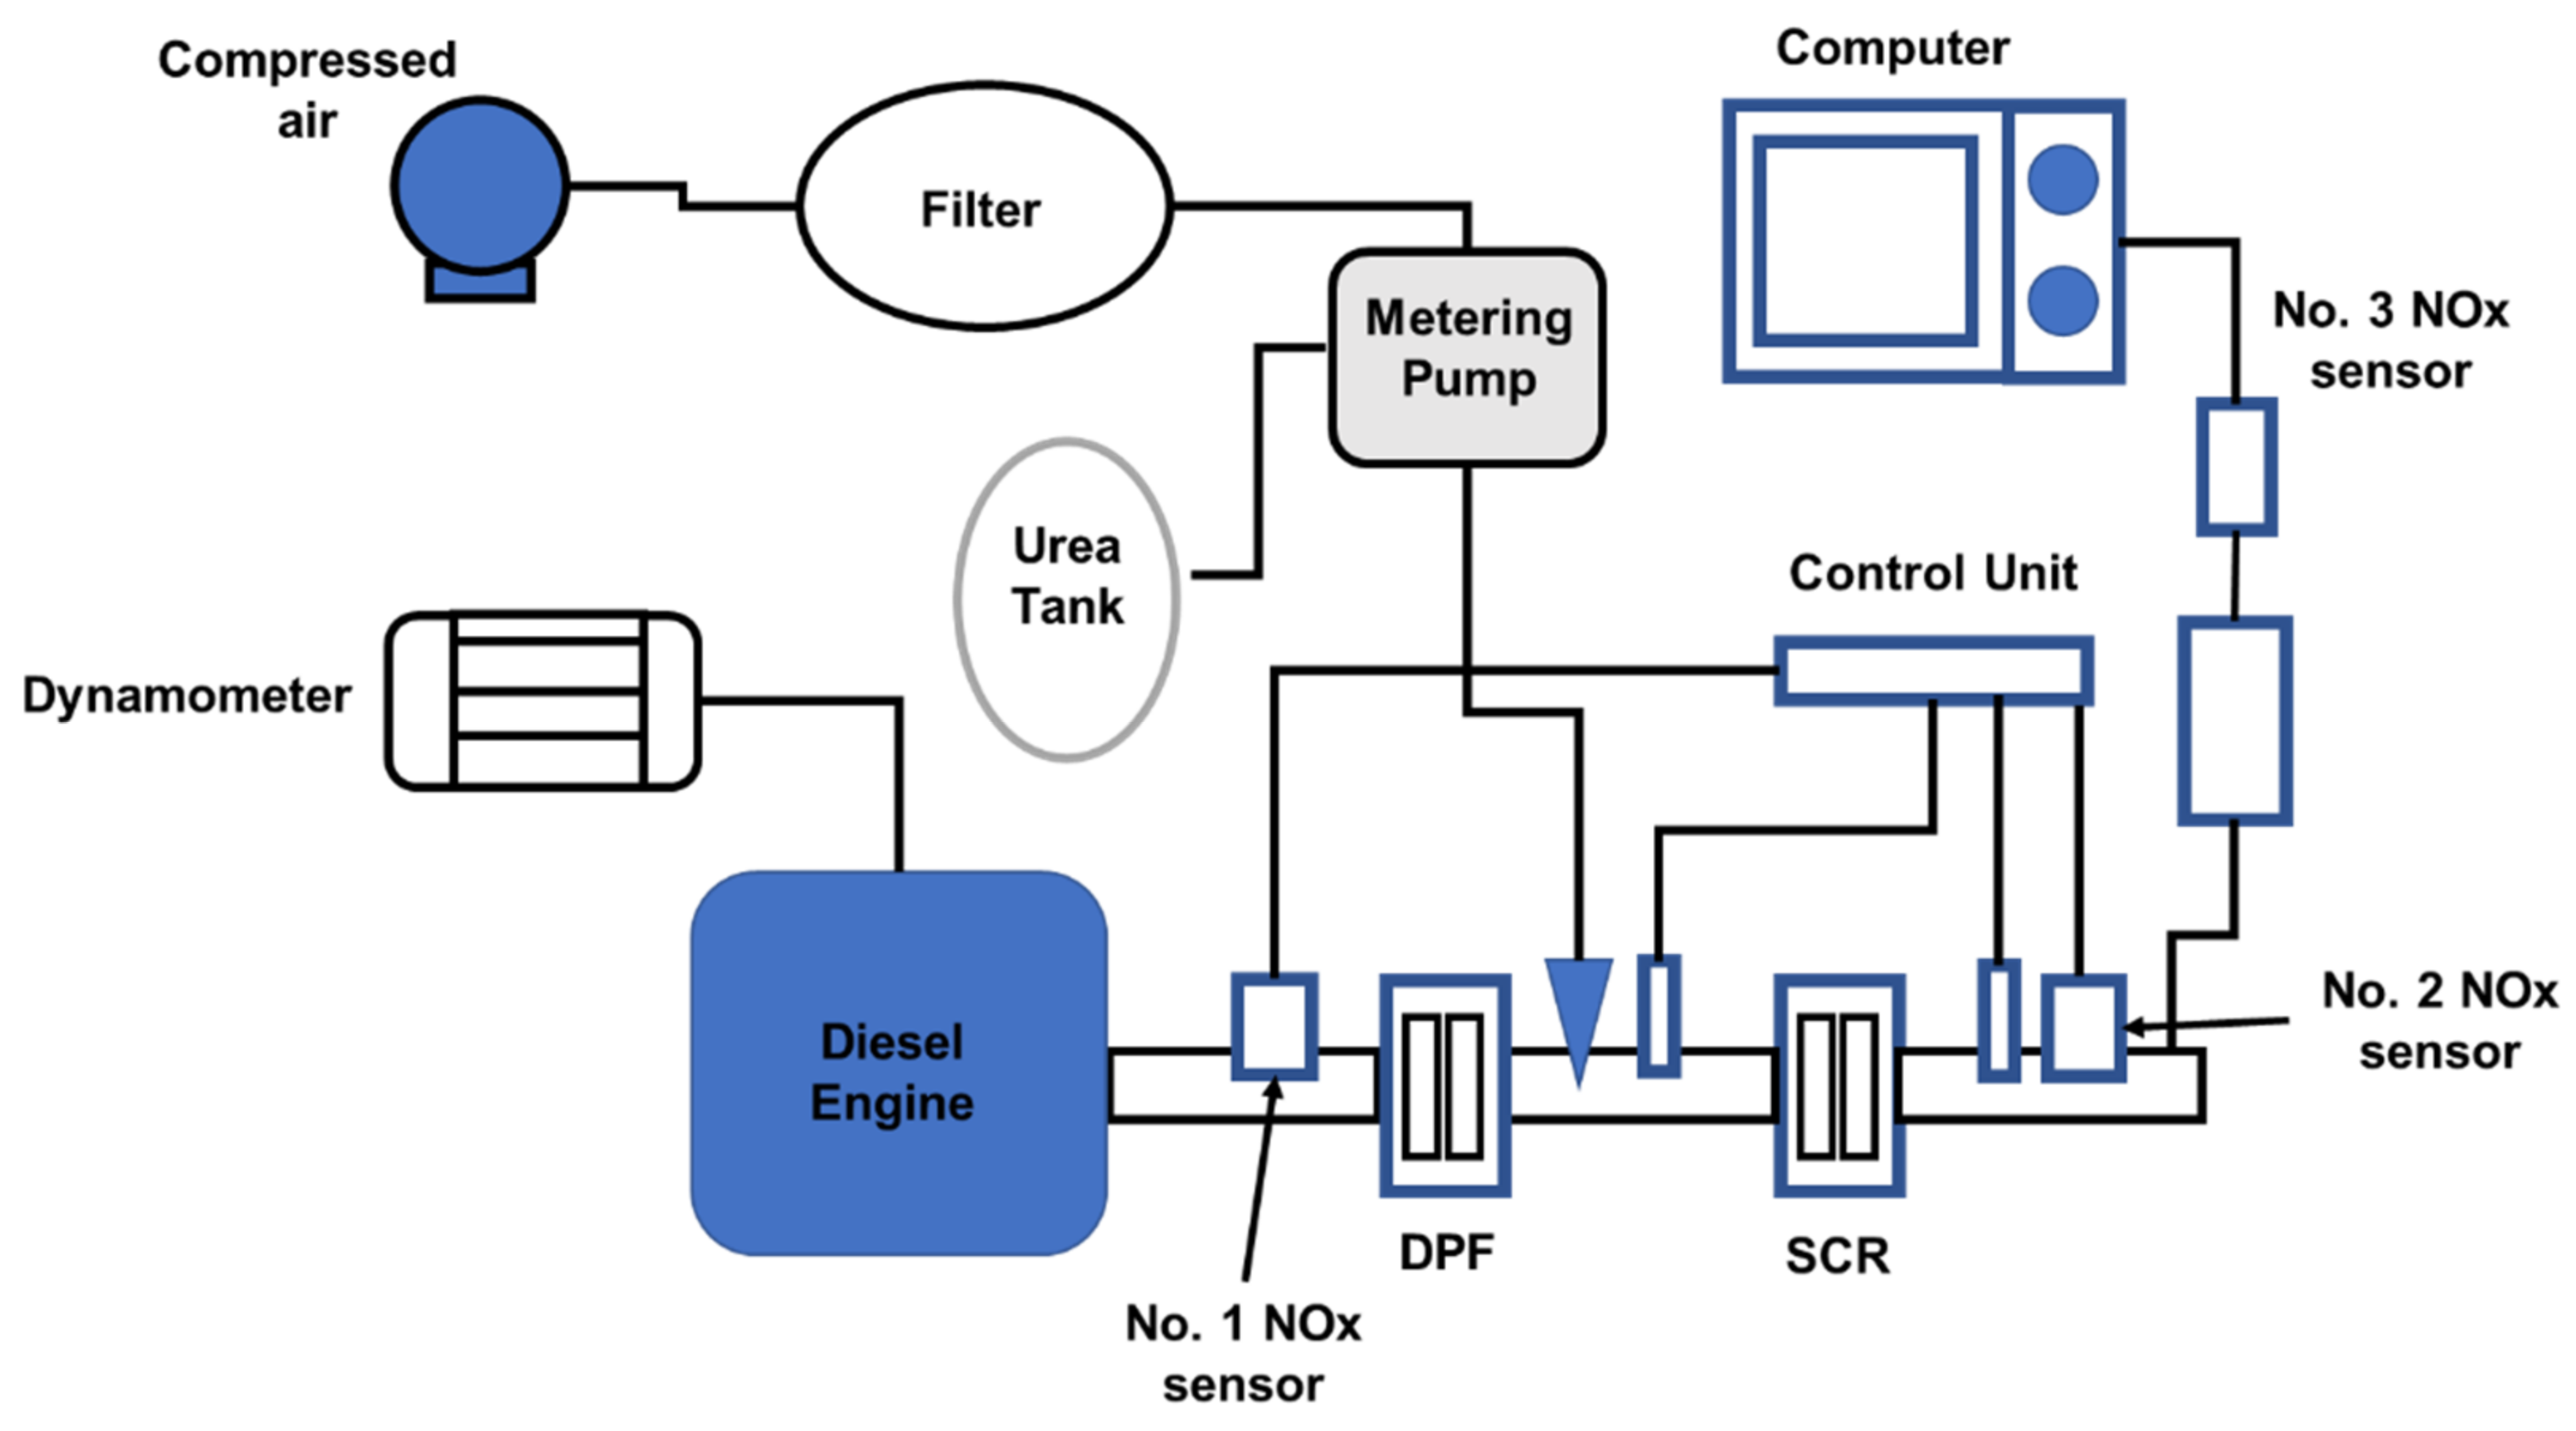
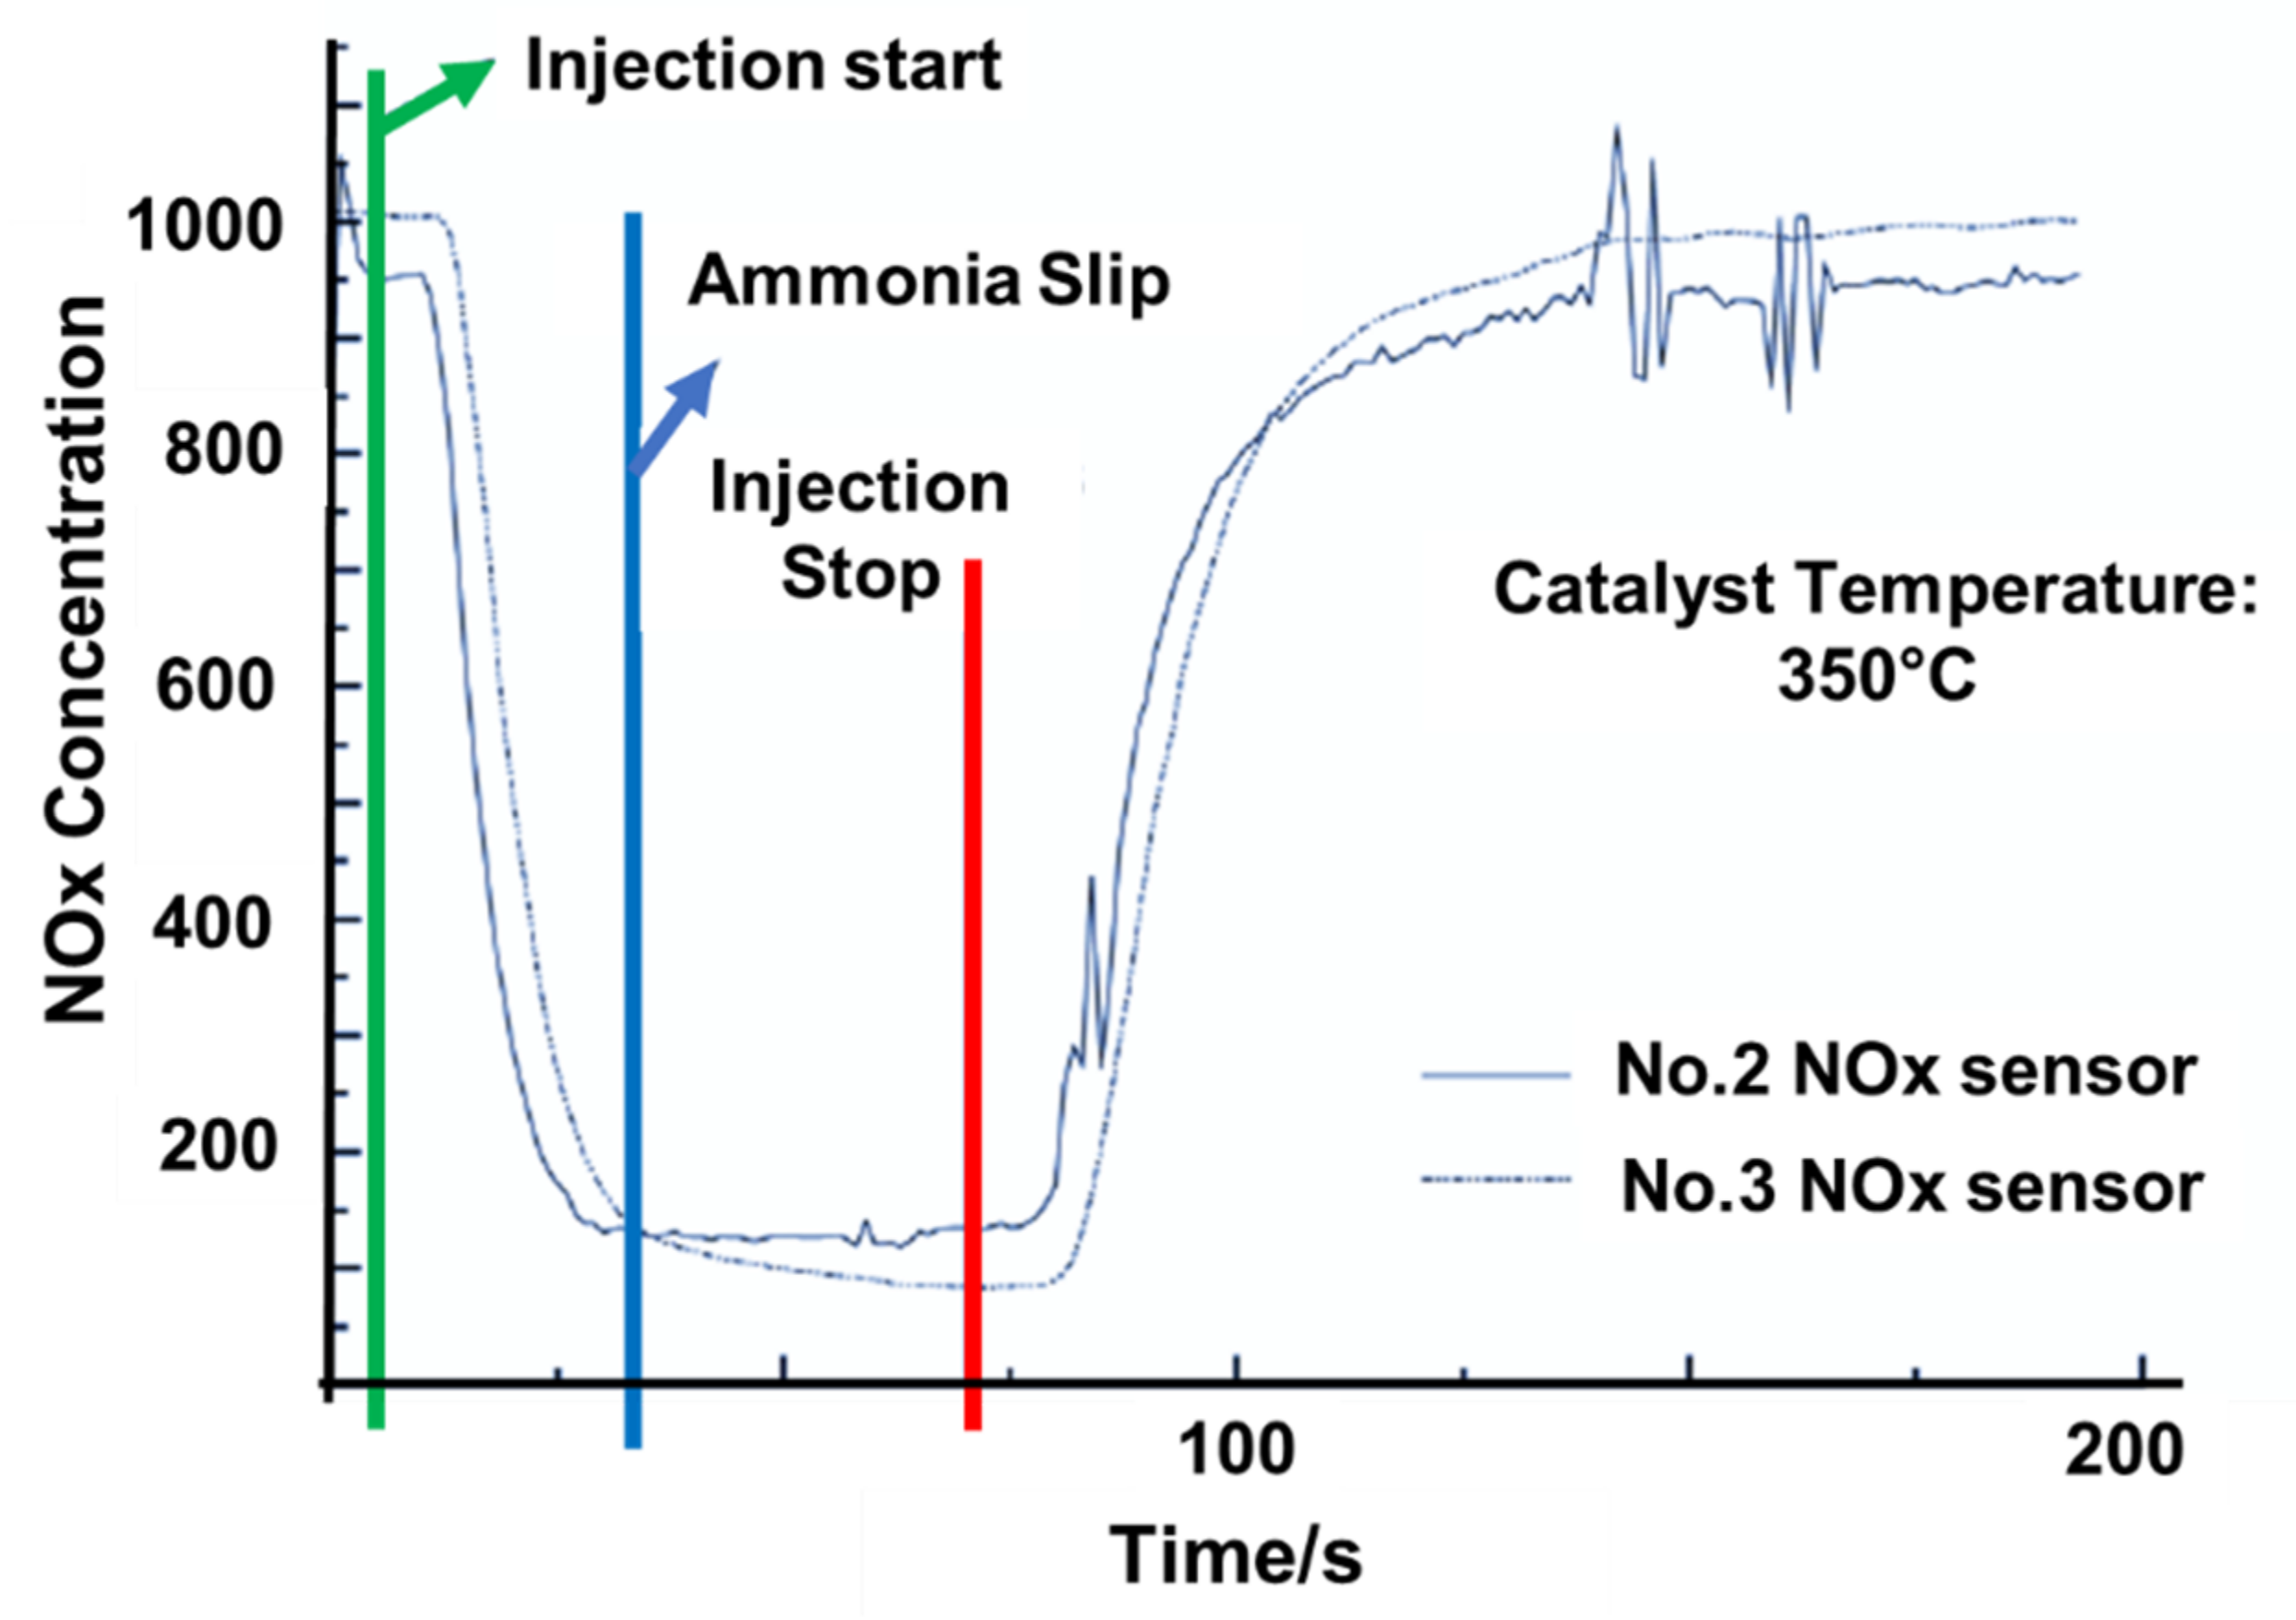
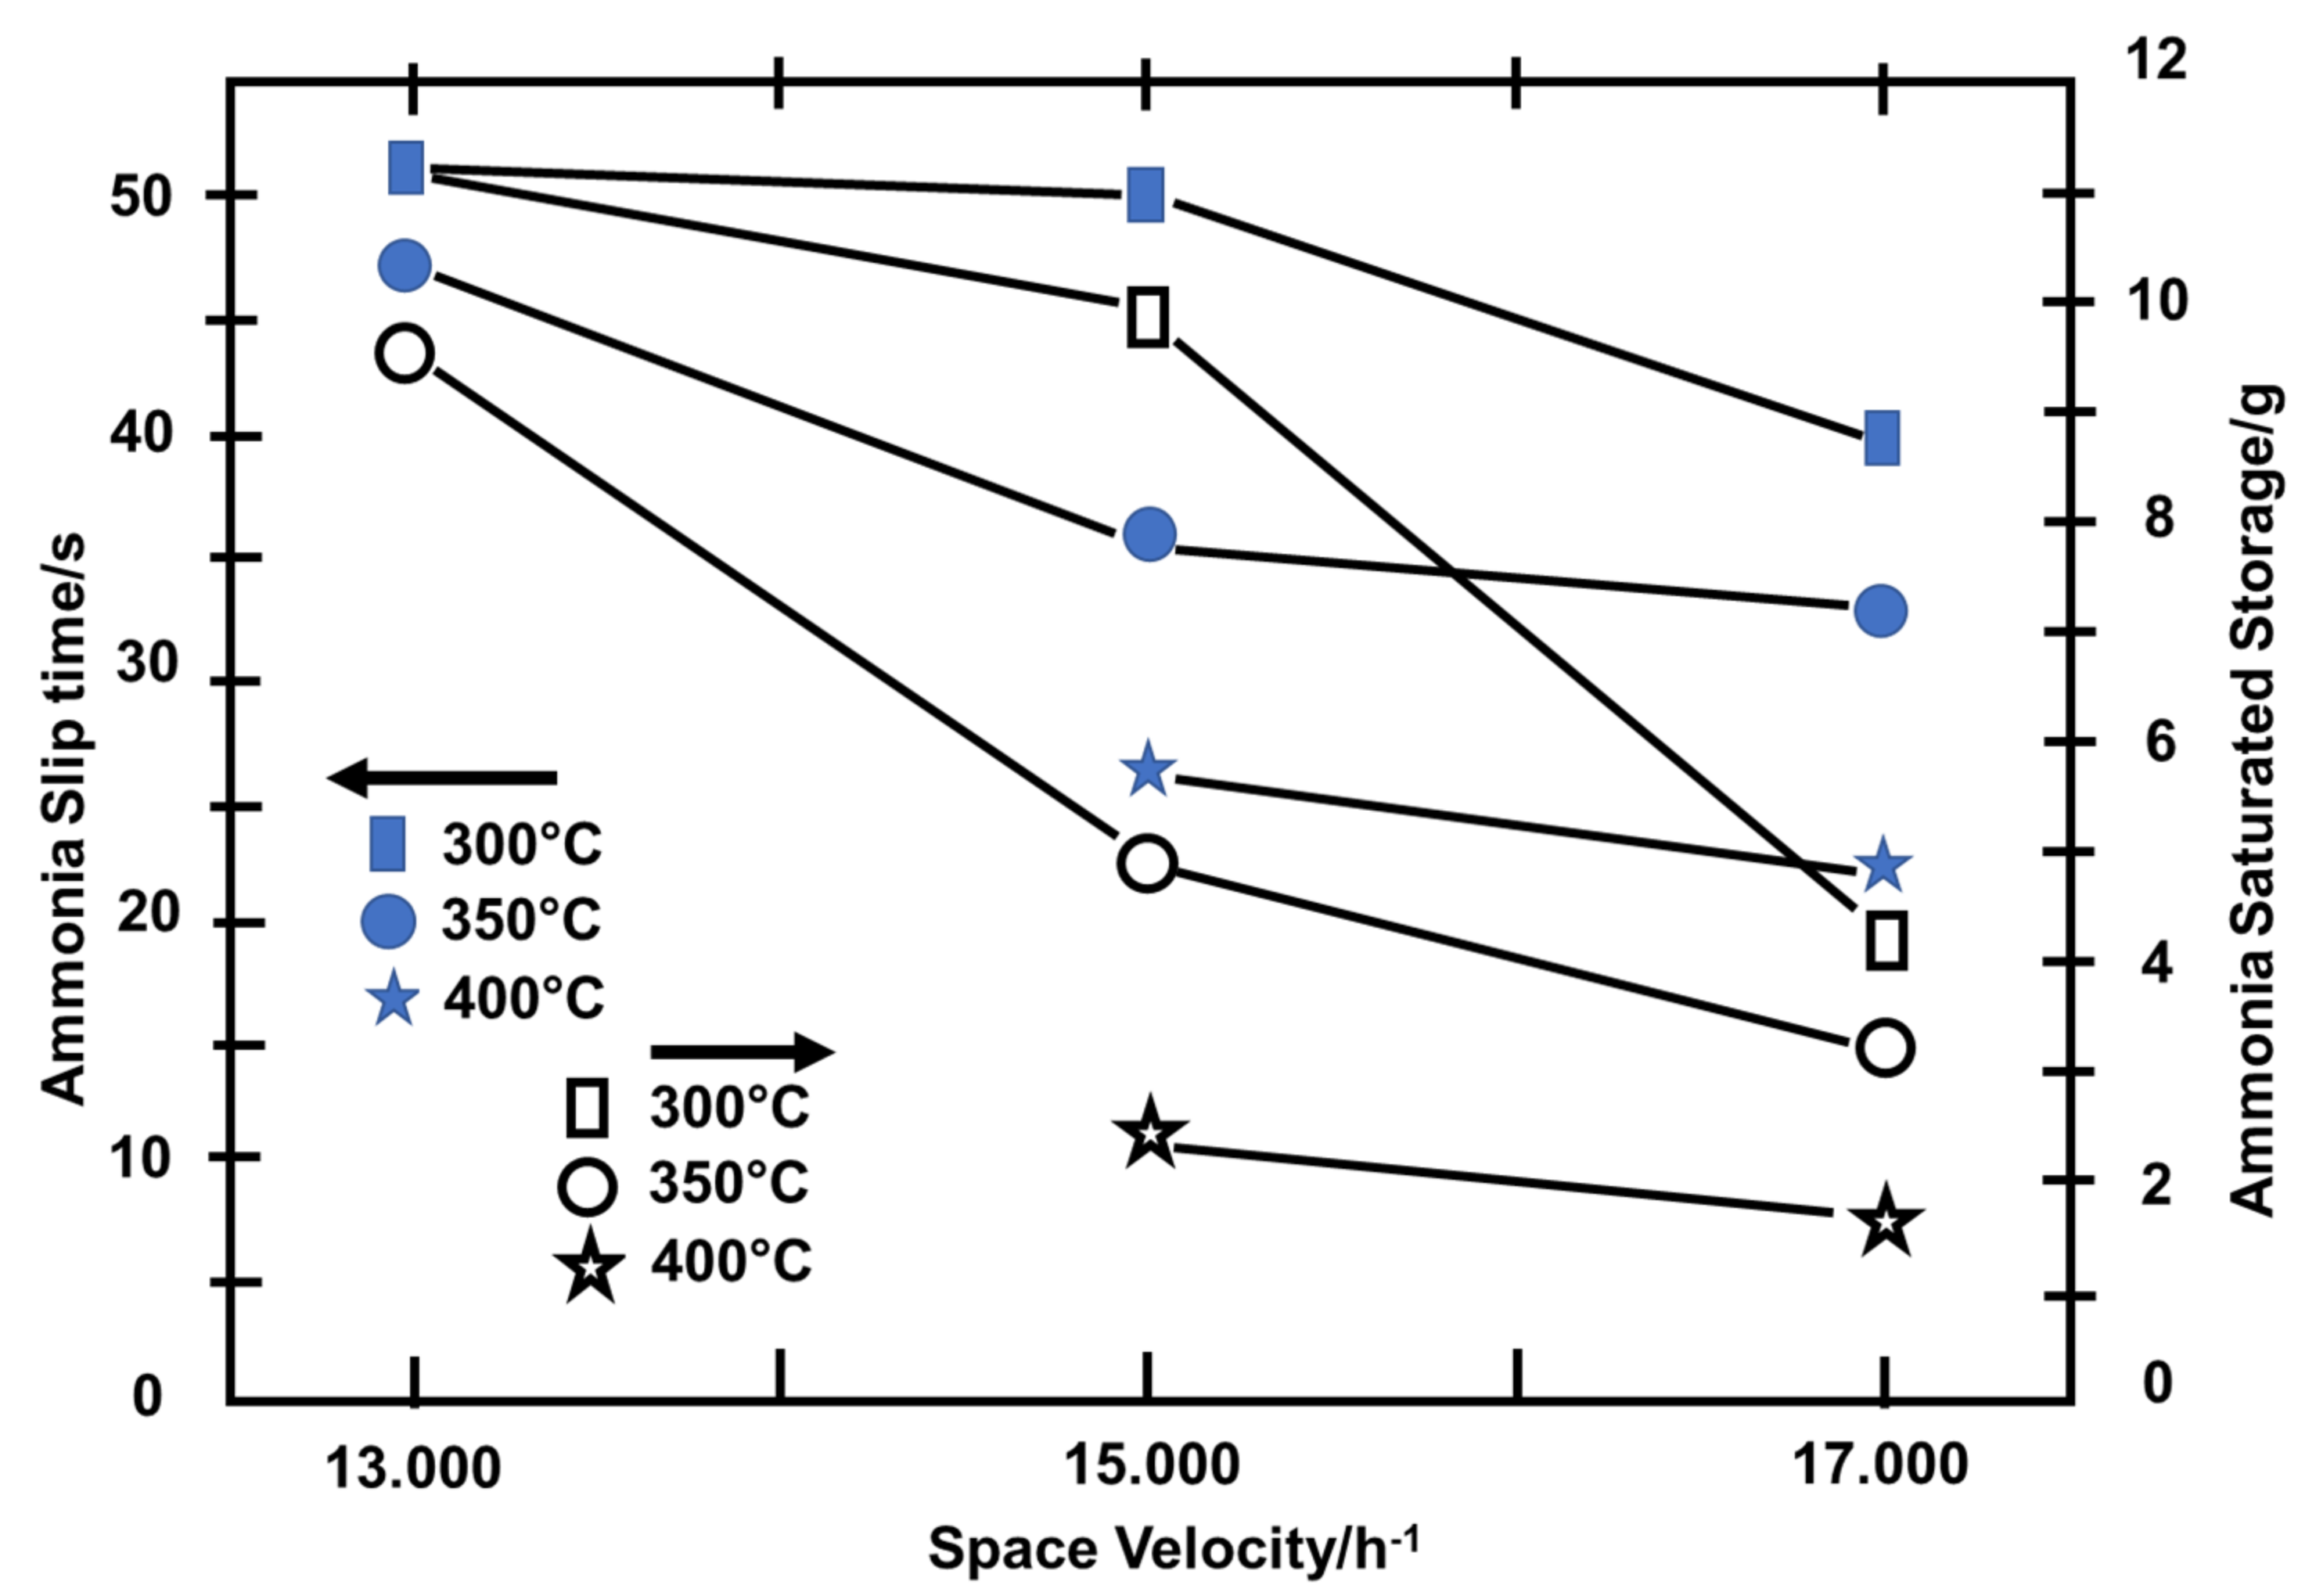
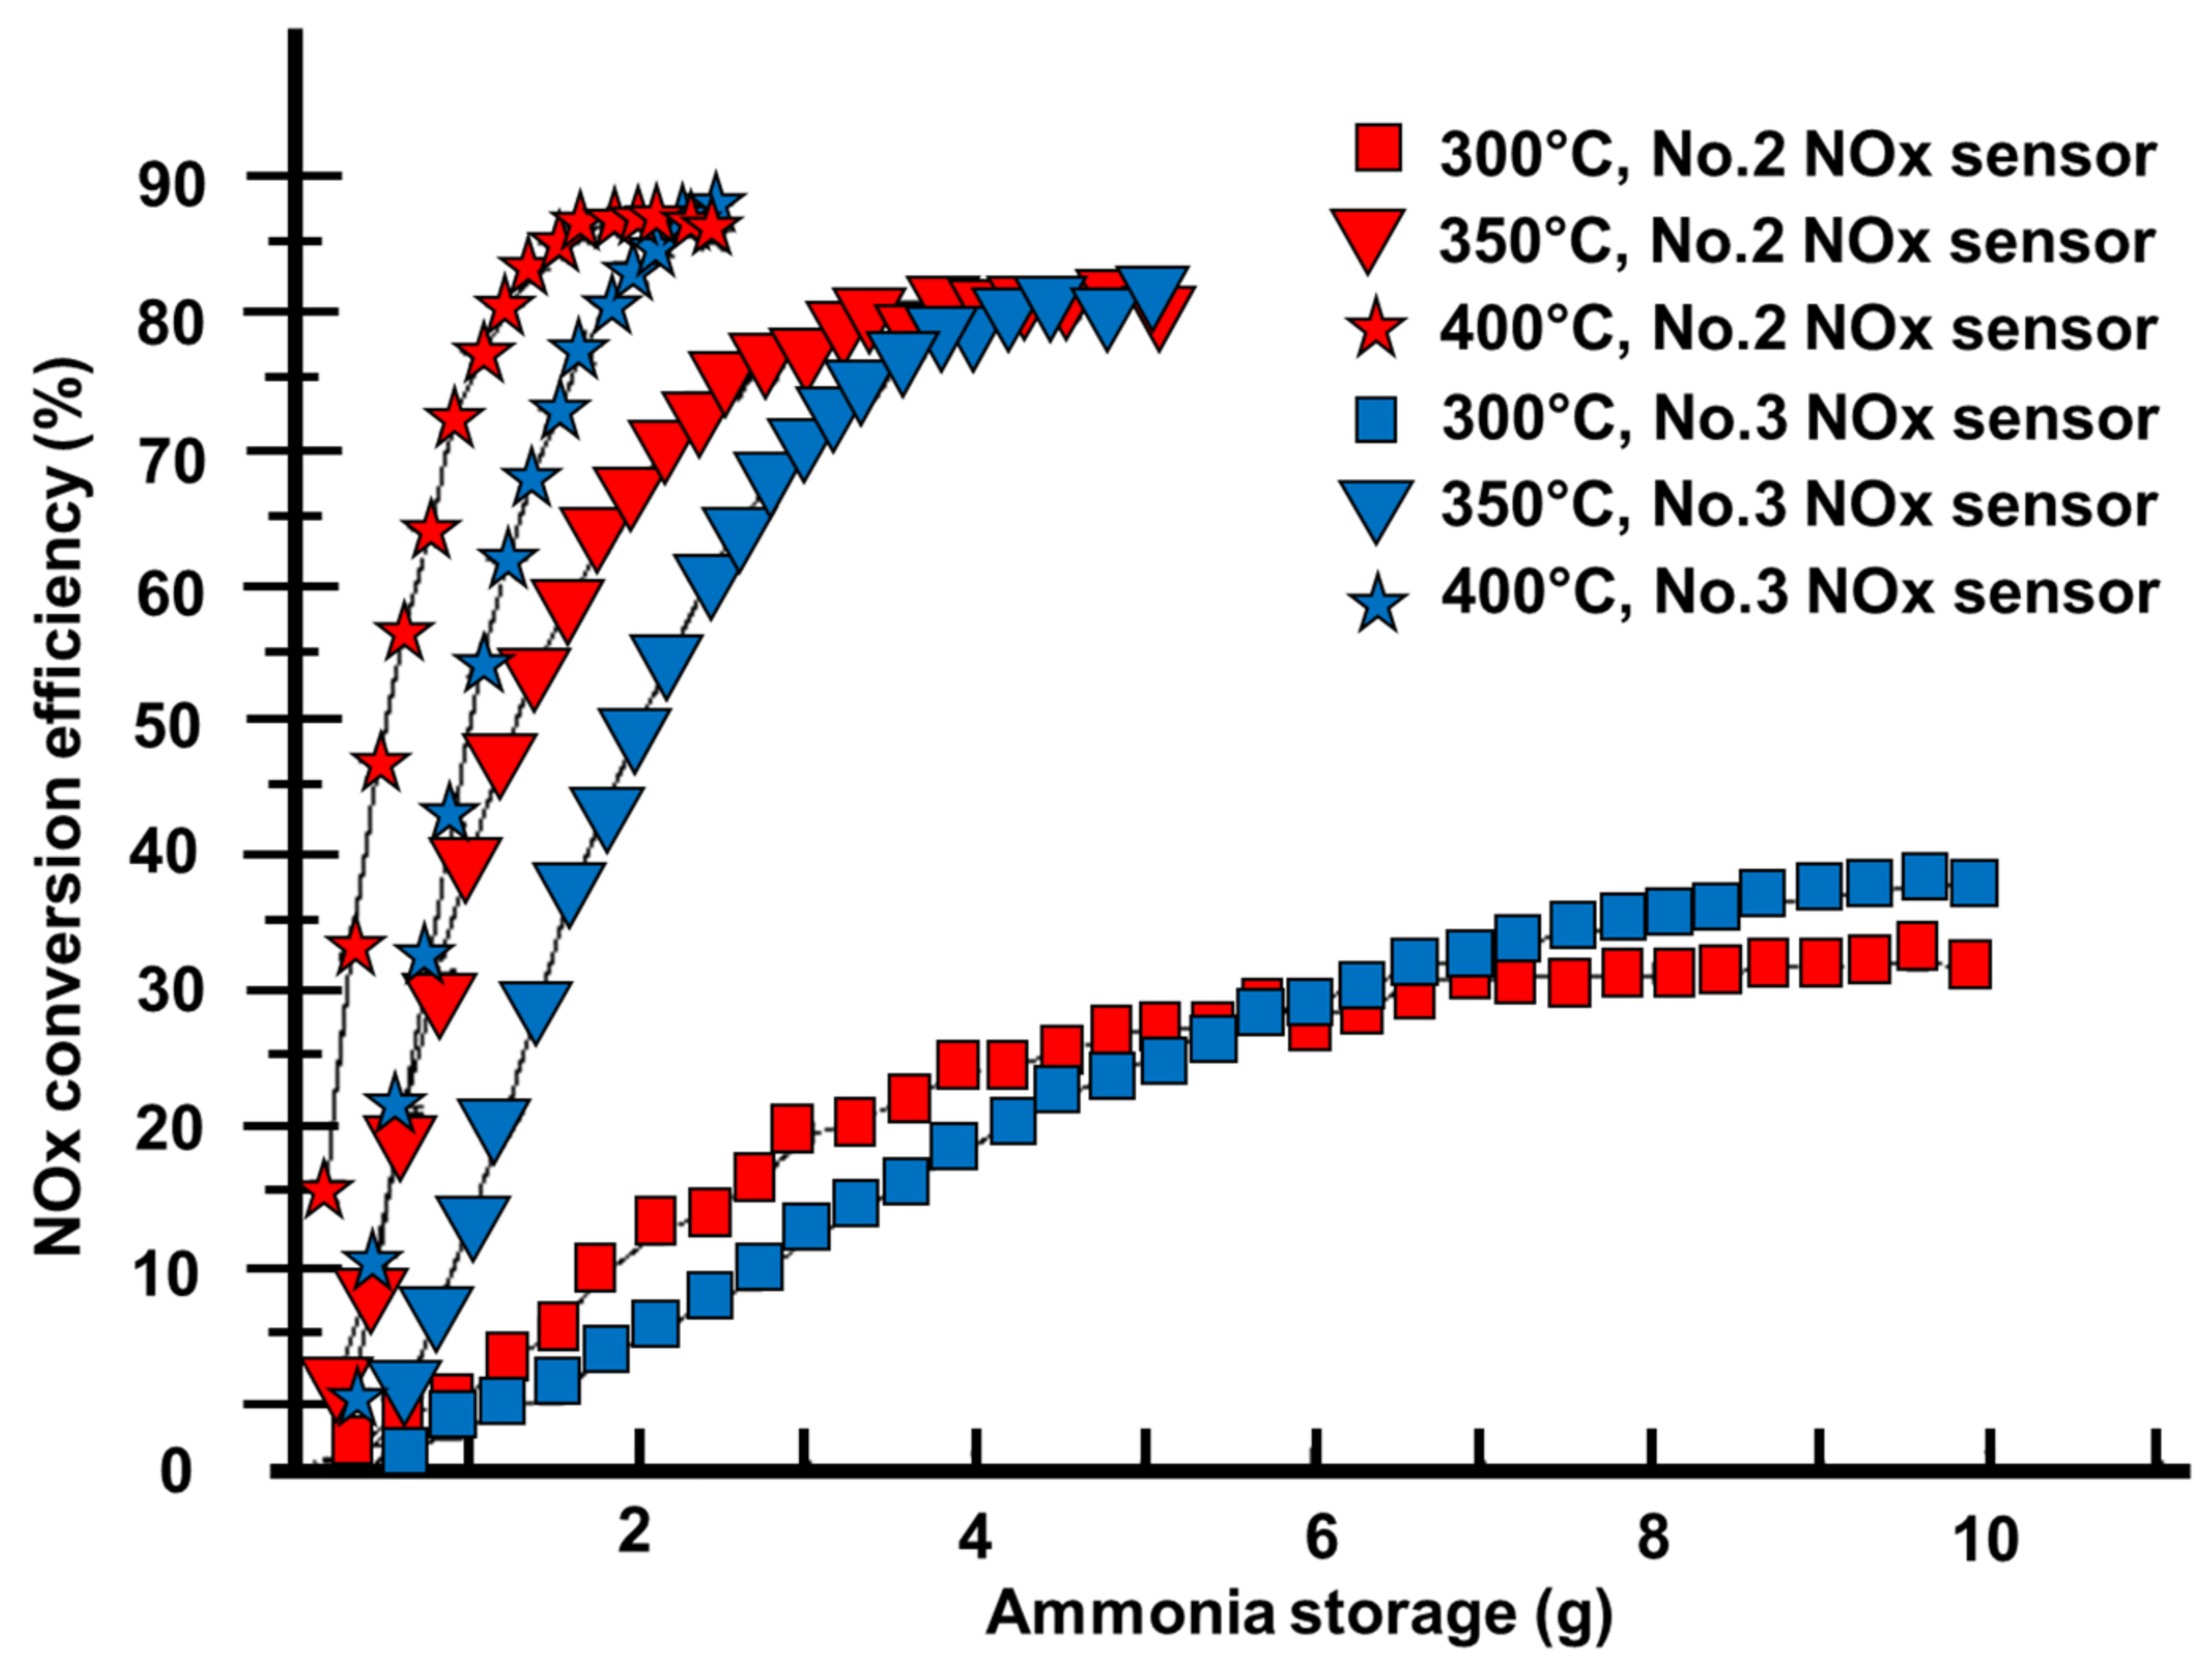
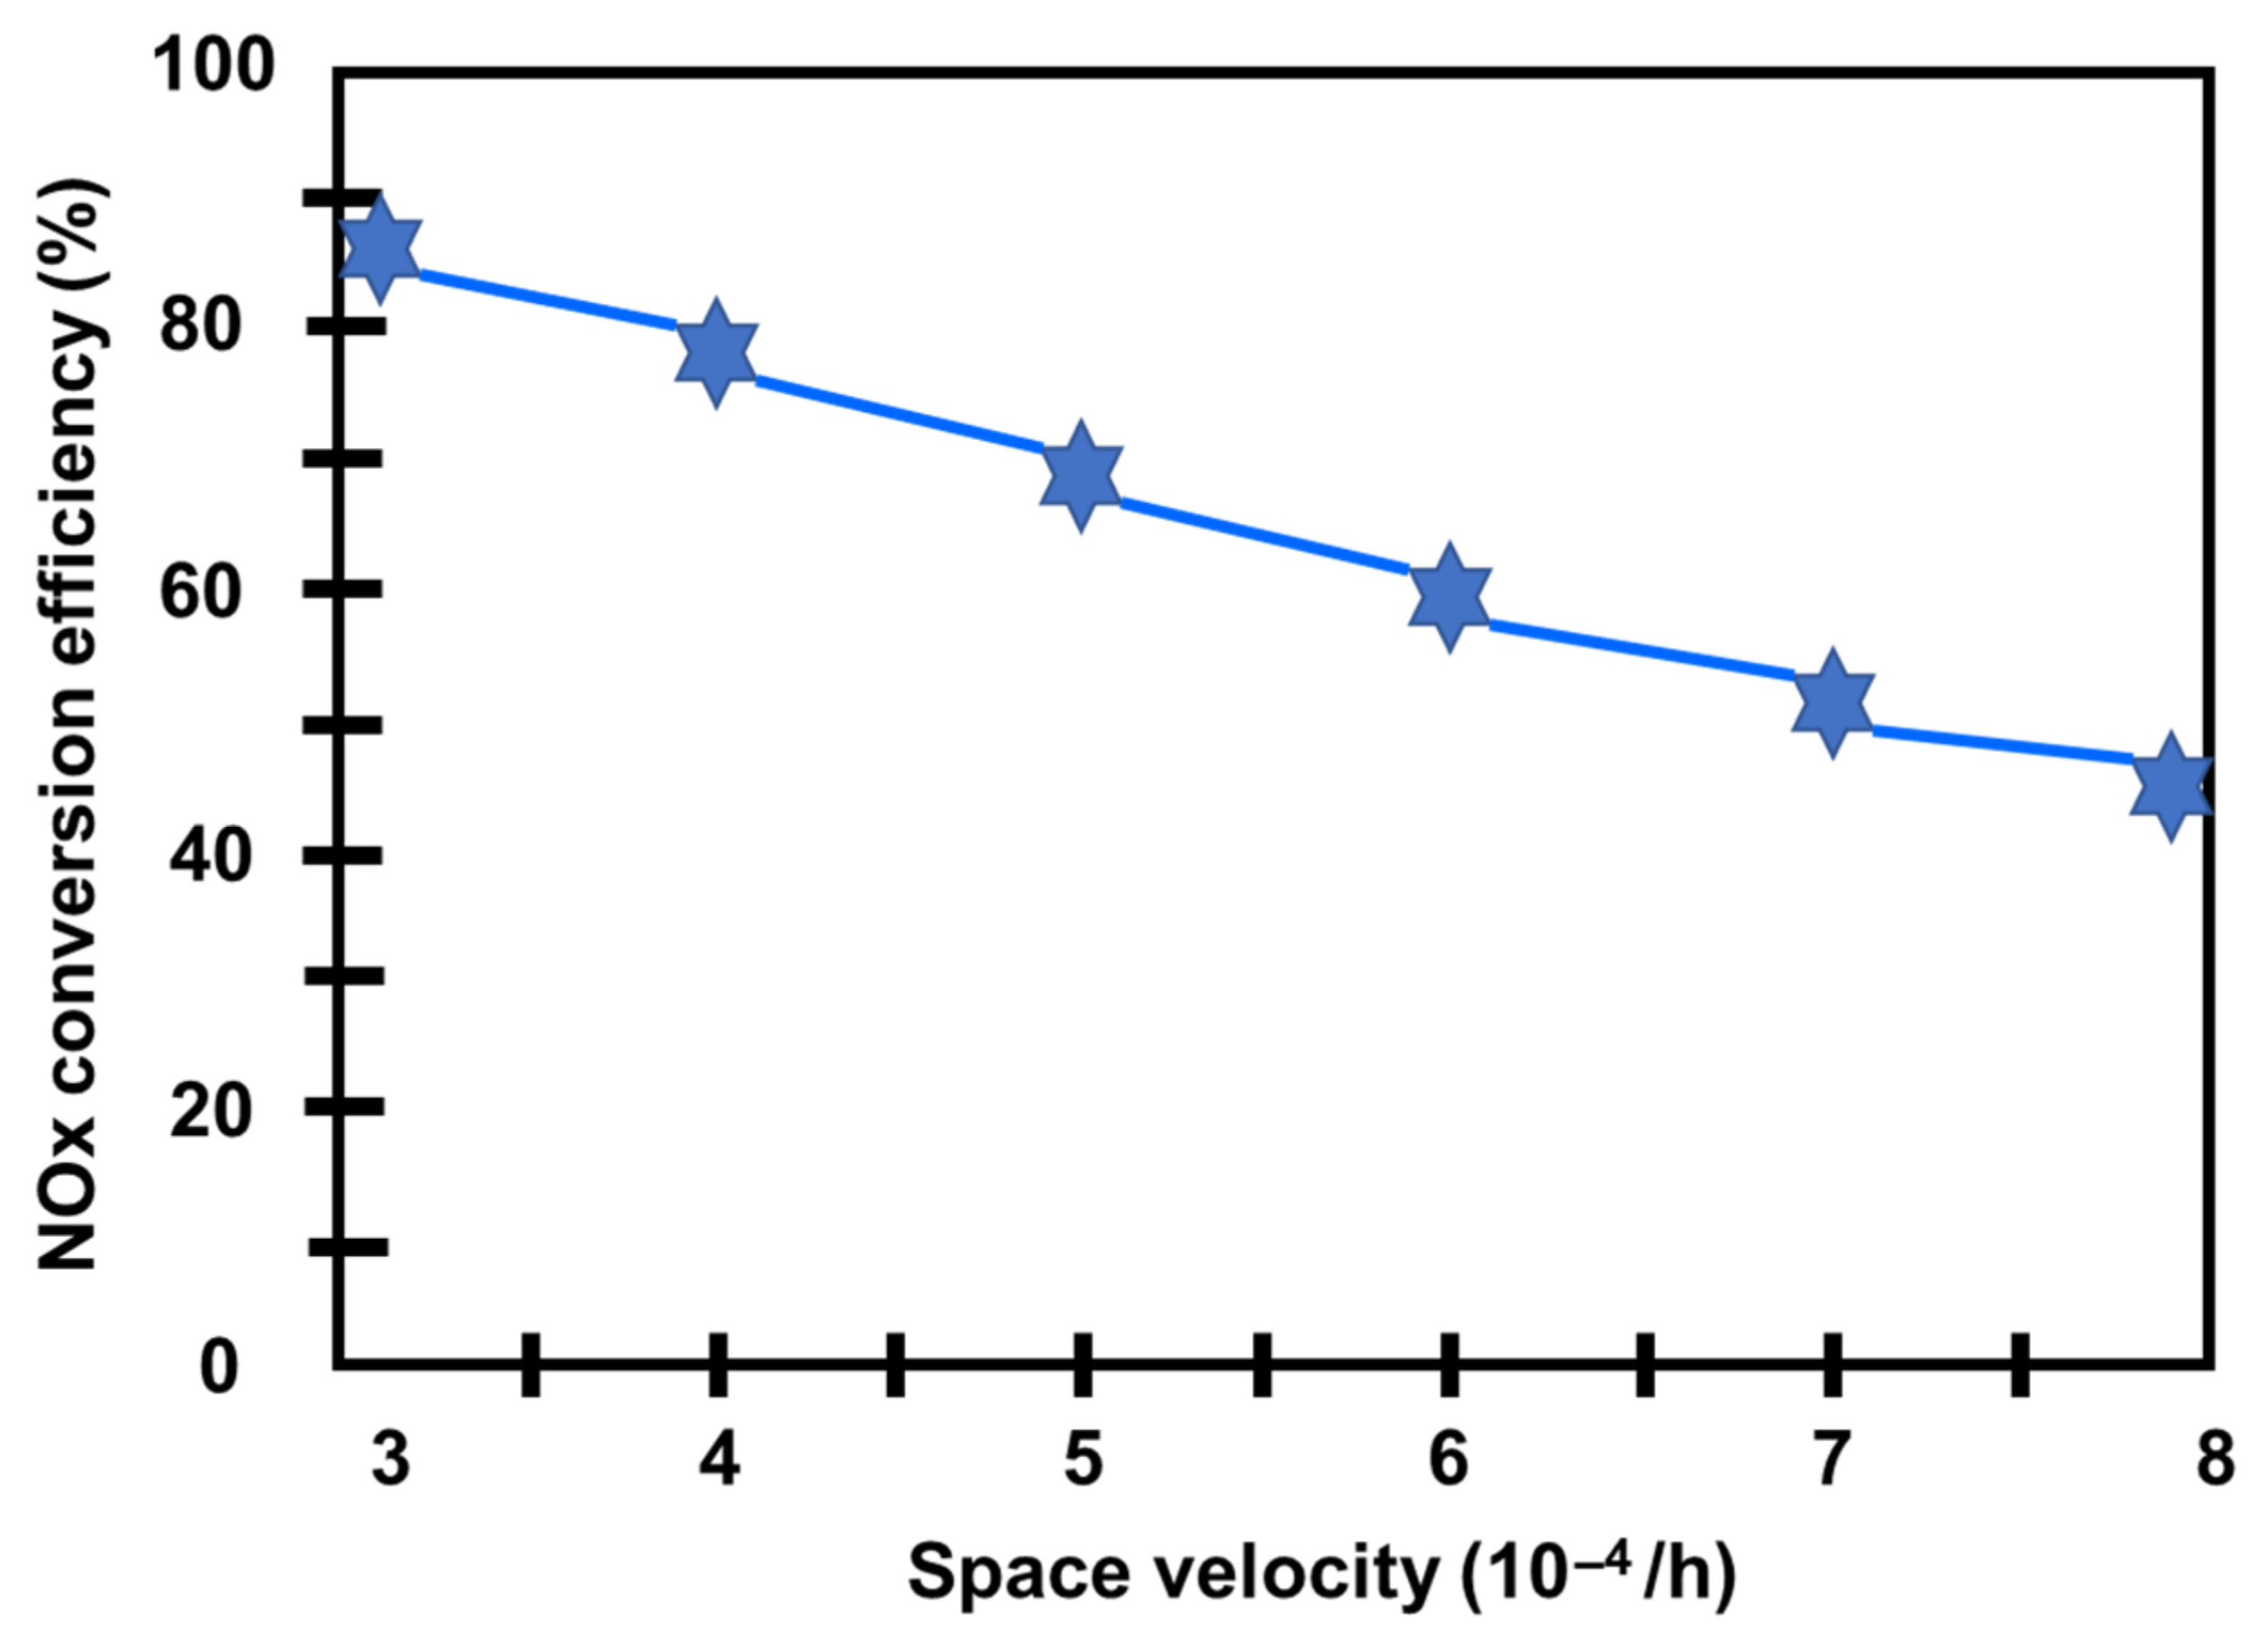
The other investigated light-duty diesel engine was an 1800 cc engine tested at a constant speed of 3000 rpm. The catalyst temperature, space velocity effects on SCR reaction rate, and ammonia slip were all investigated in this study. The NOx conversion efficiency in this study increased when the catalyst temperature and ammonia distribution increased.
c)
Similar phenomena were also demonstrated in the investigation of a 2000 cc light-duty diesel engine tested at a constant speed at 1500 rpm. Low exhaust gas temperatures of 200 and 300 °C were recorded in this investigation, representative of passenger car diesel exhausts. The temperature influenced the ammonia desorption process in this investigation. At low temperatures, the ammonia desorption rate was low.
d)
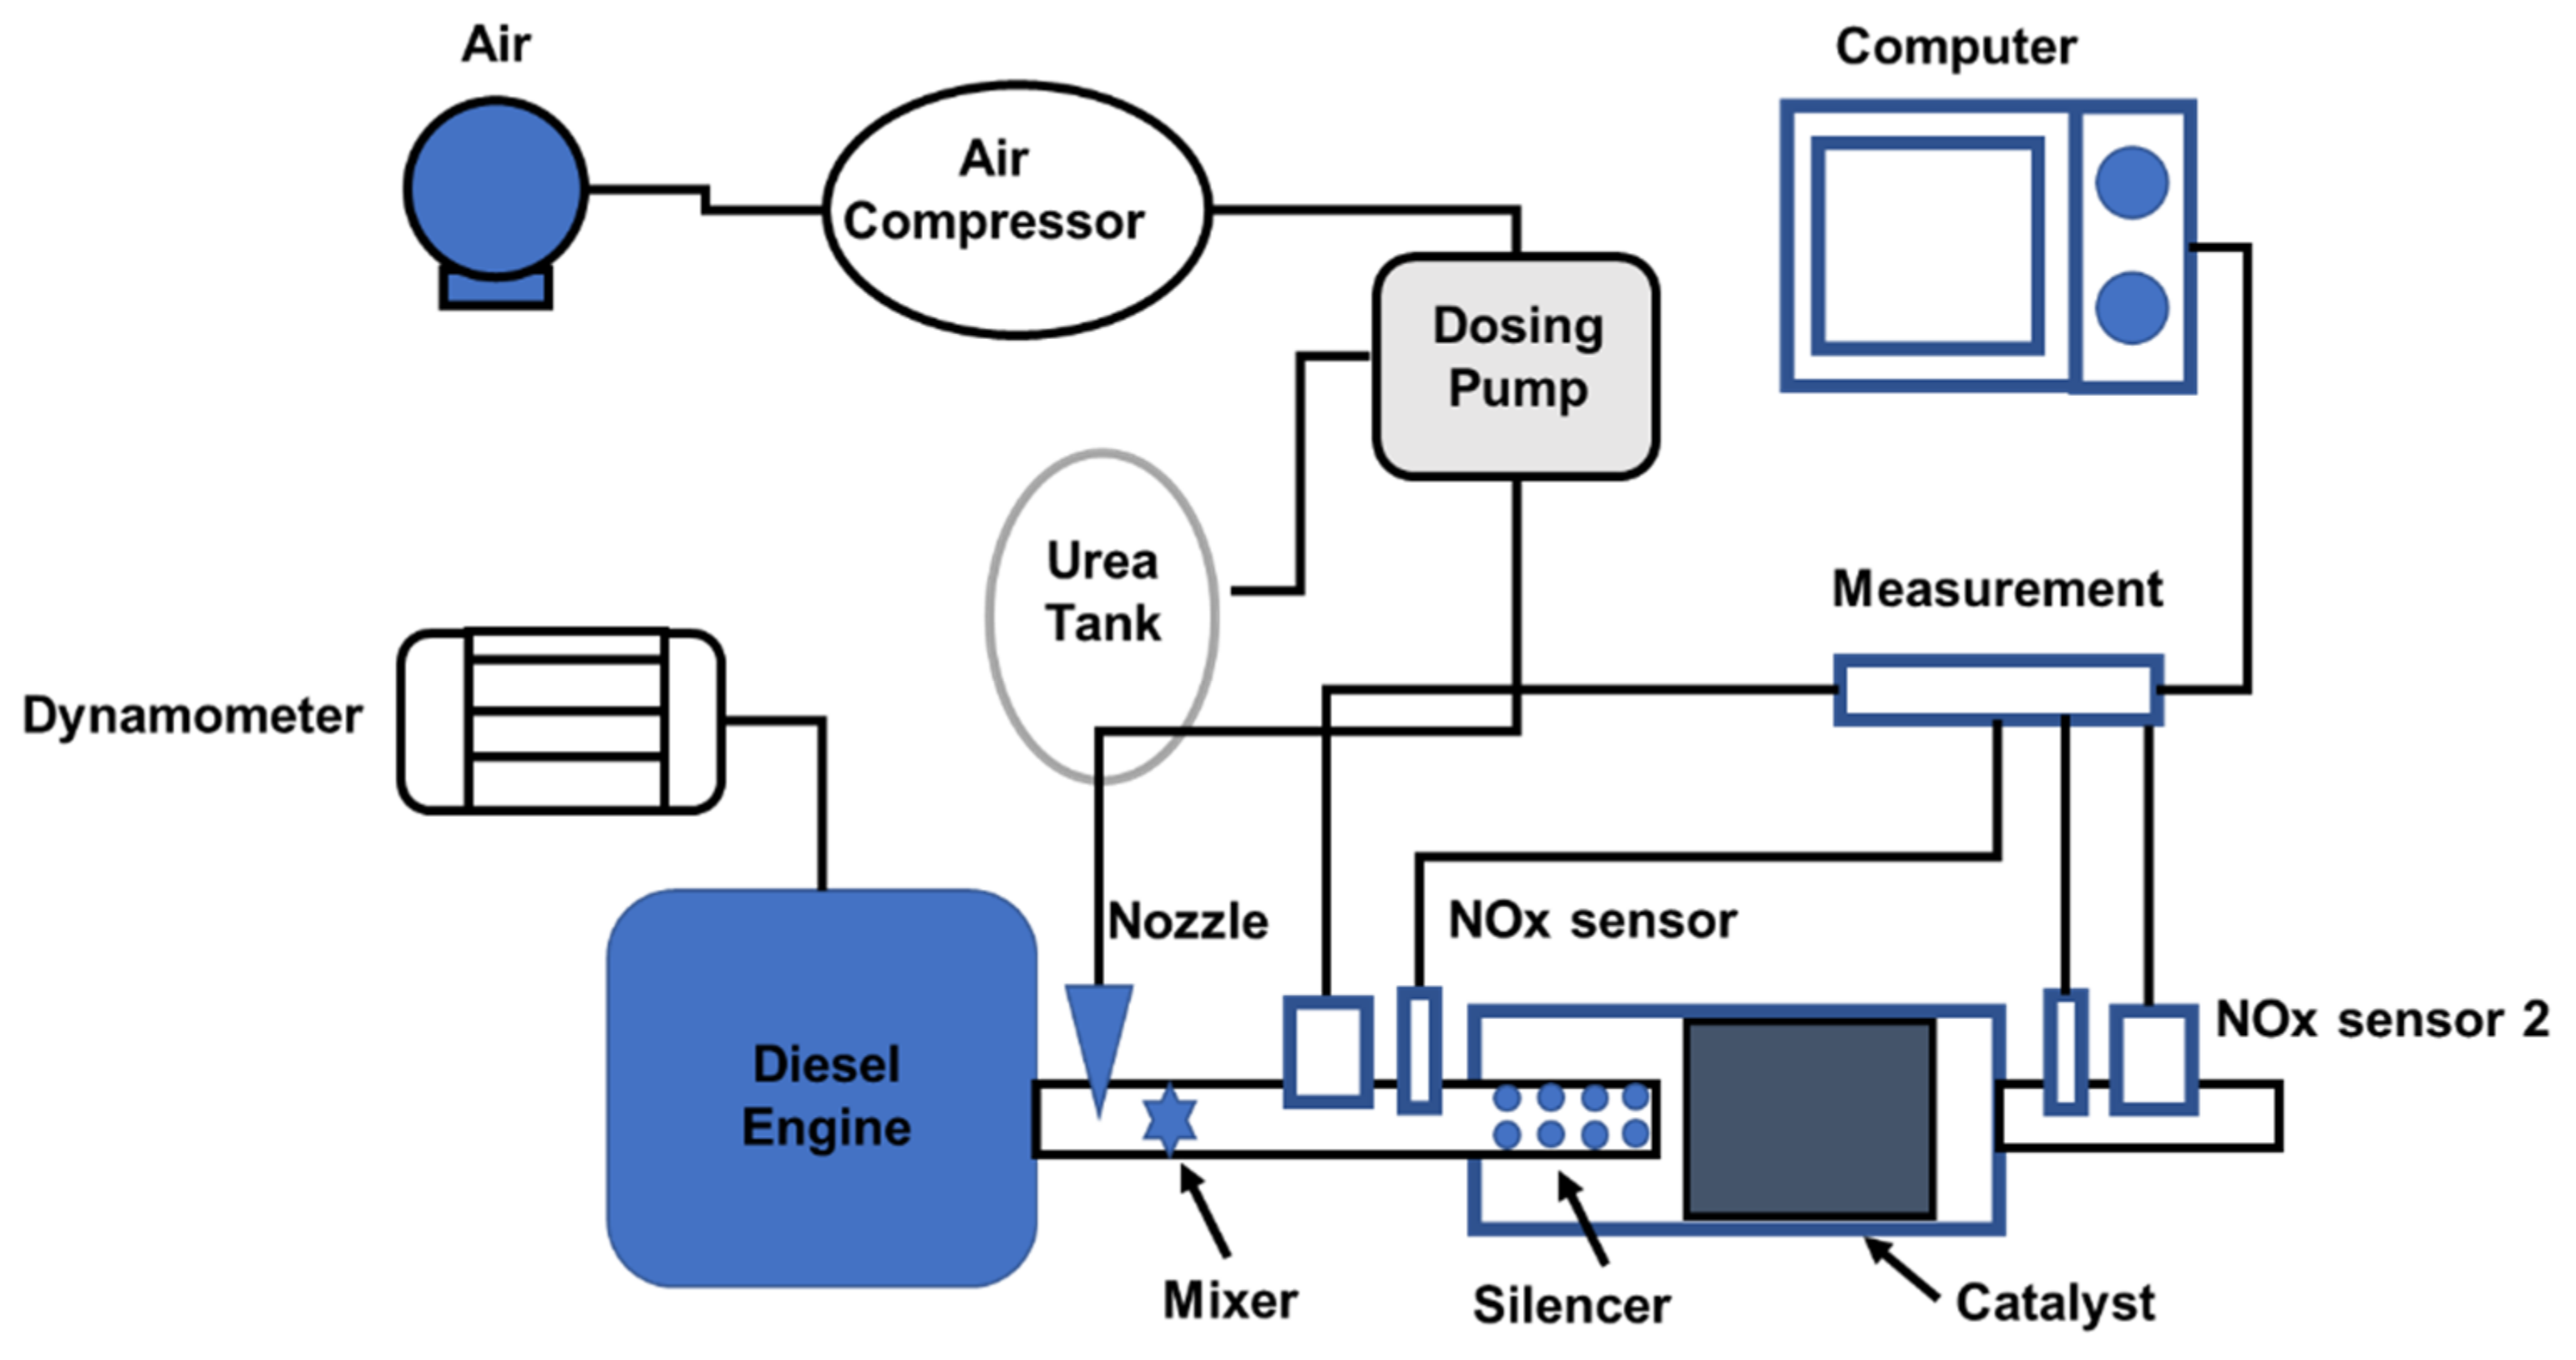
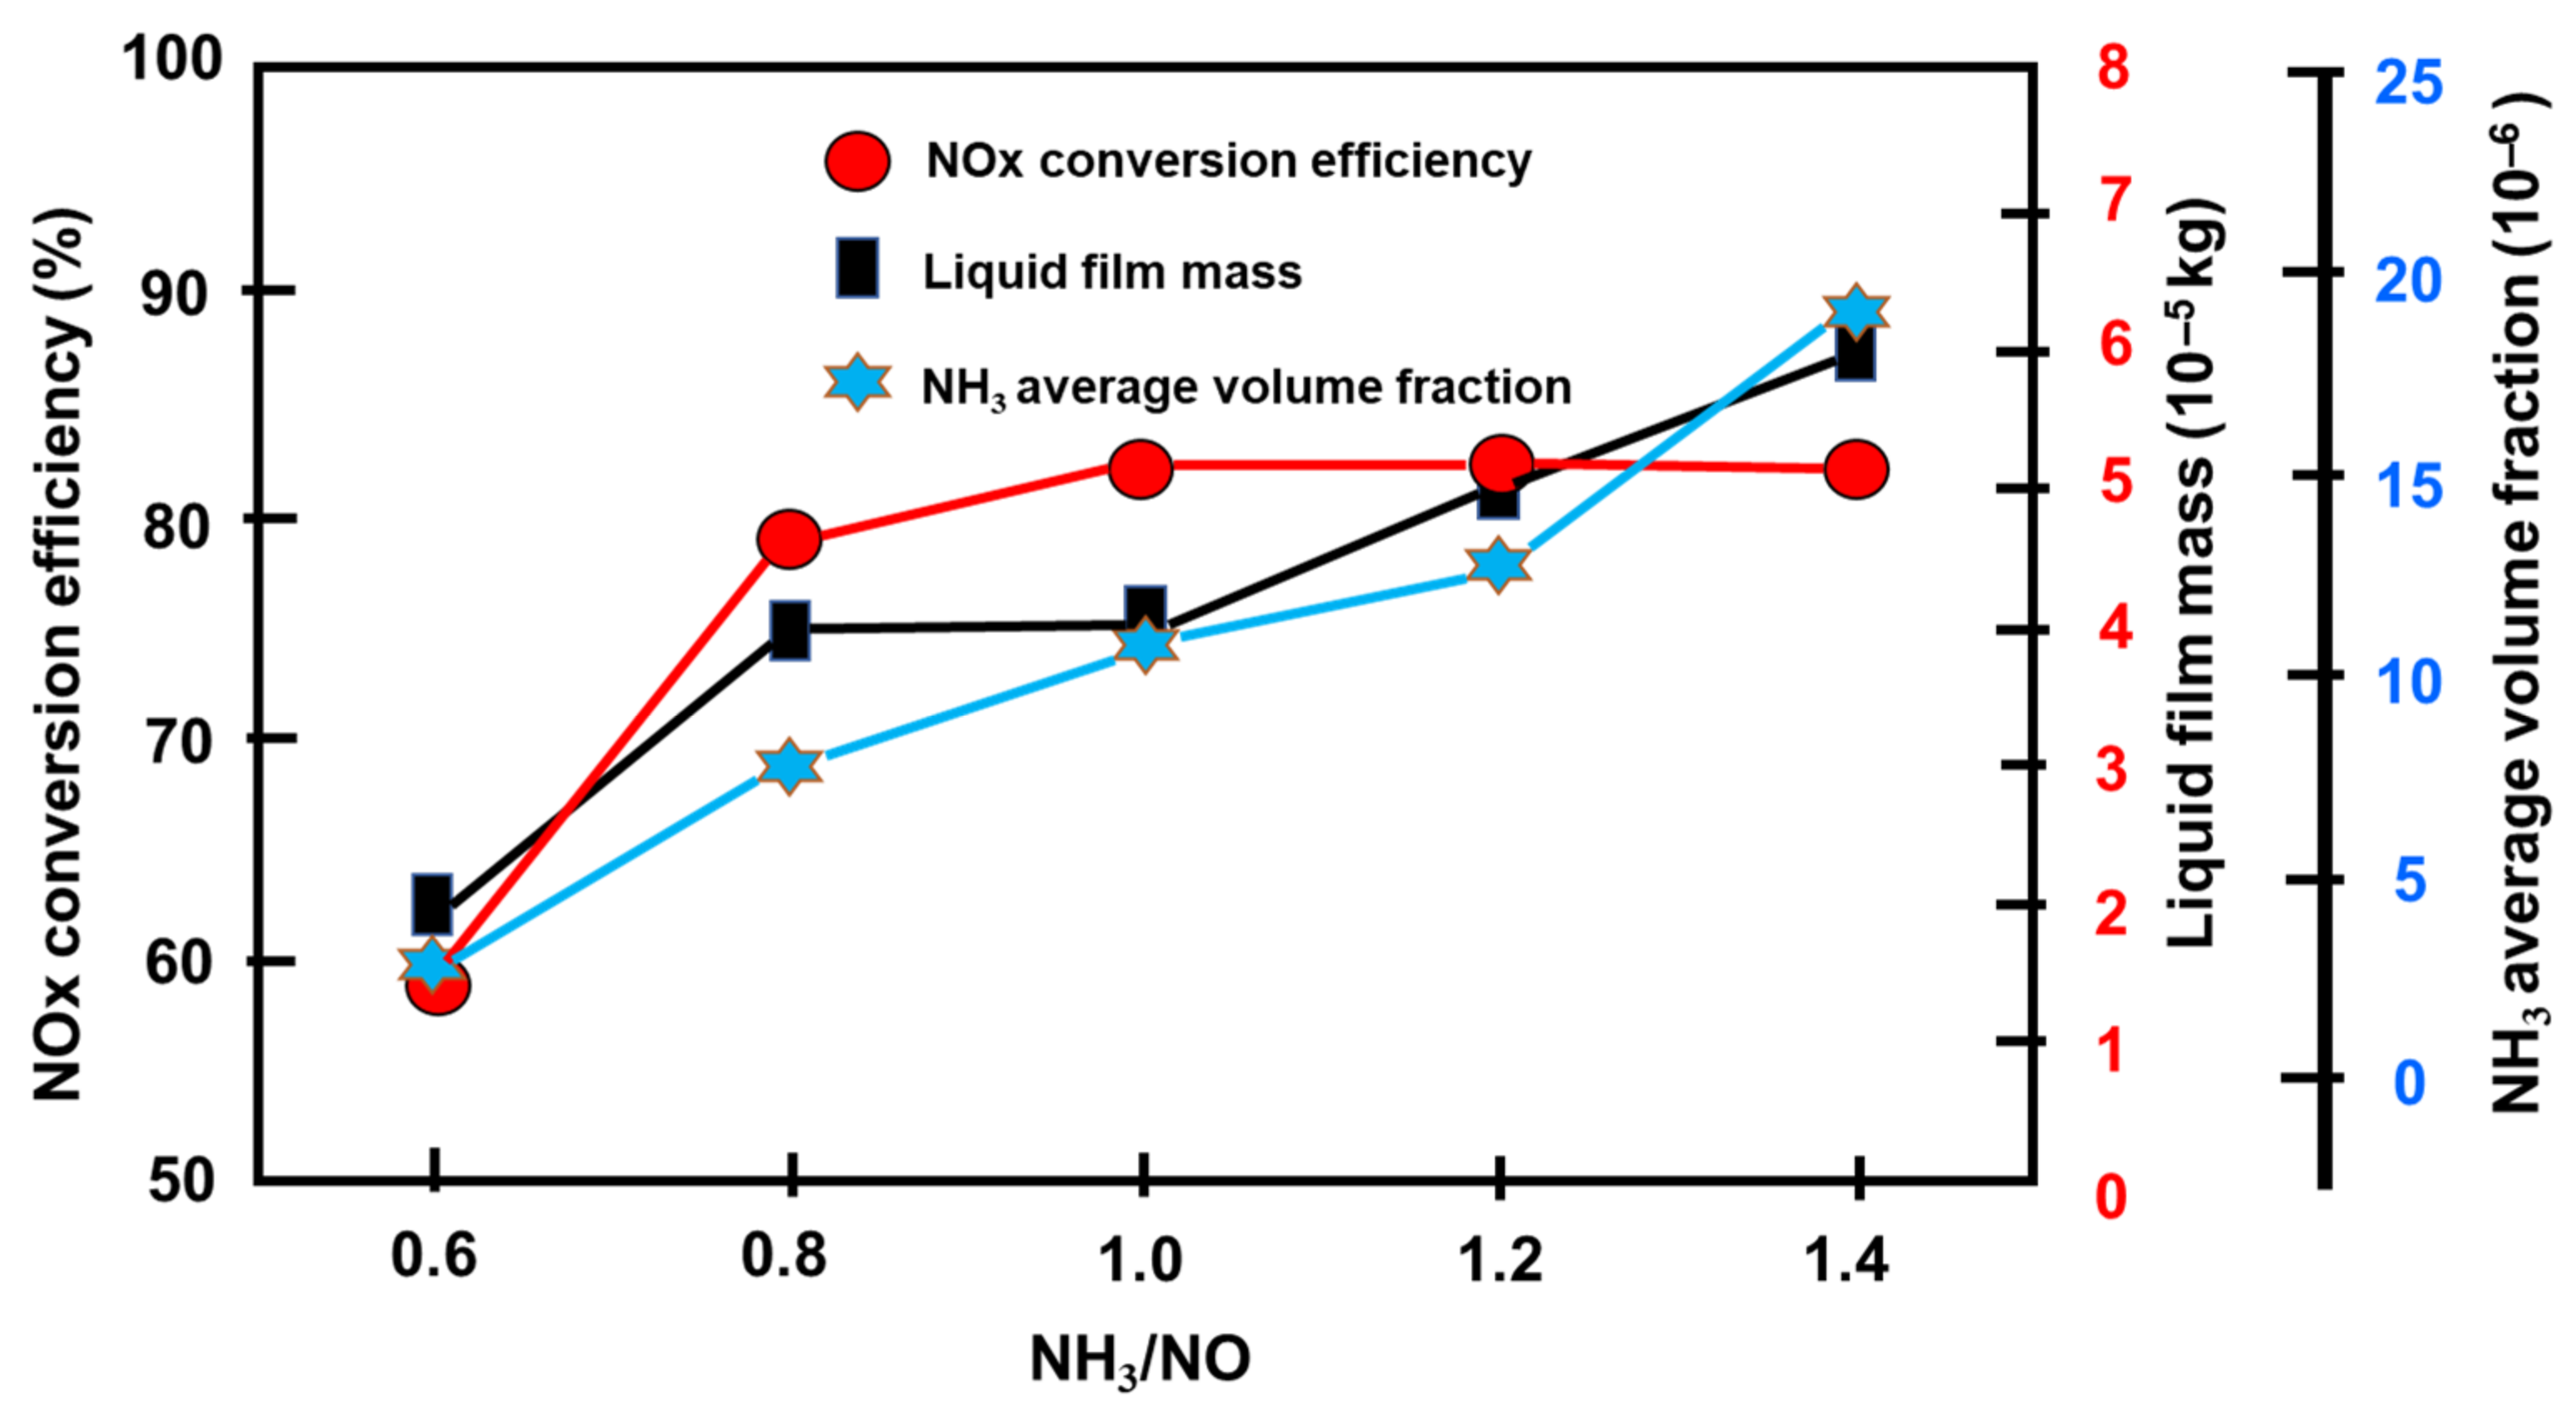
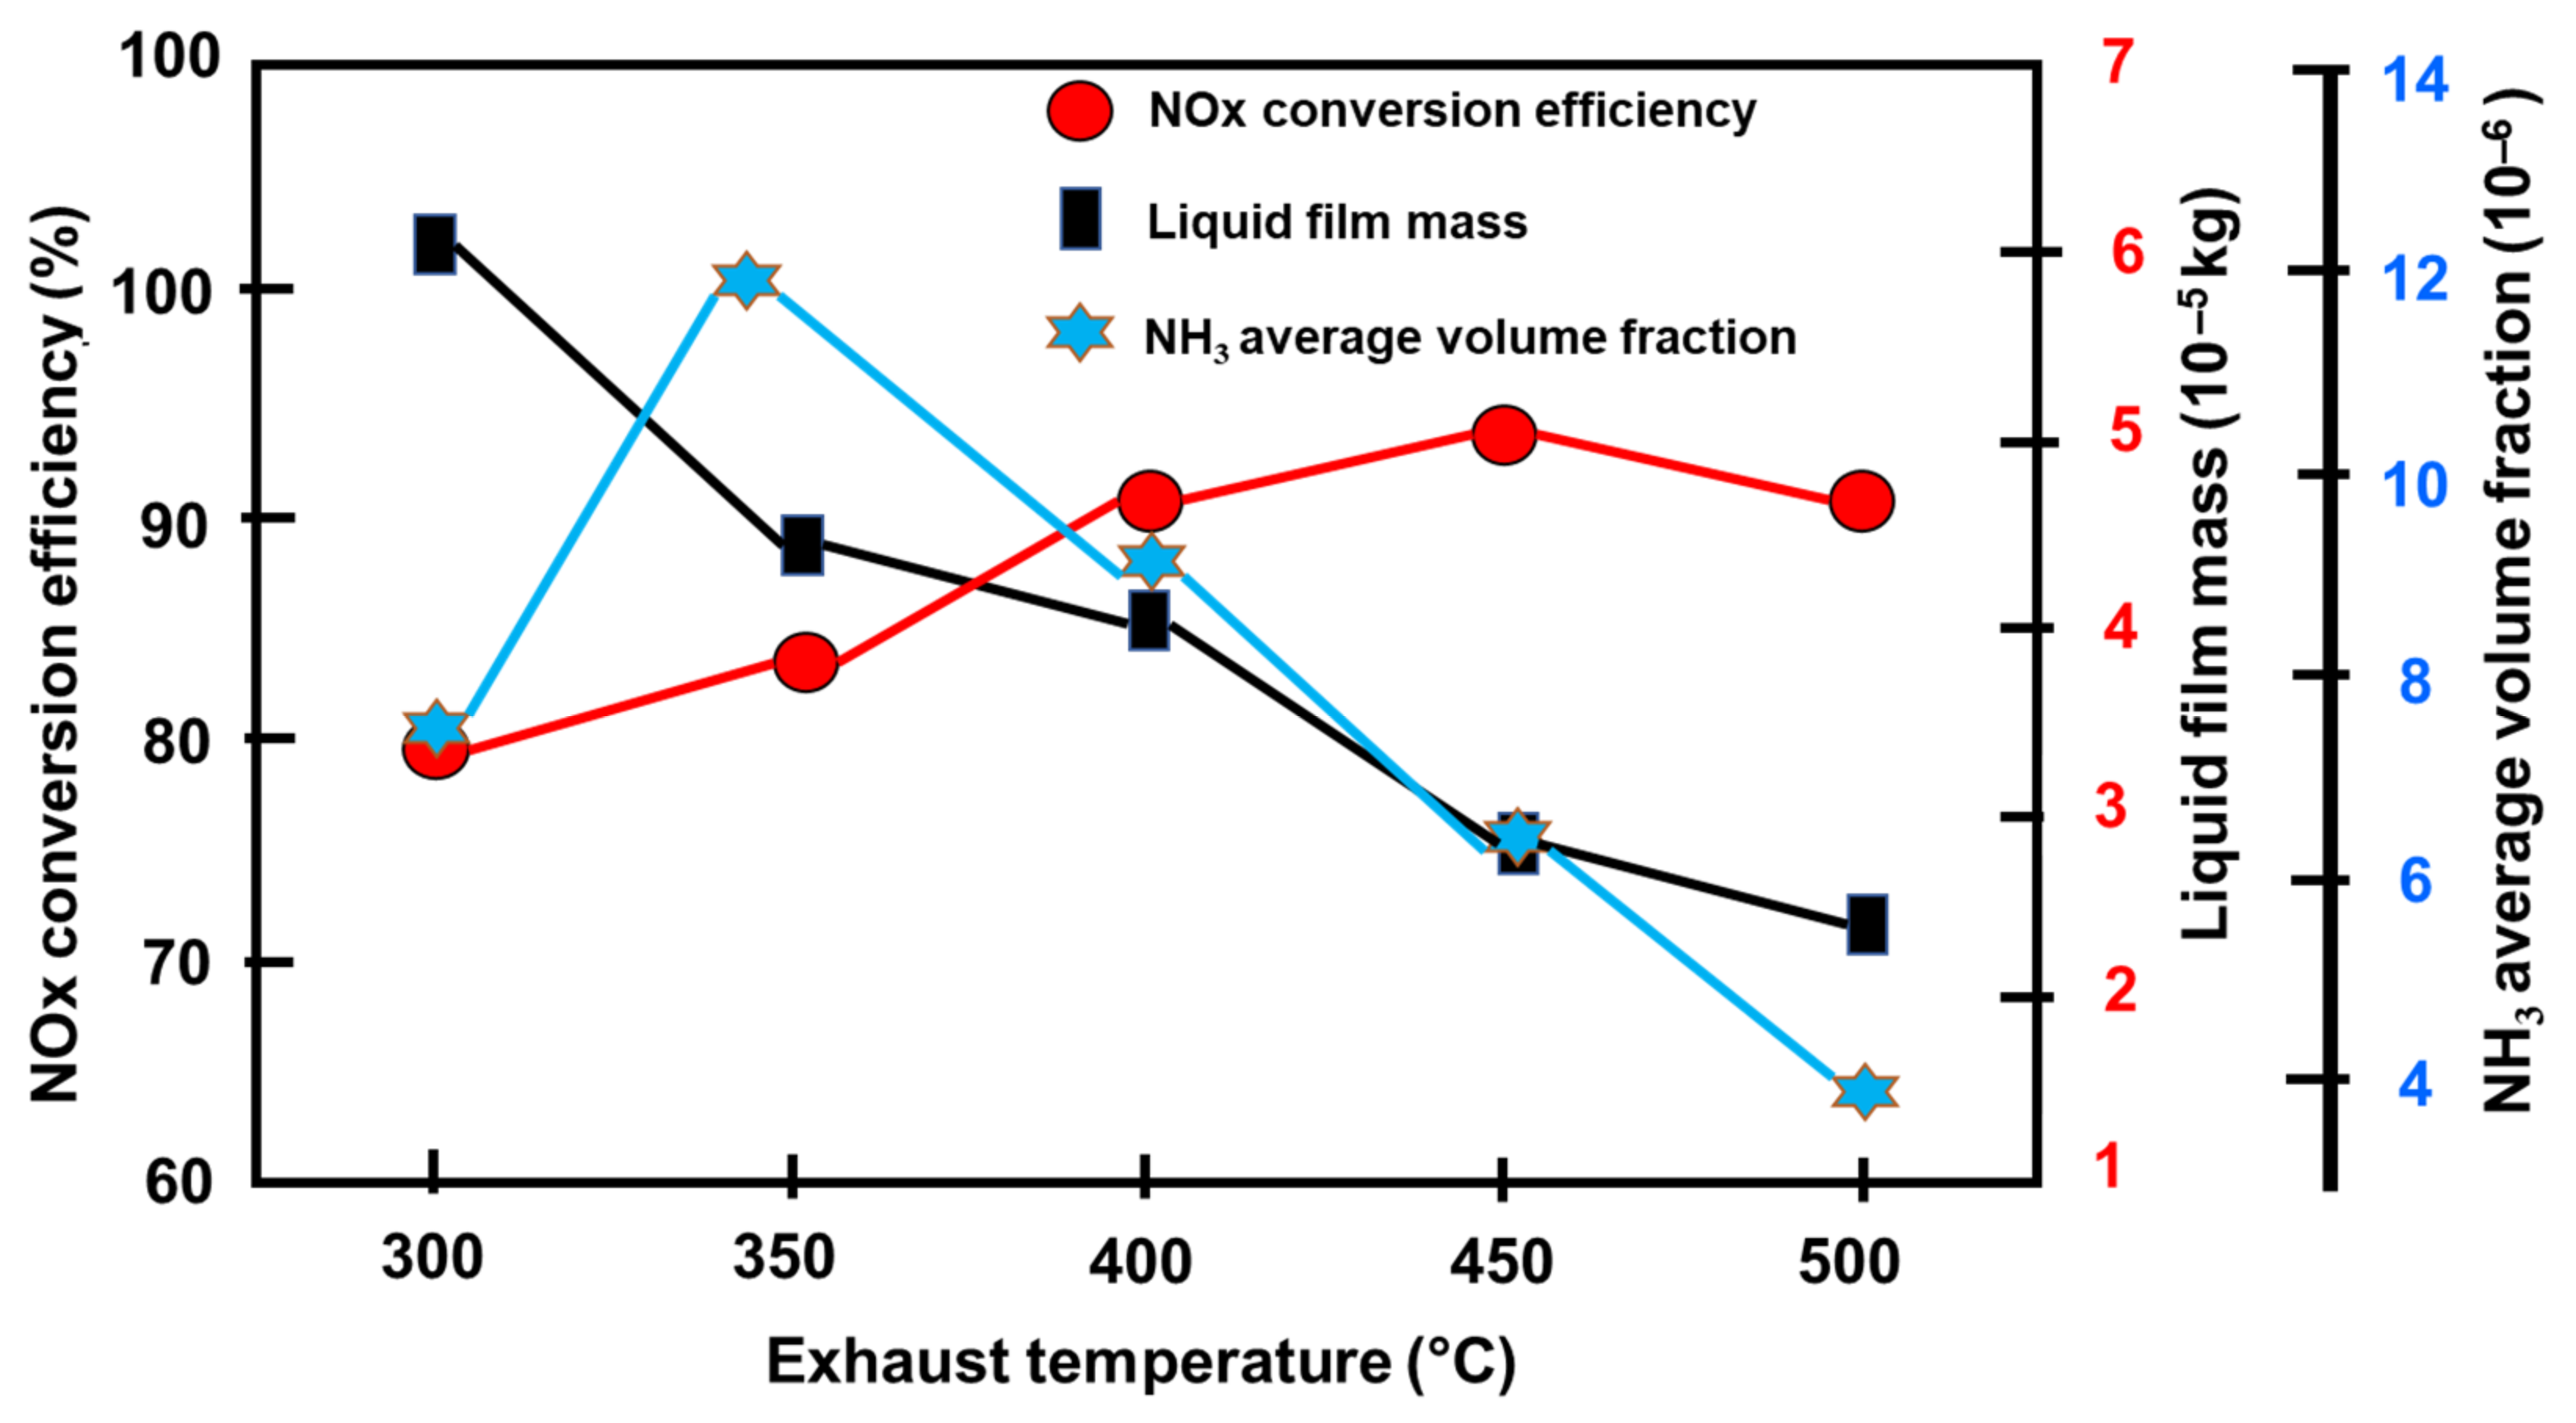
The optimal value for NH3/NO in the tested 3900 cc light-duty diesel engine was found to be around 1.0. Based on this study, increasing the amount of UWS would increase the risk of crystallization and ammonia slip in the SCR system. The results of this study showed that higher exhaust temperatures enhance crystallization resistance, while greater flow rates decrease the period of interaction between the NOx reduction agent and the catalyst, affecting the levels of NH3.
e)
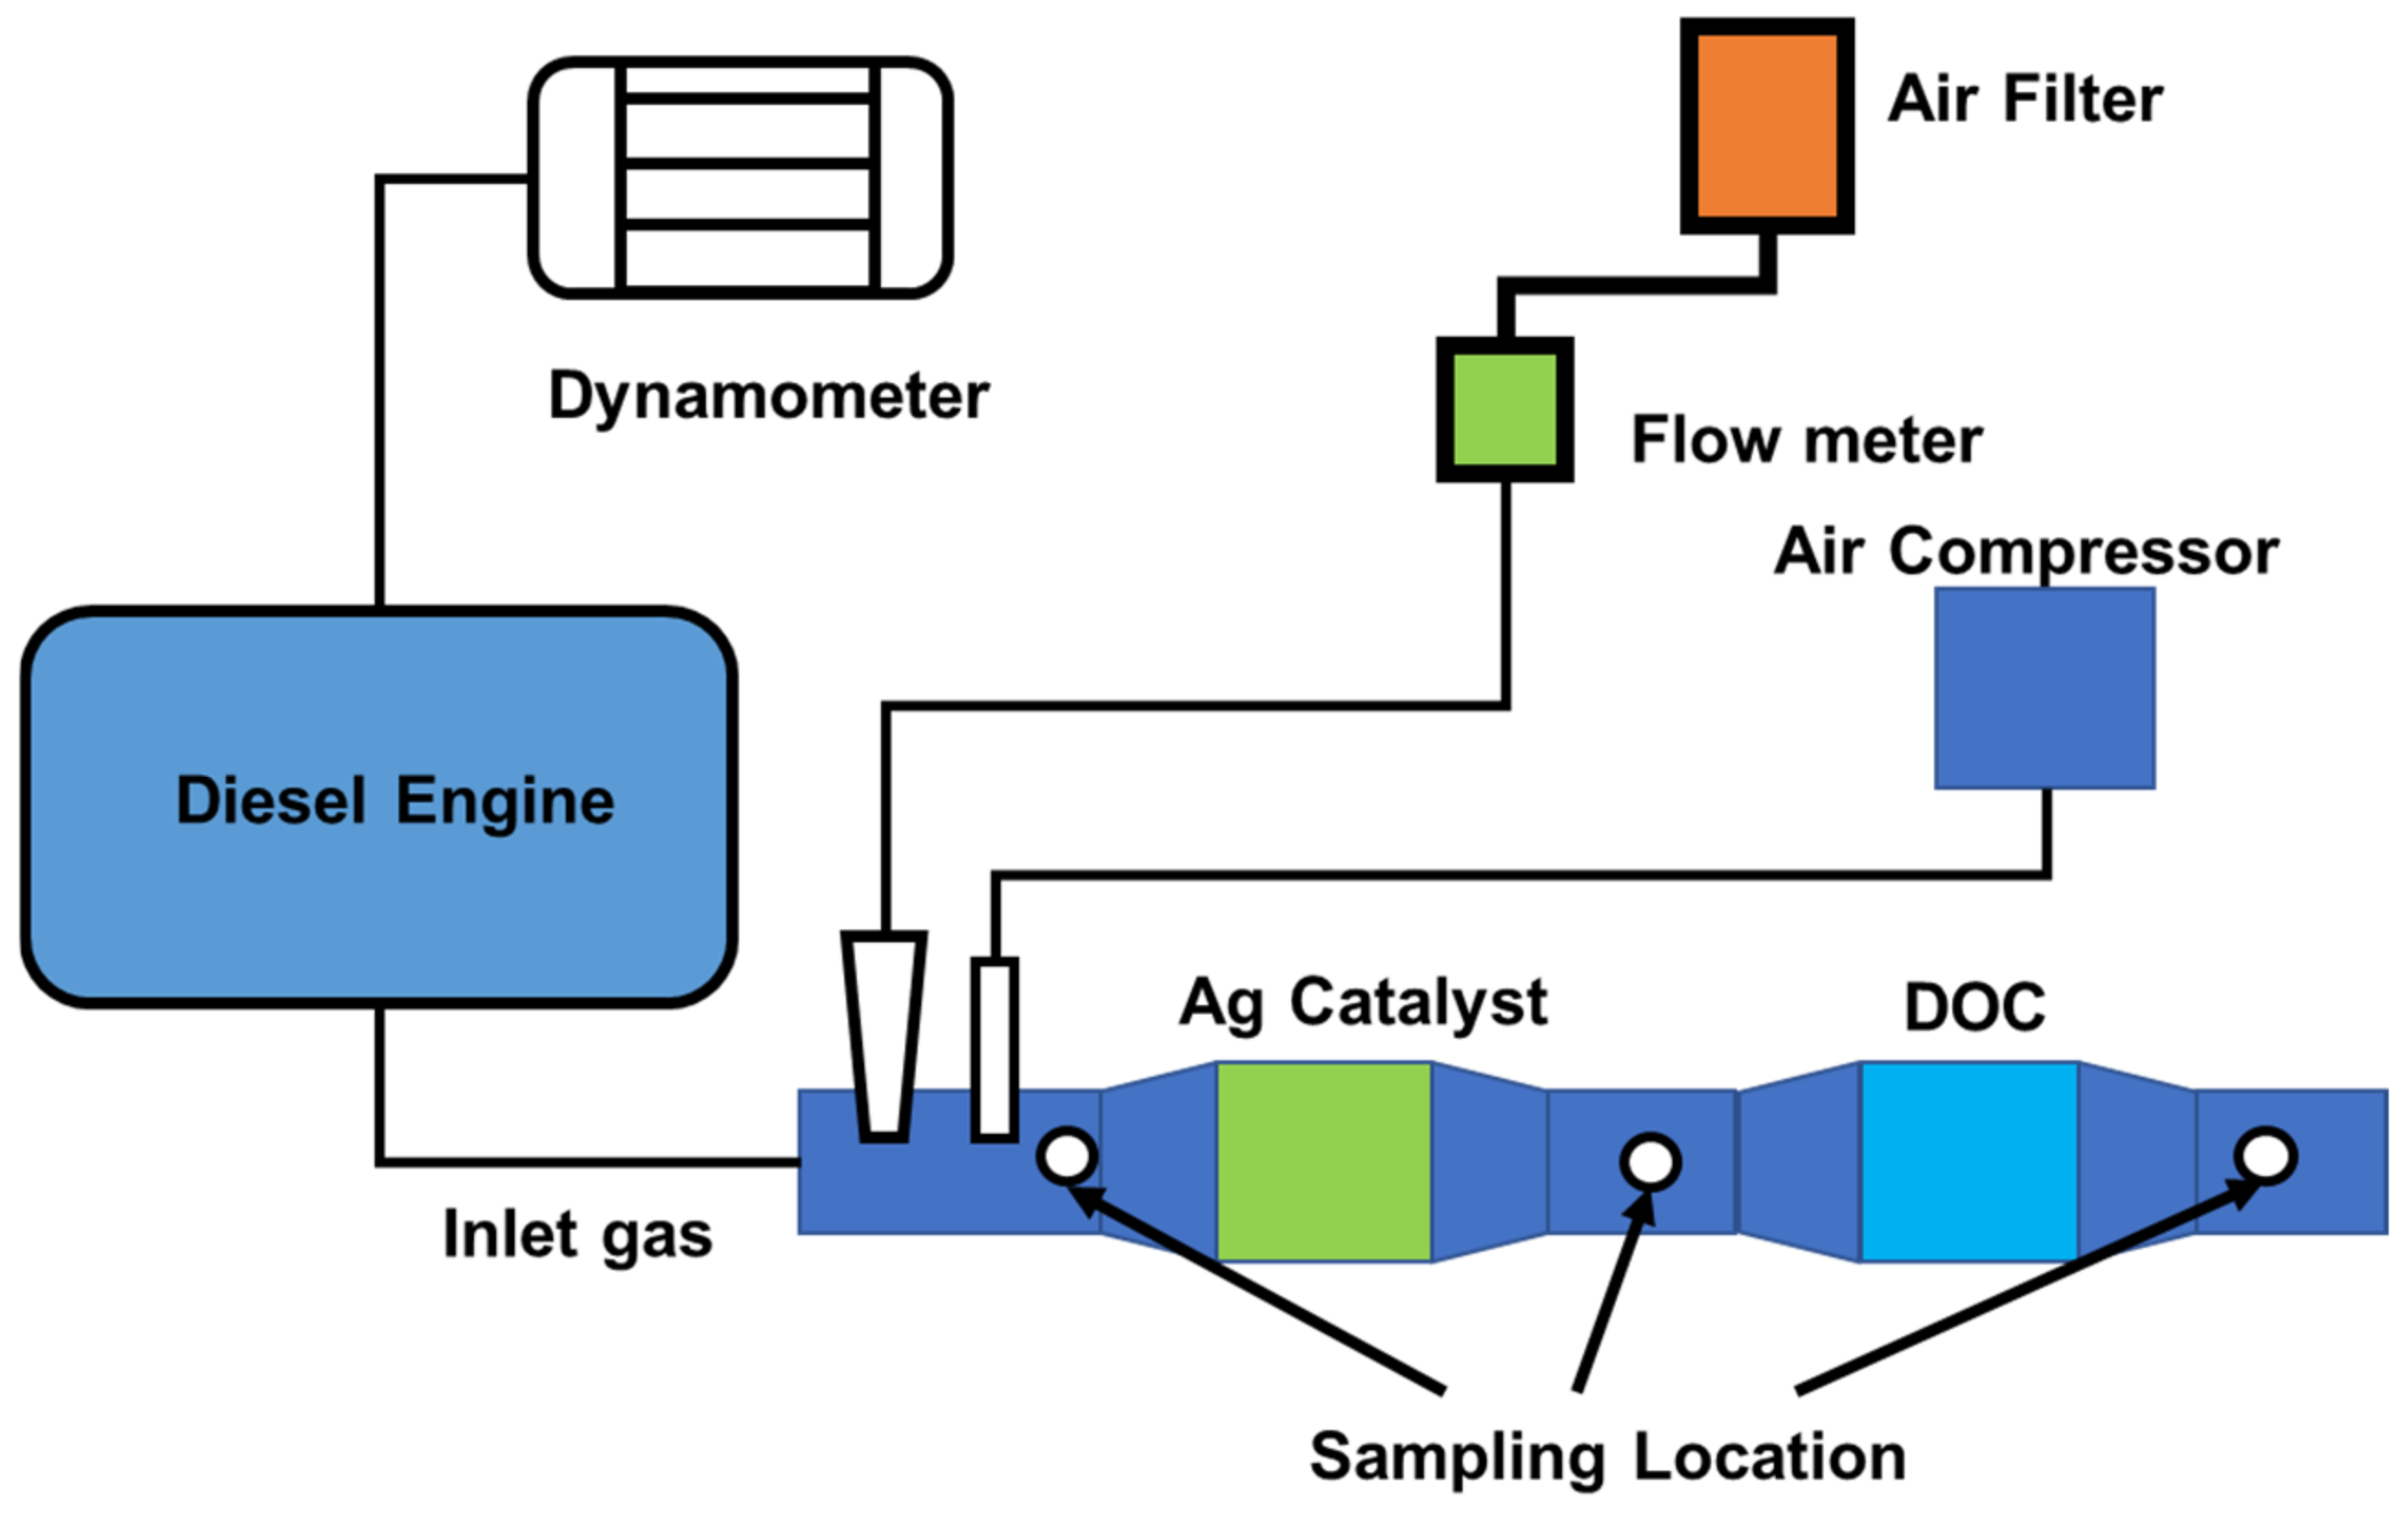
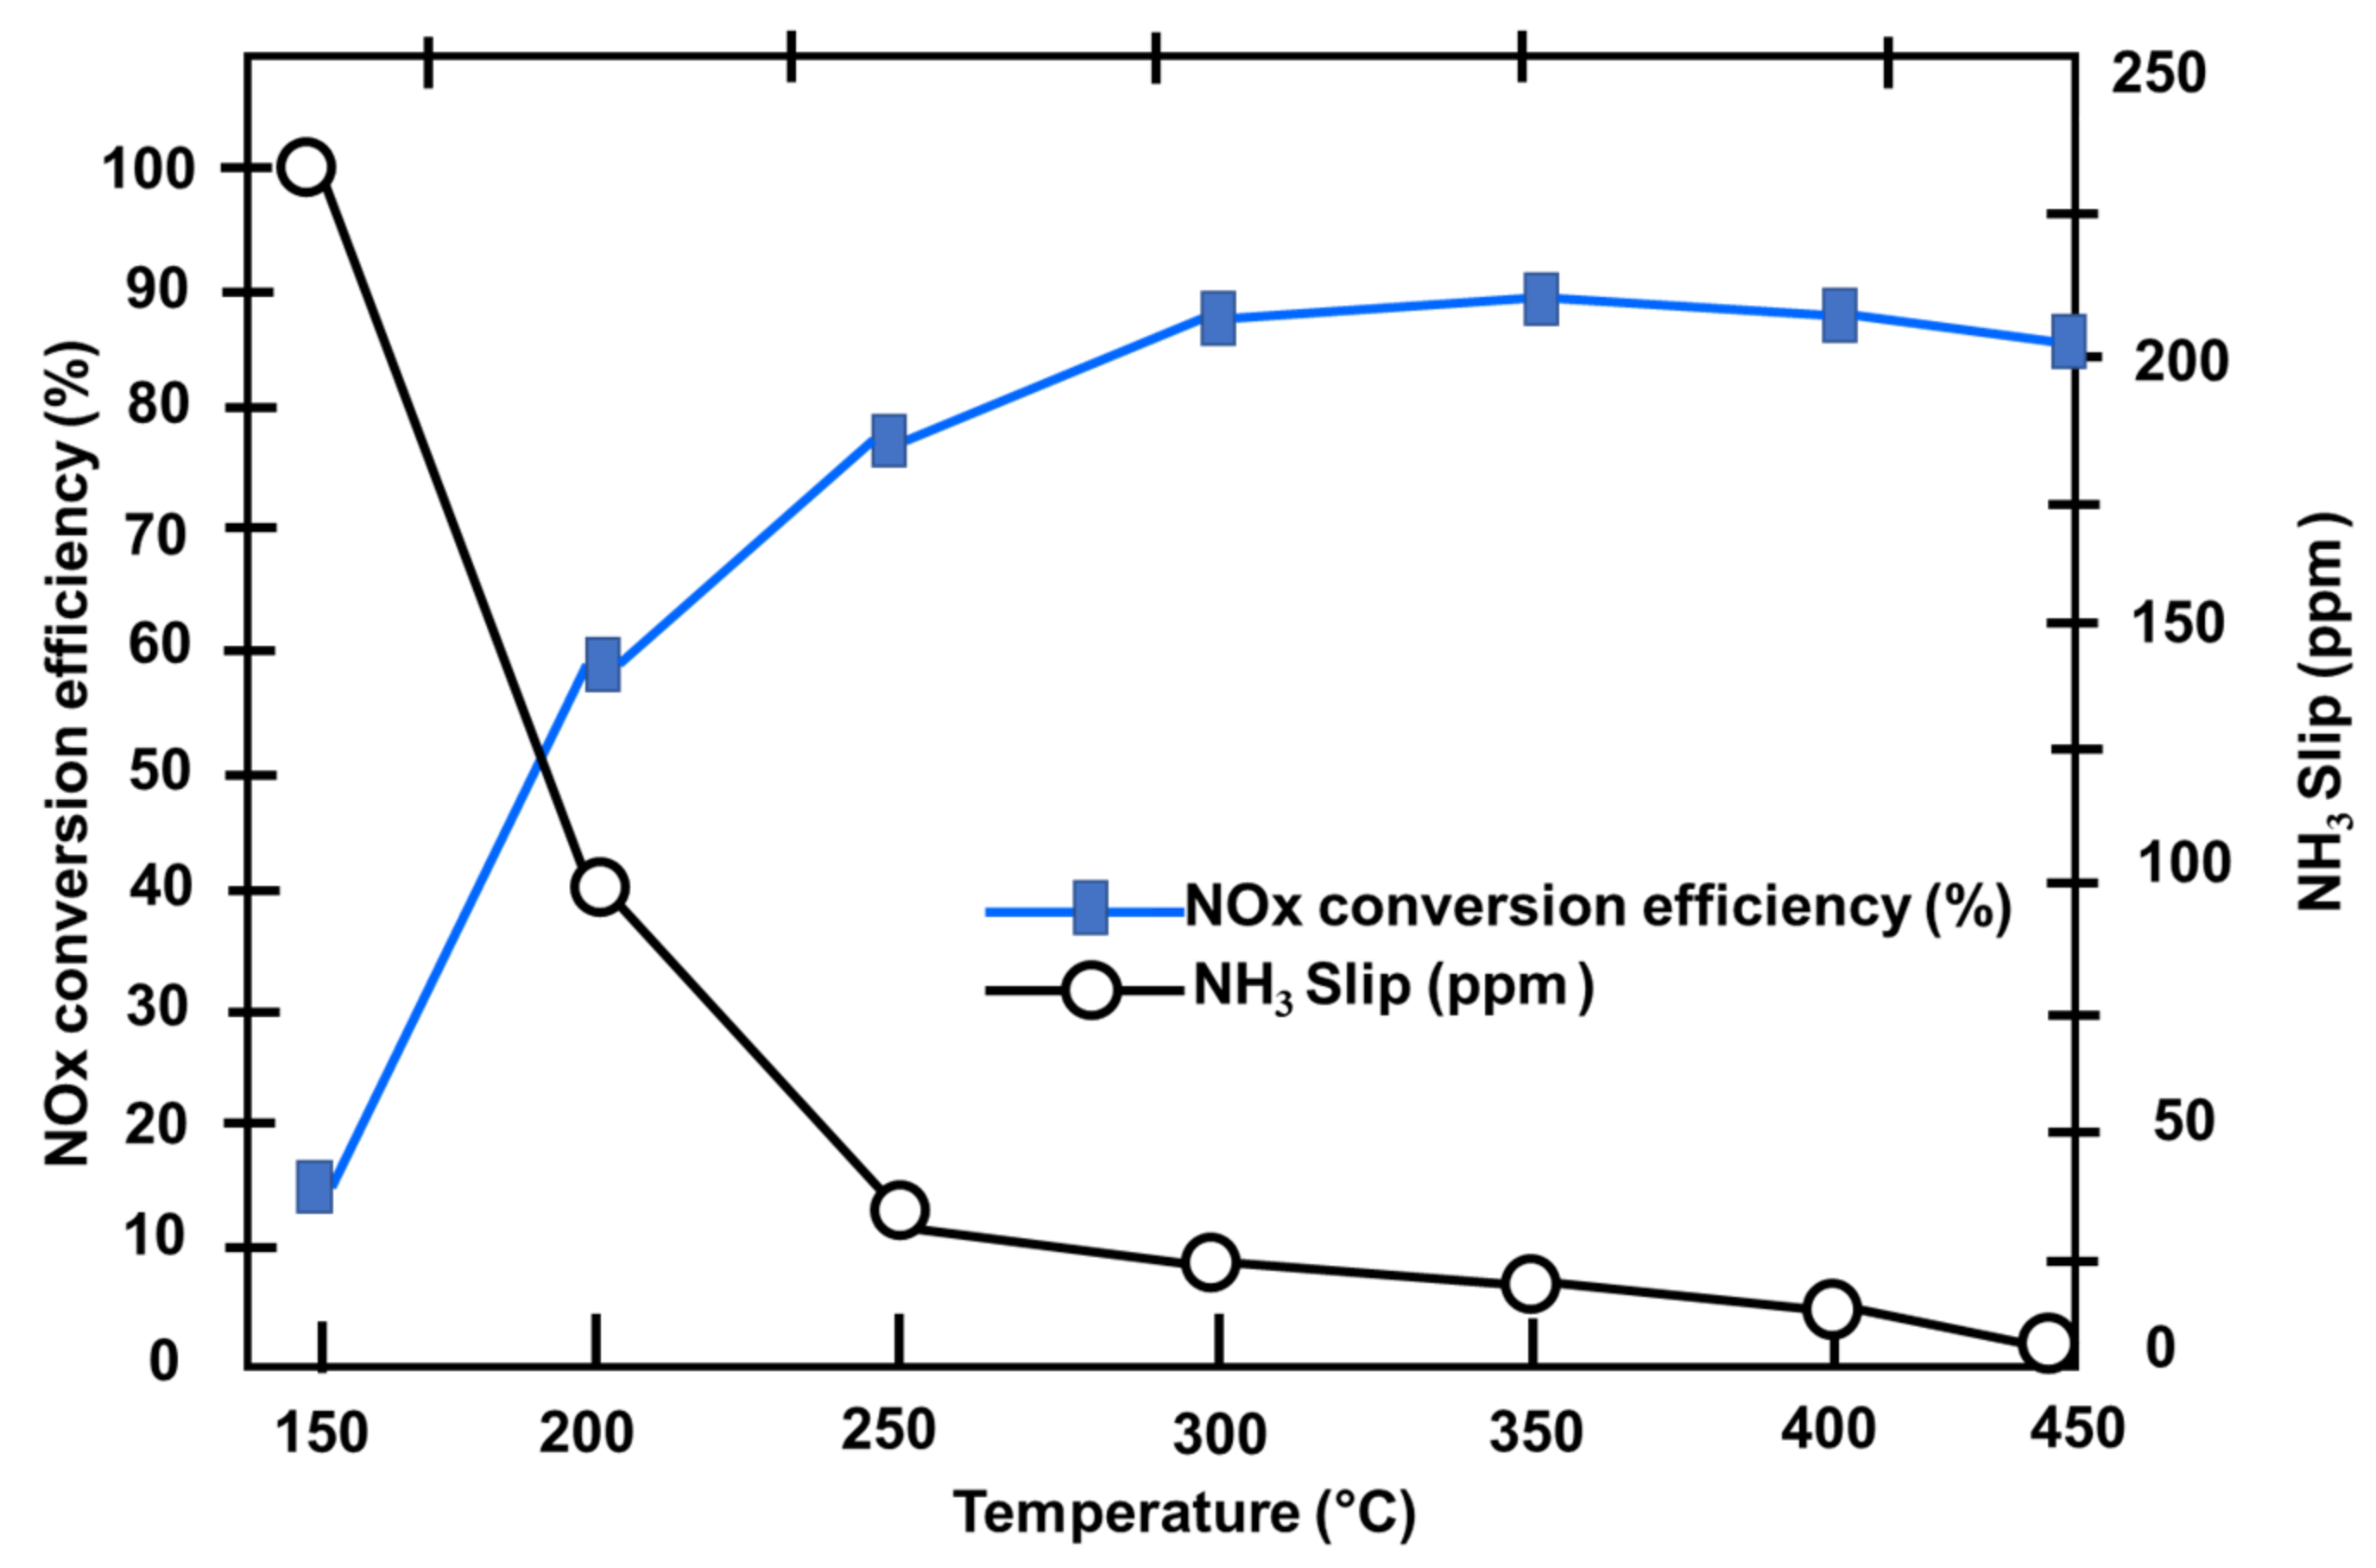
Another investigation of a light-duty diesel engine with a capacity of 5100 cc revealed a high NOx conversion (up to 90%) in an exhaust gas temperature range of 350–450 °C. However, after 30 h, the sulfur accumulated on the catalyst surface became the primary reason for reduced catalyst activation. In this investigation, the Ag/Al2O3 catalyst can decrease sulfate only marginally when the exhaust gas temperature is below 410 °C and the PM emissions can be reduced when the temperature is 336 °C, but when the temperature increases to 470 °C, the catalyst will suffer.
f)
The investigated 6500 cc heavy-duty diesel engine showed that the downstream NH3 concentration was less than the limit; in particular, the overall mean ammonia slip of 9.7 ppm may be reasonably low, but maximum deNOx performances were achieved as the temperature increased.
g)
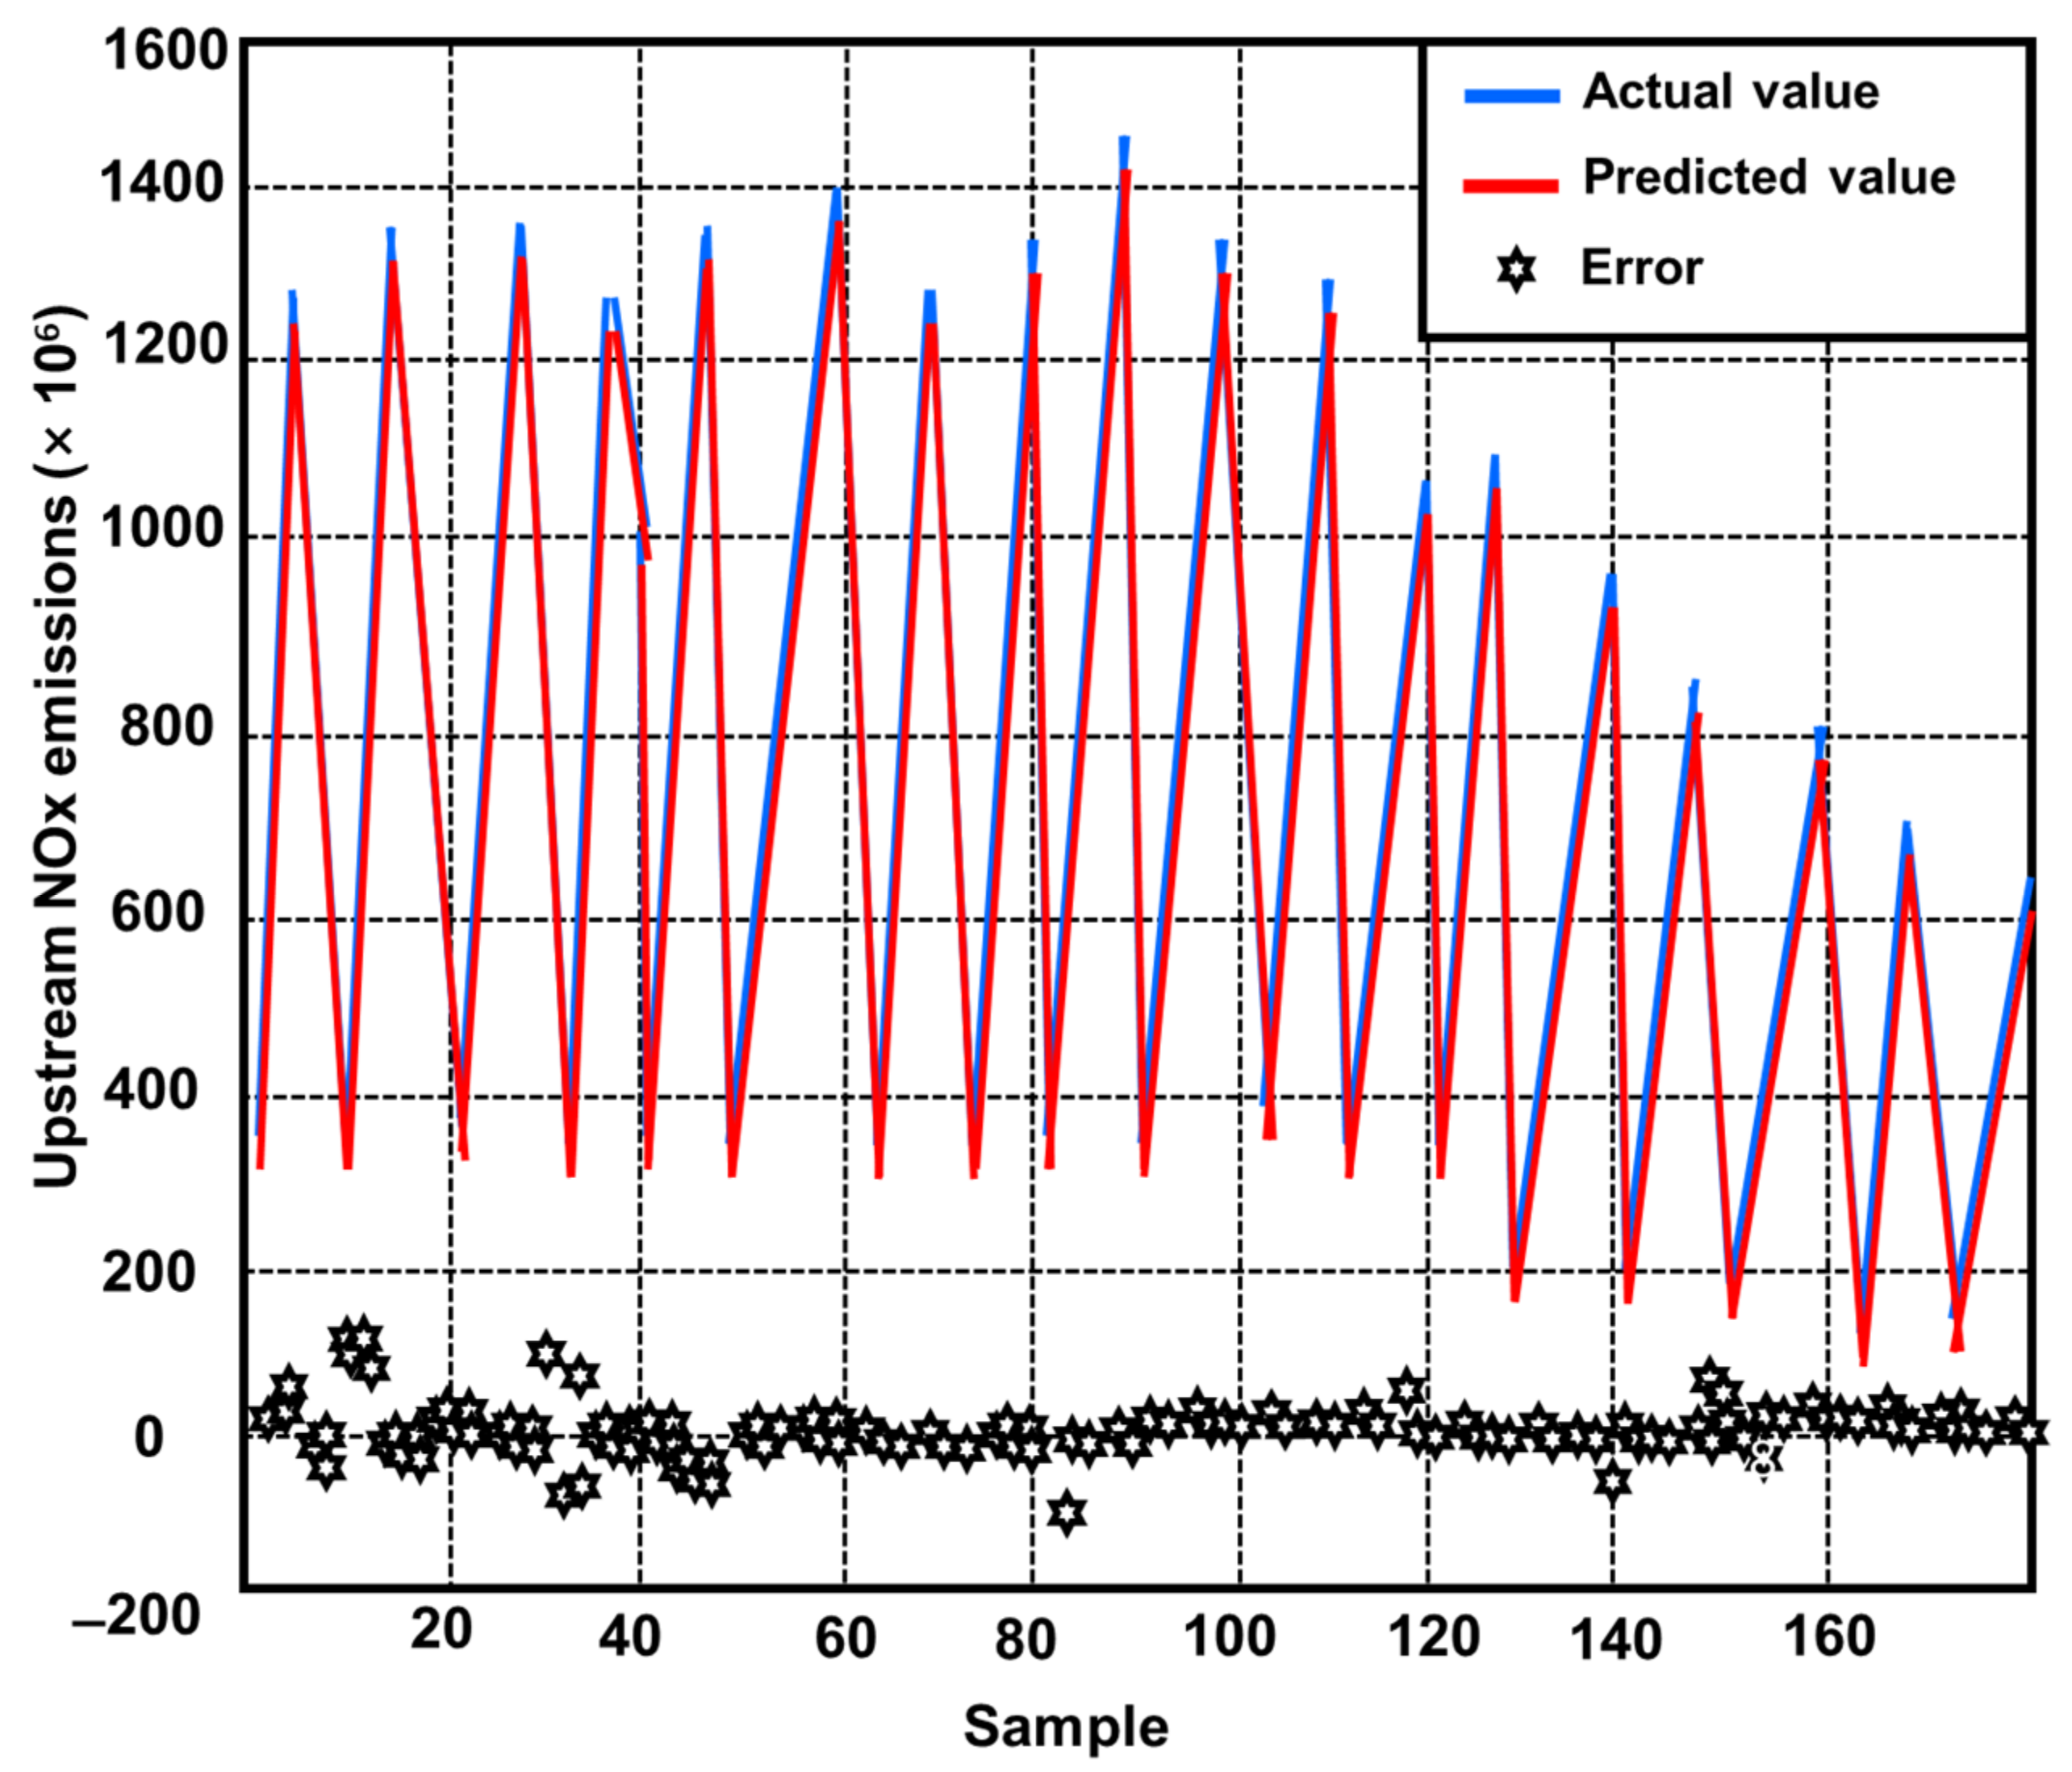
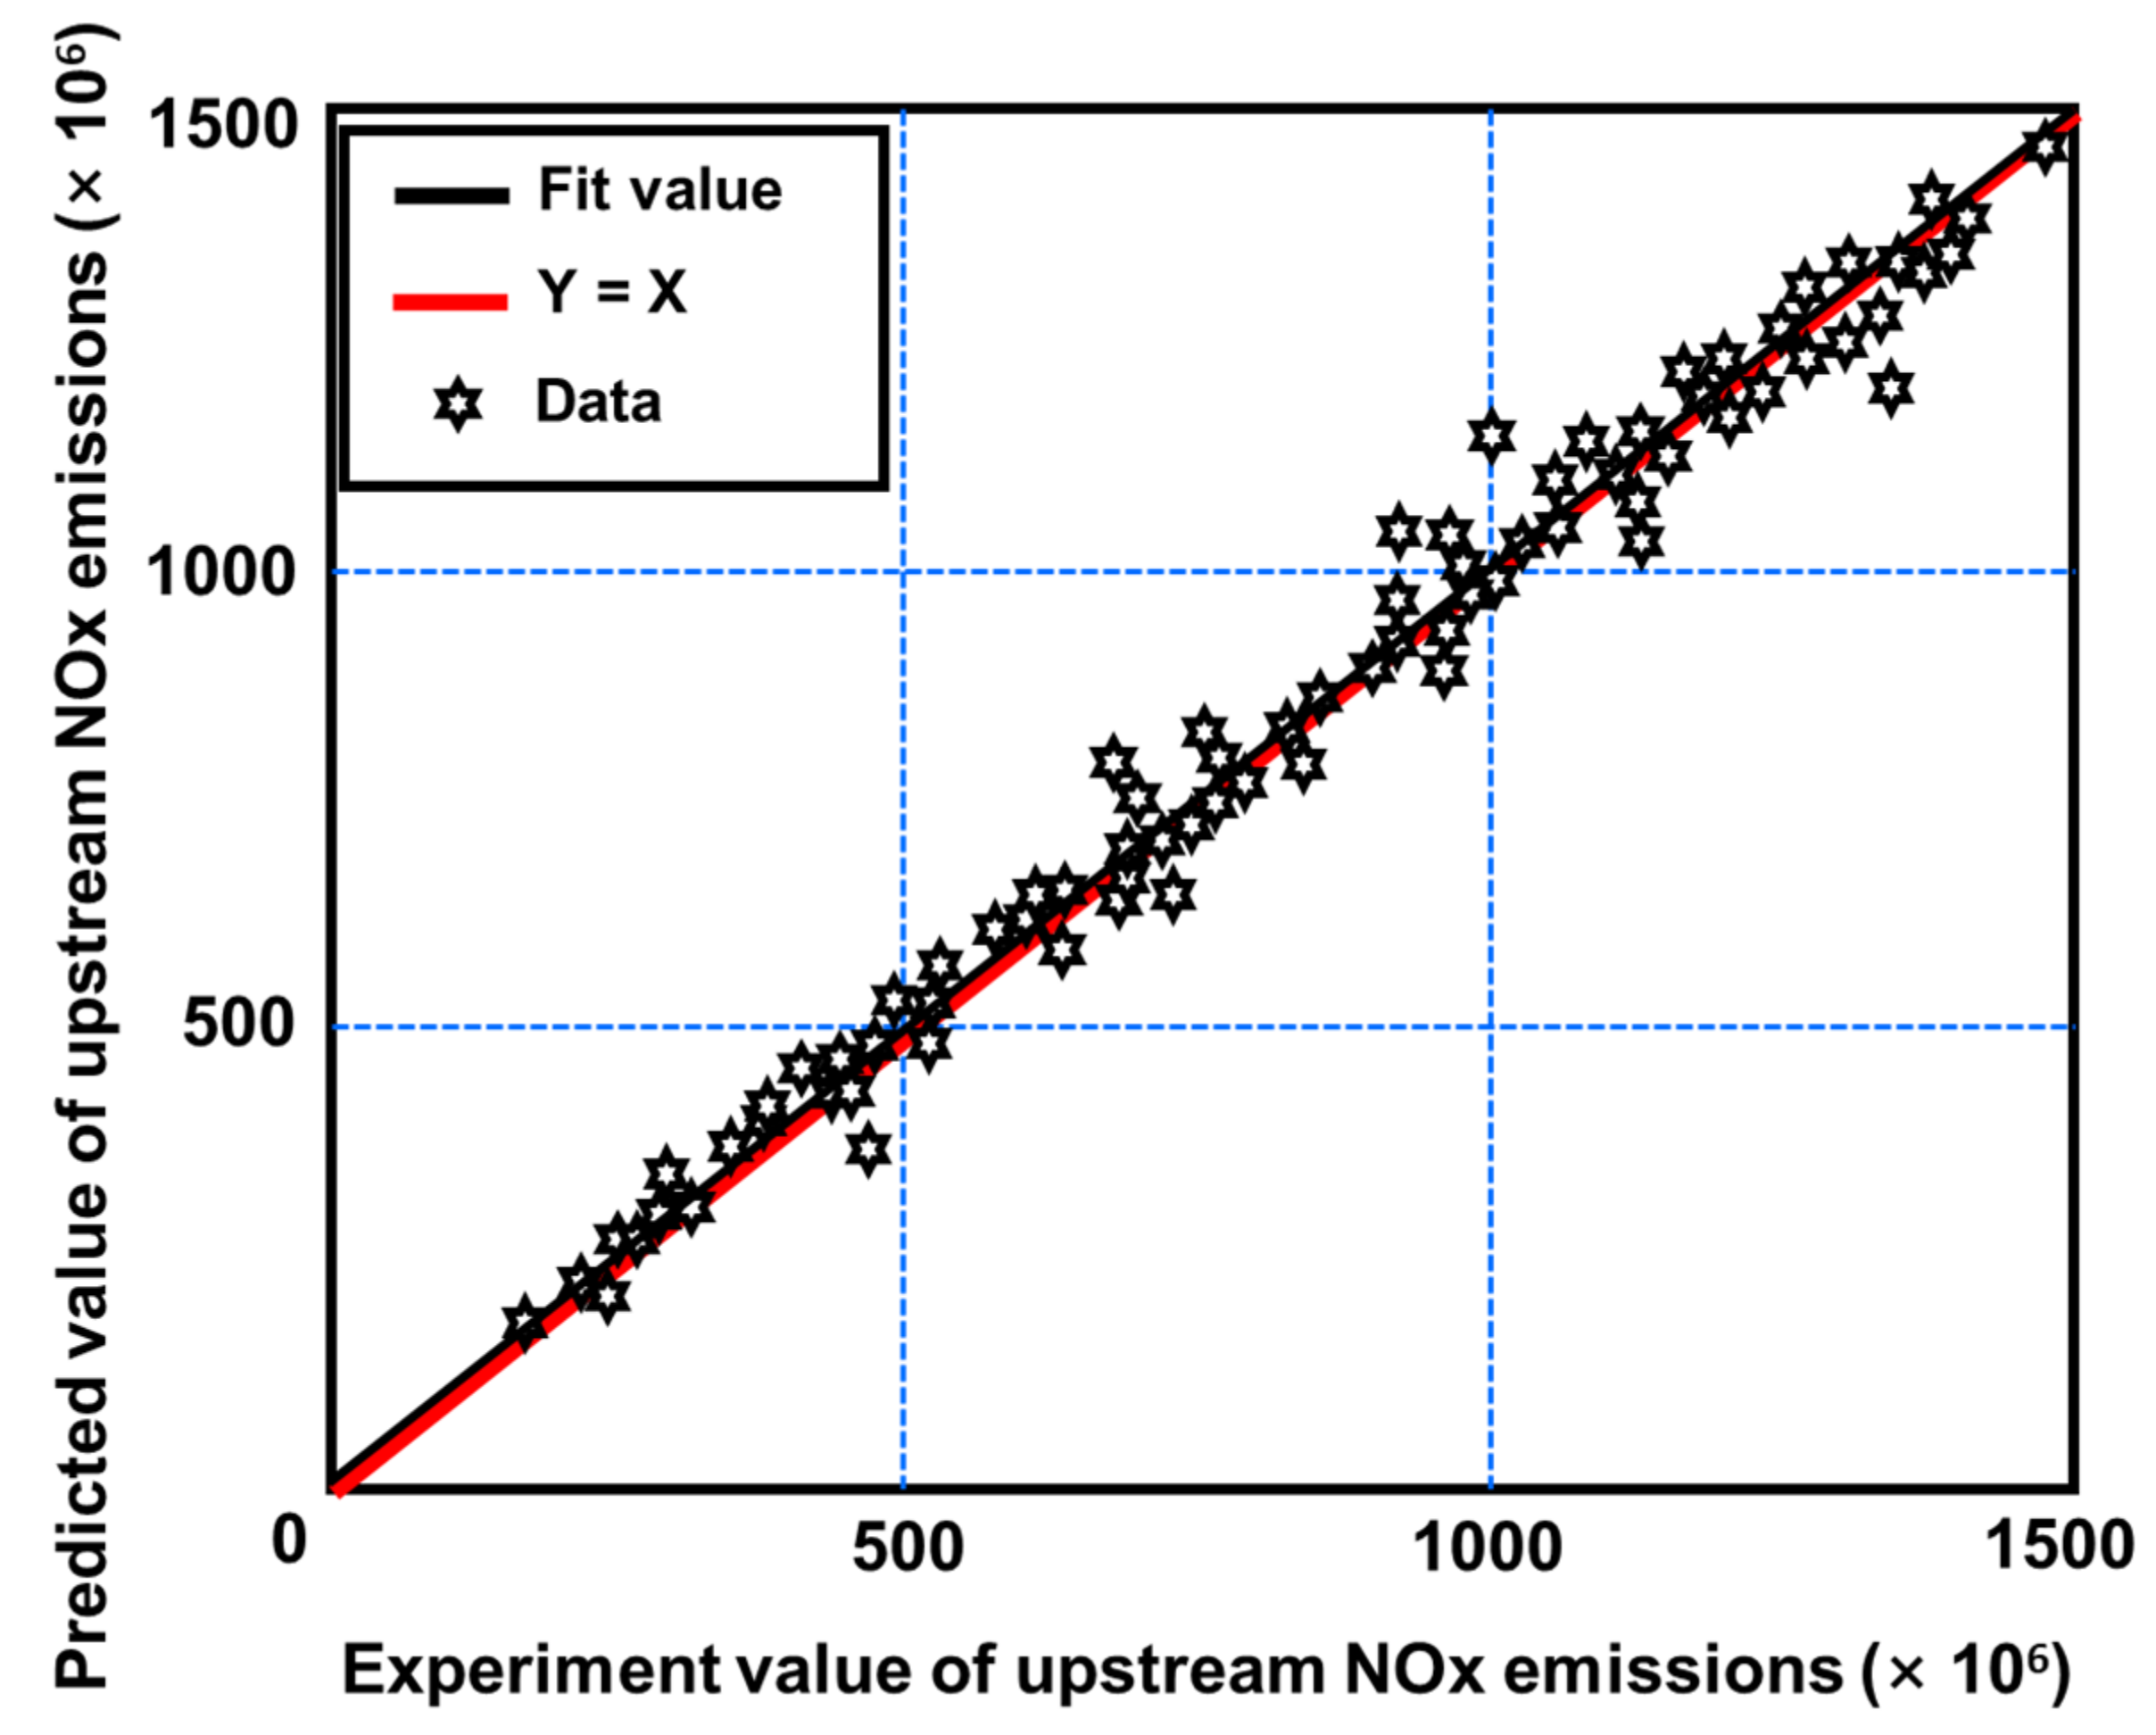
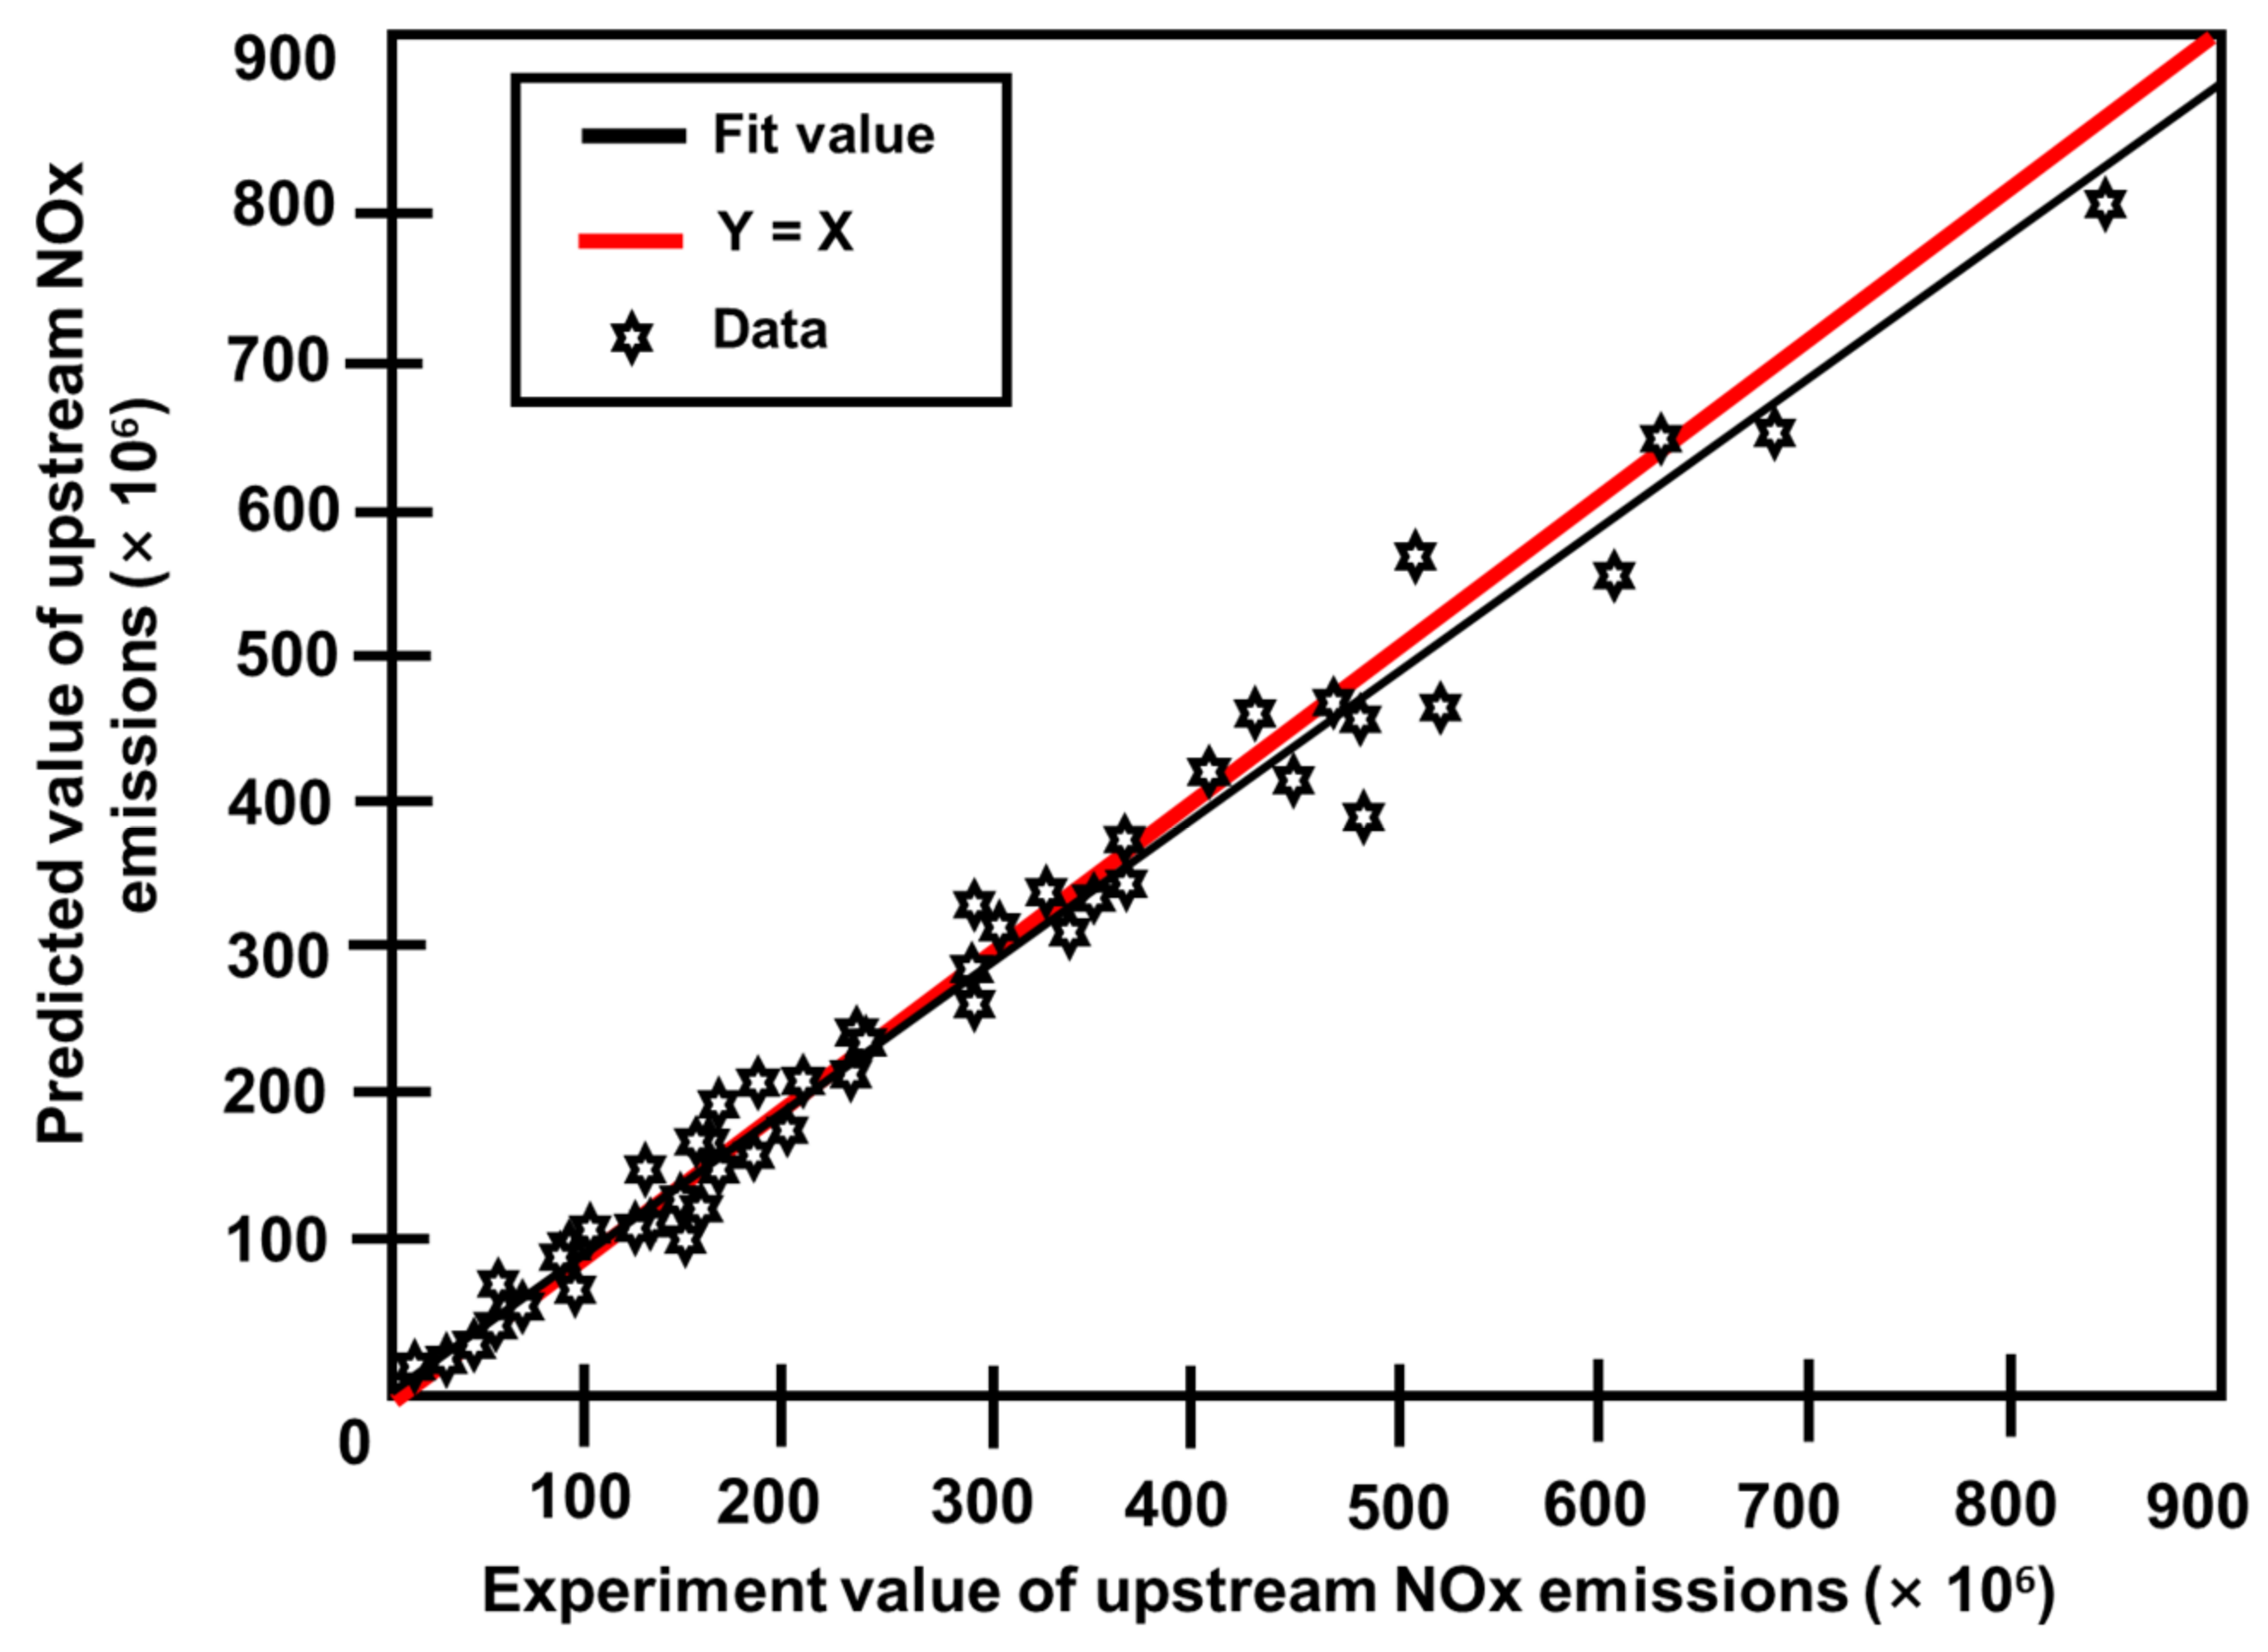
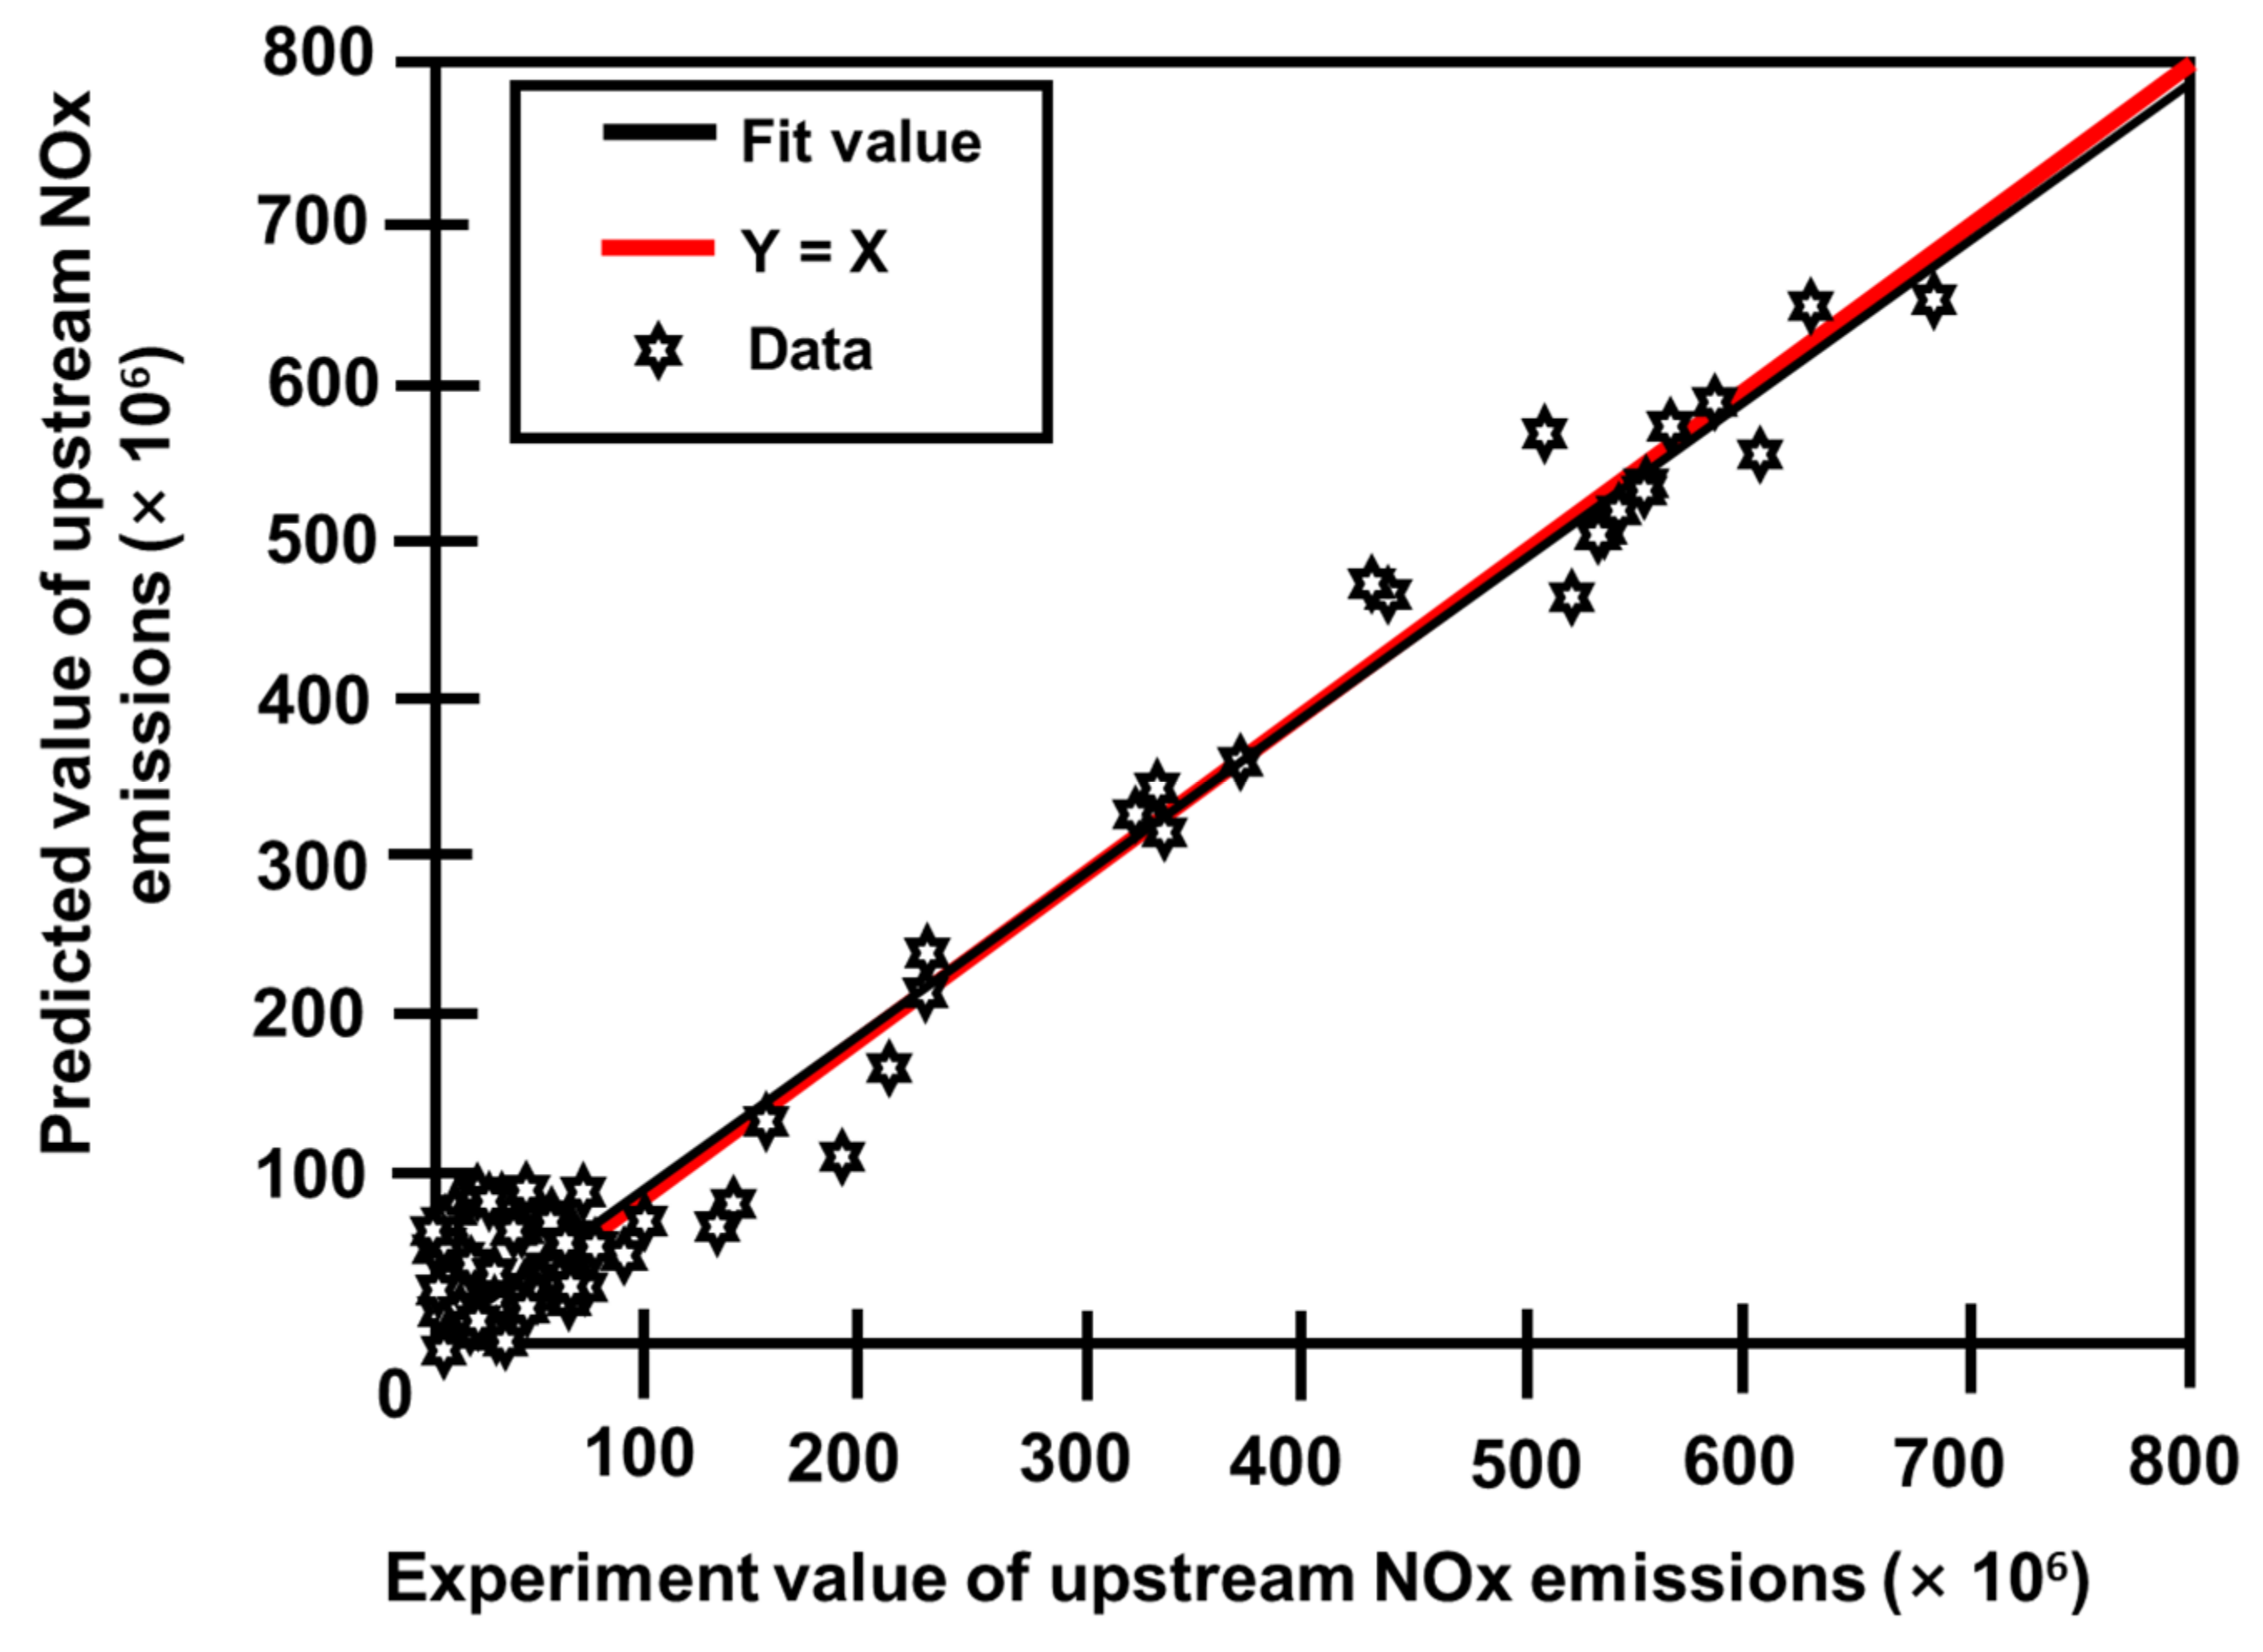
Upstream and downstream NOx emissions as well as ammonia slip were predicted using another heavy-duty diesel engine with a 6600 cc capacity. The many parts of the modeling and optimization methods have been thoroughly covered. The non-dominated sorting genetic algorithm was used to address the multi-objective optimization issue of optimizing NOx conversion efficiency while reducing ammonia slip under particular operating conditions based on the decision variable of urea injection volume.
h)
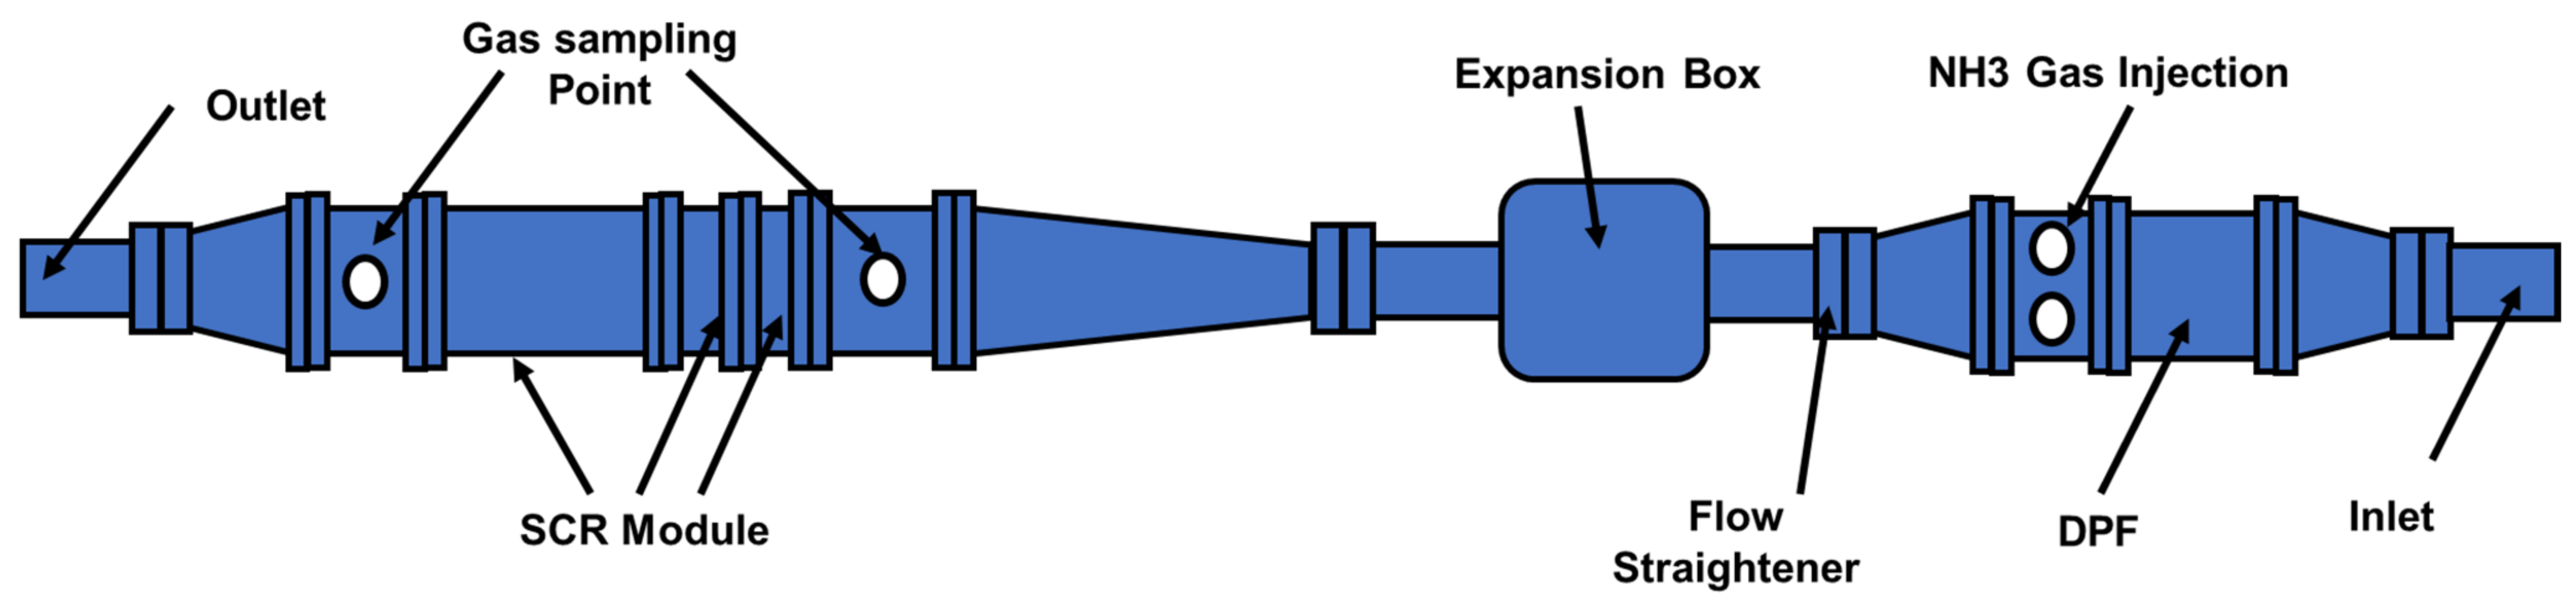
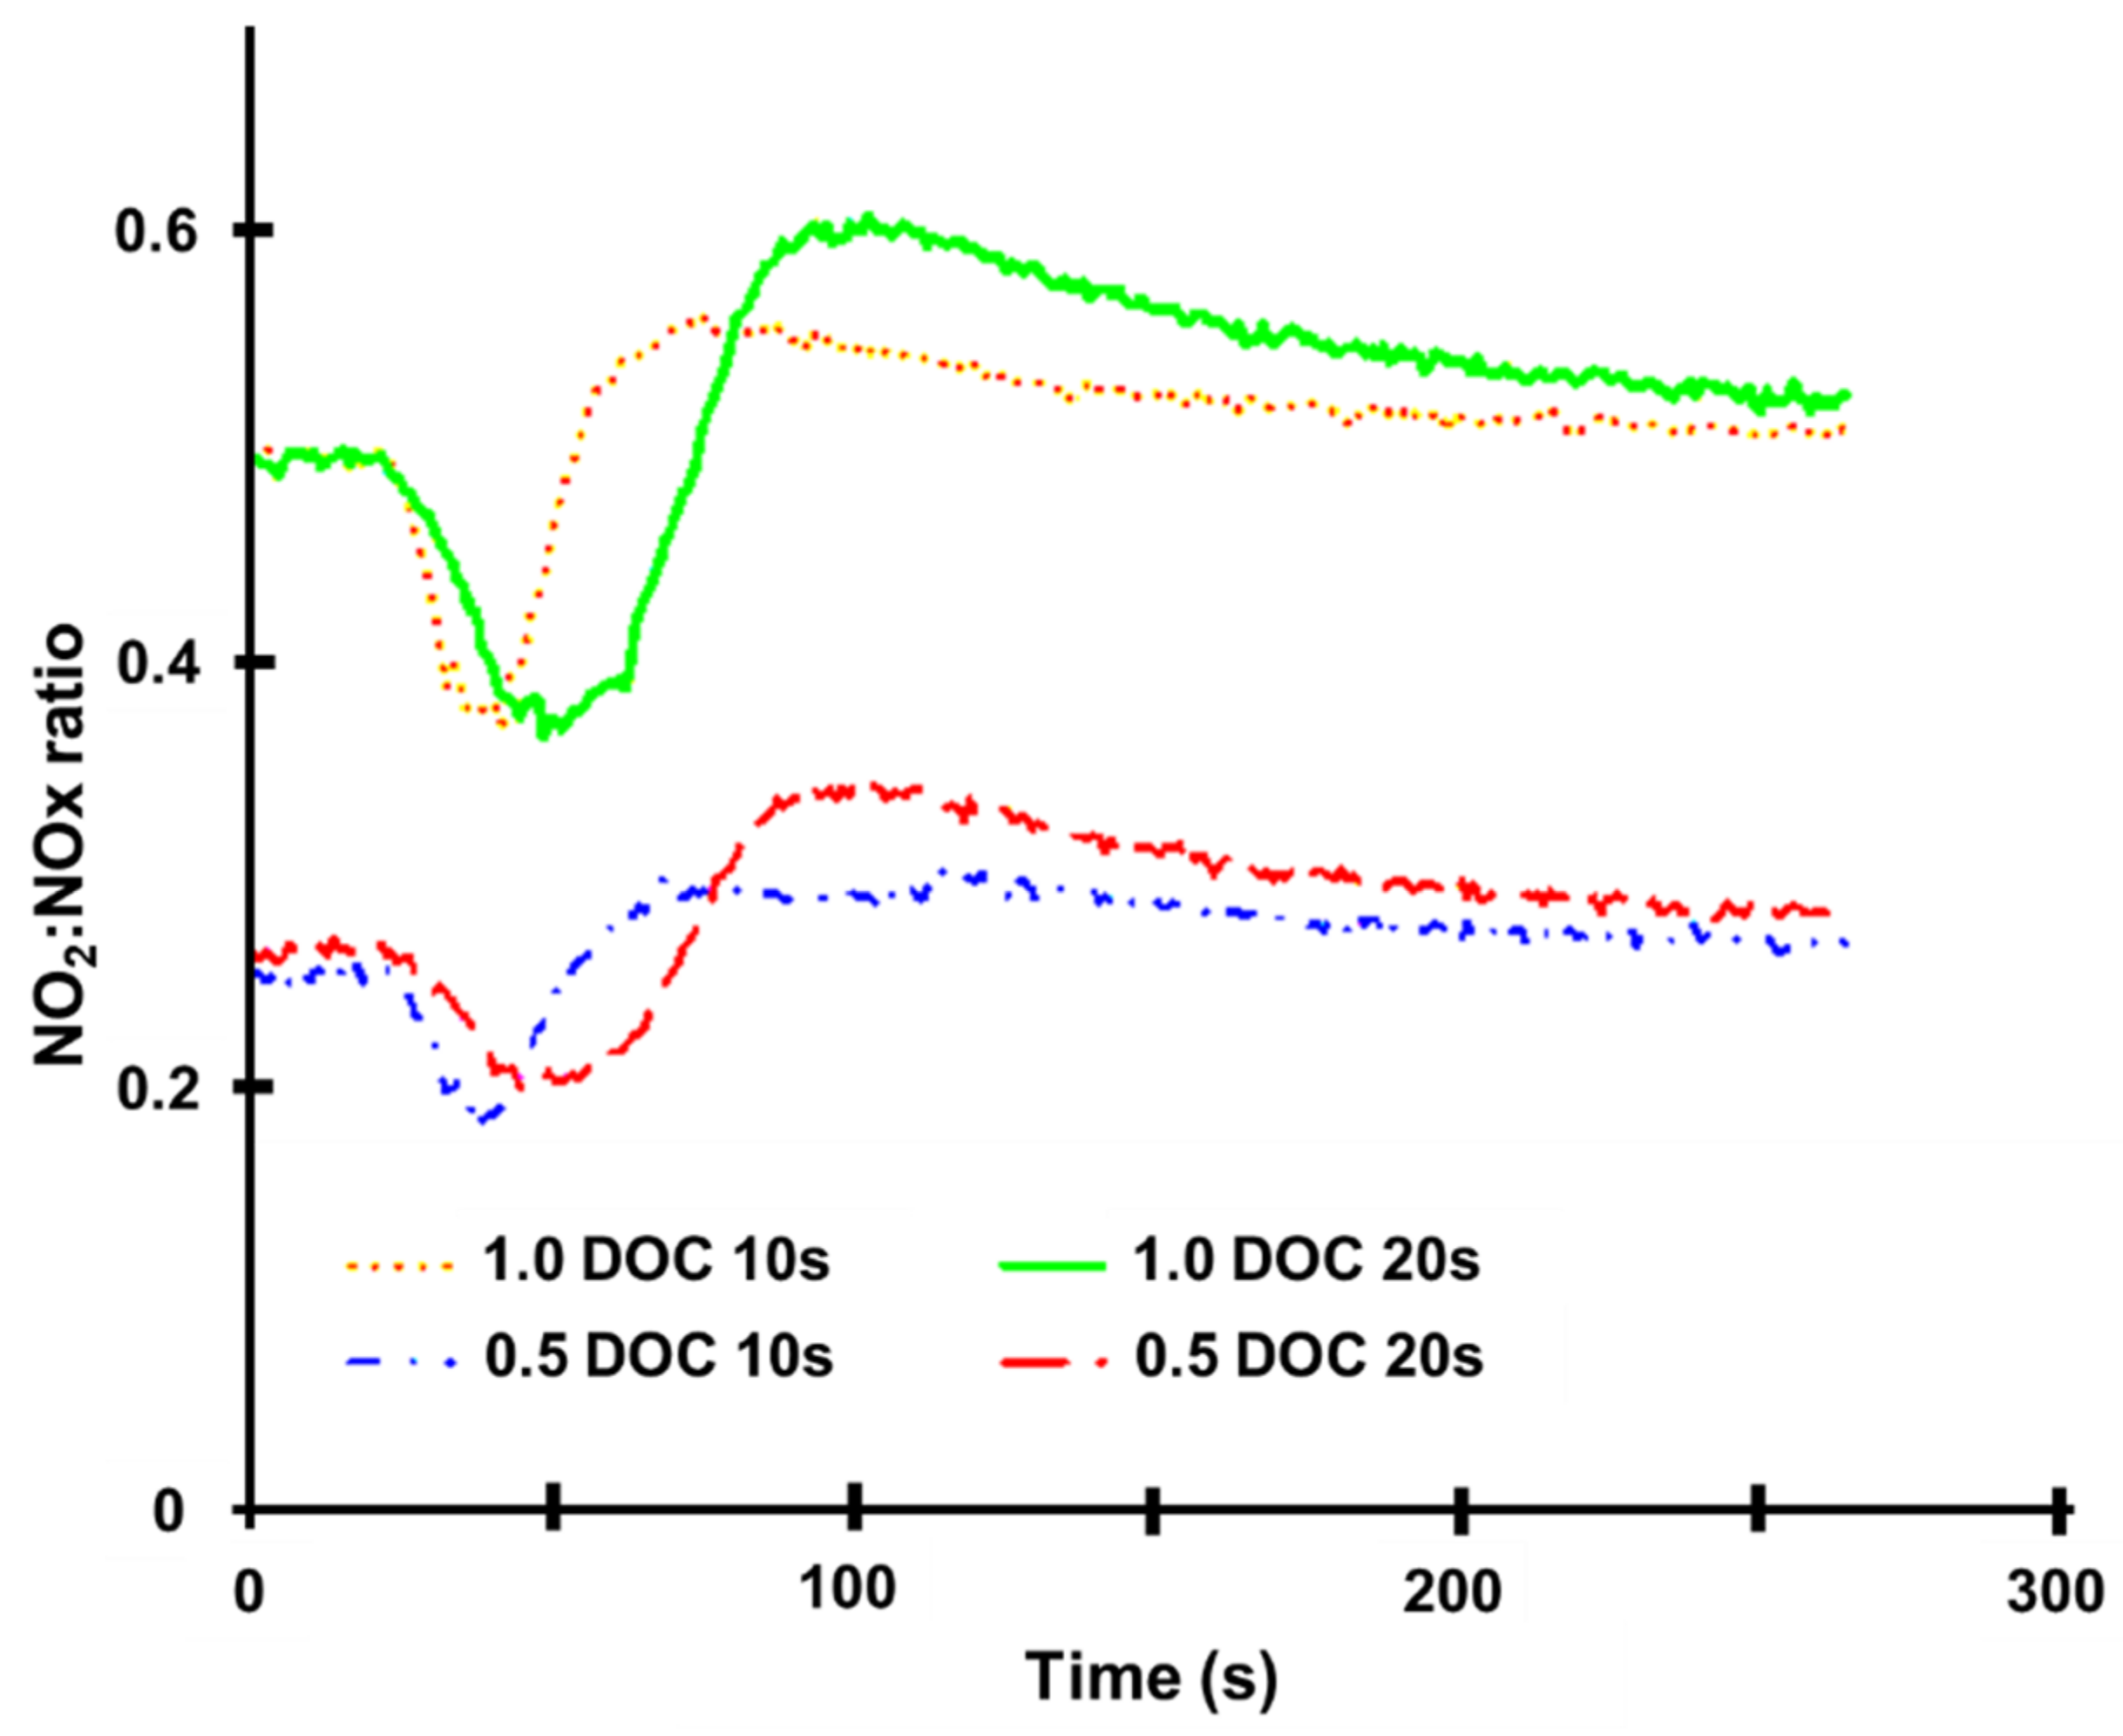
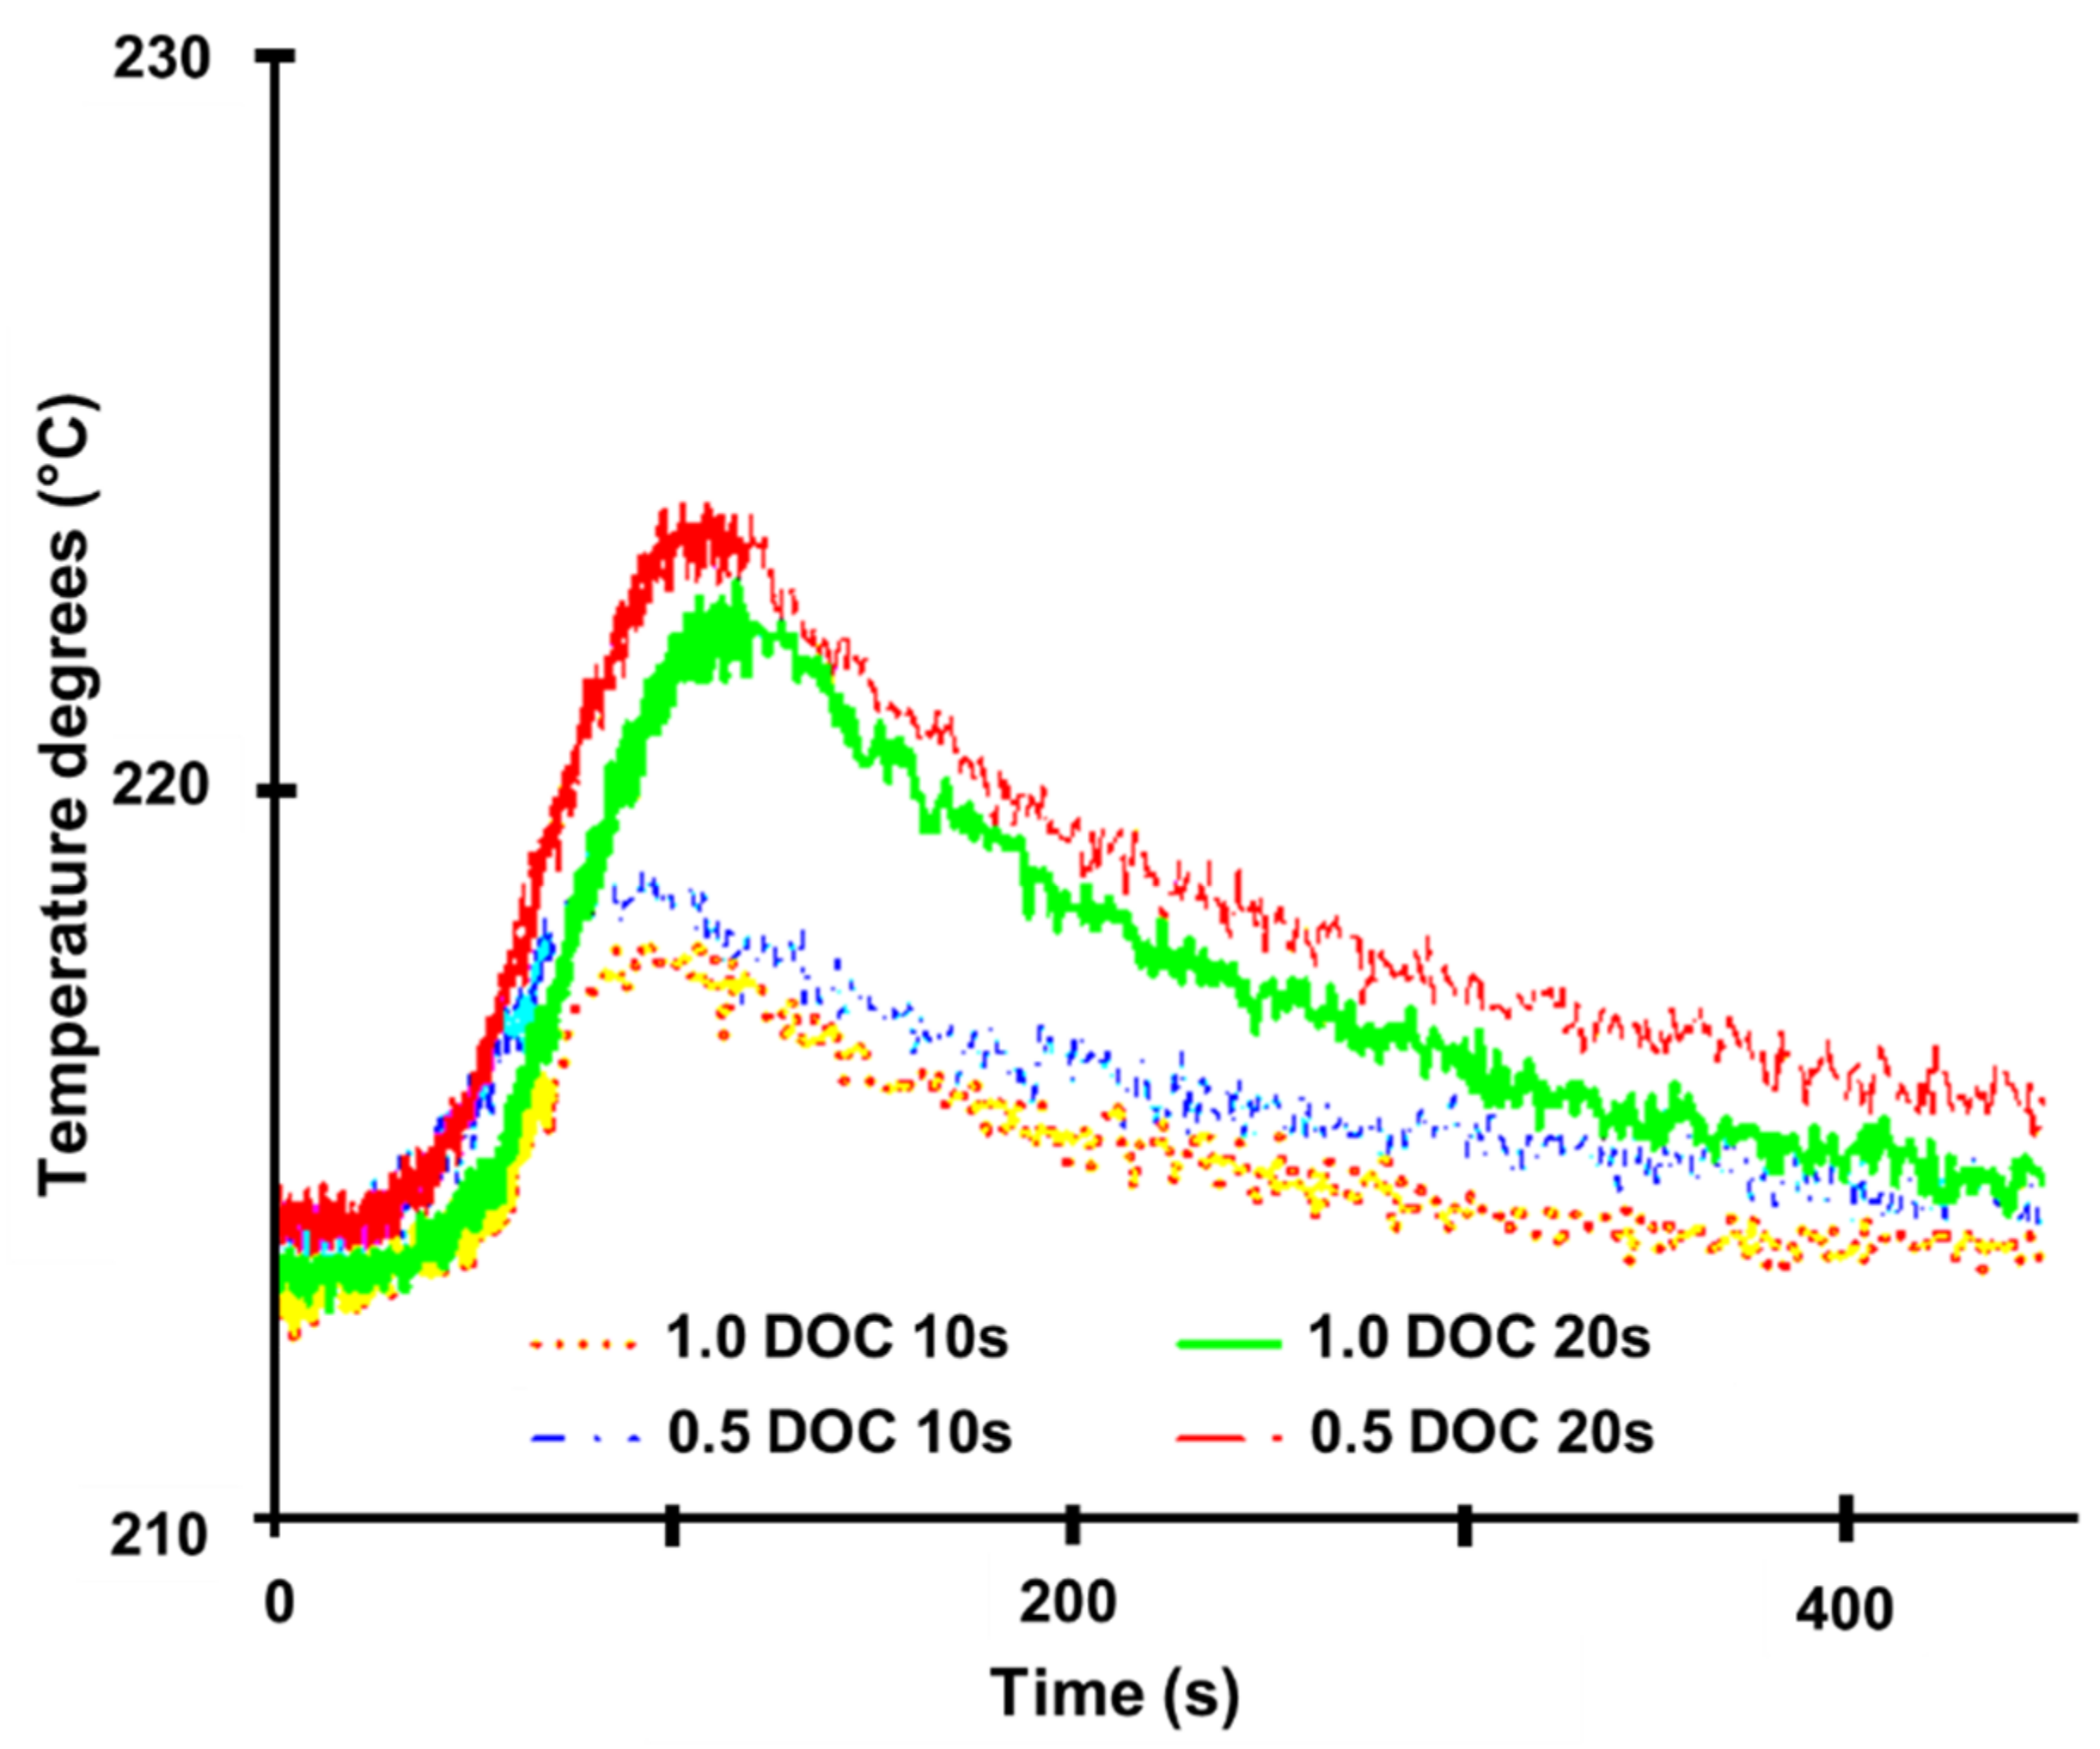
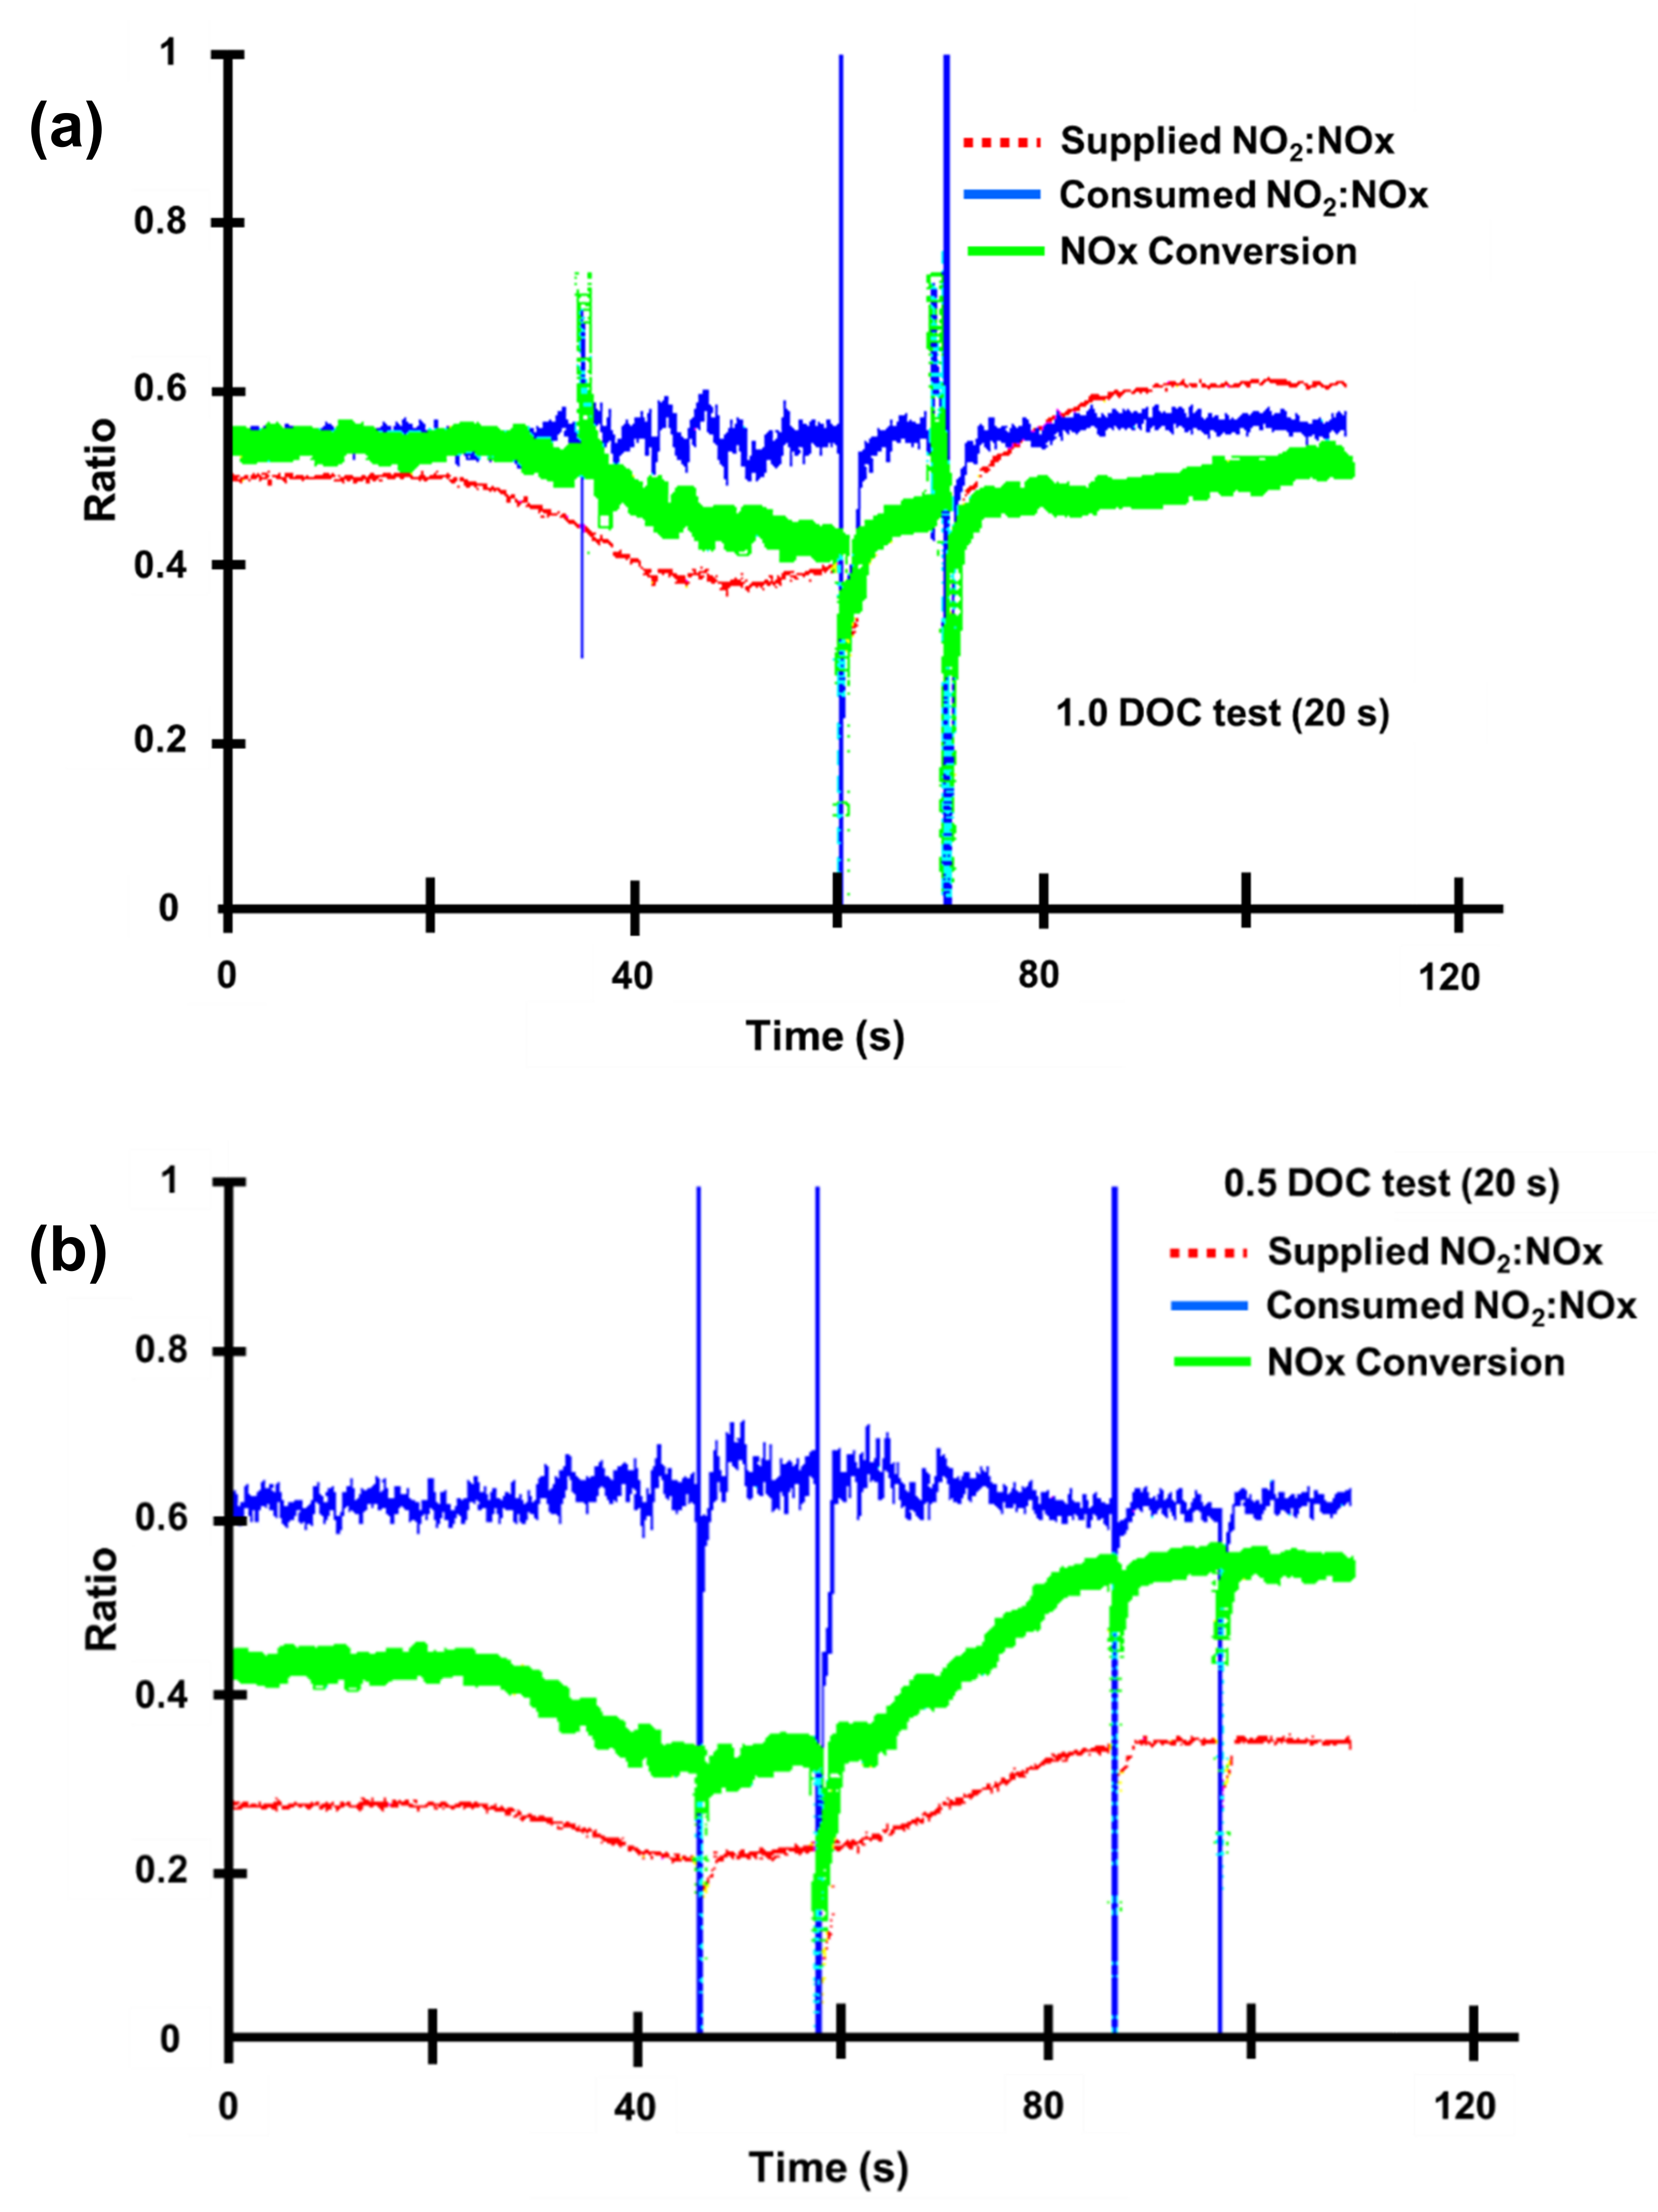
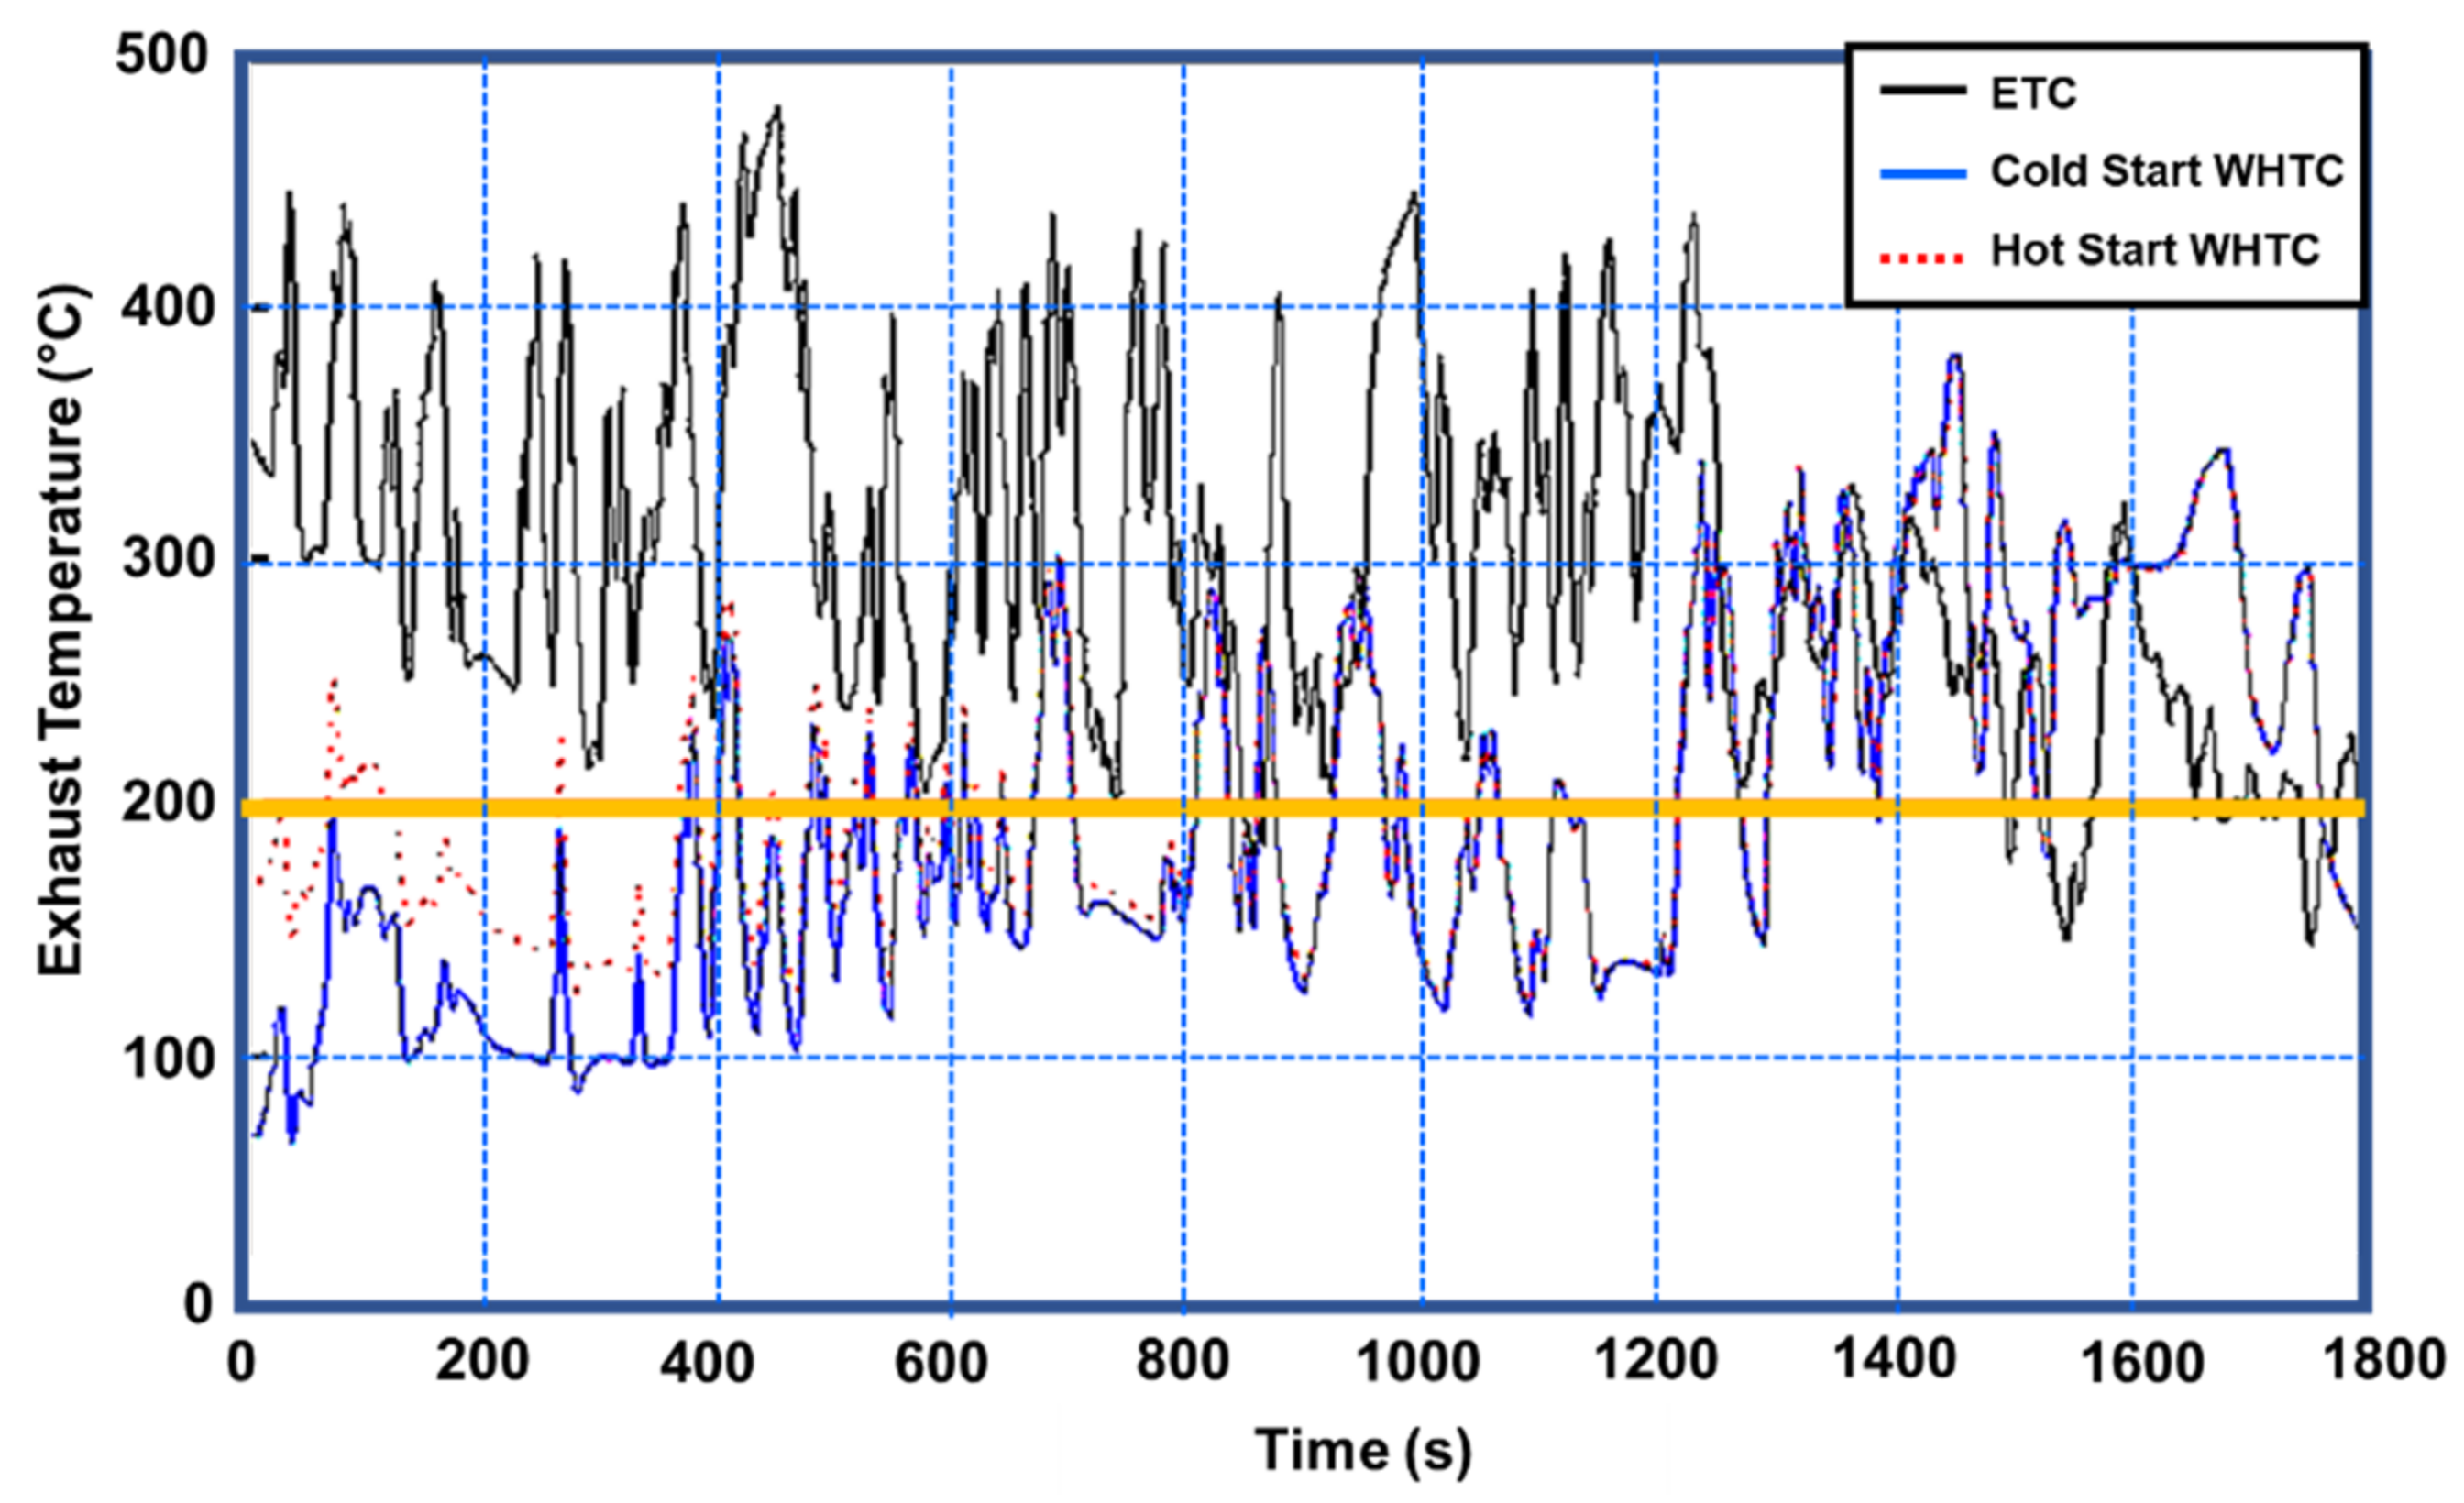
Another investigation of a heavy-duty diesel engine with a size of 7100 cc revealed that exhaust temperature may enhance the cold start and hot start performance. To control the urea injection temperature, the Harmonized Transit Cycle (WHTC) is used which can reduce the NOx emission-weighted value to 41.5%. The DOC successfully increased the NO2/NOx ratio and NOx conversion in the temperature range of 200–400 °C, resulting in an 8.7% reduction in the NOx emission-weighted value of the engine under WHTC.
i)
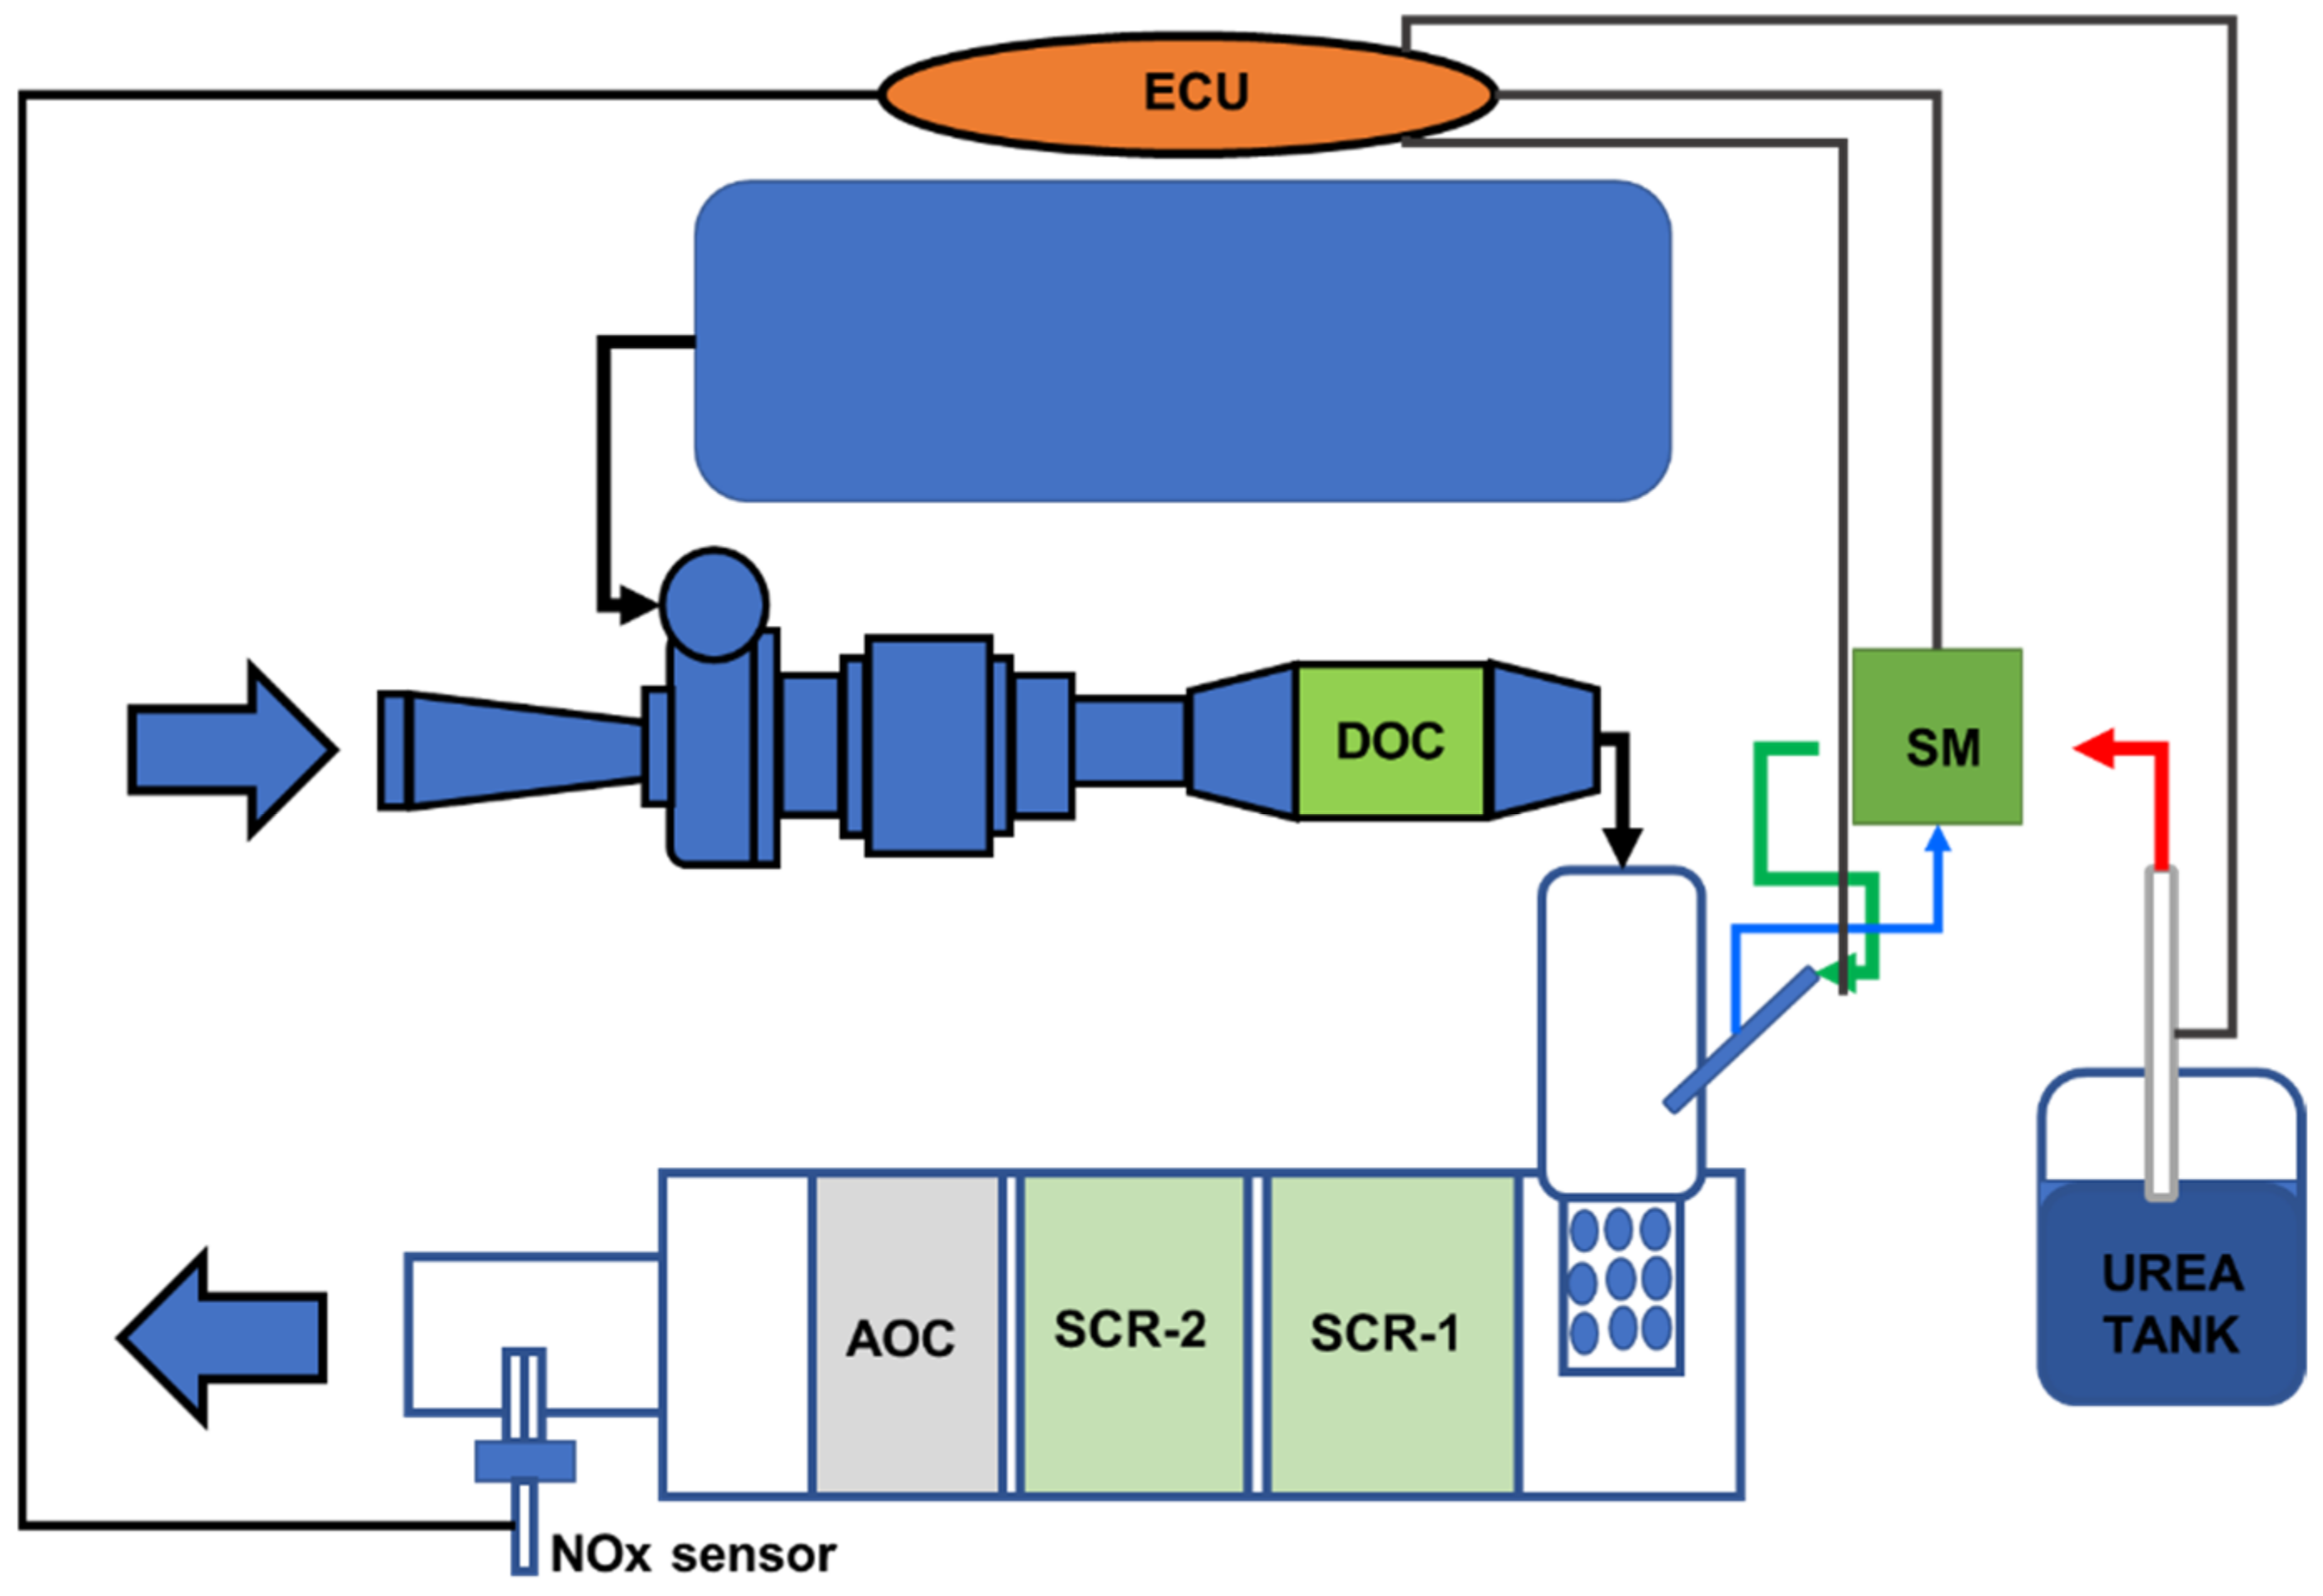
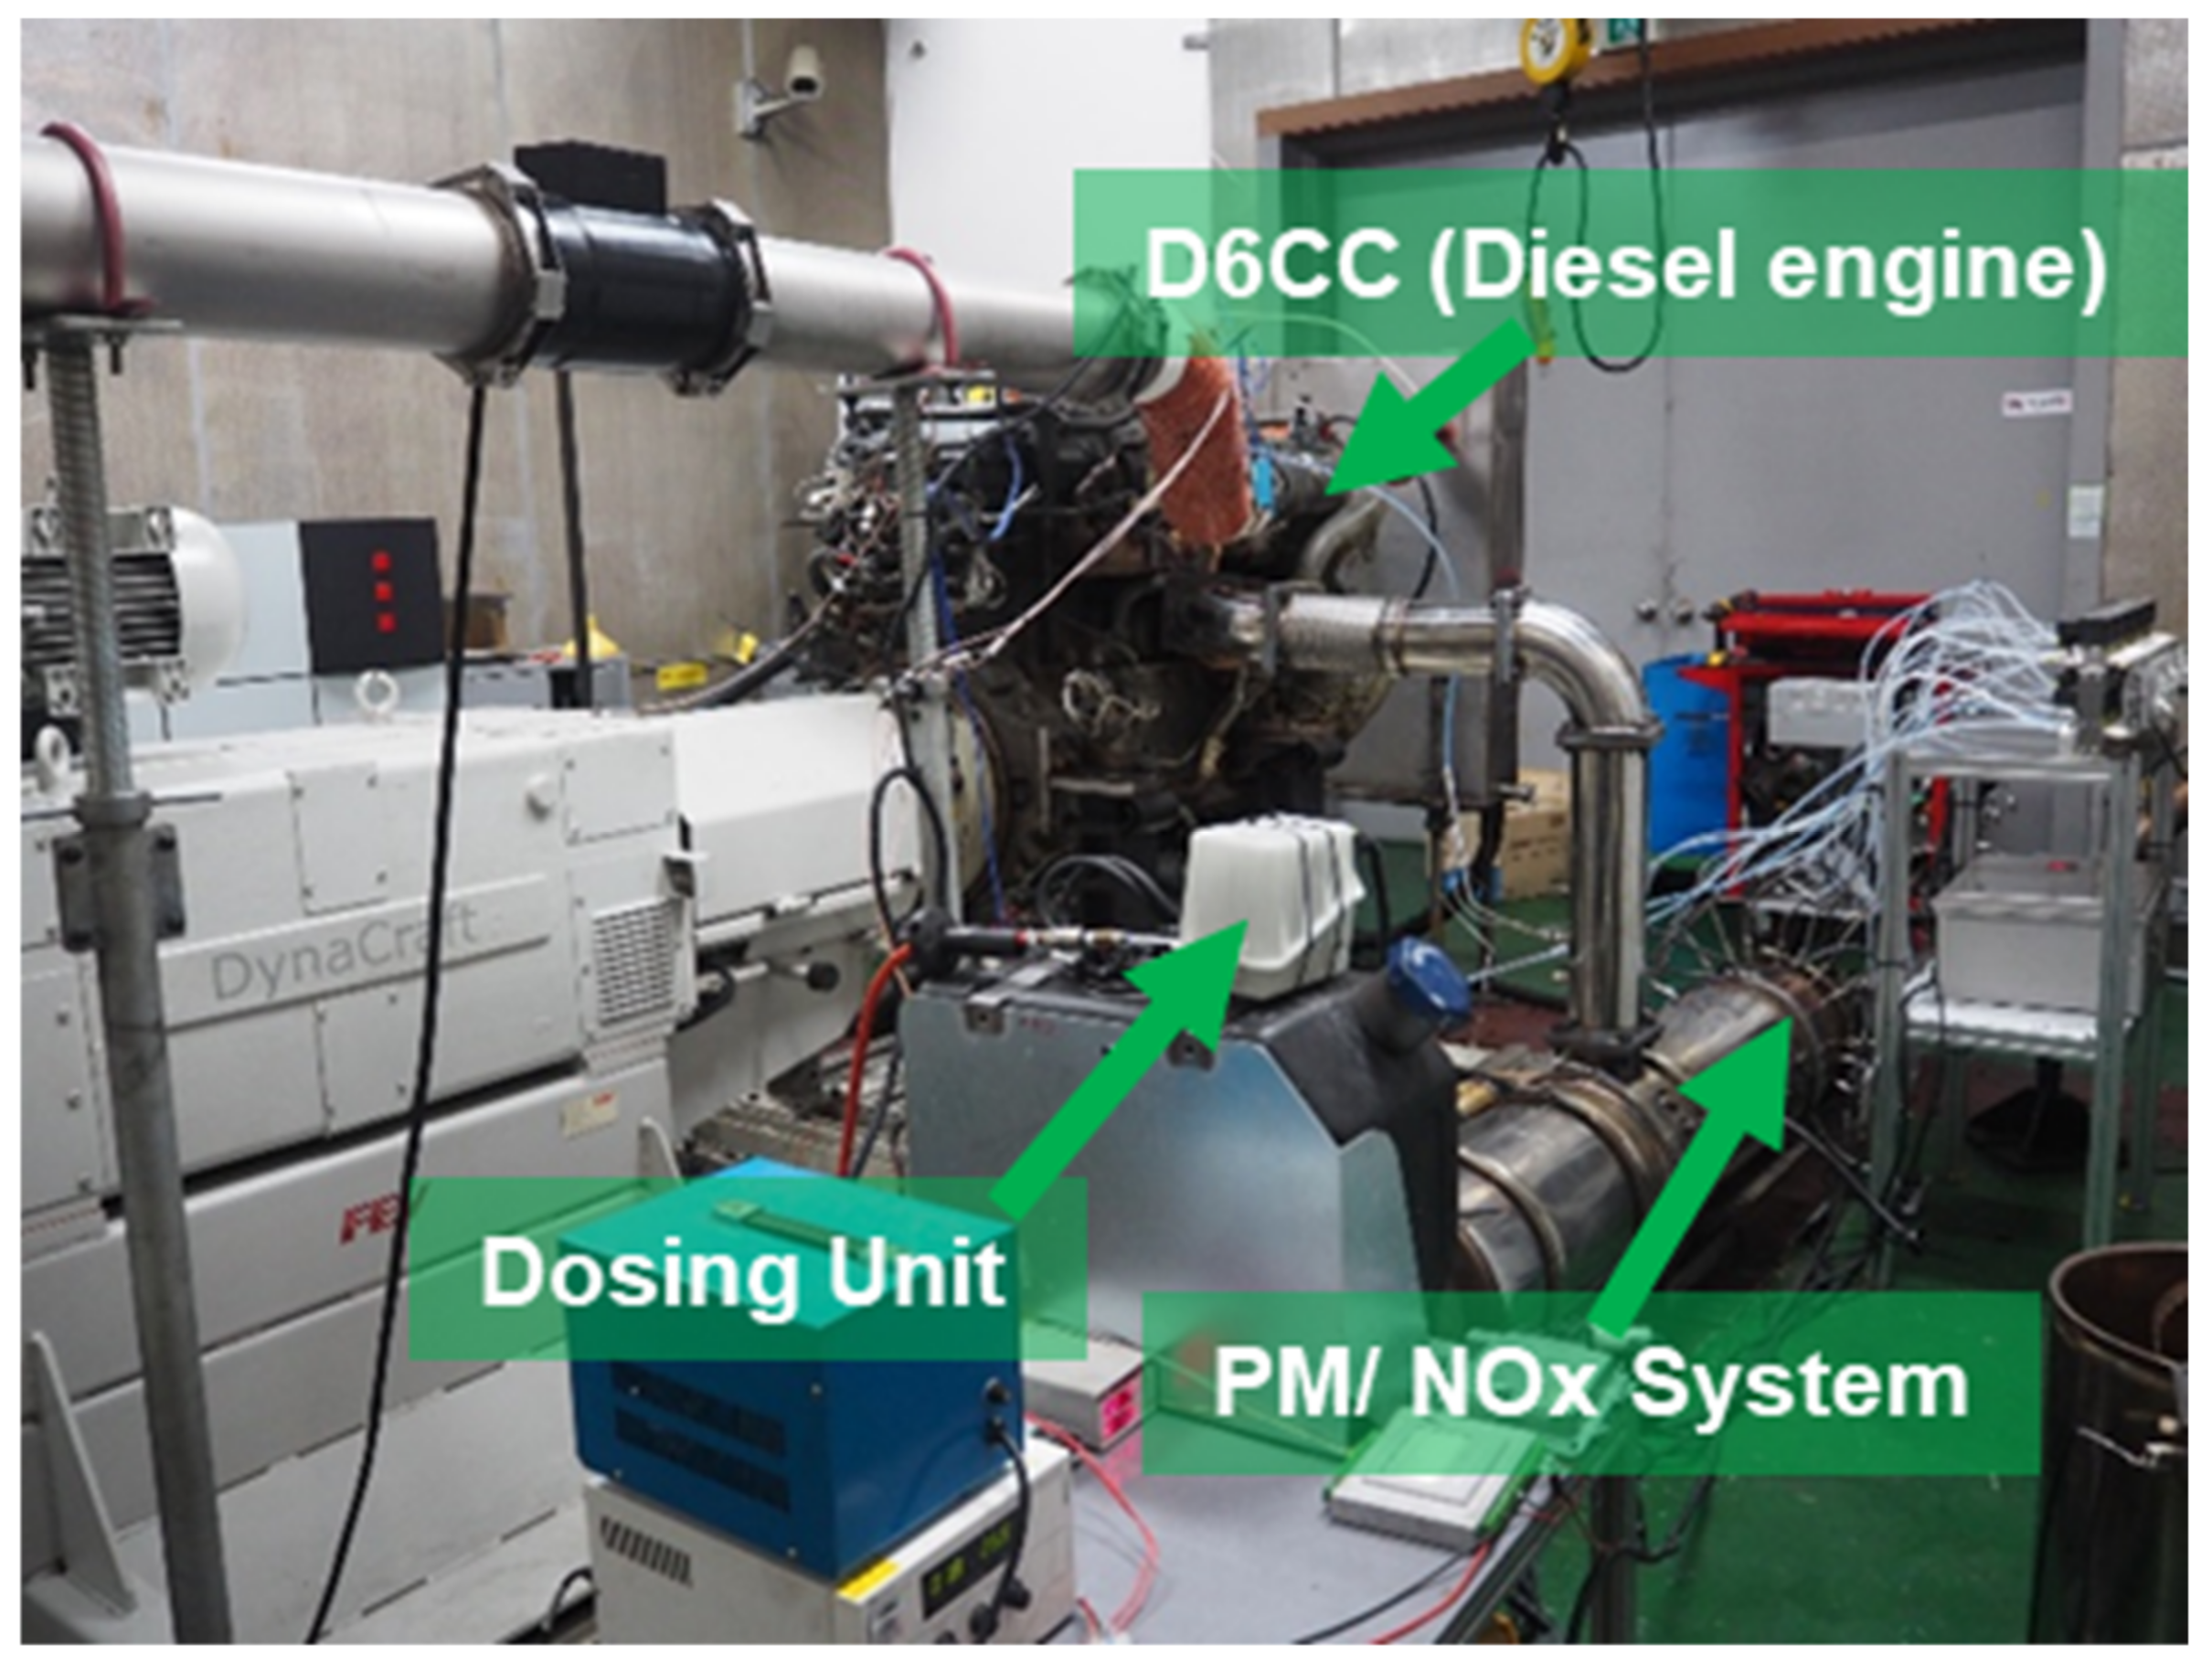
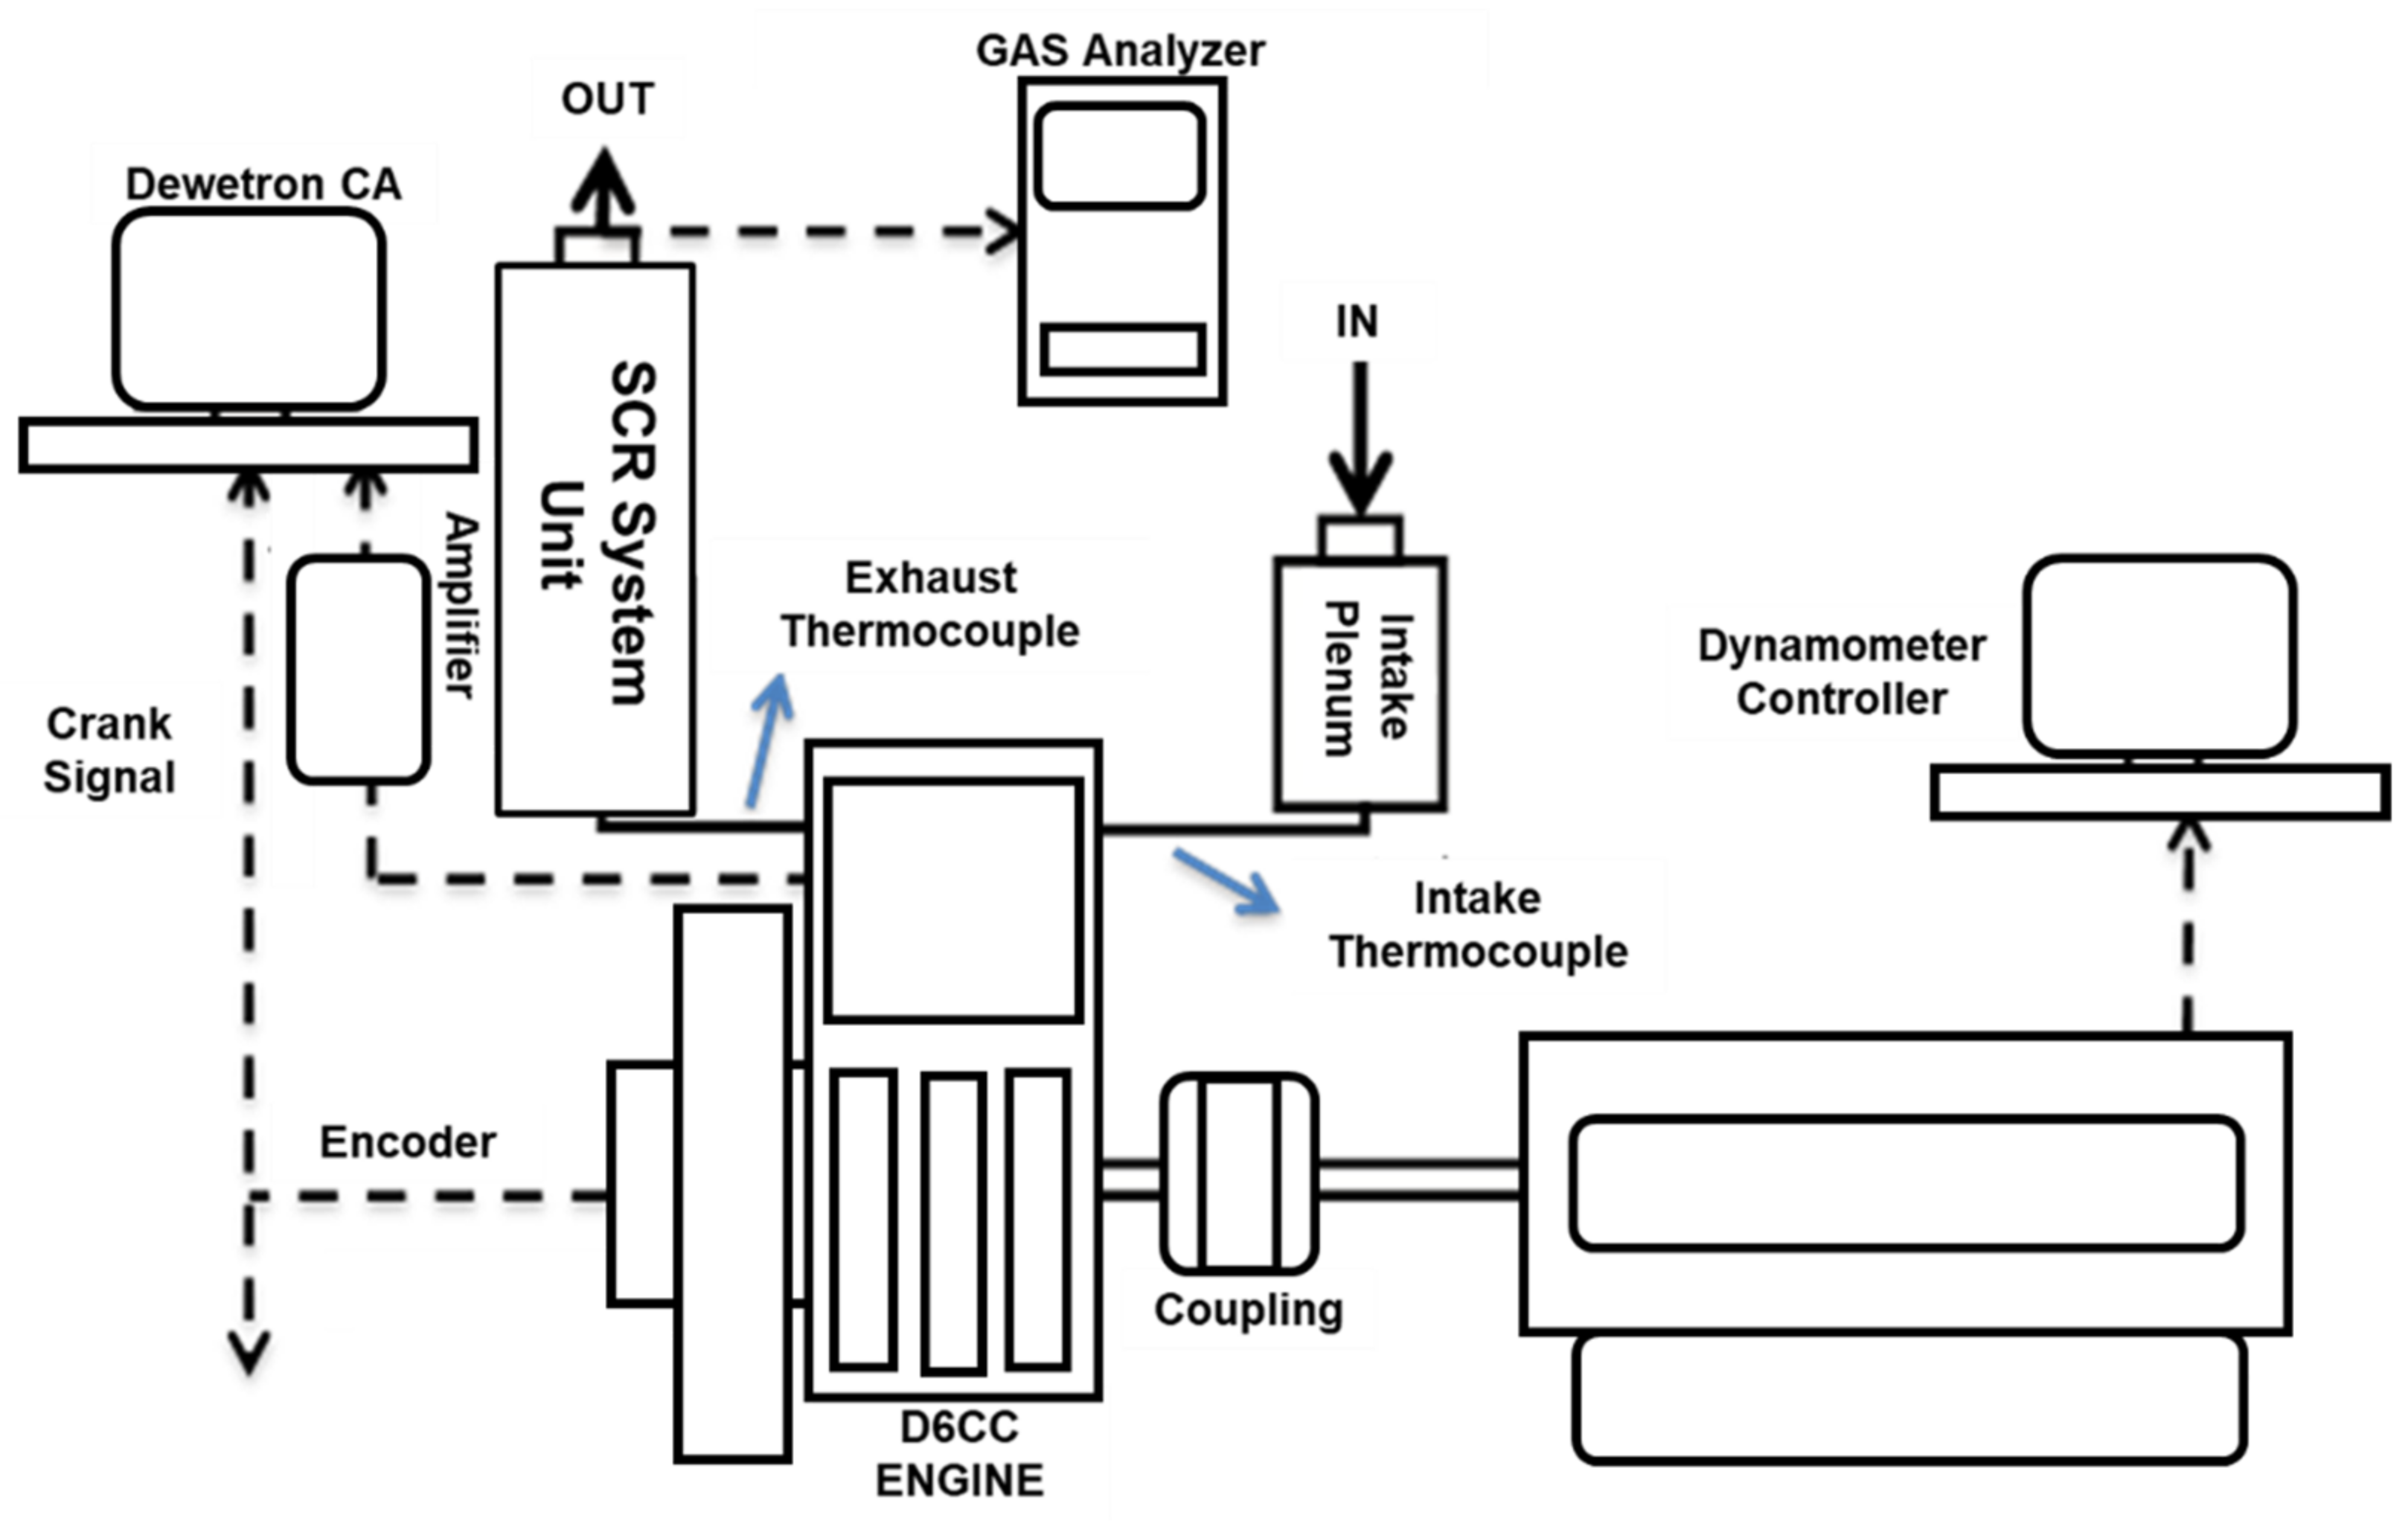
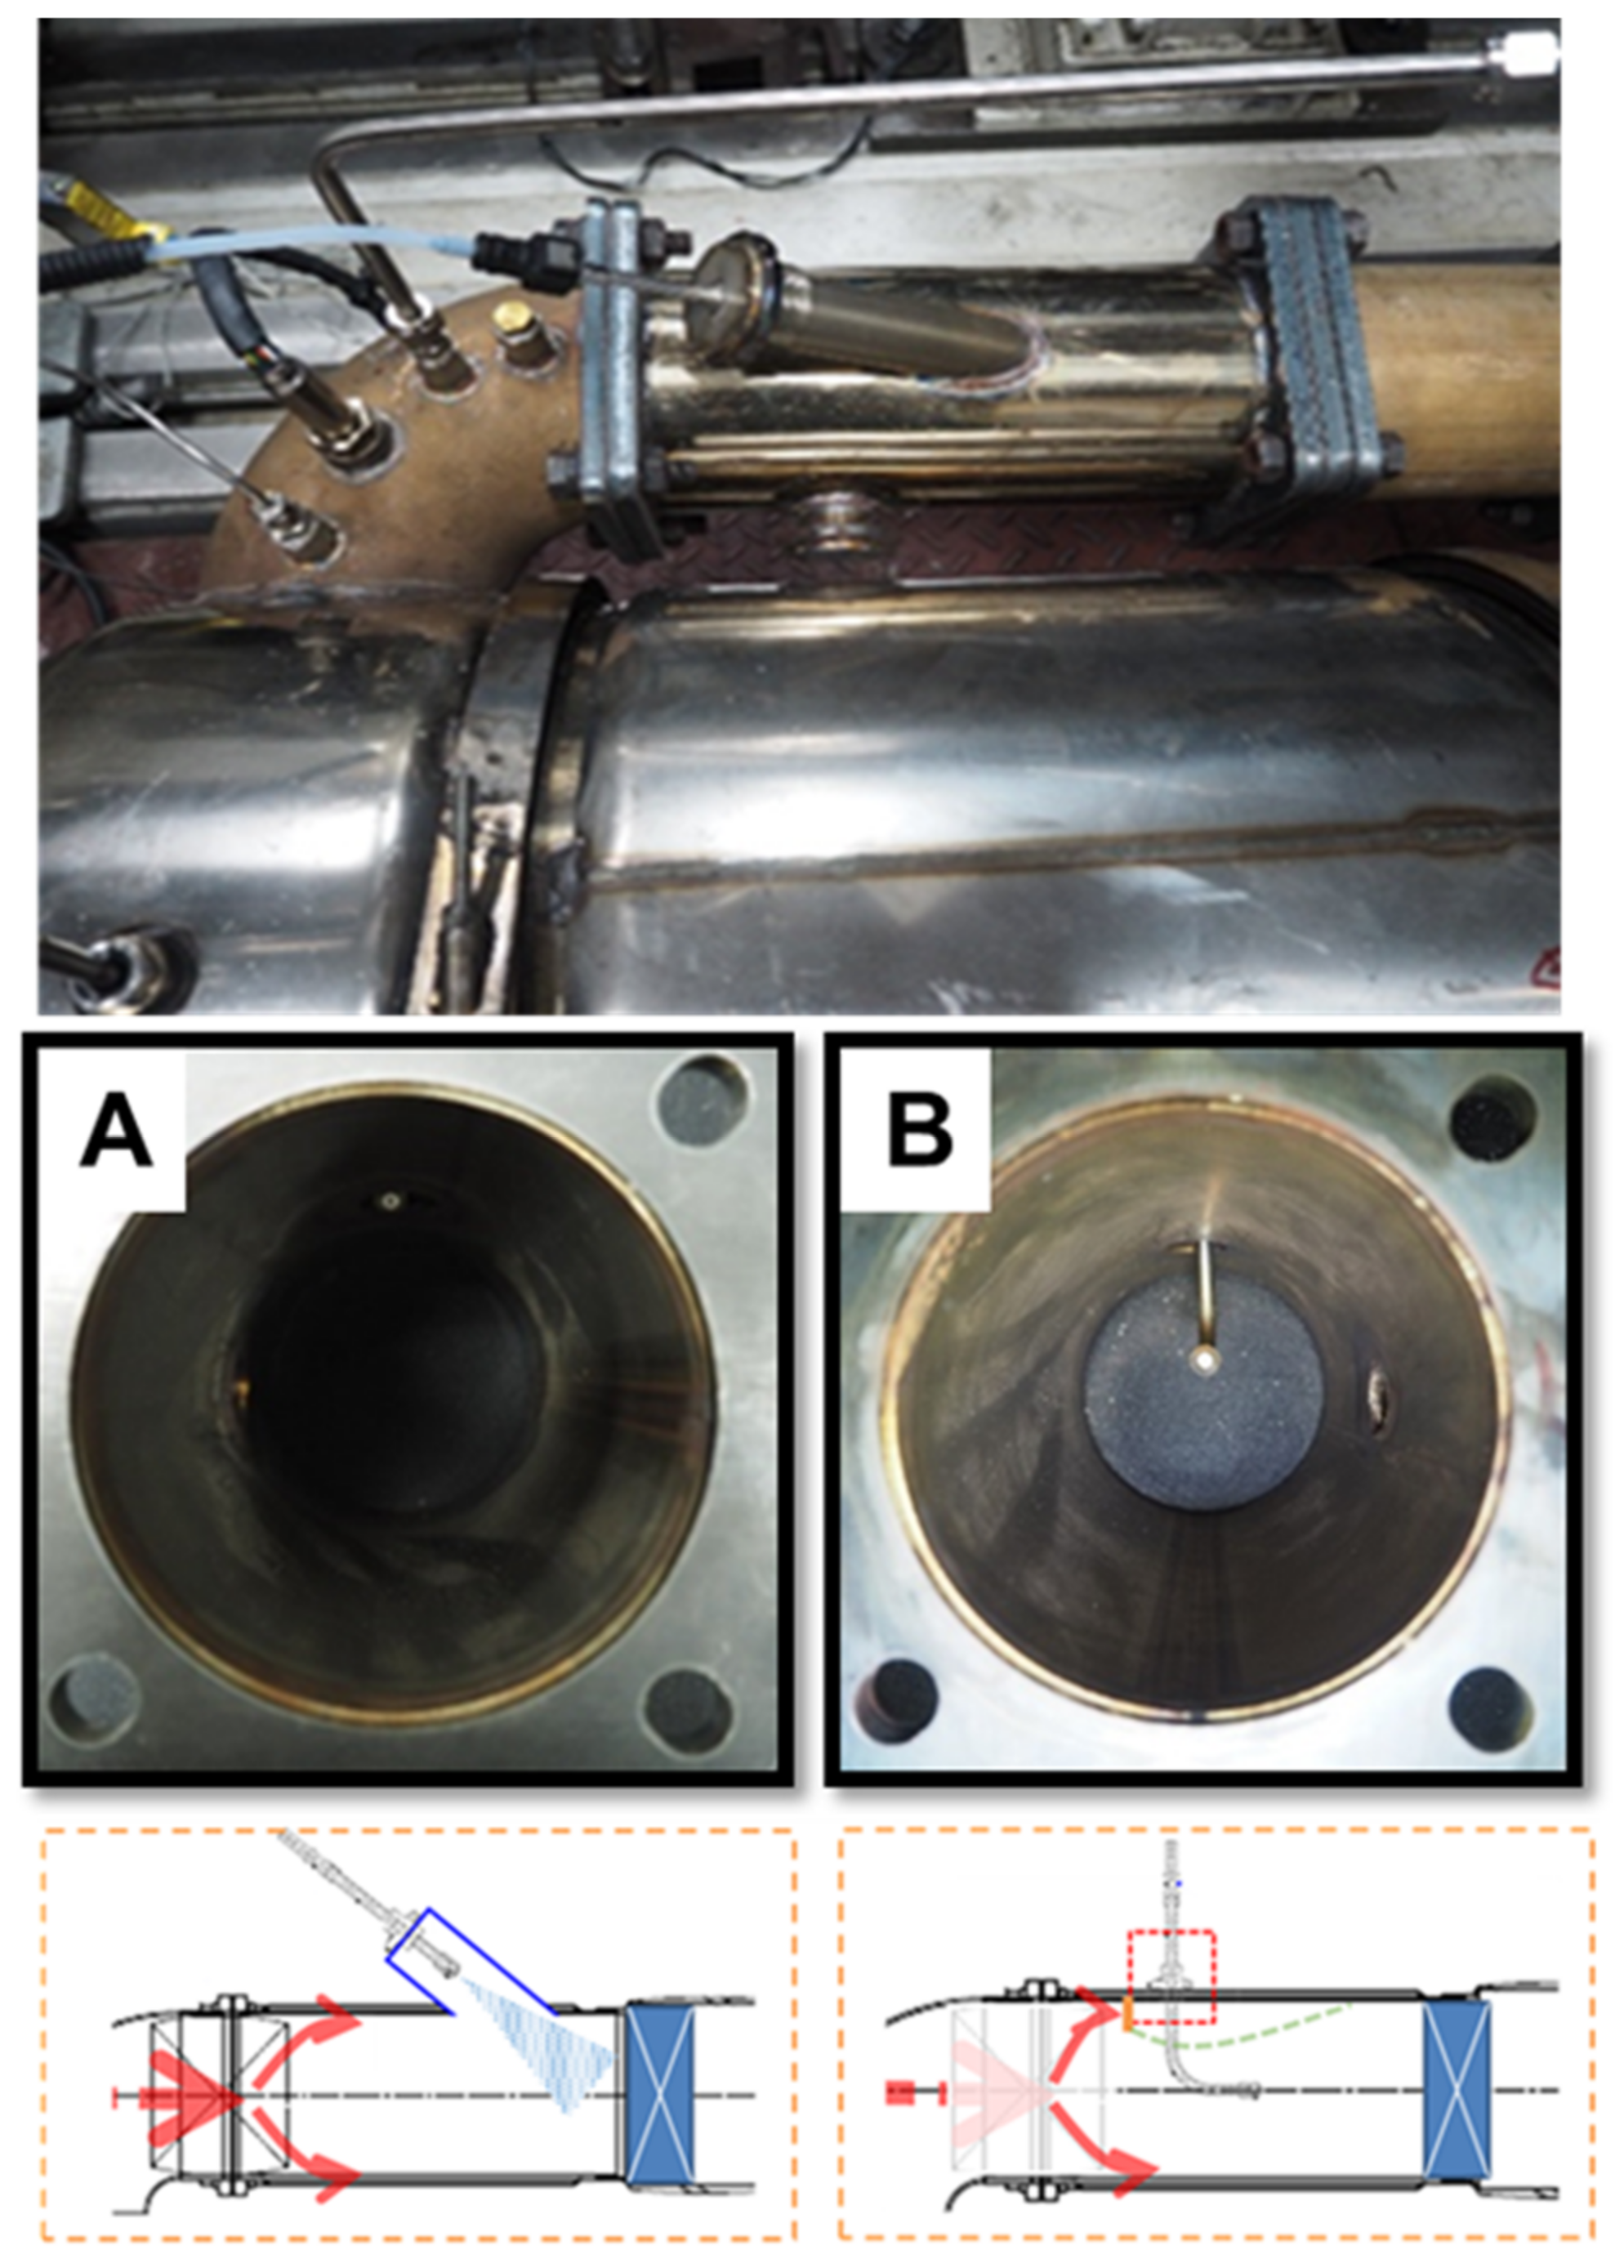
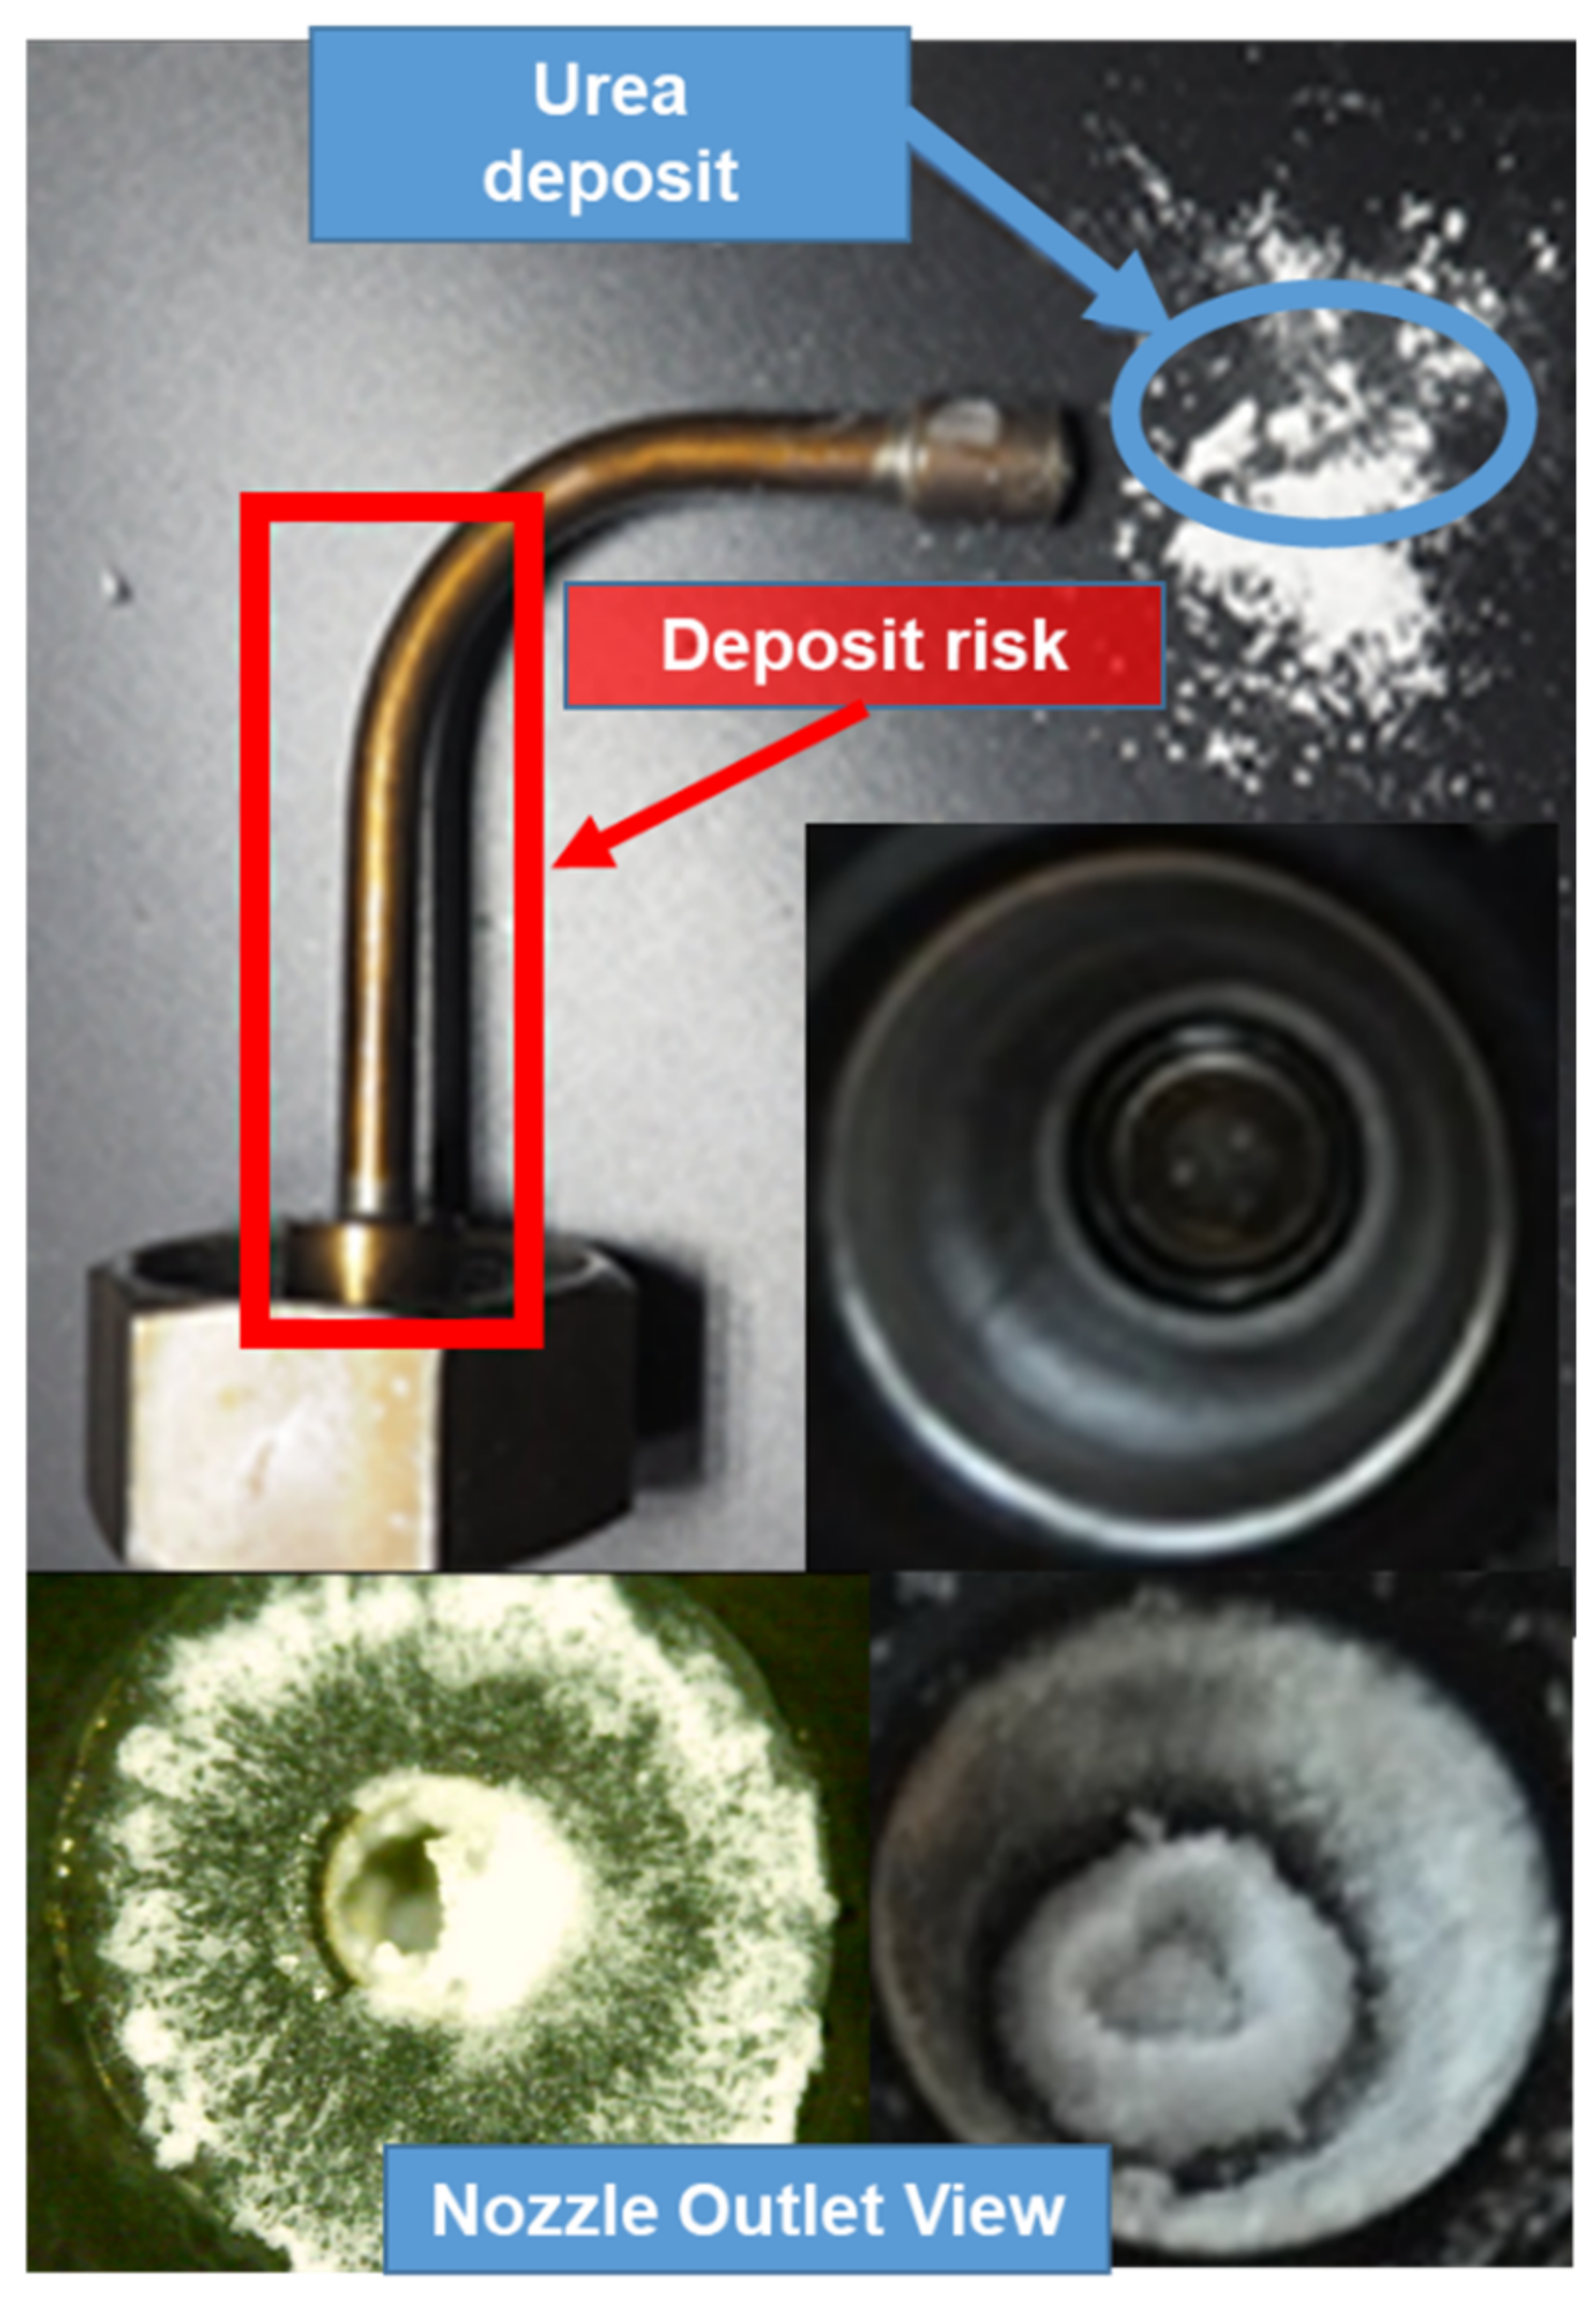
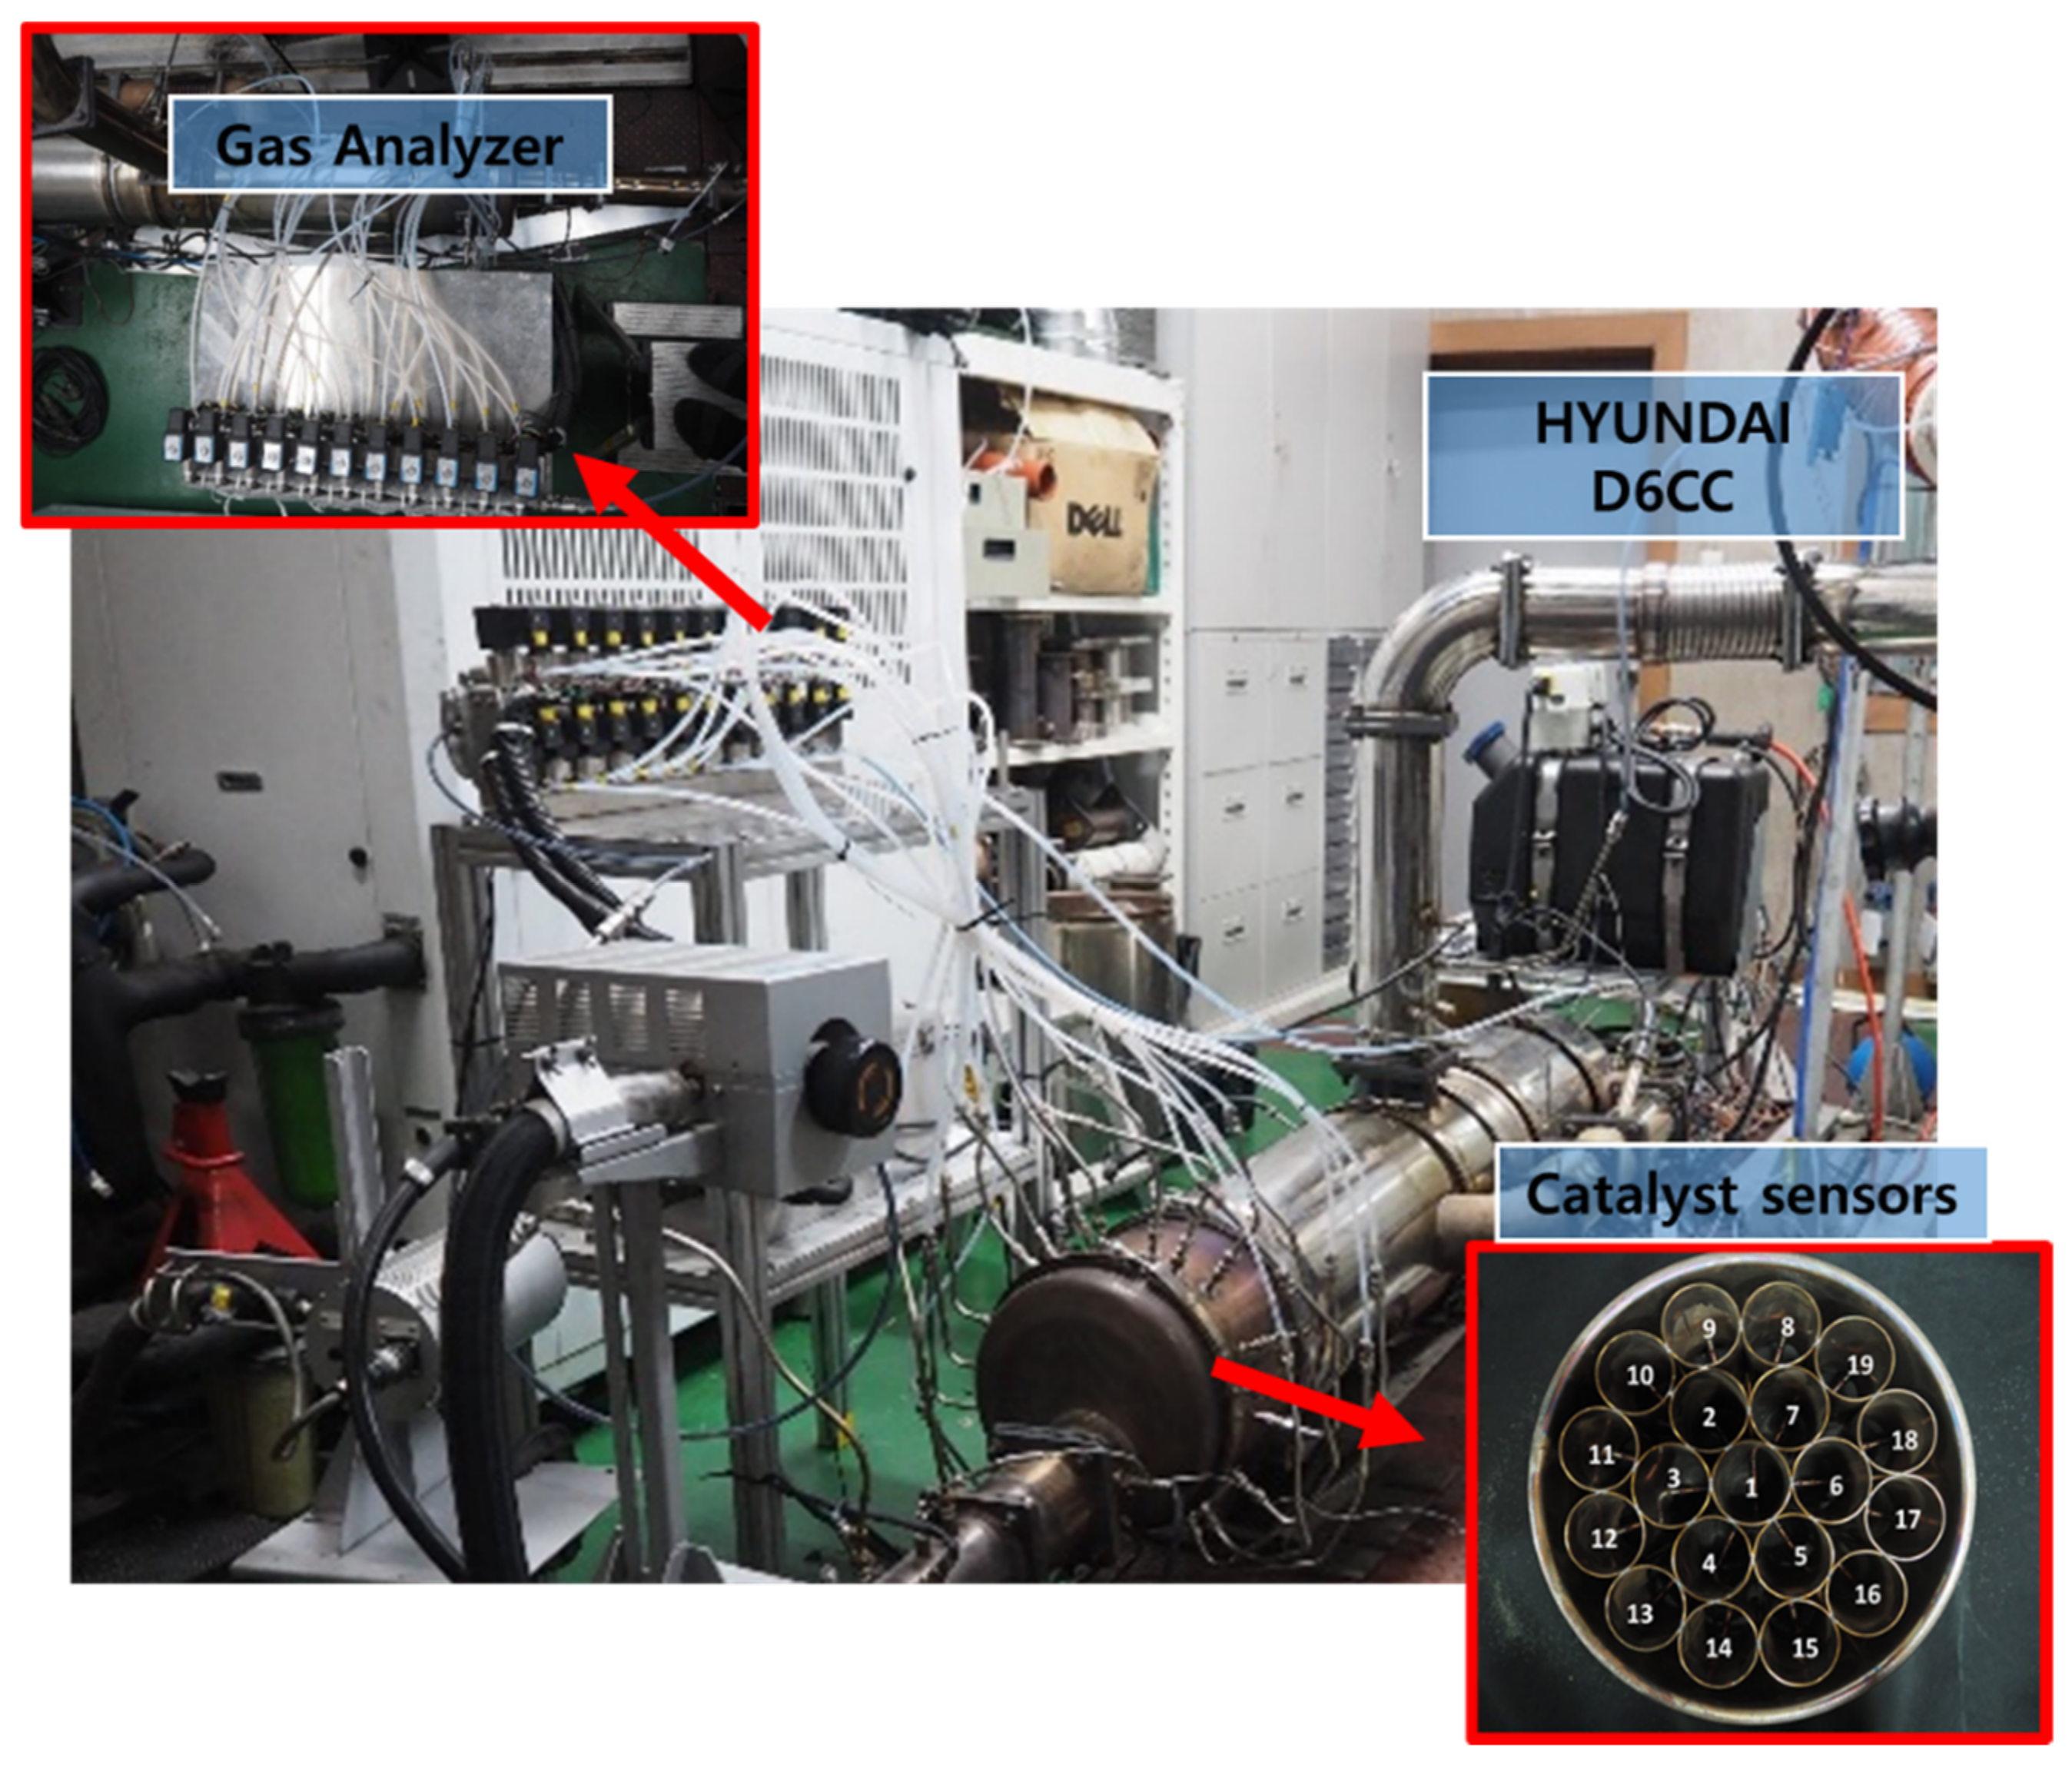
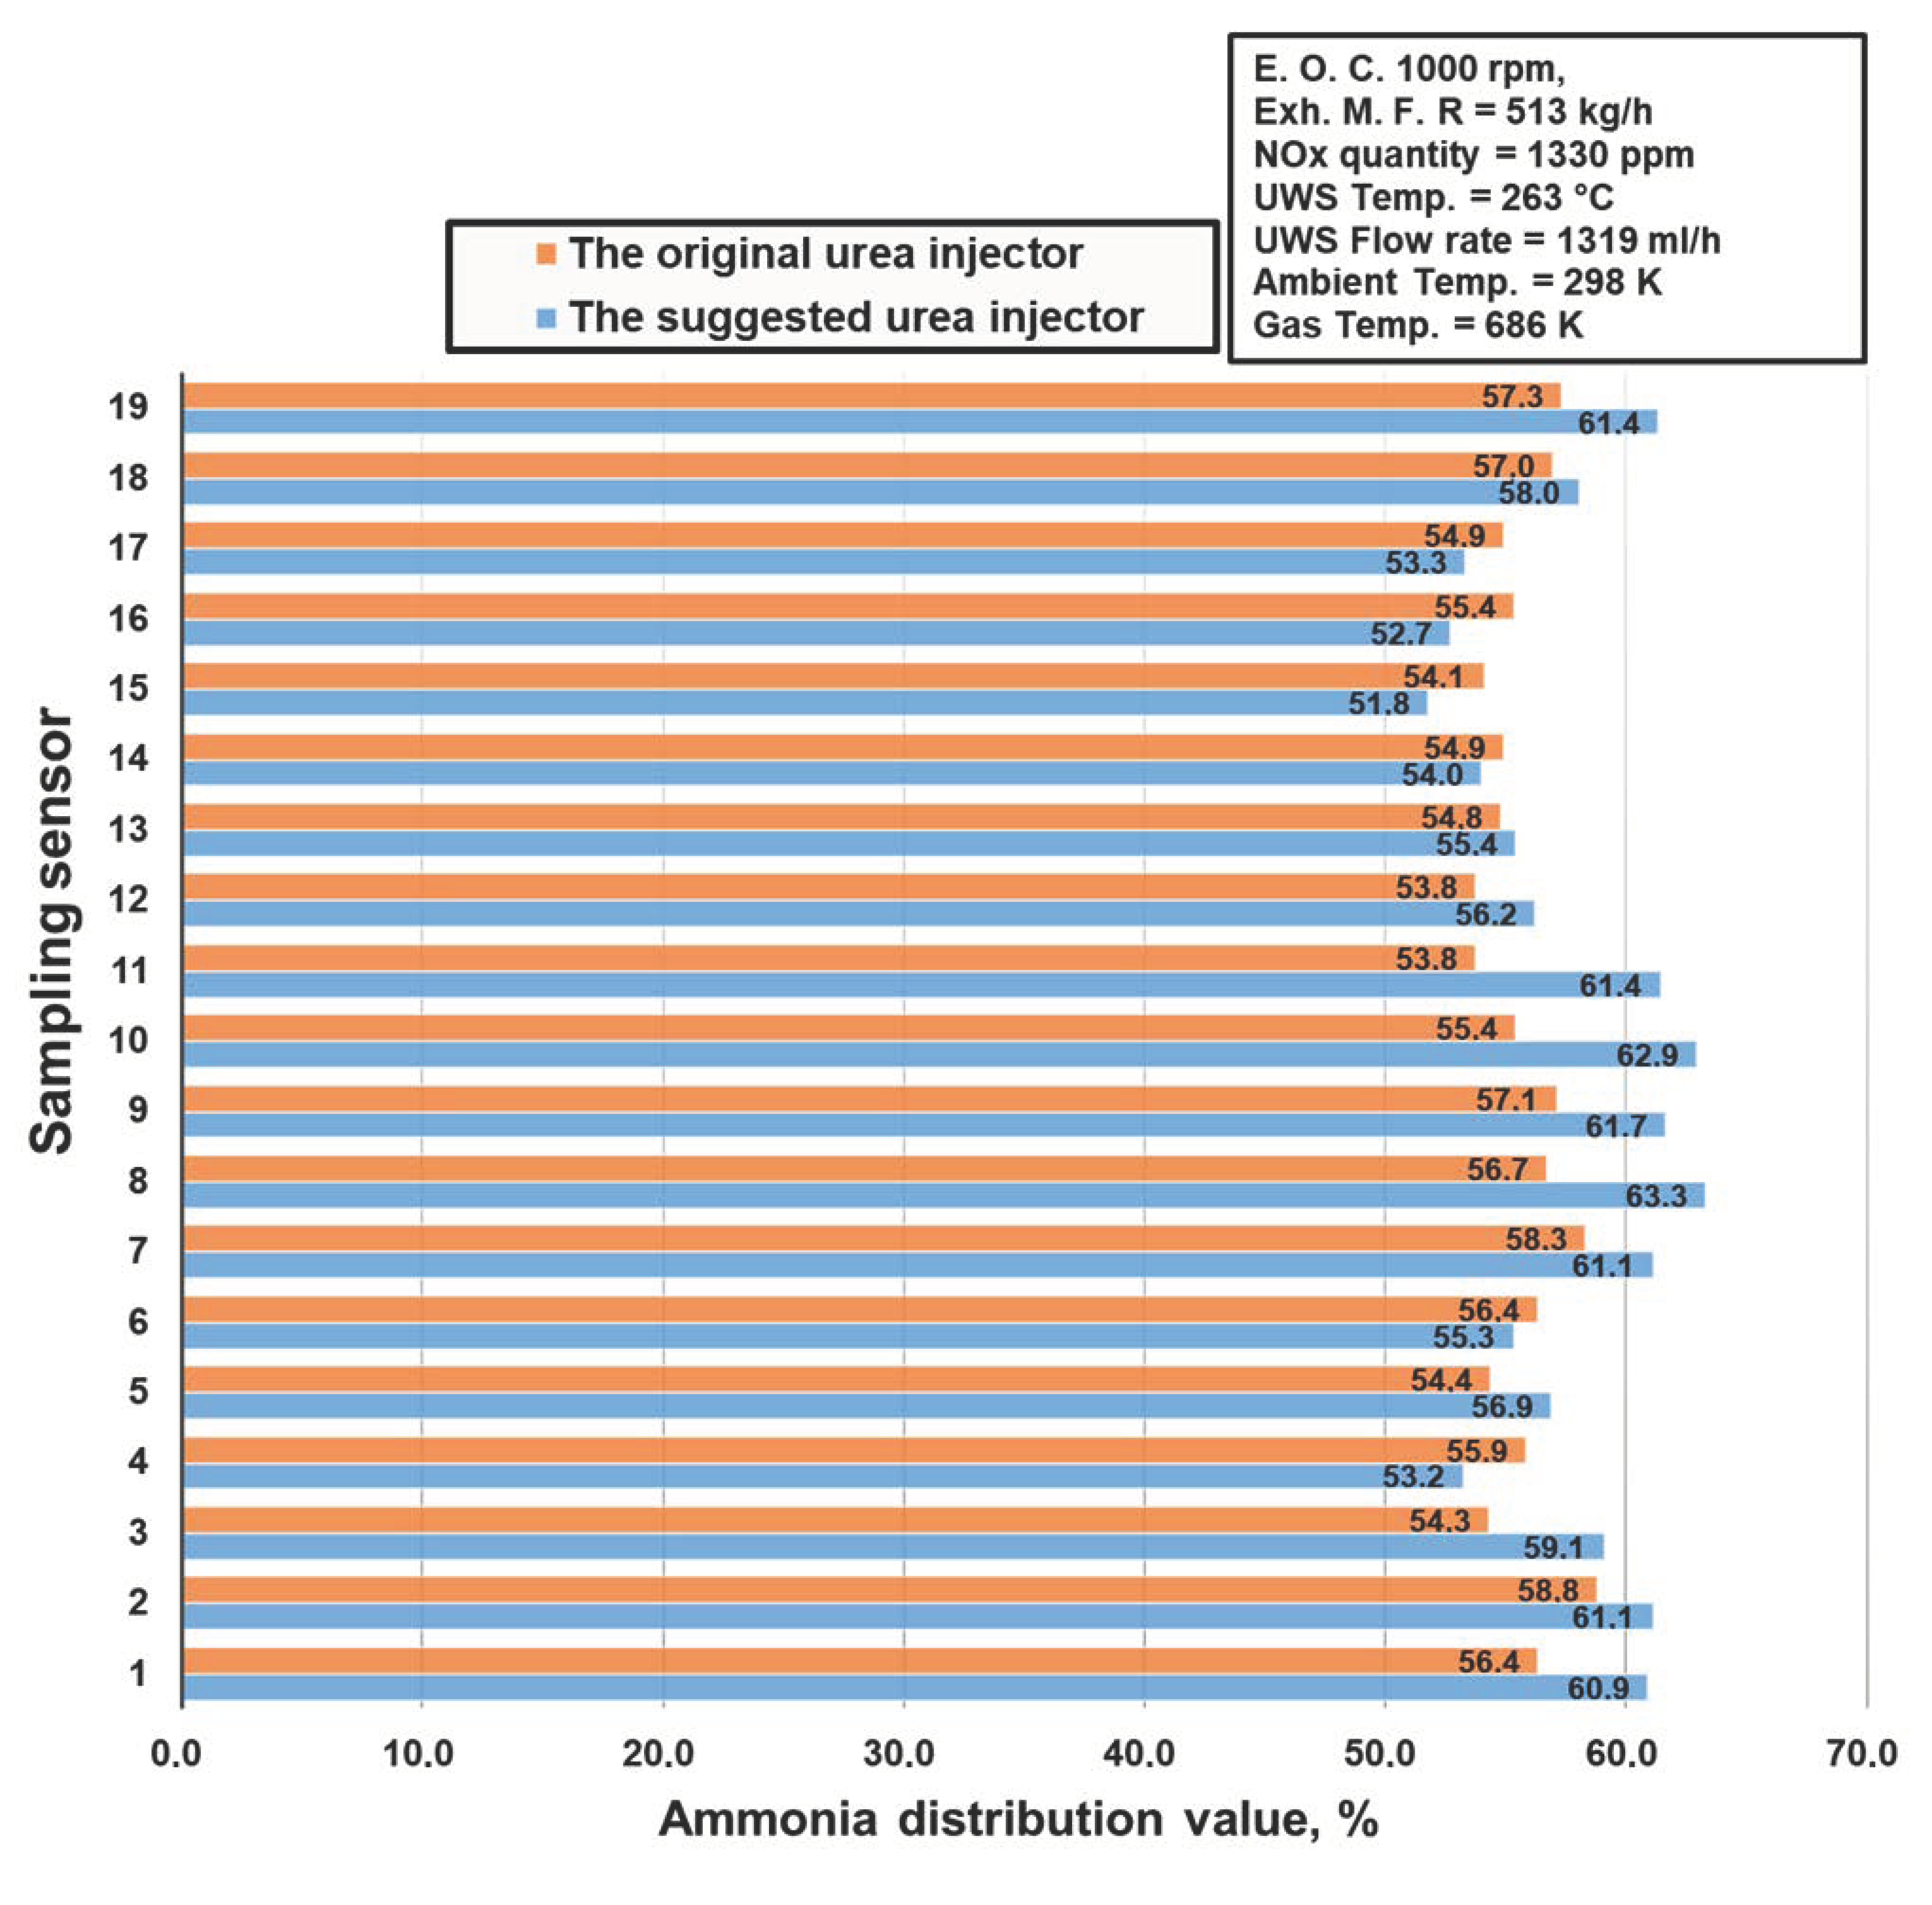
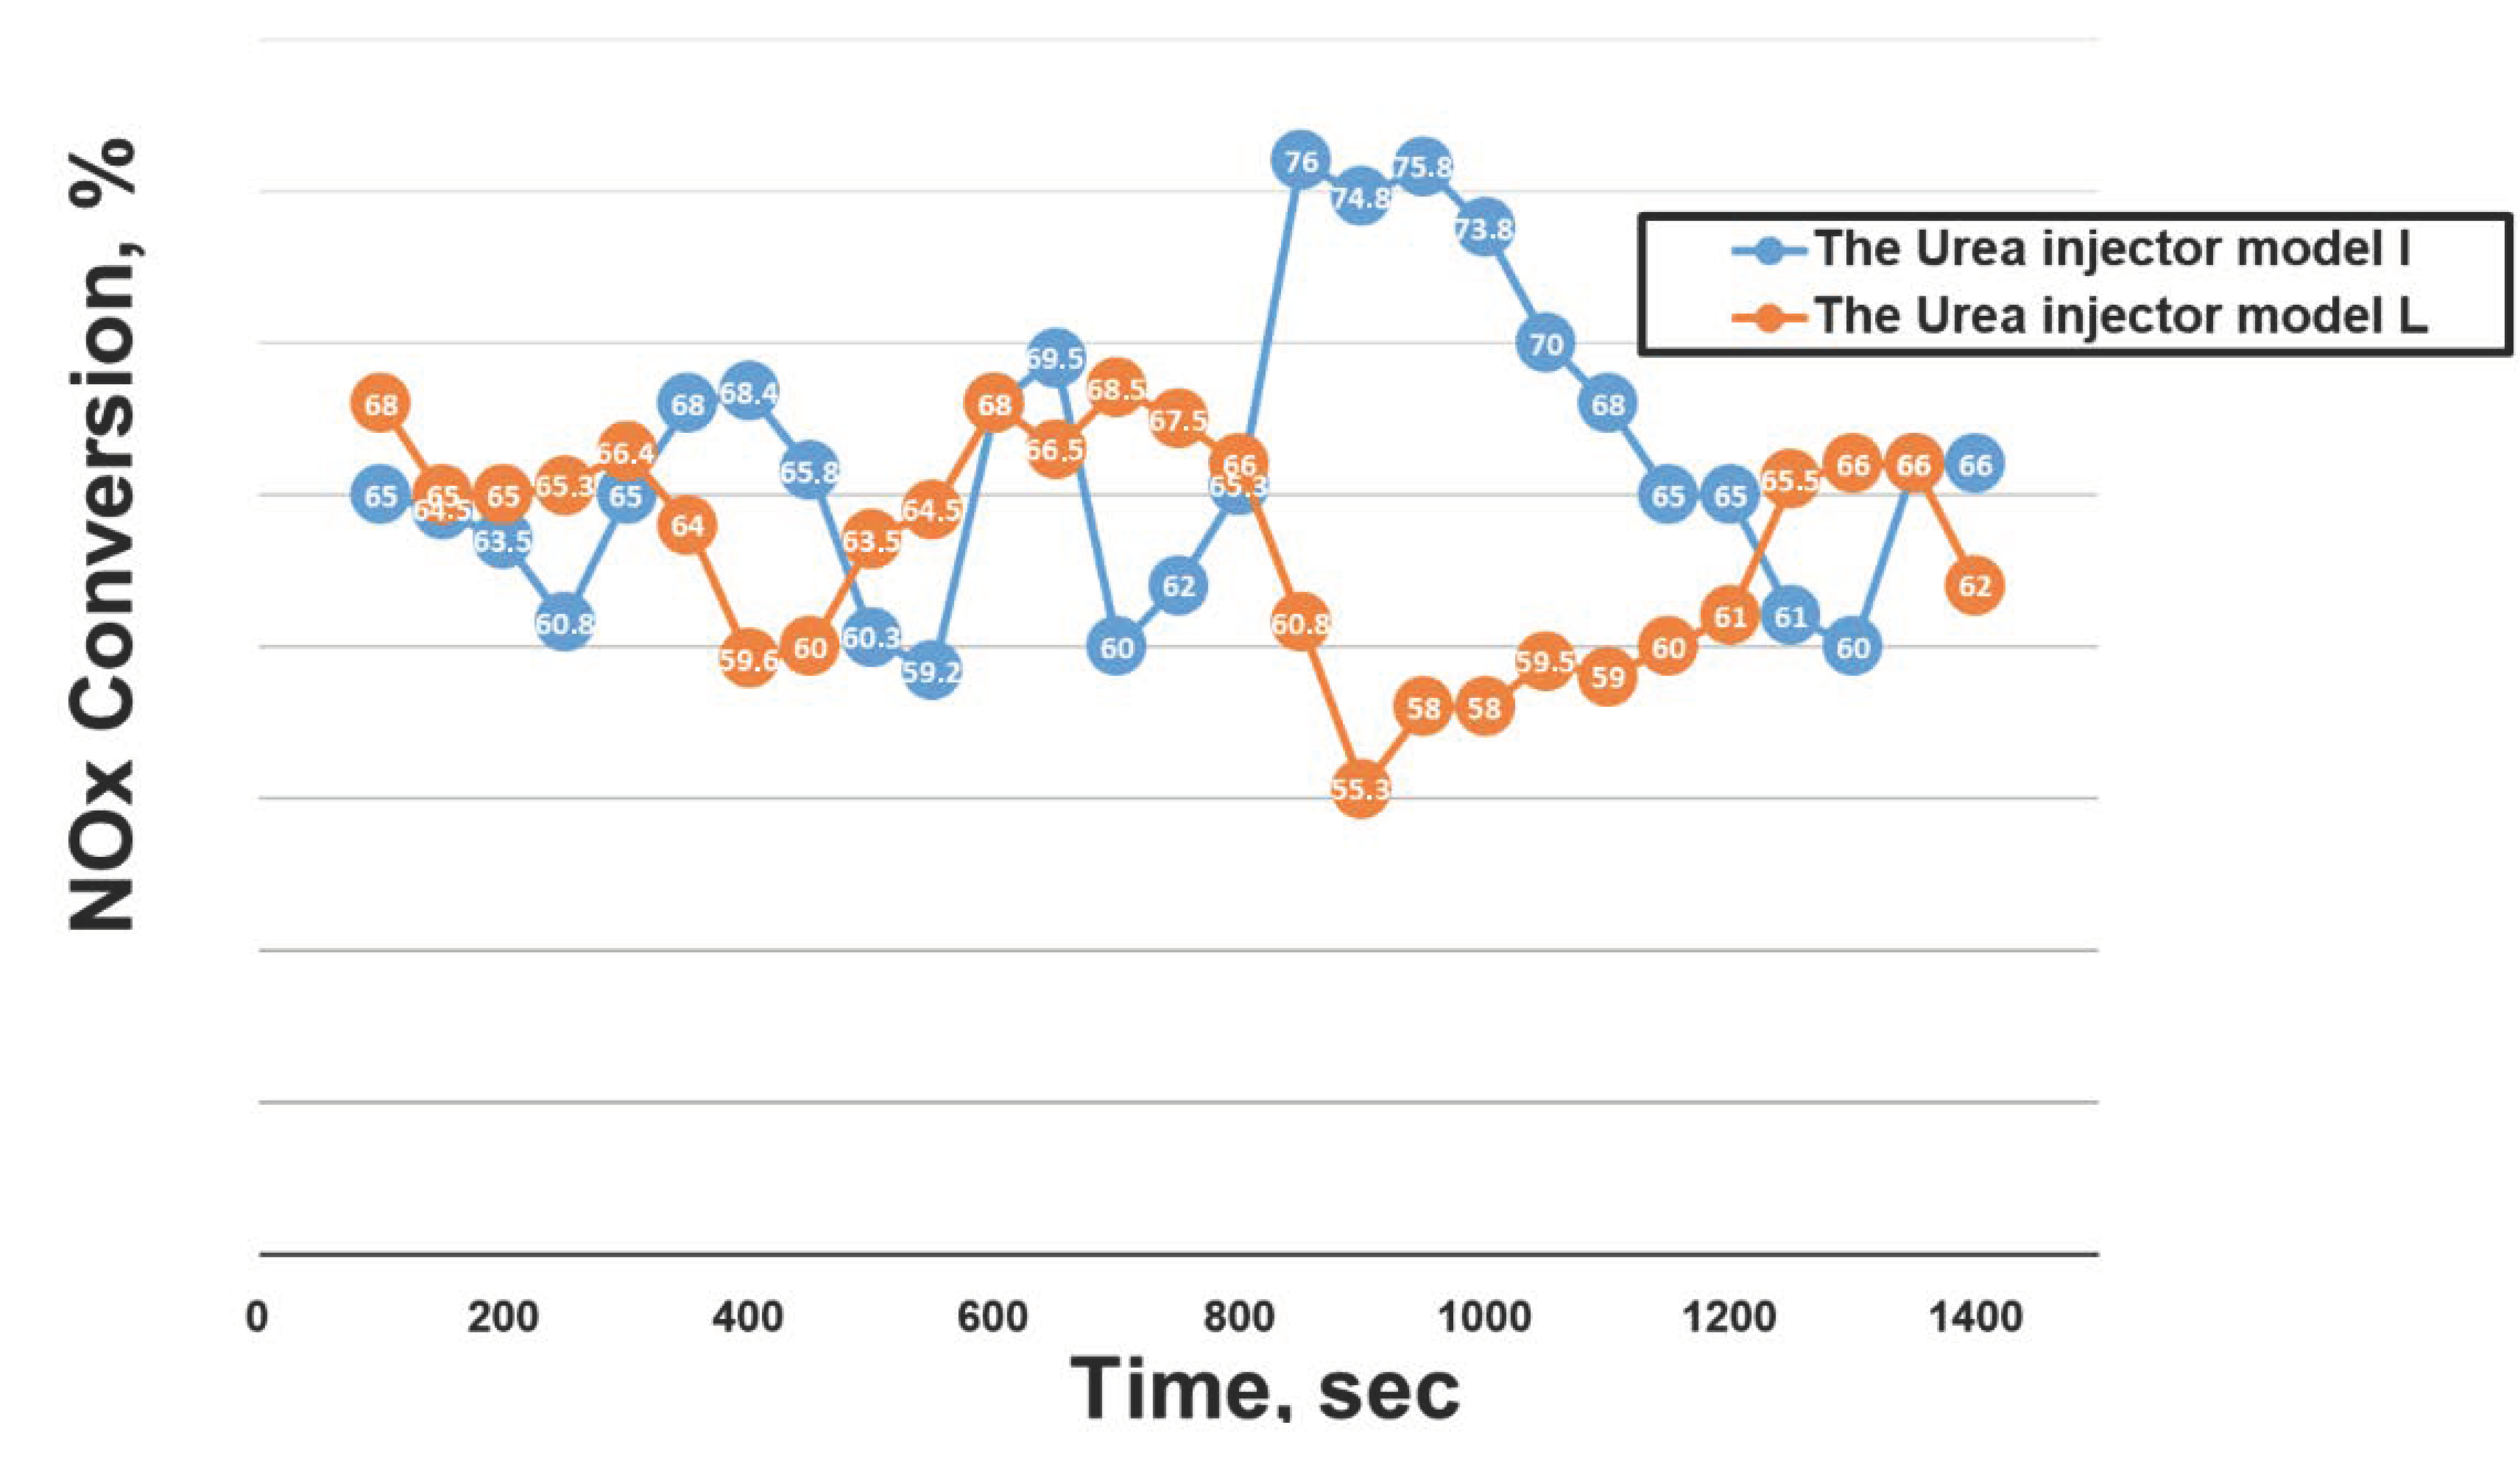
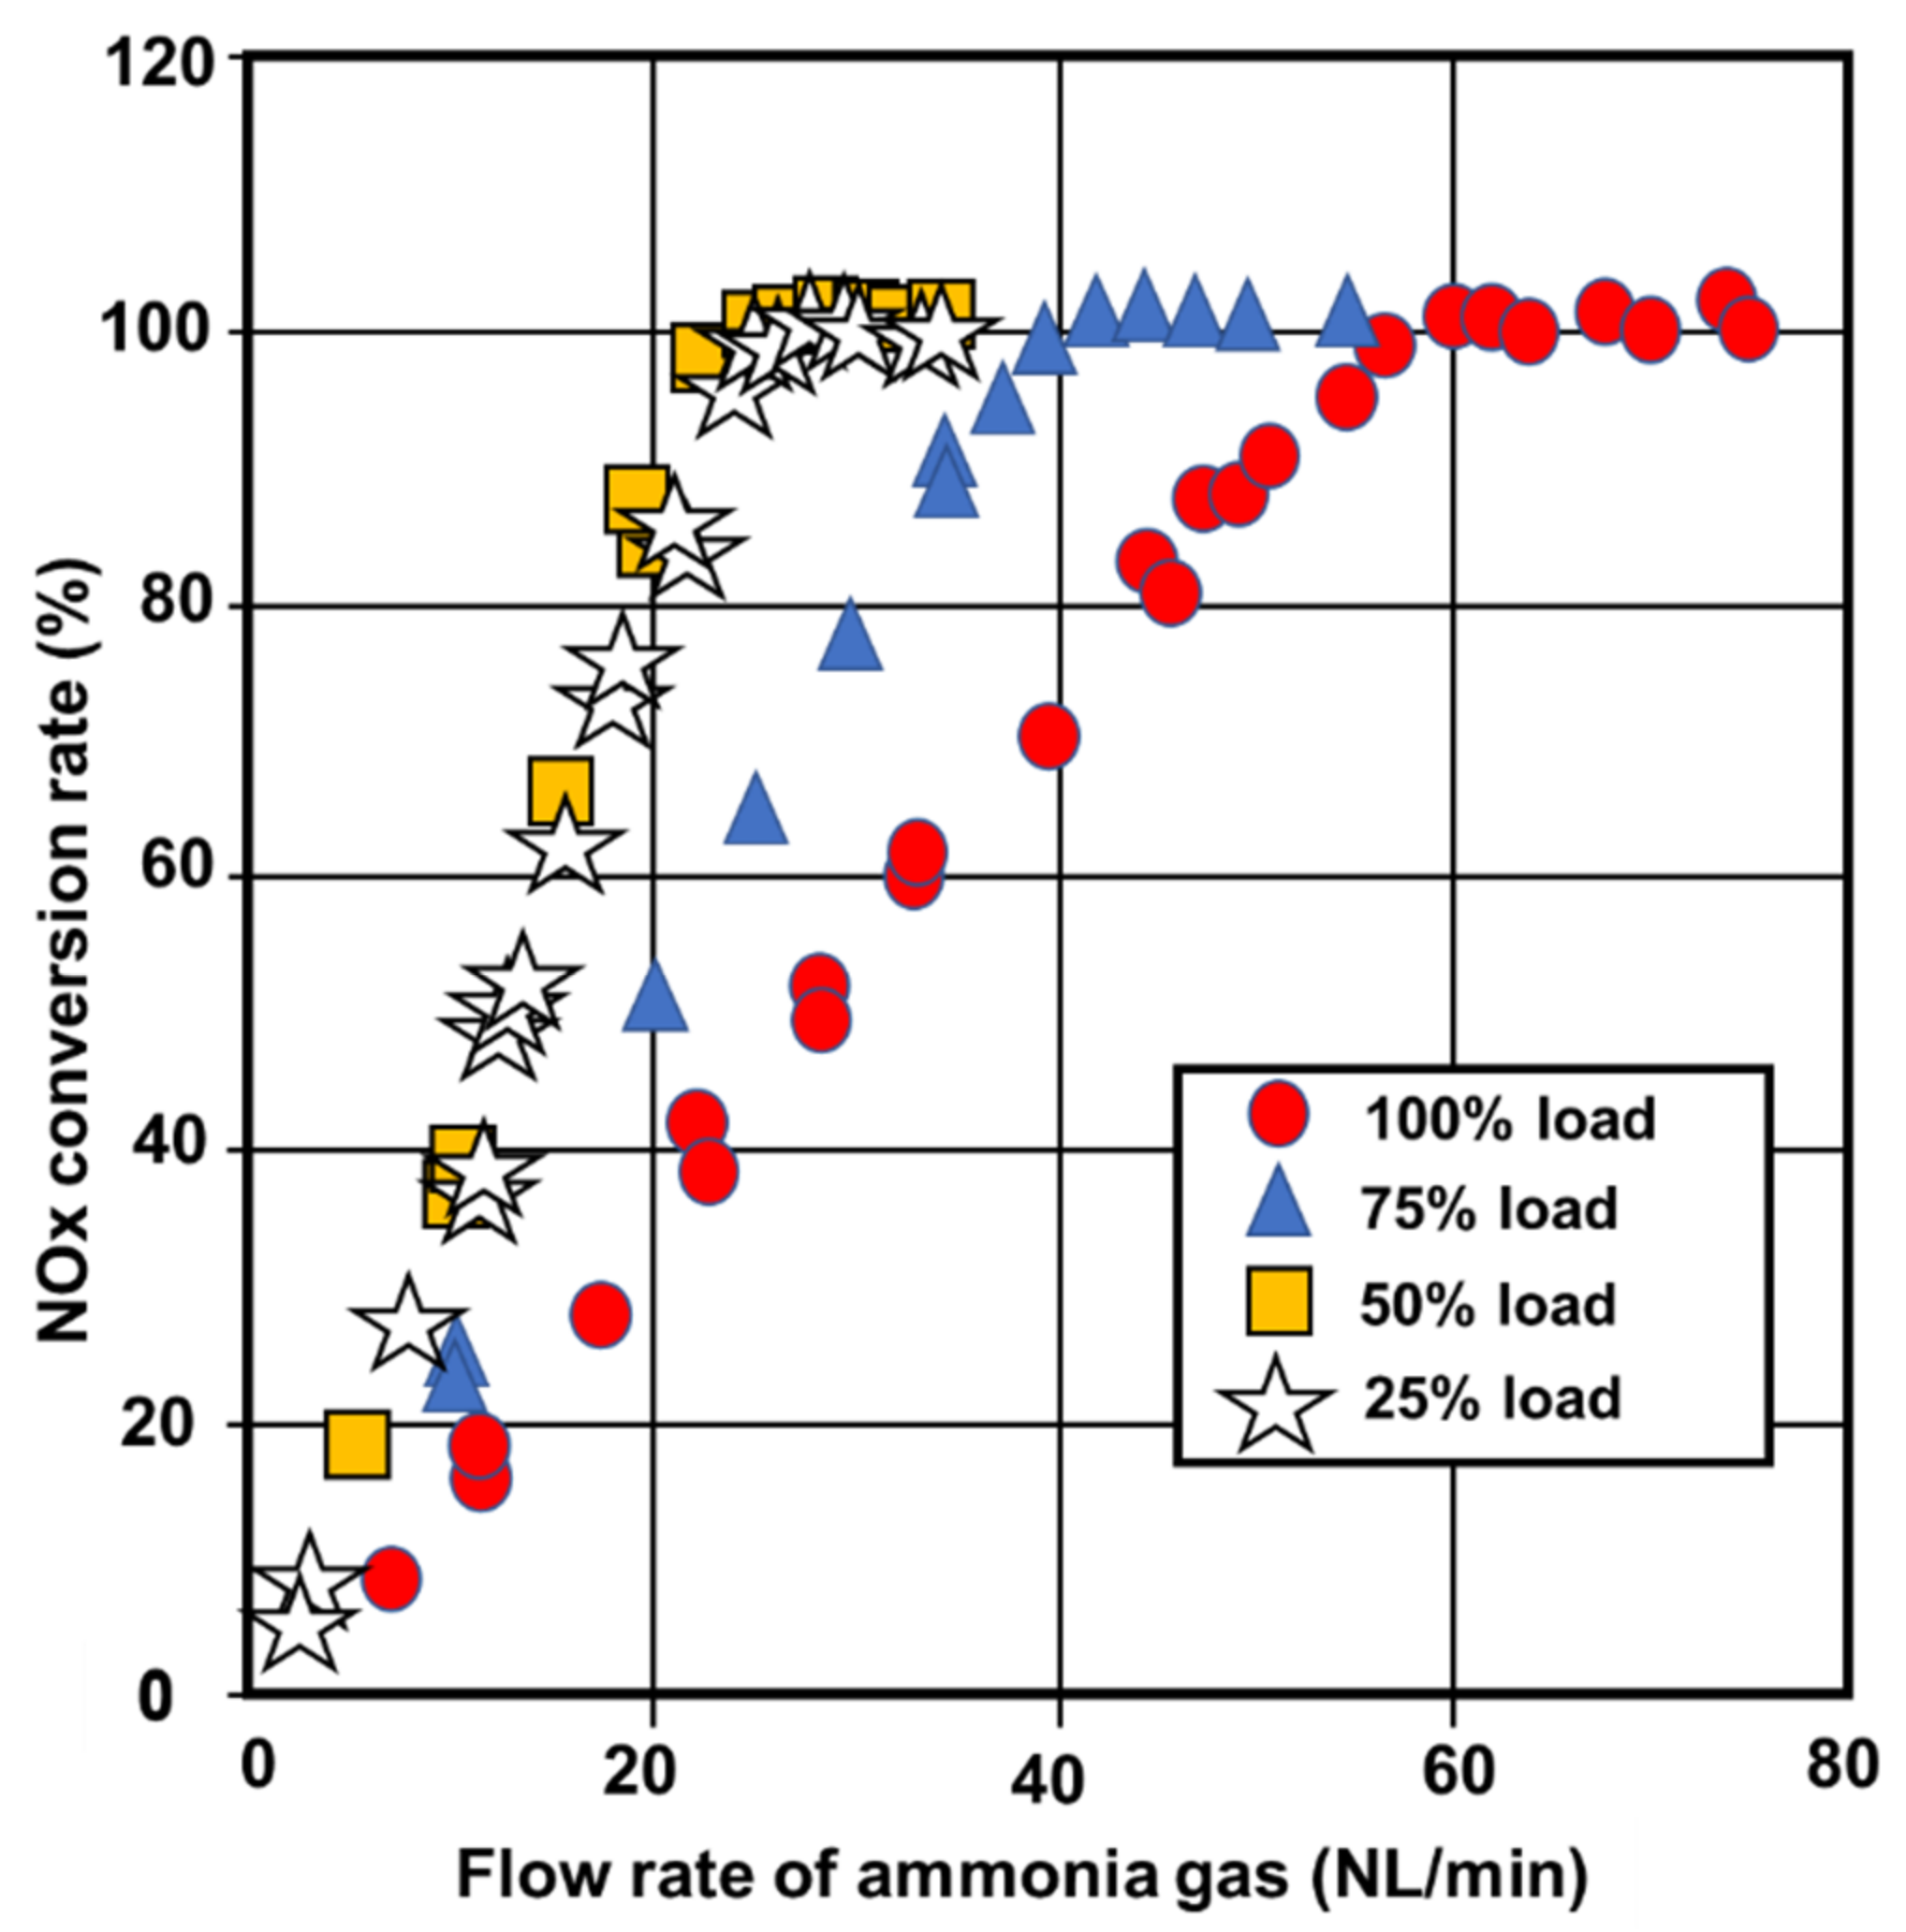
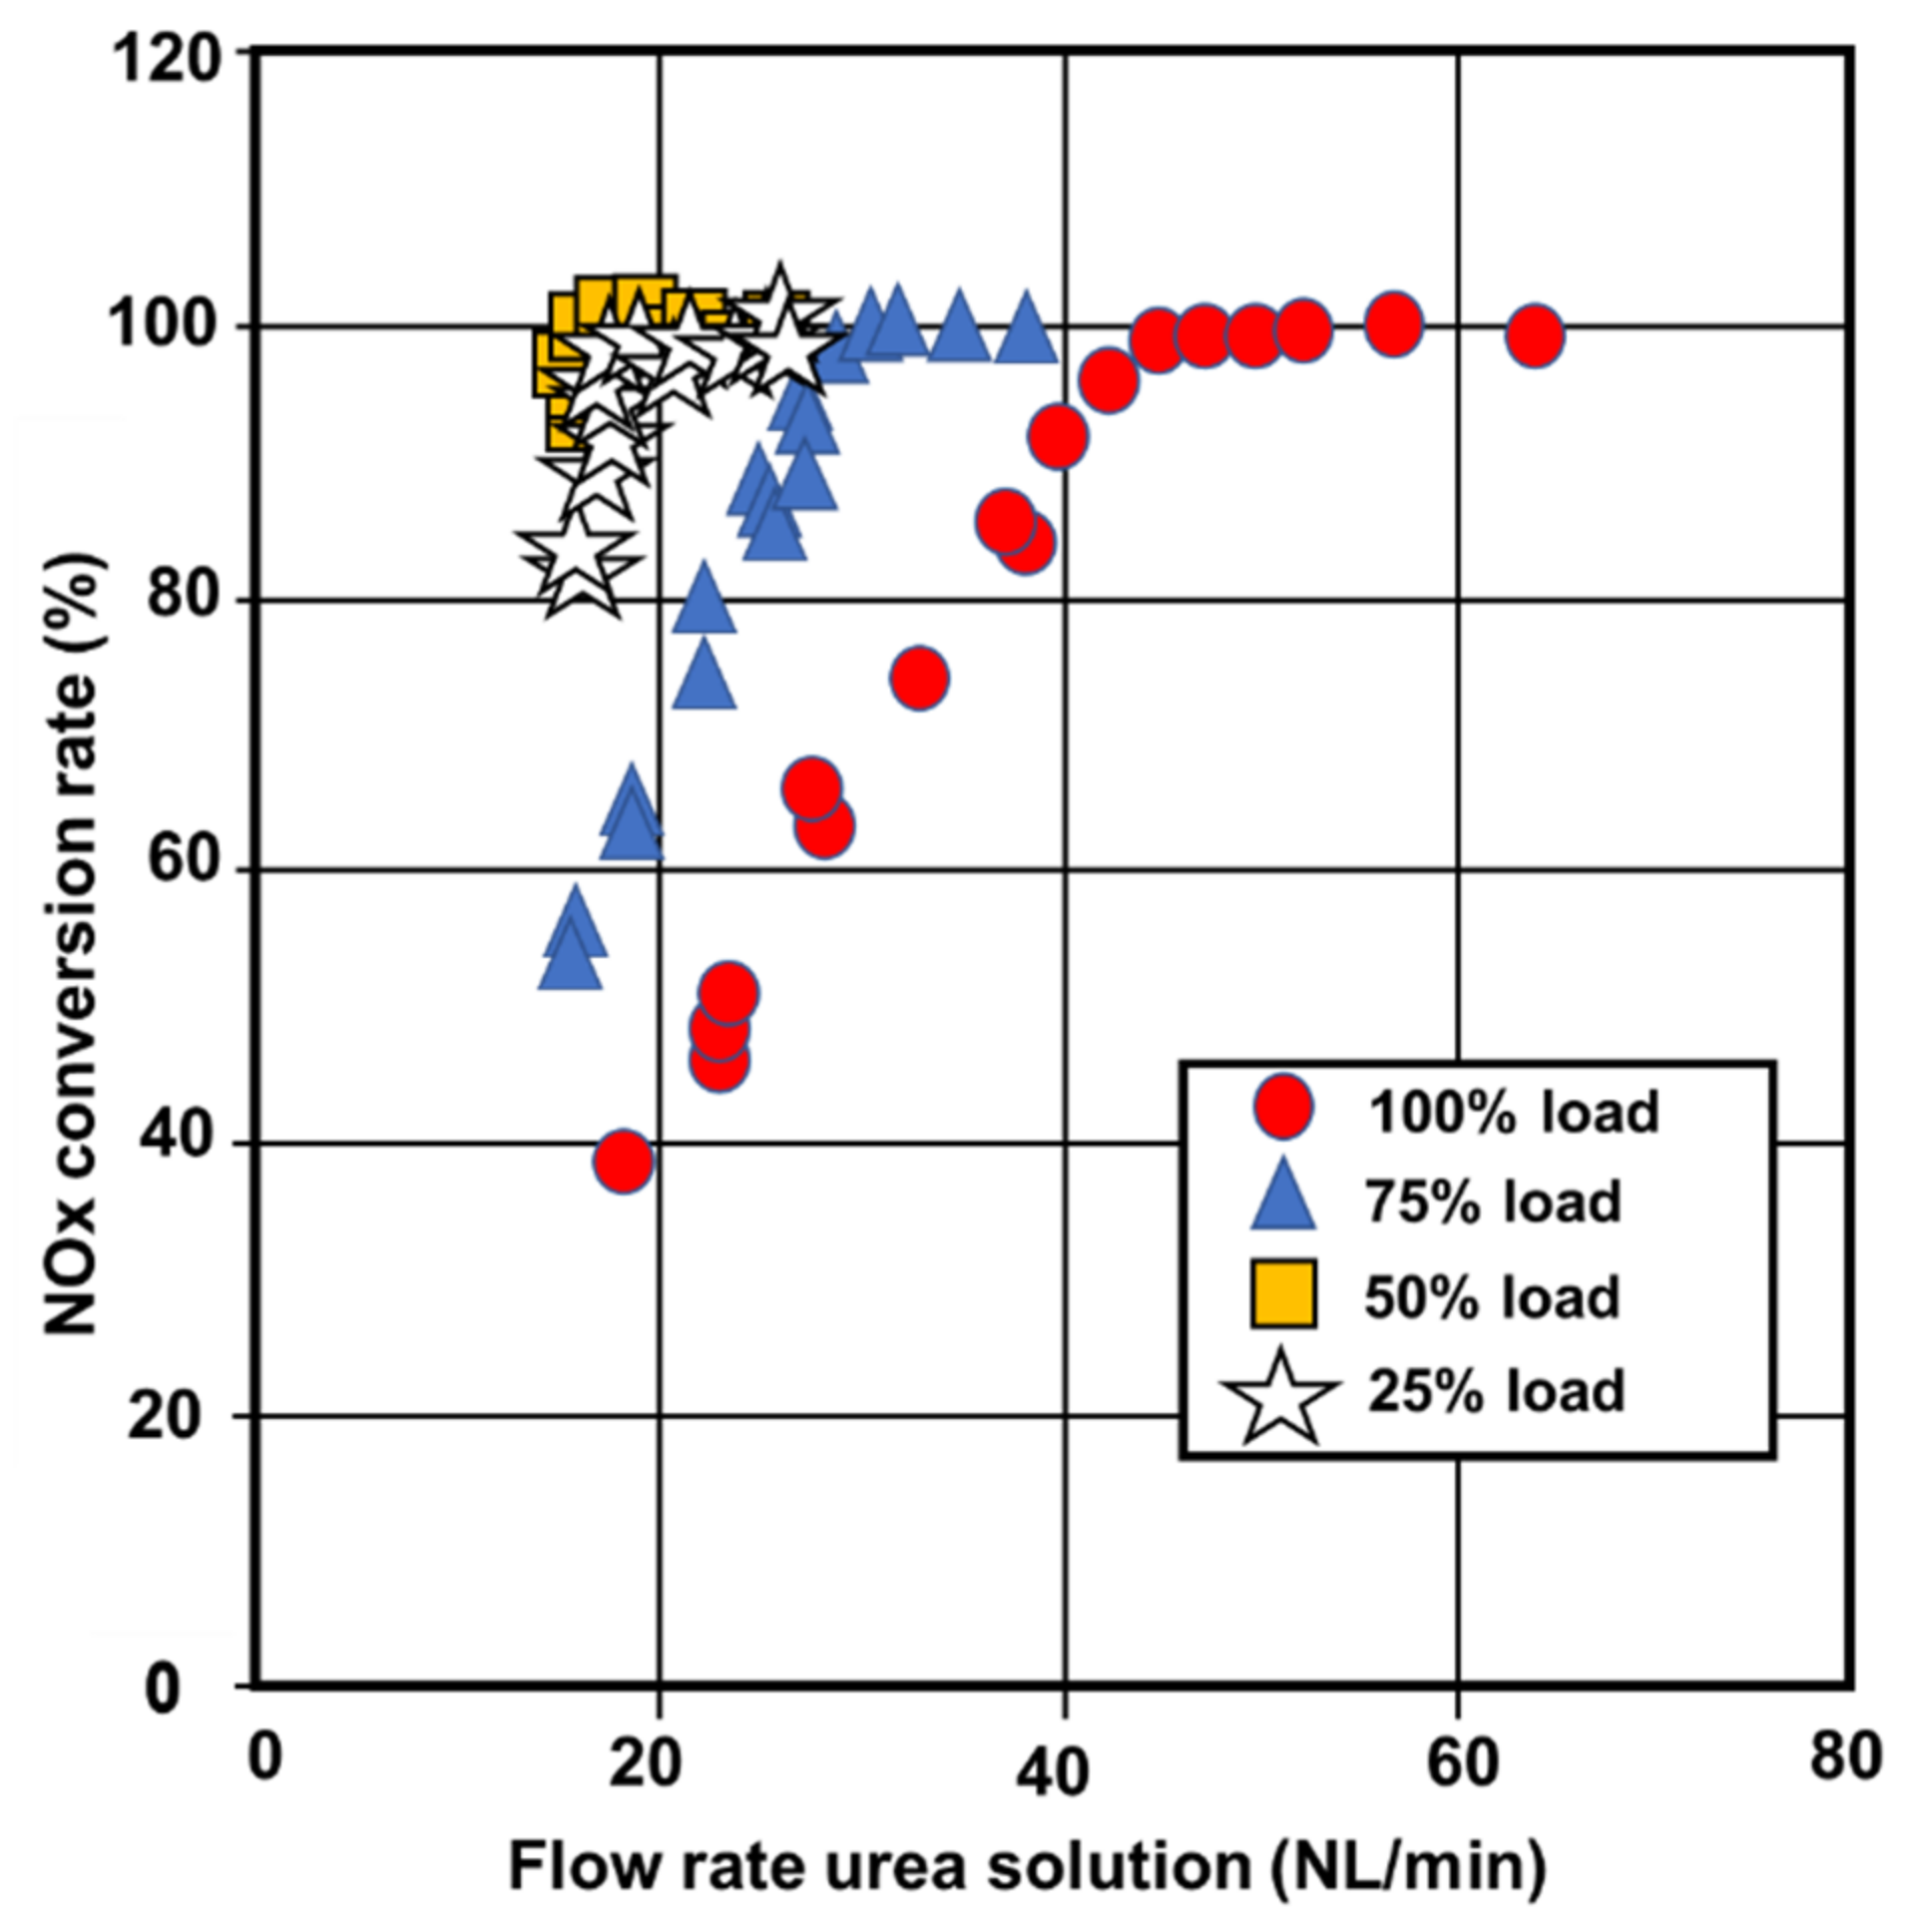
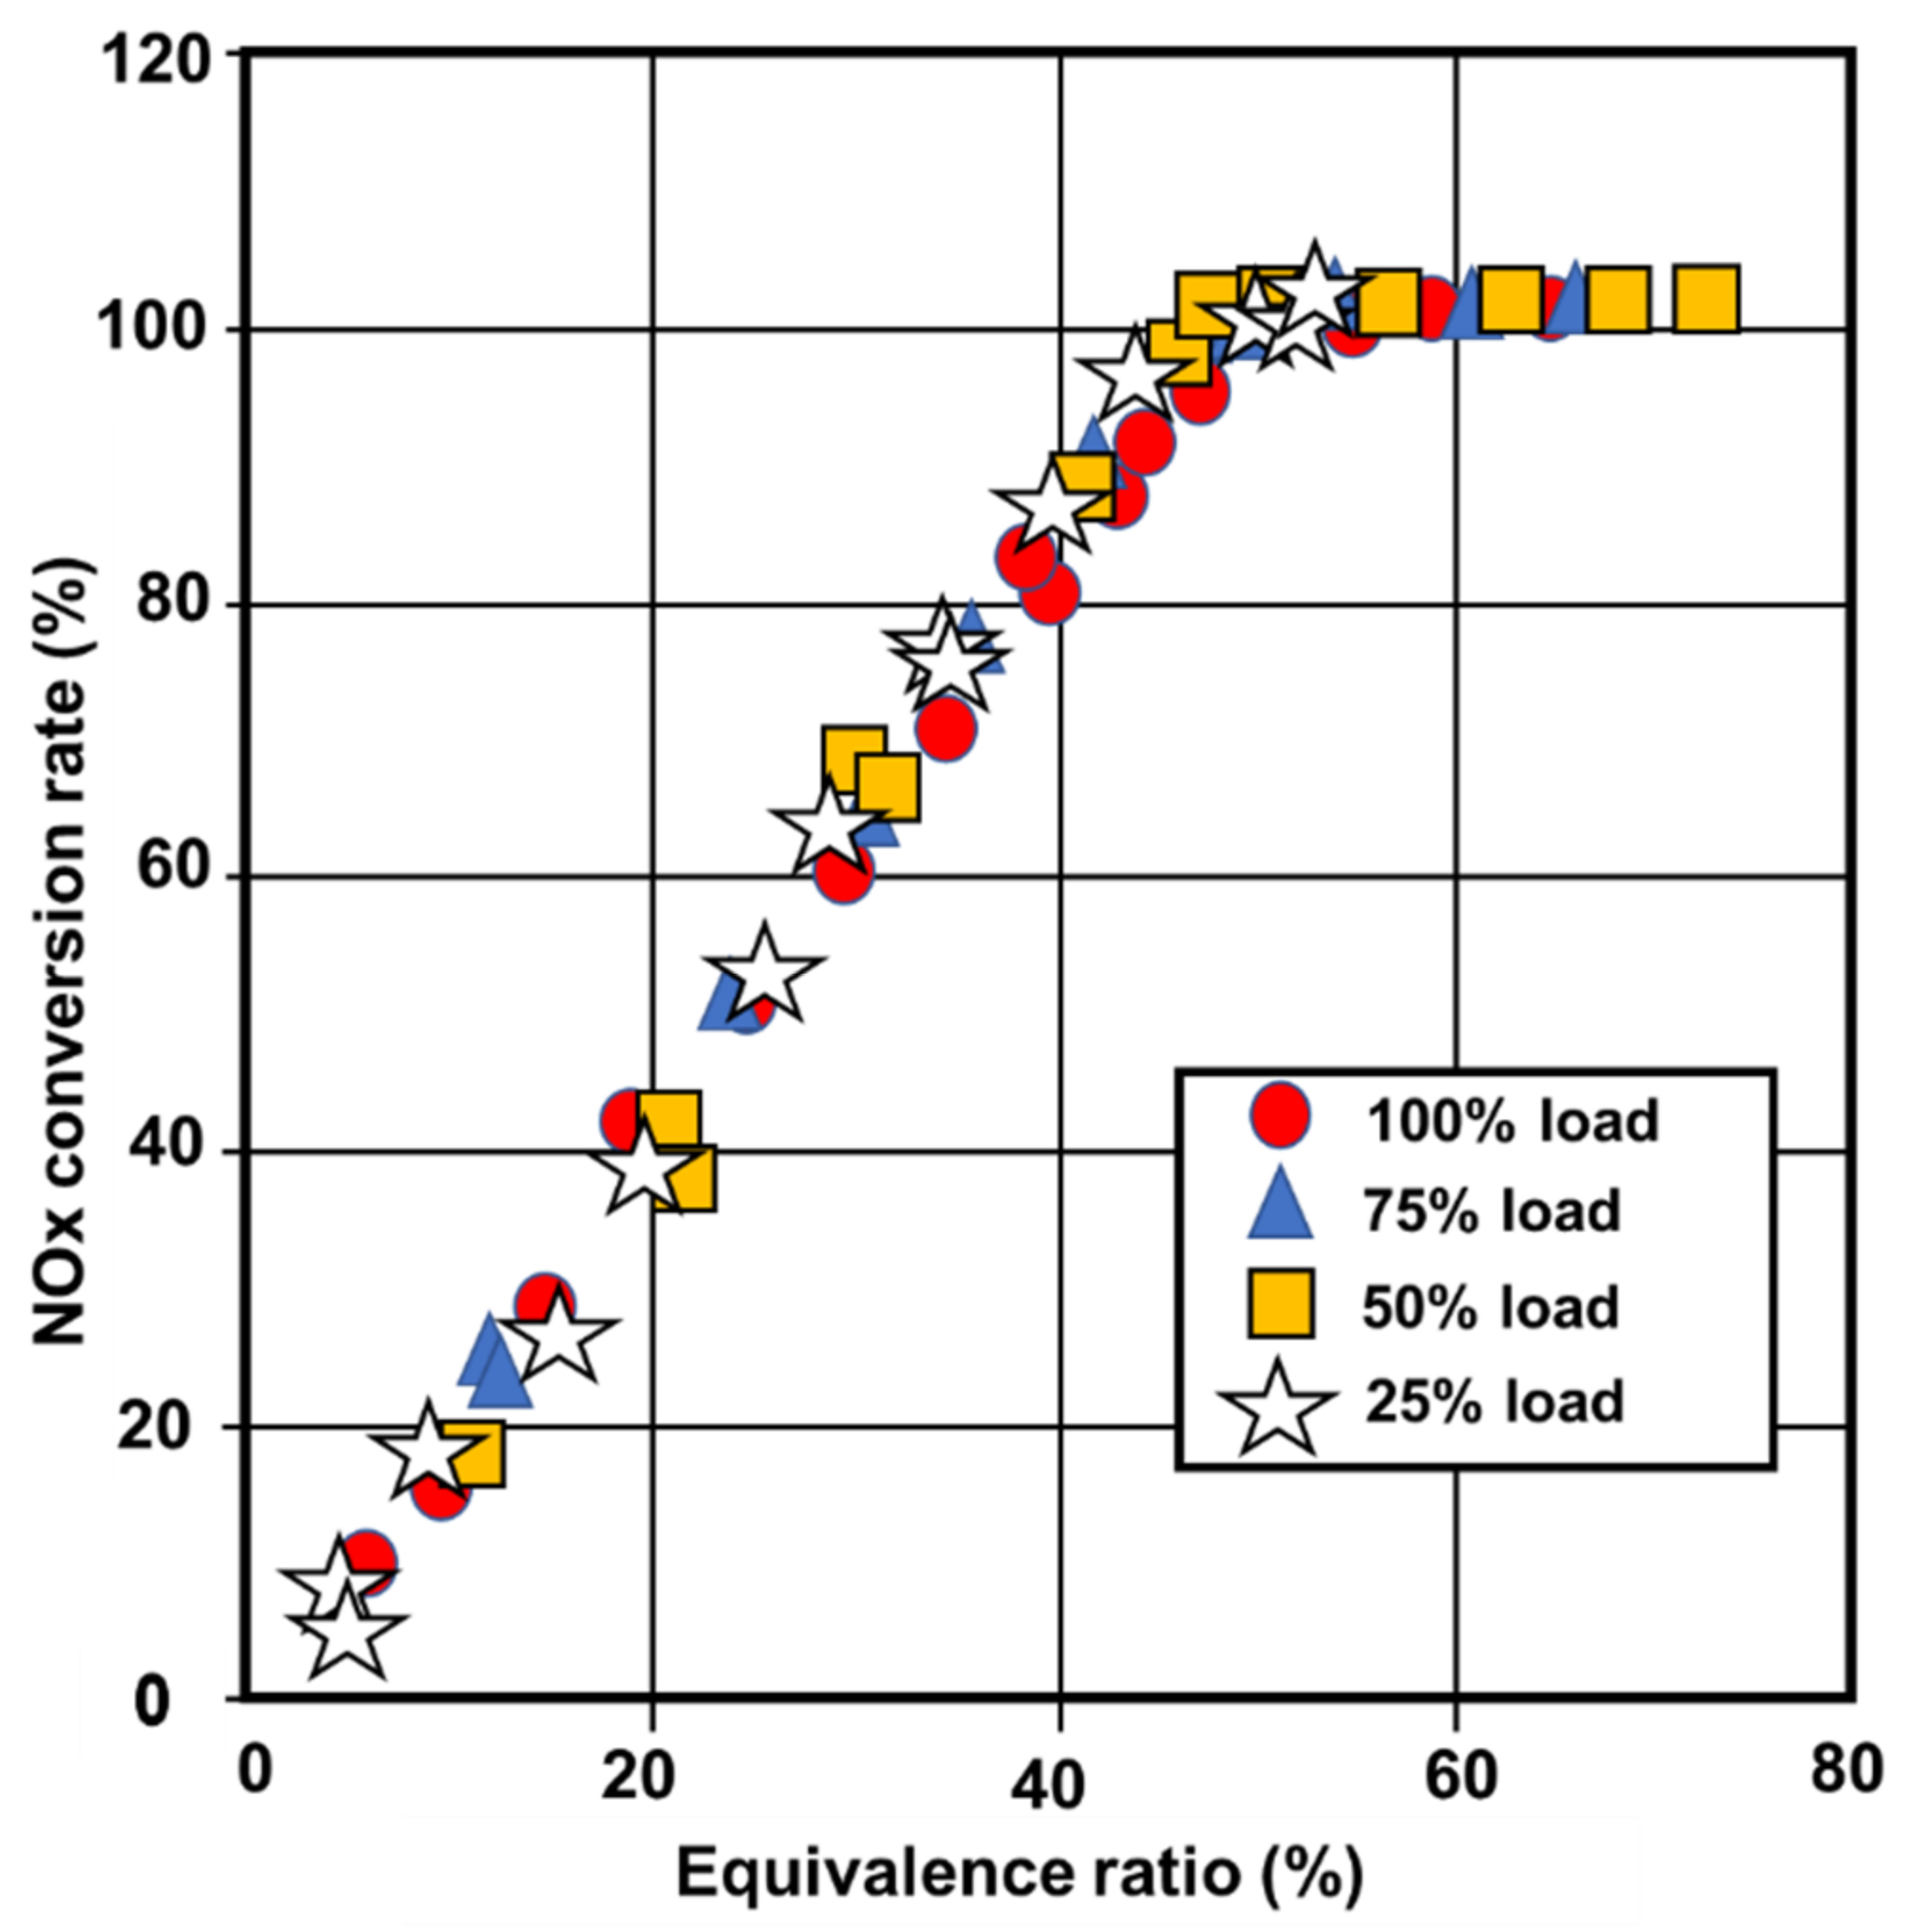
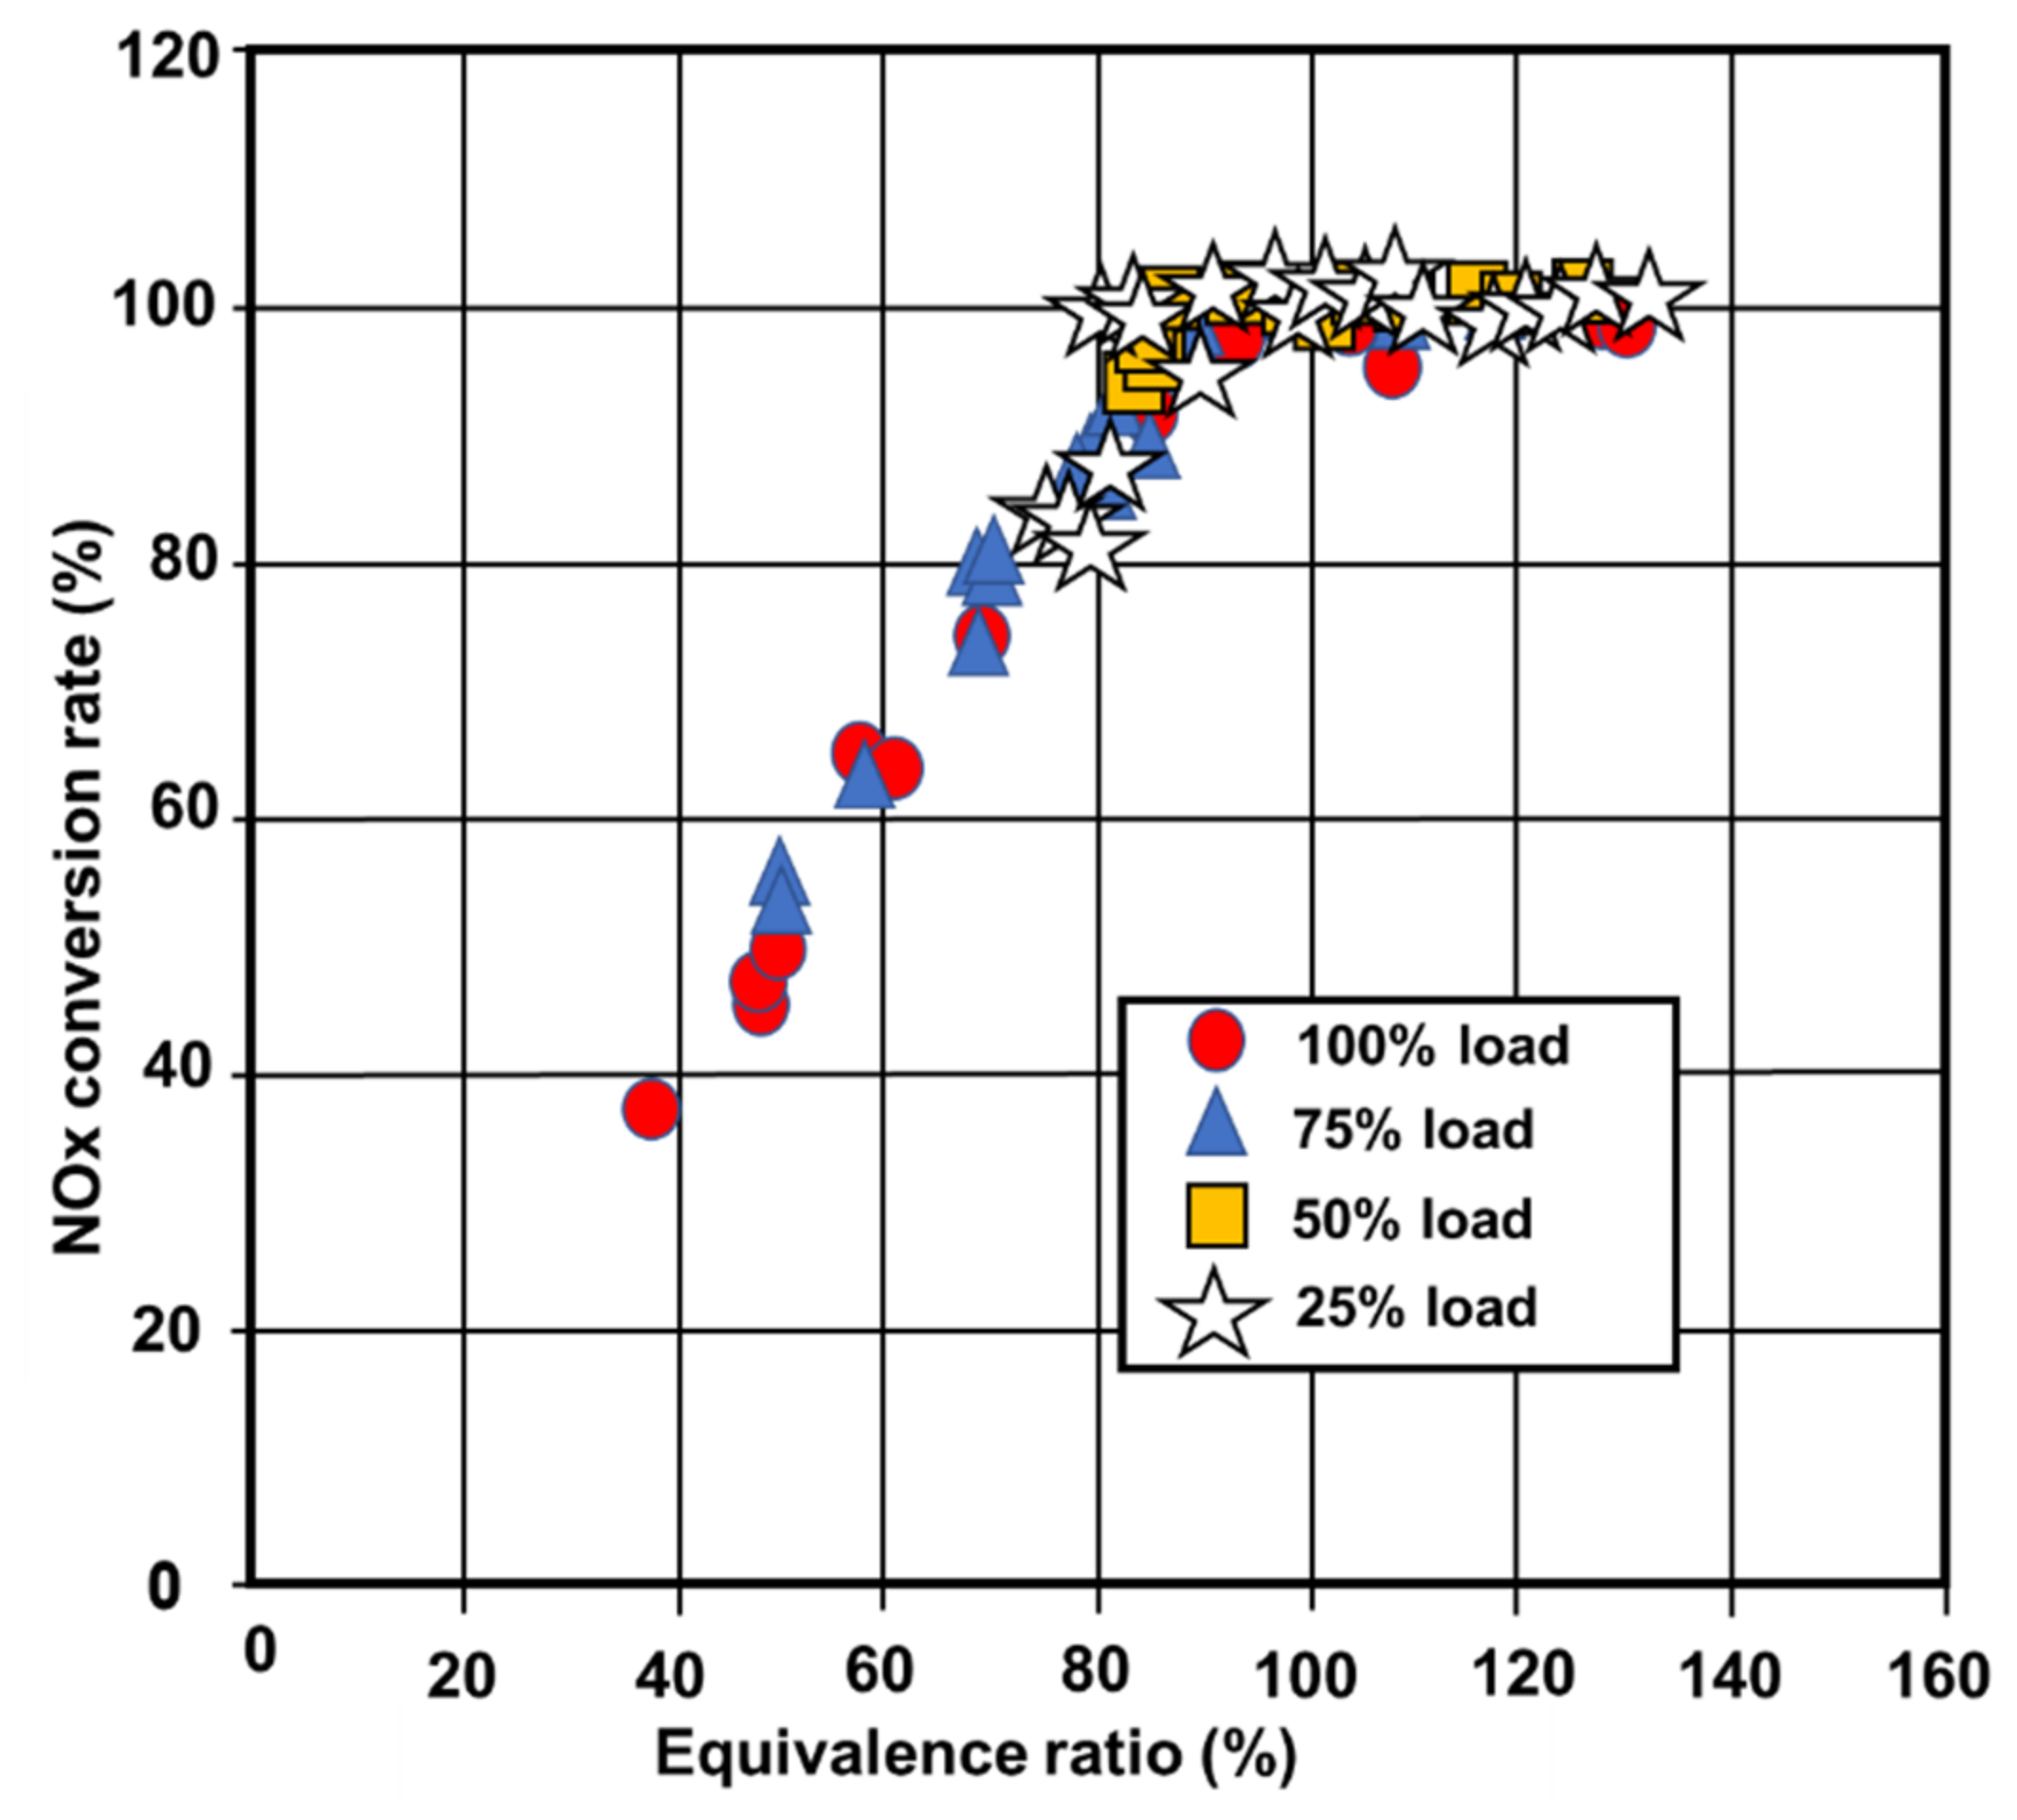
The other investigation of a heavy-duty diesel engine of 12,000 cc engine capacity tested at 1000 rpm showed that improving the ammonia gas formation can increase NOx conversion. However, the distribution of urea from the injector is the most challenging aspect. This study compared the injector model L and the injector model I in order to improve ammonia delivery. Model L had a good distribution of urea based on the position of the injector hole in the center of the system. However, that hole was easily hampered by solid urea deposits which affected the UWS distribution to the system. The model I injector was recommended to improve the model L injector problem. In this study, the model I urea injector generated 5% more ammonia and produced a better NOx conversion than the model L injector. This figure indicated that the model I injector outperformed the model L urea injector in the urea breakdown process, lowering the potential of solid urea deposition on the walls and decreasing the solid deposition inside the injector. Based on this study, the model I injector can be the alternative injector to increase the heavy-duty diesel engine SCR system performance; however, the position of the injector must be further developed to increase the distribution of urea throughout the system.
j)
The marine diesel engine in this study revealed at standard marine diesel operating speeds, engine exhaust gas NOx emissions are decreased by 80 to 90% with the SCR system. However, the desired equivalence ratio derived from measured values is required to ensure optimum urea flowrates for a 100% reduction in NOx. These findings show that the type of reducing agent has no effect on the temperature of the exhaust gas, and the results of this study contribute to the development of commonly produced maritime SCR systems.
k)
Based on the different results from different variations of diesel engines, it can be concluded that urea injection, droplet breakup, ammonia distribution, exhaust temperature, and the catalyst are the most important factors in the improvement of NOx conversion efficiencies. These conclusions could also be employed to determine the quality of NOx conversion efficiency in light-duty diesel engines, heavy-duty diesel engines, and marine diesel engines that implement an SCR system.

Author Contributions

Conceptualization, M.K.A.W.; methodology, M.K.A.W.; software, M.K.A.W.; validation, M.K.A.W.; formal analysis, M.K.A.W.; investigation, M.K.A.W., and O.L.; resources, M.K.A.W.; data curation, M.K.A.W. and O.L.; writing—original draft preparation, M.K.A.W.; writing—review and editing, M.K.A.W. and O.L.; visualization, O.L.; supervision, O.L.; project administration, O.L.; funding acquisition, O.L. All authors have read and agreed to the published version of the manuscript.

Funding

This research received no external funding.

Data Availability Statement

Data sharing not applicable. No new data were created or analyzed in this study. Data sharing is not applicable to this article.

Acknowledgments

This research is financially supported by the Global Top Environmental Technology Development Project of the Korea Environmental Industry and Technology Institute RE202001110, development and demonstration of simultaneous PM and NOx reduction system of military vehicles. This result was supported by “Regional Innovation Strategy (RIS)” through the National Research Foundation of Korea (NRF) funded by the Ministry of Education (MOE)(2021RIS-003). This work was supported by 2022 Smart Manufacturing Advanced Human Resources Development Project by Korea Industrial Complex Corporation.

Conflicts of Interest

The authors declare no conflict of interest.

References

  1. McCarron, G. Air Pollution and human health hazards: A compilation of air toxins acknowledged by the gas industry in Queensland’s Darling Downs. Int. J. Environ. Stud. 2018, 75, 171–185. [Google Scholar] [CrossRef] [Green Version]
  2. Saari, S.; Karjalainen, P.; Ntziachristos, L.; Pirjola, L.; Matilainen, P.; Keskinen, J.; Rönkkö, T. Exhaust particle and NOx emission performance of an SCR heavy duty truck operating in real-world conditions. Atmos. Environ. 2016, 126, 136–144. [Google Scholar] [CrossRef]
  3. Fu, M.; Ge, Y.; Wang, X.; Tan, J.; Yu, L.; Liang, B. NOx emissions from Euro IV busses with SCR systems associated with urban, suburban and freeway driving patterns. Sci. Total Environ. 2013, 452–453, 222–226. [Google Scholar] [CrossRef]
  4. Hua, S.; Tian, H.; Wang, K.; Zhu, C.; Gao, J.; Ma, Y.; Xue, Y.; Wang, Y.; Duan, S.; Zhou, J. Atmospheric Emission Inventory of Hazardous Air Pollutants from China’s Cement Plants: Temporal Trends, Spatial Variation Characteristics and Scenario Projections. Atmos. Environ. 2016, 128, 1–9. [Google Scholar] [CrossRef]
  5. Zhang, C.; He, H.; Shuai, S.; Wang, J. Catalytic performance of Ag/Al2O3-C2H5OH-Cu/Al2O3 system for the removal of NOx from diesel engine exhaust. Environ. Pollut. 2007, 147, 415–421. [Google Scholar] [CrossRef]
  6. Salanta, G.; Zheng, G.; Kotrba, A.; Rampazzo, R.; Bergantim, L. Optimization of a Urea SCR System for On-Highway Truck Applications; SAE International: Warrendale, PA, USA, 2010. [Google Scholar] [CrossRef]
  7. Burnett, R.T.; Brook, J.; Dann, T.; Delocla, C.; Philips, O.; Cakmak, S.; Vincent, R.; S. Goldberg, M.; Krewski, D. Association between particulate-and gas-phase components of urban air pollution and daily mortality in eight Canadian cities. Inhal. Toxicol. 2000, 12, 15–39. [Google Scholar] [CrossRef] [PubMed]
  8. Iodice, P.; Senatore, A. Air Pollution and Air Quality State in an Italian National Interest Priority Site. Part 2: The Pollutant Dispersion. Energy Procedia 2015, 81, 637–643. [Google Scholar] [CrossRef] [Green Version]
  9. Forsthuber, F.; Krenek, T.; Marinitsch, F.; Lauer, T.; Weiss, J.; Raup, M.; Schatzberger, T. Investigations on the Tail-Pipe Emissions of Commercial Engines with Advanced One-Dimensional Simulation Methods; SAE International: Warrendale, PA, USA, 2013. [Google Scholar] [CrossRef]
  10. Mehregan, M.; Moghiman, M. Experimental investigation of the distinct effects of nanoparticles addition and urea-SCR after-treatment system on NOx emissions in a blended-biodiesel fueled internal combustion engine. Fuel 2020, 262, 116609. [Google Scholar] [CrossRef]
  11. Gaynor, P.; Reid, B.; Hargrave, G.; Lockyer, T.; Wilson, J. An Experimental Investigation into DEF Dosing Strategies for Heavy Duty Vehicle Applications. SAE Int. J. Engines 2015, 8, 1196–1206. [Google Scholar] [CrossRef] [Green Version]
  12. Weiss, M.; Bonnel, P.; Kühlwein, J.; Provenza, A.; Lambrecht, U.; Alessandrini, S.; Carriero, M.; Colombo, R.; Forni, F.; Lanappe, G. Will Euro 6 reduce the NOx emissions of new diesel cars?–Insights from on-road tests with Portable Emissions Measurement Systems (PEMS). Atmos. Environ. 2012, 62, 657–665. [Google Scholar] [CrossRef]
  13. Delphi Technologies. Delphi-Emissions for Heavy Duty and Off-Highway Vehicles 2018–2019; Delphi Technologies: Boston, MA, USA, 2018. [Google Scholar]
  14. Dulles, O. Engineering Clean Air: The Continuous Improvement of Diesel Engine Emission Performance. Technol. Clean Diesel Engines Curr. Futur. 2001, 1–14. Available online: https://www.dieselforum.org (accessed on 1 March 2001).
  15. Koebel, M.; Elsener, M.; Kleemann, M. Urea-SCR: A promising technique to reduce NOx emissions from automotive diesel engines. Catal. Today 2000, 59, 335–345. [Google Scholar] [CrossRef]
  16. Koebel, M.; Strutz, E.O. Thermal and Hydrolytic Decomposition of Urea for Automotive Selective Catalytic Reduction Systems: Thermochemical and Practical Aspects. Ind. Eng. Chem. Res. 2003, 42, 2093–2100. [Google Scholar] [CrossRef]
  17. Conway, R.; Chatterjee, S.; Naseri, M.; Aydin, C. Demonstration of SCR on a Diesel Particulate Filter System on a Heavy Duty Application; SAE International: Warrendale, PA, USA, 2015. [Google Scholar] [CrossRef]
  18. Naseri, M.; Chatterjee, S.; Castagnola, M.; Chen, H.-Y.; Fedeyko, J.; Hess, H.; Li, J. Development of SCR on Diesel Particulate Filter System for Heavy Duty Applications. SAE Int. J. Engines 2011, 4, 1798–1809. [Google Scholar] [CrossRef]
  19. Arbess, H.; Bafleur, M.; Trémouilles, D.; Zerarka, M. Optimization of a MOS–IGBT–SCR ESD protection component in smart power SOI technology. Microelectron. Reliab. 2015, 55, 1476–1480. [Google Scholar] [CrossRef]
  20. Khristamto, M.; Wardana, A.; Oh, K.; Lee, Y.J.; Woo, Y.M.; Lim, O. Effects of urea injection timing on predicting NOx conversion in SCR systems. Int. J. Automot. Technol. 2020, 21, 137–145. [Google Scholar] [CrossRef]
  21. Sampath, M.K.; Lacin, F. CFD Study of Sensitivity Parameters in SCR NOx Reduction Modeling; SAE Technical Paper; SAE International: Warrendale, PA, USA, 2014. [Google Scholar] [CrossRef]
  22. Marchitti, F.; Nova, I.; Tronconi, E. Experimental study of the interaction between soot combustion and NH3-SCR reactivity over a Cu-Zeolite SDPF catalyst. Catal. Today 2016, 267, 110–118. [Google Scholar] [CrossRef]
  23. Qiu, T.; Li, X.; Lei, Y.; Liu, X.; Zhang, C.; Feng, X.; Xu, H. The prediction of fuel injection quality using a NOx sensor for the on-board diagnosis of heavy-duty diesel engines with SCR systems. Fuel 2015, 141, 192–199. [Google Scholar] [CrossRef]
  24. Ahmed, A.S.; Khan, S.; Hamdan, S.; Rahman, R.; Kalam, A.; Masjuki, H.H. Biodiesel Production from Macro Algae as a Green Fuel for Diesel Engine. J. Energy Environ. 2010, 2, 1–5. [Google Scholar]
  25. Khot, A.; Tripathi, N.; Maciejewski, D.; Sharma, S. Evaluation of Numerical Modeling Strategy for Prediction of Backpressure across Various Configuration of Diesel Engine Based after Treatment System; SAE Technical Paper; SAE International: Warrendale, PA, USA, 2016. [Google Scholar] [CrossRef]
  26. Johnson, T.V. Vehicular emissions in review. SAE Int. J. Engines 2012, 5, 216–234. [Google Scholar] [CrossRef] [Green Version]
  27. Cho, S.M. Properly apply selective catalytic reduction for NOx removal. Chem. Eng. Prog. 1994, 90, 39–45. [Google Scholar]
  28. Niki, Y.; Hirata, K.; Kishi, T.; Inaba, T.; Takagi, M.; Fukuda, T.; Nagai, T.; Muraoka, E. SCR system for NOx reduction of Medium Speed Marine Diesel Engine. CIMAC Congr. 2010, 22, 12. [Google Scholar]
  29. Fritz, A.; Pitchon, V. The current state of research on automotive lean NOx catalysis. Appl. Catal. B Environ. 1997, 13, 1–25. [Google Scholar] [CrossRef]
  30. Baleta, J.; Vujanović, M.; Pachler, K.; Duić, N. Numerical modeling of urea water based selective catalytic reduction for mitigation of NOxfrom transport sector. J. Clean. Prod. 2015, 88, 280–288. [Google Scholar] [CrossRef] [Green Version]
  31. Boroń, P.; Chmielarz, L.; Casale, S.; Calers, C.; Krafft, J.-M.; Dzwigaj, S. Effect of Co content on the catalytic activity of CoSiBEA zeolites in N2O decomposition and SCR of NO with ammonia. Catal. Today 2015, 258, 507–517. [Google Scholar] [CrossRef]
  32. Weeks, C.L.; Ibeling, D.R.; Han, S.; Ludwig, L.; Ayyappan, P. Analytical investigation of urea deposits in SCR system. SAE Int. J. Engines 2015, 8, 1219–1239. [Google Scholar] [CrossRef]
  33. Dong, H.; Shuai, S.; Wang, J. Effect of Urea Thermal Decomposition on Diesel NOx-SCR Aftertreatment Systems; SAE International: Warrendale, PA, USA, 2008. [Google Scholar] [CrossRef]
  34. Samuelsson, E.; Holmberg, S. A CFD Study of the Urea Supply, Droplet Breakup and Mixing in a Pipe Upstream of a SCR Catalyst. Master’s Thesis, Department of Chemical and Biochemical Engineering, Chalmers University of Technology, Göteborg, Sweden, 2013. Available online: http://publications.lib.chalmers.se/records/fulltext/179070/179070.pdf.
  35. Smith, H.; Lauer, T.; Schimik, V.; Gabel, K. Evaluation and Prediction of Deposit Severity in SCR Systems. SAE Int. J. Engines 2016, 9, 1735–1750. [Google Scholar] [CrossRef]
  36. Zheng, G.; Fila, A.; Kotrba, A.; Floyd, R. Investigation of Urea Deposits in Urea SCR Systems for Medium and Heavy Duty Trucks; SAE International: Warrendale, PA, USA, 2010. [Google Scholar] [CrossRef]
  37. Munnannur, A.; Chiruta, M.; Liu, Z.G. Thermal and Fluid Dynamic Considerations in Aftertreatment System Design for SCR Solid Deposit Mitigation; SAE International: Warrendale, PA, USA, 2012. [Google Scholar] [CrossRef]
  38. Strots, V.O.; Santhanam, S.; Adelman, B.J.; Griffin, G.A.; Derybowski, E.M. Deposit formation in urea-SCR systems. SAE Int. J. Fuels Lubr. 2010, 2, 283–289. [Google Scholar] [CrossRef]
  39. Wardana, M.K.A.; Lim, O. Investigation of Solid Deposit Inside L-Type Urea Injector and NOx Conversion in a Heavy-Duty Diesel Engine. Catalysts 2021, 11, 595. [Google Scholar] [CrossRef]
  40. Mera, Z.; Matzer, C.; Hausberger, S.; Fonseca, N. Performance of selective catalytic reduction (SCR) system in a diesel passenger car under real-world conditions. Appl. Therm. Eng. 2020, 181, 115983. [Google Scholar] [CrossRef]
  41. Choi, B.; Woo, S.M. Numerical analysis of the optimum heating pipe to melt frozen urea-water-solution of a diesel urea-SCR system. Appl. Therm. Eng. 2015, 89, 860–870. [Google Scholar] [CrossRef]
  42. Dunand, P.; Castanet, G.; Gradeck, M.; Maillet, D.; Lemoine, F. Energy balance of droplets impinging onto a wall heated above the Leidenfrost temperature. Int. J. Heat Fluid Flow 2013, 44, 170–180. [Google Scholar] [CrossRef] [Green Version]
  43. Wang, X.; Song, G.; Wu, Y.; Yu, L.; Zhai, Z. A NOx emission model incorporating temperature for heavy-duty diesel vehicles with urea-SCR systems based on field operating modes. Atmosphere 2019, 10, 337. [Google Scholar] [CrossRef] [Green Version]
  44. Prabhu, S.S.; Nayak, N.S.; Kapilan, N. Numerical Study on Evaporation Characteristics of Single Urea-Water Solution (UWS) Droplet and Variation of Evaporation and Wall-Interaction Characteristics of UWS Spray with Cell Density in SCR Mixing Chamber; SAE Technical Papers; SAE International: Warrendale, PA, USA, 2016. [Google Scholar] [CrossRef]
  45. Gao, Y.; Liu, Q.; Bian, L. Numerical simulation and optimization of flow field in the SCR denitrification system on a 600 MW capacity units. Energy Procedia 2012, 14, 370–375. [Google Scholar] [CrossRef] [Green Version]
  46. Maunula, T.; Kinnunen, T.; Kanniainen, K.; Viitanen, A.; Savimaki, A. Thermally Durable Vanadium-SCR Catalysts for Diesel Applications; SAE Technical Paper; SAE International: Warrendale, PA, USA, 2013. [Google Scholar] [CrossRef]
  47. Birkhold, F.; Meingast, U.; Wassermann, P.; Deutschmann, O. Analysis of the Injection of Urea-Water-Solution for Automotive SCR DeNOx-Systems: Modeling of Two-Phase Flow and Spray/Wall-Interaction. SAE Trans. 2006, 115, 252–262. [Google Scholar] [CrossRef] [Green Version]
  48. Li, Z.; Deng, J.; Li, L.; Cao, L.; Wu, Z. A Study on the Factors Affecting Heated Wall Impinging Characteristics of SCR Spray; SAE International: Warrendale, PA, USA, 2011. [Google Scholar] [CrossRef]
  49. Liao, Y.; Nocivelli, L.; Eggenschwiler, P.D.; Spiteri, A. Experimental investigation of urea-water sprays in selective catalytic reduction (SCR) systems. In 15. Internationales Stuttgarter Symposium; Springer: Berlin/Heidelberg, Germany, 2015; pp. 953–966. [Google Scholar] [CrossRef]
  50. Smith, H.; Zöchbauer, M.; Lauer, T. Advanced Spray Impingement Modelling for an Improved Prediction Accuracy of the Ammonia Homogenisation in SCR Systems; SAE Technical Paper; SAE International: Warrendale, PA, USA, 2015. [Google Scholar] [CrossRef]
  51. Ström, H.; Lundström, A.; Andersson, B. Choice of urea-spray models in CFD simulations of urea-SCR systems. Chem. Eng. J. 2009, 150, 69–82. [Google Scholar] [CrossRef]
  52. Colombo, M.; Nova, I.; Tronconi, E.; Schmei??er, V.; Weibel, M. Mathematical modelling of cold start effects over zeolite SCR catalysts for exhaust gas aftertreatment. Catal. Today 2014, 231, 99–104. [Google Scholar] [CrossRef]
  53. Lee, S.I.; Park, S.Y. Numerical analysis of internal flow characteristics of urea injectors for SCR dosing system. Fuel 2014, 129, 54–60. [Google Scholar] [CrossRef]
  54. Ayodhya, A.S.; Lamani, V.T.; Thirumoorthy, M.; Kumar, G.N. NOx reduction studies on a diesel engine operating on waste plastic oil blend using selective catalytic reduction technique. J. Energy Inst. 2019, 92, 341–350. [Google Scholar] [CrossRef]
  55. Wijayanti, K.; Andonova, S.; Kumar, A.; Li, J.; Kamasamudram, K.; Currier, N.W.; Yezerets, A.; Olsson, L. Impact of sulfur oxide on NH3-SCR over Cu-SAPO-34. Appl. Catal. B Environ. 2015, 166–167, 568–579. [Google Scholar] [CrossRef]
  56. Colombo, M.; Nova, I.; Tronconi, E. Detailed kinetic modeling of the NH3–NO/NO2 SCR reactions over a commercial Cu-zeolite catalyst for Diesel exhausts after treatment. Catal. Today 2012, 197, 243–255. [Google Scholar] [CrossRef]
  57. Nishiyama, H.; Tanaka, Y.; Adachi, T. A Study on the Improvement of NOx Reduction Efficiency for a Urea SCR System; SAE Technical Paper; SAE International: Warrendale, PA, USA, 2016; Volume 46, pp. 589–595. [Google Scholar] [CrossRef]
  58. Prikhodko, V.Y.; Parks, J.E.; Pihl, J.A.; Toops, T.J. Passive SCR for lean gasoline NOX control: Engine-based strategies to minimize fuel penalty associated with catalytic NH3 generation. Catal. Today 2016, 267, 202–209. [Google Scholar] [CrossRef] [Green Version]
  59. Park, K.; Hong, C.-H.; Oh, S.; Moon, S. Numerical Prediction on the Influence of Mixer on the Performance of Urea-SCR System. Int. J. Mech. Aerosp. Ind. Mechatron. Manuf. Eng. 2014, 8, 998–1004. [Google Scholar]
  60. Chae, H.J.; Choo, S.T.; Choi, H.; Nam, I. Direct Use of Kinetic Parameters for Modeling and Simulation of a Selective Catalytic Reduction process. Ind. Eng. Chem. Res. 2000, 39, 1159–1170. [Google Scholar] [CrossRef]
  61. Andreoli, S.; Deorsola, F.A.; Pirone, R. MnO-CeO2 catalysts synthesized by solution combustion synthesis for the low-temperature NH3-SCR. Catal. Today 2015, 253, 199–206. [Google Scholar] [CrossRef]
  62. Qiu, L.; Wang, Y.; Pang, D.; Ouyang, F.; Zhang, C. SO42−–Mn–Co–Ce supported on TiO2/SiO2 with high sulfur durability for low-temperature SCR of NO with NH3. Catal. Commun. 2016, 78, 22–25. [Google Scholar] [CrossRef]
  63. Tang, W.; Cai, Y.; Wang, J. Experimental studies on the diesel engine urea-SCR system using a double NOx sensor system. Environ. Eng. Res. 2015, 20, 397–402. [Google Scholar] [CrossRef]
  64. Casanova, M.; Llorca, J.; Sagar, A.; Schermanz, K.; Trovarelli, A. Mixed iron–erbium vanadate NH3-SCR catalysts. Catal. Today 2015, 241, 159–168. [Google Scholar] [CrossRef]
  65. Langeslay, R.R.; Kaphan, D.M.; Marshall, C.L.; Stair, P.C.; Sattelberger, A.P.; Delferro, M. Catalytic Applications of Vanadium: A Mechanistic Perspective. Chem. Rev. 2019, 119, 2128–2191. [Google Scholar] [CrossRef]
  66. Liu, Y.; Liu, Z.; Mnichowicz, B.; Harinath, A.V.; Li, H.; Bahrami, B. Chemical deactivation of commercial vanadium SCR catalysts in diesel emission control application. Chem. Eng. J. 2016, 287, 680–690. [Google Scholar] [CrossRef]
  67. Liu, Y.; Chen, W.; Henrichsen, M.; Harinath, A. Analysis of Packaging Impact on Emission Catalyst Design; SAE Technical Paper; SAE International: Warrendale, PA, USA, 2014; Volume 1. [Google Scholar] [CrossRef]
  68. Girard, J.W.; Montreuil, C.; Kim, J.; Cavataio, G.; Lambert, C. Technical Advantages of Vanadium SCR Systems for Diesel NOx Control in Emerging Markets. SAE Int. J. Fuels Lubr. 2008, 1, 488–494. [Google Scholar] [CrossRef]
  69. Bertrand, F.; Devals, C.; Vidal, D.; De Préval, C.S.; Hayes, R.E. Towards the simulation of the catalytic monolith converter using discrete channel-scale models. Catal. Today 2012, 188, 80–86. [Google Scholar] [CrossRef]
  70. Opitz, B.; Bendrich, M.; Drochner, A.; Vogel, H.; Hayes, R.E.; Forbes, J.F.; Votsmeier, M. Simulation study of SCR catalysts with individually adjusted ammonia dosing strategies. Chem. Eng. J. 2015, 264, 936–944. [Google Scholar] [CrossRef]
  71. Wang, T.J.; Baek, S.W.; Lee, S.Y.; Kang, D.H.; Yeo, G.K. Experimental investigation on evaporation of urea-water-solution droplet for SCR applications. AIChE J. 2009, 55, 3267–3276. [Google Scholar] [CrossRef]
  72. Drennan, S.; Kumar, G.; Quan, S.; Wang, M. Application of Automatic Meshing to Urea-Water Injection Simulation for Engine Aftertreatment; SAE International: Warrendale, PA, USA, 2015. [Google Scholar] [CrossRef]
  73. Mutyal, J.; Shrivastava, S.; Faltsi, R.; Braun, M. Development and Validation of a Simulation Model for Urea-Water-Solution Decomposition for Automotive SCR Systems; SAE Technical Paper; SAE International: Warrendale, PA, USA, 2015. [Google Scholar] [CrossRef]
  74. Wang, J.; Hu, Y.; Cai, Y.; Zhao, C.; Zhu, L.; Zhao, C.; Fu, H. Influence of Urea-SCR system parameters on NOx conversion rate and liquid film. Energy Sources Part A Recover. Util. Environ. Eff. 2021, 43, 2027–2040. [Google Scholar] [CrossRef]
  75. Stritzke, F.; van der Kley, S.; Feiling, A.; Dreizler, A.; Wagner, S. Ammonia concentration distribution measurements in the exhaust of a heavy duty diesel engine based on limited data absorption tomography. Opt. Express 2017, 25, 8180. [Google Scholar] [CrossRef] [PubMed]
  76. Lockyer, T.; Reid, B.; Hargrave, G.; Gaynor, P.; Wilson, J. Optical Investigation on the Ability of a Cordierite Substrate Mixing Device to Combat Deposits in SCR Dosing Systems; SAE Technical Paper; SAE International: Warrendale, PA, USA, 2015. [Google Scholar] [CrossRef] [Green Version]
  77. Cha, W.; Ehrman, S.H.; Jurng, J. CeO2 added V2O5 /TiO2 catalyst prepared by chemical vapor condensation (CVC) and impregnation method for enhanced NH3-SCR of NOx at low temperature. J. Environ. Chem. Eng. 2016, 4, 556–563. [Google Scholar] [CrossRef]
  78. Ma, Z.; Wu, X.; Feng, Y.; Si, Z.; Weng, D. Effects of WO3 doping on stability and N2O escape of MnO–CeO2 mixed oxides as a low-temperature SCR catalyst. Catal. Commun. 2015, 69, 188–192. [Google Scholar] [CrossRef]
  79. Pappas, D.K.; Boningari, T.; Boolchand, P.; Smirniotis, P.G. Novel manganese oxide confined interweaved titania nanotubes for the low-temperature Selective Catalytic Reduction (SCR) of NOx by NH3. J. Catal. 2016, 334, 1–13. [Google Scholar] [CrossRef]
  80. Scott Sluder, C.; Storey, J.M.E.; Lewis, S.A.; Lewis, L.A. Low temperature urea decomposition and SCR performance. SAE Trans. 2005, 114, 669–677. [Google Scholar] [CrossRef]
  81. Colombo, M.; Koltsakis, G.; Nova, I.; Tronconi, E. Modelling the ammonia adsorption-desorption process over an Fe-zeolite catalyst for SCR automotive applications. Catal. Today 2012, 188, 42–52. [Google Scholar] [CrossRef]
  82. Benjamin, S.F.; Gall, M.; Roberts, C.A. Modelling of NOx Conversion in a 1D Diesel Engine Exhaust SCR Catalyst System under Transient Conditions Using Ammonia Gas as the Reductant; SAE Technical Paper; SAE International: Warrendale, PA, USA, 2012; Volume 9. [Google Scholar] [CrossRef]
  83. Theis, J.R.; Dearth, M.; McCabe, R. LNT+SCR Catalyst Systems Optimized for NOx Conversion on Diesel Applications; SAE International: Warrendale, PA, USA, 2011. [Google Scholar] [CrossRef]
  84. Ma, Z.; Wu, X.; Feng, Y.; Si, Z.; Weng, D.; Shi, L. Low-temperature SCR activity and SO2 deactivation mechanism of Ce-modified V2O5–WO3/TiO2 catalyst. Prog. Nat. Sci. Mater. Int. 2015, 25, 342–352. [Google Scholar] [CrossRef] [Green Version]
  85. Zhang, S.; Zhong, Q. Surface characterization studies on the interaction of V2O5-WO3/TiO2 catalyst for low temperature SCR of NO with NH3. J. Solid State Chem. 2015, 221, 49–56. [Google Scholar] [CrossRef]
  86. Japke, E.; Casapu, M.; Trouillet, V.; Deutschmann, O.; Grunwaldt, J.D. Soot and hydrocarbon oxidation over vanadia-based SCR catalysts. Catal. Today 2015, 258, 461–469. [Google Scholar] [CrossRef]
  87. Andonova, S.; Tamm, S.; Montreuil, C.; Lambert, C.; Olsson, L. The effect of iron loading and hydrothermal aging on one-pot synthesized Fe/SAPO-34 for ammonia SCR. Appl. Catal. B Environ. 2016, 180, 775–787. [Google Scholar] [CrossRef]
  88. Auvray, X.; Partridge, W.; Choi, J.-S.; Pihl, J.; Coehlo, F.; Yezerets, A.; Kamasamudram, K.; Currier, N.; Olsson, L. Kinetic modeling of NH3-SCR over a supported Cu zeolite catalyst using axial species distribution measurements. Appl. Catal. B Environ. 2015, 163, 393–403. [Google Scholar] [CrossRef] [Green Version]
  89. Boroń, P.; Chmielarz, L.; Dzwigaj, S. Influence of Cu on the catalytic activity of FeBEA zeolites in SCR of NO with NH 3. Appl. Catal. B Environ. 2015, 168–169, 377–384. [Google Scholar] [CrossRef]
  90. Ma, L.; Cheng, Y.; Cavataio, G.; McCabe, R.W.; Fu, L.; Li, J. In situ DRIFTS and temperature-programmed technology study on NH3-SCR of NOx over Cu-SSZ-13 and Cu-SAPO-34 catalysts. Appl. Catal. B Environ. 2014, 156–157, 428–437. [Google Scholar] [CrossRef]
  91. Jeong, S.J.; Lee, S.J.; Kim, W.S.; Lee, C.B. Simulation on the Optimum Shape and Location of Urea Injector for Urea-SCR System of Heavy-Duty Diesel Engine to Prevent NH3 Slip; SAE Technical Paper; SAE International: Warrendale, PA, USA, 2005. [Google Scholar] [CrossRef]
  92. Liu, B.; Yan, F.; Hu, J.; Turkson, R.F.; Lin, F. Modeling and multi-objective optimization of NOx conversion efficiency and NH3 slip for a diesel engine. Sustainability 2016, 8, 478. [Google Scholar] [CrossRef] [Green Version]
  93. Song, X.; Naber, J.; Johnson, J.H. Nonuniformity and NO2/NOx Ratio Effects on the SCR Performance under Transient Engine Conditions; SAE International: Warrendale, PA, USA, 2014. [Google Scholar]
  94. Xu, L.; Watkins, W.; Snow, R.; Graham, G.; McCabe, R.; Lambert, C.; Carter, R.O. Laboratory and Engine Study of Urea-Related Deposits in Diesel Urea-SCR After-Treatment Systems; SAE International: Warrendale, PA, USA, 2007. [Google Scholar] [CrossRef]
  95. Theis, J.R.; Ura, J.; McCabe, R. The Effects of Sulfur Poisoning and Desulfation Temperature on the NOx Conversion of LNT+SCR Systems for Diesel Applications. SAE Int. J. Fuels Lubr. 2010, 3, 1–15. [Google Scholar] [CrossRef]
  96. Dahlin, S.; Nilsson, M.; Bäckström, D.; Bergman, S.L.; Bengtsson, E.; Bernasek, S.L.; Pettersson, L.J. Multivariate analysis of the effect of biodiesel-derived contaminants on V2O5-WO3/TiO2 SCR catalysts. Appl. Catal. B Environ. 2016, 183, 377–385. [Google Scholar] [CrossRef]
  97. de Oliveira, M.L.; Silva, C.M.; Moreno-Tost, R.; Farias, T.L.; Jimenez-Lopez, A.; Rodriguez-Castellon, E. Simulation of SCR equipped vehicles using iron-zeolite catalysts. Appl. Catal. A Gen. 2009, 366, 13–21. [Google Scholar] [CrossRef]
  98. Gao, F.; Tang, X.; Yi, H.; Zhao, S.; Li, C.; Li, J.; Shi, Y.; Meng, X. A review on selective catalytic reduction of NOx by NH3 over Mn–based catalysts at low temperatures: Catalysts, mechanisms, kinetics and DFT calculations. Catalysts 2017, 7, 199. [Google Scholar] [CrossRef]
  99. Kaario, O.; Sarjovaara, T.; Ranta, O.; Hulkkonen, T.; Keskinen, K.; Larmi, M.; Halonen, S.; Amberla, A. Comparing Breakup Models in a Novel High Injection Pressure SCR System using Polyhedral Meshing; SAE Technical Paper; SAE International: Warrendale, PA, USA, 2014. [Google Scholar] [CrossRef]
  100. Fischer, S. Simulation of the Urea-Water-Solution Preparation and Ammonia-Homogenization with a Validated CFD-Model for the Optimization of Automotive SCR-Systems. Ph.D. Thesis, Technische Universität Wien, Vienna, Austria, 2012. Available online: https://www.ub.tuwien.ac.at/diss/AC07814267.pdf.
  101. Schmieg, S.J.; Oh, S.H.; Kim, C.H.; Brown, D.B.; Lee, J.H.; Peden, C.H.F.; Heui, D. Thermal durability of Cu-CHA NH3-SCR catalysts for diesel NOx reduction. Catal. Today 2012, 184, 252–261. [Google Scholar] [CrossRef]
  102. Khristamto, M.; Wardana, A.; Shahariar, G.M.H.; Oh, K.; Lim, O. Ammonia uniformity to predict nox reduction efficiency in an SCR system. Int. J. Automot. Technol. 2019, 20, 313–325. [Google Scholar] [CrossRef]
  103. Dong, H.; Shuai, S.; Li, R.; Wang, J.; Shi, X.; He, H. Study of NOx selective catalytic reduction by ethanol over Ag/Al2O3 catalyst on a HD diesel engine. Chem. Eng. J. 2008, 135, 195–201. [Google Scholar] [CrossRef]
  104. Kass, M.D.; Thomas, J.F.; Lewis, S.A.; Storey, J.M.; Domingo, N.; Graves, R.L.; Panov, A.; Park, P. Selective catalytic reduction of NOx emissions from a 5.9 liter diesel engine using ethanol as a reductant. SAE Trans. 2003, 112, 2584–2593. [Google Scholar] [CrossRef]
  105. Shin, Y.; Jung, Y.; Cho, C.P.; Pyo, Y.D.; Jang, J.; Kim, G.; Kim, T.M. NOx abatement and N2O formation over urea-SCR systems with zeolite supported Fe and Cu catalysts in a nonroad diesel engine. Chem. Eng. J. 2020, 381, 122751. [Google Scholar] [CrossRef]
  106. Gualtieri, C.; Angeloudis, A.; Bombardelli, F.; Jha, S.; Stoesser, T. On the Values for the Turbulent Schmidt Number in Environmental Flows. Fluids 2017, 2, 17. [Google Scholar] [CrossRef] [Green Version]
  107. Fang, D.; He, F.; Mei, D.; Zhang, Z.; Xie, J.; Hu, H. Thermodynamic calculation for the activity and mechanism of Mn/TiO2 catalyst doped transition metals for SCR at low temperature. Catal. Commun. 2014, 52, 45–48. [Google Scholar] [CrossRef]
  108. Fang, D.; Xie, J.; Hu, H.; Yang, H.; He, F.; Fu, Z. Identification of MnOx species and Mn valence states in MnOx/TiO2 catalysts for low temperature SCR. Chem. Eng. J. 2015, 271, 23–30. [Google Scholar] [CrossRef]
  109. Brookshear, D.W.; Nam, J.G.; Nguyen, K.; Toops, T.J.; Binder, A. Impact of sulfation and desulfation on NOx reduction using Cu-chabazite SCR catalysts. Catal. Today 2015, 258, 359–366. [Google Scholar] [CrossRef]
  110. Ellmers, I.; Pérez Vélez, R.; Bentrup, U.; Schwieger, W.; Brückner, A.; Grünert, W. SCR and NO oxidation over Fe-ZSM-5—The influence of the Fe content. Catal. Today 2015, 258, 337–346. [Google Scholar] [CrossRef]
  111. Olsson, L.; Wijayanti, K.; Leistner, K.; Kumar, A.; Joshi, S.Y.; Kamasamudram, K.; Currier, N.W.; Yezerets, A. A kinetic model for sulfur poisoning and regeneration of Cu/SSZ-13 used for NH3-SCR. Appl. Catal. B Environ. 2016, 183, 394–406. [Google Scholar] [CrossRef]
  112. Wei, L.; Yan, F.; Hu, J.; Xi, G.; Liu, B.; Zeng, J. Nox conversion efficiency optimization based on NSGA-II and state-feedback nonlinear model predictive control of selective catalytic reduction system in diesel engine. Appl. Energy 2017, 206, 959–971. [Google Scholar] [CrossRef]
  113. Tan, Y.; Henderick, P.; Yoon, S.; Herner, J.; Montes, T.; Boriboonsomsin, K.; Johnson, K.; Scora, G.; Sandez, D.; Durbin, T.D. On-Board Sensor-Based NOx Emissions from Heavy-Duty Diesel Vehicles. Environ. Sci. Technol. 2019, 53, 5504–5511. [Google Scholar] [CrossRef] [PubMed] [Green Version]
  114. Bai, S.; Han, J.; Liu, M.; Qin, S.; Wang, G.; Li, G. xiang Experimental investigation of exhaust thermal management on NOx emissions of heavy-duty diesel engine under the world Harmonized transient cycle (WHTC). Appl. Therm. Eng. 2018, 142, 421–432. [Google Scholar] [CrossRef]
  115. Huthwohl, G.; Dolenec, S. A New Approach in AdBlue Dosing to Improve Performance and Durability of SCR Systems for the Use in Passenger Cars Up to Heavy Duty Vehicles; SAE International: Kyoto, Japan, 2011. [Google Scholar] [CrossRef]
  116. Zheng, Y.; Luss, D.; Harold, M.P. Optimization of LNT-SCR Dual-Layer Catalysts for Diesel NO x Emission Control. SAE Int. J. Engines 2014, 7, 1280–1289. [Google Scholar] [CrossRef]
  117. Hsieh, M.-F.; Wang, J. Development and experimental studies of a control-oriented SCR model for a two-catalyst urea-SCR system. Control Eng. Pract. 2011, 19, 409–422. [Google Scholar] [CrossRef]
  118. Song, Y.; Hashemi, H.; Christensen, J.M.; Zou, C.; Marshall, P.; Glarborg, P. Ammonia oxidation at high pressure and intermediate temperatures. Fuel 2016, 181, 358–365. [Google Scholar] [CrossRef] [Green Version]
  119. Vallinayagam, R.; Vedharaj, S.; Yang, W.M.; Saravanan, C.G.; Lee, P.S.; Chua, K.J.E.; Chou, S.K. Emission reduction from a diesel engine fueled by pine oil biofuel using SCR and catalytic converter. Atmos. Environ. 2013, 80, 190–197. [Google Scholar] [CrossRef]
  120. Abidin, Z.; Das, K.; Roberts, C. 3D-Semi 1D Coupling for a Complete Simulation of an SCR System; SAE Technical Papers; SAE International: Warrendale, PA, USA, 2013; Volume 2. [Google Scholar] [CrossRef]
  121. Ura, J.A.; Girard, J.; Cavataio, G.; Montreuil, C.; Lambert, C. Cold Start Performance and Enhanced Thermal Durability of Vanadium SCR Catalysts; SAE Technical Paper; SAE International: Warrendale, PA, USA, 2009. [Google Scholar] [CrossRef]
  122. Wardana, M.K.A.; Oh, K.; Lim, O. Investigation of urea uniformity with different types of urea injectors in an SCR system. Catalysts 2020, 10, 1269. [Google Scholar] [CrossRef]
  123. Fischer, S.; Bitto, R.; Lauer, T.; Krenn, C.; Tauer, J.; Pessl, G. Impact of the Turbulence Model and Numerical Approach on the Prediction of the Ammonia Homogenization in an Automotive SCR System. SAE Int. J. Engines 2012, 5, 1443–1458. [Google Scholar] [CrossRef]
  124. Zhang, X.; Romzek, M.; Morgan, C. 3-D Numerical Study of Mixing Characteristics of NH3 in Front of SCR; SAE International: Warrendale, PA, USA, 2006. [Google Scholar]
  125. Zheng, G.; Palmer, G.; Salanta, G.; Kotrba, A. Mixer Development for Urea SCR Applications; SAE Technical Paper; SAE International: Warrendale, PA, USA, 2009; Volume 4970, p. 2879. [Google Scholar] [CrossRef]
  126. Castagnola, M.; Caserta, J.; Chatterjee, S.; Chen, H.-Y.; Convey, R.; Fedeyko, J.M.; Klink, W.; Markatou, P.; Shah, S.; Walker, A. Engine Performance of Cu- and Fe-Based SCR Emission Control Systems for Heavy Duty Diesel Applications; SAE Technical Paper; SAE International: Warrendale, PA, USA, 2011; No. 2011-01-1329. [Google Scholar] [CrossRef]
  127. Rymaniak, L.; Pielecha, J.; Brzeziński, L. Determining the NOx emission from an auxiliary marine engine based on its operating conditions. E3S Web Conf. 2018, 44, 00155. [Google Scholar] [CrossRef] [Green Version]
  128. Krastev, V.K.; Amati, G.; Jannelli, E.; Falcucci, G. Direct Numerical Simulation of SCR Reactors through Kinetic Approach; SAE Technical Paper; SAE International: Warrendale, PA, USA, 2016. [Google Scholar] [CrossRef]
  129. Adamowska-Teyssier, M.; Krztoń, A.; Da Costa, P.; Djéga-Mariadassou, G. SCR NO x mechanistic study with a mixture of hydrocarbons representative of the exhaust gas from coal combustion over Rh/Ce0.62Zr0.38O2 catalyst. Fuel 2015, 150, 21–28. [Google Scholar] [CrossRef]
  130. Varna, A.; Boulouchos, K.; Spiteri, A.C.; Dimopoulos Eggenschwiler, P.; Wright, Y.M. Numerical Modelling and Experimental Characterization of a Pressure-Assisted Multi-Stream Injector for SCR Exhaust Gas After-Treatment. SAE Int. J. Engines 2014, 7, 2012–2021. [Google Scholar] [CrossRef]
  131. Senecal, P.K.; Richards, K.J.; Pomraning, E.; Yang, T.; Dai, M.Z.; McDavid, R.M.; Patterson, M.A.; Hou, S.; Shethaji, T. A New Parallel Cut-Cell Cartesian CFD Code for Rapid Grid Generation Applied to In-Cylinder Diesel Engine Simulations; SAE International: Warrendale, PA, USA, 2007. [Google Scholar] [CrossRef]
  132. Smith, H.; Lauer, T.; Mayer, M.; Pierson, S. Optical and Numerical Investigations on the Mechanisms of Deposit Formation in SCR Systems. SAE Int. J. Fuels Lubr. 2014, 7, 525–542. [Google Scholar] [CrossRef]
  133. Can, F.; Courtois, X.; Royer, S.; Blanchard, G.; Rousseau, S.; Duprez, D. An overview of the production and use of ammonia in NSR+SCR coupled system for NOx reduction from lean exhaust gas. Catal. Today 2012, 197, 144–154. [Google Scholar] [CrossRef]
  134. Nishioka, A.; Sukegawa, Y.; Katogi, K.; Mamada, H.; Kowatari, T.; Mukai, T.; Yokota, H. A Study of a New Aftertreatment System (2): Control of Urea Solution Spray for Urea-SCR; SAE International: Warrendale, PA, USA, 2006. [Google Scholar] [CrossRef]
  135. Liao, Y.; Dimopoulos Eggenschwiler, P.; Spiteri, A.; Nocivelli, L.; Montenegro, G.; Boulouchos, K. Fluid Dynamic Comparison of AdBlue Injectors for SCR Applications. SAE Int. J. Engines 2015, 8, 2303–2311. [Google Scholar] [CrossRef]
  136. Of, D.; Sciences, T.; Madia, G.S. Measures to Enhance the NOx Conversion in Urea-SCR Systems for Automotive Applications. Ph.D. Thesis, University of Calabria, Arcavacata, Italy, 2002. Available online: https://www.psi.ch/sites/default/files/import/ceg/PublicationsEN/Madia%2C_PhD_thesis%2C_ETH_Zurich%2C_2002.pdf.
Figure 1. Emission regulation standards from all countries [13].
Catalysts 13 00067 g001
Figure 2. The schematic diagram for the 1000 cc diesel engine on test [54].
Catalysts 13 00067 g002
Figure 3. NOx variation with load [54].
Catalysts 13 00067 g003
Figure 4. The variation in deNOx efficiency as a function of load [54].
Catalysts 13 00067 g004
Figure 5. Schematic diagram of the SCR aftertreatment system for an 1800 cc diesel engine [63].
Catalysts 13 00067 g005
Figure 6. The mechanism of adjusting the NOx concentration downstream of the SCR catalyst, adapted from Tang et al. [63].
Catalysts 13 00067 g006
Figure 7. Ammonia slip time and saturation storage, as well as the change in space velocity at various catalyst temperatures [63].
Catalysts 13 00067 g007
Figure 8. The shifting phase of NOx actual conversion efficiency, in addition to ammonia storage at various catalyst temperatures [63].
Catalysts 13 00067 g008
Figure 9. The exhaust system on a 2000 cc diesel engine test rig [82].
Catalysts 13 00067 g009
Figure 10. NO2:NOx ratios from the 2000 cc diesel engine tests, adapted from Benjamin et al. [82].
Catalysts 13 00067 g010
Figure 11. Temperatures measured at the SCR inlet tests, adapted from Benjamin et al. [82].
Catalysts 13 00067 g011
Figure 12. Graphs demonstrating that the consumed NO2:NOx ratio was unaffected by the supplied NO2:NOx ratio during the transient. (a) 1,0 DOC test 0n the 20 s and (b) 0,5 DOC test on 20 s. The graph spikes are insignificant instrumentation errors from the CLD analyzer, adapted from Benjamin et al. [82].
Catalysts 13 00067 g012
Figure 13. Experimental bench system of a urea–SCR system for a 3900 cc diesel engine [74].
Catalysts 13 00067 g013
Figure 14. Performance at various NH3/NOx feed ratios [74].
Catalysts 13 00067 g014
Figure 15. Performance at various exhaust temperatures [74].
Catalysts 13 00067 g015
Figure 16. Schematic of engine testing [103].
Catalysts 13 00067 g016
Figure 17. NOx conversion between space velocity (inlet temperature 400 °C) [103].
Catalysts 13 00067 g017
Figure 18. Schematic diagram for diesel engine testing [45,67].
Catalysts 13 00067 g018
Figure 19. Engine speed and torque profiles when using the ESC test (Speed A: 1325 rpm, Speed B: 1750 rpm, Speed C: 2175 rpm, and Idle: 650 rpm), adapted from Wei et al. [45,67].
Catalysts 13 00067 g019
Figure 20. Exhaust flow rate and SCR temperature profile for the ESC test, adapted from Wei et al. [45,67].
Catalysts 13 00067 g020
Figure 21. Engine-out NOx concentration over the ESC test, adapted from Wei et al. [45,67].
Catalysts 13 00067 g021
Figure 22. Comparison of experimental and projected NOx emissions from actual production against predicted output upstream sources [92].
Catalysts 13 00067 g022
Figure 23. Quality of fit for the comparison of experimental and projected NOx emissions [92].
Catalysts 13 00067 g023
Figure 24. Comparison of experimental and projected NOx emissions from downstream source values [92].
Catalysts 13 00067 g024
Figure 25. Comparison of observed and projected ammonia slip values [92].
Catalysts 13 00067 g025
Figure 26. Schematic of the experimental setup for the 7100 cc diesel engine [114].
Catalysts 13 00067 g026
Figure 27. Comparison of exhaust temperatures for the ETC and WHTC, adapted from Bai et al. [114].
Catalysts 13 00067 g027
Figure 28. The effect of exhaust temperature on NOx conversion efficiency and ammonia slip (NH3 Slip) [114].
Catalysts 13 00067 g028
Figure 29. Experimental engine and test measurement setup adapted from Khristamto et al. [39,122].
Catalysts 13 00067 g029
Figure 30. Schematic diagram of the engine test adapted from Khristamto et al. [39,122].
Catalysts 13 00067 g030
Figure 31. The system’s urea injection models: (A) Urea injector model-I (suggested injector) and (B) urea injector model L (original model from D6CC diesel engine) adapted from Khristamto et al. [122].
Catalysts 13 00067 g031
Figure 32. The solid deposit inside the urea injector adapted from Khristamto et al. [39].
Catalysts 13 00067 g032
Figure 33. Sampled ammonia values in the catalyst inlet adapted from Khristamto et al. [122].
Catalysts 13 00067 g033
Figure 34. Ammonia distribution inside the catalyst adapted from Khristamto et al. [39].
Catalysts 13 00067 g034
Figure 35. The comparison of NOx conversion between injector model I and model-L (MEXA-7100 gas analyzer), adapted from Khristamto et al. [39].
Catalysts 13 00067 g035
Figure 36. SCR System principle for the marine engine [28].
Catalysts 13 00067 g036
Figure 37. NOx conversion rate values against ammonia gas flowrates [28].
Catalysts 13 00067 g037
Figure 38. NOx conversion rate values against urea–water solution flowrates [28].
Catalysts 13 00067 g038
Figure 39. NOx conversion rate values against ammonia gas equivalence ratio [28].
Catalysts 13 00067 g039
Figure 40. NOx conversion rate values against urea water solution equivalence ratio [28].
Catalysts 13 00067 g040
Table 1. Summary transient test conditions for 10 s and 20 s adapted from Benjamin et al. [82].
0.5 DOC (20 s)1.0 DOC (20 s)0.5 DOC (10 s)1.0 DOC (20 s)
MF kg/h109110109110.5
T deg C214.8213214213
% O211.111.311.111.4
NH3 ppm282282282283
NO ppm430266427267
NO2 ppm164275155275
Initial NO2: NOx %27.650.826.650.7
Table 2. Value of parameters at different NH3/NOx feed ratios, adapted from Wang et al. [74].
Ammonia and NOx Feed
Ratio
Velocity
Homogenization (%)
Ammonia
Homogenization (%)
Ammonia
Fraction (10−6)
0.693.8198.33444
0.893.8097.98635
1.093.8297.99713
1.293.8097.61765
1.493.8198.03824
Table 3. Values of parameters at different exhaust temperatures, adapted from Wang et al. [74].
Exhaust Gas
Temperature
(°C)
Velocity
Homogenization
(%)
Ammonia
Homogenization
(%)
Ammonia
Fraction
(×10−6)
30093.7797.69583
35093.8198.33772
40093.8398.49797
45093.8598.77757
50093.8698.80754
Table 4. Engine specification, adapted from Dong et al. [103].
Engine ModelYC4112ZLQ
Type of engineInline, 4-stroke
TypeTurbocharged Intercooled
Number of cylinders4
Fuel pumpBH4P120R1402
Displacement (L)5.12 L
Engine operation condition (rpm)660 Nm/1300–1500 rpm
Compression ratio17.5
Table 5. Specification of engine and aftertreatment system, adapted from Wei et al. [45,67].
Engine ModelYUCHAI YC6J180-42
Type of engineInline, 4-stroke
TypeTurbocharged and intercooled
Number of cylinders6
Idle speed650–50 rpm
Displacement (L)6.5 L
Engine operation condition (rpm)650 Nm/1200–1700 rpm
Table 6. Technical specifications of the experimental engine, adapted from Liu et al. [92,112].
Engine ModelYUCHAI YC6-42
Type of engineInline, 4-stroke
TypeTurbocharged and intercooled
Number of cylinders6
Idle speed650–50 rpm
Displacement (L)6.6 L
Engine operation condition (rpm)960 Nm/1200–1700 rpm
Table 7. Engine test parameters, adapted from Liu et al. [92].
ModeSpeed
(rpm)
Fuel Supply
(mg/cyc)
Load
(%)
NOx
(ppm)
Catalyst
Temp.(°C)
Torque
(N.m)
1100017130862215215
21000309601401326391
3100050390849492585
4150016830684250204
51500300601131344408
61500436901306415612
7200017830498249201
8200029960767318395
92000429901026394596
10250016530290227153
11250026560489296312
12250036490674378471
Table 8. The statistical models, adapted from Liu et al. [92].
ModelUpstream NOx EmissionsDownstream NOx EmissionsAmmonia Slip
TrainingTestAllTrainingTestAllTrainingTestAll
MAPE
(%)
1.714.773.242.176.894.53---
R20.990.980.990.990.980.990.990.970.98
RMSE
(ppm)
24.6257.1644.119.5625.8721.871.342.842.22
FitsY1 = 0.9849 × X1 + 8.0395Y2 = 0.9644 × X2 + 6.8769Y3 = 0.9786 × X3 + 0.9270
Table 9. The engine specifications, adapted from Bai et al. [114].
Type of EngineInline, 4-stroke
TypeTurbocharged and intercooled (VGT)
Number of cylinders6
Emission standardEuro V
EGR type Electronic EGR
Displacement (L)7.14 L
Torque (N.m)1100
Compression ratio18
Bore × stroke (mm)108 × 130
Idle speed (rpm)650
Rate speed (rpm)2100
Rate power (kW)200
Table 10. Experimental setup, adapted from Bai et al. [44,92,114,119].
Equipment TestMeasurement Value
DynamometerSpeed (± 1 rpm)
Torque (± 0.1% FS)
Opacimeter5 µg
Exhaust gas analyzer1 ppm vol
0.01%vol
Ammonia analyzer± 0.1%
Table 11. WHTC value, adapted from Bai et al. [114].
EmissionNOx
g/(kW h)
PM
g/(kW h)
CO
g/(kW h)
NMHC
g/(kW h)
IV3.70.034.00.55
V2.80.034.00.55
Table 12. Testing Parameters adapted from Khristamto et al. [39,122].
ParametersEngine Operation = 1000 rpm
ConditionsUnit
Engine operating t1000/200rpm/Nm
Exhaust mass 513kg/h
NOx 1285ppm
Injector inlet/SCR inlet
temperature
371°C
AdBlue 1319mL/h, NSR = 1.0
CO2, 9.3%
O28%
NOx 1083g/h
H2O9.3%
Table 13. The engine specifications, adapted from Yoichi et al. [28].
EngineLaboratory Engine
Engine type4-stroke
Bore × stroke (mm)190 × 260
FuelHeavy oil (A)
Engine speed (rpm)1000
Number of cylinders6
Rate power (kW)750
Table 14. Exhaust gas temperatures, adapted from Yoichi et al. [28].
Load (%)255075100
Temperature (°C)350400390400
Disclaimer/Publisher’s Note: The statements, opinions and data contained in all publications are solely those of the individual author(s) and contributor(s) and not of MDPI and/or the editor(s). MDPI and/or the editor(s) disclaim responsibility for any injury to people or property resulting from any ideas, methods, instructions or products referred to in the content.

