Article

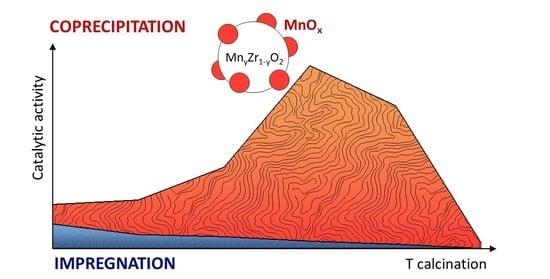
The Catalytic Performance of CO Oxidation over MnOx-ZrO2 Catalysts: The Role of Synthetic Routes

by
Olga A. Bulavchenko
1,2,*,
Valeriya P. Konovalova
1,2,
Andrey A. Saraev
1,2,
Anna M. Kremneva
1,
Vladimir A. Rogov
1,2,
Evgeny Yu. Gerasimov
1,2 and
Tatyana N. Afonasenko
3
1
Boreskov Institute of Catalysis SB RAS, Lavrentiev Ave., 5, Novosibirsk 630090, Russia
2
Department of Physics, Novosibirsk State University, Pirogova, 2, Novosibirsk 630090, Russia
3
Center of New Chemical Technologies, Boreskov Institute of Catalysis, Neftezavodskaya 54, Omsk 644040, Russia
*
Author to whom correspondence should be addressed.
Catalysts 2023, 13(1), 57; https://doi.org/10.3390/catal13010057
Submission received: 14 November 2022 / Revised: 14 December 2022 / Accepted: 23 December 2022 / Published: 27 December 2022

Abstract

:
MnOx-ZrO2 catalysts prepared by co-precipitation and vacuum impregnation were calcined at 400–800 °C and characterized by powder X-ray diffraction, textural studies, high-resolution transmission electron microscopy, temperature-programmed reduction, X-ray absorption near edge structure, and X-ray photoelectron spectroscopy. The catalytic activity was tested in the CO oxidation reaction. The activity of the co-precipitated samples exceeds that of the catalysts prepared by vacuum impregnation. The characterization studies showed that the nature of the active component for the catalysts obtained by co-precipitation differs from that of the catalysts obtained by impregnation. In the impregnation series, the most active catalyst was obtained at a temperature of 400 °C; its increased activity is due to the formation of MnO2 oxide nanoparticles containing Mn4+ and low-temperature reducibility. An increase in the synthesis temperature leads to the formation of less active Mn2O3, catalyst sintering, and, accordingly, deterioration of the catalytic properties. In the case of co-precipitation, the most active CO oxidation catalysts are formed by calcination at 650–700 °C in air. In this temperature interval, on the one hand, a MnyZr1−yO2−x solid solution is formed, and on the other hand, a partial separation of mixed oxide begins with the formation of highly dispersed and active MnOx. A further increase in temperature to 800 °C leads to complete decomposition of the solid solution, the release of manganese cations into Mn3O4, and a drop in catalytic activity.

Graphical Abstract

1. Introduction

The development of the field of catalysis over the past decades has led to increased interest in the use of transition metals as catalysts, offering a great alternative to noble metals. Transition-metal-oxide-based catalysts combine low cost with increased thermal stability and resistance to poisoning by chlorine and sulfur-containing substances, thereby prolonging their lifetime and reducing operation costs [1]. Among the oxides of transition metals, manganese oxides are of the greatest interest as catalysts for the oxidation of hydrocarbons, CO and VOCs, and selective catalytic reduction of NOx [2,3,4]. The catalytic activity in oxidation reactions on manganese oxides is associated with their structural flexibility (MnO, Mn2O3, Mn3O4, Mn5O8, MnO2), variety in the oxidation state of manganese, and oxygen mobility. The activity of manganese oxides is due to the ability of manganese ions to easily change the oxidation state [3]. Oxide carrier and preparation method affect the structure and redox properties of MnOx catalysts. The extent of the promoting effect depends on the nature of the oxide support interaction resulting in the following reducibility scale: MnOx/TiO2 < MnOx/Al2O3 < MnOx/ZrO2 [5]. A similar relationship was found in ethanol oxidation [6].
Manganese-based mixed oxides exhibit improved catalytic properties in oxidation reactions compared with single-component catalysts. For the MnOx-ZrO2 catalyst, an increase in catalytic activity is observed due to the interaction between manganese and zirconium oxides. The presence of ZrO2 stabilizes the manganese oxide phase in the catalytically active state MnO2 [7], and the addition of Mn to zirconium oxide favors the formation of the metastable tetragonal zirconia phase with respect to the thermodynamically stable phase of monoclinic zirconia [8] and the formation of solid solutions of Zr1−yMnyO2 [9,10]. The introduction of an Mn cation with an oxidation state lower than 4+ into the zirconia results in the formation of oxygen vacancies. Recently, it has been reported that the Zr1−yMnyO2 solid solution exhibited excellent catalytic activity for toluene oxidation, where the contribution of oxygen vacancy in the oxide matrix played a key role in significant improvement of catalytic activity [11]. On the other hand, several works [12,13,14,15] proposed that highly dispersed MnOx species provide activity in oxidation reactions. It should be emphasized that there is a great difficulty in determining the amorphized and dispersed MnOx phases, which gives rise to different interpretations of experimental data. The research groups led by Choundary and Dobber compared a series of catalysts prepared by impregnation and co-precipitation and came to opposite conclusions about the nature of the active component. Dobber et al. [14] supposed that MnOx-ZrO2 interactions in the process of catalyst preparation and calcination led to the formation of amorphous highly dispersed MnOx species. Choundary et al. [10] proposed that high lattice oxygen reactivity of the Mn-doped ZrO2 and consequently its high methane combustion activity could be attributed mainly to the increased mobility of the lattice oxygen due to the doping of Mn in ZrO2 [10]. A further study by Kaplin et al. [12] showed that during impregnation the formation of more active MnOx is observed compared with the co-precipitation method and incorporation of Mn into oxide. The higher catalytic activity is caused by the presence of local surface areas enriched with MnOx.
Despite the considerable research interest in the catalytic properties of MnOx-ZrO2 systems, the nature of the active phases is still a matter of debate. To study the origin of active species in MnOx-ZrO2 catalysts, two approaches were used. The first of them includes a comparison of the catalytic properties for catalysts prepared by impregnation and co-precipitation methods and having the same Mn content. The second approach consists in investigating the decomposition of Zr1−yMnyO2 solid solution as a method to prepare the dispersed MnOx species. For this, two series of MnOx-ZrO2 mixed catalysts with the Mn:Zr molar ratio 1:4 were synthesized by co-precipitation and vacuum impregnation with further calcination at 400–800 °C. The physicochemical properties were studied by X-ray diffraction (XRD), high-resolution transmission electron microscopy (TEM), temperature-programmed reduction (TPR-H2), X-ray absorption near edge structure (XANES), and X-ray photoelectron spectroscopy (XPS); the catalytic activity was tested in CO oxidation.

2. Results and Discussion

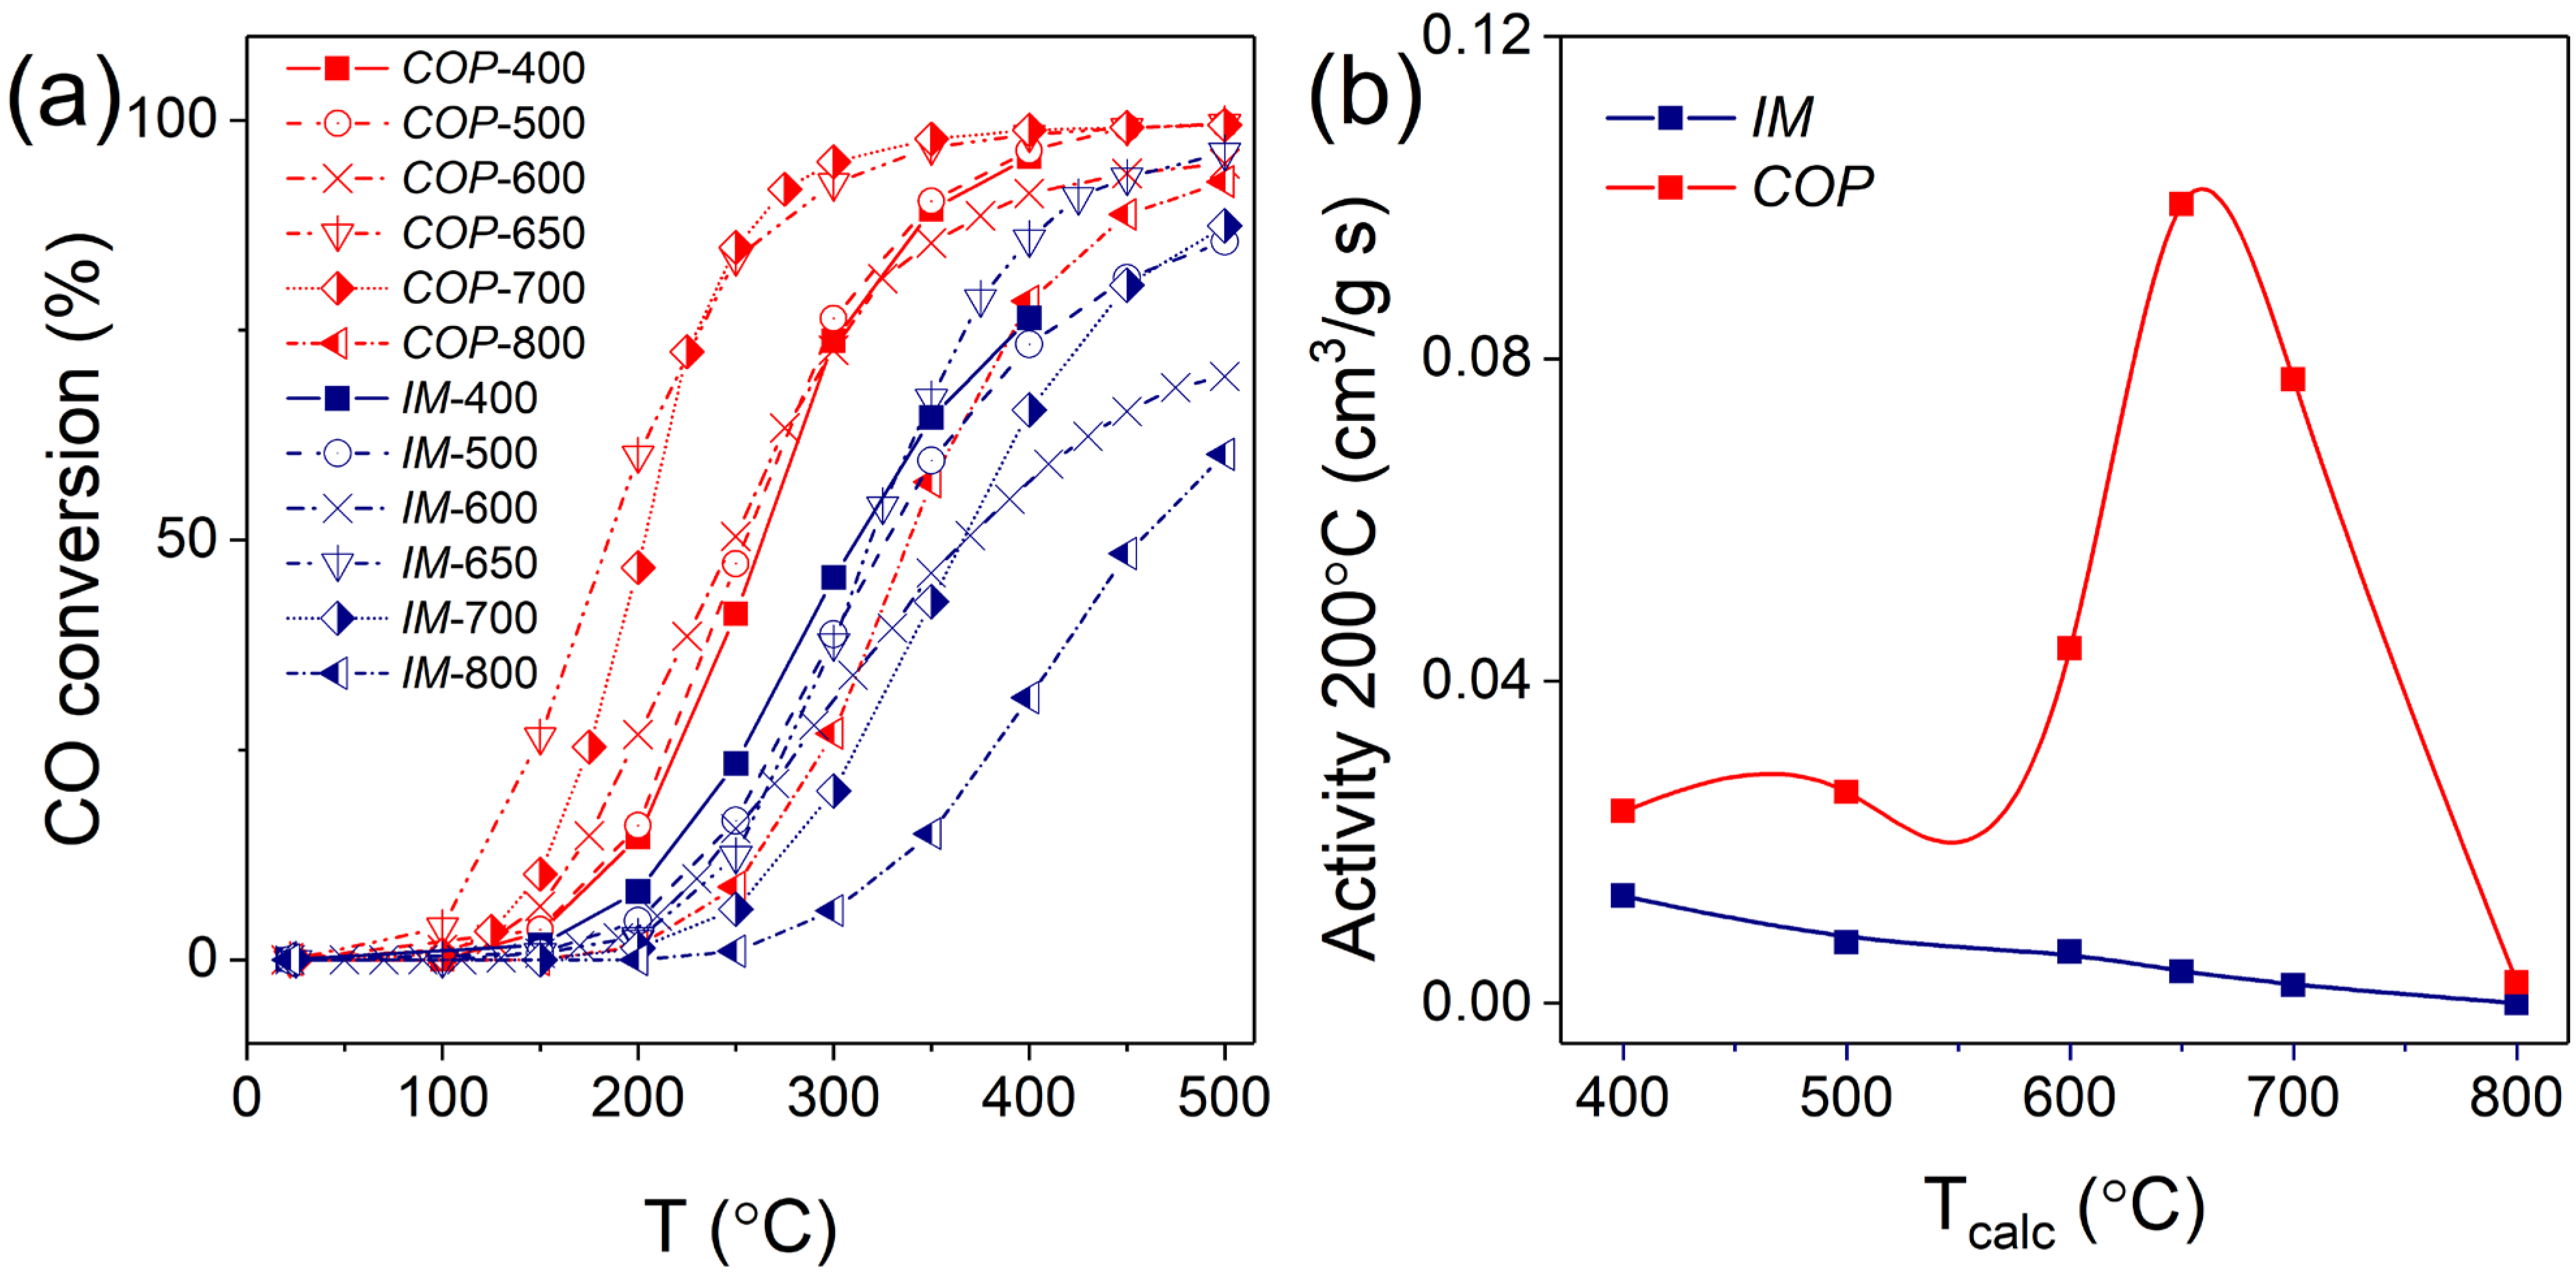
2.1. Evaluation of the Catalytic Activity in CO Oxidation for the IM and COP Series

Figure 1a shows the evolution of CO conversion as a function of temperature for MnOx-ZrO2 catalysts prepared by co-precipitation and vacuum impregnation followed by calcination in air in the temperature range 400–800 °C. The light-off curves for the COP catalyst calcined at 400–700 °C are shifted to the low-temperature region as compared with the curves for the IM series. For the COP series, the temperature of 50% CO conversion (T50) decreases from 262 to 185 °C as the synthesis temperature is increased from 400 to 650 °C. A further increase in the annealing temperature up to 800 °C leads to the opposite effect: T50 grows to 342 °C. In the case of the IM catalyst, T50 varies in the range of 312 to 457 °C.
Figure 1b shows the activity calculated at 200 °C versus the calcination temperature of MnOx-ZrO2 catalysts obtained by different methods. The activity of COP samples exceeds the activity of IM samples at a similar temperature. For the COP series, the catalytic activity sharply increases in the calcination temperature range of 600–700 °C and passes through a maximum at 650 °C. At 700 °C, the activity of the catalyst slightly decreases, but still its value is significantly higher than at other temperatures. A further increase in the synthesis temperature to 800 °C is accompanied by a sharp decline in catalytic activity. For the catalysts obtained by impregnation, a completely different relationship is observed: with an increase in the calcination temperature, a decrease in catalytic activity occurs. In the IM series, the best activity in CO oxidation is characteristic of the samples obtained at 400 °C.

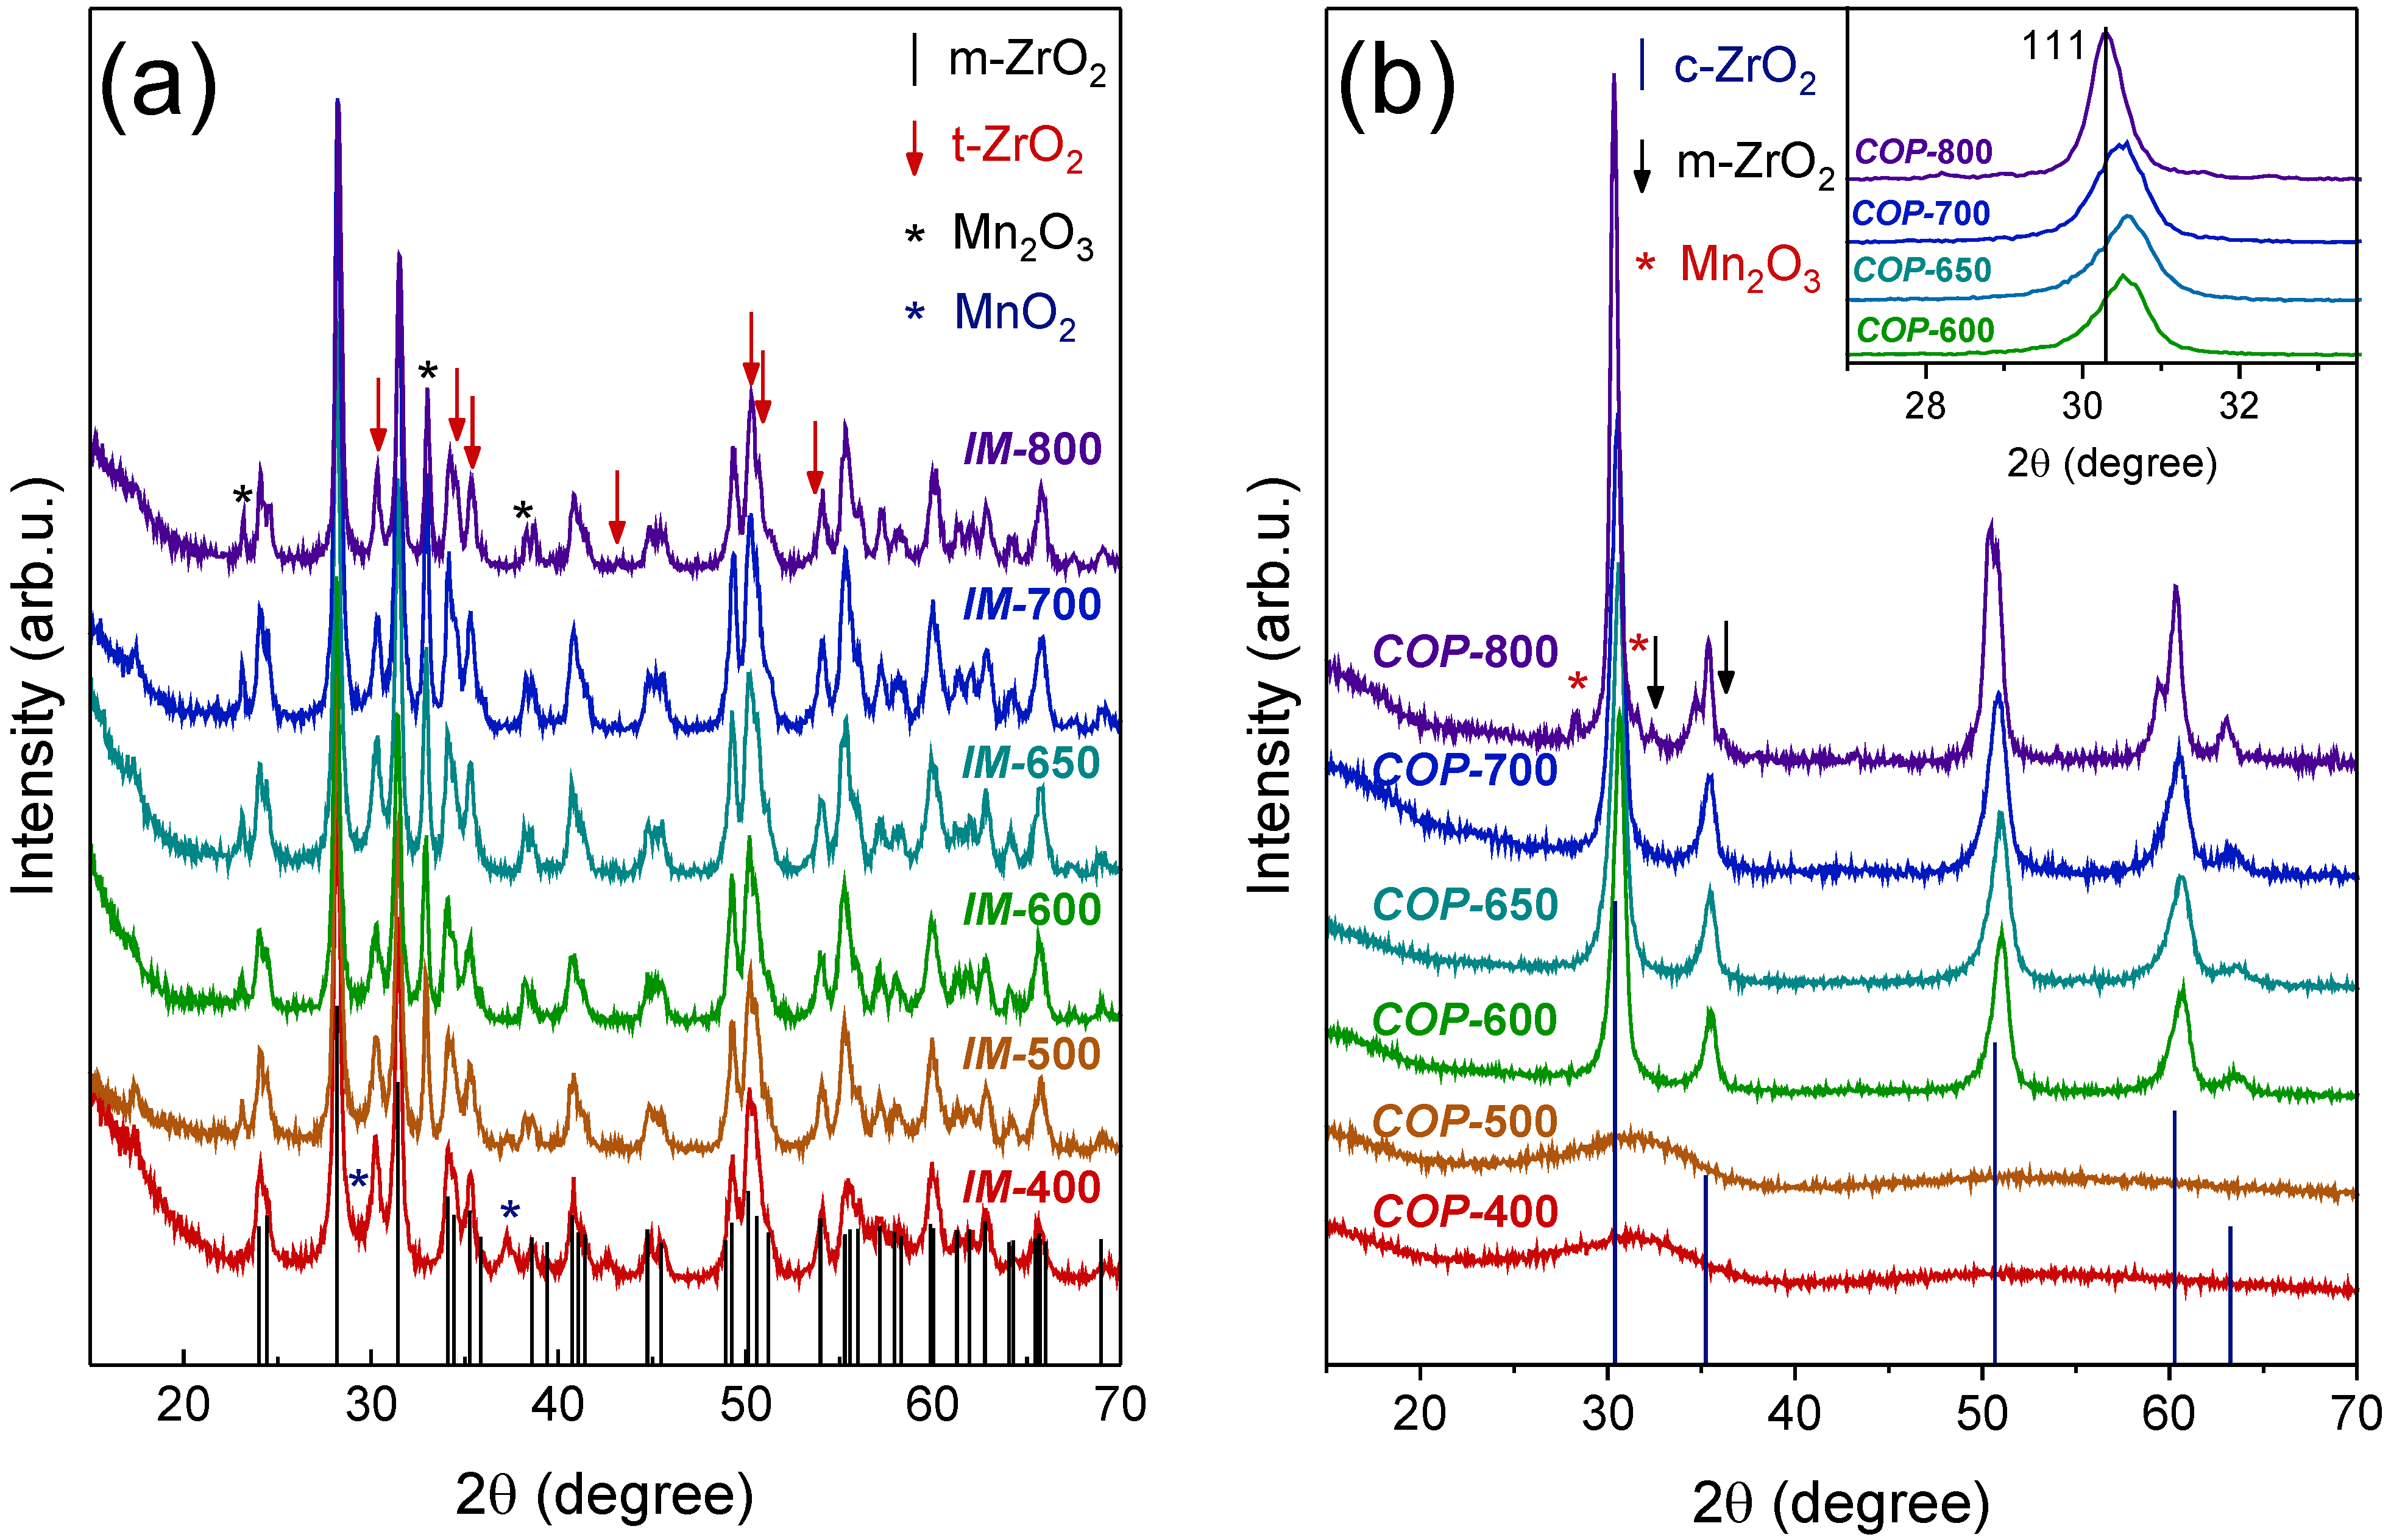
2.2. Structural and Microstructural Properties

Figure 2 shows XRD patterns for the IM and COP series. The XRD pattern of pure ZrO2 consists of the mixed crystal phases corresponding to monoclinic (sp. gr. P 21/c, PDF No. 37-1484) and tetragonal (sp. gr. P 42/nmc, PDF No. 50-1089) phases. For the IM-400 catalyst, XRD patterns contain peaks located at 2θ = 28.8, 37.2, 42.7, 56.6° and correspond to reflections of MnO2 (sp. gr. P nma, PDF No. 44-142). An increase in calcination temperature up to 500 °C leads to the disappearance of MnO2 reflections and formation of Mn2O3 oxide (diffraction lines at 2θ = 23.1, 32.9, 38.2, 45.1, 49.3, 53.2, 55.1, 64.0, 65.7, 67.4, 69.0°, sp. gr. I a-3, PDF No. 41-1442). With an increase in the calcination temperature, the crystallite size of tetragonal zirconia increases from 140 to 210 Å; the crystallite size of ZrO2 in monoclinic modification and Mn2O3 varies in the ranges of 210–240 Å and 280–310 Å, respectively (Table 1). Specific surface area decreases from 60 to 13 m2/g with increasing synthesis temperature.
Figure 2b shows XRD patterns for COP series. XRD patterns of COP-400 and COP-500 contain a wide halo at 2θ = 25–40° probably due to formation of the amorphous phase. An increase in the calcination temperature to 600–700 °C leads to the appearance of diffraction lines located at 2θ = 30.6, 35.4, 50.9, 60.5, 63.5° and corresponding to reflections of ZrO2 with the fluorite-type structure, space group Fm3m (PDF No. 49-1642). It is worth noting that no individual diffraction peaks of manganese oxide could be found over the samples, which indicates that Mn cations might enter the zirconia structure with the formation of a solid solution or be in an amorphous state of MnOx. For the COP-800 catalyst, there are additional reflections located at 2θ = 28.2, 29.0, 31.5, 32.5, 34.7, 36.2, 43.1, 44.5, 50.3, 58.6, 59.4, 60.0, 64.7, and 68.7°. Peaks at 29.0, 32.5, 36.2, 44.5, 58.6, 60.0, and 64.7° belong to 112, 013, 121, 220, 231, 224, and 040 reflections of manganese oxide Mn3O4 (PDF No. 240734); 28.2 and 31.5° are attributed to 11-1 and 111 reflections of monoclinic ZrO2 (PDF No 50-1089). The appearance of diffraction peaks at 2θ = 34.7, 43.1, 50.3, 59.4, and 68.7° indicates the tetragonalization of the zirconia lattice.
The insert in Figure 2b shows that the position of 111 reflection of fluorite shifts to a higher angle value relative to the standard maximum of zirconia (2θ = 29.802°, PDF No. 49-1642). COP-600 exhibits the maximum offset. With an increase in calcination temperature, the shift of the peak position decreases. A change in the position of the reflection toward high angles indicates a decrease in the lattice parameter of oxide and the formation of MnyZr1−yO2−x solid solution. The substitution of smaller Mn3+ cations (the ionic radius of 0.66 Å) for bigger Zr4+ cations (the ionic radius of 0.79 Å [16]) leads to a decrease in the lattice parameter of the solid solution based on zirconia and shifts the peak positions to the higher 2θ region. The lattice parameters, normalized lattice volume, crystallite size, and microstrain are summarized in Table 2. Since the transformation of cubic to tetragonal structure during thermal treatment is observed, for a convenient comparison of the lattice parameters of solid solutions we used the normalized volume V/N of the unit cell (N is the number of formula units). The normalized lattice volume increases with temperature from 16.37(1) to 16.65(1) Å3 and becomes close to the value for pure zirconium oxide (V/N = 16.86 Å3). A decrease in the lattice volume is associated with the exit of manganese cations from the solid solution structure and the formation of initially amorphous MnOx oxides (up to 700 °C), and crystallization of Mn3O4 at 800 °C (Table 1, Figure 2b). This process is accompanied by a decrease in the amount of microstrains from 0.006 to 0.004 and an increase in the crystallite size from 270 to 310 Å (Table 1). As the calcination temperature is increased from 400 to 800 °C, the specific surface area decreases from 331 to 14 m2/g.

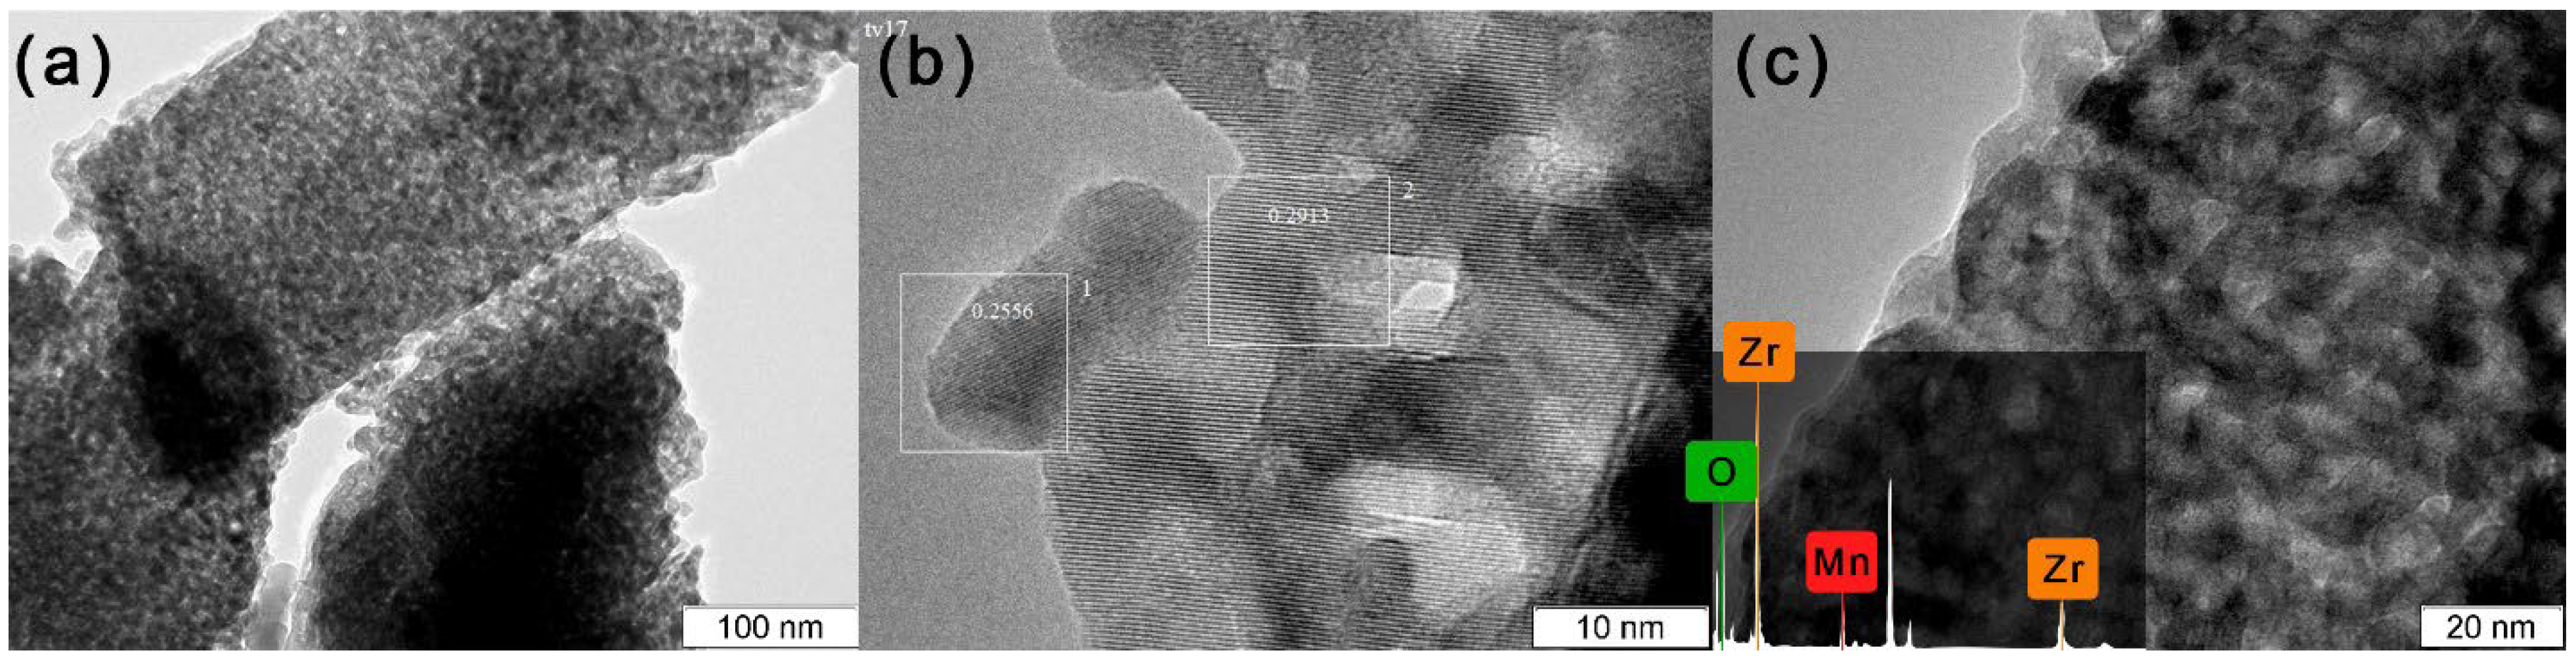
2.3. TEM Study (Morphology, Composition, and Distribution)

For IM-400, TEM images demonstrate large aggregates with sizes of 100–200 nm (Figure 3a,b) and smaller particles of a rounded shape with sizes of 10–20 nm (Figure 3c). The latter particles are associated with the monoclinic modification of ZrO2, since the Fourier image contains distances of 0.498, 0.364, 0.262, and 0.232 nm corresponding to the (100), (110), (002), and (02-1) planes of zirconia (PDF No. 37-1484), respectively. In addition, disordered particles can be distinguished with an interplanar distance of 0.313 nm corresponding to the (110) MnO2 plane. The EDX analysis shows that in this region the Mn:Zr ratio is 98:2 at. %. For IM-650, TEM images demonstrate smaller particles of the monoclinic modification of ZrO2 with sizes of 10–20 nm (Figure 3d,f). In addition, there are particles with an interplanar distance of 0.39 and 0.27 nm corresponding to the (211) and (222) Mn2O3 planes (Figure 3e).
For COP-650, there are large aggregates of 300–600 nm in size (Figure 4a). They consist of primary disordered particles with sizes of 10–30 nm (Figure 4b). The interplanar distances of 0.256 and 0.291 nm correspond to the (111) and (200) fluorite planes. According to EDX analysis, the sample contains Mn and Zr atoms in a ratio of 25:75, which is consistent with the synthesis proportion (Figure 4c). Thus, the TEM results confirm the formation of a MnxZr1−xO2 solid solution by the co-precipitation method.

2.4. XANES Study

The Mn K-edge XANES spectra of the IMP and COP catalysts and those of standard manganese compounds are shown in Figure 5 and can provide information on the local atomic and local electronic structures of the compounds. The Mn K-edge XANES spectra of the samples obtained represent two regions: the main feature at the Mn K-edge originates from the 1s → 4p dipole transitions and the pre-edge region, which is due to 1s → 3d transitions [17].
The main peak at the Mn absorption edge for COP-400 is observed at 6560.2 eV, and there is also a small peak at 6540.7 eV in the pre-edge region (Figure 5b). The main peak of COP-600-700 has a slight shift toward low energy and a doublet structure. Such a shape within these spectra probably arises due to the superposition of absorption spectra from manganese atoms located in different local environments.
It is known that the absorption edge shifts to higher energies with an increase in the average oxidation state of Mn. There is a nearly linear relationship between the energy positions of electronic transitions and the formal oxidation state in the series of Mn-oxides. Spectra of standard manganese compounds are also shown in Figure 5c and were used to determine the correlation between the K-edge excitation energy and the oxidation state of the metal cation using the positions of the K absorption edge of standard manganese oxide compounds: MnO (Mn2+), Mn3O4 (Mn2.67+), Mn2O3 (Mn3+) and MnO2 (Mn4+), and Mn [18,19,20,21,22]. The experimental value of the absorption edge is about 6549.6 eV, and the shifts of the absorption edges for all samples are in the range of ±0.2 eV, which indicates the average oxidation state of Mn to be from 3.17+ to 3.24+.
In the case of the IM catalysts, the XANES spectrum of the IM-400 sample corresponds to that of Mn in MnO2, and the spectra of samples IM-600–IM-650 correspond to that of Mn in Mn2O3 (Figure 5a). The XANES spectrum of IM-800 has a similar shape to that of Mn3O4. The charge states of Mn atoms are in accordance with those in corresponding compounds.

2.5. Results of the TPR-H2 Analysis
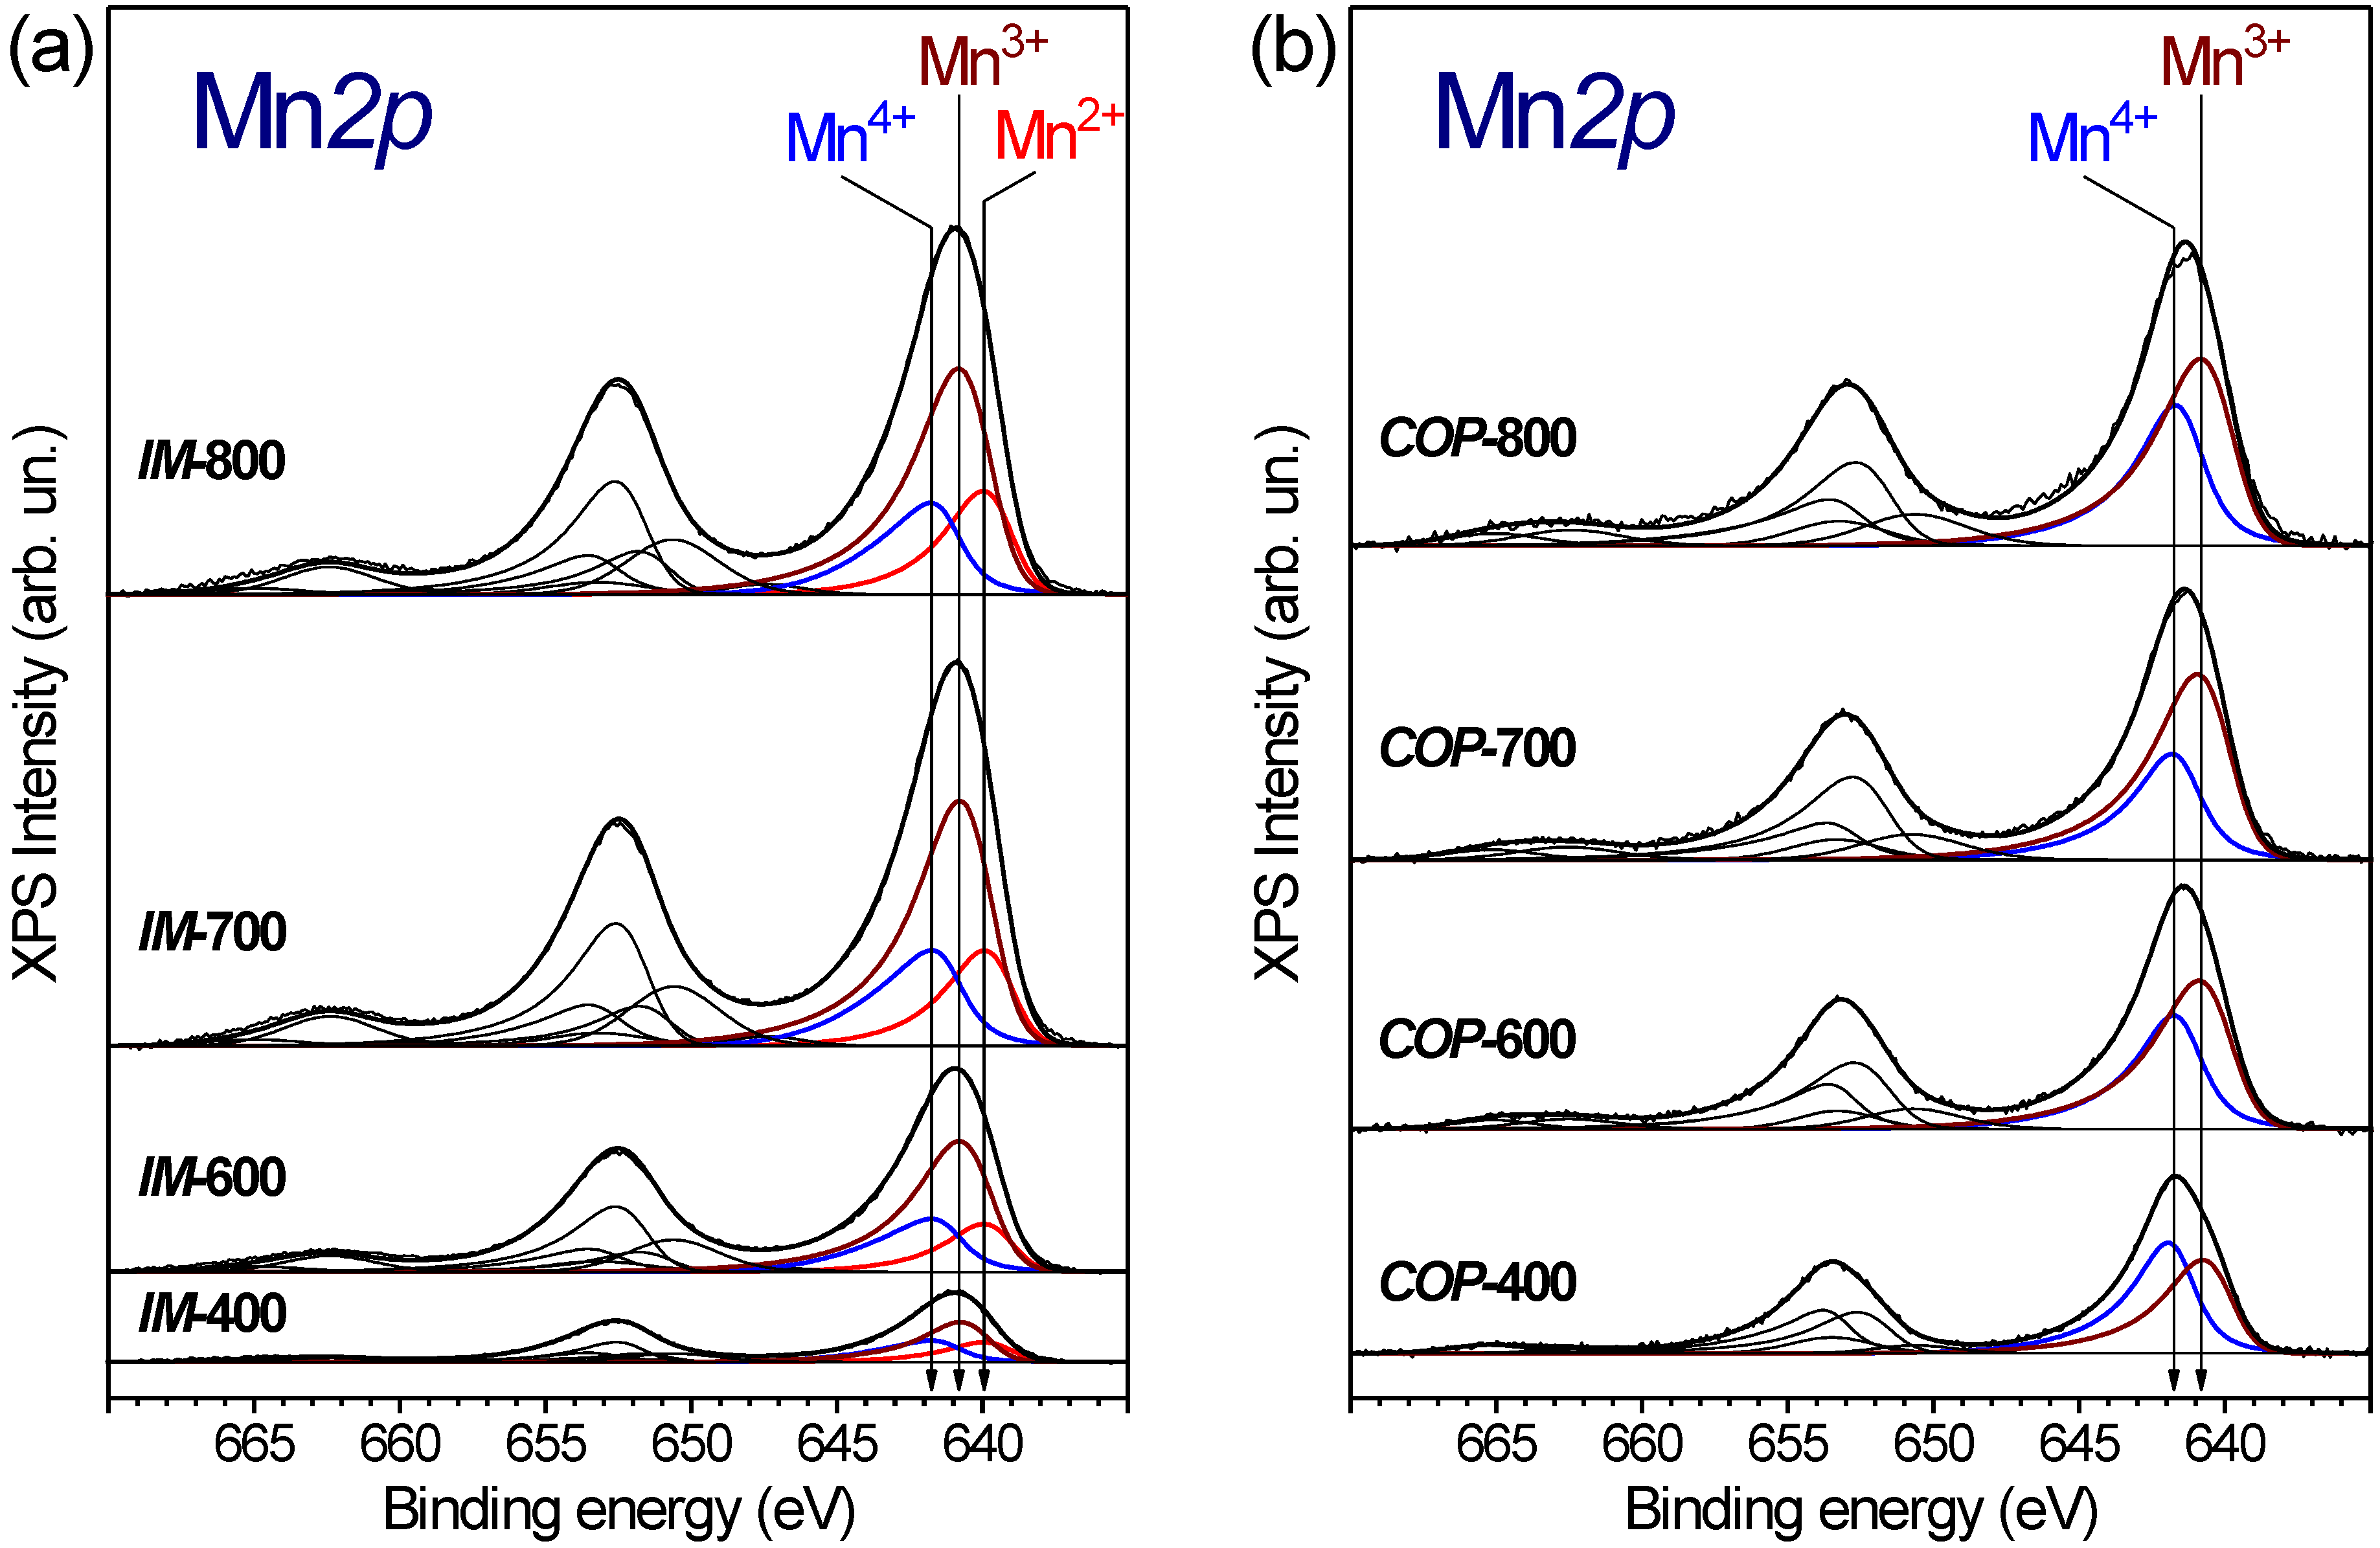
The TPR profiles of the IM and COP catalysts compared with those of pure Mn3O4, Mn2O3, and ZrO2 samples in the 50–900 °C temperature range are shown in Figure 6. The reduction of Mn2O3 is characterized by two regions of hydrogen absorption with maxima at 390 and 470 °C corresponding to the two-step reduction Mn2O3→Mn3O4→MnO [23,24]. For Mn3O4, there is one hydrogen absorption peak at 510 °C due to Mn3O4→MnO [23,24]. No hydrogen absorption is observed for pure ZrO2. The TPR curve for the catalyst obtained at 400 °C differs from those for other IM-600-800 catalysts. For IM-600, the TPR curves consist of three peaks with maxima at 390, 460, and 560 °C. With an increase in the calcination temperature to 800 °C, positions of the first and second TPR peaks shift to the high-temperature region up to 460 and 510 °C, respectively, whereas the position of the third peak does not change. The two peaks are associated with the reduction of Mn2O3, and the shift in the reduction temperatures is likely to correspond to the catalyst sintering (Table 1). The third high-temperature peak (T = 560 °C) is probably due to the partial reduction of Zr4+ to Zr3+ or the reduction of Mn cations from the ZrO2 structure. For IM-400, an intense low-temperature absorption peak is observed at 350 °C due to the reduction of MnO2 [25,26]. The total hydrogen consumption for IM-400 is larger than for the catalyst calcined at 600–800 °C (1.7 × 10⁻³ mol H2/g versus 1.0–1.1 × 10⁻³ mol H2/g).
Figure 6b shows TPR-H2 curves for the catalysts obtained by co-precipitation. For the COP catalyst prepared at 400–700 °C, two regions of hydrogen absorption are observed: broad low-temperature TPR peaks at 140–500 °C and a weak high-temperature peak located between 500 and 600 °C. The low-temperature region has an asymmetric shape, which may be associated with the presence of various oxygen states. For the COP-400 and COP-500 catalysts containing an X-ray amorphous state, the low-temperature region of hydrogen consumption contains two components with maxima at 220–230 °C (peak 1) and 365–385 °C (peak 2). According to XRD data, an increase in the preparation temperature to 600–700 °C leads to the formation of a crystalline MnyZr1−yO2−x solid solution (Table 1, Figure 2b). In this case, the TPR profile moves toward the low-temperature region. With an increase in the calcination temperature from 400 to 700 °C, the position of peak 1 moves from 220 to 210 °C, and peak 2 shifts from 370 to 320 °C. Peak 1, located at 150–300 °C, is attributed to the reduction of easily reducible and highly dispersed surface manganese species [5,12,13,27,28,29], whereas a broad peak 2 at 250–500 °C is associated with the reduction of manganese cations in the MnxZr1−xO2 solid solution [30] or Mn cations in the Mn-Zr-O amorphous species. With an increase in the calcination temperature from 400 to 700 °C, the intensity of peak 1 grows from 1.3 × 10⁻⁴ to 1.9 × 10⁻⁴ mol H2/g (the calculated H2 consumption varies from 30 to 250 °C), indicating an increase in the amount of dispersed MnOx species. For COP-800, the TPR profile changes: the consumption of hydrogen drastically decreases in the region of 150–400 °C (peaks 1 and 2), and a new intense TPR peak with a maximum at 485 °C (peak 3) appears. Peak 3 is associated with the reduction of crystalline species of Mn3O4 oxide in accordance with XRD findings. The origin of the weak high-temperature peak, which is observed at 540–560 °C (peak 4), is still debatable. It is usually attributed to the reduction of cations Mn3+→Mn2+ in the lattice of zirconia [6,13,14,30]. However, sometimes this peak is associated with the reduction of zirconia itself [31]. It is worth mentioning that the H2 consumption of high-temperature TPR peaks for IM series is larger than in the case of COP series (0.5–2.8 × 10⁻⁴ mol H2/g versus 0.2 × 10⁻⁴ mol H2/g).

2.6. XPS Study

To study the chemical states and relative concentrations of elements in the (sub)surface layers of catalysts, XPS was applied. Figure 7 shows the Mn2p core-level spectra of the IM and COP catalysts calcined at different temperatures. To identify the chemical state of manganese, the binding energy of the Mn2p3/2 peak and the intensity and position of satellites are used [32,33,34]; the asymmetry of the main peaks is due to the multielectron process. The fitting of the Mn2p spectra allows us to reveal that manganese is present in the Mn2+, Mn3+, and Mn4+ states, and that the Mn2p spectra are fitted by three Mn2p3/2–Mn2p1/2 doublets corresponding to manganese in the Mn2+, Mn3+, and Mn4+ states, and by the satellites located, respectively, at a distance of 6.7, 10.6, and 11.8 eV from the main peaks. The binding energies of Mn2p3/2 peaks equal to 640.0, 640.6, and 641.8 eV are assigned to the Mn2+, Mn3+, and Mn4+ states, respectively. In the literature, the Mn2p3/2 binding energies reported for MnO, Mn2O3, and MnO2 oxides are in the ranges of 640.4–641.7, 641.5–641.9, and 642.2–642.6 eV, respectively [32,33,35,36,37,38,39,40,41,42,43,44]. The XPS analysis allows us to estimate the fraction of manganese in different oxidation states (Table 2). The Zr3d spectra are fitted by one Zr3d5/2-Zr3d3/2 doublet with the Zr3d5/2 binding energy of 181.9 eV. The observed binding energy corresponds to zirconium in the Zr4+ state. Indeed, for stoichiometric ZrO2 the Zr3d5/2 binding energy varies in the range of 181.9–182.3 eV [45,46,47,48].
The relative surface concentrations (atomic ratios) of elements are listed in Table 2. For the IMP catalysts, with an increase in the calcination temperature from 400 to 800 °C, the content of Mn2+ and Mn3+ on the surface increases, and the content of Mn4+ decreases. In the case of the IM-400 catalyst, the lowest [Mn]/[Zr] ratio of 0.41 and the maximum content of Mn4+ are observed. It is likely that the formation of the low-temperature Mn4+ catalyst is due to the presence of the MnO2 phase. Simultaneously, segregation of the surface Mn cations occurs, and the [Mn]/[Zr] ratio changes from 0.49 to 2.41 with an increase in the calcination temperature from 400 to 700 °C. Interestingly, the most active catalyst, IM-400, is characterized by the minimum concentration of the surface Mn. According to TEM data, the IM-400 catalyst contains large disordered MnO2 particles with the size of 200–500 nm (Figure 3). It is likely that further calcination leads to the “spreads” of manganese over the support surface due to MnO2→Mn2O3 transformation. Another explanation is partial sintering of zirconia particles. As a result, the surface area of zirconia decreases, and therefore, the relative XPS signal of Mn grows.
In the case of the COP catalyst, with an increase in the calcination temperature from 400 to 800 °C, the surface content of Mn gradually increases. In this case, the [Mn]/[Zr] ratio varies in a narrow range from 0.19 to 0.35, contrary to the IM catalysts, where this ratio changes from 0.49 to 2.41 (Table 2). It should be noted that for all the IM samples, manganese is in the oxidation states 2+, 3+, and 4+; for COP samples, only 3+ and 4+ states are observed. For COP catalysts, with an increase in temperature from 400 to 800 °C, the content of Mn3+ cations increases from 46 to 59%, whereas the Mn4+ content decreases from 54 to 41%.

2.7. Factors Determining the Catalytic Activity

Two series of MnOx-ZrO2 catalysts with Mn:Zr = 1:4 were prepared by co-precipitation and vacuum impregnation with subsequent calcination at temperatures from 400 to 800 °C and then tested in CO oxidation. The activity of the COP catalysts exceeds that of the IM catalyst in the calcination temperature range from 400 to 700 °C (Figure 1). Catalysts prepared by co-precipitation and impregnation have the same chemical composition, but their physicochemical properties differ. In the case of the IM series, the catalysts contain support ZrO2 (mon), ZrO2 (tetr), and Mn oxides as active components. The most active catalyst was obtained at 400 °C; its activity in CO oxidation is due to the formation of MnO2 oxide containing Mn4+, and a low-temperature reducibility. According to XPS results (Table 2), with an increase in the calcination temperature from 400 to 700 °C, segregation of the surface Mn cations occurs. However, it does not lead to an increase in catalytic activity. An increase in the calcination temperature leads to the formation of less active Mn2O3 and a decrease in surface area, and the TPR profiles shift to the high-temperature region, which indicates a decrease in the oxygen mobility of the catalyst.
For the COP series of catalysts, the dependence of catalytic activity on the calcination temperature of the catalyst has a volcano-like shape with a maximum at 650–700 °C. For COP-400 and COP-500, an X-ray amorphous state is formed. An increase in the synthesis temperature leads to the formation of a MnyZr1−yO2−x solid solution with the fluorite structure. An increase in the calcination temperature is accompanied by an increase in the lattice parameter of the MnyZr1−yO2−x oxide (Table 1). The lattice parameter approaches the value for “pure” zirconium oxide, which is associated with the release of manganese cations from the solid solution structure. Simultaneously, the enrichment of the surface with manganese cations can be detected by XPS (Table 2). According to TPR, an increase in the low-temperature peaks of H2 consumption occurs, which is attributed to the highly dispersed MnOx oxide. The decomposition of the MnyZr1−yO2−x solid solution into simple manganese and zirconium oxide begins. For COP-800, the amount of the dispersed MnOx species decreases (peak 1, Figure 6b); the dispersed MnOx species are transformed into Mn3O4 species in accordance with the XRD findings.
Noteworthy are the catalysts prepared at 600–700 °C. Indeed, XRD, XPS, H2-TPR, and BET demonstrate the similarity among catalysts prepared at 600–700 °C: all of them contain MnyZr1−yO2−x oxide with a close crystallite size; the charge states of Mn cations on the surface and their specific surface areas are nearly equal, and the profiles of H2 consumption look quite close. However, the catalytic properties change drastically: T50 increases from 185 to 248 °C, and R decreases from 0.099 to 0.044 cm3/(g∙s) for COP-650 and COP-600, respectively. It is likely that a tendency to decomposition of the solid solution MnyZr1−yO2 contributes to the formation of the active state of the catalyst. Several signs indicate the decomposition of the solid solution: (1) a change in parameters of the mixed oxide towards “pure” zirconium oxide, (2) a tendency to form a phase of manganese oxide at 800 °C, and (3) an increase in the content of manganese on the oxide surface. An optimum is needed here between an “ideal” solid solution and a completely decomposed catalyst. It can be assumed that during the solid solution decomposition a unique microstructure is formed, in which, on the one hand, oxygen of the MnyZr1−yO2−x solid solution structure is active in oxidation reactions and, on the other hand, manganese cations segregate to the surface in the form of MnOx grain boundaries or the content of Mn in the near-surface layer of the solid solution, due to which the increase in catalytic activity is ensured.
Interestingly, at relatively low Mn content (8 wt%), catalysts prepared by wet impregnation exhibit better catalytic performance than catalysts synthesized by co-precipitation [12]. In this case, MnOx species acts as an active component. At relatively high Mn content, co-precipitated catalysts predominantly show improved catalytic performance [10,14]. According to most studies with the widely varying manganese content, catalysts with the composition Mn0.4Zr0.6O2–Mn0.6Zr0.4O2 exhibited the maximum catalytic activity in oxidation reactions [13,14,49,50]. Catalysts with a high Mn loading contain, along with a solid solution, crystalline manganese oxides such as Mn2O3 and Mn3O4. With an increase in the total amount of Mn in the catalyst, the number of manganese ions introduced into zirconia grows, which means that the number of oxygen vacancies that are active in oxidation reactions also increases [11]. Simultaneously, the introduction of Mn into zirconia leads to a decrease in the size of crystallites and an increase in the specific surface area [30,45]. Due to the multi-phase nature of Mn0.4Zr0.6O2–Mn0.6Zr0.4O2 catalysts, the possible effects associated with the formation of manganese nanoparticles during decomposition of the solid solution are not so noticeable and it is difficult to detect them. In this work, the influence of the solid solution decomposition processes was studied in the single-phase mixed oxides containing a smaller amount of manganese Mn0.2Zr0.8O2 and their role in increasing catalytic activity was shown.

3. Experimental Procedure

3.1. Catalyst Preparation

Two series of MnOx-ZrO2 catalysts were prepared by co-precipitation (COP) and impregnation (IM) methods. Precipitation was carried out with vigorous stirring of a mixed Mn(NO3)2 ZrO(NO3)2 solution by the dropwise addition of NH4OH solution until pH 10 was reached. The resulting precipitate was filtered off and washed with water on a filter to pH 6–7. The IM series was synthesized by a vacuum impregnation method with the dropwise addition of Mn(NO3)2 solution according to moisture capacity to a ZrO2 support, which was previously held under vacuum (40 mm Hg) for 20 min. ZrO2 support was prepared by hydrolysis of ZrO(NO3)2 solution by addition of NH4OH and further calcination at 600 °C for 4 h. All samples in the COP and IM series were dried at 120 °C for 2 h and then calcined in a muffle furnace at 400–800 °C for 4 h. The Mn/Zr molar ratio was 1:4. The resulting catalysts were designated as COP-T and IM-T, where T is the annealing temperature (in °C).

3.2. Catalyst Characterization

The phase composition was determined by XRD using a Bruker D8 Advance diffractometer equipped with a Lynxeye linear detector (Bruker AXS GmbH, Karlsruhe, Germany). The diffraction patterns were obtained in the 2θ range from 15 to 65° with a step of 0.05° using Cu Kα radiation (λ = 1.5418 Å). Rietveld refinement for quantitative analysis was carried out using the software package Topas V.4.2 (TOPAS–Total Pattern Analysis System, Version 4.2, Bruker AXS GmbH, Karlsruhe, Germany).
The specific surface area was calculated with the Brunauer–Emmett–Teller (BET) method using nitrogen adsorption isotherms measured at liquid nitrogen temperatures on an automatic Micromeritics ASAP 2400 sorptometer (Micromeritics Instrument Corp., Norcross, GA, USA).
The temperature-programmed reduction in hydrogen (TPR-H2) was performed with a 75 mg sample in a quartz reactor using a flow setup with a thermal conductivity detector. The reducing mixture (10 vol.% H2 in Ar) was fed at 40 mL/min. The rate of heating from room temperature to 900 °C was 10 °C/min.
The XPS measurements were performed on a photoelectron spectrometer (SPECS Surface Nano Analysis GmbH, Berlin, Germany) equipped with a PHOIBOS-150 hemispherical electron energy analyzer and an XR-50 X-ray source with a double Al/Mg anode. The core-level spectra were obtained using AlKα radiation (hν = 1486.6 eV) under ultrahigh vacuum conditions. The binding energy (Eb) of photoemission peaks was corrected to the Ce3d3/2-U‴ peak (Eb = 916.7 eV) of cerium oxide. The curve fitting was performed with CasaXPS software. The line shape used in the fit was the sum of the Lorentzian and Gaussian functions. A Shirley-type background was subtracted from each spectrum [51]. Relative element concentrations were determined from the integral intensities of the core-level spectra using the theoretical photoionization cross-sections according to Scofield [52].
The morphology and microstructure of the catalysts were studied by transmission electron microscopy. TEM images were obtained on a JEOL JEM-2010 microscope (JEOL Ltd., Tokyo, Japan) with a resolution of 1.4 Å. EDX analysis was carried out on an energy dispersive spectrometer XFlash with an energy resolution of 128 eV. Samples for research were fixed on standard copper grids using ultrasonic dispersion of the catalysts in ethanol.
X-ray absorption near edge structure (XANES) spectra of Mn K-edge (6539 eV) and Zr K-edge (17,998 eV) were recorded at the Synchrotron Radiation Source. The spectra were obtained at the Mn and Zr K-edge using channel-cut Si(111) and Si(220) monochromators, respectively. All measurements were performed in the transmission detection mode at room temperature. The ionization currents in the ion chambers were converted by Keithley 6487 current amplifiers (Keithley Instruments LLC, Cleveland, OH, USA). The obtained data were analyzed using the ATHENA software (Version 0.9.26, Washington, DC, USA) [53].

3.3. Catalyst Tests

Catalytic tests in the reaction of CO oxidation were performed in a flow regime in a glass reactor of 170 mm in length and 10 mm in the inner diameter. The initial gas mixture composition was 1 vol.% CO in air, with a constant flow rate of 487 sccm. All the samples were investigated in the temperature range 50–500 °C. A catalyst fraction of 0.4–0.8 mm was used, and the catalyst mass was 0.5 g. To avoid overheating during the exothermic reaction, the catalyst was mixed with a quartz powder of the same particle size. The reactant mixture before and after the reactor was analyzed by a gas chromatograph equipped with a zeolite CaA column and a thermal conductivity detector.
Catalytic activity was calculated from the formula:
R(CO) = C0∙X∙V/mcat, [cm3(CO)/g∙s]
X = (P0 − Pcur)/P0,
where P0 is the peak area corresponding to the initial concentration of CO in the reactant mixture;
Pcur is the peak area corresponding to the current concentration of CO at the reactor outlet;
X is the degree of CO conversion;
C0 is the initial concentration of CO in the mixture (C0 = 1 vol.%);
V is the feed rate of the reactant mixture, ml/min; and mcat is the mass of the catalyst, g.

4. Conclusions

Two series of MnOx-ZrO2 catalysts were prepared by co-precipitation and vacuum impregnation with subsequent calcination at temperatures from 400 to 800 °C and then tested in CO oxidation. It has been shown that the most active CO oxidation catalysts are formed by co-precipitation followed by calcination at 650–700 °C in air. For the series prepared by impregnation, the most active catalyst was obtained at 400 °C; its increased activity is due to the formation of MnO2 oxide nanoparticles containing Mn4+ and having low-temperature oxygen mobility. An increase in the synthesis temperature leads to the formation of less active Mn2O3, catalyst sintering, and, accordingly, deterioration of the catalytic properties. The nature of the active component for the catalysts obtained by co-precipitation differs from that of the catalysts obtained by impregnation. In the case of co-precipitation, a MnyZr1−yO2−x solid solution is formed, a partial separation of which results in the formation of the most active catalyst. A further increase in temperature to 800 °C leads to complete decomposition of the solid solution, the release of manganese cations into Mn3O4, and a drop in catalytic activity.

Author Contributions

Conceptualization, O.A.B.; formal analysis, T.N.A., A.A.S., V.P.K., V.A.R., A.M.K.; investigation, T.N.A., A.A.S., V.P.K., V.A.R., A.M.K., E.Y.G.; writing—original draft preparation, O.A.B. and V.P.K., writing—review and editing, O.A.B.; visualization, V.P.K., A.M.K.; supervision, O.A.B. All authors have read and agreed to the published version of the manuscript.

Funding

This work was supported by the Ministry of Science and Higher Education of the Russian Federation (Grant Agreement No. 075-15-2022-263).

Acknowledgments

The XRD and XPS studies were carried out using facilities of the shared research center “National Center of Investigation of Catalysts” at Boreskov Institute of Catalysis. The experiments were performed using largescale research facilities “EXAFS spectroscopy beamline” at the Siberian Synchrotron and Terahertz Radiation Center.

Conflicts of Interest

The authors declare no conflict of interest.

References

  1. Royer, S.; Duprez, D. Catalytic Oxidation of Carbon Monoxide over Transition Metal Oxides. ChemCatChem 2011, 3, 24–65. [Google Scholar] [CrossRef]
  2. Sun, H.; Park, S.-J. Recent Advances in MnOx/CeO2-Based Ternary Composites for Selective Catalytic Reduction of NOx by NH3: A Review. Catalysts 2021, 11, 1519. [Google Scholar] [CrossRef]
  3. Xu, H.; Yan, N.; Qu, Z.; Liu, W.; Mei, J.; Huang, W.; Zhao, S. Gaseous Heterogeneous Catalytic Reactions over Mn-Based Oxides for Environmental Applications: A Critical Review. Environ. Sci. Technol. 2017, 51, 8879–8892. [Google Scholar] [CrossRef] [PubMed]
  4. Bratan, V.; Vasile, A.; Chesler, P.; Hornoiu, C. Insights into the Redox and Structural Properties of CoOx and MnOx: Fundamental Factors Affecting the Catalytic Performance in the Oxidation Process of VOCs. Catalysts 2022, 12, 1134. [Google Scholar] [CrossRef]
  5. Arena, F.; Torre, T.; Raimondo, C.; Parmaliana, A. Structure and redox properties of bulk and supported manganese oxide catalysts. Phys. Chem. Chem. Phys. 2001, 3, 1911–1917. [Google Scholar] [CrossRef]
  6. Trawczyński, J.; Bielak, B.; Miśta, W. Oxidation of ethanol over supported manganese catalysts—Effect of the carrier. Appl. Catal. B Environ. 2005, 55, 277–285. [Google Scholar] [CrossRef]
  7. Qu, Y.; Zhu, S.; Zhang, L.; Sun, S.; Dong, X.; Guo, L. Low-temperature catalytic combustion of benzene over Zr–Mn mixed oxides synthesized by redox-precipitation method. J. Mater. Sci. 2021, 56, 13540–13555. [Google Scholar] [CrossRef]
  8. Fernández López, E.; Sánchez Escribano, V.; Resini, C.; Gallardo-Amores, J.M.; Busca, G. A study of coprecipitated Mn–Zr oxides and their behaviour as oxidation catalysts. Appl. Catal. B Environ. 2001, 29, 251–261. [Google Scholar] [CrossRef]
  9. Kapteijn, F.; Singoredjo, L.; Andreini, A.; Moulijn, J.A. Activity and selectivity of pure manganese oxides in the selective catalytic reduction of nitric oxide with ammonia. Appl. Catal. B Environ. 1994, 3, 173–189. [Google Scholar] [CrossRef]
  10. Choudhary, V.R.; Uphade, B.S.; Pataskar, S.G. Low temperature complete combustion of dilute methane over Mn-doped ZrO2 catalysts: Factors influencing the reactivity of lattice oxygen and methane combustion activity of the catalyst. Appl. Catal. A Gen. 2002, 227, 29–41. [Google Scholar] [CrossRef]
  11. Yang, X.; Yu, X.; Jing, M.; Song, W.; Liu, J.; Ge, M. Defective MnxZr1−xO2 Solid Solution for the Catalytic Oxidation of Toluene: Insights into the Oxygen Vacancy Contribution. ACS Appl. Mater. Interfaces 2019, 11, 730–739. [Google Scholar] [CrossRef]
  12. Kaplin, I.Y.; Lokteva, E.S.; Golubina, E.V.; Shishova, V.V.; Maslakov, K.I.; Fionov, A.V.; Isaikina, O.Y.; Lunin, V.V. Efficiency of manganese modified CTAB-templated ceria-zirconia catalysts in total CO oxidation. Appl. Surf. Sci. 2019, 485, 432–440. [Google Scholar] [CrossRef]
  13. Gutiérrez-Ortiz, J.I.; de Rivas, B.; López-Fonseca, R.; Martín, S.; González-Velasco, J.R. Structure of Mn-Zr mixed oxides catalysts and their catalytic performance in the gas-phase oxidation of chlorocarbons. Chemosphere 2007, 68, 1004–1012. [Google Scholar] [CrossRef]
  14. Döbber, D.; Kießling, D.; Schmitz, W.; Wendt, G. MnOx/ZrO2 catalysts for the total oxidation of methane and chloromethane. Appl. Catal. B Environ. 2004, 52, 135–143. [Google Scholar] [CrossRef]
  15. Afonasenko, T.N.; Glyzdova, D.V.; Konovalova, V.P.; Saraev, A.A.; Aydakov, E.E.; Bulavchenko, O.A. Effect of Calcination Temperature on the Properties of Mn–Zr–Ce Catalysts in the Oxidation of Carbon Monoxide. Kinet. Catal. 2022, 63, 431–439. [Google Scholar] [CrossRef]
  16. Shannon, R.D. Revised effective ionic radii and systematic studies of interatomic distances in halides and chalcogenides. Acta Crystallogr. Sect. A 1976, 32, 751–767. [Google Scholar] [CrossRef]
  17. Figueroa, S.J.A.; Requejo, F.G.; Lede, E.J.; Lamaita, L.; Peluso, M.A.; Sambeth, J.E. XANES study of electronic and structural nature of Mn-sites in manganese oxides with catalytic properties. Catal. Today 2005, 107–108, 849–855. [Google Scholar] [CrossRef]
  18. Li, C.; Han, X.; Cheng, F.; Hu, Y.; Chen, C.; Chen, J. Phase and composition controllable synthesis of cobalt manganese spinel nanoparticles towards efficient oxygen electrocatalysis. Nat. Commun. 2015, 6, 7345. [Google Scholar] [CrossRef] [Green Version]
  19. Jiao, F.; Frei, H. Nanostructured manganese oxide clusters supported on mesoporous silica as efficient oxygen-evolving catalysts. Chem. Commun. 2010, 46, 2920–2922. [Google Scholar] [CrossRef]
  20. Pankin, I.A.; Kravtsova, A.N.; Polozhentsev, O.E.; Budnyk, A.P.; Tsaturyan, A.A.; Bugaev, A.L.; Trigub, A.L.; Soldatov, A.V. X-ray spectroscopic diagnostics of the structure of quantum dots based on zinc and manganese sulfides and oxides. J. Struct. Chem. 2017, 58, 1633–1640. [Google Scholar] [CrossRef]
  21. Ramallo-López, J.M.; Lede, E.J.; Requejo, F.G.; Rodriguez, J.A.; Kim, J.-Y.; Rosas-Salas, R.; Domínguez, J.M. XANES Characterization of Extremely Nanosized Metal-Carbonyl Subspecies (Me = Cr, Mn, Fe, and Co) Confined into the Mesopores of MCM-41 Materials. J. Phys. Chem. B 2004, 108, 20005–20010. [Google Scholar] [CrossRef]
  22. Ressler, T.; Brock, S.L.; Wong, J.; Suib, S.L. Multiple-Scattering EXAFS Analysis of Tetraalkylammonium Manganese Oxide Colloids. J. Phys. Chem. B 1999, 103, 6407–6420. [Google Scholar] [CrossRef]
  23. Stobbe, E.R.; De Boer, B.A.; Geus, J.W. The reduction and oxidation behaviour of manganese oxides. Catal. Today 1999, 47, 161–167. [Google Scholar] [CrossRef]
  24. Bulavchenko, O.A.; Venediktova, O.S.; Afonasenko, T.N.; Tsyrul’Nikov, P.G.; Saraev, A.A.; Kaichev, V.V.; Tsybulya, S.V. Nonstoichiometric oxygen in Mn-Ga-O spinels: Reduction features of the oxides and their catalytic activity. RSC Adv. 2018, 8, 11598–11607. [Google Scholar] [CrossRef] [PubMed] [Green Version]
  25. Zheng, S.; Song, L.; Tang, S.; Liu, C.; Yue, H.; Liang, B. Insight into the synergism between MnO2 and acid sites over Mn–SiO2@TiO2 nano-cups for low-temperature selective catalytic reduction of NO with NH3. RSC Adv. 2018, 8, 1979–1986. [Google Scholar] [CrossRef] [Green Version]
  26. Kulchakovskaya, E.V.; Dotsenko, S.S.; Liotta, L.F.; La Parola, V.; Galanov, S.I.; Sidorova, O.I.; Vodyankina, O.V. Synergistic Effect in Ag/Fe&ndash;MnO2 Catalysts for Ethanol Oxidation. Catalysts 2022, 12, 872. [Google Scholar]
  27. Koh, D.J.; Chung, J.S.; Kim, Y.G.; Lee, J.S.; Nam, I.S.; Heup Moon, S. Structure of MnZr mixed oxide catalysts and their catalytic properties in the CO hydrogenation reaction. J. Catal. 1992, 138, 630–639. [Google Scholar] [CrossRef]
  28. Bulavchenko, O.A.; Afonasenko, T.N.; Tsyrul’Nikov, P.G.; Tsybulya, S.V. Effect of heat treatment conditions on the structure and catalytic properties of MnOx/Al2O3 in the reaction of CO oxidation. Appl. Catal. A Gen. 2013, 459, 73–80. [Google Scholar] [CrossRef]
  29. Afonasenko, T.N.; Glyzdova, D.V.; Yurpalov, V.L.; Konovalova, V.P.; Rogov, V.A.; Gerasimov, E.Y.; Bulavchenko, O.A. The Study of Thermal Stability of Mn-Zr-Ce, Mn-Ce and Mn-Zr Oxide Catalysts for CO Oxidation. Materials 2022, 15, 7553. [Google Scholar] [CrossRef]
  30. Bulavchenko, O.A.; Vinokurov, Z.S.; Afonasenko, T.N.; Tsyrul’Nikov, P.G.; Tsybulya, S.V.; Saraev, A.A.; Kaichev, V.V. Reduction of mixed Mn-Zr oxides: In situ XPS and XRD studies. Dalton Trans. 2015, 44, 15499–15507. [Google Scholar] [CrossRef] [Green Version]
  31. Li, W.B.; Chu, W.B.; Zhuang, M.; Hua, J. Catalytic oxidation of toluene on Mn-containing mixed oxides prepared in reverse microemulsions. Catal. Today 2004, 93–95, 205–209. [Google Scholar] [CrossRef]
  32. Castro, V.D.; Polzonetti, G. XPS study of MnO oxidation. J. Electron Spectrosc. Relat. Phenom. 1989, 48, 117–123. [Google Scholar]
  33. Han, Y.-F.; Chen, F.; Zhong, Z.; Ramesh, K.; Chen, L.; Widjaja, E. Controlled Synthesis, Characterization, and Catalytic Properties of Mn2O3 and Mn3O4 Nanoparticles Supported on Mesoporous Silica SBA-15. J. Phys. Chem. B 2006, 110, 24450–24456. [Google Scholar] [CrossRef]
  34. Feng, X.; Cox, D.F. Na Deposition on MnO(100). Surf. Sci. 2016, 645, 23–29. [Google Scholar] [CrossRef] [Green Version]
  35. Oku, M.; Hirokawa, K.; Ikeda, S. X-ray photoelectron spectroscopy of manganese—oxygen systems. J. Electron Spectrosc. Relat. Phenom. 1975, 7, 465–473. [Google Scholar] [CrossRef]
  36. Regan, E.; Groutso, T.; Metson, J.B.; Steiner, R.; Ammundsen, B.; Hassell, D.; Pickering, P. Surface and bulk composition of lithium manganese oxides. Surf. Interface Anal. 1999, 27, 1064–1068. [Google Scholar] [CrossRef]
  37. Bondi, J.F.; Oyler, K.D.; Ke, X.; Schiffer, P.; Schaak, R.E. Chemical synthesis of air-stable manganese nanoparticles. J. Am. Chem. Soc. 2009, 131, 9144–9145. [Google Scholar] [CrossRef]
  38. Han, Y.-F.; Chen, L.; Ramesh, K.; Zhong, Z.; Chen, F.; Chin, J.; Mook, H. Coral-like nanostructured α-Mn2O3 nanaocrystals for catalytic combustion of methane: Part, I. Preparation and characterization. Catal. Today 2008, 131, 35–41. [Google Scholar] [CrossRef]
  39. Yang, X.; Wang, X.; Zhang, G.; Zheng, J.; Wang, T.; Liu, X.; Shu, C.; Jiang, L.; Wang, C. Enhanced electrocatalytic performance for methanol oxidation of Pt nanoparticles on Mn3O4-modified multi-walled carbon nanotubes. Int. J. Hydrogen Energy 2012, 37, 11167–11175. [Google Scholar] [CrossRef]
  40. Ramesh, K.; Chen, L.; Chen, F.; Liu, Y.; Wang, Z.; Han, Y.-F. Re-investigating the CO oxidation mechanism over unsupported MnO, Mn2O3 and MnO2 catalysts. Catal. Today 2008, 131, 477–482. [Google Scholar] [CrossRef]
  41. Kostowskyj, M.A.; Kirk, D.W.; Thorpe, S.J. Ag and Ag–Mn nanowire catalysts for alkaline fuel cells. Int. J. Hydrogen Energy 2010, 35, 5666–5672. [Google Scholar] [CrossRef]
  42. Liu, Y.; Li, J.; Li, W.; Li, Y.; Chen, Q.; Zhan, F. Nitrogen-doped graphene aerogel-supported spinel CoMn2O4 nanoparticles as an efficient catalyst for oxygen reduction reaction. J. Power Sources 2015, 299, 492–500. [Google Scholar] [CrossRef]
  43. Kong, W.; Gao, B.; Jiang, C.; Chang, A. Influence of the oxygen pressure on the preferred orientation and optical properties of the pulsed-laser deposited Mn1.56Co0.96Ni0.48O4 ±δ thin films. J. Alloys Compd. 2015, 650, 305–310. [Google Scholar] [CrossRef]
  44. Jadhav, P.R.; Suryawanshi, M.P.; Dalavi, D.S.; Patil, D.S.; Jo, E.A.; Kolekar, S.S.; Wali, A.A.; Karanjkar, M.M.; Kim, J.-H.; Patil, P.S. Design and electro-synthesis of 3-D nanofibers of MnO2 thin films and their application in high performance supercapacitor. Electrochim. Acta 2015, 176, 523–532. [Google Scholar] [CrossRef]
  45. Guittet, M.J.; Crocombette, J.P.; Gautier-Soyer, M. Bonding and XPS chemical shifts in ZrSiO4 versus SiO2 and ZrO2: Charge transfer and electrostatic effects. Phys. Rev. B Condens. Matter Mater. Phys. 2001, 63, 1251171–1251177. [Google Scholar] [CrossRef]
  46. Jones, D.J.; Jiménez-Jiménez, J.; Jiménez-López, A.; Maireles-Torres, P.; Olivera-Pastor, P.; Rodriguez-Castellón, E.; Rozière, J. Surface characterisation of zirconium-doped mesoporous silica. Chem. Commun. 1997, 5, 431–432. [Google Scholar] [CrossRef]
  47. Miyazaki, S. Characterization of high-k gate dielectric/silicon interfaces. Appl. Surf. Sci. 2002, 190, 66–74. [Google Scholar] [CrossRef]
  48. Tsunekawa, S.; Asami, K.; Ito, S.; Yashima, M.; Sugimoto, T. XPS study of the phase transition in pure zirconium oxide nanocrystallites. Appl. Surf. Sci. 2005, 252, 1651–1656. [Google Scholar] [CrossRef]
  49. Afonasenko, T.N.; Bulavchenko, O.A.; Gulyaeva, T.I.; Tsybulya, S.V.; Tsyrul’nikov, P.G. Effect of the Calcination Temperature and Composition of the MnOx–ZrO2 System on Its Structure and Catalytic Properties in a Reaction of Carbon Monoxide Oxidation. Kinet. Catal. 2018, 59, 104–111. [Google Scholar] [CrossRef]
  50. Zeng, K.; Li, X.; Wang, C.; Wang, Z.; Guo, P.; Yu, J.; Zhang, C.; Zhao, X.S. Three-dimensionally macroporous MnZrOx catalysts for propane combustion: Synergistic structure and doping effects on physicochemical and catalytic properties. J. Colloid Interface Sci. 2020, 572, 281–296. [Google Scholar] [CrossRef]
  51. Shirley, D.A. High-Resolution X-Ray Photoemission Spectrum of the Valence Bands of Gold. Phys. Rev. B 1972, 5, 4709–4714. [Google Scholar] [CrossRef] [Green Version]
  52. Scofield, J.H. Hartree-Slater subshell photoionization cross-sections at 1254 and 1487 eV. J. Electron. Spectrosc. Relat. Phenom. 1976, 8, 129–137. [Google Scholar] [CrossRef]
  53. Ravel, B.; Newville, M. ATHENA, ARTEMIS, HEPHAESTUS: Data analysis for X-ray absorption spectroscopy using IFEFFIT. J. Synchrotron Radiat. 2005, 12, 537–541. [Google Scholar] [CrossRef]
Figure 1. CO oxidation conversion (a) and rate at 200 °C (b) depending on the preparation temperature for MnOx-ZrO2 catalysts obtained by co-precipitation (COP) and impregnation (IM).
Catalysts 13 00057 g001
Figure 2. XRD patterns of IM (a) and COP (b) catalysts. Blue asterisks indicate the reflections of MnO2, black asterisks—Mn2O3, arrows—tetragonal ZrO2. The black bar chart indicates the position of monoclinic ZrO2 reflections, black bars—cubic ZrO2.
Catalysts 13 00057 g002
Figure 3. TEM images (a,d); with FTT image (b,e,f); with EDX spectra (c) of the IM-400 (ac) and IM-650 (df) catalysts.
Catalysts 13 00057 g003
Figure 4. TEM images (a,b); with EDX spectra (c); the COP-650 catalyst.
Catalysts 13 00057 g004
Figure 5. XANES spectra of the IMP (a) and COP (b) catalysts, and those of standard manganese compounds (c).
Catalysts 13 00057 g005
Figure 6. TPR curves of the IM (a) and COP (b) catalysts, with ZrO2, Mn3O4, and Mn2O3 as references.
Catalysts 13 00057 g006
Figure 7. Mn2p core-level spectra of the IM (a) and COP (b) catalysts. Mn2p spectra are normalized to the integral intensity of the corresponding Zr3d spectra.
Catalysts 13 00057 g007
Table 1. Structural and microstructural characteristics of the IM and COP catalysts.
Calcination Temperature, °CCOPIM
Phase Composition, wt %Crystallite Size, ÅLattice Parameters of ZrO2 *, Å (V/N, Å3)Microstrains in ZrO2 *SBET, m2/gPhase Composition, wt %Crystallite Size, ÅSBET, m2/g
400amorphous---33177% ZrO2 (mon)
15% ZrO2 (tetr)
8% MnO2
215
140
190
54
500amorphous---23271% ZrO2 (mon)
13% ZrO2 (tetr)
16% Mn2O3
210
120
320
51
600ZrO2 * (cub)2705.078
(16.37)
0.0065869% ZrO2 (mon)
11% ZrO2 (tetr)
20% Mn2O3
215
120
280
43
650ZrO2 * (cub)3905.072
(16.31)
0.0084269% ZrO2 (mon)
12% ZrO2 (tetr)
19% Mn2O3
215
130
300
35
700ZrO2 * (cub)3205.083
(16.41)
0.0073872% ZrO2 (mon)
8% ZrO2 (tetr)
20% Mn2O3
215
150
300
27
80080% ZrO2 (tetr)
13% Mn3O4
7% ZrO2 (mon)
340
210
120
a = b = 3.591,
c = 5.162
(16.65)
0.0041472% ZrO2 (mon)
8% ZrO2 (tetr)
20% Mn2O3
240
210
310
13
* Zr1−yMnyO2 solid solution with the fluorite structure.
Table 2. Relative atomic concentrations of Mn and Zr cations in the near-surface layer of the studied catalysts.
IMCOP
T, °C[Mn]/[Zr]%Mn2+%Mn3+%Mn4+[Mn]/[Zr]%Mn2+%Mn3+%Mn4+
4000.49345520.1904654
500----0.2006139
6001.252057230.2705941
6501.151656280.2906337
7002.411760230.3106535
8001.131957240.3505941
Disclaimer/Publisher’s Note: The statements, opinions and data contained in all publications are solely those of the individual author(s) and contributor(s) and not of MDPI and/or the editor(s). MDPI and/or the editor(s) disclaim responsibility for any injury to people or property resulting from any ideas, methods, instructions or products referred to in the content.

