Article

Synthesis of Vinyl–Trivinyl Acidic Resins for Application in Catalysis: Statistical Study and Site Accessibility Assessment

by
William M. Godoy
1,
Leandro G. Aguiar
1,*,
Nuno A. B. S. Graça
2 and
Alírio E. Rodrigues
2
1
Department of Chemical Engineering, Engineering School of Lorena, University of São Paulo, Lorena 12602-810, SP, Brazil
2
LSRE-LCM, Associate Laboratory ALiCE, Department of Chemical Engineering, Faculty of Engineering, University of Porto (FEUP), 4200-465 Porto, Portugal
*
Author to whom correspondence should be addressed.
Catalysts 2023, 13(1), 181; https://doi.org/10.3390/catal13010181
Submission received: 5 November 2022 / Revised: 3 January 2023 / Accepted: 10 January 2023 / Published: 12 January 2023
(This article belongs to the Special Issue Advances in the Catalytic Behavior of Ion-Exchange Resins)

Abstract

:
This study aimed to synthesize sulfonated polymer resins based on styrene and trimethylolpropane triacrylate (TMPTA) and evaluate their catalytic efficiency in glycerol acetylation. A factorial design was used, with two factors, three levels, and three replicates of the center point. The factors were cross-linker percentage (YTMPTA) and cross-linker feed time (TTMPTA). Ion-exchange capacity, swelling index, and catalytic efficiency were analyzed to characterize each resin. Lower cross-linker percentages resulted in higher catalytic efficiencies, as expected. Resins synthesized with 2, 6, and 10% TMPTA had mean catalytic efficiencies of 215, 176, and 121, respectively. A linear correlation was observed between catalytic efficiency and cross-linker percentage, with R2 = 0.9971. Statistical and kinetic models were developed to represent the experimental results and support the development of strategies to improve resin formulation and synthesis conditions. TMPTA feed time at low and high levels positively influenced catalytic efficiency; the result is attributed to the micro- and macrostructure of resins. This finding was corroborated by the kinetic constants provided by the model.

Graphical Abstract

1. Introduction

Recent studies have developed polymer resins for application in water treatment [1], chemical catalysis [2], and biocatalysis [3]. In the last decades, ion-exchange resins have been used as catalysts in different organic reactions [4]. Such resins consist mainly of cross-linked sulfonated polymers produced by styrene–divinylbenzene copolymerization and can be applied to increase the rate of etherification [5], esterification [6], acetylation [7], and acetalization [8]. Studies by Amberlyst [9], Dowex [10], Purolite [11], and Lewatit [12] have applied commercially available resins in the aforementioned reactions. Favorable characteristics of these materials include high adsorption capacity for different adsorbents, ranging from highly hydrophobic to highly hydrophilic species, structures that are conducive to the formation of catalytic sites, high specific surface area, high swelling and ion-exchange capacities [13,14] and easy separation and recycling [15]. Polystyrene cross-linked with divinylbenzene is the most used resin. It has an outstanding ion-exchange capacity (ranging from 0.8 to 5.6 mmol g−1) and is available in different crosslinking and sulfonation degrees [11]. Nonetheless, recent studies have shown that commercial styrene–divinylbenzene resins may contain inaccessible catalytic sites owing to hindering effects in specific regions of the material [4]. According to the literature, resins with low divinylbenzene percentages are more flexible, leading to a favorable morphology for catalytic applications [16], as this allows for a greater number of catalytic sites to be accessible to the reaction medium. Studies have investigated the use of other cross-linkers to overcome hindering effects, such as ethylene glycol dimethacrylate (EGDMA) [17] and triethylene glycol dimethacrylate (TEGDMA) [18]. This strategy explores the effects of chain length variation, as divinylbenzene is a cross-linker with a relatively small chain length [19]. This study used an experimental design to investigate the influence of trimethylolpropane triacrylate (TMPTA) as a cross-linker and the effect of cross-linking density on resin catalytic efficiency. A statistical study was conducted to identify the optimum conditions for the synthesis of styrene–TMPTA catalysts in the studied ranges. This goal was achieved by analyzing the catalytic efficiency of synthesized resins in glycerol acetylation. Additionally, a kinetic model was developed to assess catalytic site accessibility and its effect on the rate constant of each reaction step.

2. Results and Discussion

The results of the study are divided into the following subsections: (i) Catalyst Synthesis and Characterization, which presents a discussion on catalyst properties; (ii) Catalytic Tests, which describes the study of catalytic efficiency based on statistical analyses; and (iii) Kinetic Model and Site Accessibility Assessment, which focuses on kinetic behavior and accessibility characteristics of polymer resins.

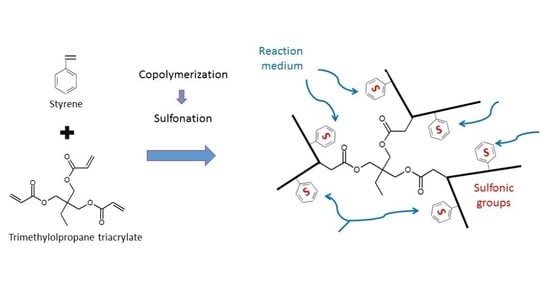
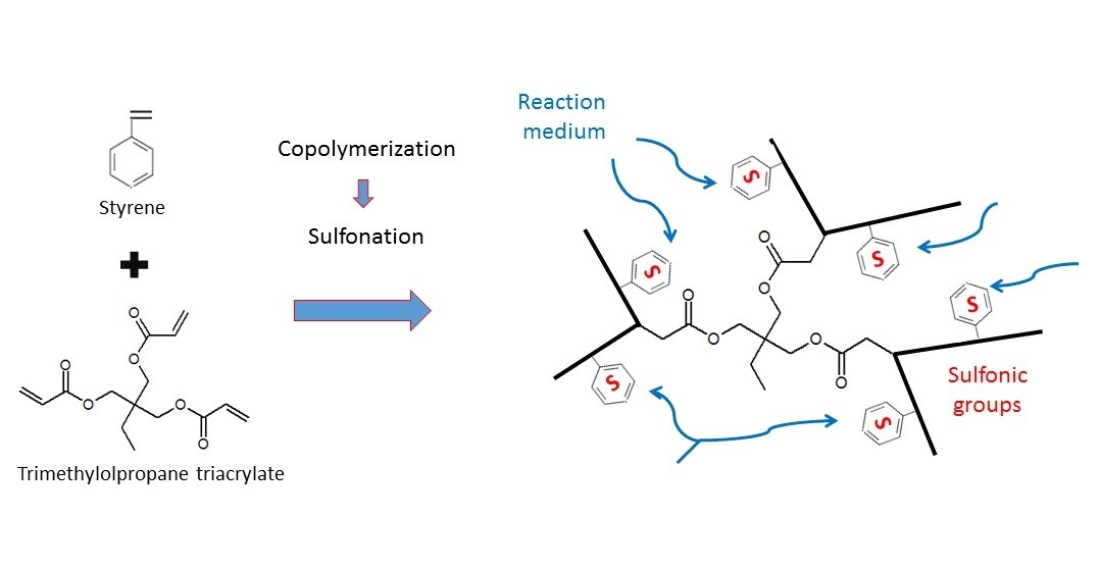
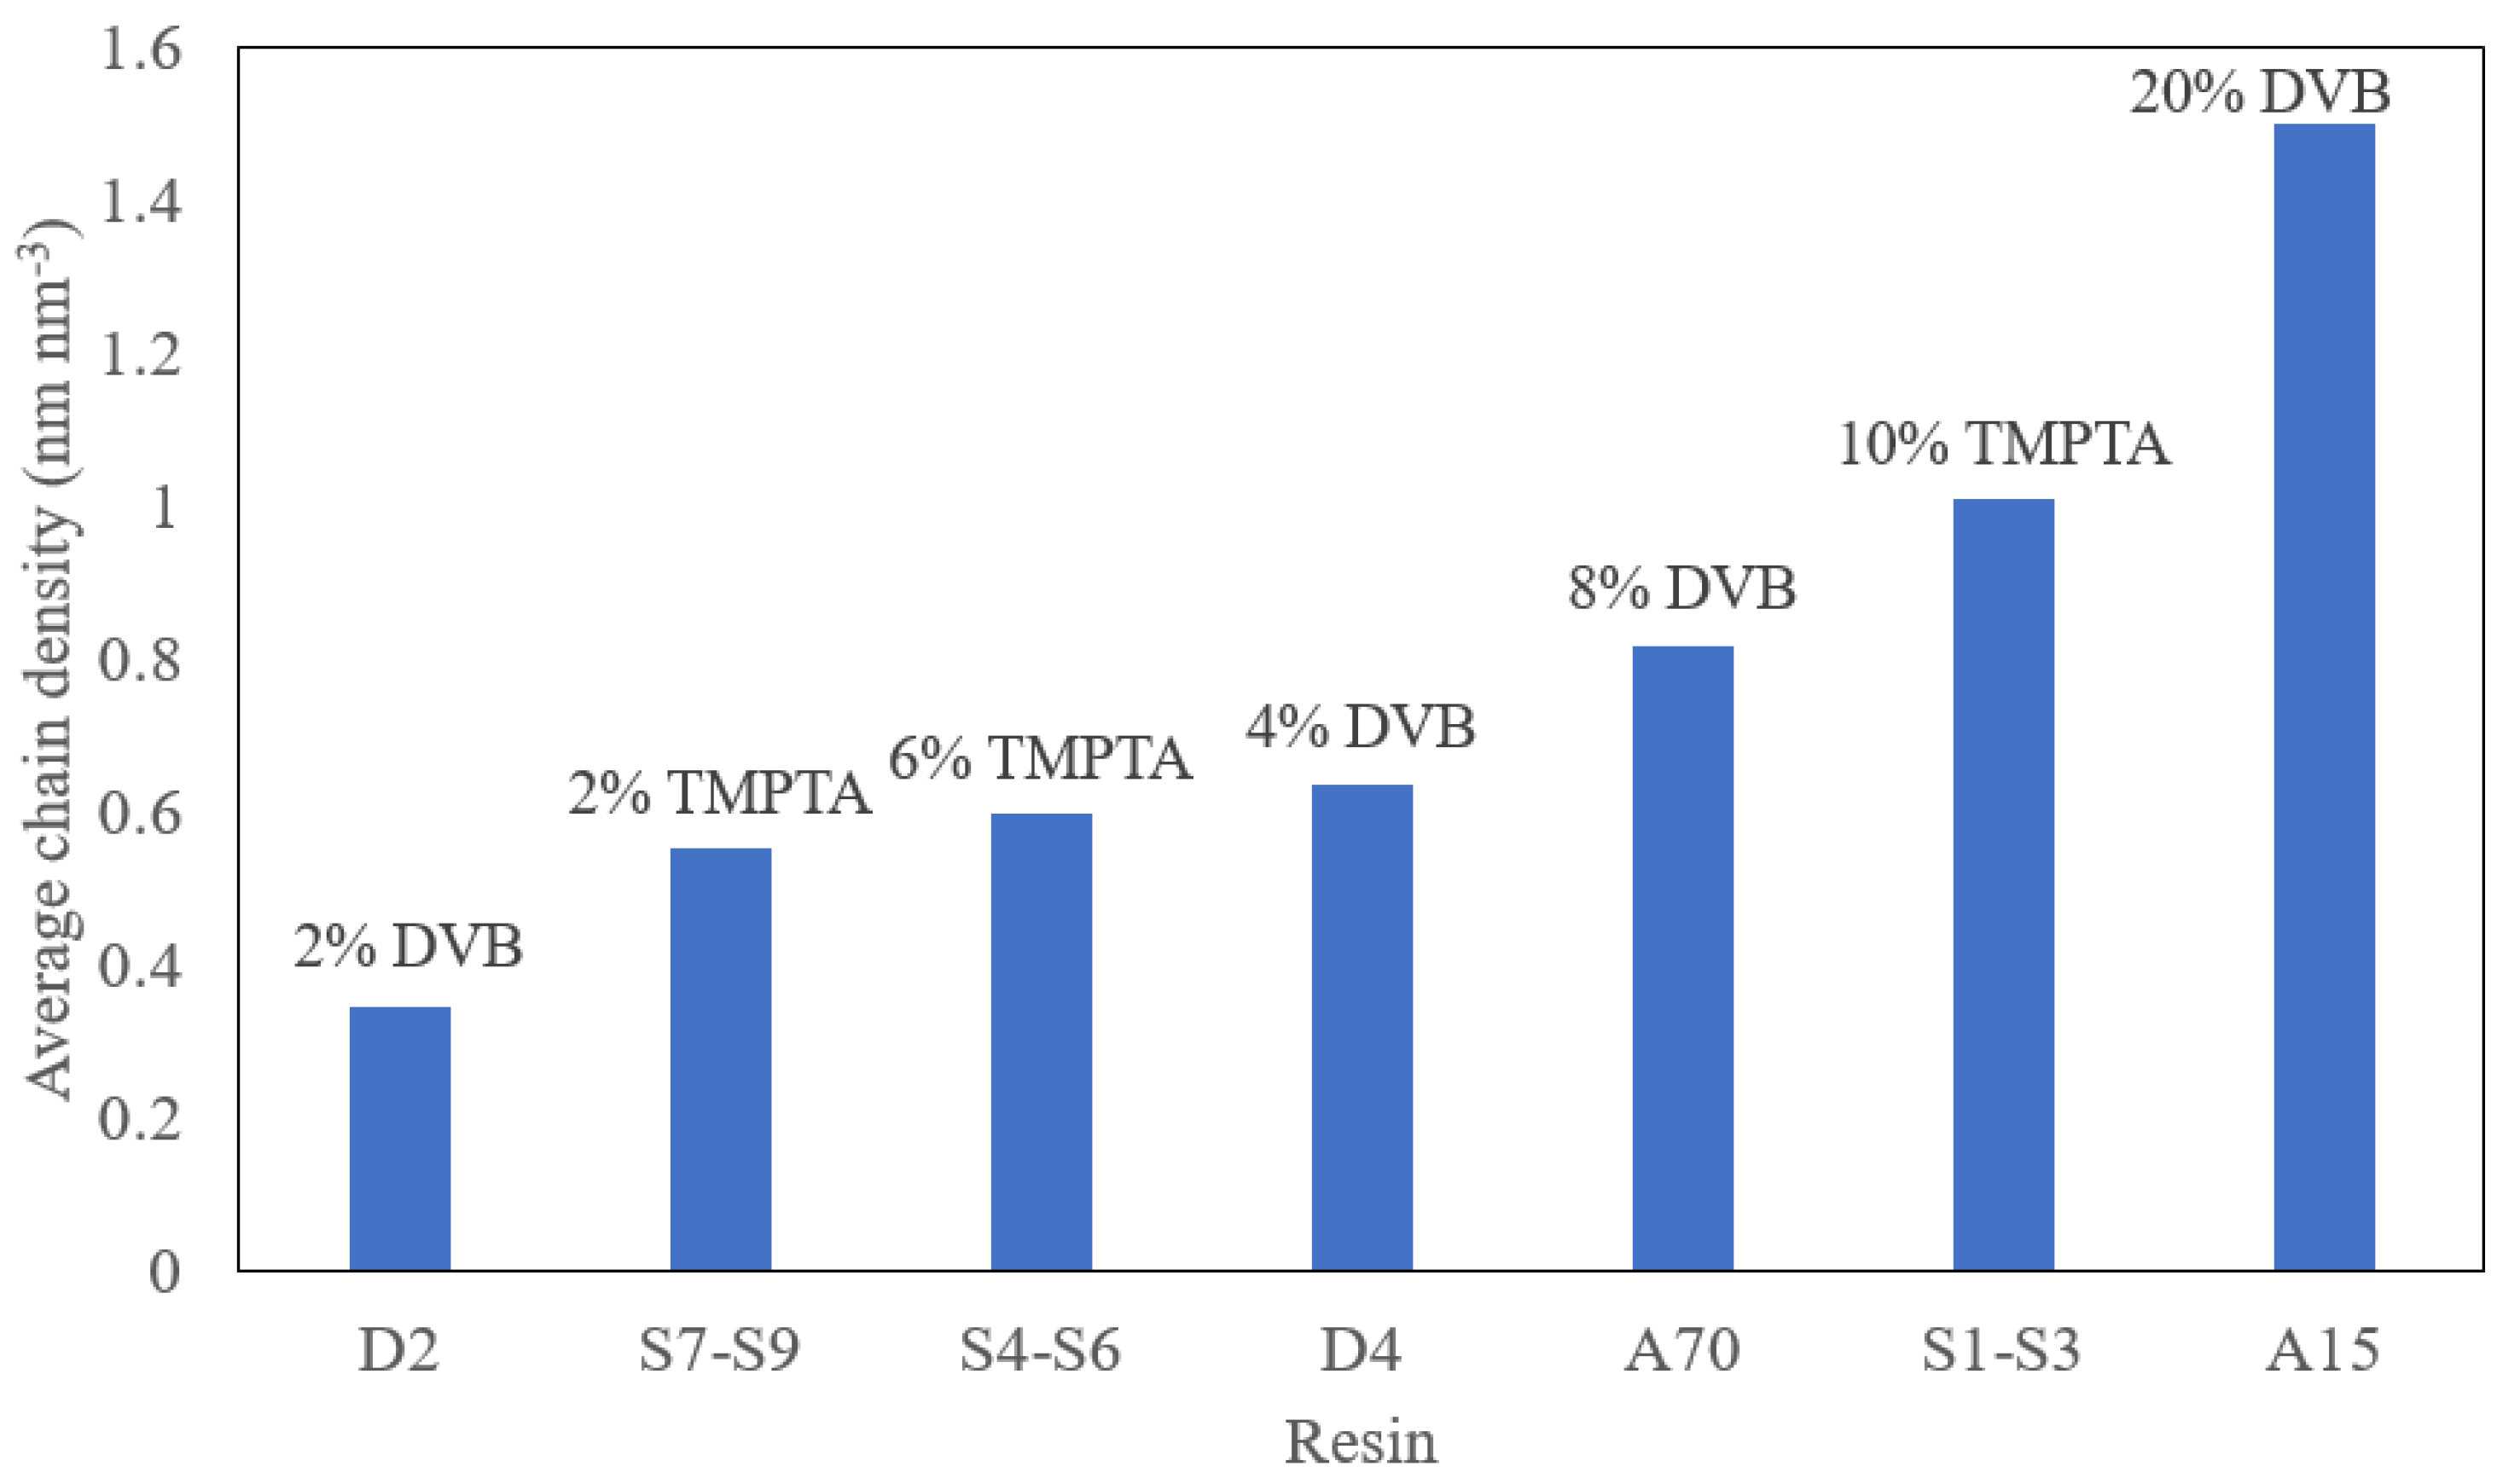
2.1. Catalyst Synthesis and Characterization

Experiments were performed according to a factorial design with triplicate runs of the center point, as described in Section 3.1. Experimental conditions and their respective polymerization and sulfonation yields are presented in Table 1.
Polymerization yields were satisfactorily compared with those of a previous study using the same comonomer system [20]. Sulfonation results show low mass loss (about 15%), which is expected for styrene–acrylate systems [17]. After the sulfonation reaction, all resins were characterized for ion-exchange capacity. Swelling indices were calculated at the end of glycerol acetylation, as described in the Methods section. Results are presented in Table 2.
Ion-exchange capacity was similar among resins, and was about 0.5 mmol g−1, which is considerably lower than the values of most commercial resins (4.0–5.4 mmol g−1). These differences may be explained by the relatively mild sulfonation conditions (short reaction time and low temperature) used in the current study to avoid crossing the degradation threshold of styrene–acrylate-based resins [17]. Sulfonation conditions were not varied in this work. Further studies are needed to investigate the sulfonation limits of styrene–TMPTA resins and enhance their ion-exchange capacity.
The swelling index indicates the degree to which resins are able to swell and change morphology. Table 2 shows that, on average, the swelling index did not change considerably as a function of TMPTA content in the acetylation medium, despite the higher chain density of resins produced with higher cross-linker percentages (2 to 10%). Swelling ability also depends on the affinity between resin and the medium [21]. Based on the functional groups involved in the present catalytic process, it can be stated that resin polarity becomes more similar to the polarity of the acetylation medium as acrylate (TMPTA) content increases. Thus, competing effects (cross-linking density versus resin–medium affinity) may explain why the swelling index remained practically constant as TMPTA content increased. On the other hand, mean swelling indices increased slightly as TMPTA feed time increased from 30 to 270 min. This finding suggests that a better distribution of monomer units along copolymer chains can improve the swelling index and potentially provide higher accessibility to catalytic sites.
After the characterization step, all resins were subjected to catalytic tests for performance assessment. The catalytic efficiency of each resin was calculated from glycerol consumption (or acetate production) and ion-exchange capacity, as described in the next section.

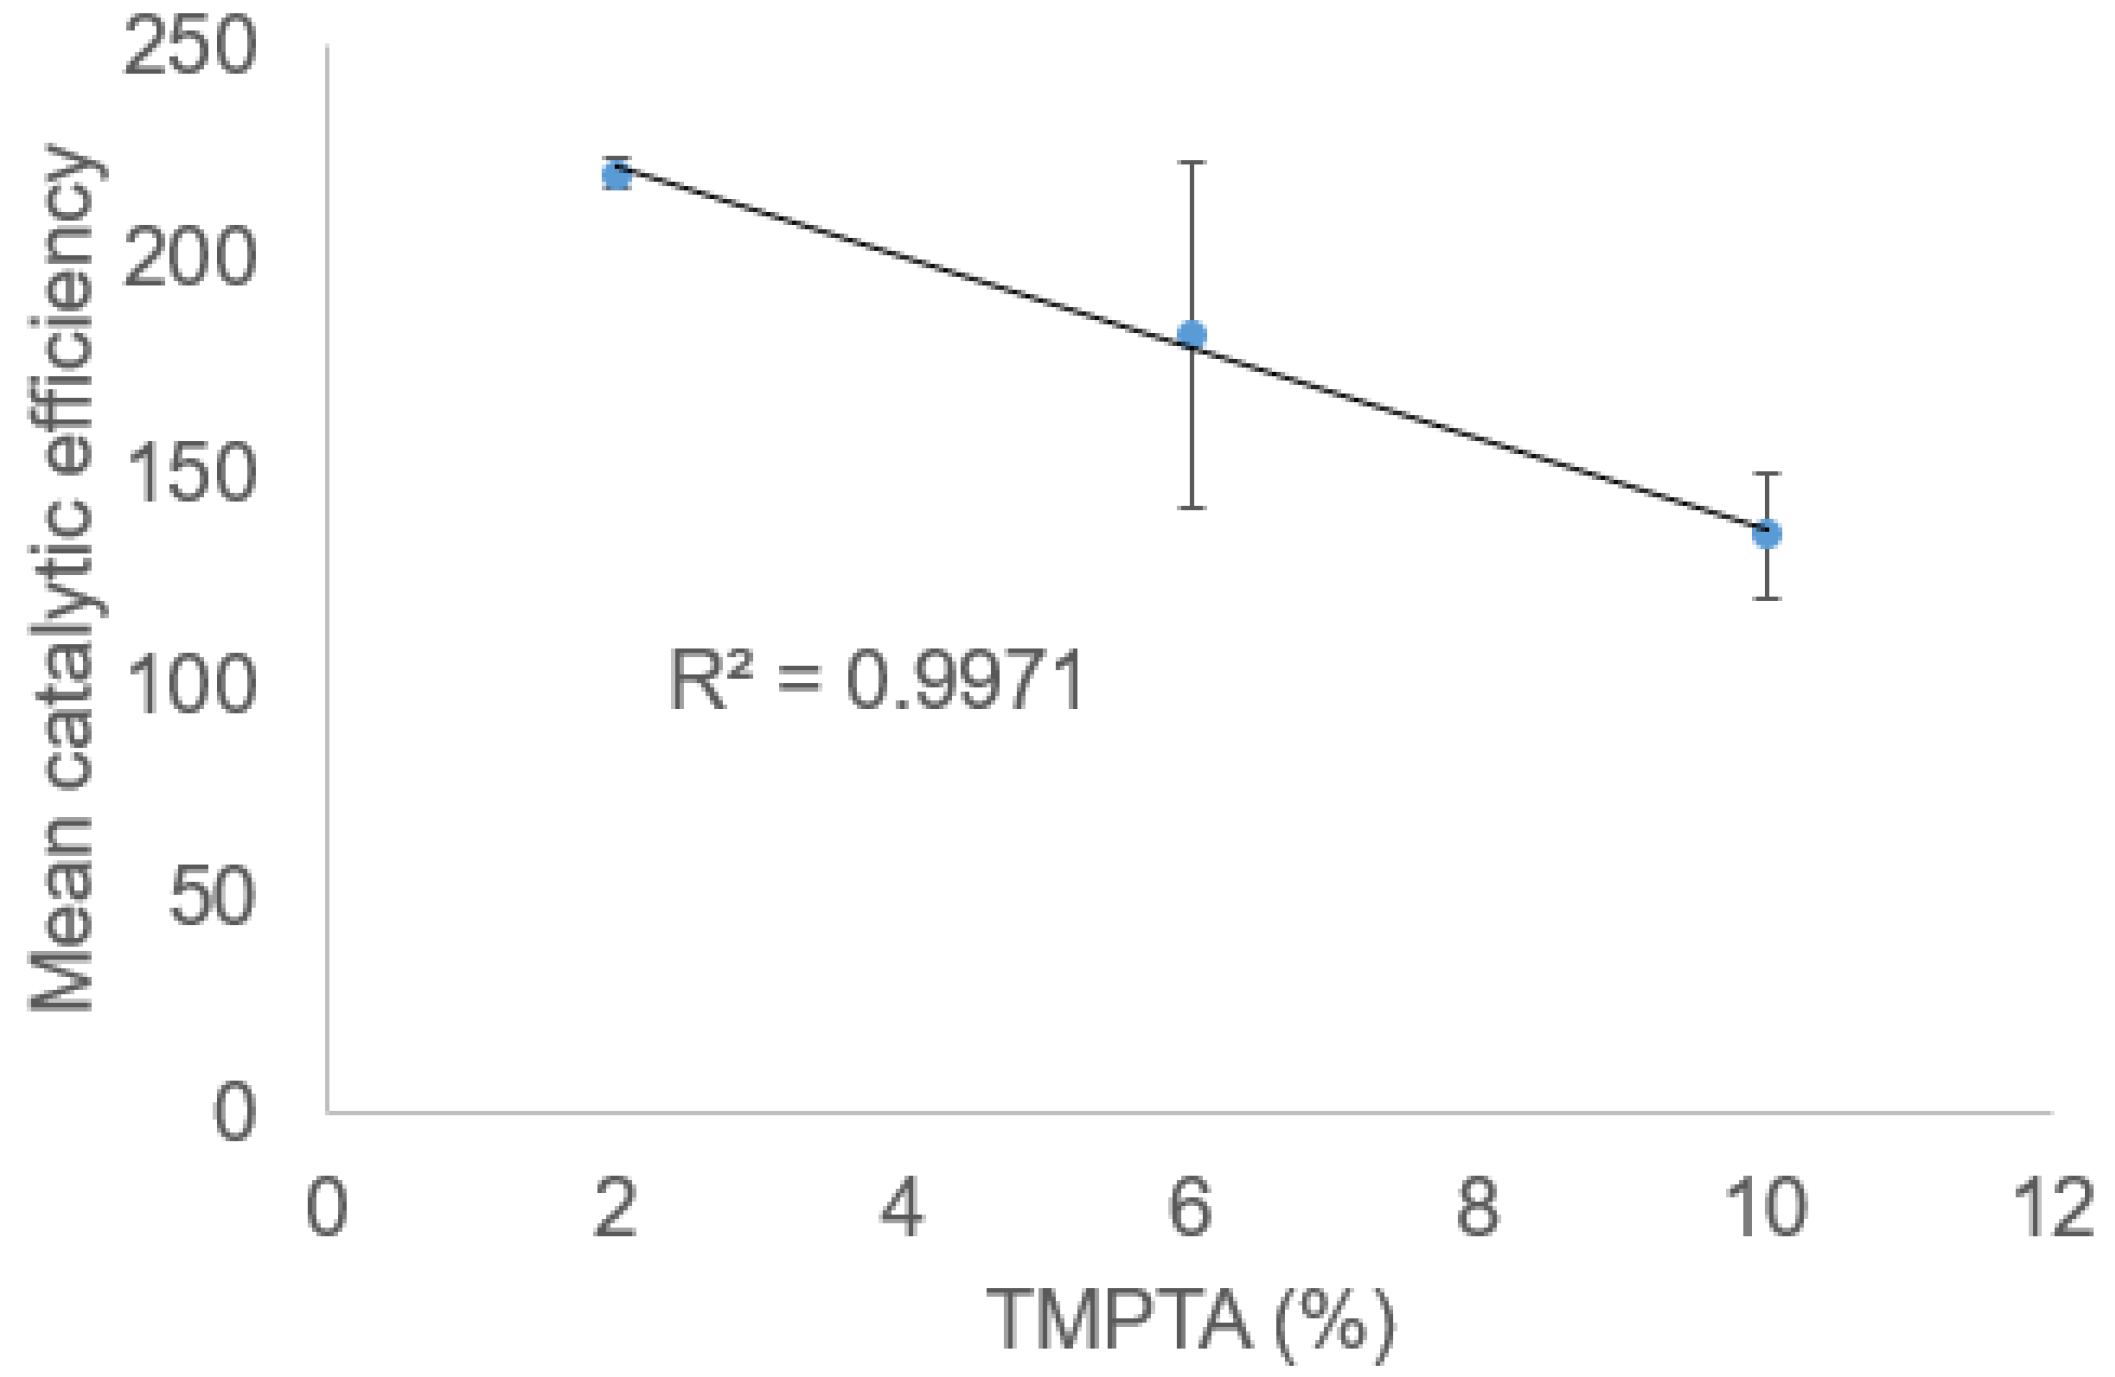
2.2. Catalytic Tests

Glycerol acetylation was carried out under the same conditions for all resins (acetic acid/glycerol molar ratio of 4:1, 90 °C, and 40 g L−1 catalyst). Results are presented in Table 3.
It can be observed from Table 3 that glycerol conversion at 1 h of reaction is similar between S6 and S9 (about 90%), indicating better catalytic performance when the cross-linker is well distributed along the polymer matrix (TMPTA feed time of 270 min). However, it is also necessary to consider catalytic efficiency. Catalytic efficiency results show the behavior of each catalyst in relation to its ion-exchange capacity. Results are expressed in mol of glycerol consumed per mol of catalytic site at 1 h of reaction.
Runs S1 to S3, which were conducted using 10% cross-linker in the polymer matrix, resulted in lower catalytic efficiency than runs S7 to S9, whose cross-linker content was 2%. These findings suggest a considerable influence of cross-linker concentration on catalytic efficiency, with catalytic efficiency decreasing as the polymer matrix becomes denser (higher cross-linker content). In spite of the coherence of the aforementioned results, it is understood that each resin has its particular swelling kinetics. At the beginning of the catalytic process, it is not likely that all accessible catalytic sites are available, as the swelling process is still ongoing. Therefore, in order to assess the efficiency of fully swollen resins, mean catalytic efficiency (EfE) of resins was calculated at 6 h of reaction for each TMPTA content (2% TMPTA, runs 7–9; 6% TMPTA, runs 4–6; and 10% TMPTA, runs 1–3). The results are shown in Figure 1.
Figure 1 shows that there is an almost linear decreasing trend of catalytic efficiency with increasing TMPTA content, which was expected because tighter polymer networks are formed with higher TMPTA contents, reducing accessibility to catalytic sites. The large standard deviation bars are justifiable, as they were determined with data from different experiments.
To statistically corroborate the relationship between catalytic efficiency and cross-linking density, the effects of YTMPTA and TTMPTA factor levels on the signal-to-noise ratio was assessed using an analysis of variance (Figure 2) [22].
Figure 2 shows the relationship between signal-to-noise ratio and YTMPTA and TTMPTA levels. For YTMPTA, there was an increase in signal-to-noise ratio with decreasing cross-linker percentage and was significant at levels two and three. On the other hand, for TTMPTA, the highest ratios were observed at levels one and three. At 10% cross-linker (level one), the ratio was significant, becoming non-significant at 6% (level two) and returning to a significant point at 2% (level three). This behavior can be explained by the occurrence of competing effects, which will be discussed in the Kinetic Model and Accessibility Assessment Section 2.3.
In summary, based on the results of the evaluated effects, it was found that low cross-linker percentage has a significant effect on catalytic efficiency. This finding is corroborated by the calculated F-value (F = 9.18), which is higher than the critical F statistic (F = 6.94) [23]. On the other hand, cross-linker feed time was not a significant factor according to F-statistics, but it was relevant or close to significant, according to Phadke (1983) [24], because high and low factor levels were above the significance threshold (Figure 2), demonstrating a positive influence on the final result.
A statistical model was developed to identify which synthesis conditions provide the best catalytic efficiency (Equation (1)). The equation was obtained through a multiple regression analysis (minimizing the sum of squared errors) using the solver tool from LibreOffice®.
E f = 109.99 + 87.87 × Y TMPTA 85.12 × T TMPTA 4.03 × Y TMPTA × T TMPTA 8.31 × Y TMPTA 2 + 23.65 × T TMPTA 2
The statistical model was fitted to experimental data with an R2 of 0.85. According to the model, the optimum experimental conditions in the studied range are YTMPTA and TTMPTA at level three (2% cross-linker fed over 270 min in the copolymerization step), which provided a catalytic efficiency of 220 at 6 h of reaction. This result was expected, given that a lower cross-linker percentage, as discussed earlier, increases the flexibility of polymer chains, facilitating the flow of compounds (reagents and products) in the reaction medium.

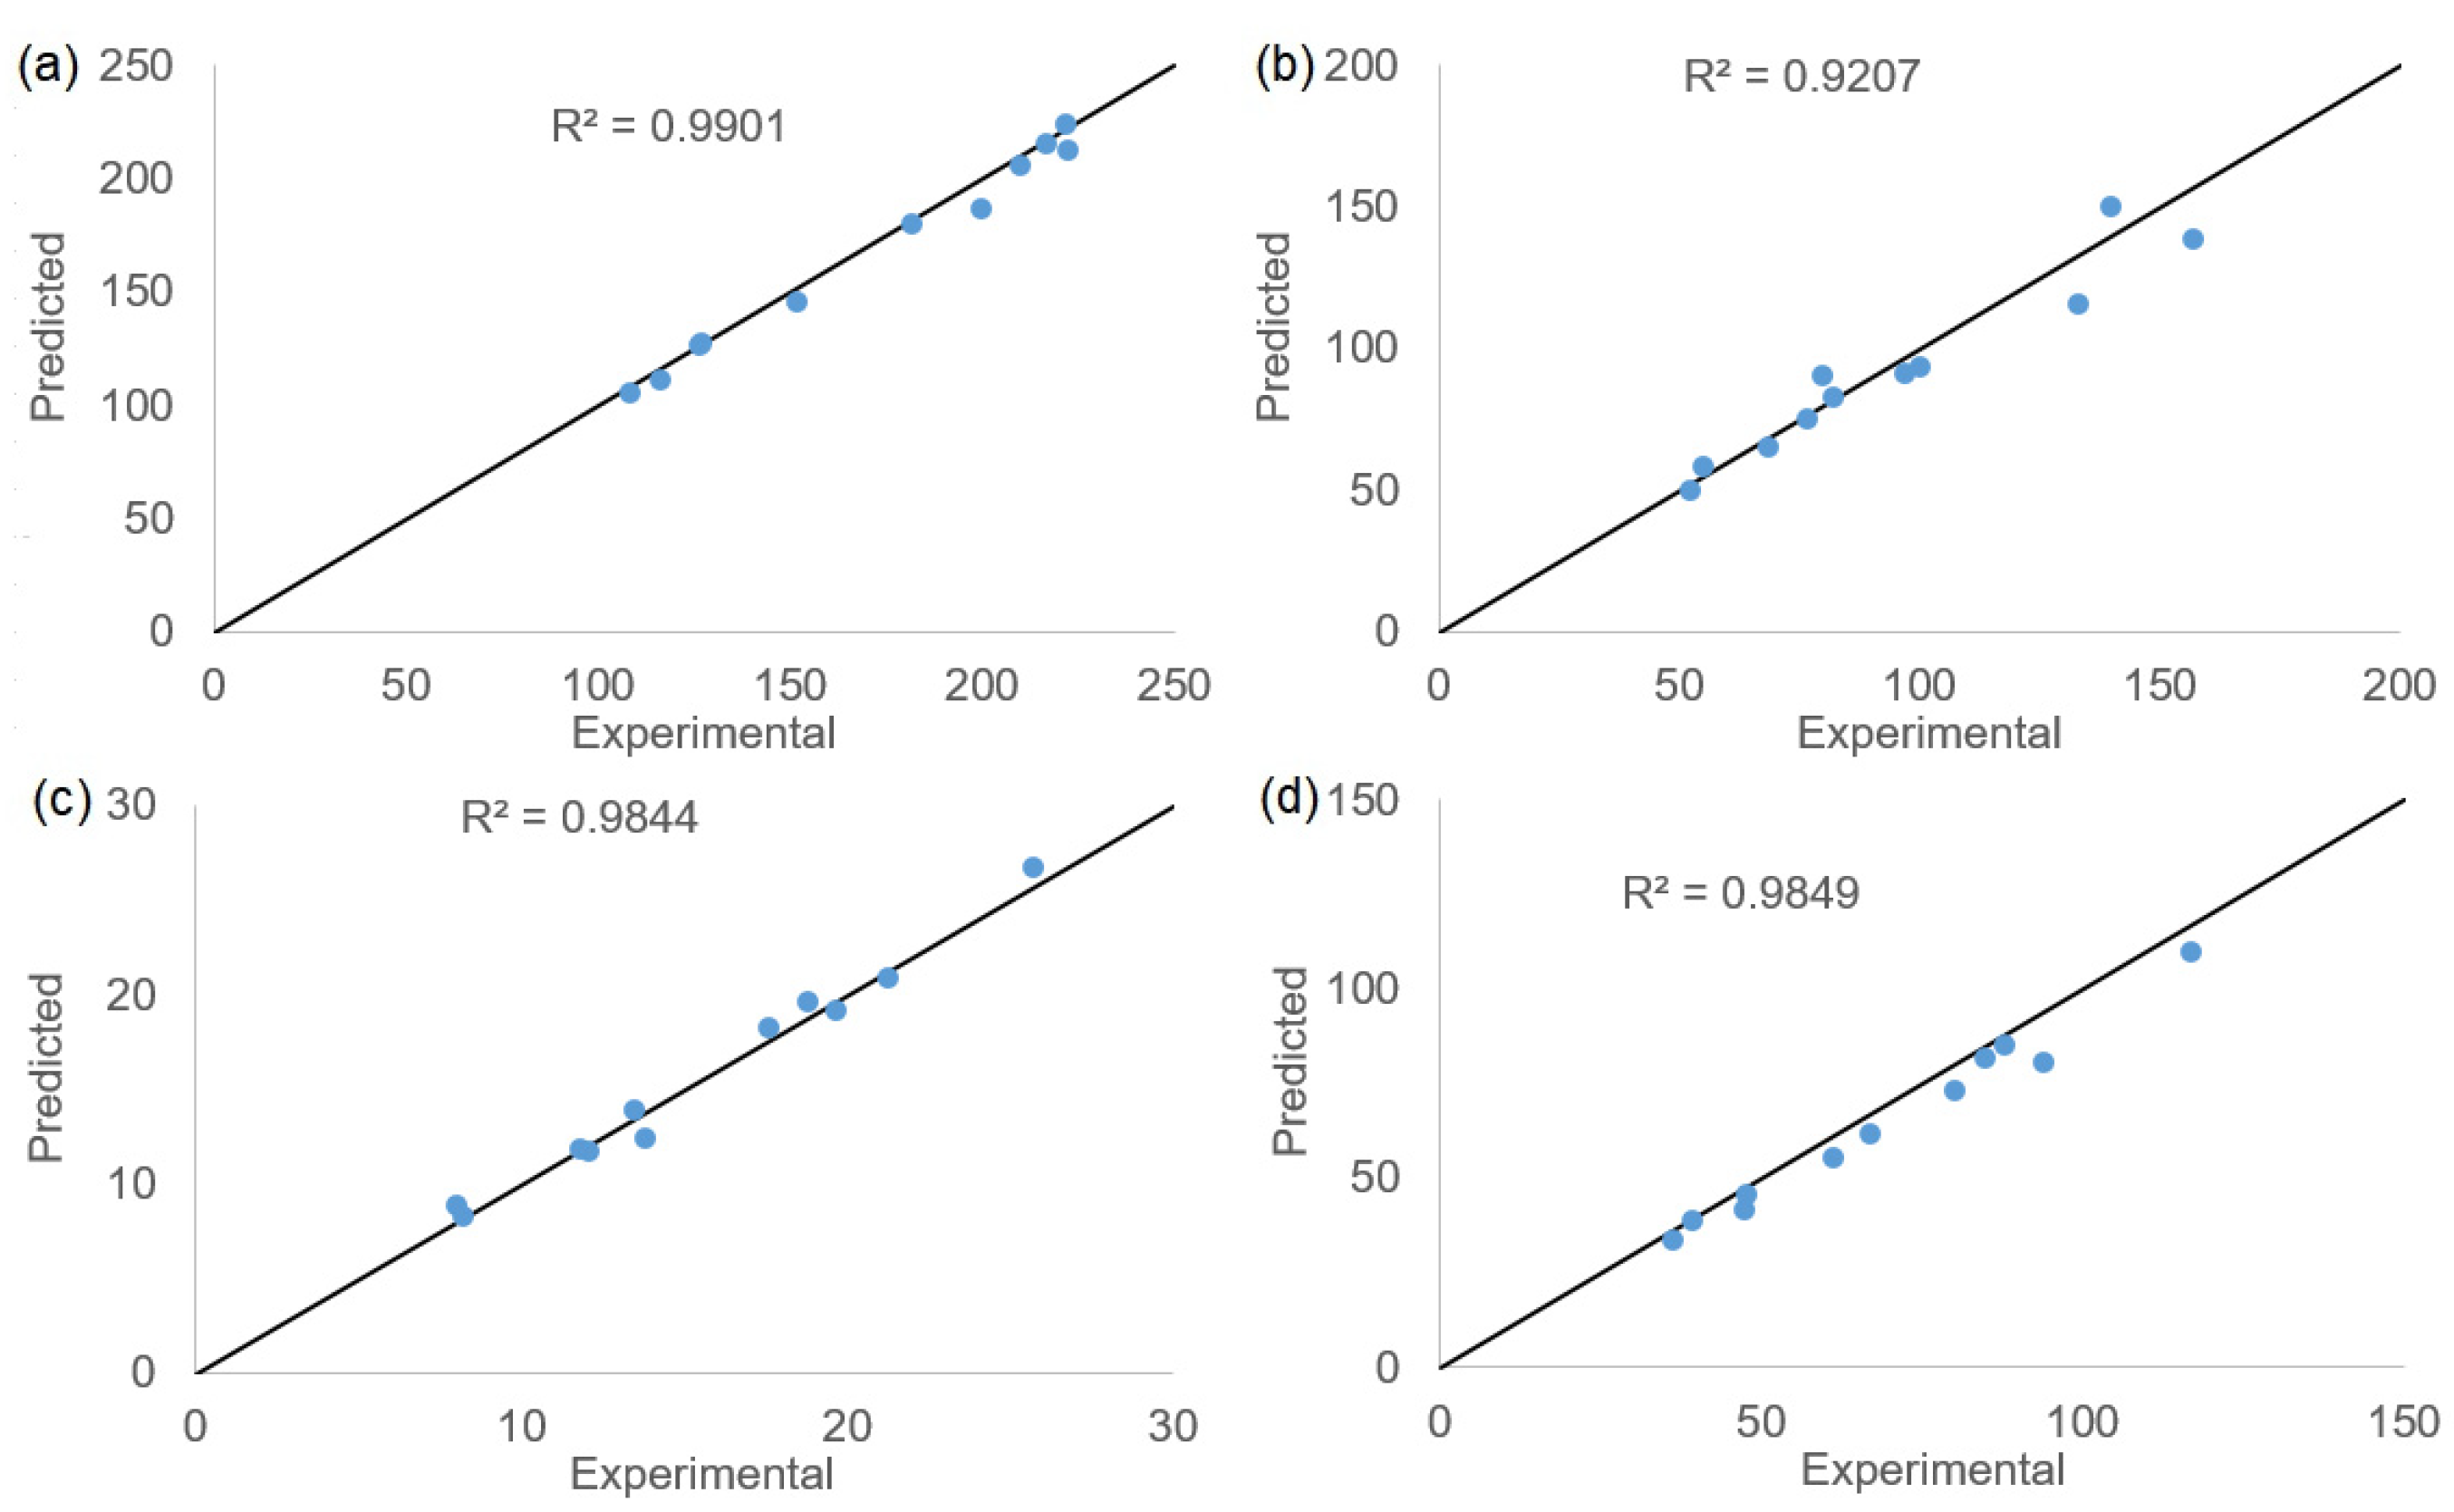
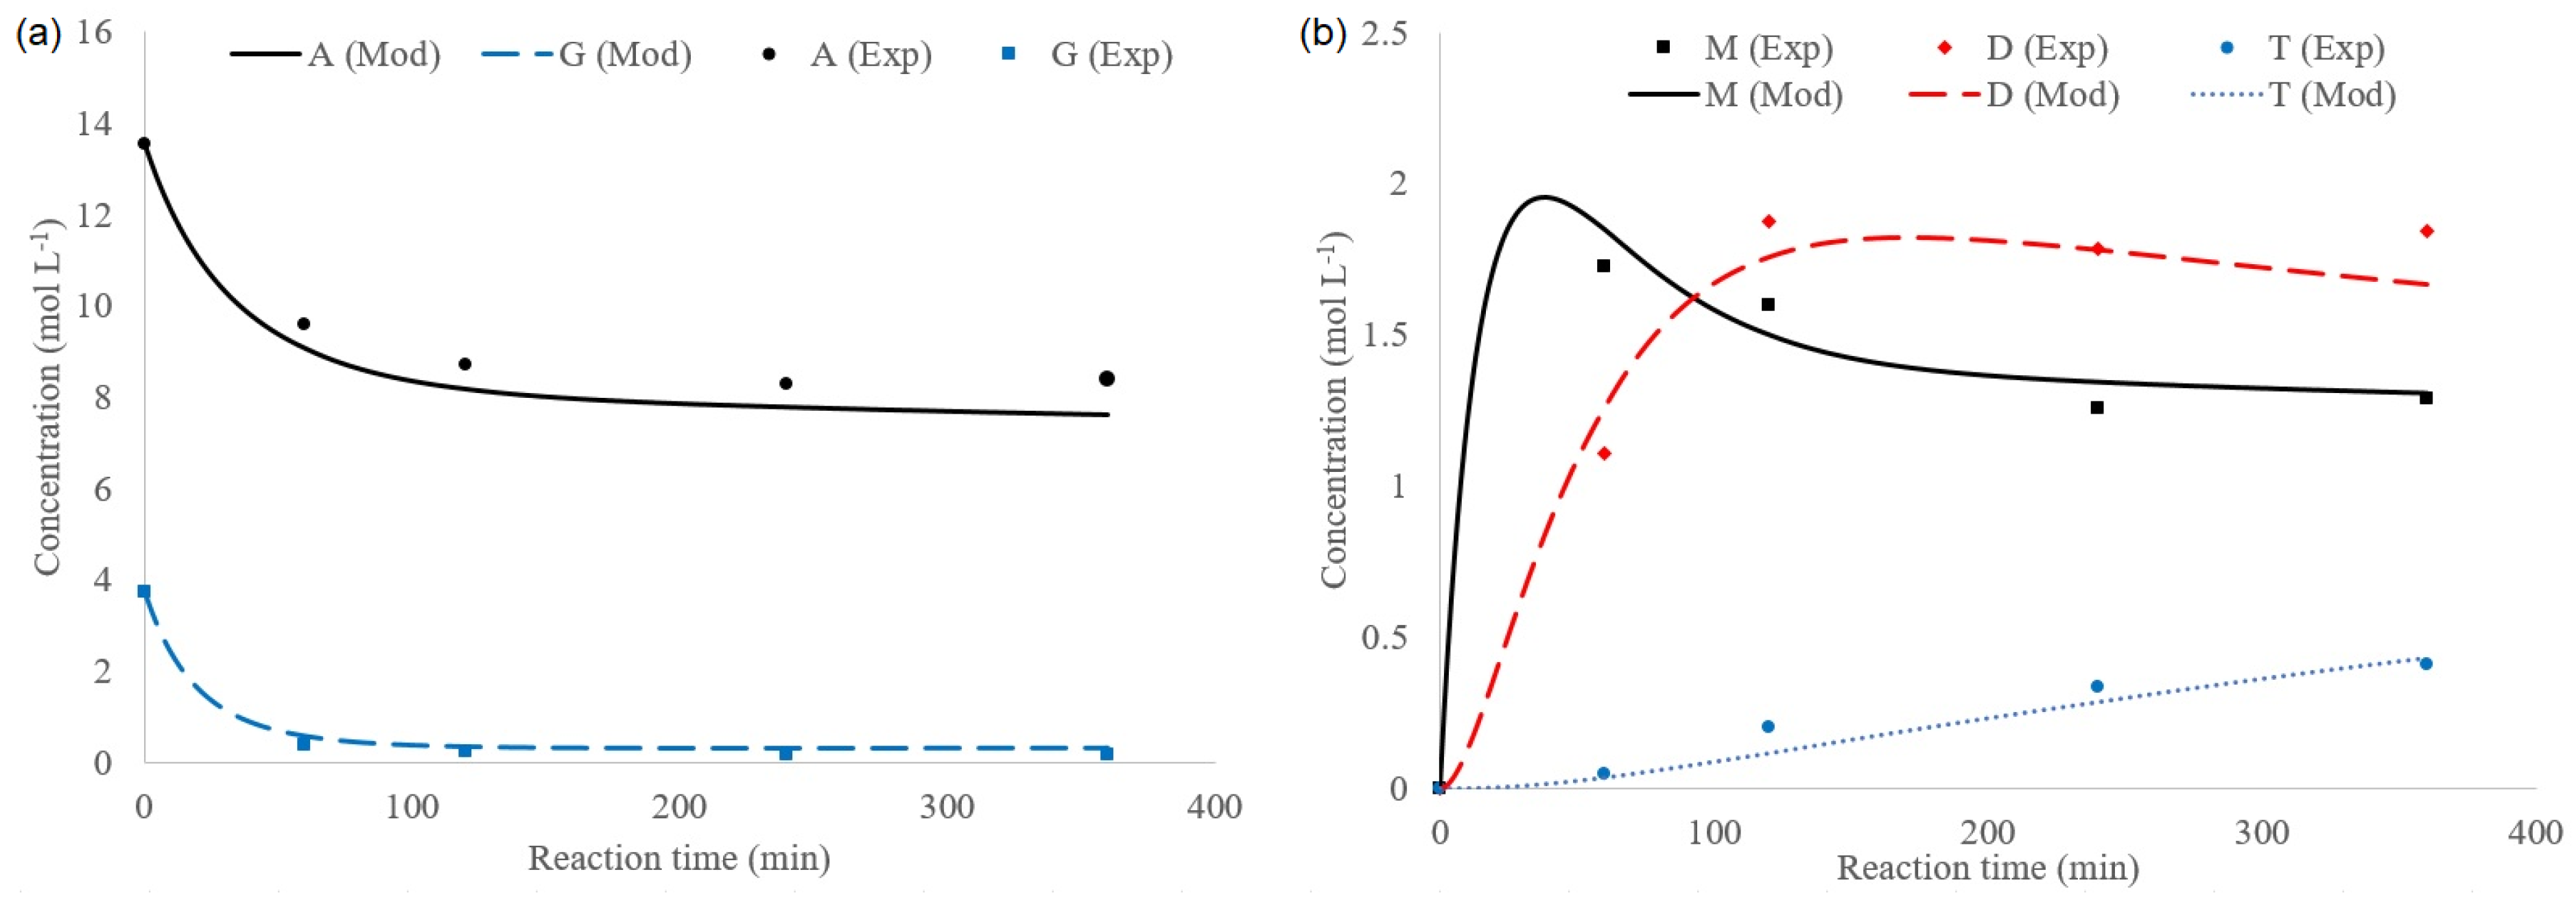
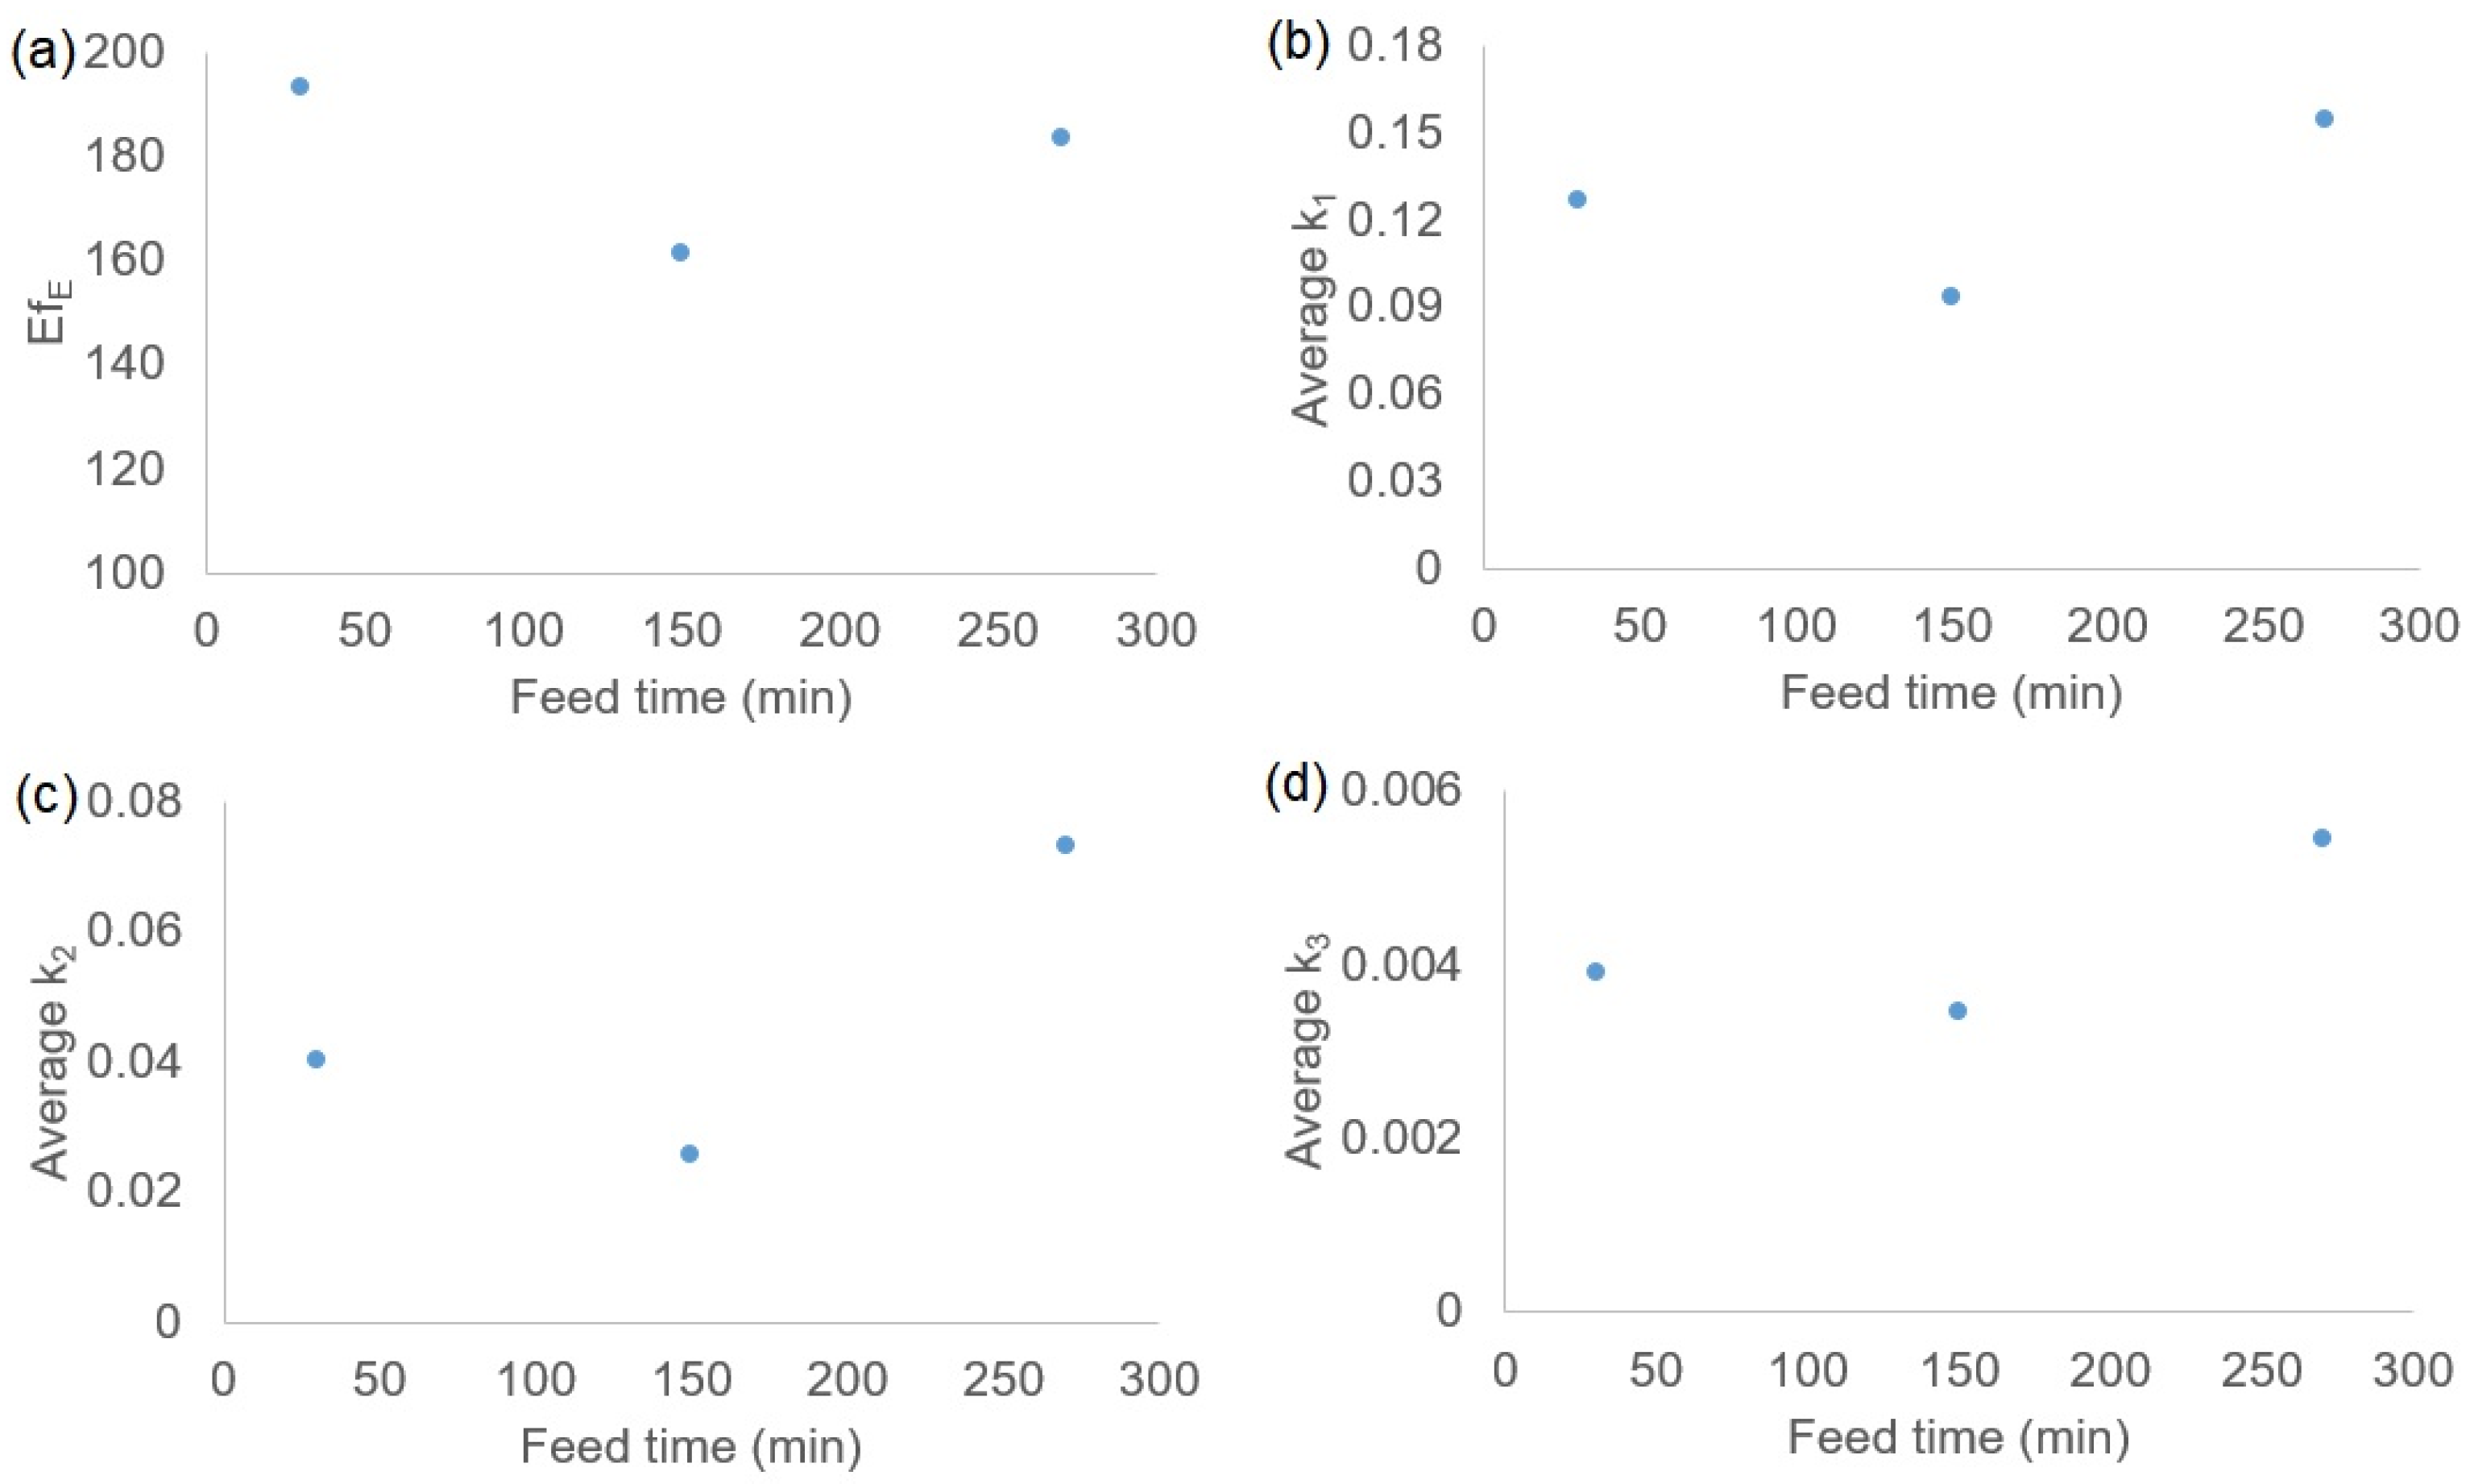
2.3. Kinetic Model and Accessibility Assessment

Comparisons between model predictions and experimental data were carried out for catalytic efficiency as a function of reaction times of interest (i.e., reaction times where there was high consumption or production of a given compound). For glycerol and triacetin, this comparison was made at t = 6 h, whereas for monoacetin and diacetin, the reaction time was t = 2 h. The results are illustrated in Figure 3.
The models’ fittings provided R2 values in the range of 0.92 to 0.99, indicating good predictive ability. Similar model fits were obtained with other concentration profiles. Figure 4 shows the curve fitting for the optimum conditions identified by statistical analysis (YTMPTA = 0.02, TTMPTA = 270 min). Fitted parameters are presented in Table 4.
The effects of TMPTA feed time on catalytic efficiency and the kinetic parameters of the model are presented in Figure 5. Mean ki values were calculated from data presented in Table 4.
In Figure 5, means were calculated for runs 1, 4, and 7 (feed time = 30 min), 2, 5, and 8 (feed time = 150 min), and 3, 6, and 9 (feed time = 270 min).
Different from that suggested in Figure 1, the molecular structure was not the factor predominantly affected by TMPTA feed time. The formation of meso- and macropores is favored when the cross-linker concentration is increased during copolymerization [25]. Thus, when the cross-linker (TMPTA) is fed in a more concentrated manner (e.g., its total mass is fed in only 30 min), the catalytic efficiency and rate constants are relatively high because of the attractive macroporous structure. On the other hand, when the same cross-linker mass is distributed over a long period of copolymerization (e.g., 270 min), the accessibility of molecules to the resulting microstructure seems to be favored, also resulting in high values of EfE and ki. Therefore, the variation in TMPTA feed rate has opposite effects on resin molecular structure and macrostructure, leading to low accessibility in the case of intermediate cross-linker distribution (150 min), as depicted in Figure 5.
The fraction of accessible catalytic sites ( f AS i ) was assessed relative to the highest k i values, which were obtained for run S9 ( k 1 = 0.21 , k 2 = 0.089 , k 3 = 0.0061   L 2   mol 2   min 1 ). Maximum accessibility was assumed for S9, i.e., f AS 1 = f AS 2 = f AS 3 = 1 , resulting in k 1 S = 0.21 , k 2 S = 0.089 , and k 3 S = 0.0061   L 2   mol 2   min 1 . Given that k 1 S , k 2 S , and k 3 S refer to reactions on catalytic sites, regardless of the chain architecture of each resin, the values are the same for S1 to S9. These values were used to calculate the f AS i of all resins by using data from Table 4 and Equation (13). Accessibility data were compiled into mean f AS values, resulting in f AS = 0.62 for resins with 2% TMPTA, f AS = 0.60 for resins with 6% TMPTA, and f AS = 0.42 for resins with 10% TMPTA. To establish a correlation with concepts of accessibility from the literature, we assumed factor f AS to be the Ogston coefficient (KO) for a molecule whose diameter (dm) corresponds to the average diameter of all species involved in the reaction. With this, it was possible to estimate the average chain density for the resins synthesized here, as depicted in Equation (2) [11,26]:
C = ln K O 0.25 π d m + d c 2
where C is the chain density, K O is the Ogston coefficient, d c is the diameter of polymer chain rigid rods ( d c = 0.4   nm ) [11], and d m is the molecule diameter. In the current study, d m was considered to be equal to 0.65 nm, the average of estimated molecular diameters of acetic acid, glycerol, monoacetin, diacetin, triacetin, and water [27]. Figure 6 shows the mean chain densities (C) of styrene–TMPTA resins, as calculated by using Equation (2), and a comparison with chain densities of commercial resins [28].
TMPTA is a trivinyl cross-linker; thus, each cross-linking point can form up to six chains, whereas the limit of divinylbenzene is four chains. On the other hand, the chain density near cross-linking points is attenuated because of the resulting homogeneity of TMPTA feed time and its long chain branches as compared with divinylbenzene. In view of these compensating features of TMPTA, it was expected that the resins produced here would not be significantly displaced in the chain density scale in comparison with divinylbenzene. This expectation was confirmed by the results of Figure 6.

3. Methods

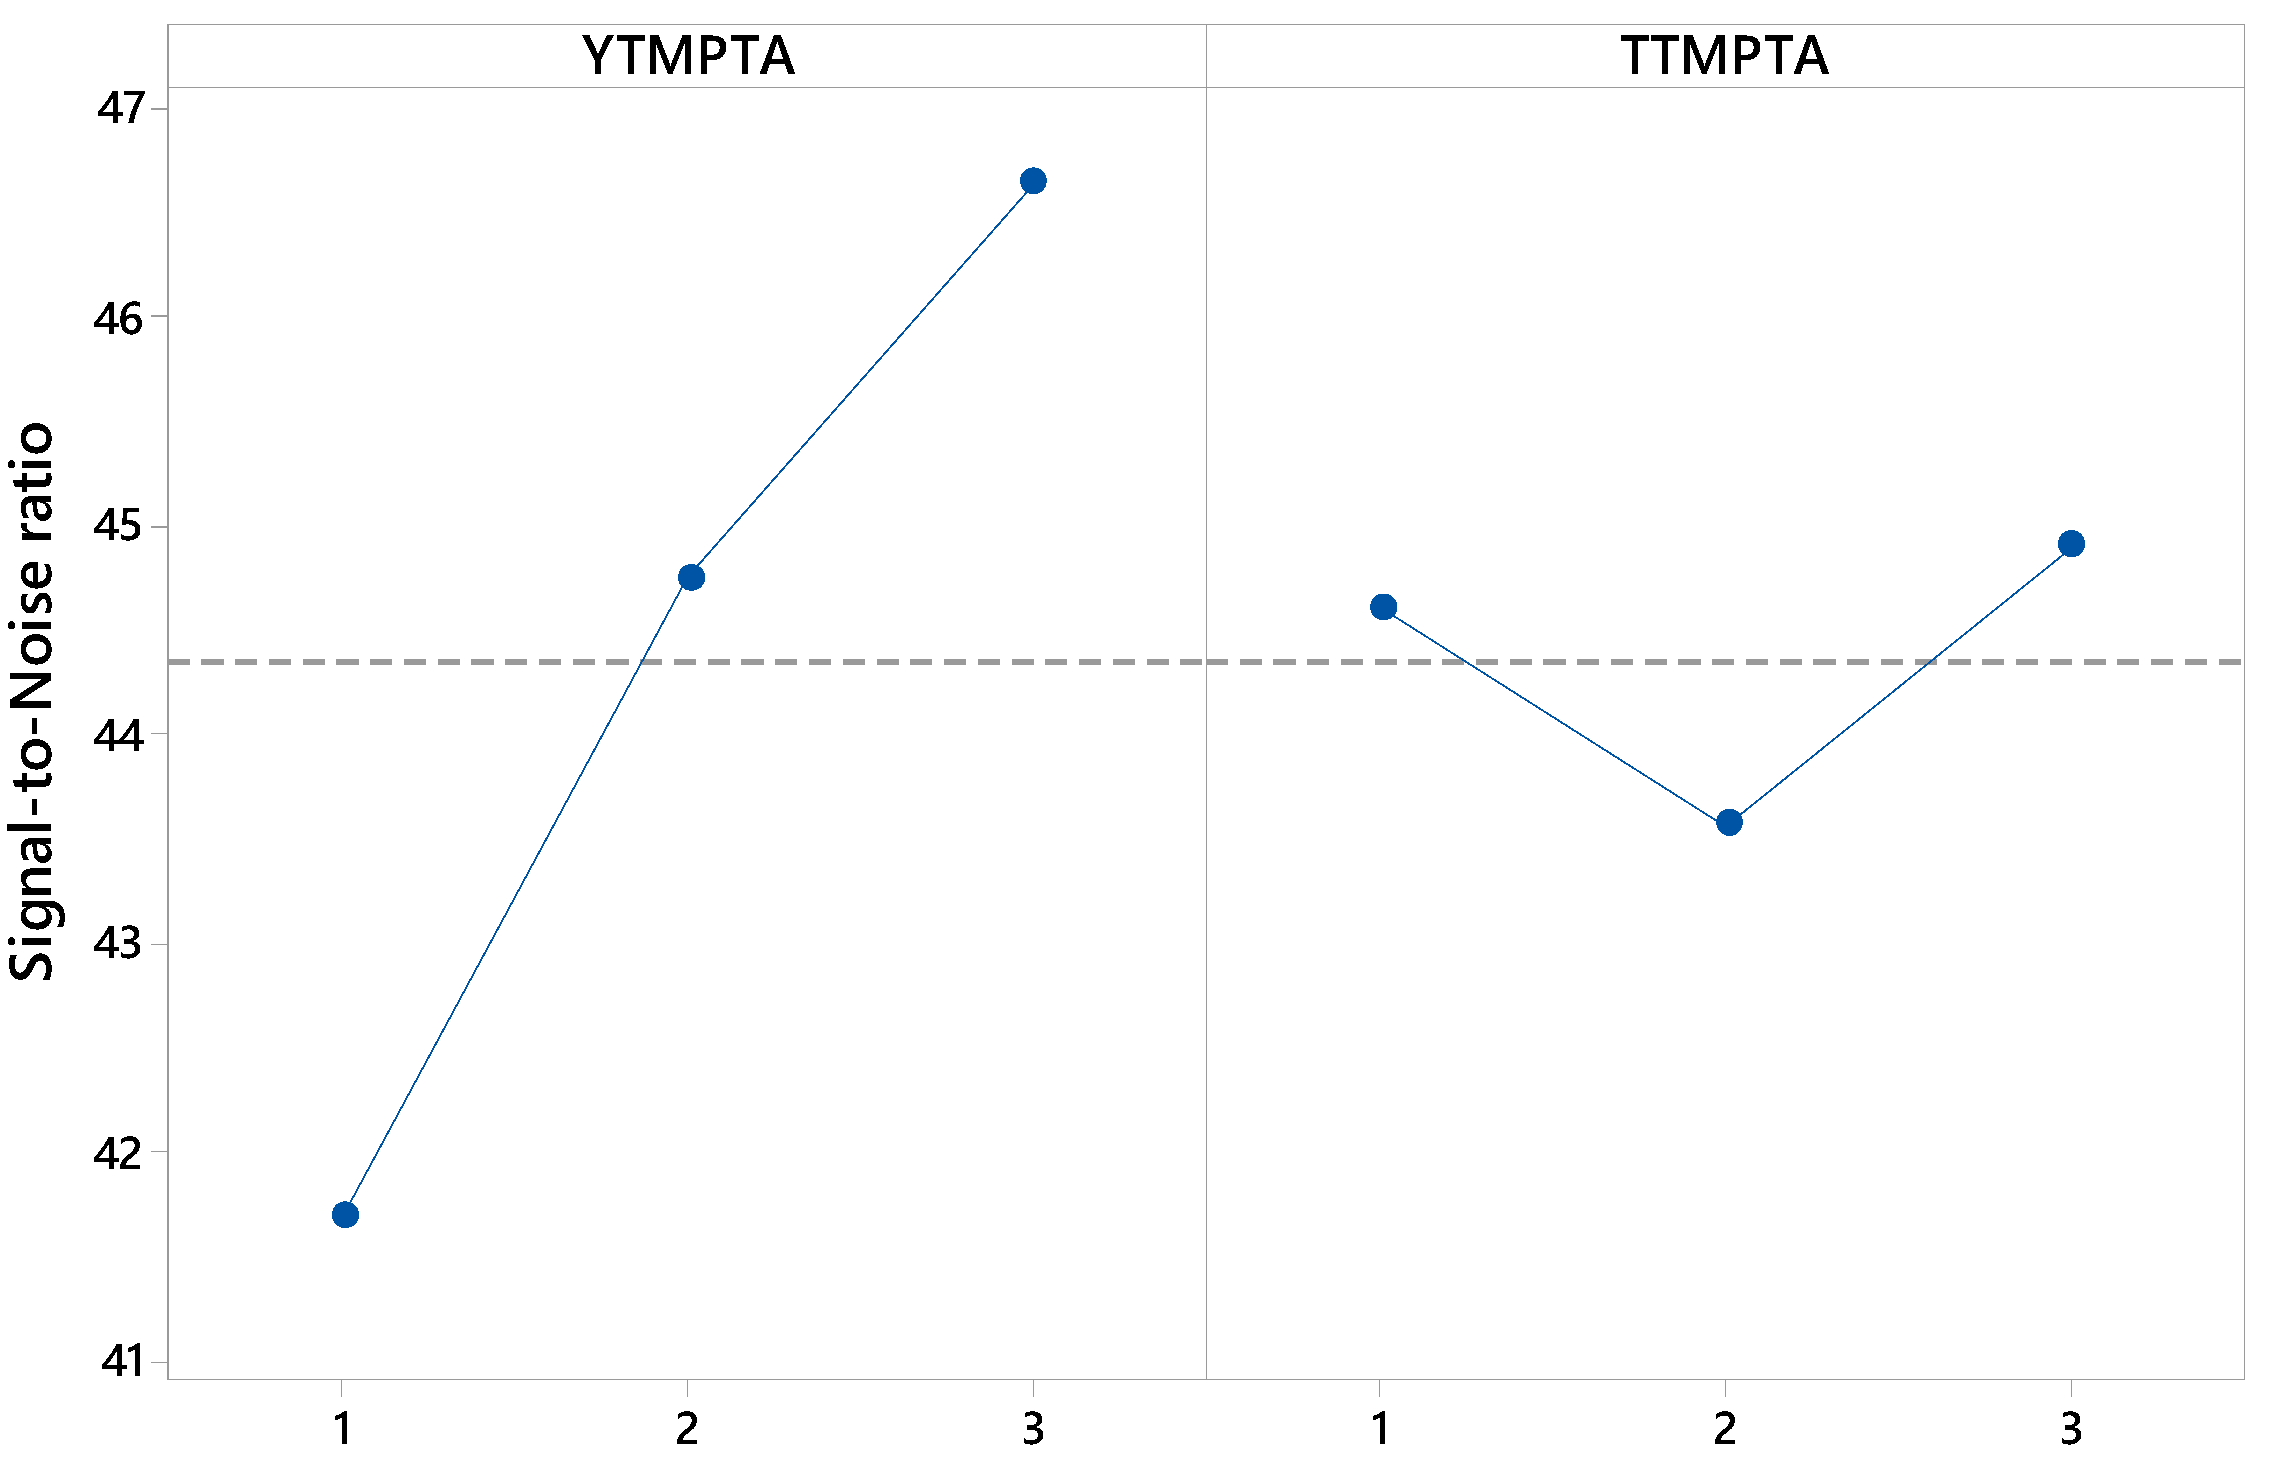
3.1. Factorial Design

Styrene–TMPTA resins were formulated according to a factorial design. A 32 factorial arrangement with two center points was used to investigate factor effects [29]. The factors were cross-linker molar fraction in relation to monomers (YTMPTA) and TMPTA feed time (TTMPTA) at three levels, as shown in Table 5.
The matrix containing all experimental conditions is presented in the Results and Discussion section.

3.2. Suspension Copolymerization

Suspension copolymerization for the synthesis of the catalyst support was carried out according to a procedure described in the literature [7,30], with modifications. The cross-linker was fed at specific reaction times. Suspension copolymerization was performed in a 1 L jacketed glass reactor at 80 °C and 350 rpm for 6 h. The reactor was fed with a mixture of organic (11.5 vol%) and aqueous (88.5 vol%) phases. The aqueous phase consisted of a solution of polyvinyl alcohol (0.0038% w/v) in water. The solution was purged with nitrogen gas (15 mL min−1) for 1 h, and then the organic phase was fed into the reactor. The organic phase consisted of a mixture of 1 mol% benzoyl peroxide (initiator) relative to the monomer mixture (styrene + TMPTA), different fractions of TMPTA in the monomer mixture (0.02, 0.06 and 0.10), 30 vol% monomers in the organic phase, and 50% toluene in the solvent mixture (toluene + heptane). The cross-linker (TMPTA) was fed into the reactor at pre-defined times, according to Table 5.
After each run, the polymerization yield was calculated by dividing the amount of polymer produced by the amount of monomers fed into the reactor.

3.3. Sulfonation Reaction

Resin sulfonation was carried out according to the literature [7,31]. About 10 g of dried resin was added with concentrated sulfuric acid (140 mL) at 57 °C under stirring (175 rpm) for 1 h. Subsequently, the mixture (resin + sulfuric acid) was diluted in distilled water at 25 °C and filtered. The sulfonated resin was extensively washed to remove all residual acid and oven-dried at 50 °C to constant weight. The sulfonation yield was calculated by dividing the mass of sulfonated resin by the mass of resin measured at the beginning of the sulfonation reaction (10 g) [7].

3.4. Ion-Exchange Capacity

Ion-exchange capacity was determined according to a method described elsewhere [32]. About 0.5 g of dried sulfonated resin was mixed with 8 mL of nitric acid solution (1 mol L−1) for 4 h. Subsequently, resins were filtered and dried at 50 °C until constant weight was achieved. The dried resin was immersed in 30 mL of sodium hydroxide solution (0.1 mol L−1) and left to rest for 24 h. The resulting solution was titrated with hydrochloric acid (0.1 mol L−1), and ion-exchange capacity was estimated according to Equation (3):
IEC = C NaOH   × V NaOH C HCl × V t W d
where IEC is the ion-exchange capacity (mmol g−1), CHCl is the concentration of hydrochloric acid (mmol mL−1), CNaOH is the concentration of sodium hydroxide solution, VNaOH is the volume of sodium hydroxide solution (mL), Vt is the titrated volume of hydrochloric acid (mL) and Wd is the resin dry weight (g).

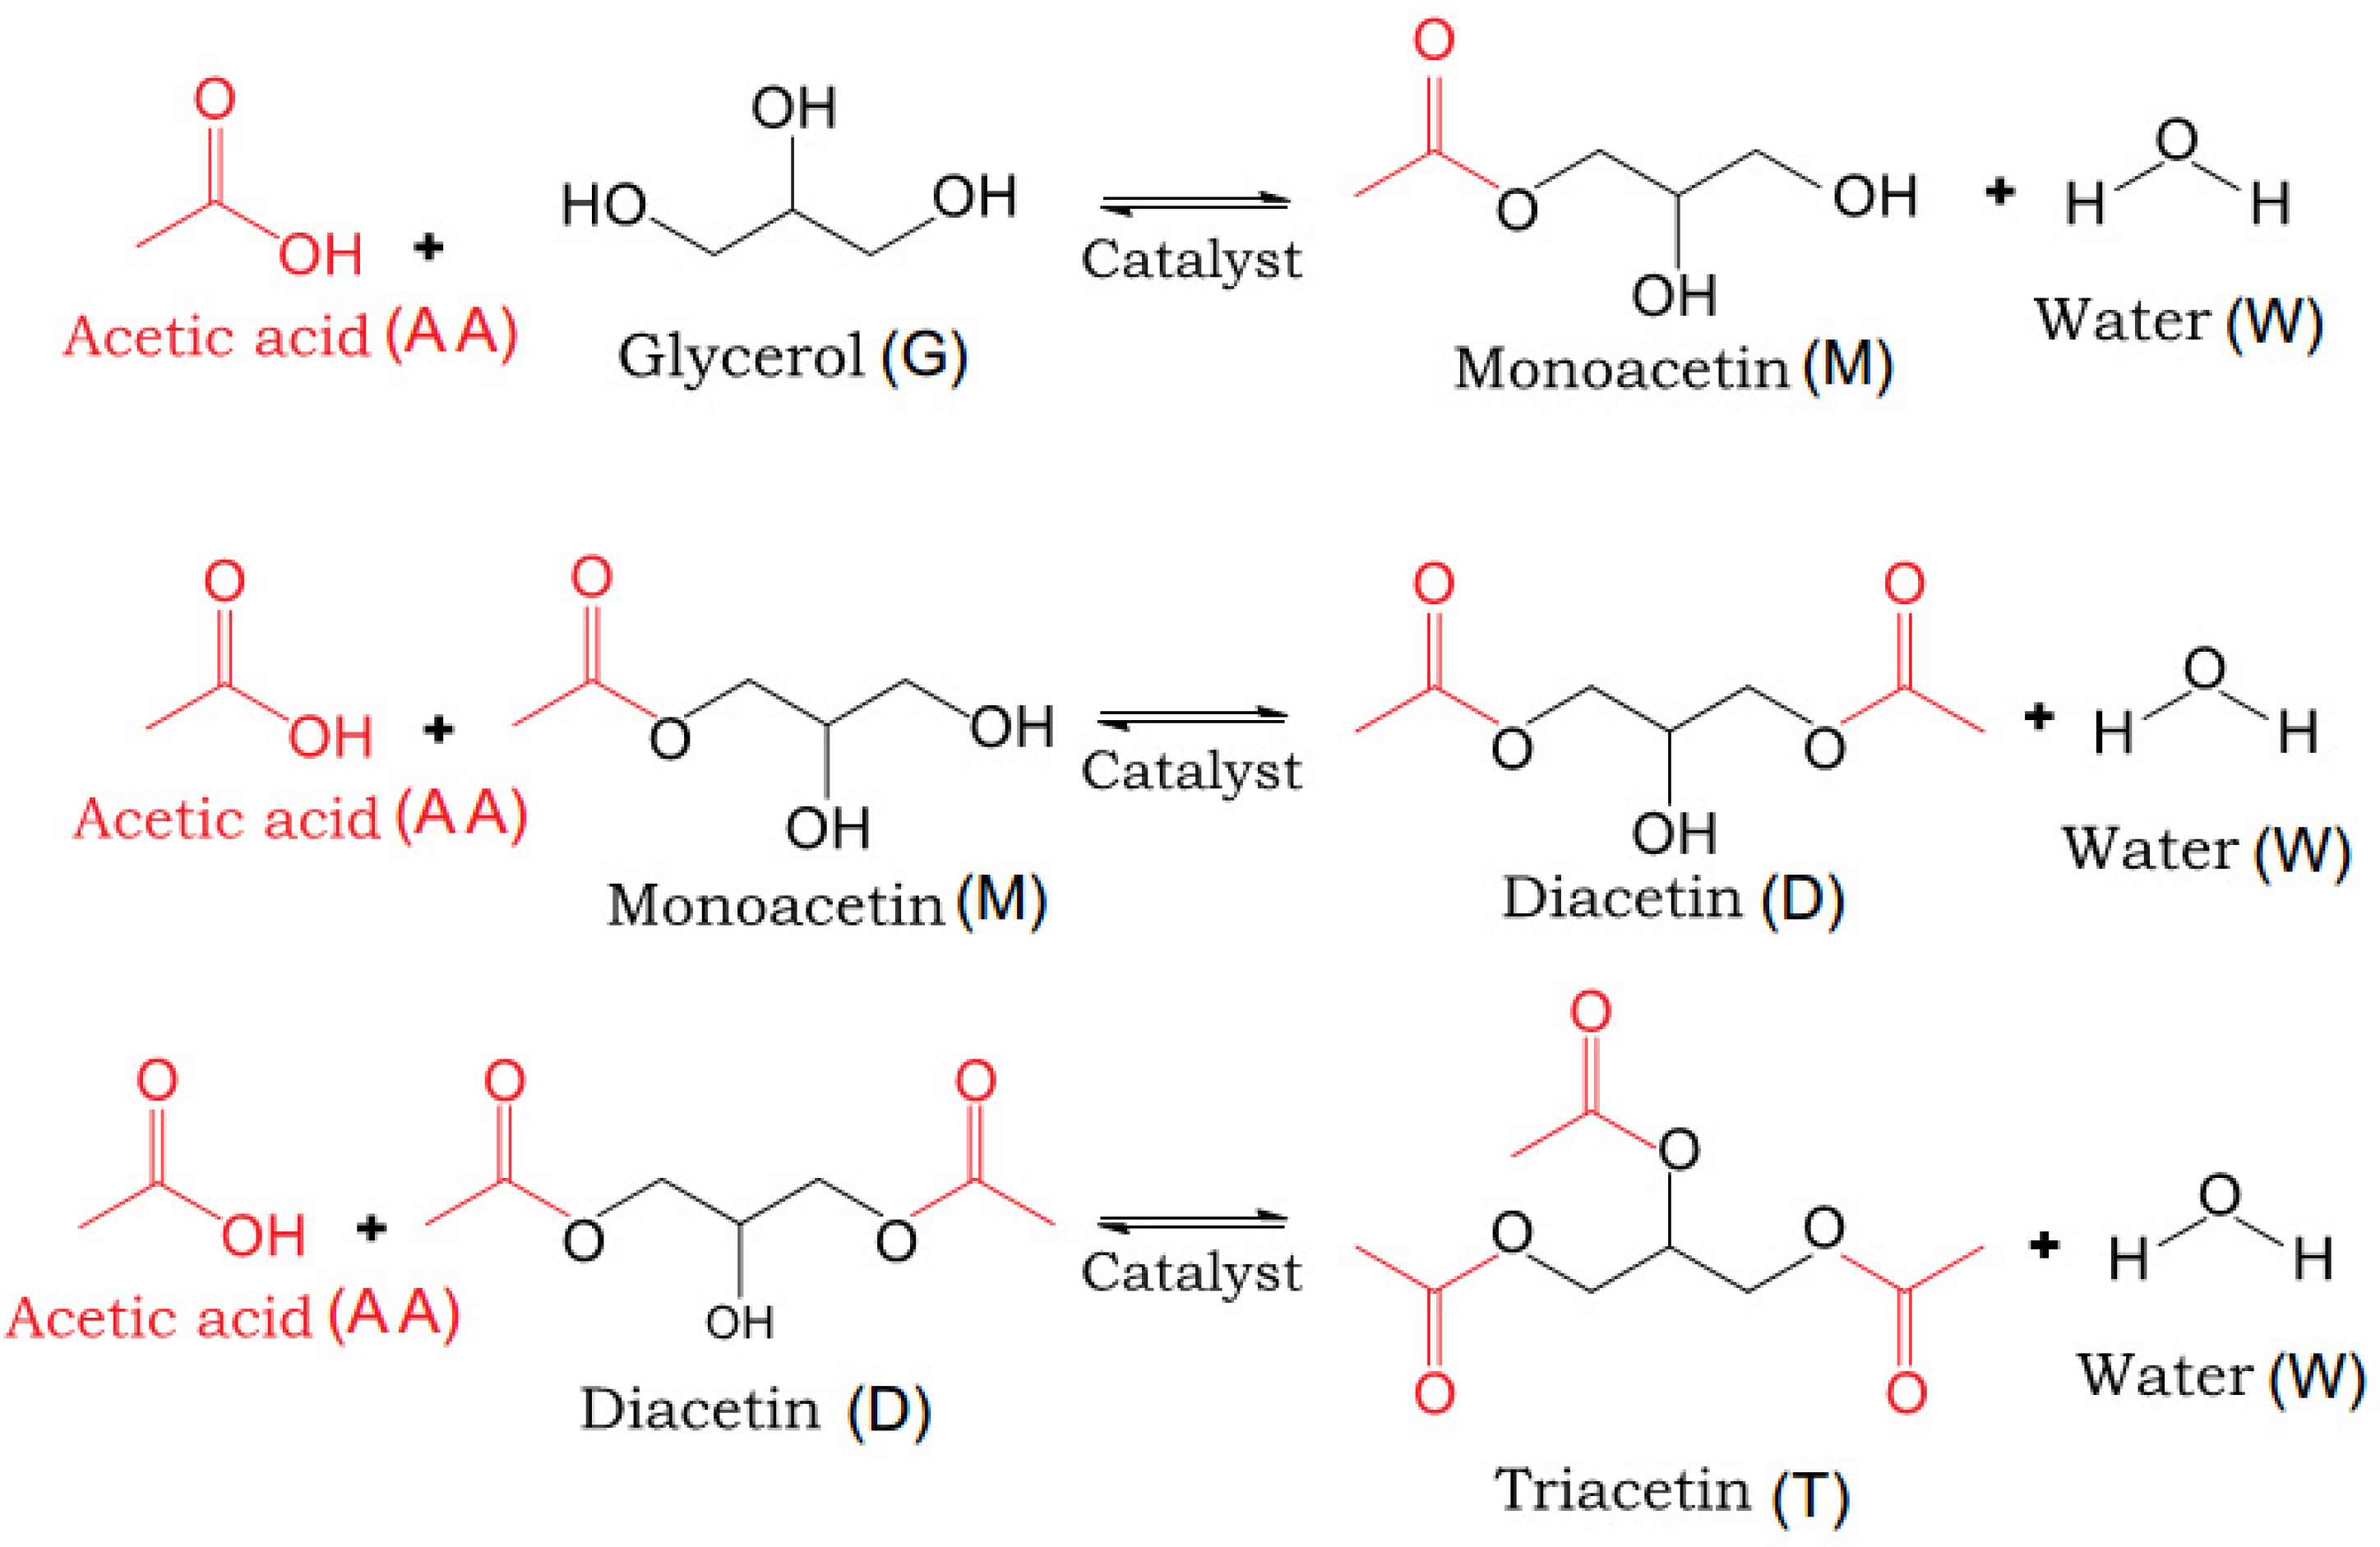
3.5. Glycerol Acetylation

Glycerol acetylation was performed to test the catalysts. Operating conditions were based on previous studies [33,34]. The acetic acid/glycerol molar ratio was 4:1, the catalyst concentration was 40 g L−1, and the reaction was conducted at 90 °C under magnetic stirring for 6 h. At pre-set times, aliquots were withdrawn from the reactor and analyzed using a Shimadzu Nexis GC-2030 gas chromatograph equipped with a SH-Rtx-5 column and a flame ionization detector for quantification of all species. Acetic acid concentration was also determined by acid–base titration. Figure 7 illustrates the set of reactions involved in glycerol acetylation.

3.6. Swelling Index

After the glycerol acetylation reaction, resins were filtered, weighed (WSW), and dried to constant weight (Wd). The swelling index (Sw) was calculated as shown in Equation (4).
S w = W SW W d

3.7. Catalytic Efficiency

In this study, the catalytic efficiency of each resin was calculated as the number of mols consumed/produced per mol of catalytic site at a given time, as described in Equation (5) [7]:
E f = N c IEC   × M cat
where Ef is the catalytic efficiency, Nc is the number of mols of glycerol consumed (or of acetate produced) at the end of the reaction (mol), IEC is the ion-exchange capacity (mol g−1) and Mcat is the amount of resin fed to the reactor (g).

3.8. Kinetic Modeling

A kinetic model was developed for the glycerol acetylation reaction catalyzed by the synthesized acidic resins. The reactions illustrated in Figure 7 can be expressed by chemical Equations (6) to (8), and the respective rate equations are listed in Equations (9) to (11).
Reaction   1 :   AA + G M + W
Reaction   2 :   AA + M D + W
Reaction   3 :   AA + D T + W
r 1 = k 1 0 + k 1 S f AS 1 C cat IEC C AA C G C M C W K eq 1
r 2 = k 2 0 + k 2 S f AS 2 C cat IEC C AA C M C D C W K eq 2
r 3 = k 3 0 + k 3 S f AS 3 C cat IEC C AA C D C T C W K eq 3
where ri is the rate of reaction i (mol L−1 min−1) ,   k i 0 is the rate constant of the uncatalyzed reaction i (mol L−1 min−1), k i S is the rate constant of the catalyzed reaction i (L2 mol−2 min−1), fASi is the fraction of catalytic sites accessible to compounds of reaction i, Ccat is the catalyst concentration (g L−1), IEC is the ion-exchange capacity of the resin (mol g−1), Keqi is the equilibrium constant of reaction i and Cj is the concentration of species j (mol L−1).
The rate constant k i was defined as follows (Equation (12)):
k i = k i S f AS i ,   i = 1 ,   2 ,   3
In Equation (12), k i S and fASi were grouped so that the resulting parameter, k i , contains information of accessibility to resin catalytic sites. It is known that a detailed assessment of resin site accessibility can be carried out by analyzing properties such as chain density distribution (via inverse size exclusion chromatography) and Ogston coefficient for each compound [16,28]. Nonetheless, a simplified approach was used here, assuming an average fraction of catalytic sites accessible to the compounds of reaction i  f AS i .
Molar balances are described in Equations (13) to (18).
d C G d t = r 1
d C M d t = r 1 r 2
d C D d t = r 2 r 3
d C T d t = r 3
d C AA d t = r 1 r 2 r 3
d C W d t = r 1 + r 2 + r 3
Differential equations were solved numerically in Scilab by adjusting a set of uncatalyzed reaction rate constants ( k 1 0 ,   k 2 0 ,   k 3 0 ) and equilibrium constants (Keq1, Keq2, Keq3) for all cases and a set of catalyzed reaction rate constants (k1, k2, k3) for each resin. The R2 values for glycerol, acetic acid, monoacetin, diacetin, and triacetin curve fittings were calculated. The best fit was achieved by adjusting the set of parameters that provided the maximum mean R2 for each resin.
Despite the acidic nature of the styrene–TMPTA resins developed here, stemming from the presence of sulfonic groups, the polarity of the matrix is much more pronounced than that of styrene–divinylbenzene resins. Given this prominent difference, the adsorption/desorption equilibrium parameters of glycerol acetylation on styrene–divinylbenzene resins reported in the literature were not adopted in this work. In order to avoid overfitting, the adsorption/desorption kinetics were not considered for the resin, resulting in a reduced number of parameters (simplified model).
Strictly speaking, the rate equations should be written in terms of compound activities. However, as reactions were carried out at atmospheric pressure, the activities can be replaced by concentrations, as described in Equations (9) to (11).
The objective of the modeling part of this research was to estimate the rate constants for the different resin formulations at the set temperature. This made it possible to discuss the accessibility of compounds to the catalytic sites of each resin. The kinetic data obtained here can be a starting point for further studies to determine the Arrhenius equation parameters by conducting experiments under different temperature conditions.

4. Conclusions

Acidic styrene–TMPTA resins were synthesized using different cross-linker contents and feed times and tested as catalysts in glycerol acetylation. A factorial design was carried out, and the optimum resin formulation was found to be that which contained 2% TMPTA fed along the first 270 min of copolymerization, according to a statistical equation. The mean catalytic efficiency decreased markedly with increasing TMPTA content, demonstrating the effect of reduced accessibility in dense polymer networks. The mean swelling index did not vary significantly with TMPTA content; however, it showed a slight increase with increasing TMPTA feed times. A kinetic model was constructed and validated with experimental data, providing R2 values of about 0.97. The average rate constants of all reactions had a behavior that indicates competing effects (resin macrostructure versus microstructure), in which lower values correspond to the intermediate TMPTA feed time (150 min). This finding is corroborated by the catalytic efficiency profile, which behaved similarly as a function of the TMPTA feed time. TMPTA can be copolymerized with styrene and be sulfonated. Despite the low ion-exchange capacities produced under the sulfonation conditions studied here, styrene–TMPTA resins show attractive accessibility when applied as catalysts.

Author Contributions

Conceptualization, N.A.B.S.G.; methodology, W.M.G. and L.G.A.; formal analysis, A.E.R.; writing—original draft preparation, W.M.G.; writing—review and editing, L.G.A., N.A.B.S.G. and A.E.R.; project administration, L.G.A. All authors have read and agreed to the published version of the manuscript.

Funding

This research was financially supported by the São Paulo Research Foundation (FAPESP) under grant numbers 2020/08631-3 and 2021/10350-5, and also by LA/P/0045/2020 (ALiCE), UIDB/50020/2020 and UIDP/50020/2020 (LSRE-LCM), funded by national funds through FCT/MCTES (PIDDAC).

Data Availability Statement

Not applicable.

Acknowledgments

The authors are grateful to André Luis Ferraz for his support in drafting the paper, and Haíra Slobodianuk for the language revision.

Conflicts of Interest

The authors declare no conflict of interest.

References

  1. Razzaq, R.; Shah, K.H.; Fahad, M.; Naeem, A.; Sherazi, T.A. Adsorption potential of macroporous Amberlyst-15 for Cd(II) removal from aqueous solutions Adsorption potential of macroporous Amberlyst-15 for Cd(II) removal from aqueous solutions. Mater. Res. Express 2020, 7, 025509. [Google Scholar] [CrossRef]
  2. Ramírez, E.; Bringu, R.; Fit, C.; Tejero, J.; Cunill, F. Assessment of ion exchange resins as catalysts for the direct transformation of fructose into butyl levulinate. Appl. Catal. A Gen. 2021, 612, 117988. [Google Scholar] [CrossRef]
  3. Silva, M.V.C.; Souza, A.B.; De Castro, H.F.; Aguiar, L.G.; De Oliveira, P.C.; De Freitas, L. Synthesis of 2-ethylhexyl oleate catalyzed by Candida antarctica lipase immobilized on a magnetic polymer support in continuous flow. Bioprocess Biosyst. Eng. 2020, 43, 615–623. [Google Scholar] [CrossRef] [PubMed]
  4. Aguiar, L.G.; Godoy, W.M.; Nápolis, L.; Faria, R.P.V.; Rodrigues, A.E. Modeling the Effect of Cross-Link Density on Resins Catalytic Activities. Ind. Eng. Chem. Res. 2021, 60, 6101–6110. [Google Scholar] [CrossRef]
  5. Pariente, S.; Tanchoux, N.; Fajula, F. Etherification of glycerol with ethanol over solid acid catalysts. Green Chem. 2009, 11, 1256–1261. [Google Scholar] [CrossRef]
  6. Jagadeeshbabu, P.E.; Sandesh, K.; Saidutta, M.B. Kinetics of esterification of acetic acid with methanol in the presence of ion exchange resin catalysts. Ind. Eng. Chem. Res. 2011, 50, 7155–7160. [Google Scholar] [CrossRef]
  7. Carpegiani, J.A.; Godoy, W.M.; Guimarães, D.H.P.; Aguiar, L.G. Glycerol acetylation catalyzed by an acidic styrene-co-dimethacrylate resin: Experiments and kinetic modeling. React. Kinet. Mech. Catal. 2020, 130, 447–461. [Google Scholar] [CrossRef]
  8. Güemez, M.B.; Requies, J.; Agirre, I.; Arias, P.L.; Barrio, V.L.; Cambra, J.F. Acetalization reaction between glycerol and n-butyraldehyde using an acidic ion exchange resin. Kinetic modelling. Chem. Eng. J. 2013, 228, 300–307. [Google Scholar] [CrossRef]
  9. Orjuela, A.; Yanez, A.J.; Santhanakrishnan, A.; Lira, C.T.; Miller, D.J. Kinetics of mixed succinic acid/acetic acid esterification with Amberlyst 70 ion exchange resin as catalyst. Chem. Eng. J. 2012, 188, 98–107. [Google Scholar] [CrossRef]
  10. Edebali, S.; Pehlivan, E. Evaluation of Amberlite IRA96 and Dowex 1×8 ion-exchange resins for the removal of Cr(VI) from aqueous solution. Chem. Eng. J. 2010, 161, 161–166. [Google Scholar] [CrossRef]
  11. Badia, J.H.; Fité, C.; Bringué, R.; Iborra, M.; Cunill, F. Catalytic Activity and Accessibility of Acidic Ion-Exchange Resins in Liquid Phase Etherification Reactions. Top. Catal. 2015, 58, 919–932. [Google Scholar] [CrossRef] [Green Version]
  12. Van de Steene, E.; De Clercq, J.; Thybaut, J.W. Ion-exchange resin catalyzed transesterification of ethyl acetate with methanol: Gel versus macroporous resins. Chem. Eng. J. 2014, 242, 170–179. [Google Scholar] [CrossRef]
  13. Chandane, V.S.; Rathod, A.P.; Wasewar, K.L.; Sonawane, S.S. Esterification of propionic acid with isopropyl alcohol over ion exchange resins: Optimization and kinetics. Korean J. Chem. Eng. 2017, 34, 249–258. [Google Scholar] [CrossRef]
  14. Serrano, D.P.; Melero, J.A.; Morales, G.; Iglesias, J.; Pizarro, P. Progress in the design of zeolite catalysts for biomass conversion into biofuels and bio-based chemicals. Catal. Rev.—Sci. Eng. 2018, 60, 1–70. [Google Scholar] [CrossRef]
  15. Mane, S.; Ponrathnam, S.; Chavan, N. Effect of Chemical Crosslinking on Properties of Polymer Microbeads: A Review. Can. Chem. Trans. 2016, 3, 473–485. [Google Scholar] [CrossRef]
  16. Tejero, M.A.; Ramírez, E.; Fité, C.; Tejero, J.; Cunill, F. Esterification of levulinic acid with butanol over ion exchange resins. Appl. Catal. A Gen. 2016, 517, 56–66. [Google Scholar] [CrossRef] [Green Version]
  17. Theodoro, T.R.; Dias, J.R.; Penariol, J.L.; Moura, J.O.V.; Aguiar, L.G. Sulfonated poly (styrene-co-ethylene glycol dimethacrylate) with attractive ion exchange capacity. Polym. Adv. Technol. 2018, 29, 2759–2765. [Google Scholar] [CrossRef]
  18. Carpegiani, J.A. Study of Mathematical Modeling of Glycerol Acetylation with Different Catalysts. Master Thesis, Escola de Engenharia de Lorena, Universidade de São Paulo, Lorena, SP, Brazil, 2020. [Google Scholar]
  19. Silva, V.F.L.; Penariol, J.L.; Dias, J.R.; Theodoro, T.R.; Carpegiani, J.A.; Aguiar, L.G. Sulfonated Styrene—Dimethacrylate Resins with Improved Catalytic Activity. Kinet. Catal. 2019, 60, 654–660. [Google Scholar] [CrossRef]
  20. Kong, X.Z.; Gu, X.L.; Zhu, X.; Zhang, L. Precipitation polymerization in ethanol and ethanol/water to prepare uniform microspheres of poly(TMPTA-styrene). Macromol. Rapid Commun. 2009, 30, 909–914. [Google Scholar] [CrossRef]
  21. Karam, H.J.; Tien, L.; Dour, T.; Company, C. Analysis of Swelling of Crosslinked Rubber Gel with Occlusions. J. Appl. Polym. Sci. 1988, 30, 1969–1988. [Google Scholar] [CrossRef]
  22. Ho, L.-H.; Feng, S.-Y.; Yen, T.-M. A New Methodology for Customer Satisfaction Analysis: Taguchi’s Signal-to-Noise Ratio Approach. J. Serv. Sci. Manag. 2014, 07, 235–244. [Google Scholar] [CrossRef] [Green Version]
  23. Wolde-rufael, Y.; Idowu, S. Income distribution and CO2 emission: A comparative analysis for China and India. Renew. Sustain. Energy Rev. 2017, 74, 1336–1345. [Google Scholar] [CrossRef]
  24. Phadke, M.S.; Kackar, R.N.; Speeney, D.V.; Grieco, M.J. Off-line quality control in integrated circuit fabrication using experimental design. Bell Syst. Tech. J. 1983, 62, 1273–1309. [Google Scholar] [CrossRef]
  25. Okay, O. Macroporous copolymer networks. Prog. Polym. Sci. 2000, 25, 711–779. [Google Scholar] [CrossRef]
  26. Jerábek, K. Characterization of Swollen Polymer Gels Using Size Exclusion Chromatography. Anal. Chem. 1985, 57, 1598–1602. [Google Scholar] [CrossRef]
  27. NanoComposix Molecular Weight to Size Calculator. Available online: https://nanocomposix.com/pages/molecular-weight-to-size-calculator (accessed on 18 October 2022).
  28. Bringué, R.; Ramírez, E.; Tejero, J.; Cunill, F. Esteri fi cation of furfuryl alcohol to butyl levulinate over ion-exchange resins. Fuel 2019, 257, 116010. [Google Scholar] [CrossRef]
  29. Faria Neto, A.; Costa, A.F.B.; de Lima, M.F. Use of Factorial Designs and the Response Surface Methodology to Optimize a Heat Staking Process. Exp. Tech. 2018, 42, 319–331. [Google Scholar] [CrossRef] [Green Version]
  30. Godoy, W.M. Synthesis and Characterization of Polymerics Catalysts from Styrene Base, and Application in the Glycerol Acetylation. Master Thesis, University of São Paulo, Lorena, SP, Brazil, 2021. [Google Scholar]
  31. Godoy, W.M.; Carpegiani, J.A.; Pereira, F.M.; Guimarães, D.H.P.; Aguiar, L.G. Kinetic modeling of glycerol acetylation catalyzed by styrene–divinylbenzene and styrene-trimethylolpropane triacrylate sulfonated resins. React. Kinet. Mech. Catal. 2022, 135, 233–245. [Google Scholar] [CrossRef]
  32. Godoy, W.; Castro, G.; Nápolis, L.; Carpegiani, J.; Guimarães, D. Synthesis of Sulfonated Poly [Styrene-co-(Trimethylolpropane Triacrylate)] and Application in the Catalysis of Glycerol Acetylation. Macromol. Symp. 2020, 394, 1900169. [Google Scholar] [CrossRef]
  33. Banu, I.; Bumbac, G.; Bombos, D.; Velea, S.; Gălan, A.-M.; Bozga, G. Glycerol acetylation with acetic acid over Purolite CT-275. Product yields and process kinetics. Renew. Energy 2020, 148, 548–557. [Google Scholar] [CrossRef]
  34. Gomes, J.T.S.; Santos, J.H.S.; Abreu, C.A.M.; Medeiros, E.B.M.; Coelho, L.C.D.; Faria, R.P.V.; Rodrigues, A.E.; Lima Filho, N.M. Development and validation of analytical method for mono, di and triacetin analysis by HPLC/UV–Vis/DAD detection with 13C NMR identification. Results Chem. 2020, 2, 100063. [Google Scholar] [CrossRef]
  35. Perez, F.M.; Gatti, M.N.; Nichio, N.N.; Pompeo, F. Results in Engineering Bio-additives from glycerol acetylation with acetic acid: Chemical equilibrium model. Results Eng. 2022, 15, 100502. [Google Scholar] [CrossRef]
Figure 1. Mean catalytic efficiency calculated from glycerol consumption at 6 h of reaction for resins prepared with different TMPTA contents.
Catalysts 13 00181 g001
Figure 2. Effect of factors on signal-to-noise ratio. The dashed line represents the significance threshold.
Catalysts 13 00181 g002
Figure 3. Comparison of experimental versus predicted catalytic efficiencies. (a) Catalytic efficiencies calculated from glycerol consumption at 6 h of reaction. (b) Catalytic efficiencies calculated from monoacetin production at 2 h of reaction. (c) Catalytic efficiencies calculated from diacetin production at 2 h of reaction. (d) Catalytic efficiencies calculated from triacetin production at 6 h of reaction.
Catalysts 13 00181 g003
Figure 4. Curve fitting for concentration profiles of run S9 (YTMPTA = 0.02, TTMPTA = 270 min). Exp—experimental data; Mod—kinetic model predictions; (a) Glycerol and acetic acid concentrations: A—acetic acid; G—glycerol; (b) Acetates concentration: M—monoacetin; D—diacetin; T—triacetin.
Catalysts 13 00181 g004
Figure 5. Effect of TMPTA feed time on catalytic efficiency (EfE) and kinetic parameters (k1, k2, k3). (a) Average experimental catalytic efficiency of glycerol consumption in 6 h of reaction (L2 mol−2 min−1). Average rate constants of reactions: (b) 1, (c) 2, and (d) 3.
Catalysts 13 00181 g005
Figure 6. Mean chain densities of commercial and synthesized resins. D and A represent the commercial resins Dowex and Amberlyst, respectively [28].
Catalysts 13 00181 g006
Figure 7. Glycerol acetylation. The isomers 1- and 2-monoacetin and 1,2- and 1,3-diacetin are formed during the process [35].
Catalysts 13 00181 g007
Table 1. Experimental conditions and polymerization (PY) and sulfonation (SY) yields.
RunFactorResponse
YTMPTATTMPTAPY (%)SY (%)
10.10307789
20.101508582
30.102708882
40.06307385
50.061509093
60.062709280
70.02307383
80.021507482
90.022705773
100.061509391
110.0615010093
YTMPTA, cross-linker content; TTMPTA, cross-linker feed time. A two-phase feed program was used. From 0 to 30 min of reaction, TMPTA was fed into the reactor at 10 min intervals. From 30 min onward, TMPTA was fed at 20 min intervals. In all cases, the total amount of cross-linker was divided into equal portions throughout the reaction.
Table 2. Properties of sulfonated resins.
ResinYTMPTATTMPTA (min)IEC (mmol g−1)Sw
S10.10300.5851.177
S20.101500.5401.344
S30.102700.5401.463
S40.06300.4181.214
S50.061500.6411.440
S60.062700.5371.355
S70.02300.3571.244
S80.021500.4131.104
S90.022700.4111.578
YTMPTA, cross-linker content; TTMPTA, cross-linker feed time; IEC, ion-exchange capacity; Sw, swelling index. Results for S5 are the mean values of three resins obtained under center point conditions (runs 5, 10, and 11).
Table 3. Glycerol conversion (XG) and catalytic efficiency (Ef) of polymer resins.
ResinYTMPTATTMPTA (min)IEC (mmol g−1)XG (%)Ef
S10.10300.5858698
S20.101500.5406690
S30.102700.5406387
S40.06300.41878173
S50.061500.6417283
S60.062700.53788181
S70.02300.35764147
S80.021500.4133484
S90.022700.41190206
YTMPTA, cross-linker content; TTMPTA, cross-linker feed time; IEC, ion-exchange capacity. Conversions and efficiencies calculated from glycerol content at 1 h of reaction.
Table 4. Model parameters.
RunResin Formulation k 1
(L2 mol−2 min−1)
k 2 ( L 2   mol 2   min 1 ) k 3 ( L 2   mol 2   min 1 )
TMPTA Content (%)TMPTA Feed Time (min)
S110300.11000.05500.0041
S2101500.08000.02100.0030
S3102700.06500.01500.0022
S46300.15000.03900.0045
S561500.12400.03800.0034
S662700.10000.05700.0048
S72300.12000.02700.0031
S821500.07600.01800.0039
S922700.21000.08900.0061
TMPTA, trimethylolpropane triacrylate. Parameters fitted for all cases: Keq1 = 3, Keq2 = 1, and Keq3 = 0.7. k 1 0 = 1.67 × 10 4 , k 2 0 = 5.50 × 10 5 , k 1 0 = 7.00 × 10 7 L mol−1 min−1.
Table 5. Factorial design.
LevelFactors
YTMPTATTMPTA (min)
10.1030
20.06150
30.02270
Disclaimer/Publisher’s Note: The statements, opinions and data contained in all publications are solely those of the individual author(s) and contributor(s) and not of MDPI and/or the editor(s). MDPI and/or the editor(s) disclaim responsibility for any injury to people or property resulting from any ideas, methods, instructions or products referred to in the content.

