Article

ZnO/CQDs Nanocomposites for Visible Light Photodegradation of Organic Pollutants

Department of Organic Chemistry, Biochemistry and Catalysis, Faculty of Chemistry, University of Bucharest, Regina Elisabeta Blvd., No. 4-12, 030016 Bucharest, Romania
*
Author to whom correspondence should be addressed.
Catalysts 2022, 12(9), 952; https://doi.org/10.3390/catal12090952
Submission received: 3 August 2022 / Revised: 22 August 2022 / Accepted: 24 August 2022 / Published: 26 August 2022

Abstract

:
Currently, carbon quantum dots (CQDs) have been widely investigated as an enhancing photocatalytic component of various nanocomposites. In this study, hetero-structures containing carbon quantum dots (CQDs) associated to zinc oxide were prepared following two one-pot procedures: (i) a hydrothermal approach in which commercial ZnO was used as carrier for CQDs; and (ii) an approach in which the ZnO/CQDs samples were produced in situ by adding zinc acetate to an aqueous suspension of CQDs. CQDs were prepared in advance by a low-temperature hydrothermal (LHT) treatment of useless humins wastes produced by the glucose dehydration in an acidic medium. These samples were characterized by several techniques such asadsorption-desorption isotherms of liquid nitrogen at 77K, X-ray diffraction (XRD), infrared diffuse reflectance with Fourier transform (DRIFT) and UV-vis spectroscopy. The photocatalytic behavior of these materials was investigated in the degradation of methylene blue (MB). The obtained results revealed electronic interactions between CQDs and ZnO which have as an effect an enhancement of the charge separation and diminution of the charge recombination. In accordance, a correlation between the photocatalytic activity and the intrinsic properties of ZnO/CQDs has been evidenced. The highest photocatalytic activity corresponded to the heterostructure containing highly dispersed narrow sized CQDs onto ZnO. Under visible light irradiation and after 180 min of irradiation, MB was degraded by as much as 97.6%.

Graphical Abstract

1. Introduction

Photocatalysis is providing a promising alternative to the highly energetic and pollutant chemical transformations [1,2]. As a photocatalyst, zinc oxide (ZnO) attracted a certain interest due to its quite efficient behavior in environmental applications such as the cleaning of wastewaters or the polluted air [3]. Also, its high photosensitivity correlates well to other important features such as its non-toxicity and low cost [3]. However, its large bandgap (3.37 eV), massive charge carrier recombination, and photoinduced corrosion–dissolution under extreme pH conditions, leading to inert Zn(OH)2, are all barriers to its extensive applicability [4].
Then, the photocatalytic efficiency of ZnO is highly dependent on the surface morphology and particles size [5,6,7,8]. Therefore, in order to inhibit the surface-bulk charge carrier recombination, intensive research has been carried out to improve its performances by tailoring the surface-bulk structure and altering its photogenerated charge transfer pathways [4]. This also correlates well with the requirement for new photocatalytic materials able to shift the adsorption from UV towards the visible region [9].
The luminescence of ZnO in both the visible and UV regions is assigned to the intrinsic defects created during synthesis. Accordingly, its broad visible luminescence is associated to its morphology and crystalline structure [4]. Further, engineering O and Zn vacancies of this oxide may even tune its photoluminescence emission [10]. In this way, its photocatalytic behavior under visible irradiation may be tuned by coupling with another semiconductor, with carbon nanoparticles, and by doping with transition metals [11,12,13] or non-metal elements (i.e., C or N) [14,15]. However, most of these hybrid ZnO nanocomposites still suffer from an inefficient use of sunlight (<5%) and an unstable nature.
Recently, due to their unique properties, carbon quantum dots (CQDs) became a focal point of interest as a new class of carbon nanomaterials [16]. Their synthesis mainly focuses easy routes of preparation, surface passivation and functionalization [17], small particle sizes, biocompatibility, photoluminescence (PL) properties, a high-temperature stability, a chemically inert structure, and a low toxicity. Correlated to these, CQDs already received interest in many fields, such as photocatalysis [18], sensors [19] and biomedical applications [20,21].
For the particular case of photocatalysis, CQDs became potential competitors to conventional semiconductor quantum dots (QDs) synthesized from the elements of the groups III–VI or toxic heavy metals [22]. Moreover, their hybridization with different materials such as TiO2, ZnO, SiO2, Fe2O3, Ag3PO4, or Cu2O has been reported as a new opportunity to improve the charge separation and the reduction of the charge recombination, leading thus to the enhancement of the photocatalytic efficiency [23,24,25,26,27].
Very recently Widiyandari et al. [25]. reviewed the applications of ZnO/CQDs nanocomposites for the degradation of pollutants focusing the progress in their development. However, despite the numerous reports on the CQDs exploiting for different applications, the synthesis of ZnO/CQDs nanocomposites, with the aim to promote ZnO photocatalytic activity under visible light irradiation, was investigated only in a few reports [27,28,29,30].
Based on this state of the art, the challenge of the present work was to combine, in an innovative way, photocatalysis, biomass wastes valorization and environmental degradation with the aim to rich a high degree of sustainability. To reach this scope, the synthesis of carbon quantum dots (CQDs) has been carried out from a worthless humins by-product, generated in the dehydration of the glucose. This was treated through an environmentally hydrothermal friendly (LTH) process at low-temperature. Subsequently, for the photocatalytic degradation of the organic dyes, there were synthesized ZnO/CQDs nanocomposites. The synthesis of these followed two hydrothermal routes: (i) in which a commercial ZnO was used as carrier for the CQDs; and (ii) an one-pot process in which a Zn(CH3COO)2·2H2O precursor salt was directly added to an aqueous solution of CQDs. After gentle drying, these materials were investigated in the photooxidative degradation of methylene blue (MB), a representative of a class of dye-stuff resistants to biodegradation, under both UV and Vis lights irradiation.

2. Results and Discussion

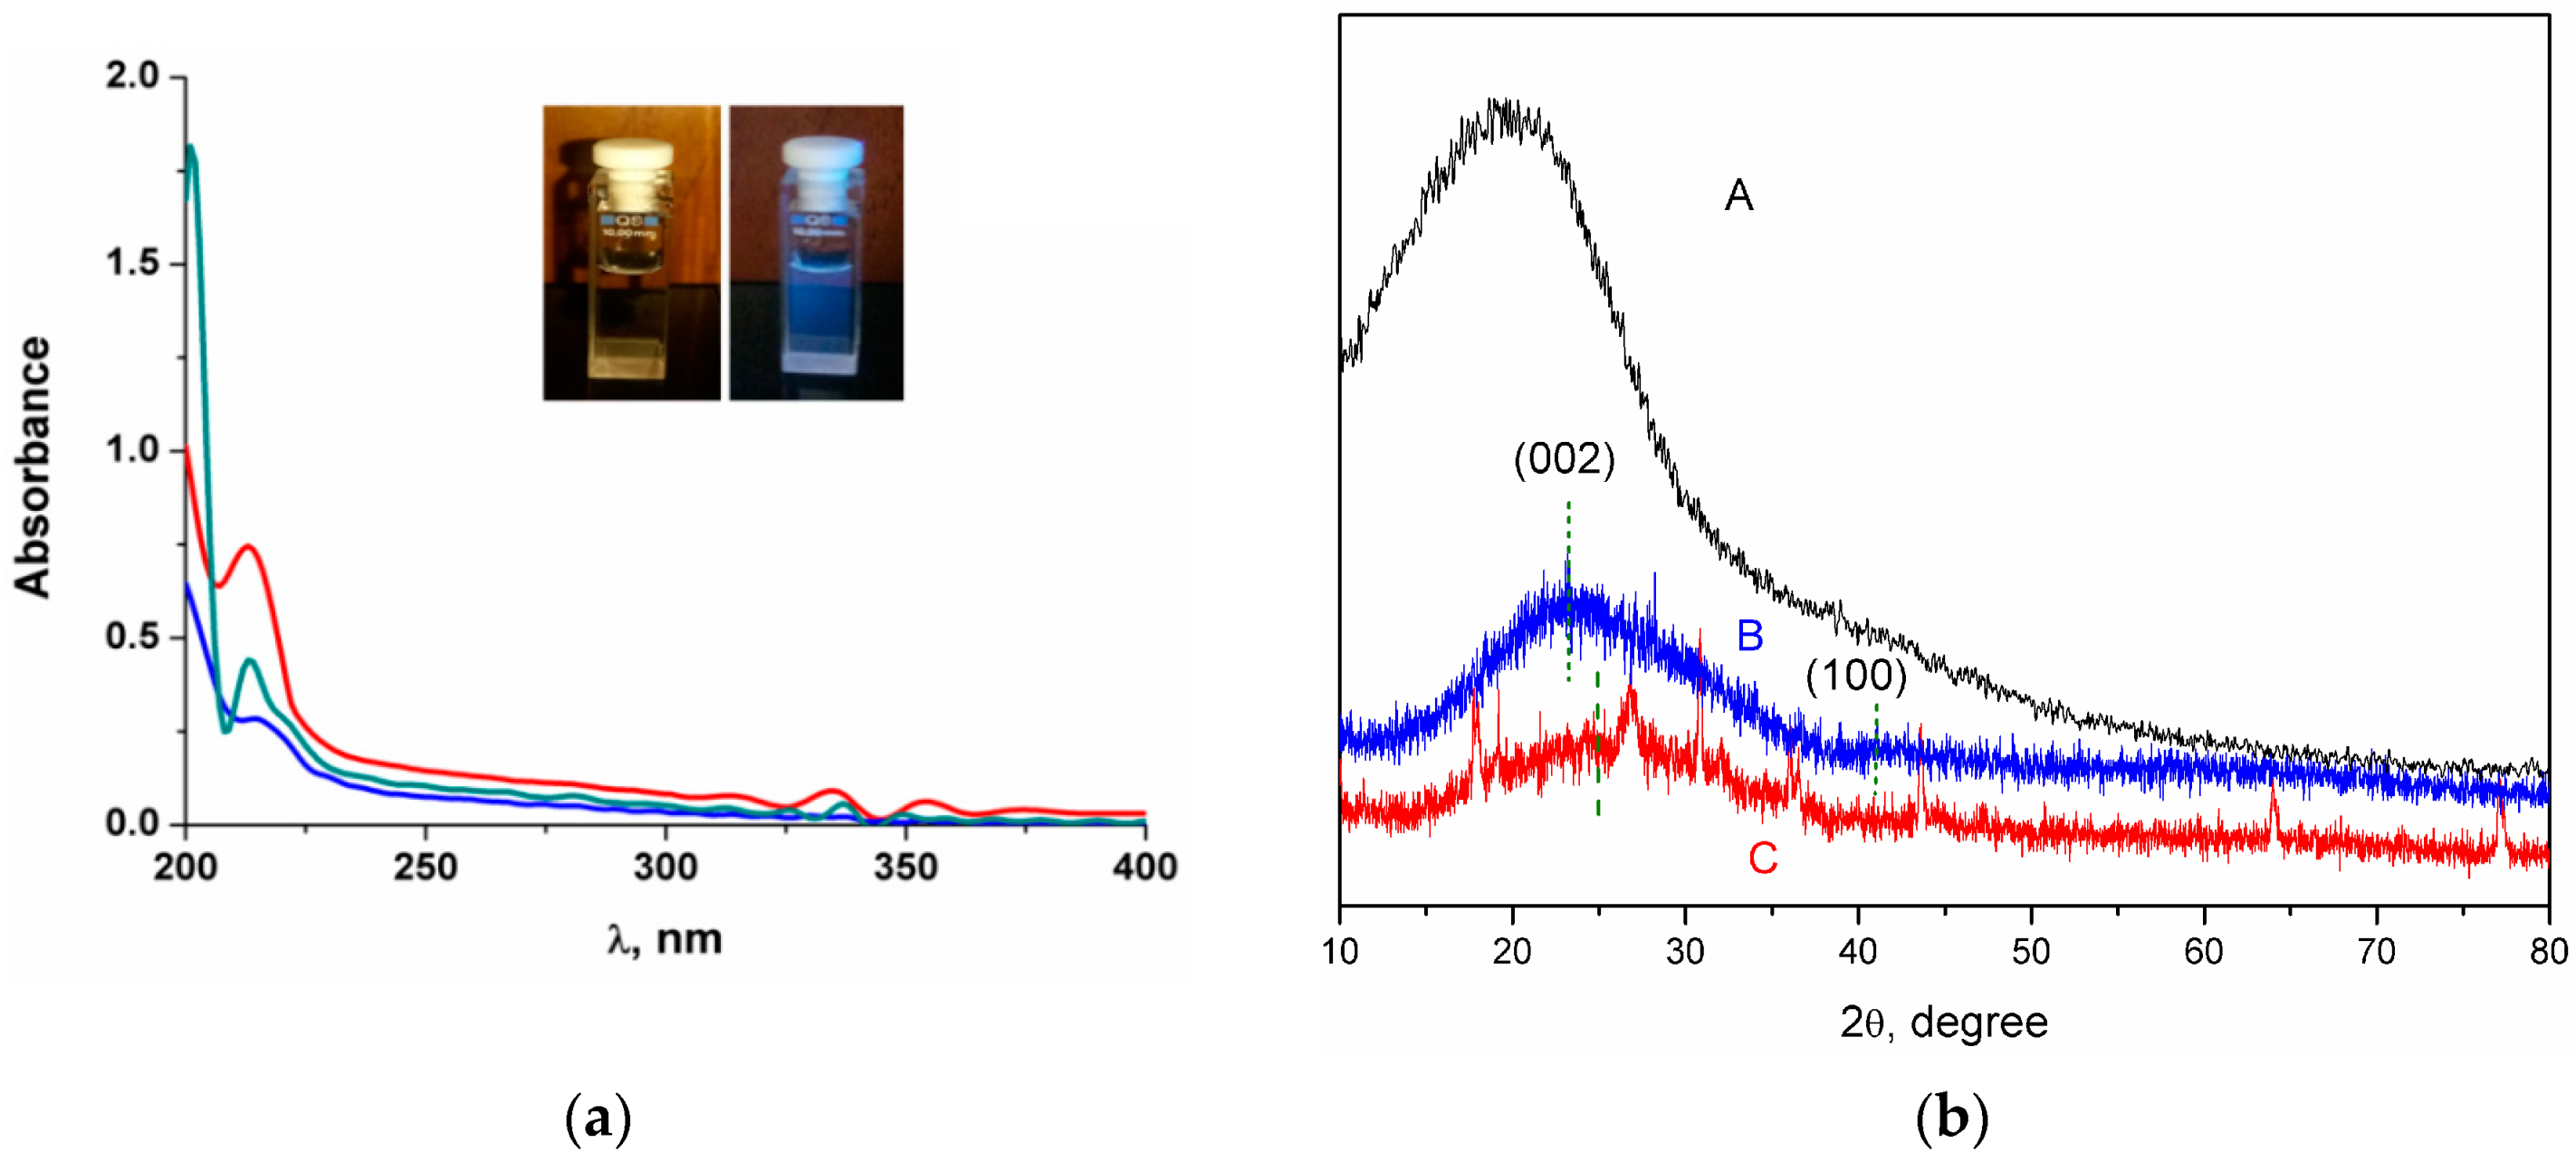
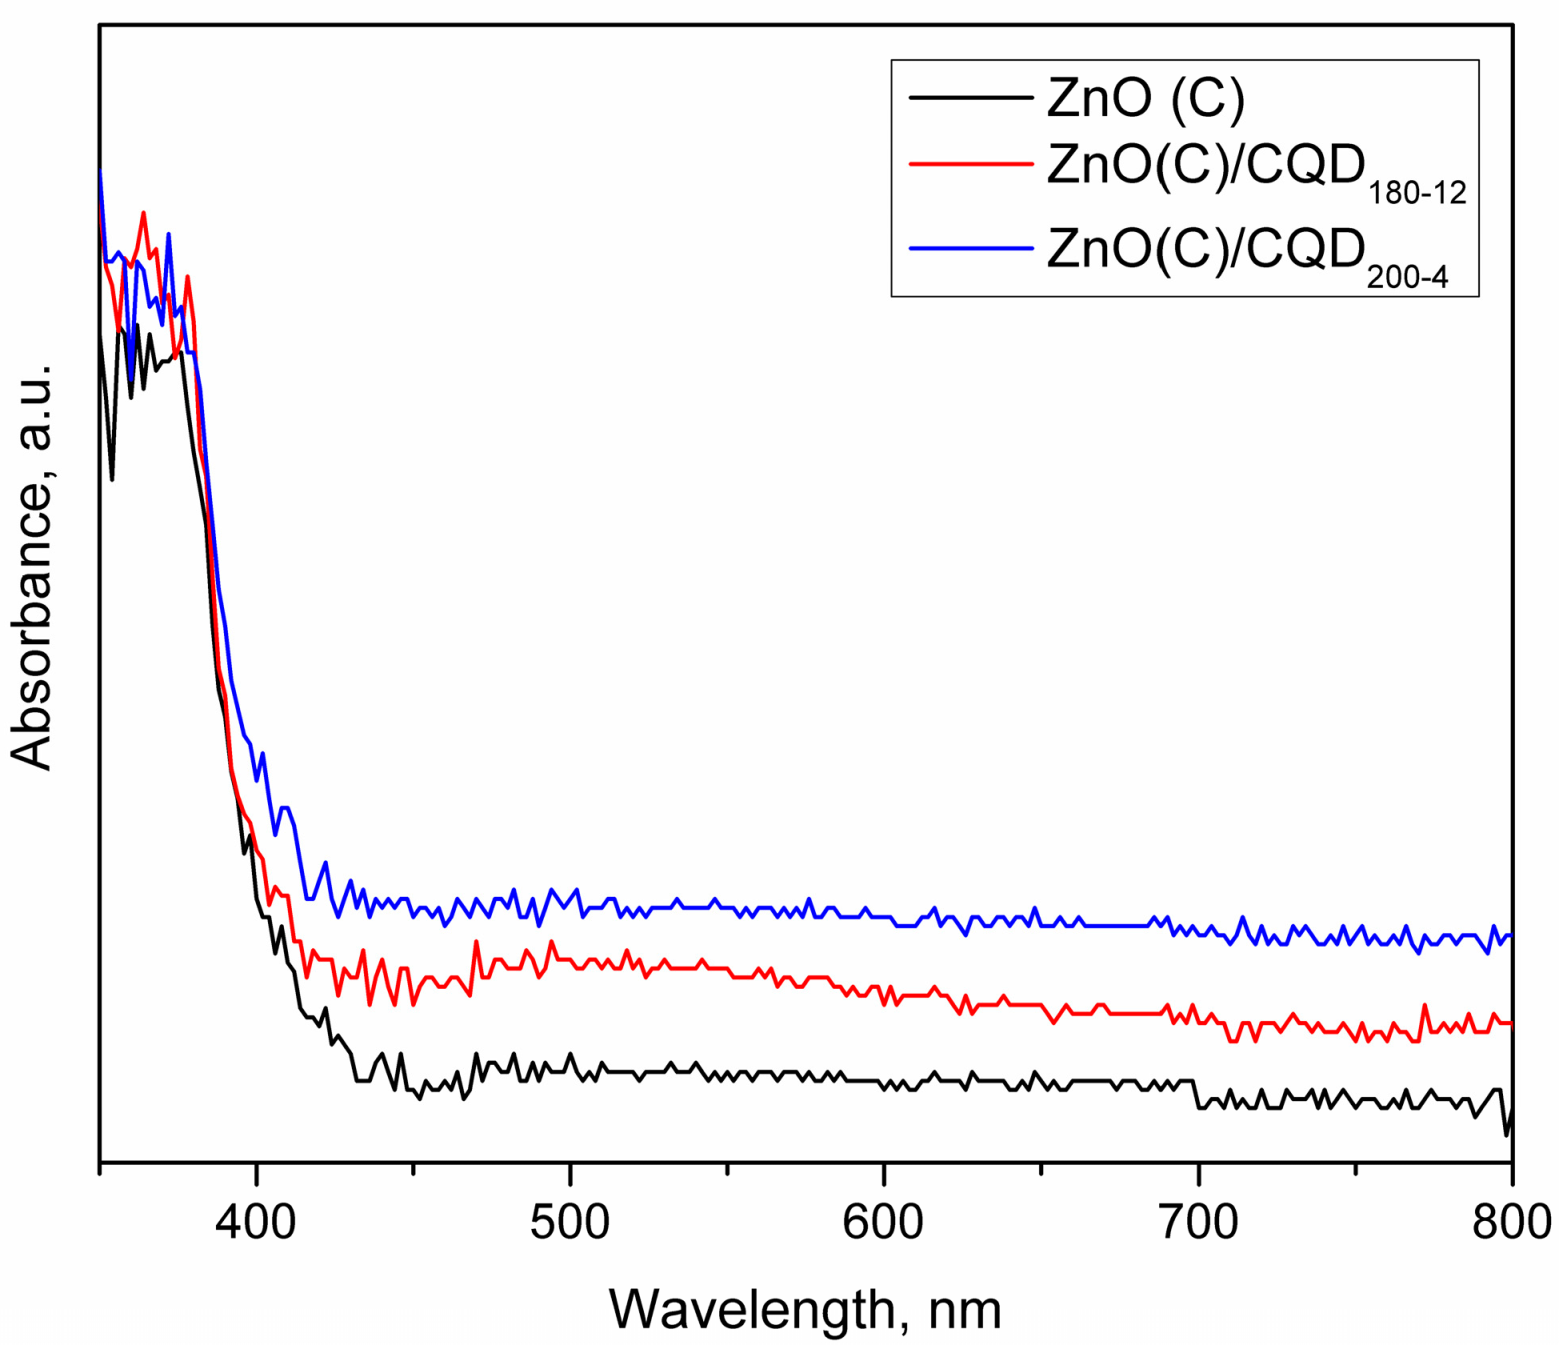
2.1. ZnO/CQDs Nanocomposites Characterization

Carbon quantum dots (CQDs) obviously present a core-shell morphology with nanocrystalline or amorphous cores [31] and shells with attached polar groups (e.g., hydroxyls, carboxyls and carbonyls) derived from starting materials [32]. However, when the CQDs are produced via a low-temperature hydrothermal (LTH) approach their size distribution and chemical composition highly depend on two key factors, namely, the reaction time and the synthesis temperature.
In this work the CQDs were synthesized from humins wastes produced by acid dehydration of D-glucose. The LTH approach was applied for the CQDs synthesized at 160–200 °C, for 4–12 h, respectively. Emission spectra at λex = 310 nm reveal the effect of the hydrothermal parameters on the fluorescence characteristics of CQDs. Both the temperature and time affect the CQDs formation progress and the fluorescence properties. The highest PL intensities were registered for either CQDs synthesized at higher temperatures and shorter synthesis times (i.e., CQD200-4) or at lower temperatures and longer synthesis times (e.g., CQD180-12) (Figure 1a). At 200 °C, longer reaction times led to the aggregation of the small CQDs exhibiting a lower intensity of fluorescence (not shown in Figure 1a) while, at 180 °C, the intensity of the fluorescence depended on the reaction time, thus suggesting a progress of the LTH process. Therefore, at 180 °C and a short reaction time, the fluorescence is weak. This implies that the reaction is just in the initial stage and the concentration of the quantum dots formed is low. The fluorescence intensity gradually increases with the reaction time increases, which suggests an increase in the carbon dot concentration. The solution with the brightest luminescent is obtained after 12 h (Figure 1b).
ATR-FTIR measurements confirmed the influence of the synthesis parameters upon the nature of the CQDs functionalities. As ATR-IR spectra show (Figure 2), the bands at 1220–1100 cm−1 correspond to the C-O-C stretching, at 1370 cm−1 to the O-H in-plane deformation vibration, at 1640 cm−1 to the C=C stretching, at 1730 cm −1 to the C=O stretching and at 3300 cm−1 to the –OH stretching vibration, most probably attached to the surface and at the CQDs edge. The intense and broad band centered at 3300 cm−1 proves the high concentration of the hydroxyl groups, irrespective of the LTH parameters. Also, their presence justify a very good dispersion and high stability of these solid nanoparticles in water [33]. However, the intensity of the absorption band at 1730 cm−1 (characteristic to the C=O stretching) diminished with the increase of the hydrothermal temperature from 180 to 200 °C that may indicate a decreased population of the carboxylic group in the shell composition, also in accordance to the literature data [34].
The structural properties of the CQDs were as well investigated by UV-Vis (Figure 3a) and XRD patterns (Figure 3b). The inset in Figure 3a shows the images of the CQD200-4 solutions collected in visible and UV light (365 nm). The faint yellow color under visible light and the distinct blue emission under the UV light at 365 nm correspond to a red-shift.
The UV absorption band at 220 nm is attributed to the π-π* transition of the C=C bonds with a tail extending into the visible range (Figure 3a). The relatively weak absorptions at 335 and 354 nm may originate from the n–π* transition of the C=C-C=O groups (335 nm) and from the overtone transition of the oxygen bridged bond (R-O-R′) (354 nm) in the sp3 hybrid region. The XRD pattern (Figure 3b) of CQDs revealed two diffraction lines centered at 22 and 42°, indicating a graphite-like carbon structure in their core [35]. For the CQD180-12, the lower diffraction line intensity along with a relatively high full width half maximum suggest the presence of particles with a smaller size [34].
The PL emission spectra of the CQDs excited at λex = 250–450 nm (Figure 4a exemplifies the PL spectra of CQD200-4) consist of two overlapping spectral bands [36], with a double PL peaks at 410 and 445 nm, respectively. In accordance to Yuan et al. [37] this is a consequence of the electron transition between the edge states functional groups and carbon states, such as conjugate π states (or sp2 area). The different origins of the PL emission are also confirmed by the decrease of the relative intensity of the band at 410 nm with the increase of the relative intensity of the band at 445 nm (namely with the increase of the excitation wavelength).
For the excitation in the range of 250–340 nm no perceptible excitation-emission dependence (λem = 410–445 nm) has been observed while a distinct red-shift from λem = 445 to λem = 530 nm was clearly evidenced when λex shifted from 360 to 450 nm (Figure 4a). This excitation-independent PL behavior is derived from the CQDs homogeneous particle size [38] while the high polarity of the nanosized and the sp2-carbon networks of CQDs is usually claimed as being responsible for the excitation-dependent PL behavior [39]. In accordance, it can be assumed that the excitation-independent PL behavior of the shorter wavelength part of the emission is due to the predominant homogeneous size of CQDs, while the excitation-dependent behavior of the longer wavelength part is attributed to the presence of a low population of CQDs with larger sizes [40]. An additional argument that comes to support the assumption of the existence of predominate homogeneous CQDs size is given by the wavelength corresponding to the maximum emission (λmax). This remained approximately constant for the excitation (λex) in the 240–340 nm range while for the range of 360–450 nm the position of the maximum emission shifted with the increase of the excitation wavelength (Figure 4b).
The quantum yield (QY) (λex = 366 nm) of the CQDs varied in the: CQD200-4 (22.6%) > CQD180-12 (21%) > CQD180-4 (8%), order, namely, with values comparable to most of the reported QYs in the literature [38]. In accordance with Zhu et al. [41], the higher QY of CQD200-4 can be attributed to its edge slightly smaller concentration of the non-radiative recombination carboxyl (–COOH) sites (see also Figure 2). The smaller size of the CQDs obtained at 180 °C and after 12 h could justifies the increased QY value compared to that of CQDs produced at the same temperature but after only 4 h.
ZnO/CQD nanocomposites were subsequently produced using the above synthesized CQDs through either the hydrothermal (ZnO(C)/CQD) or the one-pot hydrothermal (ZnO(OP)/CQD) routes. The corresponding XRD patterns are given in Figure 5.
The diffraction lines at 2θ = 31.68°, 34.35°, 36.09°, 47.36°, 56.48°, 62.70°, 66.23°, 67.87°, 68.99°, 72.55°, and 76.77° were assigned to (100), (002), (101), (102), (110), (103), (200), (112), (201), (004) and (202) crystalline planes of ZnO (wurtzite, with hexagonal phase structure (JCPD36-1451)) [42]. The patterns of ZnO(C)/CQDs were identical with those of the ZnO(C) carrier (Figure 5a) that demonstrates the crystal structure of ZnO has not been modified by CQDs. Also, the XRD patterns of the ZnO(C)/CQD (Figure 5a) do not evidenced diffraction lines characteristic to CQDs indicating a high dispersion of these on the external surface of ZnO. This may also correspond to a small loading, poor crystallinity and high dispersion of the CQDs into the ZnO(C)/CQD composites.
XRD patterns of the samples prepared via the one-pot hydrothermal approach (OP) also showed lines assigned to the ZnO (wurtzite, hexagonal phase structure (JCPD36-1451)) (Figure 5b).
The crystallites average size was determined from the Debye-Scherrer equation taking the reflection (101) of hexagonal ZnO wurtzite (1) [43]:
d = k λ β cos θ
where: d is the crystallite size in nm; k = 0.94; λ is the wavelength of the X-ray (1.54178 Å); θ is the half-diffraction angle and β is the full width at half-maximum (FWHM) in radians for the 2θ value.
As Table 1 shows, the average crystallite sizes of the ZnO(C)-based samples varied in a narrow range (33–35 nm), while for those prepared via the one-pot hydrothermal approach (i.e., ZnO(OP)-based samples), the average crystallite sizes were even smaller (cca 28 nm). The broadening of the (101) diffraction line also supports the smaller sizes of all of the prepared samples, irrespective of the applied approach.
Similar to ZnO–graphene composites [44], the XRD patterns of ZnO(OP)/CQD show a shifting of the main diffraction lines (i.e., (100), (002), (101) planes) to a lower degree (Figure 6 and Table 1, column 3) compared to the pure ZnO(C), indicating both a change in the ZnO lattice constants and a stronger interaction with CQDs [45,46].
The lattice parameters (a, b and c) were calculated using Equation (2), while the plane d-spacing (d) was calculated using the Braggs’ Equation (3) [47]:
a = b = λ 3 sin θ 100   and   c = λ sin θ 002
d = λ 2 sin θ 101
where: θ100 and θ002 are the diffraction lines angles of the (100) and (002) planes, respectively.
As Table 2 shows, for ZnO(OP)/CQD the lattice parameters (a, b and c) were higher [48]. Obviously, such a modification is due to the presence of CQDs and the enlarged d-spacing may suggest a relatively high density of the ZnO stabilized CQDs layers.
For both ZnO and ZnO/CQD the adsorption-desorption isotherms of nitrogen (Figure 7) correspond to a type IV in the IUPAC classification. These indicate the presence of a small percentage of micropores filled with nitrogen at extremely low relative pressures and of a multilayer evidenced at high relative pressures. Finally, a capillary condensation prevails as the pressure gets higher. The H3-type hysteresis provides an indication of slit-shaped pores generated through the particles’ aggregation.
The BET surface areas, pore volumes (Vp), average pore diameter (Dp) and particles size (dBET) are given in Table 3.
The average diameter of the particles (dBET) was calculated from SBET using the formula:
d B E T ( nm ) = 6000 S B E T ( m 2 / g ) × ρ ( g / c m 3 )
where: ρ is the ZnO density (5.61 g/cm3).
As Table 3 shows, except sample ZnO(C)/CQD200-4 sample with an average Dp (nm) of 52 nm, all other samples possess average pores in the mesoporous size range, which coincides with the type IV adsorption isotherm. BET surface areas were in the range of 7–18 m2/g while the pore volumes between 0.038 and 0.136 cm3/g. The diminution of the surface and pore volume for ZnO(OP)-samples may be assigned to the intercalation of the CQDs between the ZnO layers but also as a consequence of the agglomeration of the nanoparticles. Indeed, for the samples prepared via the one-pot hydrothermal approach (denoted with (OP)) the increased particle size (dBET) corresponds to a higher agglomeration of the smaller crystallite ZnO. These results are also supported by the XRD measurements.
The electronic interaction between ZnO and CQDs was further confirmed by the DRIFT spectra. The strong bands at 642 and 872 cm1 are attributed to the Zn-O stretching vibrations [49] while the bands at around 1635 and 3464 cm−1 are attributed to the O-H stretching vibrations of chemisorbed water molecules [50,51] (Figure 8). However, the band at 1635 cm−1 may also be assigned to the C=C stretching vibration of the numerous sp2 species that enriched the aromatic structure of the CQDs [52]. The band at 1569 cm−1 is assigned to the C=C stretching of polycyclic aromatic structures, while that at 1418 cm−1 to C-O vibrations of the oxygen containing groups [46].
The absorption band at 1260 cm−1 is ascribed to the C-O-C stretching of the furan ring deformation while the new band at 1338–1345 cm1 for ZnO/CQDs to a new Zn-COO group formed as a result of the CQDs interaction with the ZnO carrier (Figure 9).
Photo-absorption is one of the key factors affecting the photocatalytic performance of the photocatalysts. As shown in Figure 10, ZnO has almost no absorption above 370 nm that is in accordance to its band gap. However, the ZnO/CQDs composite showed an absorption in the visible light region, ranging from 450 to 650 nm, likely derived from the interaction between the CQDs and ZnO. As consequence, the increased intensity of this absorption band may serve as an indication of the contribution of CQDs to the enhanced visible light absorption of the composite [53].

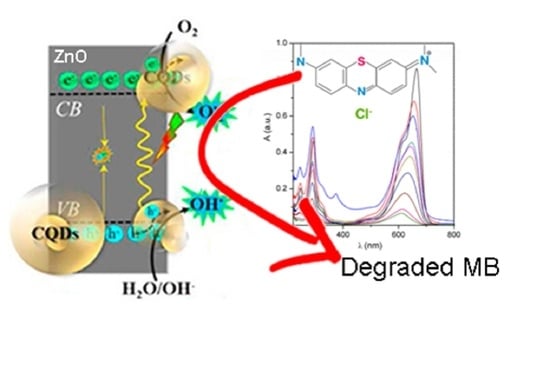
2.2. Methylene Blue (MB) Photodegradation

The pH solution influences the ionization of the MB and the catalyst surface [54,55], neutral and basic environments leading to better efficiency than acidic environments. The pHPZC of ZnO which lies between 8 and 9. Therefore, as the pH of the solution increases pHPZC of ZnO becomes zero or less positive hence, the percentage of MB adsorption increases with increase in pH, leading to an enhanced degradation. The low degradation efficiency in acidic pH is related to the presence H+ ions which compete with cationic pollutant molecules (i.e., MB) for the adsorption onto the adsorbent surface [56].
Therefore, the photocatalytic degradation of the methylene blue has been carried out in both the absence (i.e., pH = 6 for the used MB solution) and the presence of the Na2CO3/NaHCO3 buffer (pH = 9.2), and under UV and Vis light irradiation. Under the UV irradiation zinc oxide may suffer photocorrosion reactions. However, very recently it has been showed that due to the fast charge separation, the presence of CQDs can protect the ZnO semiconductor from photocorrosion and, therefore, enhance its structural stability [53].
MB is a chromogenic agent whose N-S heterocycle group attached to benzene includes lone pair electron in which thiol group is the main chromophoric group [57,58]. The UV-Vis bands at 612 and 666 nm are characteristic for the large conjugated system of the N-S heterocycle group while that at 292 nm characterizes the phenothiazine structure [58]. The collected UV-Vis spectra during the MB photo-degradation in the presence of ZnO(C) and under UV irradiation, in the absence or the presence of the Na2CO3/NaHCO3 buffer are shown in Figure 11.
During the photocatalytic reaction the intensity of the bands located in the visible region suffered an important decrease (Figure 11a,b) that is also an indication of a destruction of the heterocycle conjugated structure, both at pH = 6 and pH = 9.2. This effect was synchronized with a decoloration process, supporting the recorded blue shifts (i.e., hypsochromic effects) associated to N-demethylation of the dimethylamino group of MB [57,58]. The diminution of the phenothiazine structure occurred through opening of the ring via the attack of hydroxyl radicals.
However, as Figure 11 shows the MB degradation takes place with a conversion of 98.2%, at pH = 6 and after 180 min of irradiation with UV (Figure 11a), while in the presence of the Na2CO3/NaHCO3 buffer (Figure 11b) the degradation occurred in a lower extend (i.e., 85% conversion after 180 min). This behavior can be due to the Na2CO3/NaHCO3 buffer which acts as a OH scavenger, in a similar way as reported for processes taking place in the presence of the Na2CO3 base [59]. Therefore, MB degradation tests in the presence of the ZnO(C)/CQDs and ZnO(OP)/CQDs semiconductors were subsequently carried out in the absence of the buffer Na2CO3/NaHCO3. The obtained results under UV irradiation are shown in Figure 12.
The promoting effects of the CQDs system may differ according to the utilized irradiation [53]. Under the UV exposure, CQDs act as a reservoir trapping photogenerated electrons from ZnO and promoting the separation of the photogenerated electron-hole pairs. However, the rate of MB decomposition is different as a function of the ZnO/CQDs features (Figure 12). A faster decomposition takes place in the presence of the CQD180-12-based nanocomposites irrespective of the ZnO carrier nature. The conversion of MB reached 98.8% in the presence of ZnO(C)/CQD180-12 in only 30 min (Figure 12a), while, in the presence of the ZnO(OP)/CQD180-12, it decreased to 89.1% even after a longer time (i.e., 180 min) (Figure 12b). The higher photoactivity of the CQD180-12—based samples can be associated to the presence of a higher loading the -COOH acidic groups onto the CQDs surface, making it easier the chemisorption of the basic MB groups. Moreover, the steric hindrance of the CQD180-12 is smaller owing a small size promotion of an effective photon and hydroxyl radicals transfer [38].
As XRD patterns showed (Figure 5b) the ZnO(OP) posses larger particle sizes generated by a higher agglomeration of the smaller ZnO crystallites during the synthesis. ZnO(OP)/CQDs are also characterized by a reduced surface area and pore volume, most probably due to the intercalation and agglomeration of the CQDs between the ZnO layers. Thus, a lower conversion in the MB degradation might be attributed to a decreased active surface.
A mechanism for the UV photocatalytic degradation of dyes, also fitting the results of this work, was not long ago proposed by Zou and co-workers [46]. In accordance with this, the UV irradiation of the ZnO/CQD heterostructure at energies higher or equal to the band-gap of ZnO excites the electrons (e) from the valence band into the conduction band. These move freely to the surface of CQDs layer through a photo-induced charge transfer process, while the holes (h+) leave in the valence band of ZnO (step 1). Then, holes (h+) migrate to the surface and react with H2O or OH- to produce OH radicals (step 3). The photo-generated electrons can further react with the dissolved oxygen on the surface of CQDs generating O2 radicals (step 2) which after protonation generate hydroperoxy HO2 radicals (step 4), producing hydroxyl radical OH and hydrogen peroxide (step 5). Hydrogen peroxide is a supplementary source for the hydroxyl radical OH production (step 6). These species represent strong oxidizing agents able to degrade MB and, finally, to mineralize them towards CO2 and H2O (step 7).
1 .     C Q D @ Z n O + h v e ( C Q D ) + h + ( Z n O ) 2 .     e + O 2 O 2 3 .     h + + O H O H 4 .     O 2 + H 2 O H O 2 + O H 5 .     H O 2 + H 2 O H 2 O 2 + O H 6 .     H 2 O 2 2 O H 7 .     O H + d y e C O 2 + H 2 O
Under visible light irradiation the MB degradation takes place at a lower level by comparison with the UV irradiation, irrespective of the ZnO/CQDs nature (Figure 13).
According to Heng et al. [53], under irradiation with visible light, the CQDs act as a photosensitizer enlarging the absorption range of metal oxide into the visible light region through electronic coupling between π states of CQDs and conduction band of the metal oxide. This corresponds to a transfer of excited electrons from CQDs to the conduction band of the ZnO. The best results in MB degradation were obtained in the presence of ZnO(C)/CQD180-12 sample and are well correlated with the UV-vis absorption measurements results (Figure 10). In the presence of this sample, the MB conversion reached a level of 97.6%, after 180 min, while, in the presence of the pristine ZnO(C) the MB conversion was four times lower (i.e., 25%). The same level of MB conversion (26%) was registered in the presence of the ZnO(OP) sample, while onto ZnO(OP)/CQD180-12 the decomposition of the MB reached a higher level (32%) but much lower compared to the one obtained in the presence of the ZnO(C)/CQD180-12. Once again, the photocatalytic efficiency seems to be governed by the same factors: the CQDs and ZnO features. In the case of the ZnO(OP)/CQD samples, the self-aggregation of CQDs on the ZnO surface reduces fewer sites for activation and absorption of visible light by carbon [60].

3. Methods and Materials

3.1. Synthesis of ZnO/CQDs Nanocomposites

Carbon quantum dots (CQDs) were synthesized following a low temperature hydrothermal (LTH) methodology in which the humins, generated from the decomposition of glucose, were used as raw material. Briefly, 30 mg of humins were dispersed in 30 mL of water. To this suspension, 0.15 mL of glacial CH3COOH were added. Then, the solution was placed in a Teflon-lined stainless-steel autoclave and heated at 160–200 °C for 4–12 h. After the hydrothermal treatment, the aqueous mixture was transferred into a 250 mL separating funnel and 40 mL n-butanol was added. The formed layers were vigorously mixed thoroughly for some time, the aqueous layer, containing CQDs, was separated and further analyzed.
Obtained CQDs were subsequently used for the preparation of the ZnO/CQDs nanocomposites by using two methods as described below.
Hydrothermal approach: In a typical procedure, 0.4 g ZnO was slowly added under stirring to a solution of 20 mL of H2O, 6 mL C2H5OH, and 2 mL solution of CQDs and the mixture was kept at room temperature for 4 h. The resulting suspension was then placed in a Teflon-lined stainless-steel autoclave and kept at a constant temperature of 140 °C for 4 h. After hydrothermal treatment, the ZnO/CQDs product was collected by centrifugation, washed with deionized water several times to remove the impurities and finally dried in air for 12 h at 80 °C. The obtained samples were denoted ZnO(C)/CQD200-4 and ZnO(C)/CQD180-12, were (C) indicates a commercial ZnO.
One-pot hydrothermal approach: The ZnO/CQDs hybrid nanostructures were synthesized by a hydrothermal method at a low temperature [26]. Typically, 0.274 g (125 mM) of Zn(CH3COO)2·2H2O were dissolved in the previously prepared CQDs solution at room temperature. The pH of the solution was adjusted to 10 through dropwise addition of 8 M NaOH aqueous solution and stirring vigorously for 15 min at room temperature. Then, the solution was transferred into a Teflon- beaker and heated at 80 °C for 3 h. The final product was collected by centrifugation, washed with deionized water several times to remove the impurities and finally dried in air for 12 h at 80 °C. The obtained samples were denoted ZnO(OP)/CQD200-4 and ZnO(OP)/CQD180-12 where (OP) indicates the “one-pot” approach.

3.2. Characterization Techniques

ZnO/CQDs materials were characterized by techniques as: adsorption-desorption isotherms of liquid nitrogen at 77K, X-ray diffraction (XRD), IR diffuse reflectance with Fourier transform (DRIFT) and UV-vis spectroscopy.
Textural characteristics (surface area, pore volume and pore diameter) were determined from the adsorption-desorption isotherms of nitrogen at 77 K using a Micromeritics ASAP 2020 Surface Area and Porosity Analyzer.
Powder X-ray Diffraction patterns were collected at room temperature using a Shimadzu XRD-7000 apparatus with the Cu Kα monochromatic radiation of 1.5406 Å, 40 kV, 40 mA at a scanning rate of 1.0 2θ min−1, in the 2θ range of 10–90°.
DRIFT spectra were recorded with a Thermo spectrometer 4700 (400 scans with a resolution of 4 cm−1) in the range of 600–4000 cm−1.
UV-vis spectra were recorded with a SPECORD 250-222P108 in a range of 304–1100 nm with a scan rate of 50 nm per second.

3.3. Methylene Blue Photooxidative Degradation

MB photooxidative degradation tests were performed in a LZC-4b photoreactor (Luzchem Research Inc., Gloucester, ON, Canada) provided with LED lamps (112 W, 445–465 nm) or in a home-made system provided with UV lamps (VilberLorumat, 240 W, 365 nm). Both photoreactors are provided as well as an exhaust/ventilation system. Experiments were conducted in a quartz cylinder. The distance between the lamp and the reaction cylinder was fixed at 20 cm. In each experiment 30 mg of catalyst (3.0 g/L) was added to 10 mL of a MB aqueous solution (30 mg/L; 9.4 × 10⁻⁵ mol/L) at its natural pH of 6.0. Some experiments were also carried out at a constant pH of 9.2 maintained by a Na2CO3/NaHCO3 buffer. The suspension of the photocatalyst and the homogeneity of the reacting mixture were ensured by magnetic stirring. Before switching on the lamp, the suspension was kept in darkness for 30 min and under stirring to reach the thermodynamic equilibrium. During the runs, samples of reacting suspension (500 μL) were withdrawn at 10, 20, 30, 45, 60, 90, 120, 150, and 180 min, filtered through a 0.45 μm hydrophilic membrane (HA, Millipore) and mixed with 2.5 mL of H2O before being analyzed. The spectrum was registered on a SPECORD 250-222P108 in a range from 190 nm to 1100 nm with a scan rate of 10 nm per second, a delta lambda of 1 nm and a split of 4 nm. Cuvettes of quartz were used with a path length of 1 cm.

3.4. Reaction Products Analysis

The concentration of MB after illumination was determined by a UV-Vis spectrometer (SPECORD 250-222P108). The intensity of the main absorption peak (666 nm) of the MB dye was referred to as a measure of the residual MB dye concentration. Control experiments with pristine ZnO were also performed.
For the calibration curve stock solution of 500 mL with a concentration of 30 mg/L was prepared (15 mg MB dissolved in distilled water in a volumetric flask). The stock solution was used to prepare other five different MB concentrations as: 5, 10, 15, 20, and 25 mg/L. For each concentration, the UV-vis spectra was registered (Figure 14a) and the corresponding absorbance value for the 665 nm band was used to build the calibration curve (Figure 14b). The calibration curve presents a linear relation and the relationship coefficient was 0.9990 (Figure 14b).
The MB conversion was defined as follows:
C o n v e r s i o n ( % ) = C 0 C C 0 × 100
where: C0 is the initial concentration of MB and C is the concentration of the MB at a certain reaction time, respectively.

4. Conclusions

In summary, ZnO/CQDs were synthesized by two methods, namely a hydrothermal approach, in which CQDs were deposited onto the surface of commercial ZnO, and a one-pot hydrothermal approach, in which CQDs were added during the synthesis of the ZnO from a zinc acetate precursor. For the first time, the CQDs used for the production of these nanocomposites were obtained from worthless humins by-product by an environmentally friendly low-temperature hydrothermal (LTH) process. ZnO display a wurtzite (hexagonal phase) structure and adding it to CQDs generates hierarchical heterophases formed by ZnO and CQDs. The characterization techniques indicate a series of differences between these materials in terms of surface area, particle size, dispersion, and location of the CQDs. For ZnO(C)/CQD the CQDs are preponderantly docked on the external surface of the ZnO, with a high dispersion, while for ZnO(OP)/CQDs the agglomerated CQDs are preponderantly stacked between the ZnO layers, generating a sandwich-like structure.
Under UV irradiation the CQDs act as electron reservoirs that resist the recombination of electron-hole pairs. However, an increased photocatalytic activity of ZnO/CQDs can be induced by the presence of small sized CQDs (i.e., CQD180-12). The larger size of CQDs (i.e., CQD200-4) caused decreased photocatalytic performance of ZnO.
As these results shows, the presence of CQDs on the surface of ZnO can also promote a large spectrum of absorption, from UV into visible one, and the excellent photocatalytic activity of the ZnO(C)/CQD180-12 nanocomposite under Vis light irradiation could be attributed to visible light sensitization of ZnO.
Among the investigated catalysts ZnO(C)/CQD180-12 was able to degrade MB at a conversion of 99.3% under UV irradiation for 30 min and over 97.6% under Vis light irradiation for 180 min.

Author Contributions

Conceptualization, S.M.C.; methodology, E.E.T. and G.S.; validation, B.C.; formal analysis, E.E.T., G.S. and B.C.; investigation, E.E.T., G.S. and B.C.; writing—original draft preparation, S.M.C.; writing review and editing, S.M.C. and V.I.P.; visualization, S.M.C. and V.I.P.; supervision, S.M.C.; funding acquisition, B.C. All authors have read and agreed to the published version of the manuscript.

Funding

This study was funded by the Government of Romania, Ministry of Research and Innovation, project PNIII-P4-ID-PCE2020-2207 nr. 235/2021.

Conflicts of Interest

The authors declare no conflict of interest.

References

  1. Hoffmann, M.R.; Martin, S.T.; Choi, W.; Bahnemann, D.W. Environmental Applications of Semiconductor Photocatalysis. Chem. Rev. 1995, 95, 69–96. [Google Scholar]
  2. Yang, X.; Wang, D. Photocatalysis: From Fundamental Principles to Materials and Applications. ACS Appl. Energy Mater. 2018, 1, 6657–6693. [Google Scholar]
  3. Djurišić, A.B.; Chen, X.; Leung, Y.H.; Ng, A.M.C. ZnO Nanostructures: Growth, Properties and Applications. J. Mater. Chem. 2012, 22, 6526–6535. [Google Scholar]
  4. Kumar, S.G.; Rao, K.S.R.K. Zinc Oxide Based Photocatalysis: Tailoring Surface-Bulk Structure and Related Interfacial Charge Carrier Dynamics for Better Environmental Applications. RSC Adv. 2015, 5, 3306–3351. [Google Scholar]
  5. Li, D.; Li, D.K.; Wu, H.Z.; Liang, F.; Xie, W.; Zou, C.W.; Shao, L.X. Defects Related Room Temperature Ferromagnetism in Cu-Implanted ZnO Nanorod Arrays. J. Alloys Compd. 2014, 591, 80–84. [Google Scholar]
  6. Gupta, M.K.; Lee, J.H.; Lee, K.Y.; Kim, S.W. Two-Dimensional Vanadium-Doped ZnO Nanosheet-Based Flexible Direct Current Nanogenerator. ACS Nano 2013, 7, 8932–8939. [Google Scholar]
  7. Liu, X.; Hu, M.; Chu, X.; Yan, Q. Synthesis and Field Emission Properties of Highly Ordered Ti-Doped ZnO Nanoarray Structure. J. Mater. Sci. Mater. Electron. 2013, 24, 2839–2845. [Google Scholar]
  8. Qi, L.; Li, H.; Dong, L. Simple Synthesis of Flower-like ZnO by a Dextran Assisted Solution Route and Their Photocatalytic Degradation Property. Mater. Lett. 2013, 107, 354–356. [Google Scholar]
  9. Xiang, Q.; Yu, J.; Jaroniec, M. Graphene-Based Semiconductor Photocatalysts. Chem. Soc. Rev. 2012, 41, 782–796. [Google Scholar]
  10. Rauwel, E.; Galeckas, A.; Rauwel, P.; Sunding, M.F.; Fjellvaåg, H. Precursor-Dependent Blue-Green Photoluminescence Emission of ZnO Nanoparticles. J. Phys. Chem. C 2011, 115, 25227–25233. [Google Scholar]
  11. Wang, Z.L. Splendid One-Dimensional Nanostructures of Zinc Oxide: A New Nanomaterial Family for Nanotechnology. ACS Nano 2008, 2, 1987–1992. [Google Scholar]
  12. Polyakov, A.Y.; Nesterov, A.V.; Goldt, A.E.; Zubyuk, V.; Dolgova, T.; Yadgarov, L.; Visic, B.; Fedyanin, A.A.; Tenne, R.; Goodilin, E.A. Optical Properties of Multilayer Films of Nanocomposites Based on WS 2 Nanotubes Decorated with Gold Nanoparticles. J. Phys. Conf. Ser. 2015, 643, 012046. [Google Scholar]
  13. Donkova, B.; Vasileva, P.; Nihtianova, D.; Velichkova, N.; Stefanov, P.; Mehandjiev, D. Synthesis, Characterization, and Catalytic Application of Au/ZnO Nanocomposites Prepared by Coprecipitation. J. Mater. Sci. 2011, 46, 7134–7143. [Google Scholar]
  14. Kurtz, M.; Strunk, J.; Hinrichsen, O.; Muhler, M.; Fink, K.; Meyer, B.; Wöll, C. Active Sites on Oxide Surfaces: ZnO-Catalyzed Synthesis of Methanol from CO and H2. Angew. Chem. Int. Ed. 2005, 44, 2790–2794. [Google Scholar]
  15. Yuan, J.; Choo, E.S.G.; Tang, X.; Sheng, Y.; Ding, J.; Xue, J. Synthesis of ZnO–Pt Nanoflowers and Their Photocatalytic Applications. Nanotechnology 2010, 21, 185606. [Google Scholar]
  16. Wang, Y.; Hu, A. Carbon Quantum Dots: Synthesis, Properties and Applications. J. Mater. Chem. C 2014, 2, 6921–6939. [Google Scholar]
  17. Pan, M.; Xie, X.; Liu, K.; Yang, J.; Hong, L.; Wang, S. Fluorescent Carbon Quantum Dots-Synthesis, Functionalization and Sensing Application in Food Analysis. Nanomaterials 2020, 10, 930. [Google Scholar]
  18. Zhang, Z.; Zheng, T.; Li, X.; Xu, J.; Zeng, H. Progress of Carbon Quantum Dots in Photocatalysis Applications. Part. Part. Syst. Charact. 2016, 33, 457–472. [Google Scholar]
  19. Molaei, M.J. A Review on Nanostructured Carbon Quantum Dots and Their Applications in Biotechnology, Sensors, and Chemiluminescence. Talanta 2019, 196, 456–478. [Google Scholar]
  20. Luo, P.G.; Yang, F.; Yang, S.T.; Sonkar, S.K.; Yang, L.; Broglie, J.J.U.; Liu, Y.; Sun, Y.P. Carbon-Based Quantum Dots for Fluorescence Imaging of Cells and Tissues. RSC Adv. 2014, 4, 10791–10807. [Google Scholar]
  21. Singh, I.; Arora, R.; Dhiman, H.; Pahwa, R. Carbon Quantum Dots: Synthesis, Characterization and Biomedical Applications. Turkish J. Pharm. Sci. 2018, 15, 219–230. [Google Scholar]
  22. Sumanth Kumar, D.; Jai Kumar, B.; Mahesh, H.M. Quantum Nanostructures (QDs): An Overview. In Synthesis of Inorganic Nanomaterials; Elsevier: Amsterdam, The Netherlands, 2018; pp. 59–88. [Google Scholar]
  23. Muthulingam, S.; Lee, I.H.; Uthirakumar, P. Highly Efficient Degradation of Dyes by Carbon Quantum Dots/N-Doped Zinc Oxide (CQD/N-ZnO) Photocatalyst and Its Compatibility on Three Different Commercial Dyes under Daylight. J. Colloid Interface Sci. 2015, 455, 101–109. [Google Scholar]
  24. Yu, H.; Zhao, Y.; Zhou, C.; Shang, L.; Peng, Y.; Cao, Y.; Wu, L.Z.; Tung, C.H.; Zhang, T. Carbon Quantum Dots/TiO2 Composites for Efficient Photocatalytic Hydrogen Evolution. J. Mater. Chem. A 2014, 2, 3344–3351. [Google Scholar]
  25. Al Ja’farawy, M.S.; Kusumandari; Purwanto, A.; Widiyandari, H. Carbon Quantum Dots Supported Zinc Oxide (ZnO/CQDs) Efficient Photocatalyst for Organic Pollutant Degradation—A Systematic Review. Environ. Nanotechnol. Monit. Manag. 2022, 18, 100681. [Google Scholar]
  26. Bozetine, H.; Wang, Q.; Barras, A.; Li, M.; Hadjersi, T.; Szunerits, S.; Boukherroub, R. Green Chemistry Approach for the Synthesis of ZnO-Carbon Dots Nanocomposites with Good Photocatalytic Properties under Visible Light. J. Colloid Interface Sci. 2016, 465, 286–294. [Google Scholar]
  27. Yu, H.; Zhang, H.; Huang, H.; Liu, Y.; Li, H.; Ming, H.; Kang, Z. ZnO/Carbon Quantum Dots Nanocomposites: One-Step Fabrication and Superior Photocatalytic Ability for Toxic Gas Degradation under Visible Light at Room Temperature. New J. Chem. 2012, 36, 1031–1035. [Google Scholar]
  28. Zhang, X.; Pan, J.; Zhu, C.; Sheng, Y.; Yan, Z.; Wang, Y.; Feng, B. The Visible Light Catalytic Properties of Carbon Quantum Dots/ZnO Nanoflowers Composites. J. Mater. Sci. Mater. Electron. 2015, 26, 2861–2866. [Google Scholar]
  29. Zhang, X.-Y.; Liu, J.-K.; Wang, J.-D.; Yang, X.-H. Mass Production, Enhanced Visible Light Photocatalytic Efficiency, and Application of Modified ZnO Nanocrystals by Carbon Dots. Ind. Eng. Chem. Res. 2015, 54, 1766–1772. [Google Scholar]
  30. Han, C.; Yang, M.-Q.; Weng, B.; Xu, Y.-J. Improving the Photocatalytic Activity and Anti-Photocorrosion of Semiconductor ZnO by Coupling with Versatile Carbon. Phys. Chem. Chem. Phys. 2014, 16, 16891–16903. [Google Scholar]
  31. Liu, H.; Ye, T.; Mao, C. Fluorescent Carbon Nanoparticles Derived from Candle Soot. Angew. Chem. Int. Ed. 2007, 46, 6473–6475. [Google Scholar]
  32. Dekaliuk, M.O.; Viagin, O.; Malyukin, Y.V.; Demchenko, A.P. Fluorescent Carbon Nanomaterials: “Quantum Dots” or Nanoclusters? Phys. Chem. Chem. Phys. 2014, 16, 16075–16084. [Google Scholar]
  33. Li, H.; He, X.; Kang, Z.; Huang, H.; Liu, Y.; Liu, J.; Lian, S.; Tsang, C.H.A.; Yang, X.; Lee, S.T. Water-Soluble Fluorescent Carbon Quantum Dots and Photocatalyst Design. Angew. Chem. Int. Ed. 2010, 49, 4430–4434. [Google Scholar]
  34. Chen, X.; Zhang, W.; Wang, Q.; Fan, J. C8-Structured Carbon Quantum Dots: Synthesis, Blue and Green Double Luminescence, and Origins of Surface Defects. Carbon N. Y. 2014, 79, 165–173. [Google Scholar]
  35. Liu, Y.; Zhou, L.; Li, Y.; Deng, R.; Zhang, H. Highly fluorescent nitrogen-doped carbon dots with excellent thermal and photo stability applied as invisible ink for loading important information and anti-counterfeiting. Nanoscale 2017, 9, 491–496. [Google Scholar]
  36. Dong, Y.; Shao, J.; Chen, C.; Li, H.; Wang, R.; Chi, Y.; Lin, X.; Chen, G. Blue Luminescent Graphene Quantum Dots and Graphene Oxide Prepared by Tuning the Carbonization Degree of Citric Acid. Carbon N. Y. 2012, 50, 4738–4743. [Google Scholar]
  37. Yuan, F.; Yuan, T.; Sui, L.; Wang, Z.; Xi, Z.; Li, Y.; Li, X.; Fan, L.; Tan, Z.; Chen, A.; et al. Engineering Triangular Carbon Quantum Dots with Unprecedented Narrow Bandwidth Emission for Multicolored LEDs. Nat. Commun. 2018, 9, 2249–2260. [Google Scholar]
  38. Wu, P.; Wu, X.; Li, W.; Liu, Y.; Chen, Z.; Liu, S. Ultra-Small Amorphous Carbon Dots: Preparation, Photoluminescence Properties, and Their Application as TiO2 Photosensitizers. J. Mater. Sci. 2019, 54, 5280–5293. [Google Scholar]
  39. Liu, H.; Zhao, X.; Wang, F.; Wang, Y.; Guo, L.; Mei, J.; Tian, C.; Yang, X.; Zhao, D. High-Efficient Excitation-Independent Blue Luminescent Carbon Dots. Nanoscale Res. Lett. 2017, 12, 399–405. [Google Scholar]
  40. Song, Y.; Zhu, S.; Xiang, S.; Zhao, X.; Zhang, J.; Zhang, H.; Fu, Y.; Yang, B. Investigation into the Fluorescence Quenching Behaviors and Applications of Carbon Dots. Nanoscale 2014, 6, 4676–4683. [Google Scholar]
  41. Zhu, S.; Song, Y.; Zhao, X.; Shao, J.; Zhang, J.; Yang, B. The Photoluminescence Mechanism in Carbon Dots (Graphene Quantum Dots, Carbon Nanodots, and Polymer Dots): Current State and Future Perspective. Nano Res. 2015, 8, 355–381. [Google Scholar]
  42. Dulub, O.; Boatner, L.A.; Diebold, U. STM Study of the Geometric and Electronic Structure of ZnO(0 0 0 1)-Zn, (0 0 0 1̄)-O, (1 0 1̄ 0), and (1 1 2̄ 0) Surfaces. Surf. Sci. 2002, 519, 201–217. [Google Scholar]
  43. Zhang, Q. Effects of Calcination on the Photocatalytic Properties of Nanosized TiO2 Powders Prepared by TiCl4 Hydrolysis. Appl. Catal. B Environ. 2000, 26, 207–215. [Google Scholar]
  44. Fu, D.; Han, G.; Chang, Y.; Dong, J. The Synthesis and Properties of ZnO-Graphene Nano Hybrid for Photodegradation of Organic Pollutant in Water. Mater. Chem. Phys. 2012, 132, 673–681. [Google Scholar]
  45. Song, S.; Wu, K.; Wu, H.; Guo, J.; Zhang, L. Multi-shelled ZnO decorated with nitrogen and phosphorus co-doped carbon quantum dots: Synthesis and enhanced photodegradation activity of methylene blue in aqueous solutions. RSC Adv. 2019, 9, 7362–7374. [Google Scholar]
  46. Li, Y.; Zhang, B.P.; Zhao, J.X.; Ge, Z.H.; Zhao, X.K.; Zou, L. ZnO/Carbon Quantum Dots Heterostructure with Enhanced Photocatalytic Properties. Appl. Surf. Sci. 2013, 279, 367–373. [Google Scholar]
  47. Pandiyarajan, T.; Karthikeyan, B. Cr Doping Induced Structural, Phonon and Excitonic Properties of ZnO Nanoparticles. J. Nanoparticle Res. 2012, 14, 647. [Google Scholar]
  48. Chung, F.H. Quantitative Interpretation of X-Ray Diffraction Patterns of Mixtures. I. Matrix-Flushing Method for Quantitative Multicomponent Analysis. J. Appl. Crystallogr. 1974, 7, 519–525. [Google Scholar]
  49. Sali, S.; Boumaour, M.; Kechouane, M.; Kermadi, S.; Aitamar, F. Nanocrystalline ZnO Film Deposited by Ultrasonic Spray on Textured Silicon Substrate as an Anti-Reflection Coating Layer. Phys. B Condens. Matter 2012, 407, 2626–2631. [Google Scholar]
  50. Li, Y.; Zhao, Y.; Cheng, H.; Hu, Y.; Shi, G.; Dai, L.; Qu, L. Nitrogen-Doped Graphene Quantum Dots with Oxygen-Rich Functional Groups. J. Am. Chem. Soc. 2012, 134, 15–18. [Google Scholar]
  51. Xu, T.; Zhang, L.; Cheng, H.; Zhu, Y. Significantly Enhanced Photocatalytic Performance of ZnO via Graphene Hybridization and the Mechanism Study. Appl. Catal. B Environ. 2011, 101, 382–387. [Google Scholar]
  52. Van Zandvoort, I.; Wang, Y.; Rasrendra, C.B.; Van Eck, E.R.H.; Bruijnincx, P.C.A.; Heeres, H.J.; Weckhuysen, B.M. Formation, Molecular Structure, and Morphology of Humins in Biomass Conversion: Influence of Feedstock and Processing Conditions. ChemSusChem 2013, 6, 1745–1758. [Google Scholar]
  53. Heng, Z.W.; Chong, W.C.; Pang, Y.L.; Koo, C.H. An Overview of the Recent Advances of Carbon Quantum Dots/Metal Oxides in the Application of Heterogeneous Photocatalysis in Photodegradation of Pollutants towards Visible-Light and Solar Energy Exploitation. J. Environ. Chem. Eng. 2021, 9, 105199. [Google Scholar]
  54. Moalem-Banhangi, M.; Ghaeni, N.; Ghasemi, S. Saffron derived carbon quantum dot/N-doped ZnO/fulvic acid nanocomposite for sonocatalytic degradation of methylene blue. Synth. Met. 2021, 271, 116626. [Google Scholar]
  55. Velumani, A.; Sengodan, P.; Arumugam, P.; Rajendran, R.; Santhanam, S.; Palanisamy, M. Carbon quantum dots supported ZnO sphere based photocatalyst for dye degradation application. Curr. Appl. Phys. 2020, 20, 1176–1184. [Google Scholar]
  56. Soga, T. Nanostructured Materials for Solar Energy Conversion; Elsevier: Oxford, UK, 2006. [Google Scholar]
  57. Zhang, T.; Oyama, T.; Aoshima, A.; Hidaka, H.; Zhao, J.; Serpone, N. Photooxidative N-Demethylation of Methylene Blue in Aqueous TiO2 Dispersions under UV Irradiation. J. Photochem. Photobiol. A Chem. 2001, 140, 163–172. [Google Scholar]
  58. Houas, A.; Lachheb, H.; Ksibi, M.; Elaloui, E.; Guillard, C.; Herrmann, J.M. Photocatalytic Degradation Pathway of Methylene Blue in Water. Appl. Catal. B Environ. 2001, 31, 145–157. [Google Scholar]
  59. Zhou, B.; Song, J.; Zhang, Z.; Jiang, Z.; Zhang, P.; Han, B. Highly Selective Photocatalytic Oxidation of Biomass-Derived Chemicals to Carboxyl Compounds over Au/TiO2. Green Chem. 2017, 19, 1075–1081. [Google Scholar]
  60. Behnood, R.; Sodeifian, G. Synthesis of N Doped-CQDs/Ni Doped-ZnO Nanocomposites for Visible Light Photodegradation of Organic Pollutants. J. Environ. Chem. Eng. 2020, 8, 103821. [Google Scholar]
Figure 1. (a) Emission spectra (λex = 310 nm) of the synthesized CQDs at 200 °C and 4 h and at 180 °C and 12 h; (b) emission spectra (λex = 310 nm) of the synthesized CQDs at 180 °C as a function of the reaction time.
Catalysts 12 00952 g001
Figure 2. ATR-FTIR spectra in the 1000–4000 cm−1 range of the CQDs synthesized at 200 °C and 4 h and at 180 °C and 12 h.
Catalysts 12 00952 g002
Figure 3. (a) The UV-vis absorption spectra for CQD180-4 (blue), CQD180-12 (green) and CQD200-4 (red) samples; (b) the XRD pattern of humins (A), CQD200-4 (B) and CQD180-12 (C).
Catalysts 12 00952 g003
Figure 4. (a) PL spectra of the CQD200-4 aqueous solution excited in a range of λex = 250–450 nm; (b) the maximum of the wavelength PL emission (λmax) as a function of the excitation wavelength (λex).
Catalysts 12 00952 g004
Figure 5. (a) The XRD patterns of the ZnO(C)/CQD nanocomposites; (b) the XRD patterns of the ZnO(OP)/CQD nanocomposites.
Catalysts 12 00952 g005
Figure 6. XRD patterns of on 2θ = 30–38° of ZnO(OP)/CQD samples.
Catalysts 12 00952 g006
Figure 7. Nitrogen adsorption-desorption isotherms of the ZnO(C)/CQDs (a) and the ZnO(OP)/CQDs (b) samples.
Catalysts 12 00952 g007
Figure 8. DRIFT spectra of (a) ZnO(C)/CQDs and (b) ZnO(OP)/CQDs samples.
Catalysts 12 00952 g008
Figure 9. Schematically representation of the esterification reaction between the carboxyl groups from CQDs and the hydroxyls groups from ZnO.
Catalysts 12 00952 g009
Figure 10. UV-Vis diffuse reflectance spectra of ZnO(C)/CQDs samples.
Catalysts 12 00952 g010
Figure 11. UV–Vis spectra collected during the MB degradation versus reaction time on the ZnO(C) catalyst, under UV irradiation and (a) in the absence of the Na2CO3/NaHCO3 buffer and (b) in the presence of the Na2CO3/NaHCO3 buffer.
Catalysts 12 00952 g011
Figure 12. The degradation of MB (665 nm band) in time in the presence of (a) ZnO(C)/CQD and (b) ZnO(OP)/CQD under UV irradiation.
Catalysts 12 00952 g012
Figure 13. The degradation of MB (665 nm band) in time in the presence of (a) ZnO(C)/CQD and (b) ZnO(OP)/CQD under Vis light irradiation.
Catalysts 12 00952 g013
Figure 14. (a) UV-vis spectra of MB at different concentrations; (b) the calibration curve.
Catalysts 12 00952 g014
Table 1. The crystallite size of the ZnO/CQD nanocomposites.
Sampleβ, Degree(101) Plane, 2θθ, DegreeCrystallite Size, nm
ZnO(C)0.259936.215818.107933.61
ZnO(C)/CQD180-120.249036.263718.131835.09
ZnO(C)/CQD200-40.246936.232218.116135.39
ZnO(OP)/CQD180-120.305336.126518.063228.61
ZnO(OP)/CQD200-40.313936.132718.066327.83
Table 2. The lattice parameters (a–c) and the inter-planer d-spacing of the ZnO/CQD samples.
Sample2θ, DegreeLattice Parameters, Åc/ad-Spacing, BRAGG
ca = b
ZnO(C)36.21585.21573.25611.60182.4803
ZnO(C)/CQD180-1236.26375.21403.25331.60272.4771
ZnO(C)/CQD200-436.23225.21403.25471.60202.4795
ZnO(OP)/CQD180-1236.12655.22463.26781.59882.4867
ZnO(OP)/CQD200-436.13275.22463.27131.59712.4859
JCPDS 36-145136.21505.21503.25601.6016-
Table 3. BET analysis surface area and porosity of ZnO/CQD samples.
SampleBET (m2/g)Vp (cm3/g)Average Dp (nm)dBET (nm)
ZnO(C)120.03326.589.1
ZnO(C)/CQD200-4150.13652.071.3
ZnO(C)/CQD180-12180.06225.859.4
ZnO(OP)/CQD200-470.03825.7152.8
ZnO(OP)/CQD180-12110.04537.297.2
Publisher’s Note: MDPI stays neutral with regard to jurisdictional claims in published maps and institutional affiliations.

