Article

Modification of Graphite Sheet Anode with Iron (II, III) Oxide-Carbon Dots for Enhancing the Performance of Microbial Fuel Cell

1
Department of Physics, Sharda School of Basic Sciences and Research, Sharda University, Greater Noida 201310, India
2
Biopositive Lab, Department of Life Sciences, Sharda School of Basic Sciences and Research, Sharda University, Greater Noida 201310, India
3
Ministry of Environment, Forest and Climate Change, Indira Paryavaran Bhawan, Jor Bagh, New Delhi 110003, India
4
Department of Bio-Technology, Koneru Lakshmaiah Education Foundation, Vaddeswaram 522302, India
5
Department of Biotechnology, Graphic Era Deemed to be University, Dehradun, Uttarakhand 248002, India
6
Special Centre for Nanoscience, Jawaharlal Nehru University, New Delhi 110067, India
*
Authors to whom correspondence should be addressed.
These authors contributed equally to this work.
Catalysts 2022, 12(9), 1040; https://doi.org/10.3390/catal12091040
Submission received: 12 August 2022 / Revised: 5 September 2022 / Accepted: 6 September 2022 / Published: 13 September 2022
(This article belongs to the Special Issue Recent Advances on Nano-Catalysts for Biological Processes)

Abstract

:
The present study explores the use of carbon dots coated with Iron (II, III) oxide (Fe3O4) for its application as an anode in microbial fuel cells (MFC). Fe3O4@PSA-C was synthesized using a hydrothermal-assisted probe sonication method. Nanoparticles were characterized with XRD, SEM, FTIR, and RAMAN Spectroscopy. Different concentrations of Fe3O4- carbon dots (0.25, 0.5, 0.75, and 1 mg/cm2) were coated onto the graphite sheets (Fe3O4@PSA-C), and their performance in MFC was evaluated. Cyclic voltammetry (CV) of Fe3O4@PSA-C (1 mg/cm2) modified anode indicated oxidation peaks at −0.26 mV and +0.16 mV, respectively, with peak currents of 7.7 mA and 8.1 mA. The fluxes of these anodes were much higher than those of other low-concentration Fe3O4@PSA-C modified anodes and the bare graphite sheet anode. The maximum power density (Pmax) was observed in MFC with a 1 mg/cm2 concentration of Fe3O4@PSA-C was 440.01 mW/m2, 1.54 times higher than MFCs using bare graphite sheet anode (285.01 mW/m2). The elevated interaction area of carbon dots permits pervasive Fe3O4 crystallization providing enhanced cell attachment capability of the anode, boosting the biocompatibility of Fe3O4@PSA-C. This significantly improved the performance of the MFC, making Fe3O4@PSA-C modified graphite sheets a good choice as an anode for its application in MFC.

Graphical Abstract

1. Introduction

Bioelectricity generated by electrochemically active bacteria (EAB) has gained much attention, with promising significance for renewable energy generation, wastewater remediation, and metallic nanoparticle fabrication [1,2]. In such fuel cells, waste disposal can be converted to electricity with the aid of EAB that colonizes on the anode surface. On the surface of the anode, biodegradable waste is oxidized and generates electrons, protons, and other by-products, protons pass through the cation exchange membrane from anode to cathode, and electrons via an outer circuit, electrons, and protons combined with oxygen at the cathode to complete the reaction [3]. Anode plays a major role in determining the power output of the MFC [4]. However, sluggish EAB biofilm growth impedes the development of the anode half-cell potential and causes voltage loss; consequently, the MFC productivity has not achieved its full potential, resulting in decreased power output [5]. MFC power interruptions occur due to undesirable physicochemical conditions for bacterial consortiums and system architecture [6,7]. The anode composition has the largest impact on energy output in MFCs because it combines microbiology and electrochemistry. The anode’s conductance and biocatalytic efficiency must be improved to reduce potential losses. In MFCs, graphite disc anodes are treated with Au and Pd nanoparticles, for example, outperformed untreated anodes in biocompatibility and power generation [8]. As a result, changing the anode makeup might be a good technique for dealing with overpotential problems [9]. Anode remodeling alters the physical and chemical characteristics of the anode, allowing for improved microbial adhesion by increasing the electrochemically specific surface area and enhancing electron transport due to the increased permeability of the anode [10].
Interesting and informative research has been conducted in order to bring about positive changes in MFC anodes [11]. For example, a carbon cloth anode treated with formic acid boosted the ideal power density of a single-chambered MFC by 38.1 percent (from 611.56 mW/m2 to 877.935 mW/m2) [12]. Likewise, electrolysis of the carbon fiber anode in nitric acid followed by rinsing in aqueous ammonia gave a noteworthy power density of 3.20 ± 0.05 W/m2 for two-chambered MFCs [13]. Chaetoceros phytoplankton and lauric acid were used as methanotrophic inhibitors in MFCs implanted with mixed fermented sludge in the anodic compartment [14]. Rajesh et al. found 45.18% and 11.6% optimum coulombic efficiency, respectively [15]. Spontaneous elimination of AQS diazonium cations generated in situ immobilized an electron transfer accelerator, anthraquinone-2-sulfonic acid (AQS), onto the surface of a graphite sheet anode [16]. They used AQS in MFC, which showed a maximum power density increasing from 967 ± 33 mW/m2 to 1872 ± 42 mW/m2.
Entities including neutral red [17] and lignin [18] have also been used to improve the bio-catalytic effectiveness of the anode in MFCs. Anode characteristics like transmittance and the percentage surface area available for bacterial attachment are crucial, and both can be improved using graphene to improve electronic conductivity. A family of adaptable nanomaterials called carbon quantum dots (C-dots) has not yet been described in MFCs. Prior attempts at creating C-dots from coconut shell were said to include surface functional groups for hydroxyl and carboxyl. The C-dots’ capacity to absorb and transport electrons was made possible by the existence of these ligands on a composite. C-dots were added as a suspension to the anode compartment of an MFC, which increased maximum power density by 22.5 percent. Compared to methylene blue, a common electron shuttle used in MFCs, C-dots demonstrated superior efficiency as electron shuttles [19]. Most of the EABs are metal reducing in natural condition. One of the primary limiting phases of MFC performance that requires attention is the sluggish exocellular electron transfer (EET) process in the anode. Most of the time, EET is improved by employing a modified anode. Anodes in MFCs are often made of biocompatible conductive carbon paper/cloth, graphite, and stainless steel. These materials, however, lack electrochemical activity for anode microbial processes. As a result, it is critical to create appropriate anode materials for efficient bacterial adhesion and electron collecting capabilities for better EET. The electron transfer efficiency of the outermost cytochromes (Omcs) [Omc C and Omc A] may be increased in the presence of redox-active biocompatible metal oxides and/or hydroxides. However, there have been relatively few reports on the C-dots metal oxides modified anode in MFC to date. As a result, the incorporation of C-dots and Iron oxide might address the shortcomings of the electrode materials, i.e., non-capacitive anode.
In the present research work, Fe3O4@PSA-C (0.25 mg/cm2, 0.5 mg/cm2, 0.75 mg/cm2, and 1 mg/cm2) were used to change graphite sheet anodes. Fe3O4@PSA-C assigned for Iron oxide @ sodium poly-acrylate-Carbon dot where Iron oxide (Fe3O4) is synthesized with sono- chemical method in presence of sodium poly-acrylate and after chemical sonication process with C-dots, finally we got Fe3O4@PSA-C-dots nanocomposite. The performance of MFCs using these anodes was compared to that of MFCs using a raw graphite sheet as an anode. Higher amount of Fe3O4@PSA-C like 1.25 mg/cm2 was showing minute increase/ no increase in power density as compared to 1 mg/cm2 which can be neglected hence the amount of Fe3O4@PSA-C was taken till the highest power density observed. This study aimed to examine if changing the anode to Fe3O4@PSA-C may enhance MFC power density (PD) at a fair cost to create a replacement anode composition that could improve MFC performance.

2. Results and Discussion

2.1. Structural Properties

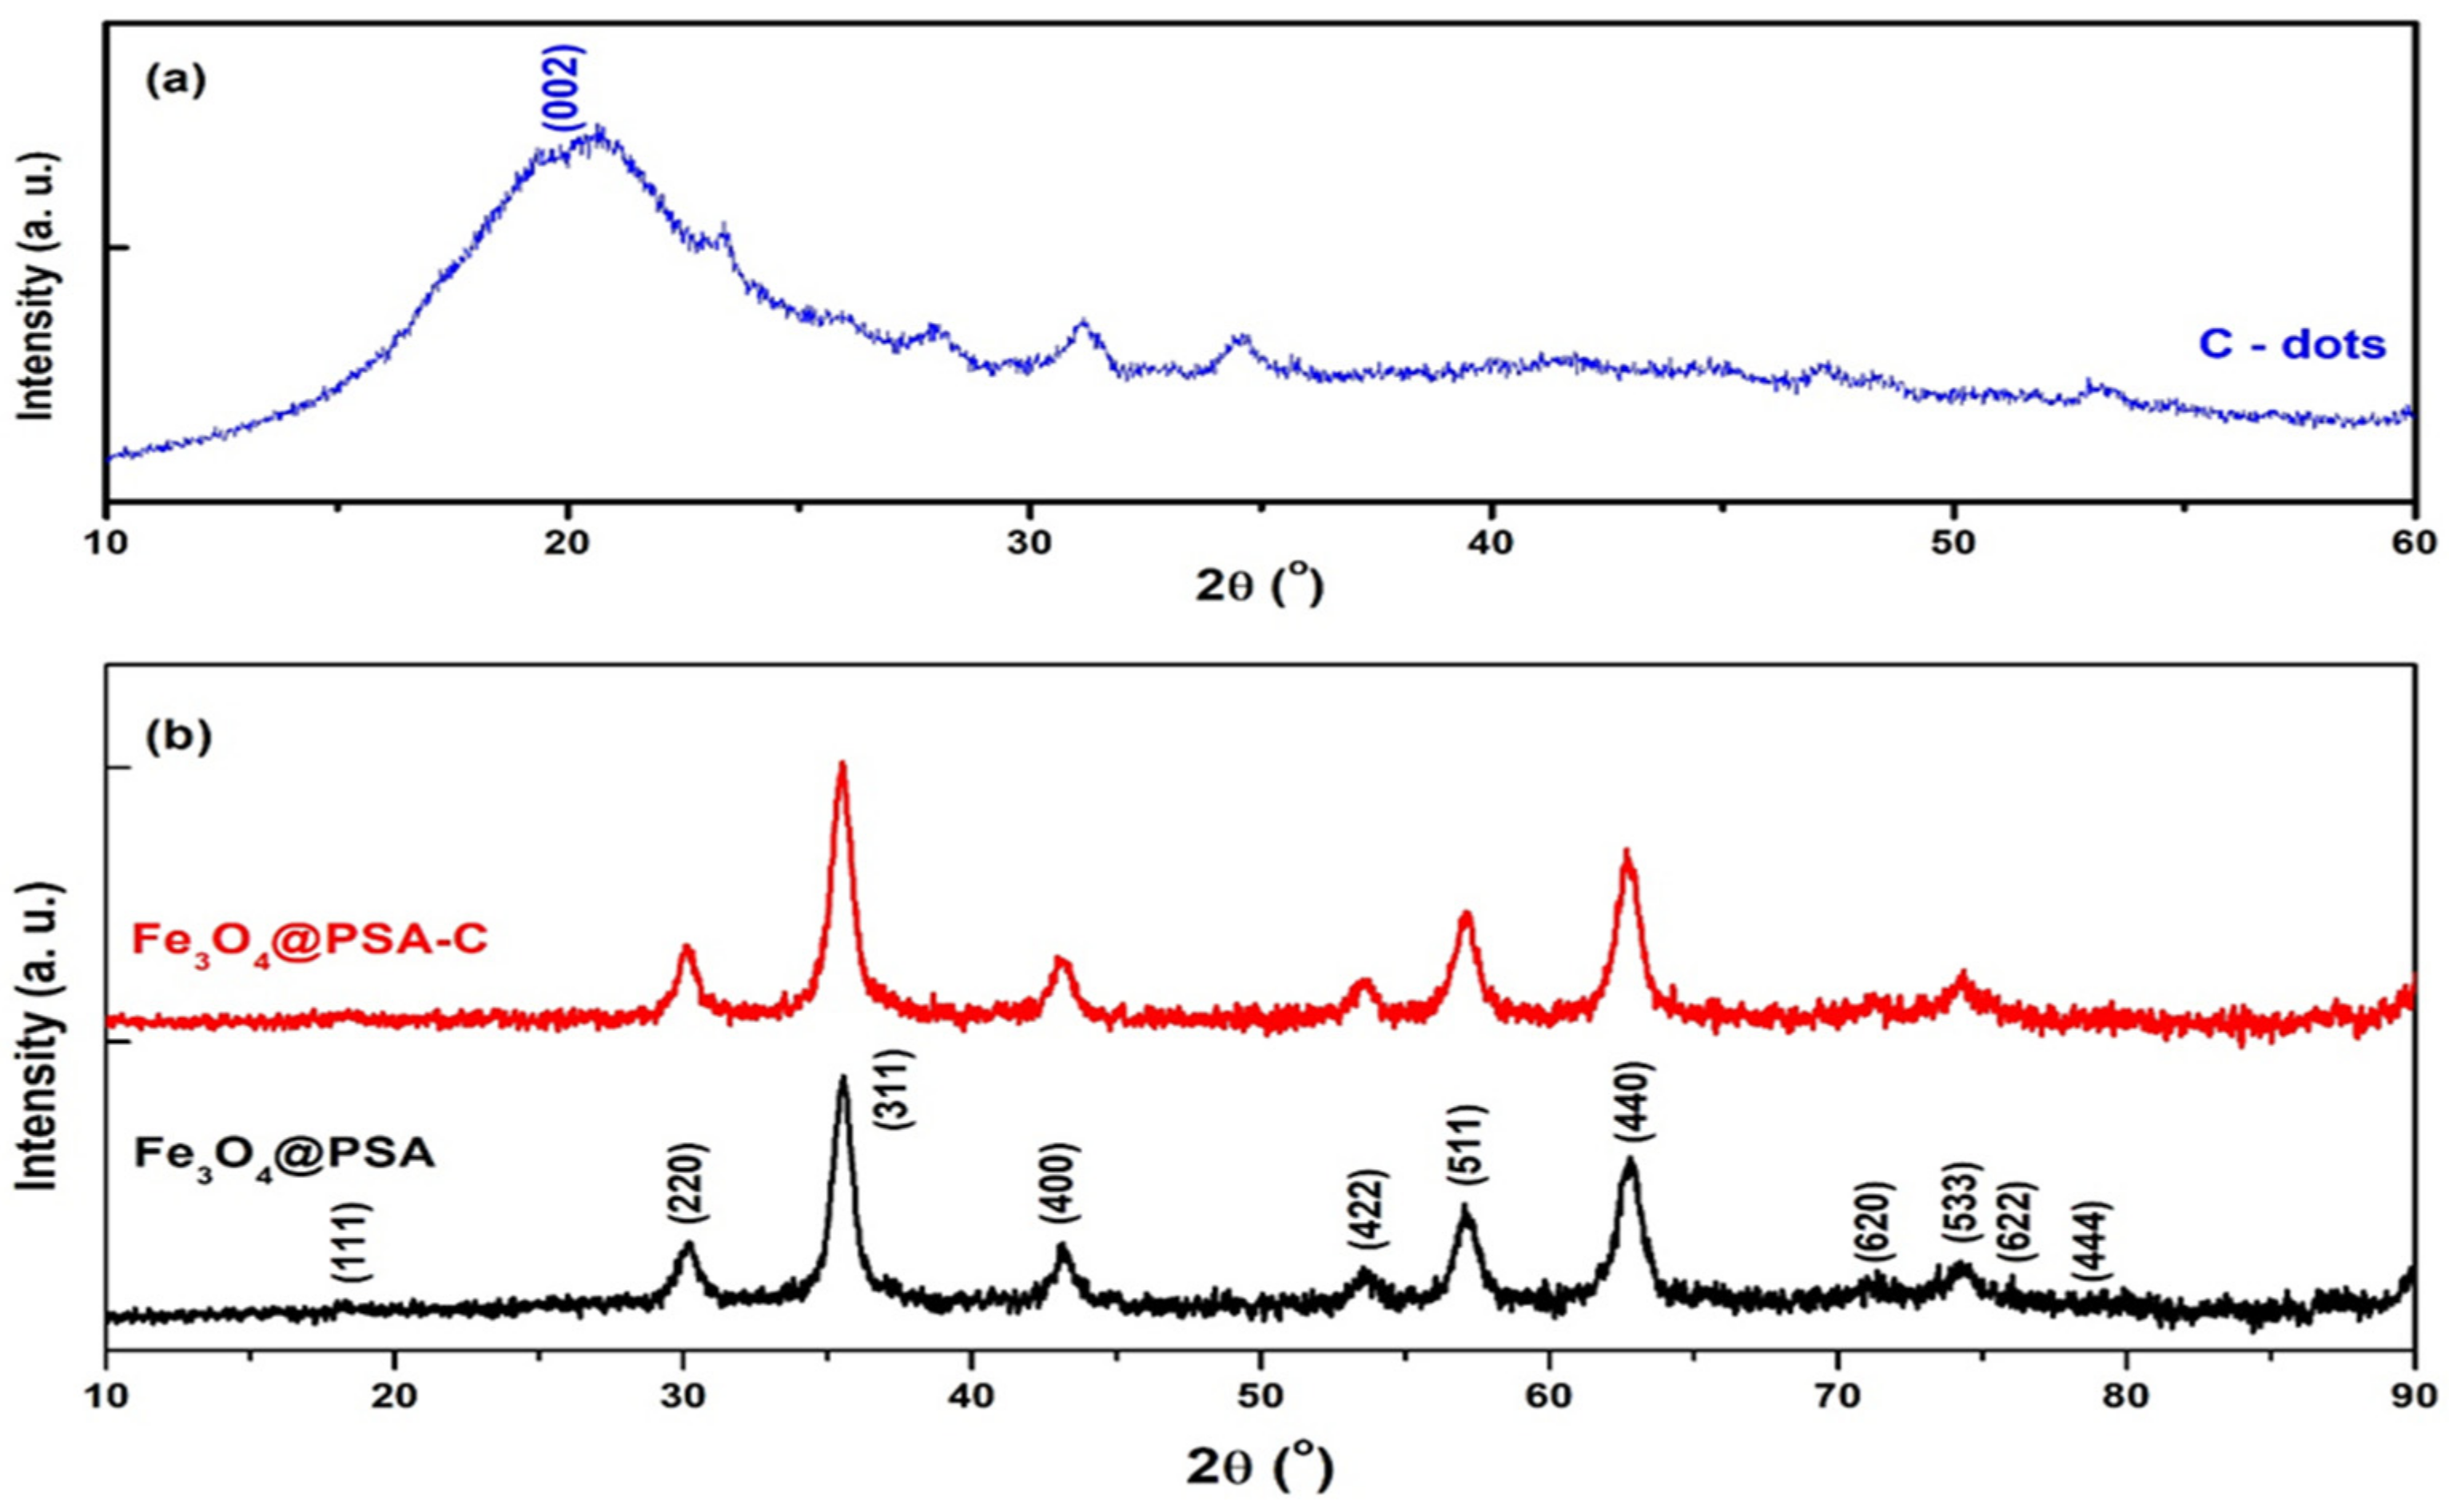
2.1.1. X-ray Diffraction

The phase composition and crystallite size were determined using an X-ray Diffraction (XRD) technique to find the structure of nanoparticles. Figure 1 shows the XRD pattern of the as-synthesized nanoparticles, which shows the typical diffraction peaks for the synthesized nanocomposites as a pure phase with no secondary phases. Figure 1a depicts the XRD diffraction peak for C-dots at 2θ value 18° consist of (002) plane. Figure 1b reveals the XRD peaks for Fe3O4@PSA-C and Fe3O4@PSA samples. The XRD pattern of the nanoparticles synthesized by the sonication process was identical to the XRD pattern of the functionalized Fe3O4@PSA nanoparticles. The diffraction peaks may be assigned to magnetite Fe3O4 (JCPDS 19-0629). The intense diffracted peaks were recorded at 2θ = 18.21; 30.19; 35.58; 43.16; 53.45; 57.00; 62.75; 71.19; 74.24, 75.96 and 78.77, indicating the presence of magnetite as a phase pure with a spherical structure for (111), (220), (311), (400), (422), (511), (440), (620), (622) and (444) planes, which validate the presence of Fe3O4 in Fe3O4@PSA synthesized sample [20].
The assigned XRD peaks for Fe3O4@PSA-C functionalized hetero-structure nanoparticles were confirmed to have the presence of all validated positions of Fe3O4@PSA and C-dots as given in Figure 2b [20,21]. The calculated dimension of the magnetic nanoparticle crystallites at room temperature using the Debye Scherrer equation, based on the broadening of the most intense peak (311–35.58), was recorded in the XRD graph (Figure 1). The average crystallite size of the produced nanoparticles is 10 nm computed using the Debye– Scherrer equation [22,23].

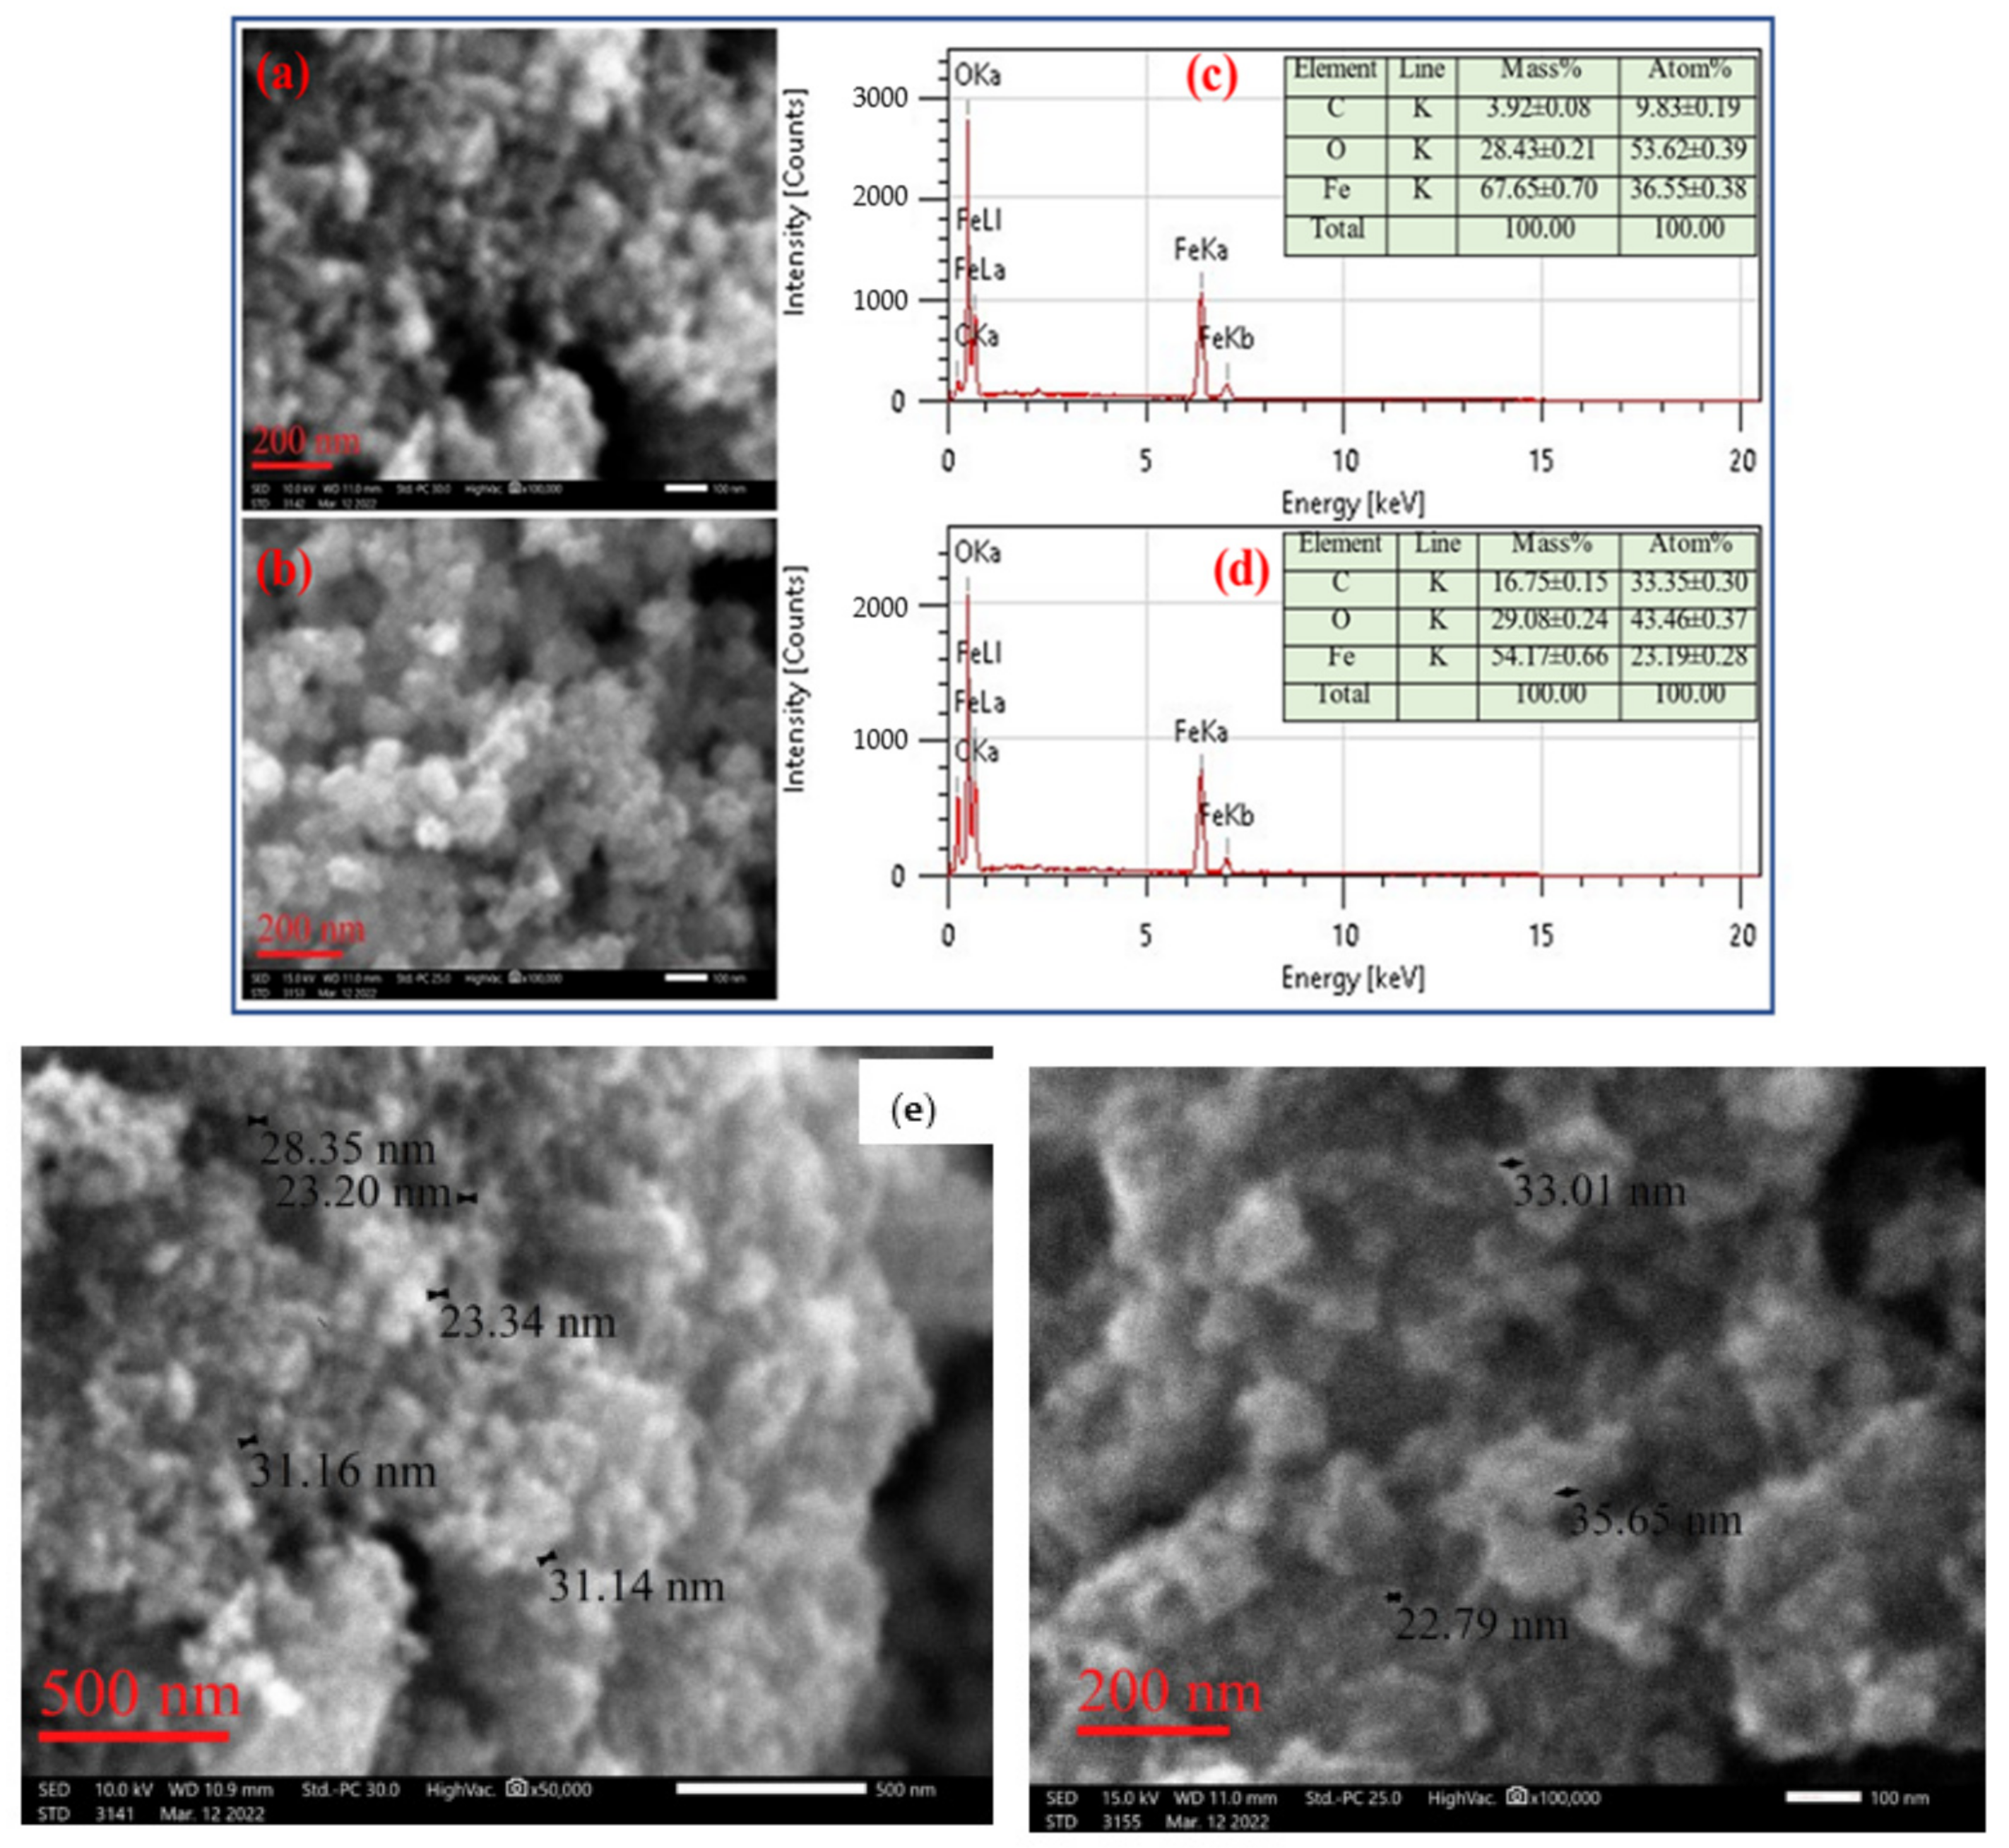
2.1.2. Scanning Electron Microscopy (SEM)

Figure 2a–d shows the SEM images of Fe3O4@PSA and Fe3O4@PSA-C nanoparticles with their energy dispersive X-ray (EDX) elemental mapping. The SEM micrograph results show that synthesized samples are spherical agglomerated structures due to the composition of numerous small nanoparticles and their particle size in the range of 10 nm to 30 nm. The particle size decreased due to sodium polyacrylate (C3H3NaO2) n as CA, which chelates the Fe ions during the sonochemical process. The compositions of Fe3O4@PSA and Fe3O4@PSA-C nanocomposite was determined by X-ray energy-dispersive spectroscopy (EDS), as shown in Figure 2c,d. The EDS analysis of the Fe3O4@PSA samples showed peaks with weight percentages for Fe (67.65%), O (28.43%) and C (3.92%). The EDS analysis of the Fe3O4@PSA-C composite showed peaks for Fe (54.17%), O (29.08%) and C (16.75%), which reveal the implantation of the C-dots in the Fe3O4@PSA nanoparticles. The carbon- dots agglomerated over the Fe3O4@PSA surface.

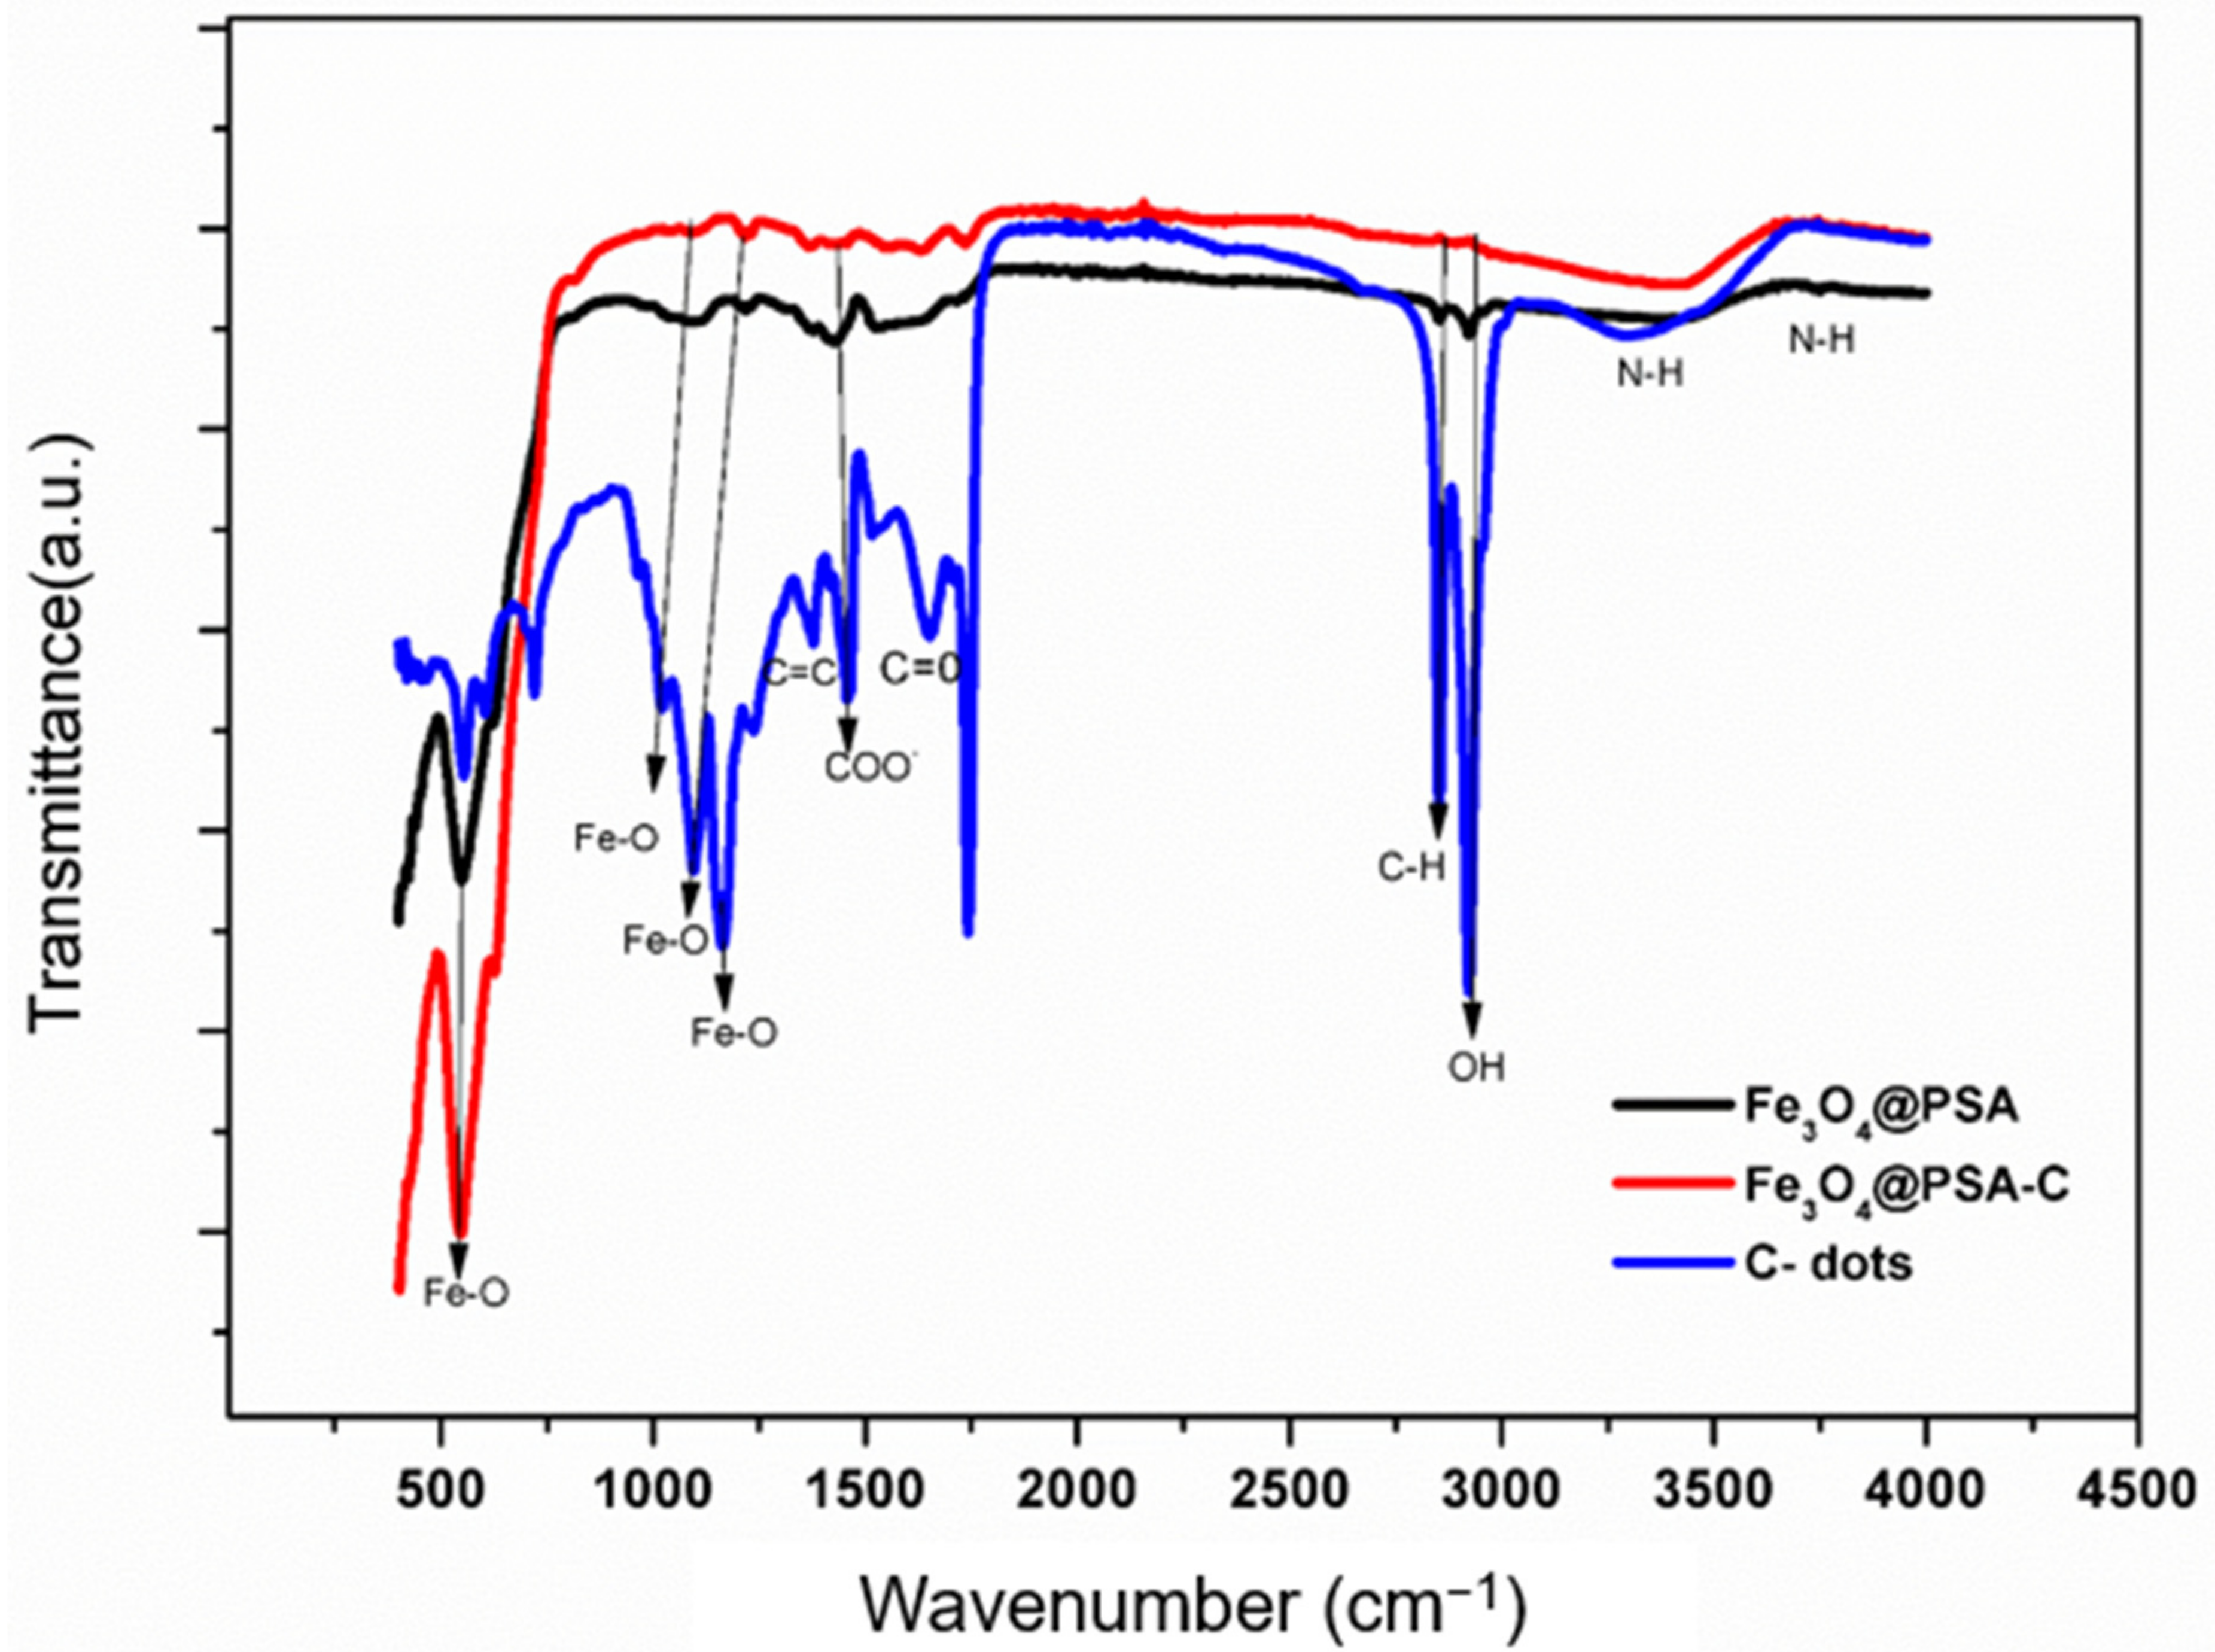
2.1.3. Fourier Transform Infrared Spectroscopy (FTIR)

The chemical bond and function of Fe3O4@PSA, C-dots, and Fe3O4@PSA-Cdots nanoparticles have been identified by FTIR analysis in Figure 3. The presence of the Fe-O bond in tetrahedral and octahedral positions can be seen in the bands around 450–700 cm−1. The peaks at 1440–1550 cm−1 represent the coordination between COO-group vibration and Fe-cations. The absorption bands around 2900–3600 cm−1 have been supported by the presence of O-H and C-H bonds [24]. Cow milk-based carbon dots contain various chemical compositions with polarities [25].
The band between 3100–3600 cm−1 shows the presence of O-H and N-H bonds, whereas the bands around 2800 and 2900 cm−1 are attributed to the C-H bond. The peaks at 1400 cm−1,1550 cm−1, and 1630 cm−1 were assigned to C=C, N-H, and C=O starch bonds with π-π* and n-π* transitions. The FTIR spectra peaks of Fe3O4@PSA-C nanocomposite represent the slightly shifted band at 1400 cm−1,1550 cm−1, and 1630 cm−1 ascribed to C=C, N-H, and C=O bonds due to the surface interaction between the functional moieties of nanocomposites. The peaks at 1100 cm−1 and 1300 cm−1 show the interaction between Fe-O bonds in Fe3O4@PSA and the carbonyl group present in C-dots. All such results confirm the hetero-structure nanocomposite of Fe3O4@PSA-C [26].

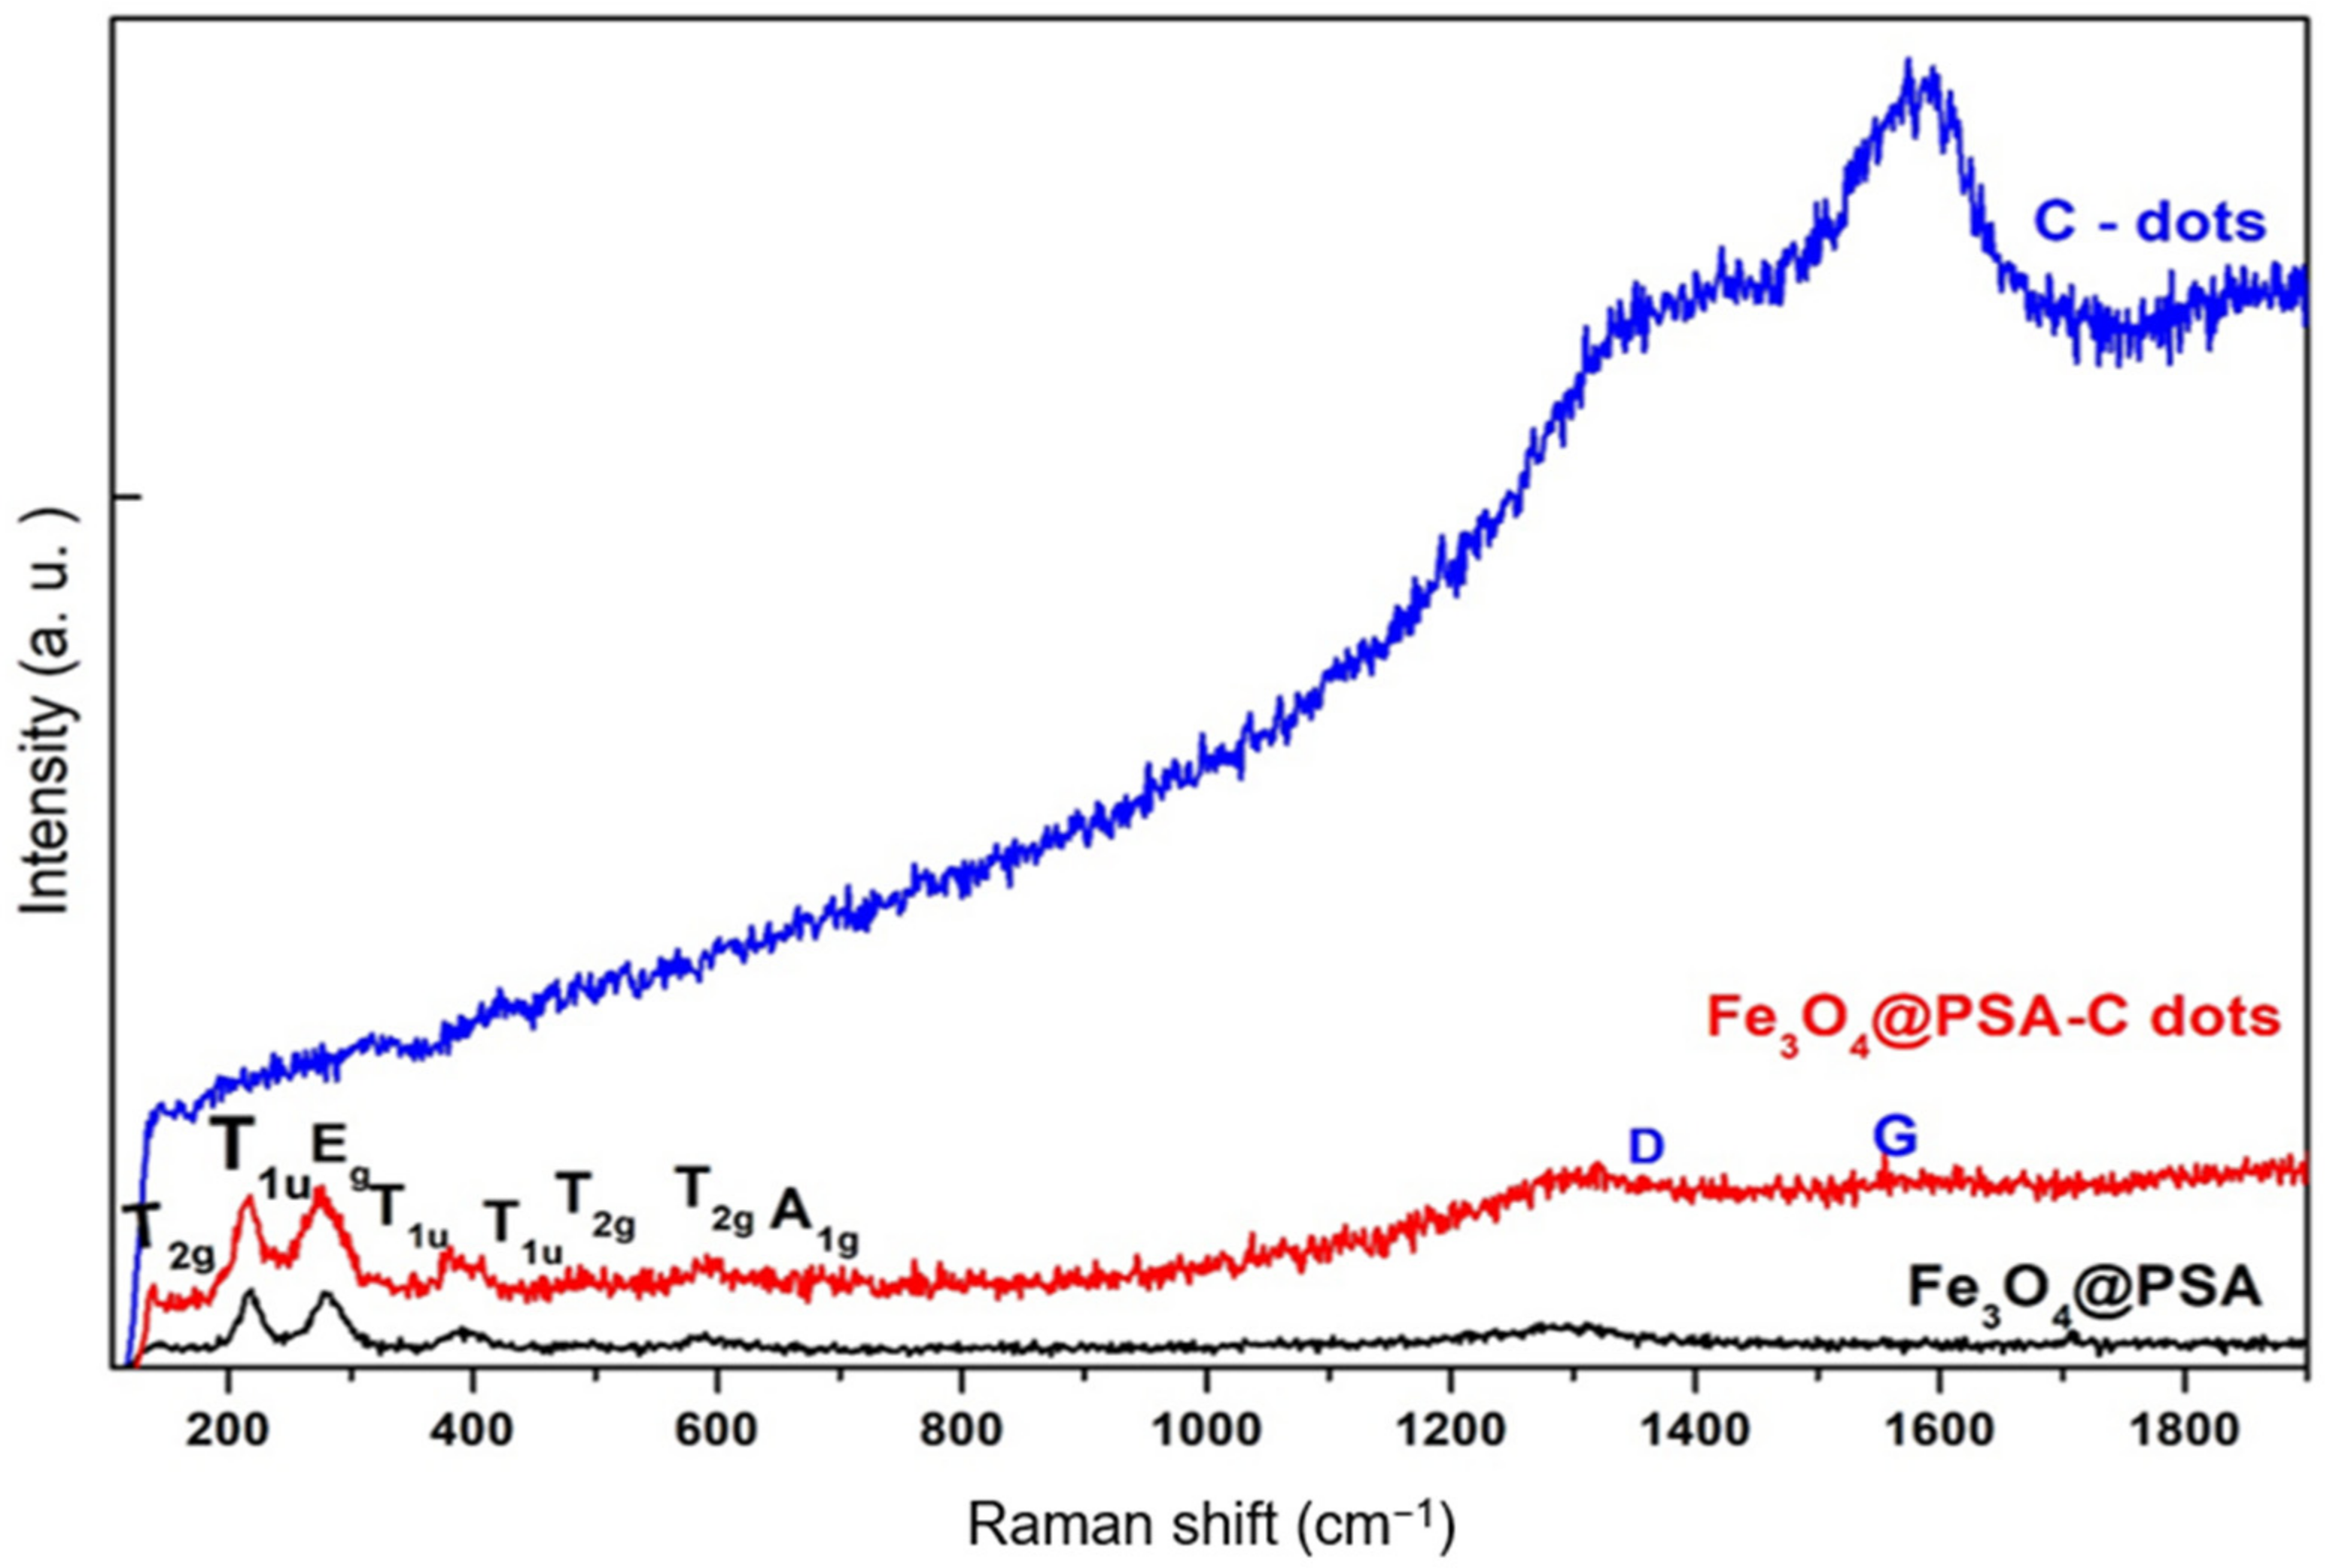
2.1.4. RAMAN Spectroscopy

In Figure 4, the Raman spectroscopy technique was used to identify the modes of C-dots, Fe3O4@PSA-C and Fe3O4@PSA nanoparticles. The cation distribution, non-stoichiometry, and defect conditions influence the results of Raman modes. The estimated values of polarized intensities also help to identify the Fe3O4@PSA Raman modes. The weak anti-stokes spectrum is present in the Fe3O4@PSA Raman band around 195 cm−1. The ascribed vibrational spectrum of the observed modes was based on polarization induced due to the orientation of Fe3O4 nanoparticles like T2g at 193 cm−1; T1u at 201 cm−1; 390 cm−1 and 450 cm−1; Eg at 296 cm−1, T2g at 500 cm−1 and 590 cm−1 whereas, A1g at 660 cm−1 as shown in Figure 5. The bands around 1340 cm−1 and 1600 cm−1 in Raman spectra were assigned to D-band and G-bands for C-dots. The presence of sp3 and sp2 hybridized carbon atoms shows C-dots nanoparticles’ graphitic nature. In Fe3O4@PSA-C spectra, the presence of T2g, T1u, Eg, T2g, A1g, D, and G vibrational modes with a modest frequency shift, shows that the Fe3O4 and C-dots were well coupled in the hetero-structure nanomaterial [27].

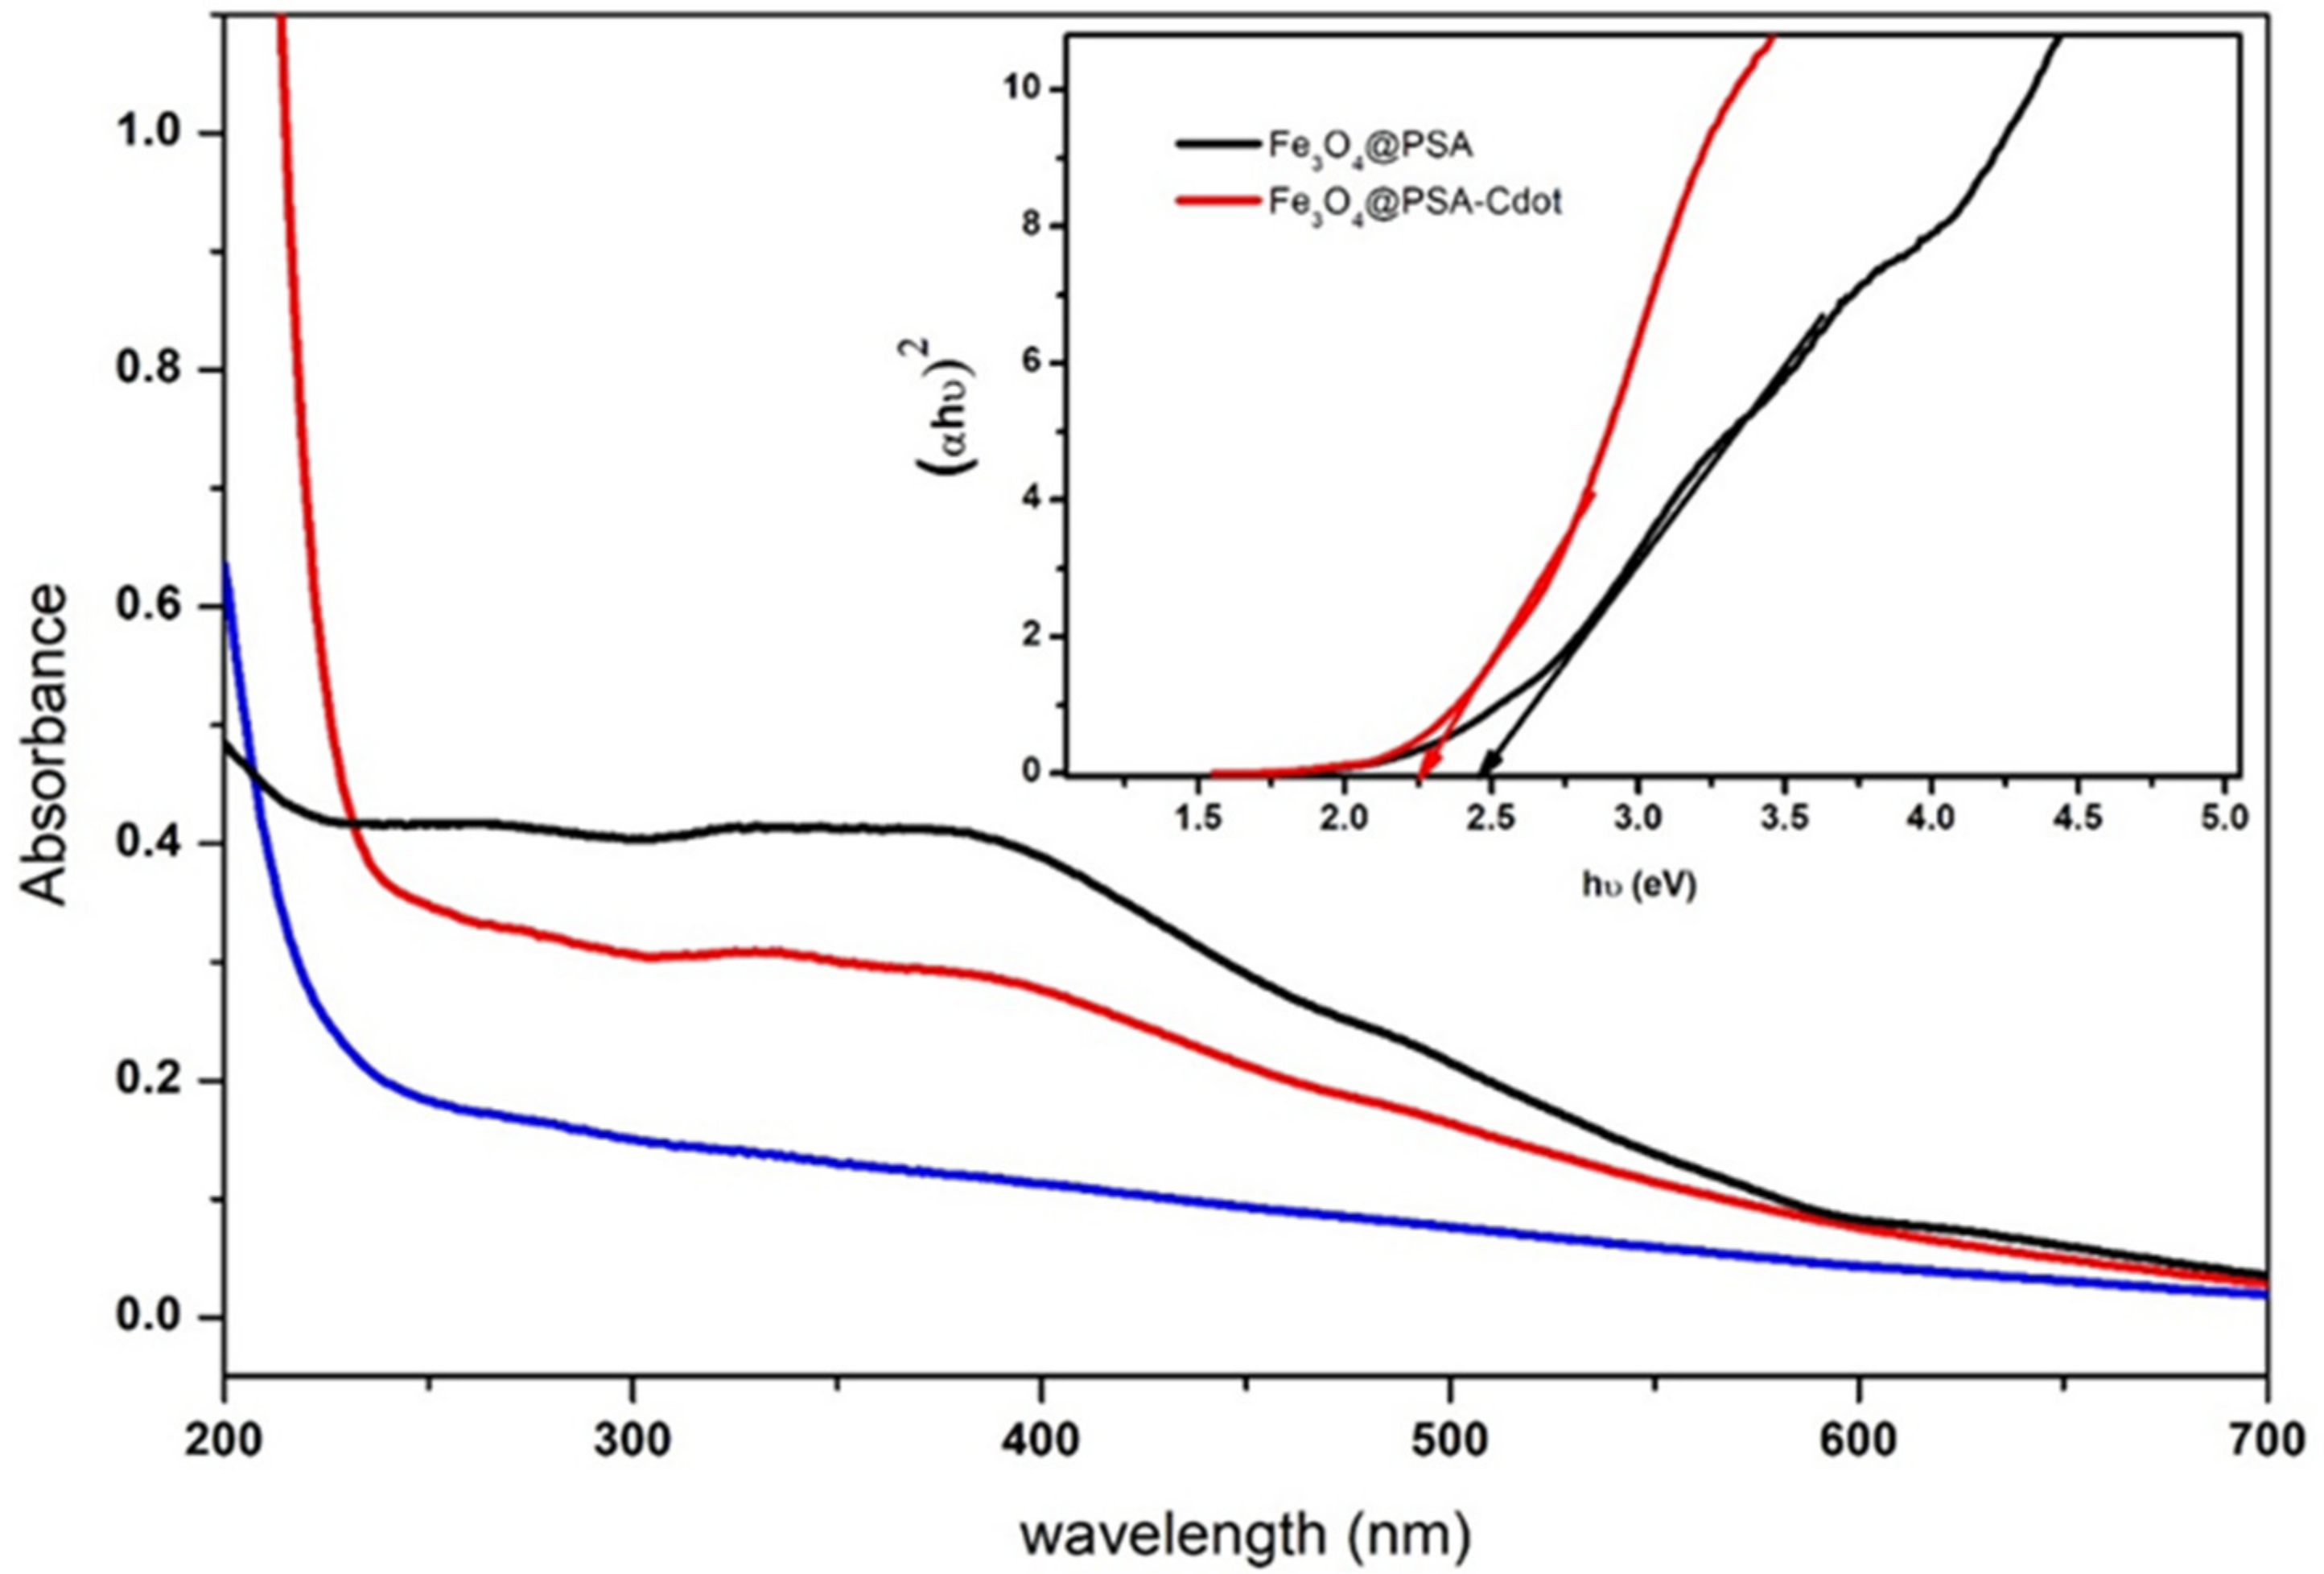
2.2. Optical Properties

The optical properties of functionalized nanoparticles depend on their electronic characteristics and energy bandgaps (Eg). These optical properties of pristine samples were analyzed by the UV-Visible absorption spectra shown in Figure 6. The energy bandgap (Eg) was calculated using ‘Tauc’s relation.’
α = A E g 1 2 / h ν
where A refers to constant, hν for photon energy, Eg for band gap, and α for absorption coefficient [22].
The bandgap was determined from the (αhν)2 vs. hν curve by drawing an extrapolation of the data point to the photon energy axis where (αhν)2 = 0, giving the optical band gap Eg. Figure 3 shows the energy bandgap (Eg) values for Fe3O4@PSA and Fe3O4@PSA-C synthesized materials. The Eg values for Fe3O4@PSA were estimated to be around 2.4 eV and 2.25 eV for Fe3O4@PSA-C nanocomposite [24]. The bandgap was reduced after the composition of C-dots due to the agglomerated particle size and functionalization of the surface of the composite nanomaterial. The composition of C-dots results in a charge imbalance, which triggers the presence of oxygen vacancies in prepared samples. The variation in the angle of Fe-O-Fe towards 180° also affects their electronic structure and creates an impurity band. This impurity band enhances charge transfer between the carriers by alteration of the energy bandgap. The substitution of C-dots in pristine Fe3O4@PSA shows lower energy band gap values, which resulted in improved optical properties of the Fe3O4@PSA-C nanocomposite.

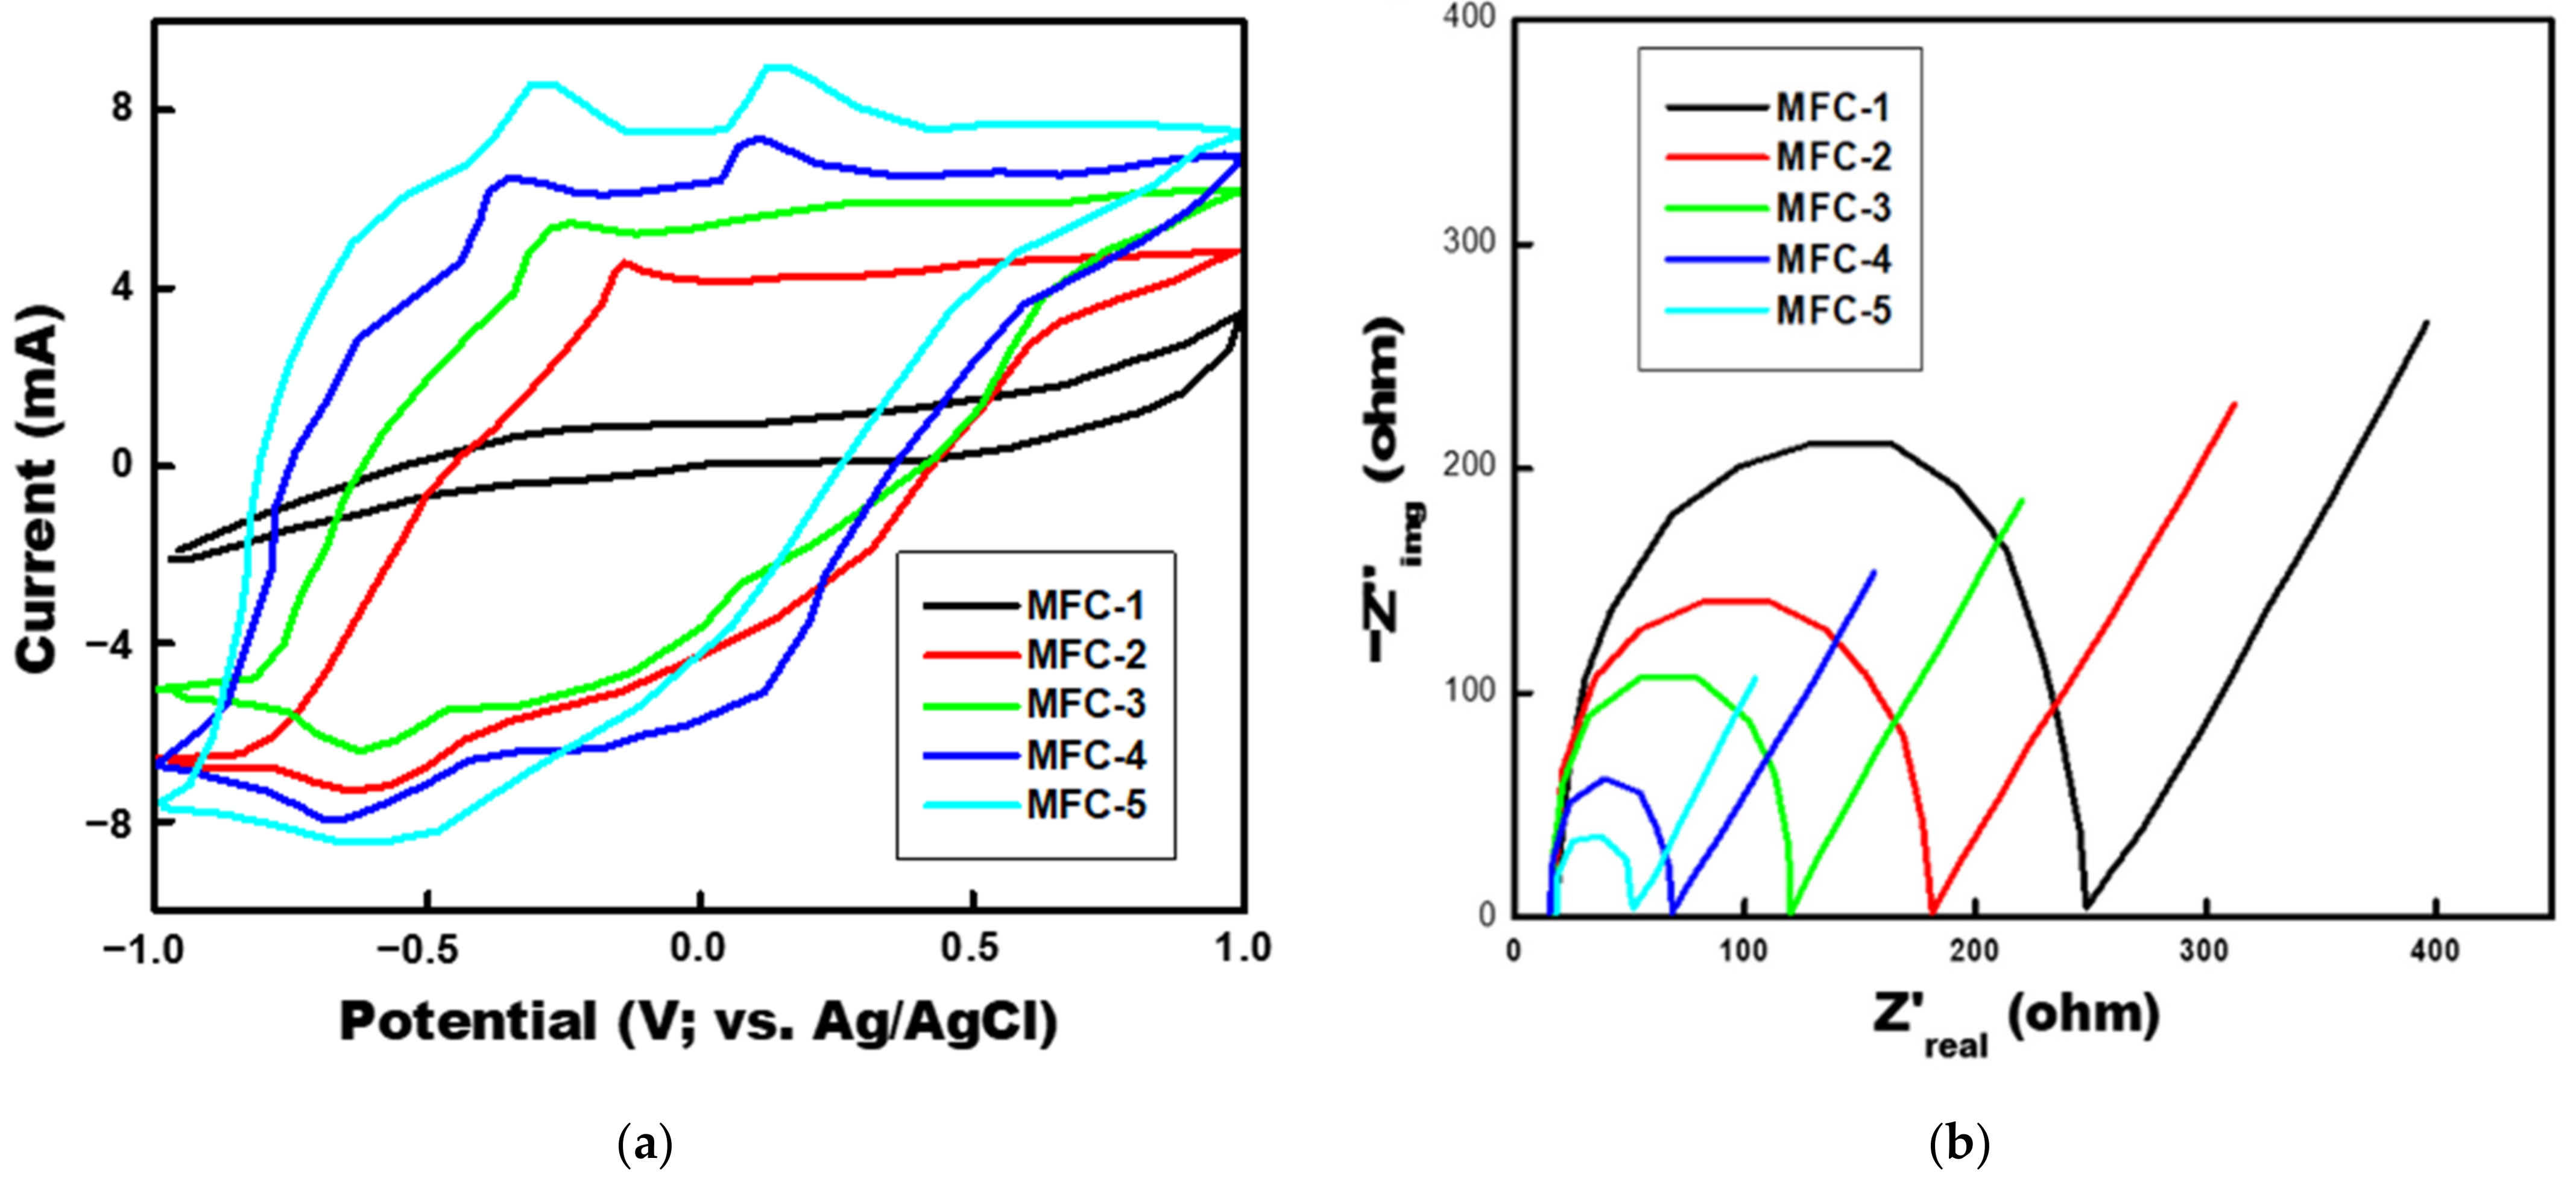
2.3. Microbial Electrochemical Study

MFCs having anode with different concentrations of Fe3O4@PSA were operated in a fed-batch mode. Following the biofilm development throughout the ninth batch rotation, the anode’s electrochemical kinetics were studied in operational MFCs. The CV approach has been widely utilized to evaluate the biocompatibility of anode components for electro-catalyzing substrates using microbes as biocatalysts [28]. In this study, the functionalization of anodes enhanced with various components like raw graphite sheet and different amounts of Fe3O4@PSA-C mixture was assessed only based on the MFCs’ electrochemical properties. Five MFC system were built and named; for instance, MFC having raw graphite as anode was named as MFC-1, followed by MFC with increasing amount of Fe3O4@PSA-C 0.25 mg/cm2, 0.50 mg/cm2, 0.75 mg/cm2 and 1 mg/cm2 as MFC-2, MFC-3, MFC-4 and MFC-5, respectively (Table 1). Figure 6a summarizes the output of the cyclic voltammetry (CV) evaluation of the various anode components employed in these tests. By using a linearly cycled potential sweep among two or more preset values, cyclic voltammetry is an electrochemical method for determining how much current flows through a redox-active solution. The rates of electronic-transfer events, the energy levels of the analyte, and the thermodynamics of redox reactions can all be easily ascertained using this method. The Fe3O4@PSA-C (1 mg/cm2) composite exhibited separate redox maxima, which were determined to be greater than the Fe3O4@PSA-C (0.25 mg/cm2, 0.5 mg/cm2, and 0.75 mg/cm2) and reference anode, as per CV. During the oxidative examination of CV, two oxidation maxima at −0.26 mV and +0.16 mV at current values of 7.7 mA and 8.1 mA were recorded in MFC utilizing Fe3O4@PSA-C (1 mg/mL).
Similarly, MFC having Fe3O4@PSA-C (0.75 mg/cm2) also reported two oxidation peaks at −0.40 mV and +0.02 mV at current values of 5.7 mA and 6.8 mA. A single oxidation spike was observed at −0.12 mV with a current of 3.7 mA in the case of MFC having Fe3O4@PSA-C 0.5 mg/cm2 and −0.2 mV with a current of 4.8 mA in the case of MFC having Fe- 0.25 mg/cm2, respectively. Still, the reference anode showed no enhanced oxidation spike, perhaps because of poor anode kinematics.
The oxidation of essential metabolites may have caused the initial oxidation spike at −0.26 mV. Furthermore, electroactive enhancers such as Fe3O4@PSA-C-treated electrodes have been discovered to boost the electronic conductivity of the electroactive species, resulting in greater signal responsiveness [29]. FCDMA, for instance, had several oxidation spikes that were not hazy, while other anodes had crushed maxima. Moreover, the oxidation potential in the Fe3O4@PSA-C-modified anode was substantially greater than in the control anode, which might be attributable to decreased oxidation overpotential failure due to the FCDMA anode’s super-hydrophilicity. In contrast, as opposed to the control, the Fe3O4@PSA-C (0.25 mg/cm2 and 0.5 mg/cm2) had greater efficacy and generated more oxidative potential.
Solution resistance (Rs), charge transfer resistance of the electrode (Rct), and diffusion resistance (Rd) have all been demonstrated to be effective in assessing anodic impedance in MFCs using EIS [30]. The dielectric characteristics of materials, and the complex resistance are determined through electrochemical impedance spectroscopy (EIS). This is determined by the interaction of the external field with the specific sample’s dipole moment, which is often expressed by the permittivity. Additionally, it is thought of as an experimental method for describing electrochemical systems. With this technique, system impedance is measured across a range of frequencies. As a result, a frequency response involving energy storage and dissipation characteristics is provided. The majority of the time, Nyquist plots are used to visually represent the data obtained by electrochemical impedance spectroscopy. The EC-Lab V11.36 tool was used to create the EIS evaluation findings. A calculated Nyquist plot of hypothetical impedance vs. real impedance is shown in Figure 6b. The width of the semi-largest circle may be used to compute Rct readings. Any electrode’s Rct score is a statistic that represents the electrode’s oxidation or reduction activation energy. A higher Rct value suggests a larger potential barrier for redox processes and vice versa. As a result, a change in Rct’s value might impact anode dynamics. Improved electrochemical rates resulted in a lower Rct of 52.96 and 33.45 for electron transport in MFCs using Fe3O4@PSA-C (0.75 mg/cm2 and 1 mg/cm2), approximately 6.9-fold lower than the control anode (230 Ω). The Rct of the Fe3O4@PSA-C (0.25 mg/cm2 and 0.5 mg/cm2) was 164.46 and 103.14, respectively, 2.22 times lower than the control anode.
In the investigation, Fe3O4@PSA-C (0.75mg/cm2 and 1 mg/cm2) has been transformed into highly conductive oxide in the anode during MFC operation, enhancing extracellular electron transport [31]. Furthermore, the magnitudes of the Fe3O4@PSA-C—0.25 mg/cm2, 0.5 mg/cm2, 0.75 mg/cm2, and 1 mg/mL Rs were found to be almost equivalent (~18 ohm), showing that the mixture should be conceptually similar.

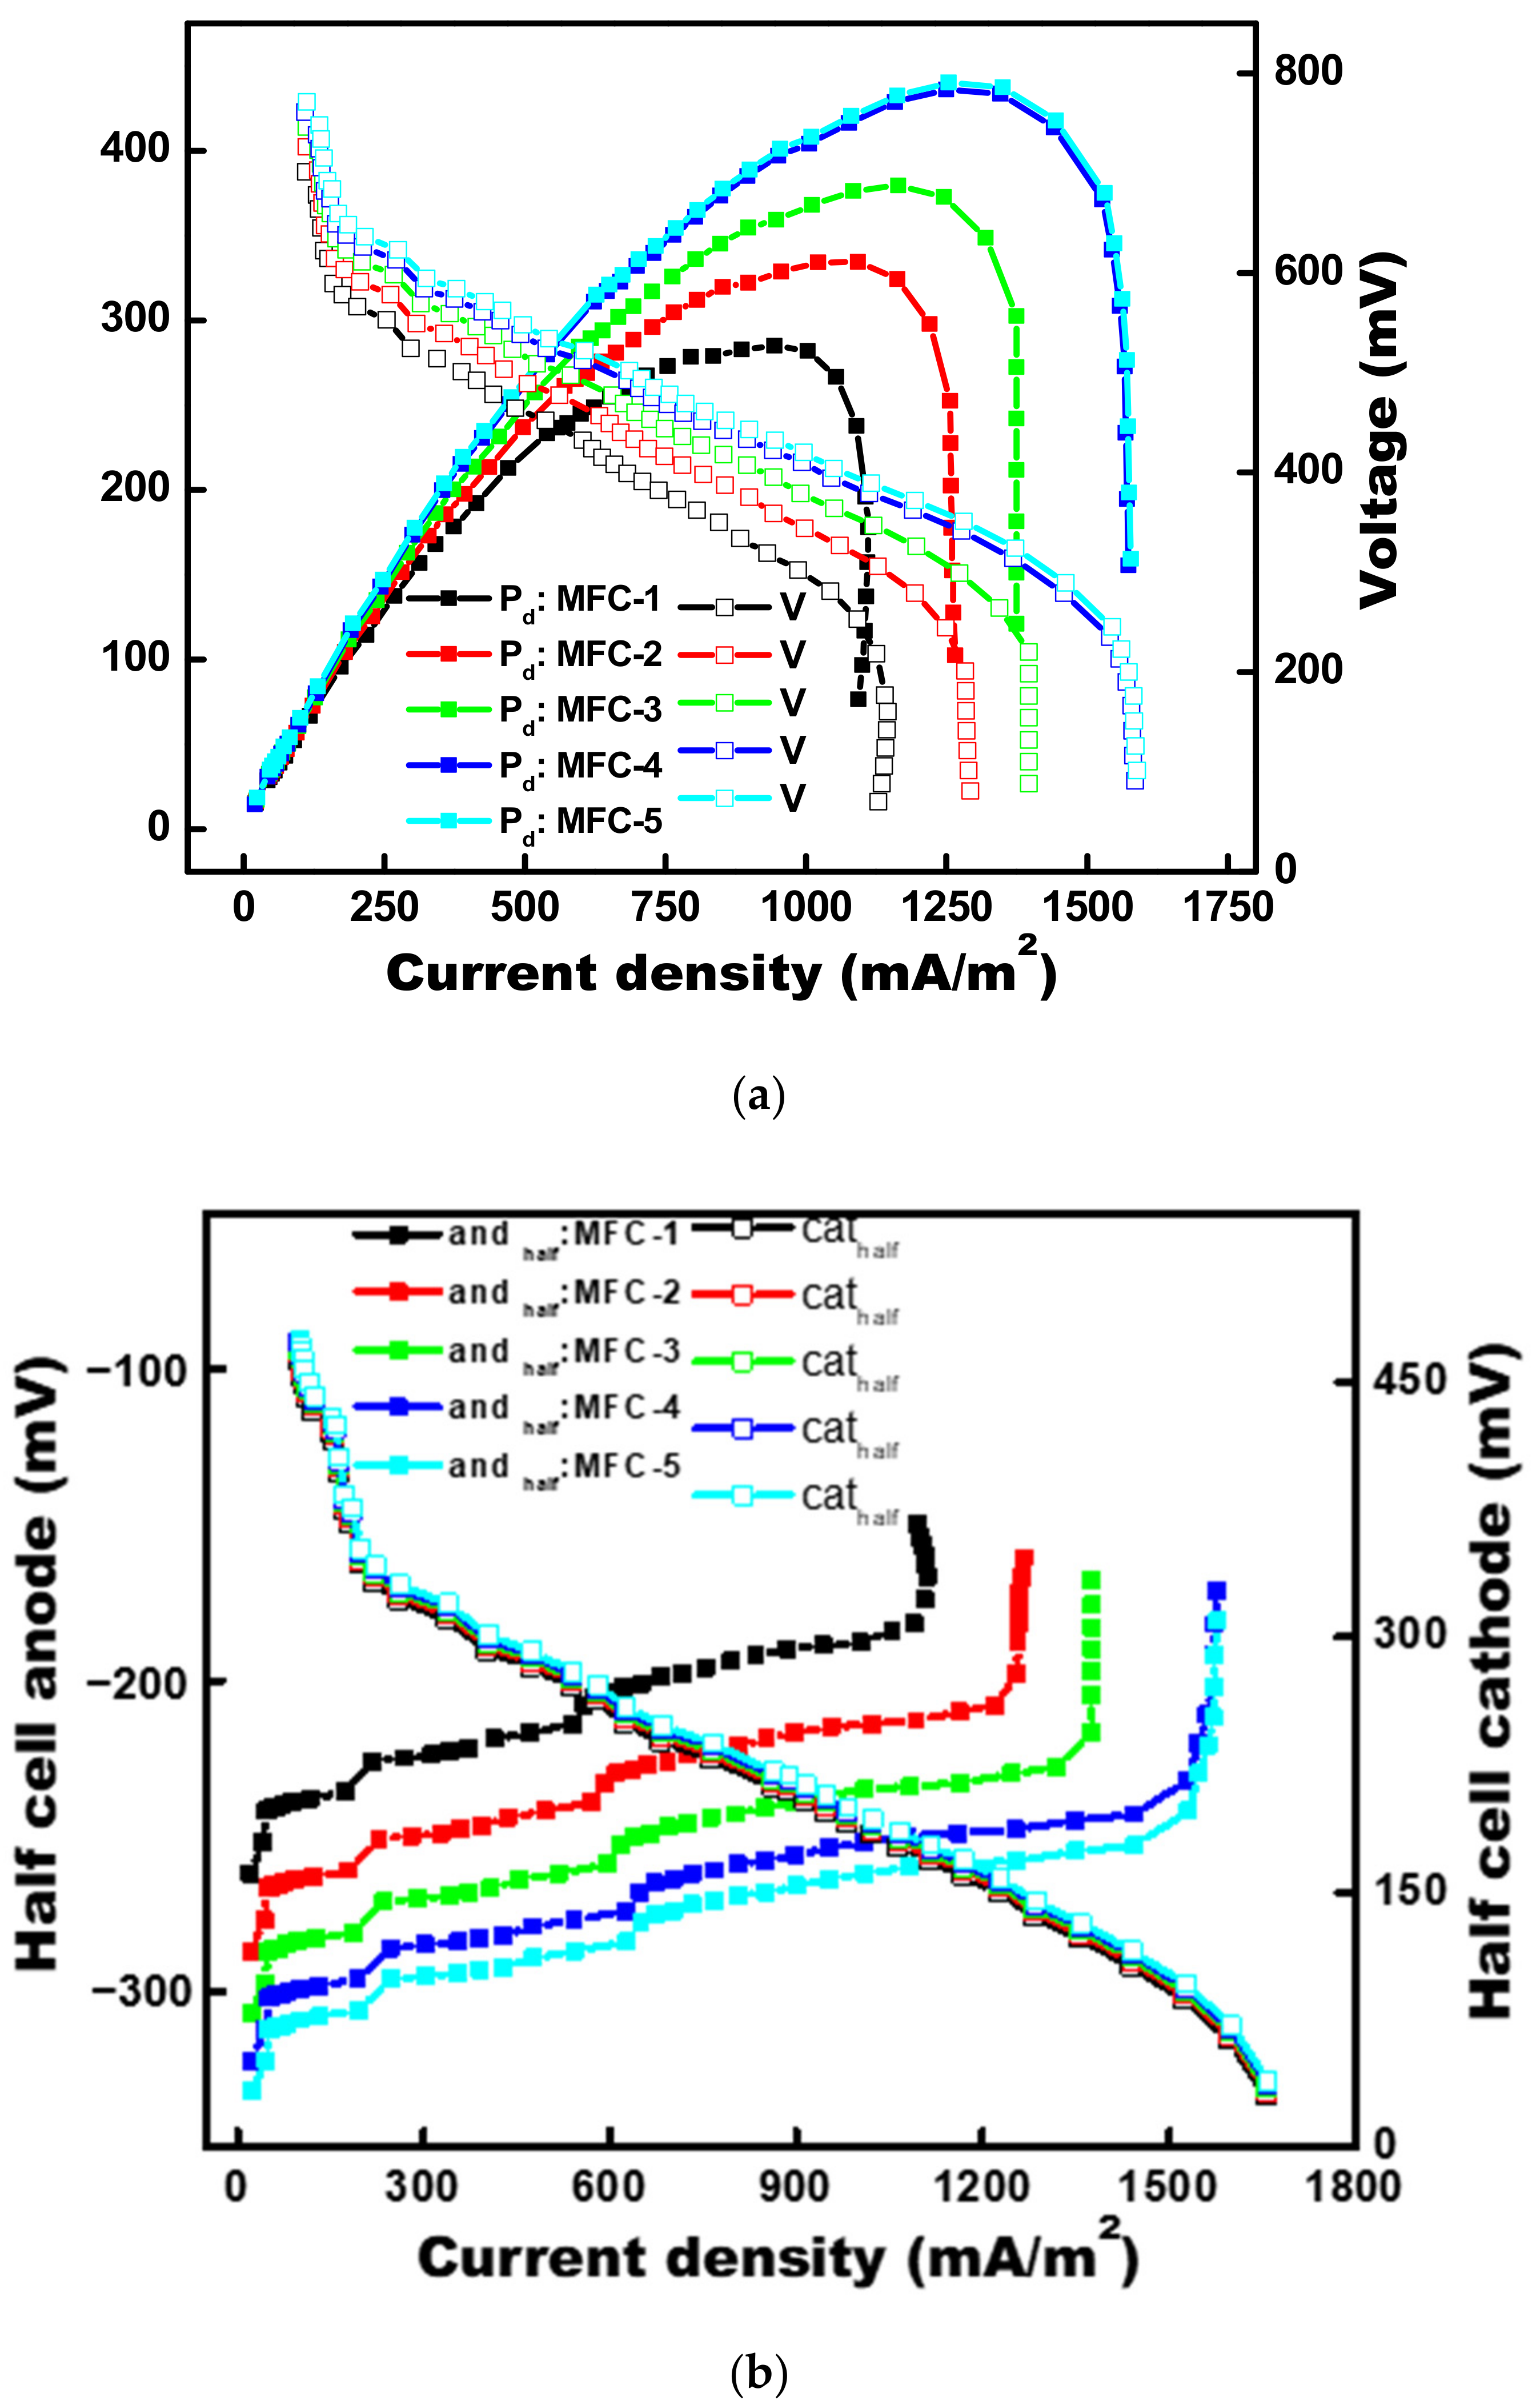
2.4. Power Generation

The power output reached a stable state after two fed-batch periods. At infinite impedance, the maximum OCV improved from 701 ± 23 mV in MFC-1 to 726 ± 20 mV in MFC-2, 746 ± 22 mV in MFC-3, 765 ± 25 mV in MFC-4, and 771 ± 28 mV in MFC-5 (reported as open-circuit voltage, OCV). Stronger electrogenic biofilm formation on the anode in MFCs using Fe3O4@PSA-C and other assessed MFCs resulted in enhanced OV and OCV, leading to enhanced electrogenic yield.
When the entire anodic chamber volume and actual anode surface area were normalized, polarisation experiments were performed to establish the appropriate power density. Figure 7a shows that MFC-1 with an unmodified anode had a lower power density of 285.01 ± 10 mW/m2, compared to MFC-2 (0.25 mg/ cm2 Fe3O4@PSA-C)which had a power density of 334.41 ± 6 mW/m2 (4.86 ± 0.8 W/m3), MFC-3 (0.50 mg/cm2 Fe3O4@PSA-C) with 379.56 ± 8 (5.52 ± 0.5 W/m3), MFC-4 (0.75 mg/cm2 Fe3O4@PSA-C with 420.33 ± 12 mW/m2 (6.11 ± 0.3 W/m3) and MFC-5 (1 mg/cm2 Fe3O4@PSA-C) with 440 ± 7 mW/m2 (6.40 ± 0.4 W/m3).
These results were superior to those previously reported for single-chambered MFCs with various anode promoters. Despite this, the MFC-2 and MFC-3 with lower Fe3O4@PSA-C altered anode had a lower inbuilt impedance than the MFC-1, which might be due to the reduced carbon dots’ lower charge transmission obstacle. Because Fe3O4@PSA-C on the anode side worked as a final electron acceptor for extracellular electron transport, reduced the internal impedance, and decreased the anode’s conductance (Table 1).
The existence of rapid energy losses in MFC-1, MFC-2, and MFC-3 instead of a gradual current decline in MFC-4 and MFC-5 indicates that MFC-1, MFC-2, and MFC-3 have a larger activation rate (Figure 7a). The anode potential in MFC-4 (−322 mV) and MFC-5 (−332 mV) was found to be the lowest when compared to MFC-1 (−262 mV), MFC-2 (−287 mV) and MFC-3 (−307 mV), as shown in Figure 7b. Using carbon dots in conjunction with Fe3+ can increase the anode’s surface area on a micro/nanoscale, allowing additional cell adhesion and catalytic regions. The Fe3O4-carbon dot modified anode-based MFC’s increased cell adhesion and catalytic regions were combined with increased energy output. Moreover, because most electricigens employ hydrophilic redox messengers, the interface between the anode contacts region and the biofilm impacts the MFC’s energy output [32,33]. Increased microbe adhesion to the anode elevated anode voltage, resulting in improved electrogenic productivity in MFCs using Fe3O4@PSA-C modified anode (FCDMA).

3. Materials and Methods

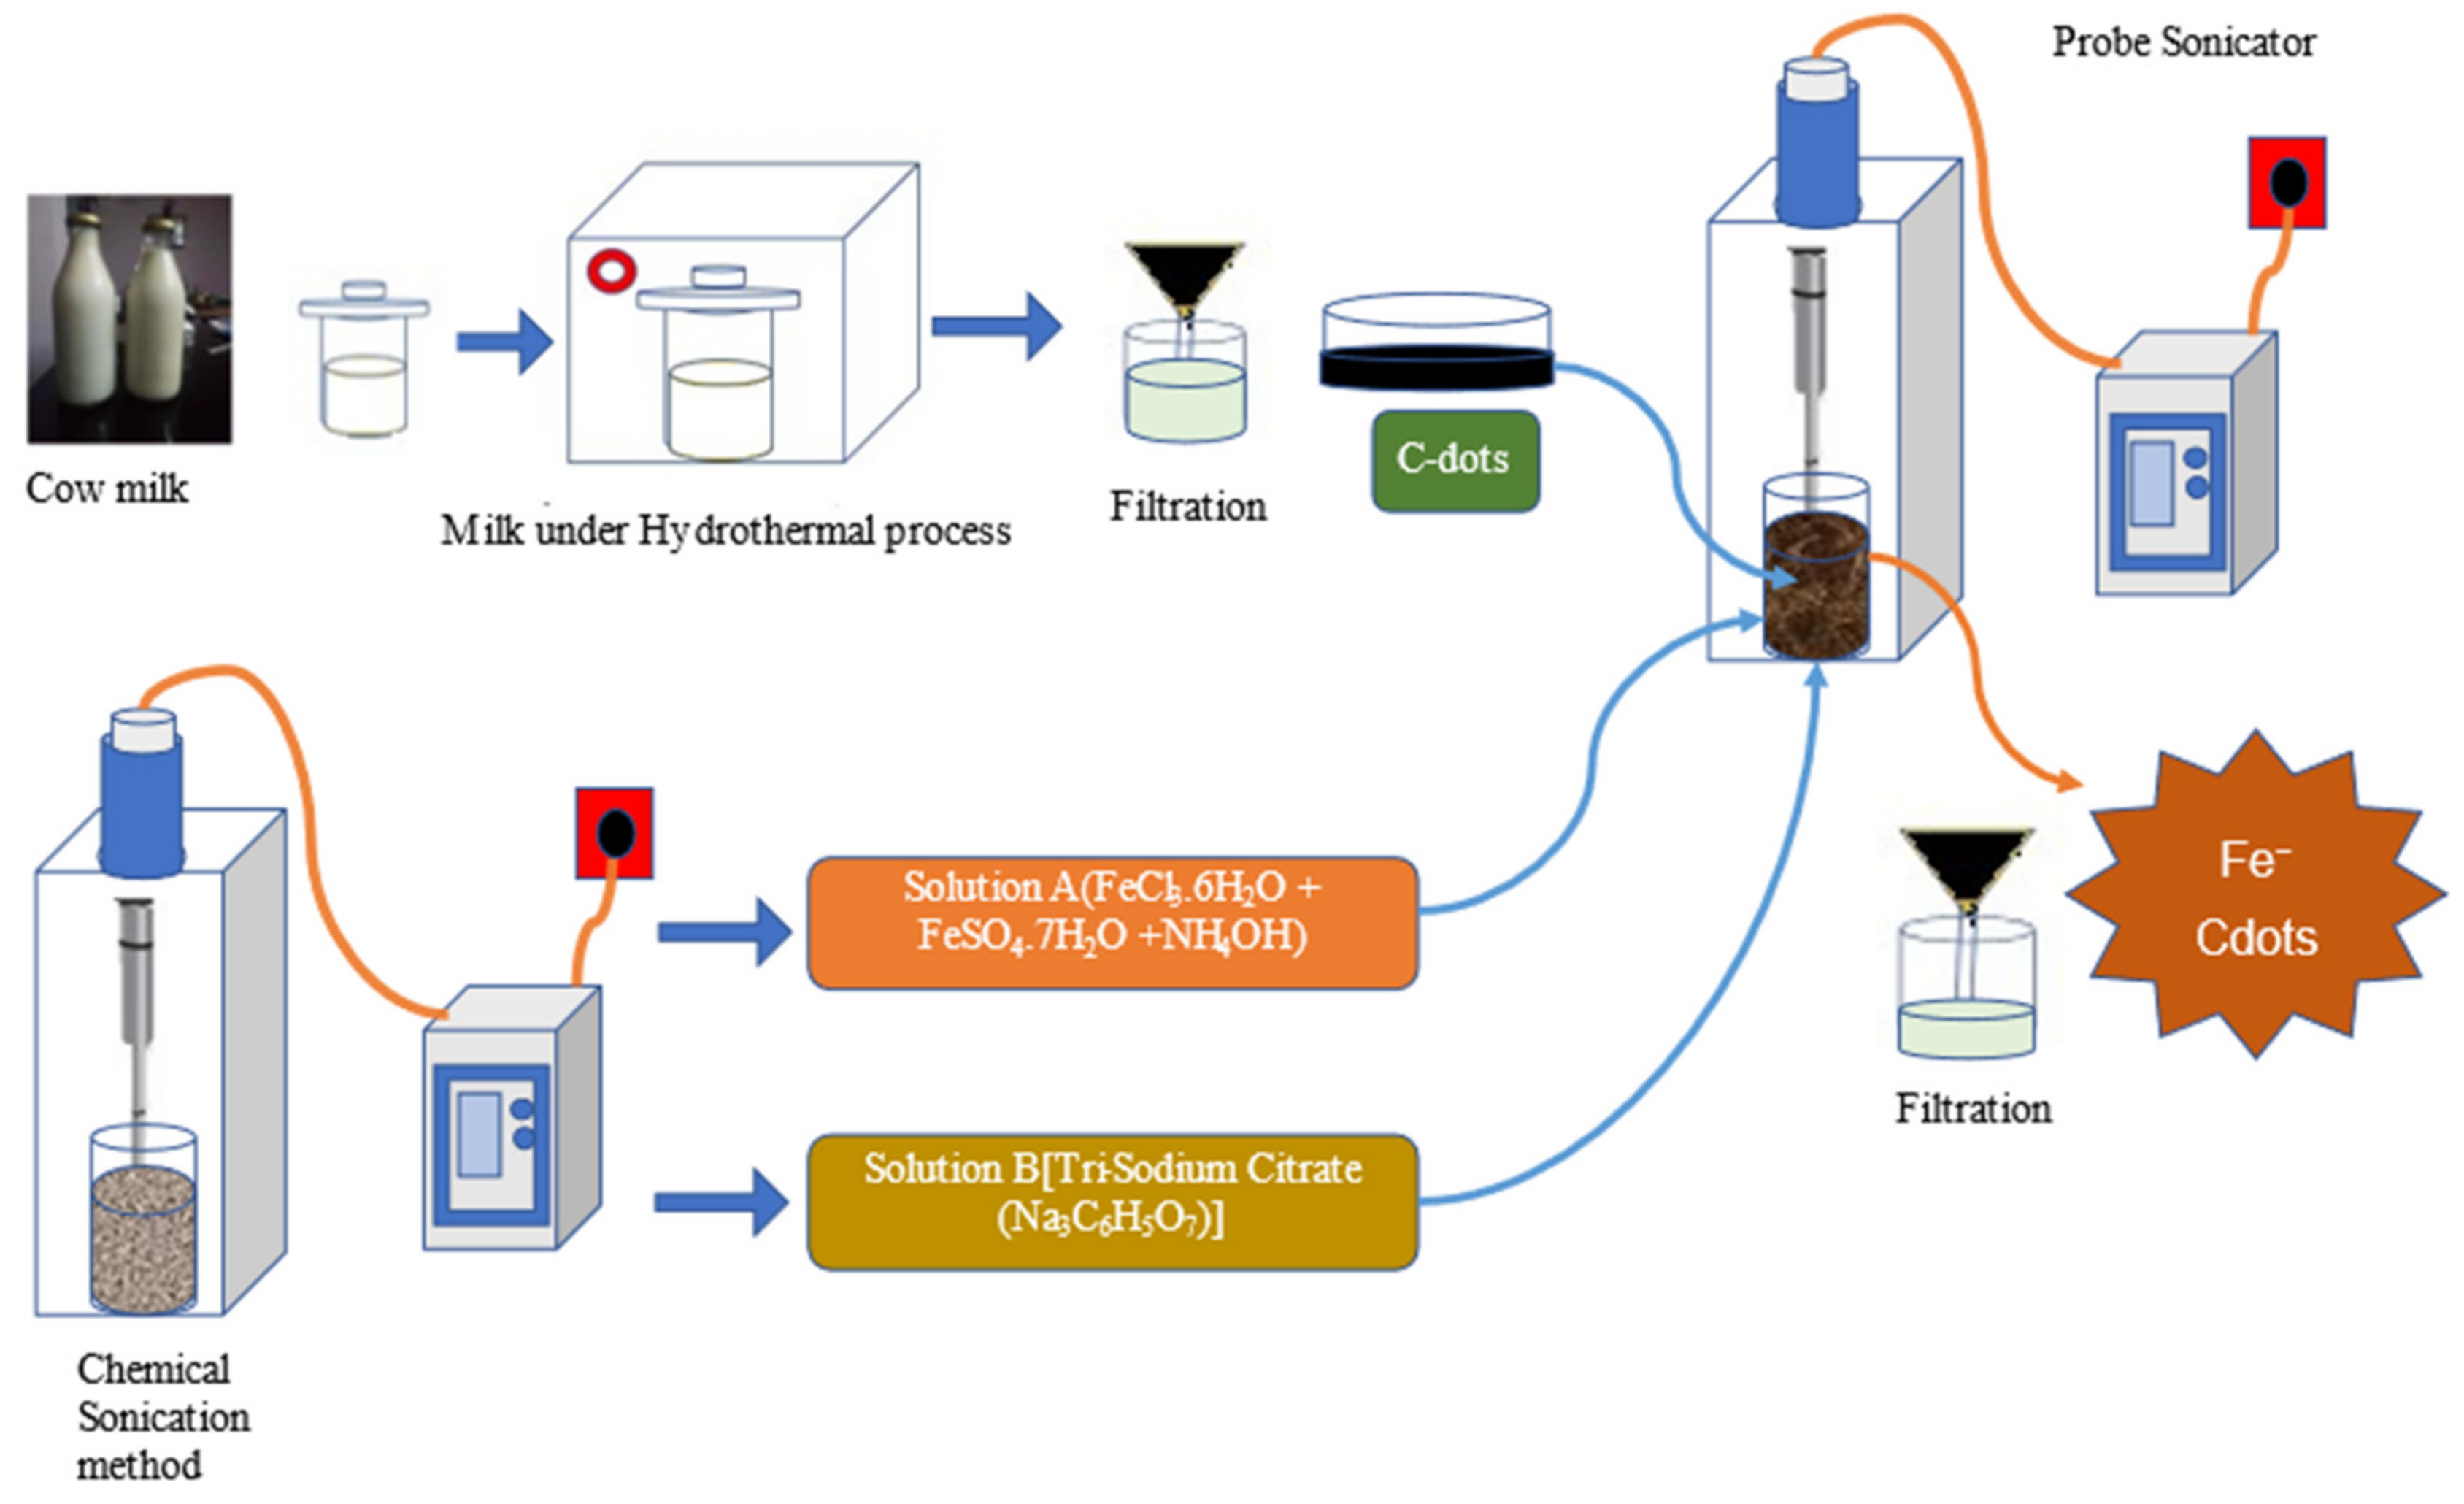
3.1. Synthesis of Fe-Carbon Dots

Materials Required: Iron Chloride (FeCl3·6H2O); Iron Sulphate (FeSO4·7H2O); Ammonium Hydroxide (NH4OH); Tri-Sodium Citrate (Na3C6H5O7) as capping agent (CA) and Cow milk. All chemicals were purchased from Sigma Aldrich. The Fe3O4@PSA-C hetero-structure was synthesized by the hydrothermal-assisted probe sonication method. The C-dots synthesis process was performed using the hydrothermal method, whereas further Fe3O4@PSA-C nanoparticle synthesis was done using the sonochemical method (Probe Sonicator), as shown in Figure 8.
Synthesis of C-dots: For the synthesis of C-dots, a fixed amount of cow milk was taken for the hydrothermal treatment at 120 °C for 4 h in a 100 mL stainless steel autoclave [25]. After cooling at room temperature, the sample was filtered and washed continuously using double distilled water until it reached pH-7. The C-dots filtered particles were dried at 60 °C, and the prepared C-dots nanoparticles became ready for characterization and participated in the Fe-C-dot synthesis process. For the synthesis of C-dots, we have used the cow milk. The Amul cow milk was purchased from the local market. The specifications and content of the Amul cow milk are given below (Table 2).
The C-dots were synthesized using the Amul cow milk many times in our lab; further the XRD, FTIR, and Raman measurements were performed. The results are reproducible.
Synthesis of Fe3O4@PSA-C: The whole sonication synthesis process was divided into three steps, and the prepared solutions in different steps were marked as solution A, Solution B, and F-Cdots. A certain amount of FeCl3·6H2O and FeSO4·7H2O (1:1 ratio) were dissolved in 15 mL of DD water to prepare solution A. The prepared solution was kept in the probe sonicator system (Labman Pro650, Labman Scientific Instruments Pvt. Ltd., Chennai, India) with frequency 20–25 kHz and 6 mm probe. The settings for the probe sonicator are pulse rate (3 sec on/off), power 585 watt and the cut off temperature 65 °C. Subsequently, a 7 mL NH4OH solution was added to the prepared solution and sonicated for the next 5 min under the same conditions. The prepared solution was marked as Solution A. Parallelly; solution B was prepared in 10 mL of DD water using a certain amount of sodium polyacrylate (C3H3NaO2)n as CA. Finally, solution B and 0.2 gm C-dots (pre-synthesized using cow milk) were mixed with solution A under vigorous sonication for 10–15 min. The resultant solution was filtered and continuously washed with DD water and acetone till pH-7 was achieved. The prepared sample was dried in an oven at 70 °C for 12 h to obtain Fe3O4@PSA-C hetero-structure nanoparticles in pure blackish powder form [34].

3.2. Characterization of Fe-Carbon Dots

The prepared samples were structurally characterized by an X-Ray diffractometer (XRD, MiniFlex 600, Rigaku, Japan). The measurements were carried out at room temperature using a CuKα radiation source (λ = 1.5406 Å, operated at 40 KV and 40 mA). The data were collected in the range 2θ = 7° to 90° with a step size of 0.02° and 1.2 s count time at each step. Scanning electron microscopic images were recorded by using a Zeiss Ultra scanning electron microscope (SEM, JSMIT200, JEOL, New Delhi, India) operated at 10–15 kV. Raman spectroscopy was carried out in the backscattering configuration (LabRAM HR, HORIBA India Private Limited, Kolkata, India) with a charge-coupled device detector and 532 nm Laser excitation sources. The Laser power was kept below 10 mW in order to avoid any sample heating. The vibrational properties were characterized by Fourier Transformed Infrared (FTIR) spectroscopy performed on a spectrum BX-II spectrophotometer (PerkinElmer, New Delhi, India) with a spectral resolution of 1 cm1. The FTIR measurements of all the samples were done in the reflectance method in the wavenumber range of 400–4000 cm1 at room temperature. The optical properties of the synthesized samples were analyzed by using a LABMAN-900S UV–visible spectrometer (Labman Scientific Instruments Pvt. Ltd., Chennai, India).

3.3. Construction of Electrodes

A titanium horn edge sonicator was used to disperse the Fe3O4-carbon dots in 50 mL of deionized water (Piezo-U-Sonic, Kolkata, India). After 3 h of sonication, the composite mixture was transferred to 0.5 mL of 5% polyvinyl alcohol (PVA) and sonicated for another 30 min. The Fe3O4@PSA-C concentrations in the composite mixture were kept at 0.25 mg/cm2, 0.5 mg/cm2, 0.75 mg/cm2 and 1 mg/cm2, respectively. Clumps of graphite sheet with an approximate contact area of 9 cm2 (3.0 cm × 3.0 cm) were washed in 1 M HCl. These pieces were sonicated for 30 min with distilled water to remove adhering particles, then rinsed multiple times using distilled water and 35% ethanol, followed by thermal treatment in a muffle furnace for over 30 min at 400 °C. A fabricated graphite sheet was submerged in the combination above of Fe-Carbon dots in a new Petri plate overnight at 60 °C to generate Fe3O4@PSA-C-modified anodes (FCDMA). A raw graphite sheet anode was made using the same procedure but without including Fe3O4@PSA-C in the solution. The redesigned anodes were heated in a hot air oven at 60 °C for 24 h. Measurement of dried anodes provided the correct surface mass deposition of Fe3O4@PSA-C mixture of raw graphite sheet.
The MFCs’ air cathodes were constructed using stainless steel (SS) wire mesh potential collectors (6 cm × 6 cm). Pt-C catalysts (0.5 mg/cm2, Sigma-Aldrich, St. Louis, MO, USA) and 33.33 L/cm2 PDMS (Polydimethylsiloxane) adhesive were combined in acetone and coated on SS wire mesh. Fabricated air cathodes were heated for 6 h at 80 °C in a muffle furnace before being stored in a desiccator for MFCs [35].

3.4. MFC Fabrication and Operation

Acrylic sheets were used to make five comparable single-chambered MFCs with a 30 mL anodic chamber size. In such MFCs, four FCDMA (with different amounts of Fe3O4@PSA-C) and a raw graphite sheet anode (reference) were utilized, with the rest of the constituents remaining the same. MFC-1, MFC-2, MFC-3, MFC-4, and MFC-5 were assigned to MFCs that used raw graphite sheet, Fe3O4@PSA-C (with 0.25 mg/cm2, 0.5 mg/cm2, 0.75 mg/cm2, and 1 mg/cm2) covered anodes, respectively. The anodic chamber and cathode of MFCs were separated by a 16 cm2 cation exchange membrane (Ultrex, Ventura, CA, USA), which allowed H+ ions to move from the anodic chamber to the air-cathode interaction junction. High-quality concealed copper wires were employed to connect the anode and cathode over a 100 Ω applied load. Shewanella putrefaciens MTCC 8104, an EAB, was used as an inoculant in the anodic chamber [36]. Twenty milliliters of inoculum was used as an inoculant in the anodic chamber of each MFC [37].Synthetic effluent containing 3 g/L sodium acetate and an adequate feeding media were supplied to the MFCs [36,38]. At the top of the anode chamber, there were two ports: one for the electrode terminal and the other for the reference electrode (Ag/AgCl, saturated KCl; +197 mV, Equiptronics, Mumbai, India) for sampling [39]. In the testing, five single-chambered MFCs with varied customized anodes were employed. However, the performance results may be trusted because the tests were done in triplicate for many feed gaps. These MFCs were kept in a batch mode with a three-day fresh eating interval at ambient temperatures varying from 33 to 37 °C.

3.5. Computation and Analysis

A digital multi-meter was utilized to record current output daily (HTC 830L). The polarisation experiment was conducted with the help of a data logger and a variable external resistance stage. The impedance ranged from 20,000 Ω to 5 Ω, and the related power was measured for at least 30 min (Agilent 34970A, Selangor Darul Ehsan, Malaysia). The power density in proportion to the expected surface area of the anode was calculated using Pd (mW/m2) = EI/A, in which E and I are voltage and current, respectively, connected to specifically applied loads, and A is the anode surface area. The inherent resistance of the MFC was calculated using the current interruption method [39].

3.6. Analyses of Improved Anodes

The physical characterization of several anodes after remodeling and during biofilm growth on the relevant anodes while performing was carried out using a scanning electron microscope (SEM, ZEISS, Oberkochen, Germany).

3.7. Electrochemical Analysis

Electrochemical methods like electrochemical impedance spectroscopy (EIS) and cyclic voltammetry were used to investigate the anodic degradation kinetics of the different anodes used. Each MFC’s platinum rod and anode were used as counter and operating electrodes in EClab electrochemical interrogations to analyze MFCs with a 3-electrode set-up. The voltage and current related to the Ag/AgCl (+197 mV vs. SHE) counter electrode w measured. The CV of the anodes was achieved by scanning the administered voltage from −1 V to +1 V at a frequency of 10 mV/s. The EIS was performed using alternating current (AC) at a rate of 100 kHz to 100 MHz and a voltage intensity of 5 mV. The EIS spectra were modeled in an analogous network to determine charge transfer resistance (Rct) and solution resistance (Rs).

4. Conclusions

The present study used carbon dots coated Iron (II, III) oxide (Fe3O4@PSA-C) as a biocompatible anode to enhance power generation in a microbial fuel cell (MFC).
The Fe3O4@PSA-C hetero-structure was synthesized by the hydrothermal-assisted probe sonication method. The C-dots synthesis process was performed using the hydro-thermal method, whereas further Fe3O4@PSA-C nanoparticle synthesis was completed using the sonochemical method. Nanoparticles were characterized with XRD, SEM, FTIR, and RAMAN Spectroscopy. The structural characterizations confirm the desired nanoparticles’ pure phase formation with crystallite sizes ranging between 10–30 nm. Different concentrations of Fe3O4@PSA-C were coated onto graphite sheets and used as anodes in a single-chambered air cathode MFC. A graphite sheet anode enhanced with a Fe3O4@PSA-C combination was used to examine the building of a more bio-compatible anode for boosting MFC efficiency. Power density in MFCs using Fe3O4@PSA-C was 1.54 times greater than in MFCs using raw graphite sheet anodes in a Shewanella -grown MFC.
The physical characterization of Fe3O4@PSA-C showed that the high surface area and several active sites were responsible for increased adhesion and low activation energy for the electroactive bacteria, thereby increasing the extracellular electron transfer. The coupling of Fe3O4 with carbon dots enhanced hydrophilicity with only a few sheets of flat Fe3O4@PSA-C, generating stronger stickiness and a broad contact surface for mi-croorganisms to cling on the anode, resulting in better anode dynamics and efficiency in MFC. As a result, an anode made of carbon-based materials coated with Fe3O4@PSA-C may be employed in MFCs to improve coulombic efficiency and collect more energy while eliminating sewage in the anode compartment. The Fe3O4@PSA-C-modified bio-anodes were shown to boost the redox peak current during CV (Figure 6a). The im-proved redox profile with modified bioanodes is thought to be owing to EAB’s intrin-sic capacity to transport electrons from its OmcC to insoluble Fe(III) metal centers of Fe3O4@PSA-C. A capacitive anode modifier may provide a capacitive bridge between the EAB and the anode, allowing the regulated passage of electrons from the EAB to the anode.
As a consequence, the larger the capacitance of the anode modifier, the better the efficiency. The various valence metal centers of Fe3O4@PSA-C may act as a redox cou-ple to link the EAB and anode interfaces. Furthermore, it is hypothesized that the con-stant interconversion of Fe(II) to Fe(III) contributes to transient electron storage through microbial or electrochemical reduction/oxidation, resulting in an increase in transient charge storage on Fe3O4@PSA-C loaded anodes. EIS analysis was used at OCP to investigate the interfacial charge transfer activity of several bioanodes [40]. Nyquist charts depict the impedance characteristics of all electrodes (Figure 5). CPE was uti-lized to analyze the varied resistive and capacitive properties of bioanodes using an equivalent circuit consisting of Rs, Rct, and Zw. The presence of Fe+3 and C-dot in re-dox active Fe3O4@PSA-C might be responsible for improved charge transfer and consequently decreased Rct (Figure 6b). The half-cell potential measurements show that at the same current, all MFCs with bare graphite sheet anodes have equivalent half-cell potentials (Figure 7b, curve with solid symbol). Thus, the discrepancies in power generation between these five MFC reactors were caused by variances in cathode potentials (Figure 6b, curve with open symbol).

Author Contributions

Conceptualization, S.P., S.C. and A.S.M.; experiment, B.T., A.S., S.P. and S.C.; writing—original draft preparation, B.T., A.S., S.S., S.P. and S.C.; writing—review, P.K.D., A.S.M., P.K.G., M.S. and R.C.S.; editing, S.C., S.P., R.C.S. and K.P.; supervision, S.C. and S.P. All authors have read and agreed to the published version of the manuscript.

Funding

Authors duly acknowledge the grant received from Sharda University seed grant project (SUSF2001/01). Authors duly acknowledge the grant received from the Life Sciences Research Board, Defense Research and Development Organization (DRDO) (File No. LSRB/81/48222/LSRB-368/BTB/2020) and Department of Science and Technology (File No. CRD/2018/000022) for the accomplishment of this work. Gratitude to Science and Engineering Research Board (SERB), File Number TAR/2019/000210, Govt. of India to accomplish the current research work.

Data Availability Statement

Not applicable.

Conflicts of Interest

The authors declare no conflict of interest.

References

  1. Logan, B.E.; Rabaey, K. Conversion of Wastes into Bioelectricity and Chemicals by Using Microbial Electrochemical Technologies. Science 2012, 337, 686–690. [Google Scholar] [CrossRef] [PubMed]
  2. Wu, R.; Tian, X.; Xiao, Y.; Ulstrup, J.; Christensen, H.E.M.; Zhao, F.; Zhang, J. Selective Electrocatalysis of Biofuel Molecular Oxidation Using Palladium Nanoparticles Generated on Shewanella Oneidensis MR-1. J. Mater. Chem. A 2018, 6, 10655–10662. [Google Scholar] [CrossRef]
  3. Rojas Flores, S.; Nazario-Naveda, R.; Betines, S.; Cruz–Noriega, M.; Cabanillas-Chirinos, L.; Valdiviezo Dominguez, F. Sugar Industry Waste for Bioelectricity Generation. Environ. Res. Eng. Manag. 2021, 77, 15–22. [Google Scholar] [CrossRef]
  4. Chou, H.-T.; Lee, H.-J.; Lee, C.-Y.; Tai, N.-H.; Chang, H.-Y. Highly Durable Anodes of Microbial Fuel Cells Using a Reduced Graphene Oxide/Carbon Nanotube-Coated Scaffold. Bioresour. Technol. 2014, 169, 532–536. [Google Scholar] [CrossRef] [PubMed]
  5. Mehdinia, A.; Ziaei, E.; Jabbari, A. Multi-Walled Carbon Nanotube/SnO2 Nanocomposite: A Novel Anode Material for Microbial Fuel Cells. Electrochim. Acta 2014, 130, 512–518. [Google Scholar] [CrossRef]
  6. Min, B.; Román, O.B.; Angelidaki, I. Importance of Temperature and Anodic Medium Composition on Microbial Fuel Cell (MFC) Performance. Biotechnol. Lett. 2008, 30, 1213–1218. [Google Scholar] [CrossRef]
  7. Torres, C.I.; Krajmalnik-Brown, R.; Parameswaran, P.; Marcus, A.K.; Wanger, G.; Gorby, Y.A.; Rittmann, B.E. Selecting Anode-Respiring Bacteria Based on Anode Potential: Phylogenetic, Electrochemical, and Microscopic Characterization. Environ. Sci. Technol. 2009, 43, 9519–9524. [Google Scholar] [CrossRef]
  8. Fan, Y.; Xu, S.; Schaller, R.; Jiao, J.; Chaplen, F.; Liu, H. Nanoparticle Decorated Anodes for Enhanced Current Generation in Microbial Electrochemical Cells. Biosens. Bioelectron. 2011, 26, 1908–1912. [Google Scholar] [CrossRef]
  9. Neethu, B.; Bhowmick, G.D.; Ghangrekar, M.M. Improving Performance of Microbial Fuel Cell by Enhanced Bacterial-Anode Interaction Using Sludge Immobilized Beads with Activated Carbon. Process. Saf. Environ. Prot. 2020, 143, 285–292. [Google Scholar] [CrossRef]
  10. Bhowmick, G.D.; Noori, M.D.T.; Das, I.; Neethu, B.; Ghangrekar, M.M.; Mitra, A. Bismuth Doped TiO2 as an Excellent Photocathode Catalyst to Enhance the Performance of Microbial Fuel Cell. Int. J. Hydrogen Energy 2018, 43, 7501–7510. [Google Scholar] [CrossRef]
  11. Ahilan, V.; Bhowmick, G.D.; Ghangrekar, M.M.; Wilhelm, M.; Rezwan, K. Tailoring Hydrophilic and Porous Nature of Polysiloxane Derived Ceramer and Ceramic Membranes for Enhanced Bioelectricity Generation in Microbial Fuel Cell. Ionics 2019, 25, 5907–5918. [Google Scholar] [CrossRef]
  12. Liu, W.; Cheng, S.; Guo, J. Anode Modification with Formic Acid: A Simple and Effective Method to Improve the Power Generation of Microbial Fuel Cells. Appl. Surf. Sci. 2014, 320, 281–286. [Google Scholar] [CrossRef]
  13. Zhang, J.; Li, J.; Ye, D.; Zhu, X.; Liao, Q.; Zhang, B. Enhanced Performances of Microbial Fuel Cells Using Surface-Modified Carbon Cloth Anodes: A Comparative Study. Int. J. Hydrogen Energy 2014, 39, 19148–19155. [Google Scholar] [CrossRef]
  14. Rajesh, P.P.; Noori, M.D.T.; Ghangrekar, M.M. Controlling Methanogenesis and Improving Power Production of Microbial Fuel Cell by Lauric Acid Dosing. Water Sci. Technol. 2014, 70, 1363–1369. [Google Scholar] [CrossRef] [PubMed]
  15. Rajesh, P.P.; Jadhav, D.A.; Ghangrekar, M.M. Improving Performance of Microbial Fuel Cell While Controlling Methanogenesis by Chaetoceros Pretreatment of Anodic Inoculum. Bioresour. Technol. 2015, 180, 66–71. [Google Scholar] [CrossRef] [PubMed]
  16. Tang, X.; Li, H.; Du, Z.; Ng, H.Y. Spontaneous Modification of Graphite Anode by Anthraquinone-2-Sulfonic Acid for Microbial Fuel Cells. Bioresour. Technol. 2014, 164, 184–188. [Google Scholar] [CrossRef]
  17. Park, D.H.; Laivenieks, M.; Guettler, M.V.; Jain, M.K.; Zeikus, J.G. Microbial Utilization of Electrically Reduced Neutral Red as the Sole Electron Donor for Growth and Metabolite Production. Appl. Env. Microbiol. 1999, 65, 2912–2917. [Google Scholar] [CrossRef]
  18. Sakdaronnarong, C.; Ittitanakam, A.; Tanubumrungsuk, W.; Chaithong, S.; Thanosawan, S.; Sinbuathong, N.; Jeraputra, C. Potential of Lignin as a Mediator in Combined Systems for Biomethane and Electricity Production from Ethanol Stillage Wastewater. Renew. Energy 2015, 76, 242–248. [Google Scholar] [CrossRef]
  19. Vishwanathan, A.S.; Aiyer, K.S.; Chunduri, L.A.A.; Venkataramaniah, K.; Siva Sankara Sai, S.; Rao, G. Carbon Quantum Dots Shuttle Electrons to the Anode of a Microbial Fuel Cell. 3 Biotech 2016, 6, 228. [Google Scholar] [CrossRef] [PubMed]
  20. Abbas, M.W.; Soomro, R.A.; Kalwar, N.H.; Zahoor, M.; Avci, A.; Pehlivan, E.; Hallam, K.R.; Willander, M. Carbon Quantum Dot Coated Fe3O4 Hybrid Composites for Sensitive Electrochemical Detection of Uric Acid. Microchem. J. 2019, 146, 517–524. [Google Scholar] [CrossRef]
  21. Wang, H.; Wei, Z.; Matsui, H.; Zhou, S. Fe3O4/Carbon Quantum Dots Hybrid Nanoflowers for Highly Active and Recyclable Visible-Light Driven Photocatalyst. J. Mater. Chem. A 2014, 2, 15740–15745. [Google Scholar] [CrossRef]
  22. Chauhan, S.; Kumar, M.; Yousuf, A.; Rathi, P.; Sahni, M.; Singh, S. Effect of Na/Co Co-Substituted on Structural, Magnetic, Optical and Photocatalytic Properties of BiFeO3 Nanoparticles. Mater. Chem. Phys. 2021, 263, 124402. [Google Scholar] [CrossRef]
  23. Lemine, O.M. Transformation of Goethite to Hematite Nanocrystallines by High Energy Ball Milling. Adv. Mater. Sci. Eng. 2014, 2014, e589146. [Google Scholar] [CrossRef]
  24. Periyasamy, M.; Sain, S.; Sengupta, U.; Mandal, M.; Mukhopadhyay, S.; Kar, A. Bandgap Tuning of Photo Fenton-like Fe3O4/C Catalyst through Oxygen Vacancies for Advanced Visible Light Photocatalysis. Mater. Adv. 2021, 2, 4843–4858. [Google Scholar] [CrossRef]
  25. Wang, L.; Zhou, H.S. Green Synthesis of Luminescent Nitrogen-Doped Carbon Dots from Milk and Its Imaging Application. Anal. Chem. 2014, 86, 8902–8905. [Google Scholar] [CrossRef]
  26. Ahmadian-Fard-Fini, S.; Salavati-Niasari, M.; Ghanbari, D. Hydrothermal Green Synthesis of Magnetic Fe3O4-Carbon Dots by Lemon and Grape Fruit Extracts and as a Photoluminescence Sensor for Detecting of E. Coli Bacteria. Spectrochim. Acta A Mol. Biomol. Spectrosc. 2018, 203, 481–493. [Google Scholar] [CrossRef]
  27. Kumar, G.G.; Sarathi, V.G.S.; Nahm, K.S. Recent Advances and Challenges in the Anode Architecture and Their Modifications for the Applications of Microbial Fuel Cells. Biosens. Bioelectron. 2013, 43, 461–475. [Google Scholar] [CrossRef]
  28. Fricke, K.; Harnisch, F.; Schröder, U. On the Use of Cyclic Voltammetry for the Study of Anodic Electron Transfer in Microbial Fuel Cells. Energy Environ. Sci. 2008, 1, 144–147. [Google Scholar] [CrossRef]
  29. Xu, Y.; Bai, H.; Lu, G.; Li, C.; Shi, G. Flexible Graphene Films via the Filtration of Water-Soluble Noncovalent Functionalized Graphene Sheets. J. Am. Chem. Soc. 2008, 130, 5856–5857. [Google Scholar] [CrossRef]
  30. Baranitharan, E.; Khan, M.R.; Prasad, D.M.R.; Teo, W.F.A.; Tan, G.Y.A.; Jose, R. Effect of Biofilm Formation on the Performance of Microbial Fuel Cell for the Treatment of Palm Oil Mill Effluent. Bioprocess. Biosyst. Eng. 2015, 38, 15–24. [Google Scholar] [CrossRef] [Green Version]
  31. Yuan, Y.; Zhou, S.; Zhao, B.; Zhuang, L.; Wang, Y. Microbially-Reduced Graphene Scaffolds to Facilitate Extracellular Electron Transfer in Microbial Fuel Cells. Bioresour. Technol. 2012, 116, 453–458. [Google Scholar] [CrossRef] [PubMed]
  32. Pandit, S.; Khilari, S.; Roy, S.; Ghangrekar, M.M.; Pradhan, D.; Das, D. Reduction of Start-up Time through Bioaugmentation Process in Microbial Fuel Cells Using an Isolate from Dark Fermentative Spent Media Fed Anode. Water Sci. Technol. 2015, 72, 106–115. [Google Scholar] [CrossRef] [PubMed]
  33. Zhou, M.; Chi, M.; Luo, J.; He, H.; Jin, T. An Overview of Electrode Materials in Microbial Fuel Cells. J. Power Sources 2011, 196, 4427–4435. [Google Scholar] [CrossRef]
  34. Neto, D.M.A.; Freire, R.M.; Gallo, J.; Freire, T.M.; Queiroz, D.C.; Ricardo, N.M.P.S.; Vasconcelos, I.F.; Mele, G.; Carbone, L.; Mazzetto, S.E.; et al. Rapid Sonochemical Approach Produces Functionalized Fe3O4 Nanoparticles with Excellent Magnetic, Colloidal, and Relaxivity Properties for MRI Application. J. Phys. Chem. C 2017, 121, 24206–24222. [Google Scholar] [CrossRef]
  35. Khilari, S.; Pandit, S.; Ghangrekar, M.M.; Das, D.; Pradhan, D. Graphene Supported α-MnO 2 Nanotubes as a Cathode Catalyst for Improved Power Generation and Wastewater Treatment in Single-Chambered Microbial Fuel Cells. RSC Adv. 2013, 3, 7902–7911. [Google Scholar] [CrossRef]
  36. Panda, J.; Chowdhury, R. Growth Kinetic Study of Electrochemically Active Bacterium Shewanella Putrefaciens MTCC 8104 on Acidic Effluent of Jute Stick Pyrolysis. Indian Chem. Eng. 2021, 63, 193–205. [Google Scholar] [CrossRef]
  37. More, T.T.; Ghangrekar, M.M. Improving Performance of Microbial Fuel Cell with Ultrasonication Pre-Treatment of Mixed Anaerobic Inoculum Sludge. Bioresour. Technol. 2010, 101, 562–567. [Google Scholar] [CrossRef]
  38. Behera, M.; Ghangrekar, M.M. Performance of Microbial Fuel Cell in Response to Change in Sludge Loading Rate at Different Anodic Feed PH. Bioresour. Technol. 2009, 100, 5114–5121. [Google Scholar] [CrossRef]
  39. Pandit, S.; Khilari, S.; Roy, S.; Pradhan, D.; Das, D. Improvement of Power Generation Using Shewanella Putrefaciens Mediated Bioanode in a Single Chambered Microbial Fuel Cell: Effect of Different Anodic Operating Conditions. Bioresour. Technol. 2014, 166, 451–457. [Google Scholar] [CrossRef]
  40. Khilari, S.; Pandit, S.; Varanasi, J.L.; Das, D.; Pradhan, D. Bifunctional Manganese Ferrite/Polyaniline Hybrid as Electrode Material for Enhanced Energy Recovery in Microbial Fuel Cell. ACS Appl. Mater. Interfaces 2015, 7, 20657–20666. [Google Scholar] [CrossRef]
Figure 1. XRD patterns for (a) C-dots (b) Fe3O4@PSA-C and Fe3O4@PSA nanoparticles.
Catalysts 12 01040 g001
Figure 2. SEM graph for (a) Fe3O4@PSA, (b) Fe3O4@PSA-C nanoparticles, (c) EDX mapping of Fe3O4@PSA and (d) EDX mapping of Fe3O4@PSA-C, (e) SEM images of Fe3O4@PSA-C nanoparticles with grain size nanoparticles.
Catalysts 12 01040 g002
Figure 3. FTIR spectra of C-dots; Fe3O4@PSA-C and Fe3O4@PSA nanoparticles.
Catalysts 12 01040 g003
Figure 4. Raman spectra of C-dots; Fe3O4@PSA-Cdots and Fe3O4@PSA nanoparticles.
Catalysts 12 01040 g004
Figure 5. The plot (αhν)2 vs. hν represents the energy bandgap (Eg) of the Fe3O4 and Fe3O4@PSA-C nanoparticles.
Catalysts 12 01040 g005
Figure 6. (a) Cyclic Voltammetry analysis of all five MFCs; (b) Nyquist plot of operational MFCs.
Catalysts 12 01040 g006
Figure 7. (a) Polarization study of unaltered and Fe3O4@PSA-C altered anode; the power density and voltage data points are presented as solid and open symbols, respectively. (b) Anode and cathode half-cell analysis to understand the variation in anode after modification with Fe3O4@PSA-C. Open and solid symbols represent cathode and anode half-cell voltages, respectively.
Catalysts 12 01040 g007
Figure 8. The synthesis process of C-dots; Fe3O4@PSA-C and Fe3O4@PSA samples using the Hydrothermal assisted chemical sonication method.
Catalysts 12 01040 g008
Table 1. Comparison of different quantities of Fe3O4@PSA-C (0.25, 0.50, 0.75, and 1 mg/cm2) in the anode with the standard graphite sheet.
MFC Serial No.AnodeOCV (mV)PD (mW/m2)Charge Transfer Resistance, Rct (Ohm)
MFC-1Raw graphite sheet701285.01230
MFC-2Fe3O4@PSA-C modified anode (0.25 mg/cm2)726334.41164.46
MFC-3Fe3O4@PSA-C modified anode (0.50 mg/cm2)746379.56103.14
MFC-4Fe3O4@PSA-C modified anode (0.75 mg/cm2)765420.3352.96
MFC-5Fe3O4@PSA-C modified anode (1 mg/cm2)771440.0133.45
Table 2. Specification and content of Amul cow milk.
Packaging TypePoly Packet
BrandAmul
Serving Size200 mL/100 mL
Amount per100 mL/100 mL
Energy62 Kcal/100 mL
Energy from FAT32 Kcal/100 mL
Total FAT3.5 g/100 mL
Saturated FAT2.3 g/100 mL
Cholesterol8 mg/100 mL
Total Carbohydrate4.7 g/100 mL
Pack Size500 mL
Publisher’s Note: MDPI stays neutral with regard to jurisdictional claims in published maps and institutional affiliations.

