Article

Photo-Oxidation of Glycerol Catalyzed by Cu/TiO2

by
Osmín Avilés-García
1,
Arisbeht Mendoza-Zepeda
1,
Alejandro Regalado-Méndez
2,
Jaime Espino-Valencia
3,
Sandra L. Martínez-Vargas
1,
Rubi Romero
1 and
Reyna Natividad
1,*
1
Chemical Engineering Laboratory, Centro Conjunto de Investigación en Química Sustentable, UAEM-UNAM, Universidad Autónoma del Estado de México, km 14.5 Toluca-Atlacomulco Road, Toluca 50200, Mexico, Mexico
2
Research Laboratories, Campus Puerto Ángel, Universidad del Mar, Puerto Ángel 70902, Oaxaca, Mexico
3
Chemical Engineering Faculty, Universidad Michoacana de San Nicolás de Hidalgo, Edif. V1, Ciudad Universitaria, Morelia 58060, Michoacán, Mexico
*
Author to whom correspondence should be addressed.
Catalysts 2022, 12(8), 835; https://doi.org/10.3390/catal12080835
Submission received: 19 May 2022 / Revised: 20 July 2022 / Accepted: 27 July 2022 / Published: 29 July 2022
(This article belongs to the Special Issue 10th Anniversary of Catalysts—Feature Papers in Photocatalysis)

Abstract

:
In the present study, glycerol was oxidized by photocatalysis to glyceraldehyde, formaldehyde, and formic acid. Copper-doped TiO2 was synthesized by the evaporation-induced self-assembly approach and it was used as catalyst during the glycerol photo-oxidation reactions. The prepared mesoporous material exhibited high specific surface area (242 m2/g) and band gap energy reduction of 2.55 eV compared to pure titania (3.2 eV) by the synthesis method due to the presence of copper cations (Cu2+ identified by XPS). The catalyst showed only anatase crystalline phase with nanocrystals around 8 nm and irregular agglomerates below 100 μm. The selectivity and formation rate of the products were favored towards formaldehyde and glyceraldehyde. The variables studied were catalyst amount, reaction temperature, and initial glycerol concentration. The response surface analysis was used to evaluate the effect of the variables on the product’s concentration. The optimized conditions were 0.4 g/L catalyst, 0.1 mol/L glycerol, and temperature 313.15 K. The response values under optimal conditions were 3.23, 8.17, and 1.15 mM for glyceraldehyde, formaldehyde, and formic acid, respectively. A higher selectivity towards formaldehyde was observed when visible light was used as the radiation source. This study is useful to evaluate the best reaction conditions towards value-added products during the oxidation of glycerol by photocatalysis using Cu/TiO2.

1. Introduction

Biodiesel is a widely used energy alternative because it is environmentally friendly compared to fossil fuels. However, the production of biodiesel generates a large amount of glycerol as the main waste byproduct in the triglyceride transesterification reaction [1], with an approximate formation weight ratio of 1:20 [2]. It is for this reason that interest in glycerol has increased towards its conversion into value-added products [3]. Selective oxidation of glycerol is a commonly used reaction for its conversion to chemicals of interest, such as dihydroxyacetone, glyceraldehyde, formaldehyde, and various acids (formic, glyceric, glycolic, oxalic, among others) [4,5].
Among the processes that have been carried out for the oxidation of glycerol are with heterogeneous [6] and homogeneous [7] catalysts, and microbial [8] and electrochemical [9] oxidation. Heterogeneous photocatalysis has been used as an alternative in the selective conversion of glycerol towards certain products of interest, because the reactions are performed under moderate conditions with relatively low energy consumption, using different types of solid catalysts such as ZnO, Bi2WO6, Pt/CNT, and TiO2 [10,11,12,13]. Titanium dioxide is the most widely used semiconductor due to its excellent properties (low cost and toxicity, abundant, thermal, and chemical stability) [14,15]. The incorporation of metallic and non-metallic species in TiO2 in order to improve its photocatalytic performance has been approached by several investigations to extend its absorption spectrum and/or to reduce the recombination of the photogenerated electron/hole pairs [16,17]. Although most research has focused on the production of hydrogen from glycerol [18,19,20], the generation of products with industrial importance has been neglected. Furthermore, although photocatalysis is an advanced oxidation process, it can also be used to carry out partial oxidations of organic molecules towards certain compounds of interest. Table 1 summarizes the existing literature focused on the selective oxidation of glycerol by photocatalysis using pure TiO2 and metal/TiO2 as catalysts, the applied reaction conditions, and the relevant results regarding selectivity.
Among the compounds obtained from the partial oxidation of glycerol (see Table 1), dihydroxyacetone, glyceraldehyde, glycolaldehyde, formaldehyde, and formic acid are considered chemicals with wide applications. Dihydroxyacetone is used as tanning compound in the cosmetics industry, as well as in the polymer industry as a monomer in the manufacture of biomaterials [26]. Glyceraldehyde is used in the skin care products industry [27]. Glycolaldehyde is the smallest molecule containing one hydroxyl group and one aldehyde group, which can be easily hydrogenated into value-added chemicals such as ethylene glycol under moderate reaction conditions [13]. Other expected products are formaldehyde and formic acid. Formaldehyde is widely used as a bactericide and a preservative of biological samples [28]. Formic acid is used in the leather industry and in agriculture [29]. Therefore, the generation of these compounds is of great industrial importance. As observed in Table 1, the main obtained product and selectivity of the photocatalyzed glycerol oxidation varies according to type of catalyst, which also dictates the wavelength to conduct this reaction (100 to 600 nm).
In this work, TiO2 doped with Cu cations was synthesized by the EISA (Evaporation-Induced Self-Assembly) method [30] and its photocatalytic performance was evaluated in the selective oxidation reaction of glycerol towards value-added products. Until now, no study using TiO2 doped only with copper species and evaluated during the partial oxidation of glycerol has been reported [31,32]. Initial glycerol concentration, amount of catalyst, and temperature were the variables studied in order to obtain the best reaction conditions. The response surface methodology [33] was used to optimize the effect of the independent variables on the concentration of the products.

2. Results and Discussion

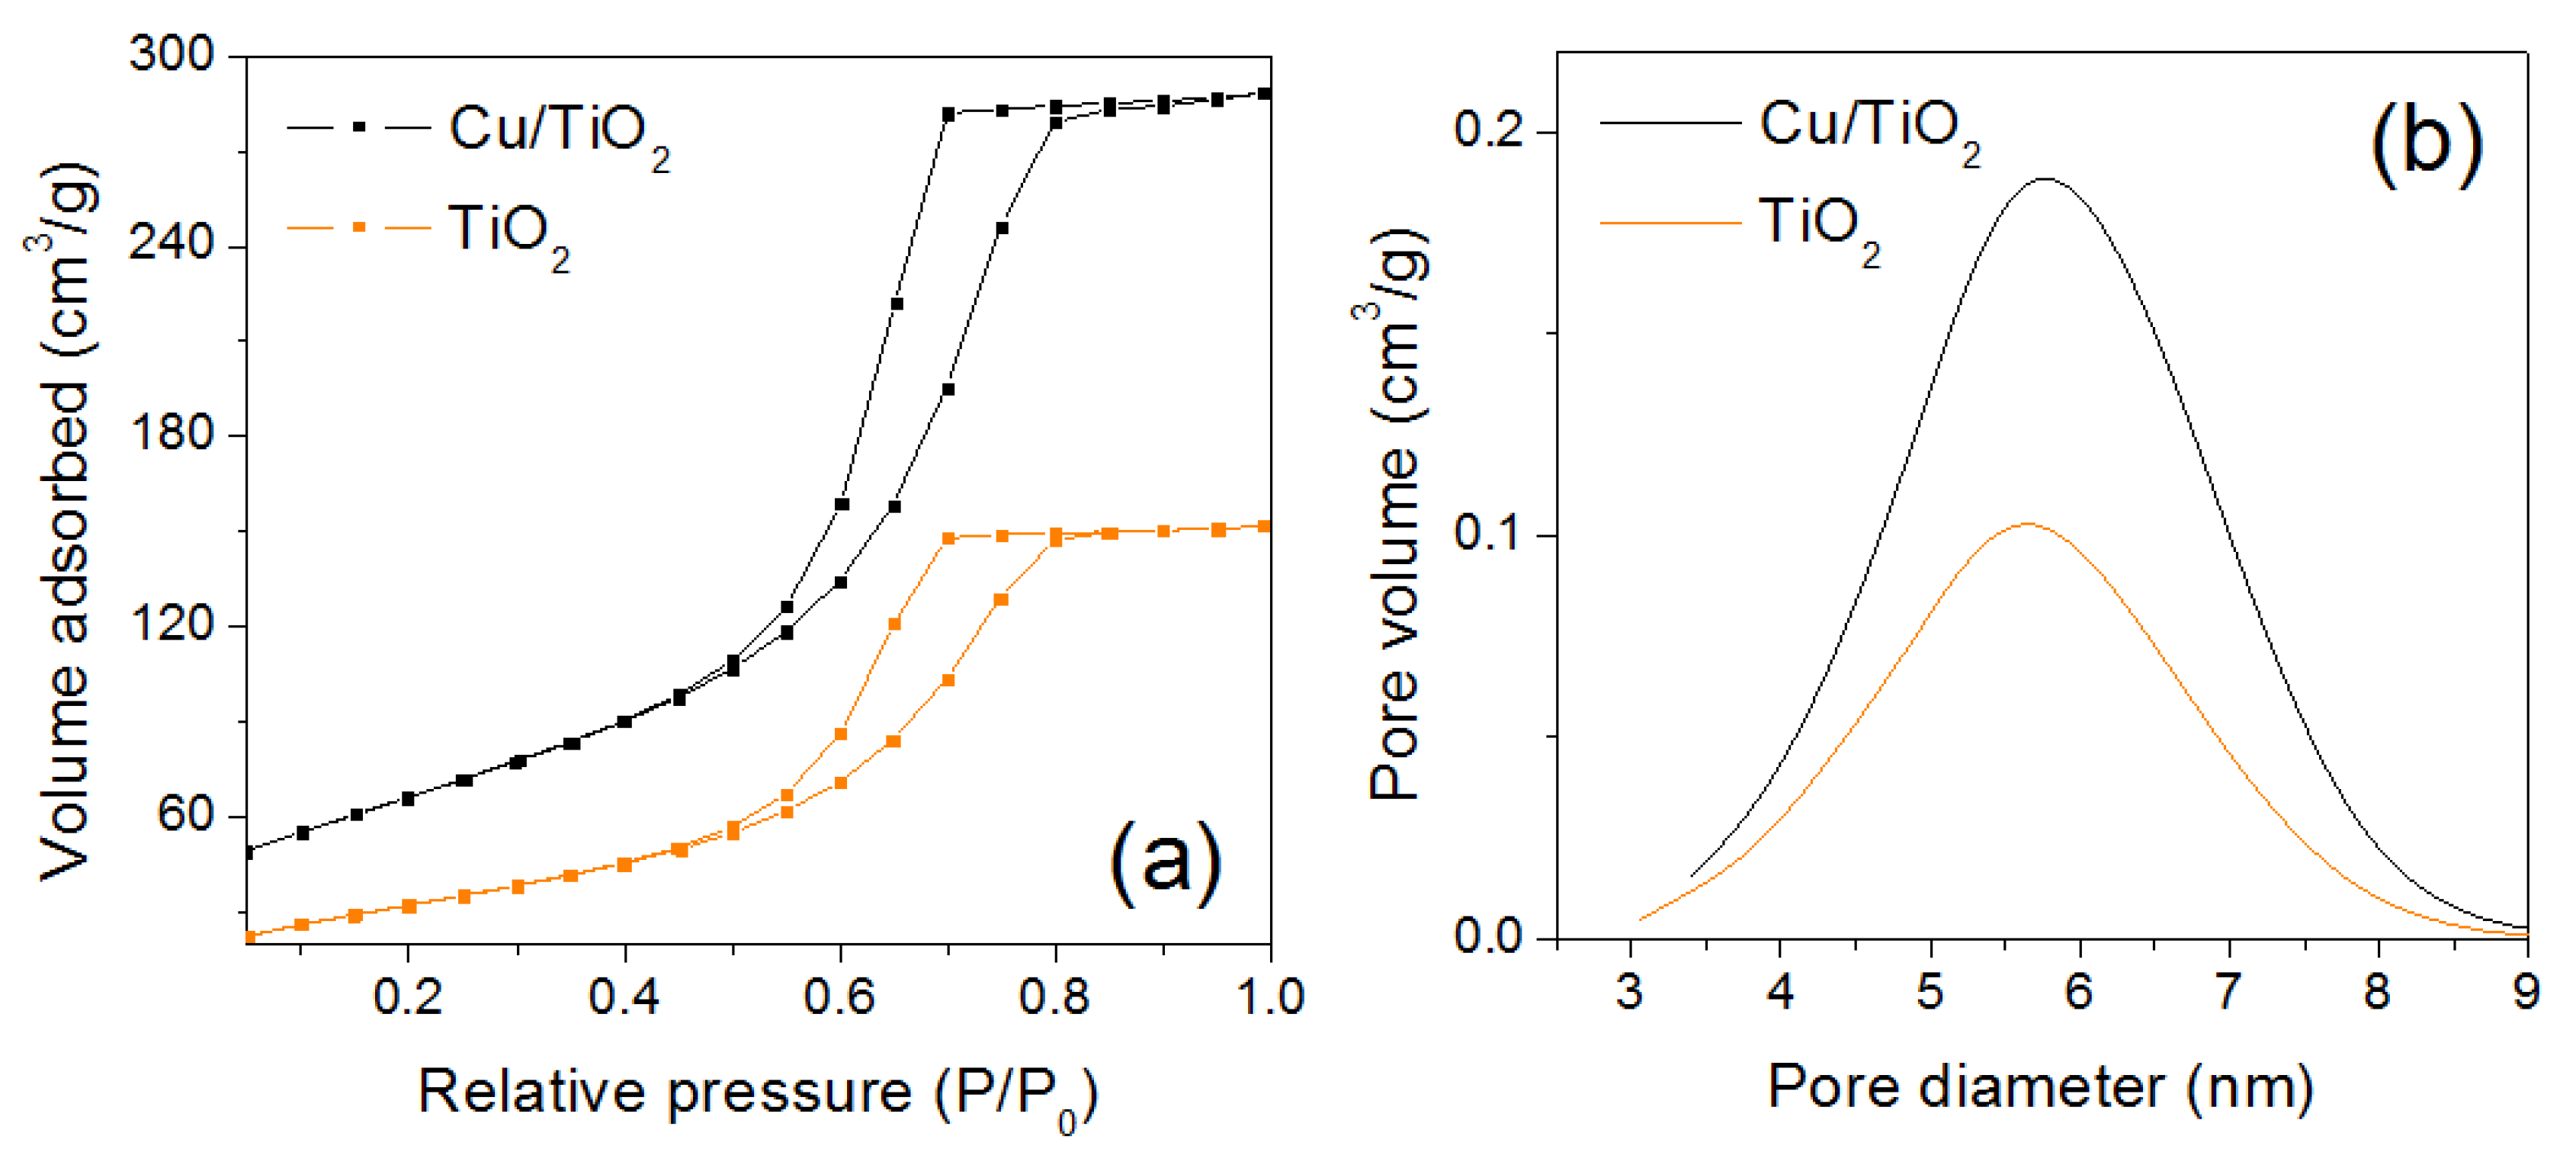
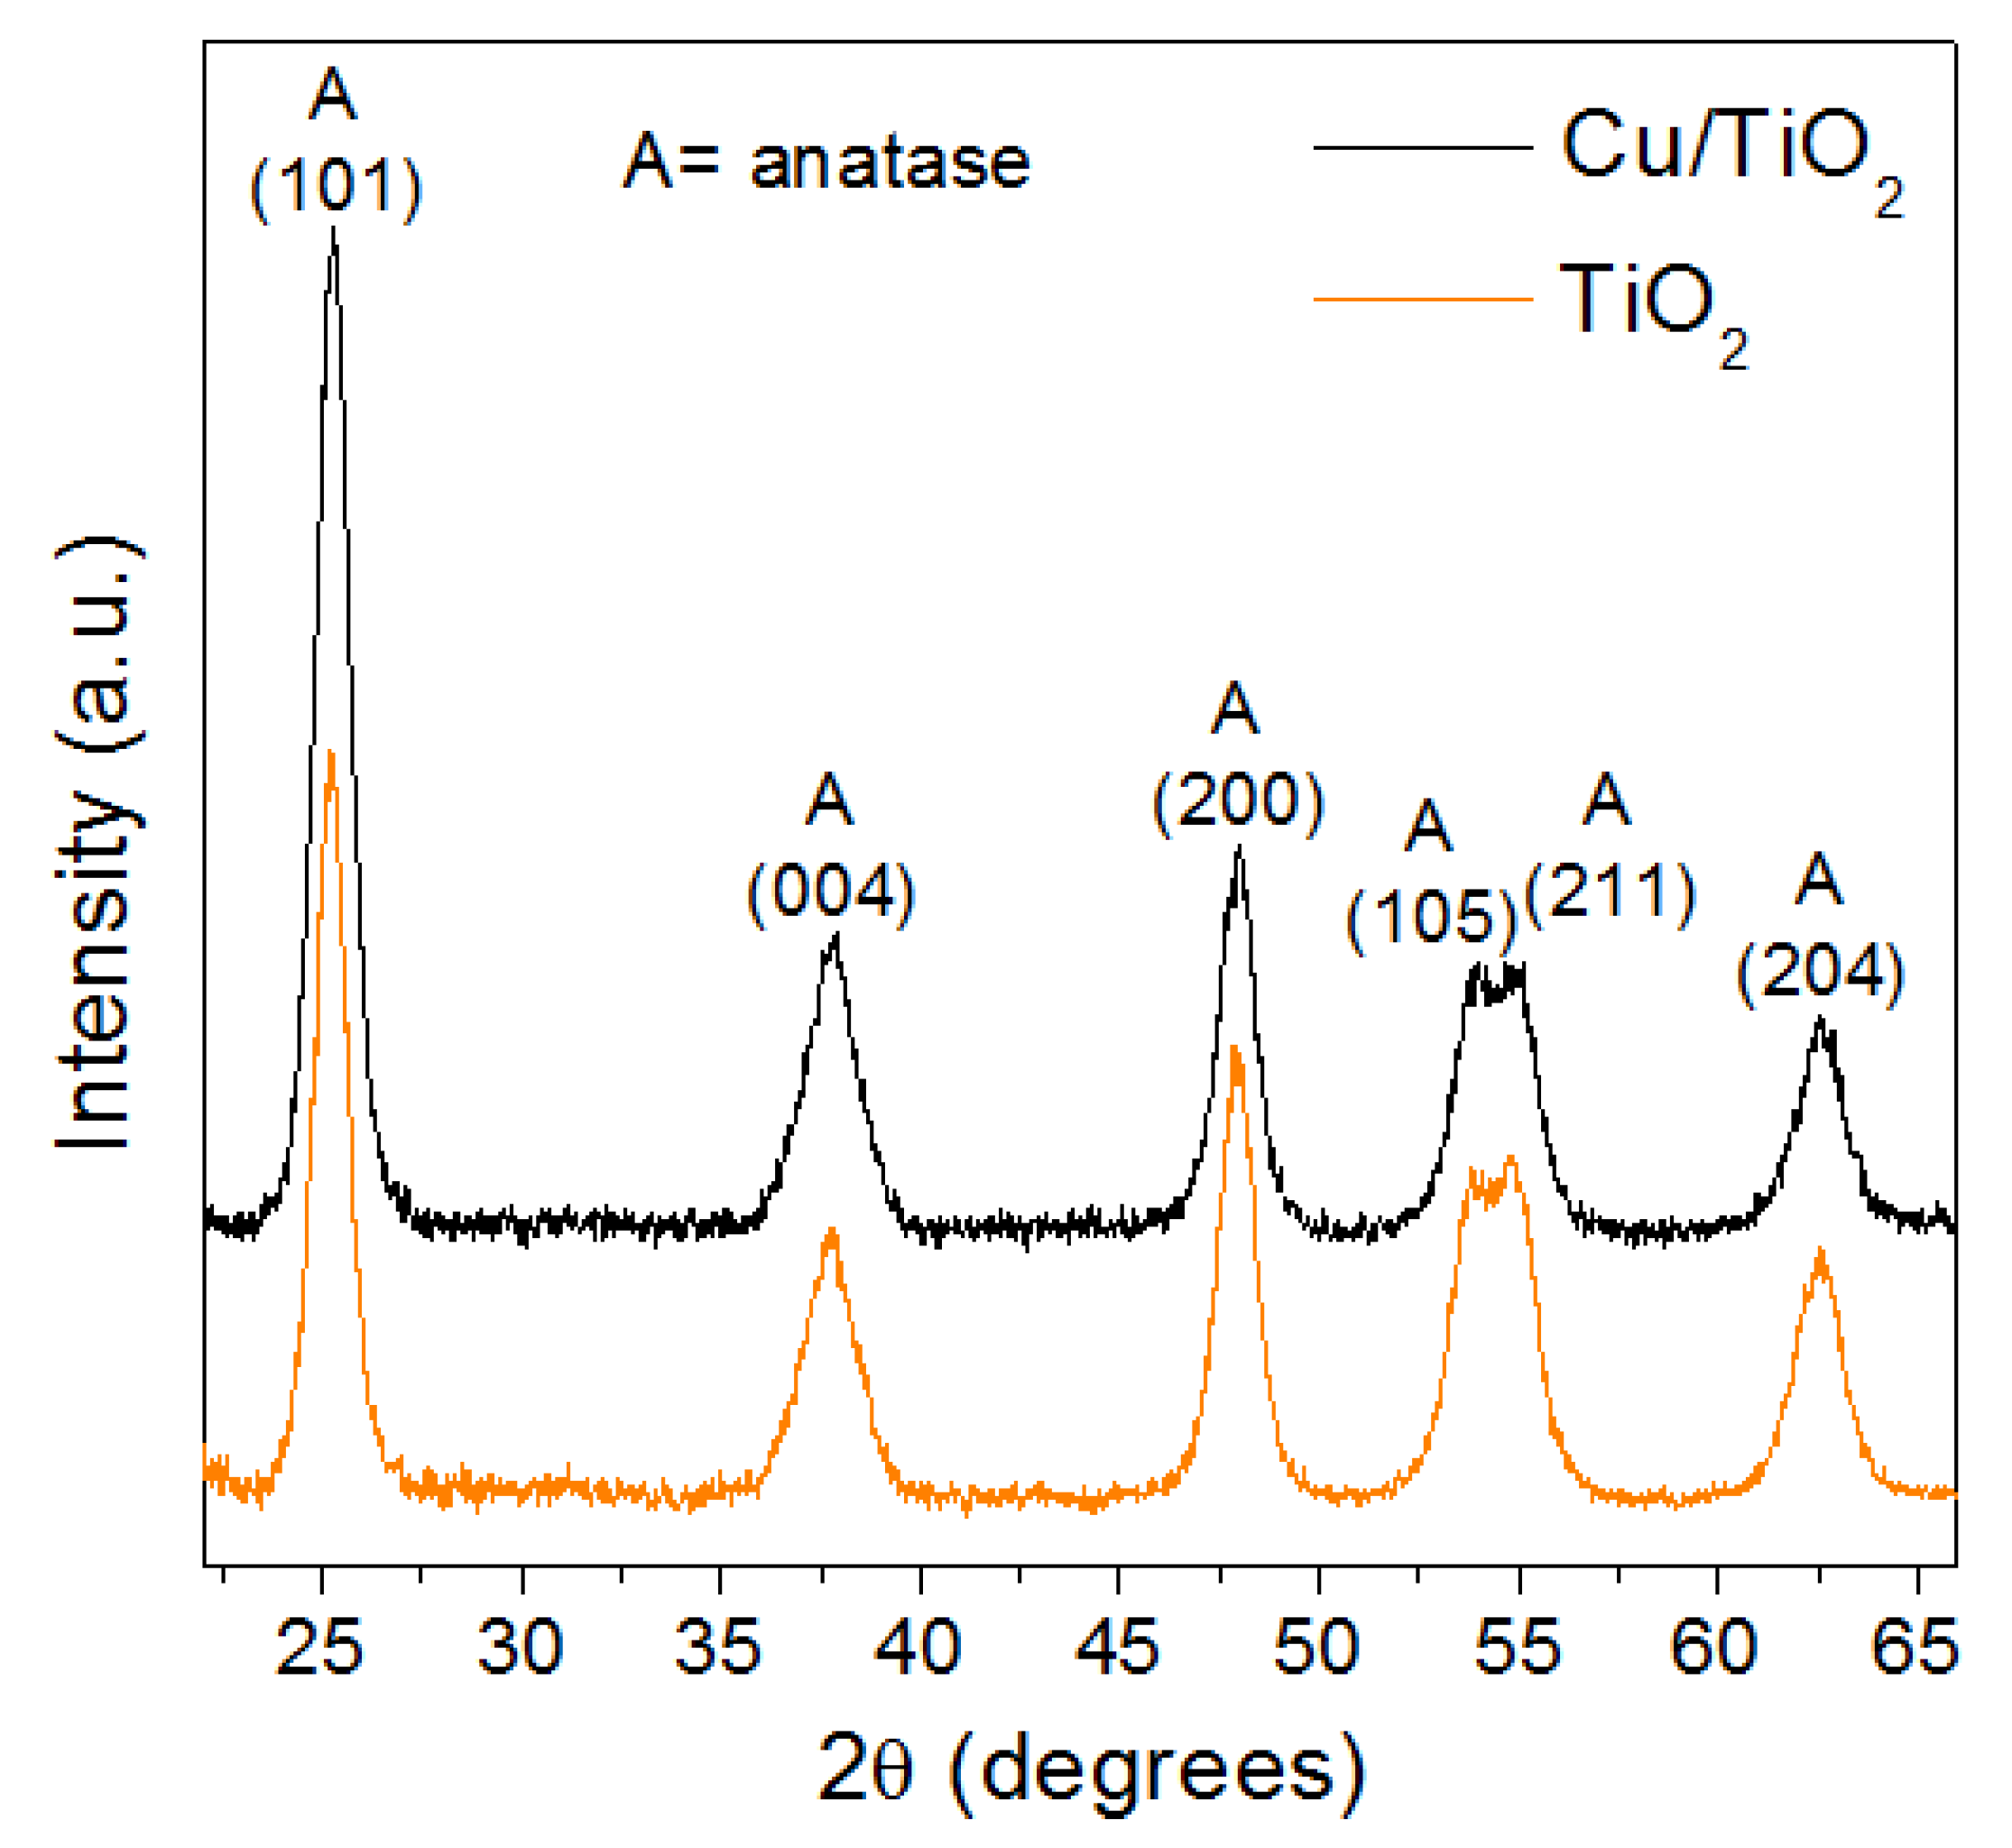
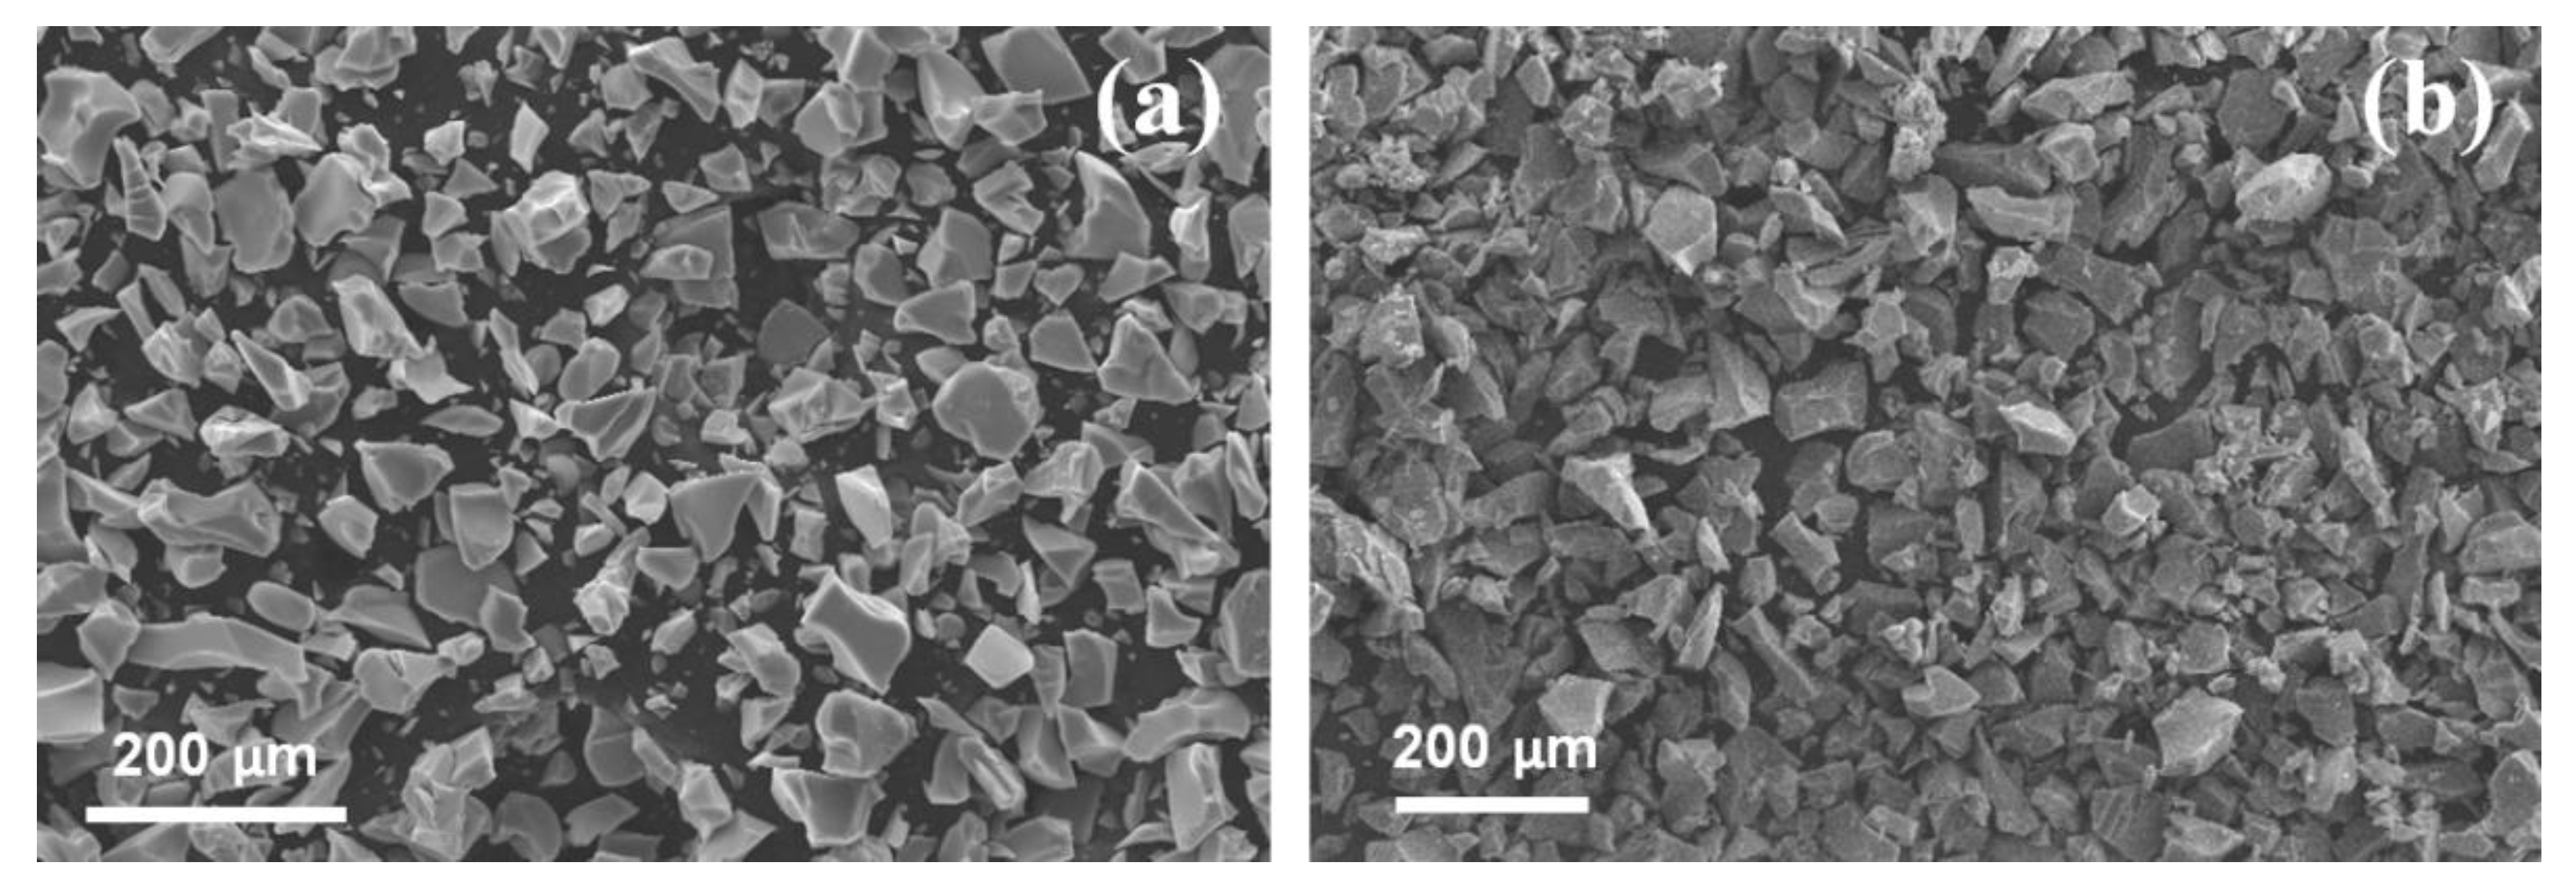
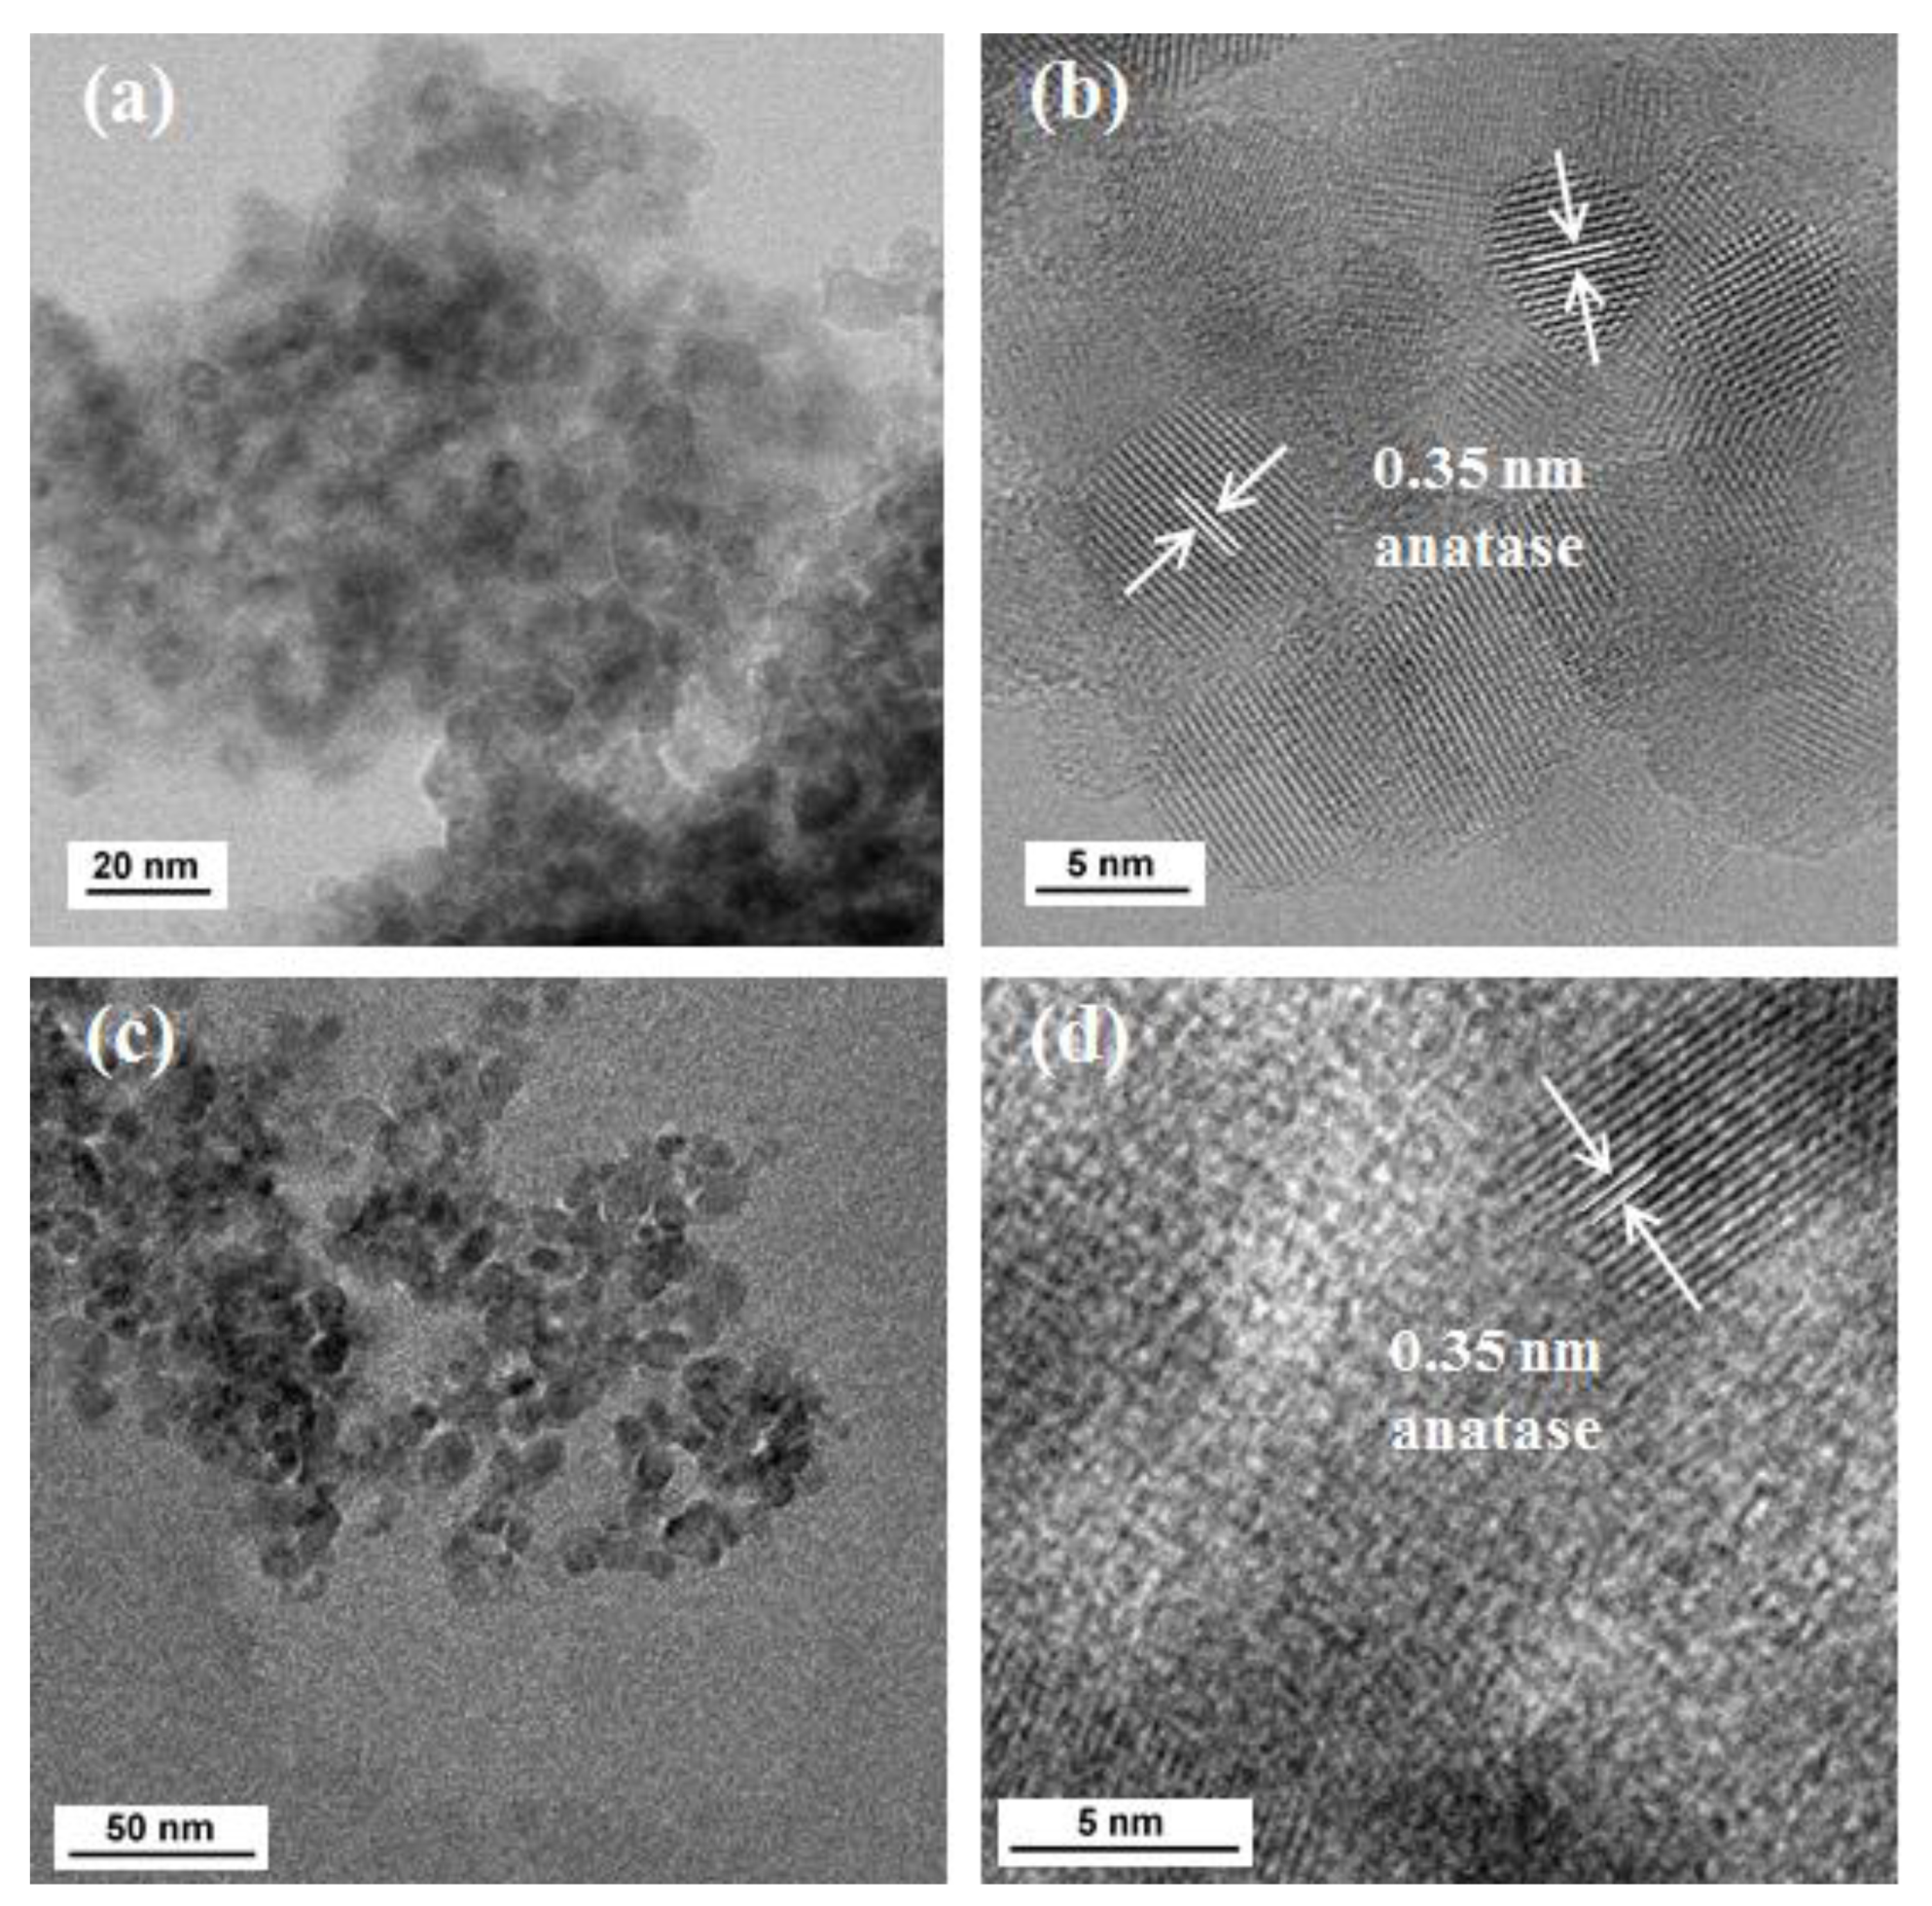
2.1. Characterization

The textural properties of the synthesized Cu/TiO2 and TiO2 catalysts are shown in Table 2. By nitrogen adsorption-desorption, it was observed that the incorporation of copper species into the TiO2 structure increased the specific surface area and the pore volume with respect to the pure TiO2 catalyst. The Cu/TiO2 sample exhibited twice the surface area than that obtained with the pure TiO2 material, and the pore volume increased from 0.26 to 0.48 cm3/g, which can be attributed to structural defects in the titania due to the presence of Cu cations [34]. The average pore diameter remained constant at 5.7 nm in both catalysts. High textural properties can promote better catalytic activity, since more organic molecules can be adsorbed [35].
Isotherms and pore size distributions of the synthesized materials are shown in Figure 1. The samples presented unimodal pore diameters with type IV isotherms and type H2 hysteresis cycles (relative pressure values between 0.5 and 0.9), which is characteristic of mesoporous materials forming a structure of interconnected pores [36]. The saturation point adsorption band for the Cu/TiO2 sample is higher compared to that of the TiO2 sample, which corresponds to a higher surface area, as can be seen in Figure 1a.
Figure 2 shows the X-ray diffraction patterns of the synthesized catalysts. As can be seen, the materials exhibited only characteristic peaks of the anatase TiO2 crystalline phase corresponding to the planes (101), (004), (200), (105), (211), and (204), which are located at 2θ values of 25.29°, 37.94°, 47.97°, 53.91°, 55.03°, and 62.65°, respectively [37]. Copper species can be present in the Cu/TiO2 catalysts as Cu2+, based on the used synthesis method [38], these species were later confirmed by XPS. These species exhibit ionic radii (0.072 nm) very similar to those of the Ti4+ species (0.068 nm) that are part of TiO2 and they are probably well dispersed within the structure of anatase crystals [39], so that no peak with respect to copper oxides was observed (see Figure 2). On the other hand, a slight shift in the position of the (101) anatase peak towards higher 2θ values is related to the crystal lattice distortion by Cu species, which reduces crystal growth [40]. As can be seen in Table 3, the addition of Cu cations in the titania reduces the average crystalline size from 8.22 nm to 7.98 nm, and an increase in the lattice distortion can be observed. The copper content in the catalyst, determined by atomic absorption spectroscopy, was 3.8 wt.%, as can be seen in Table 3. This value is in good agreement with the theoretical value of 3.9 wt.%. Energy dispersive spectroscopy analysis was also carried out and showed a value of 3.75 wt.% Cu (see Figure S1).
Images of catalysts Cu/TiO2 and TiO2 obtained by SEM are depicted in Figure 3. As can be seen, both materials exhibit particles with irregular shapes and sizes ranging from 30 to 100 μm. This type of morphology is similar when compared to other investigations using the same synthesis methodology [41].
Transmission electron micrographs (TEM) and high-resolution transmission electron micrographs (HRTEM) for the synthesized catalysts are shown in Figure 4. Both materials, Cu/TiO2 and TiO2, exhibit crystalline structures of irregular shapes and sizes between 7 and 10 nm, as can be seen in Figure 4a,c, which is in agreement with the XRD analyses during the estimation of the average anatase crystal size. HRTEM images shown in Figure 4b,d exhibit parallel lines that are related to the distance “d” between two planes (101) of anatase at a value of 0.35 nm [42], which is the preferential growth direction of the crystals. These images confirm the high crystallinity and well-defined structures of the catalysts.
The band-gap energies of the synthesized materials were determined by DRS analysis (see Table 2). The estimation of these values was carried out using the Kubelka–Munk function in Tauc graphs, as can be seen in Figure 5. The estimated value for the TiO2 sample was 3.24 eV, which is in agreement with the reported band-gap value of anatase at 3.2 eV [43]. When copper is incorporated into TiO2, the band-gap value is reduced to 2.54 eV, which is related to charge transfers between the “3d” and “2p” orbitals of copper and oxygen, respectively, just below the conduction band of the semiconductor [44]. The band-gap energy corresponds to the energy required to excite the semiconductor and thus be able to generate the electron/hole pairs responsible for the photocatalytic performance.
By means of X-ray photoelectron spectroscopy (XPS) analysis, the oxidation state of the species on the surface of the Cu/TiO2 catalyst were established. Figure 6a shows the XPS spectra for Ti 2p with peaks for Ti 2p1/2 and Ti 2p3/2 at 264.2 eV and 258.6 eV, respectively, assigned to Ti4+ [41]. Figure 6b shows the XPS spectra for O 1s with two contributions at 532.2 eV and 530.7 eV, assigned to surface oxygen (O-H) and oxygen into the TiO2 lattice (O-Ti), respectively [45]. Figure 6c shows the XPS spectra for Cu 2p with two peaks at binding energies of 950 eV and 933 eV assigned to the Cu 2p1/2 and Cu 2p3/2 states, respectively, which correspond to Cu2+ species forming Cu-O-Ti bonds [38].

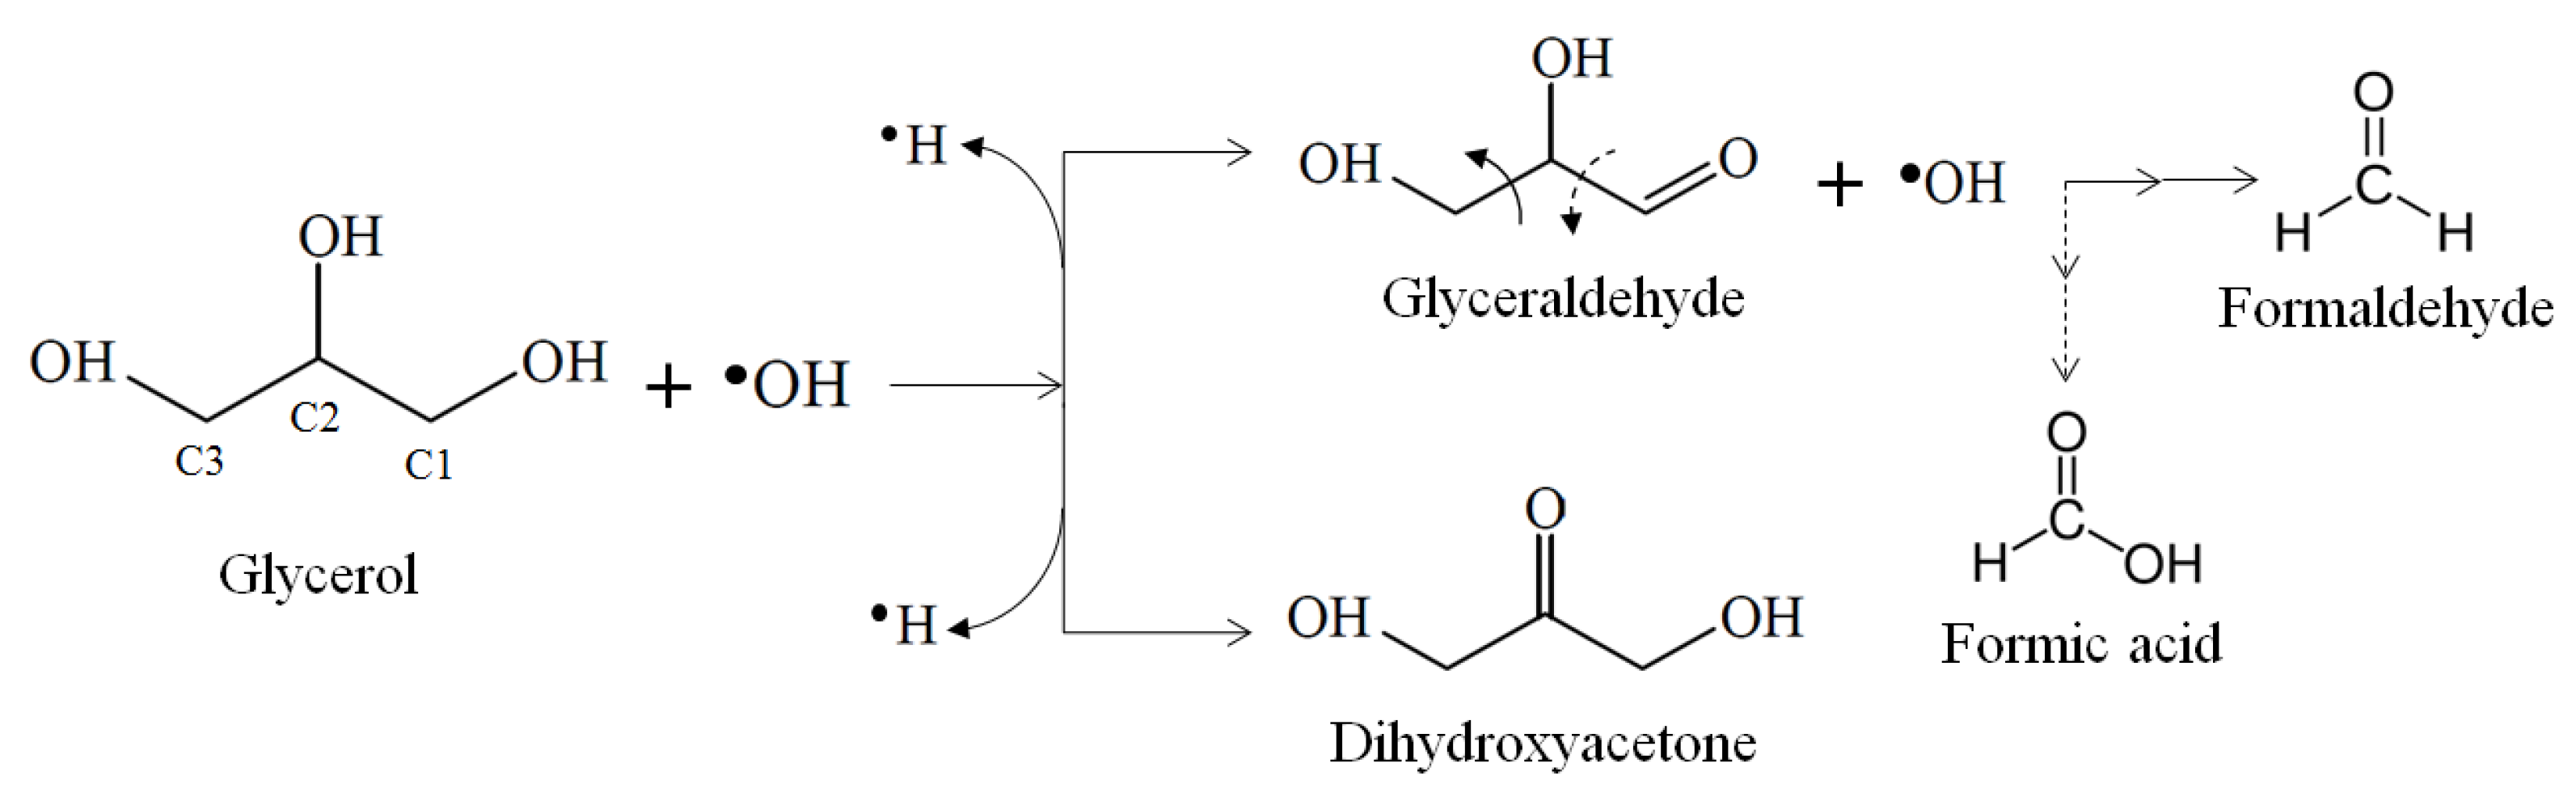
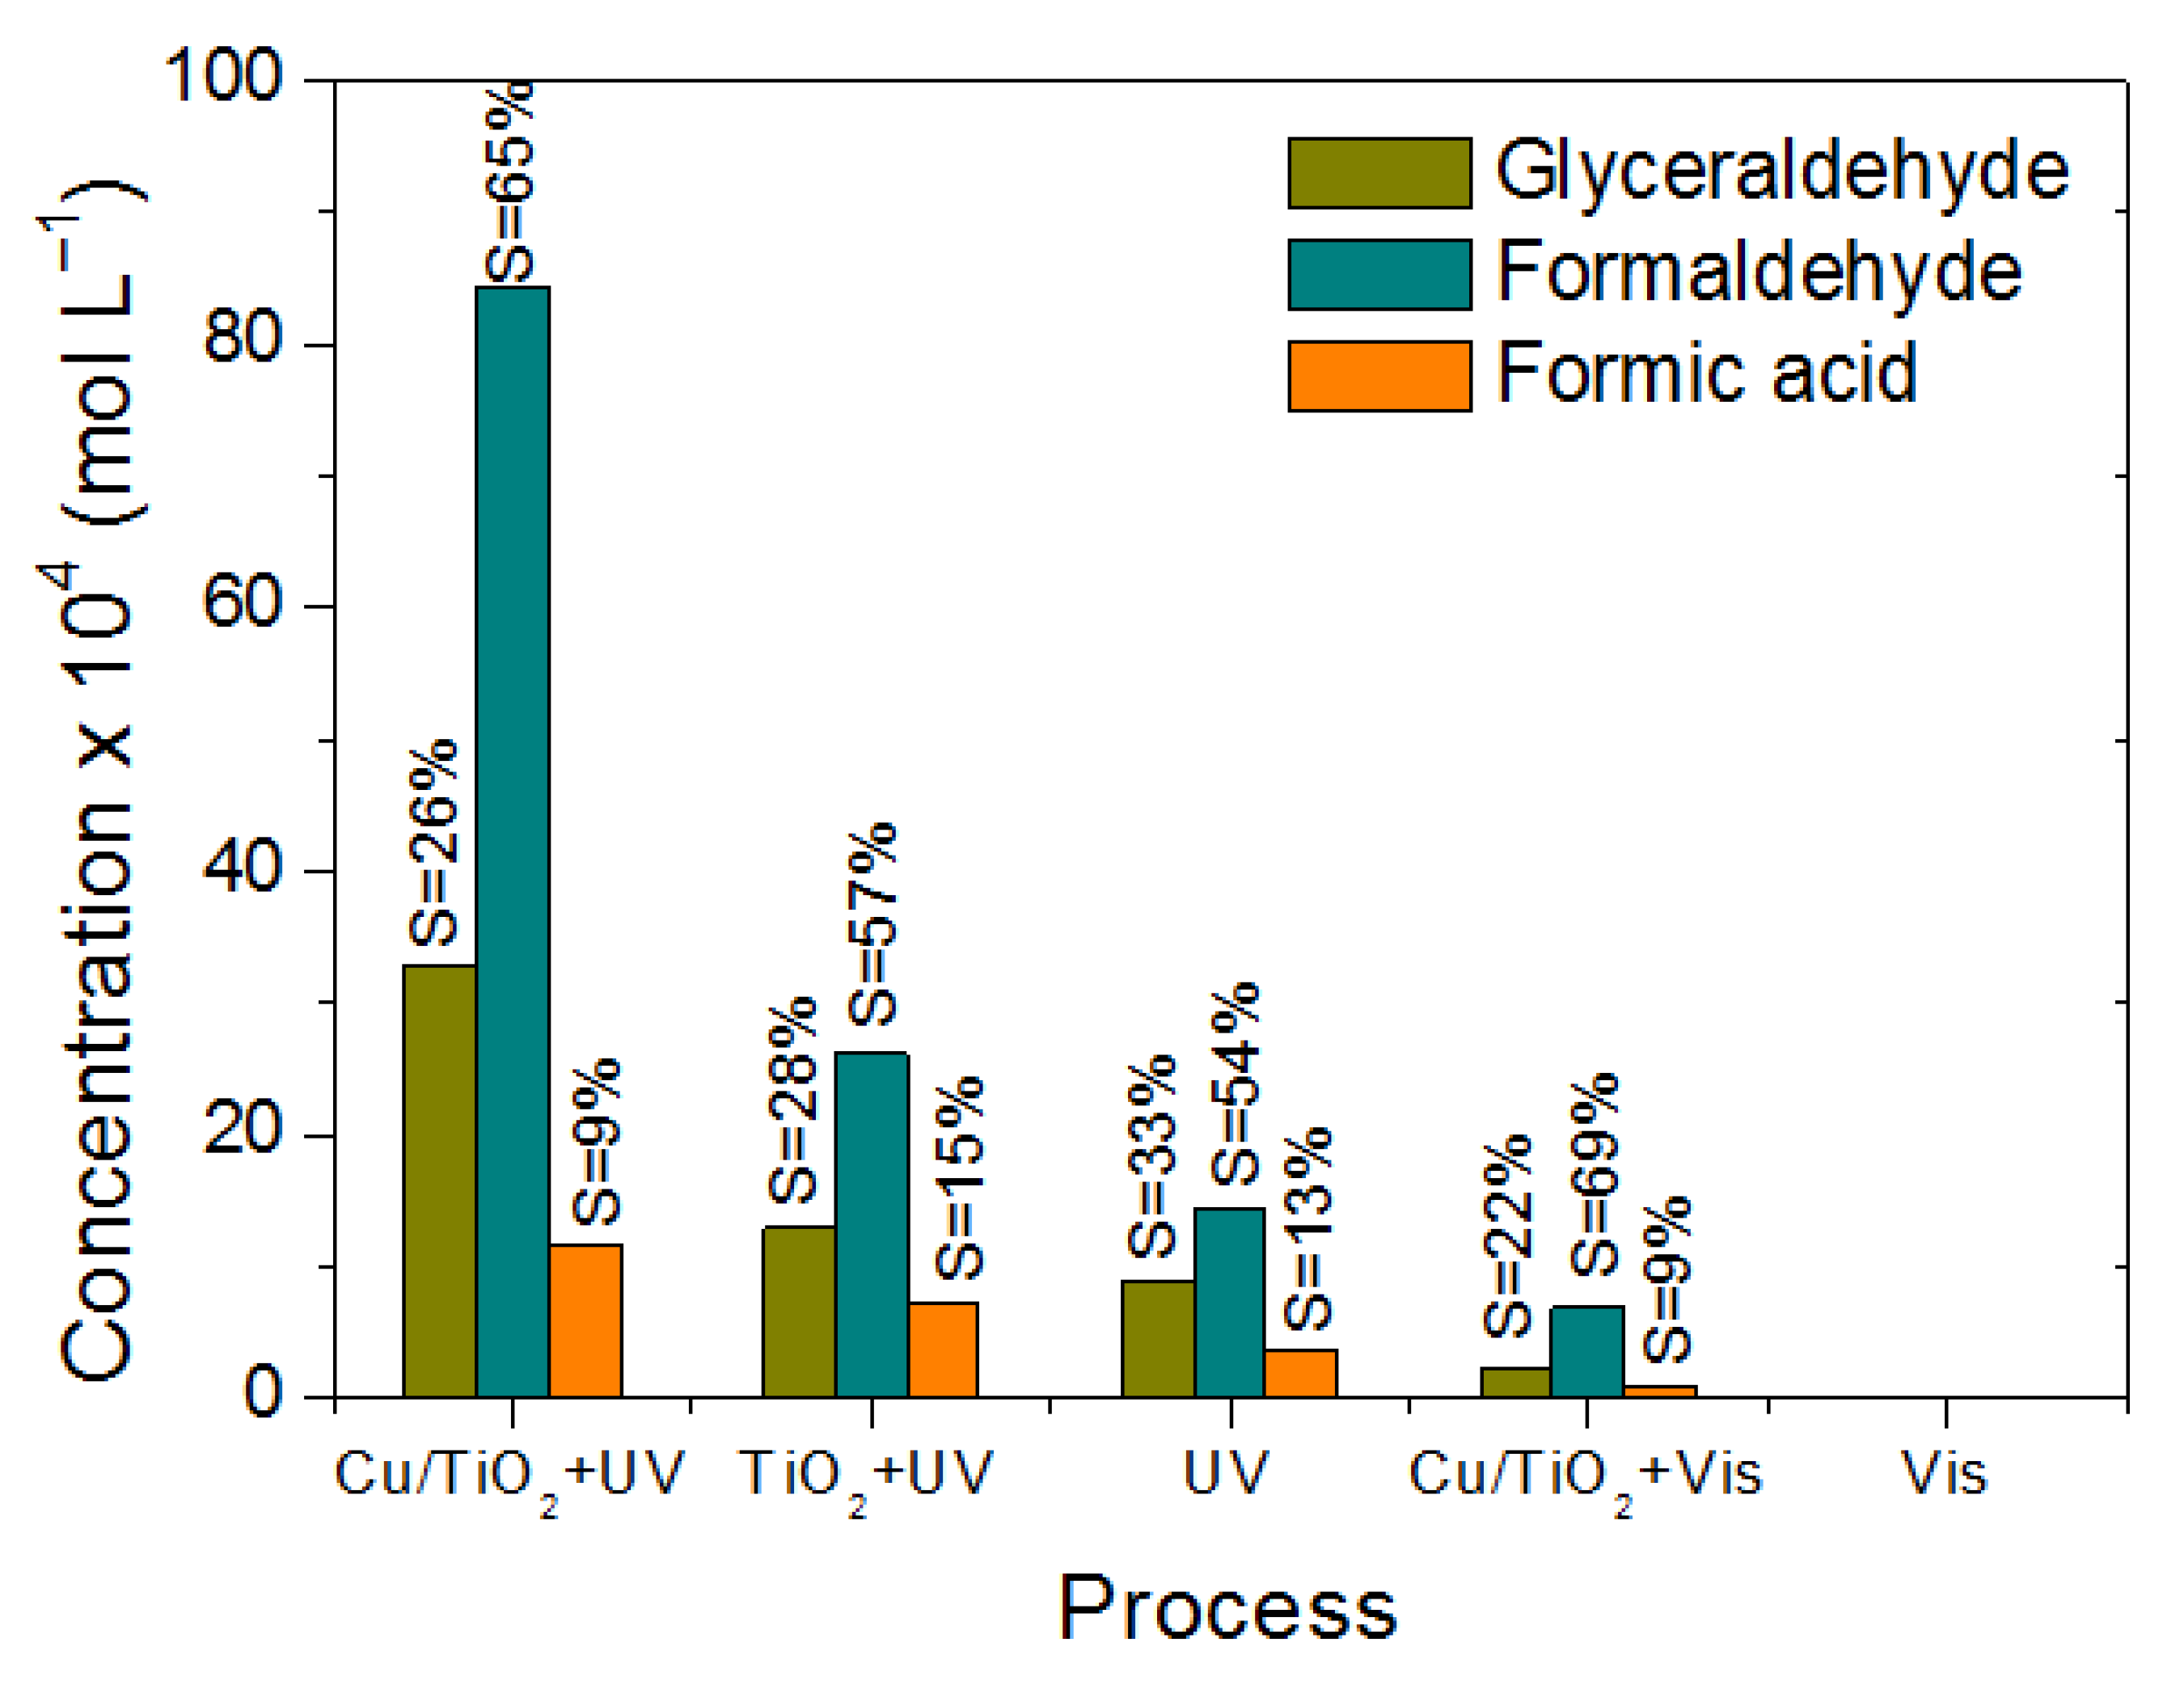
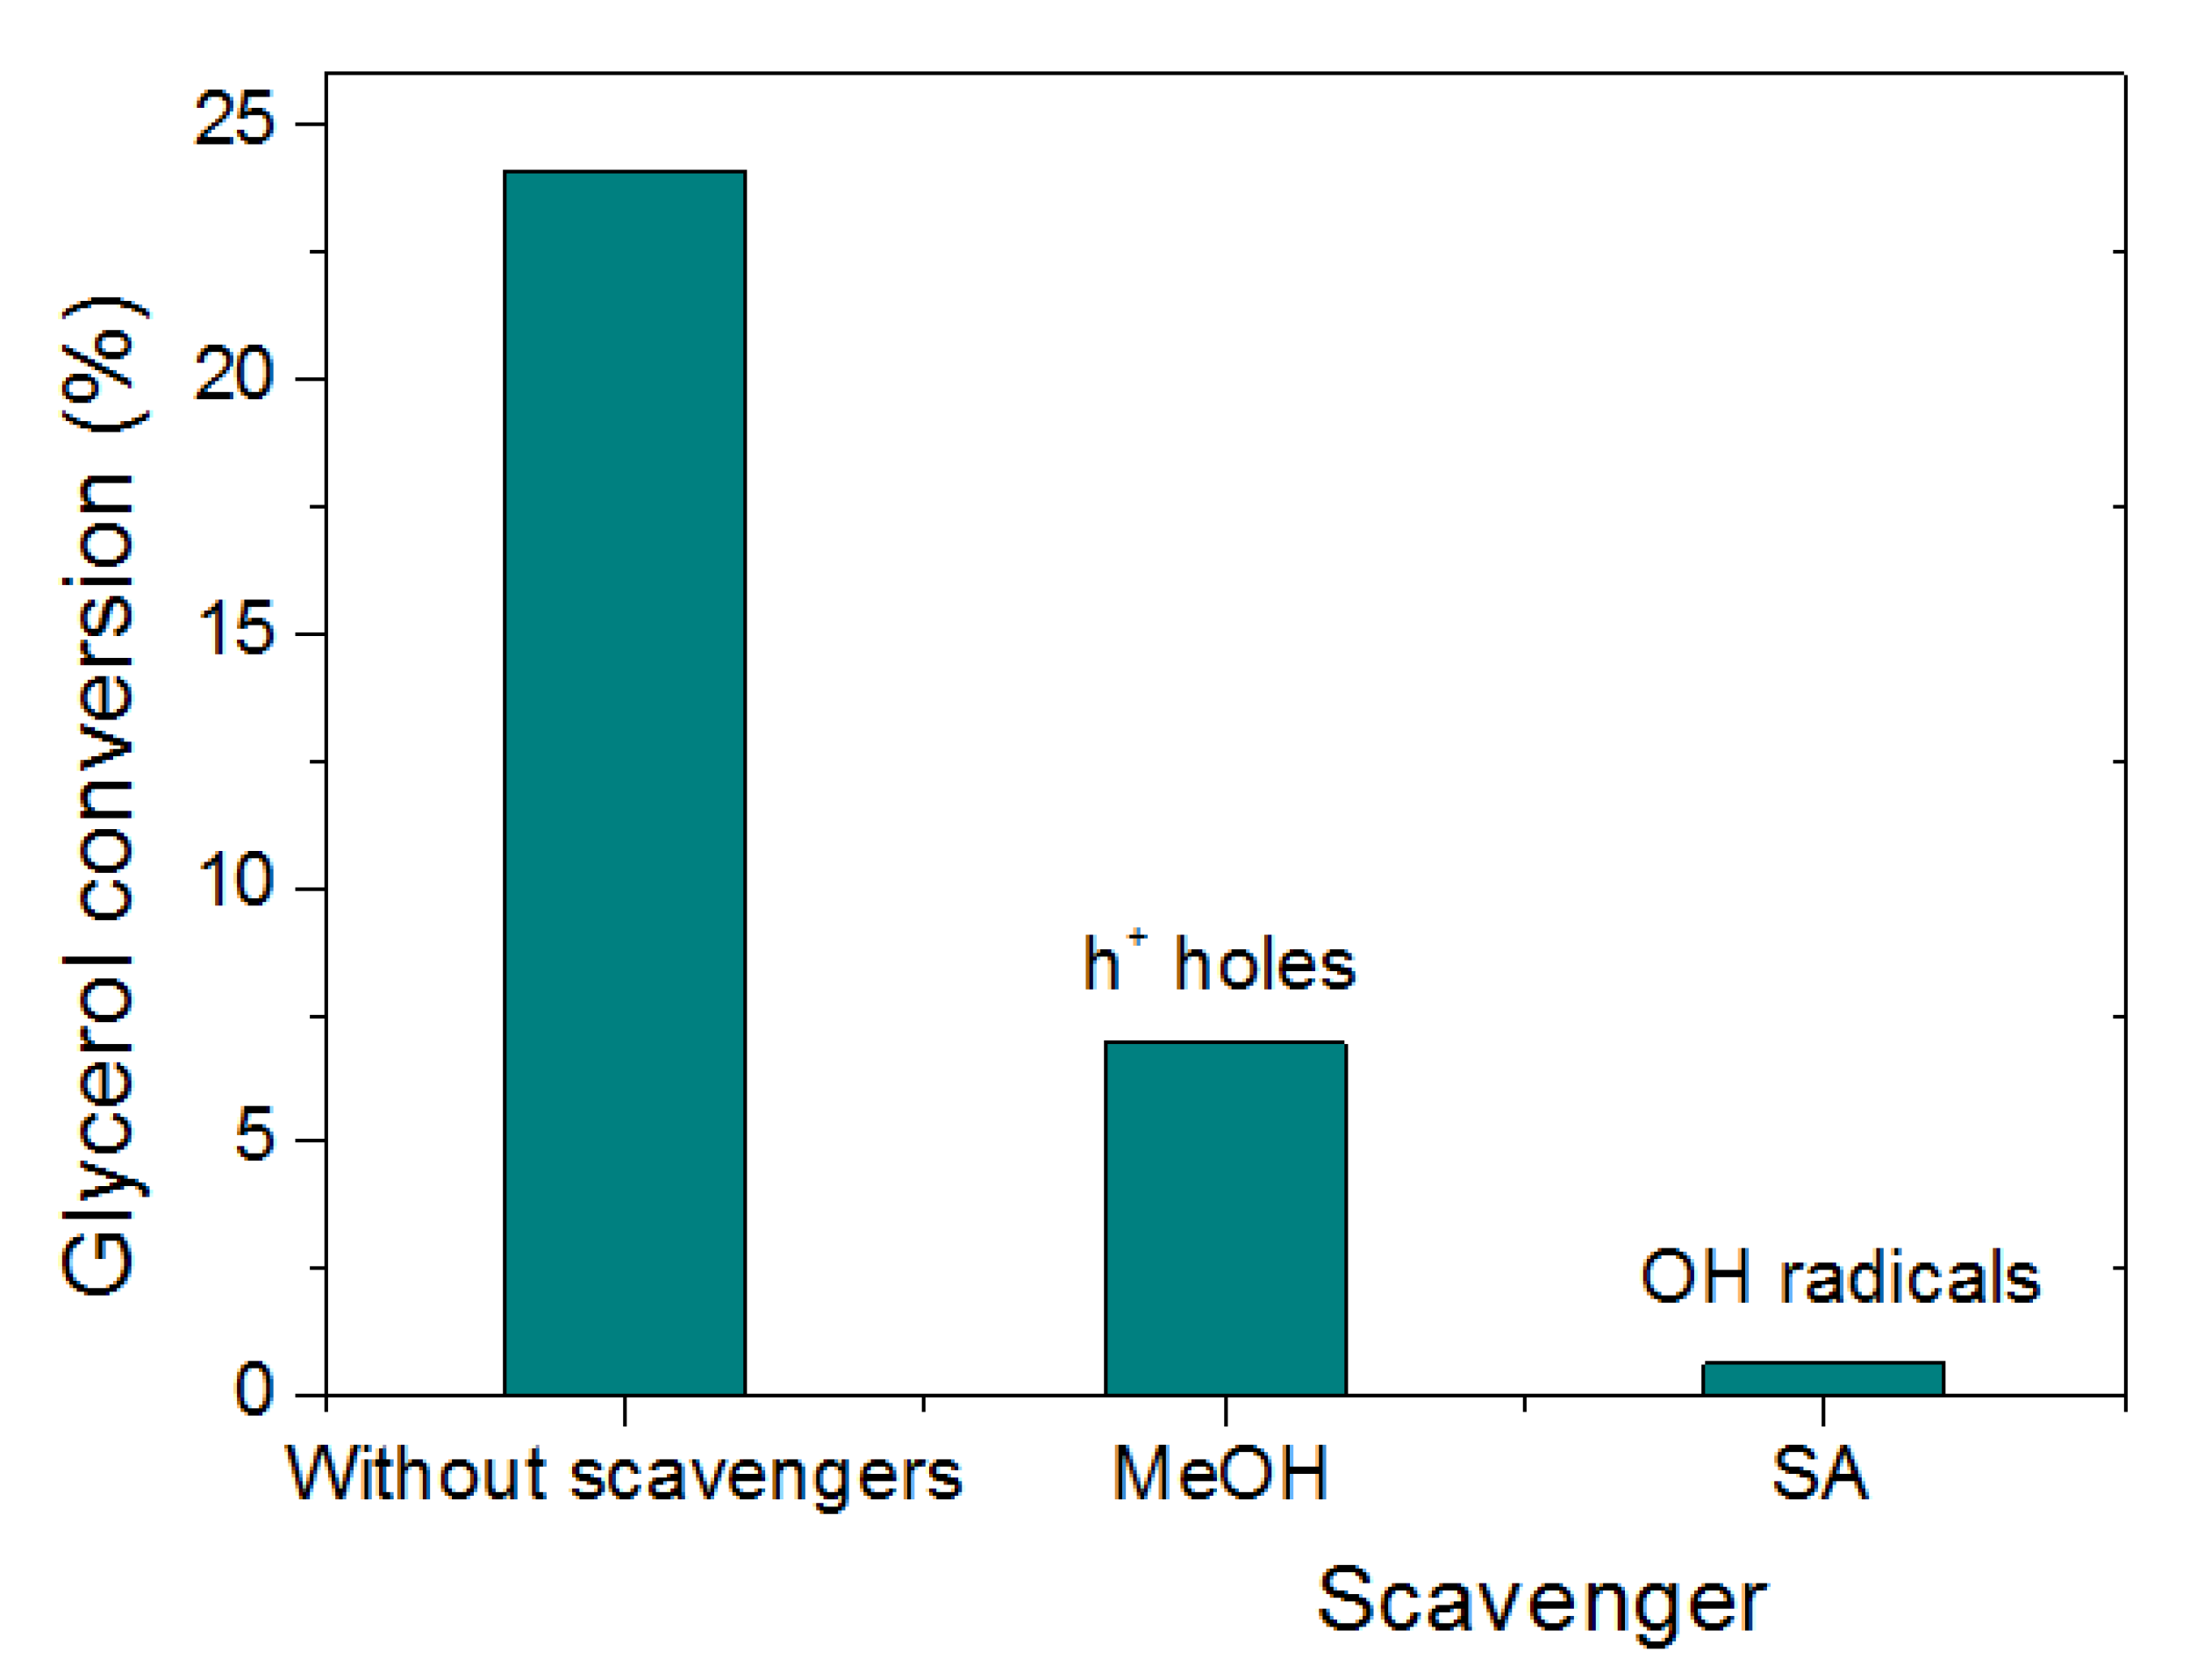
2.2. Glycerol Photo-Oxidation

2.2.1. Effect of Catalyst Loading

The amounts of catalyst evaluated were selected based on the concentrations used for this type of photocatalytic reaction [21,46,47]. The glycerol oxidation with the effect of the amount of catalyst is shown in Figure 7. As can be seen, high percentages in the decrease of glycerol are not obtained at the end of the reaction time, achieving conversions between 6 and 15%, approximately, with the three amounts of Cu/TiO2 in 6 h. Although oxidation is slow, an increase in the conversion can be observed with the increase in the catalyst loading, which is related to a greater area available for photon absorption during catalytic activation by the effect of radiation, which leads to a high rate of hydroxyl radical generation. Similarly, the catalyst load could increase the number of photogenerated active sites for the adsorption of organic molecules [22,24]. Likewise, a considerable increase in the initial reaction rate was observed when using a higher catalyst loading (0.4 g/L), obtaining a value of 19.8 × 10⁻⁴ mol/L h. In photocatalysis, a decay trend in the degradation rate may be related to an excess in the amount of catalyst, which reduces the penetration of radiation due to the opacity of the solution [47]. In this study, such maximum catalyst loading limit is not exceeded. It is also worth noting that the maximum catalyst concentration used in this work is one order of magnitude lower than other studies where 100% conversion has been reported with catalysts such as Au/TiO2 and using a lamp with higher intensity (100 W) than the used here (8 W) [24].
The concentration and selectivity of glycerol oxidation products when using different catalyst concentrations are shown in Figure 8. As can be seen, the compounds formed during the oxidation of glycerol are glyceraldehyde (GCD), formaldehyde (FD), and formic acid (FA). When the amount of catalyst is low (0.1 g/L), the lowest generation of products is obtained. On the other hand, when the catalyst loading is the highest (0.4 g/L), a maximum concentration can be observed. A high concentration of product formation associated with high amount of catalyst may be related to higher generation of hydroxyl radicals, as shown in Equations (1)–(3), which are the main species responsible for the oxidation of the organic molecule [48]. Likewise, copper species can act as electron traps by reducing the recombination rate of photogenerated electron/hole pairs, as can be seen in Equation (4), thus increasing the generation of OH radicals [49],
Cu/TiO2 + hv → hvb+ + ecb
hvb+ + H2O → OH + H+
Glycerol + OH → oxidation products
Cu2+ + ecb → Cu+
Figure 8a shows the GCD concentration profiles with a maximum concentration at 6 h of reaction for all catalyst loadings, as a result of oxidation. The formation of glyceraldehyde is related to the attack of hydroxyl radicals on the glycerol molecule in the C1 position in comparison with the reactivity in the C2 position towards the formation of dihydroxyacetone [50]; however, in this study, the generation of dihydroxyacetone was negligible since the abstraction of the first hydrogen is favored (see Figure 9) [51]. The subsequent oxidation of glyceraldehyde by hydroxyl radicals can form other byproducts, such as formic acid and formaldehyde, this is due to the incision of the C-C bonds in the organic molecule [46]. Figure 8b,c shows the concentration profiles of the formaldehyde and formic acid formed during the photo-oxidation tests, respectively. Both products show an increasing trend over time for each catalyst amount, but with 0.4 g/L of catalyst the greatest generation is observed. FD was the product with the highest concentration of formation compared to GCD and FA, showing a selectivity of up to 65%, as shown in Figure 8.

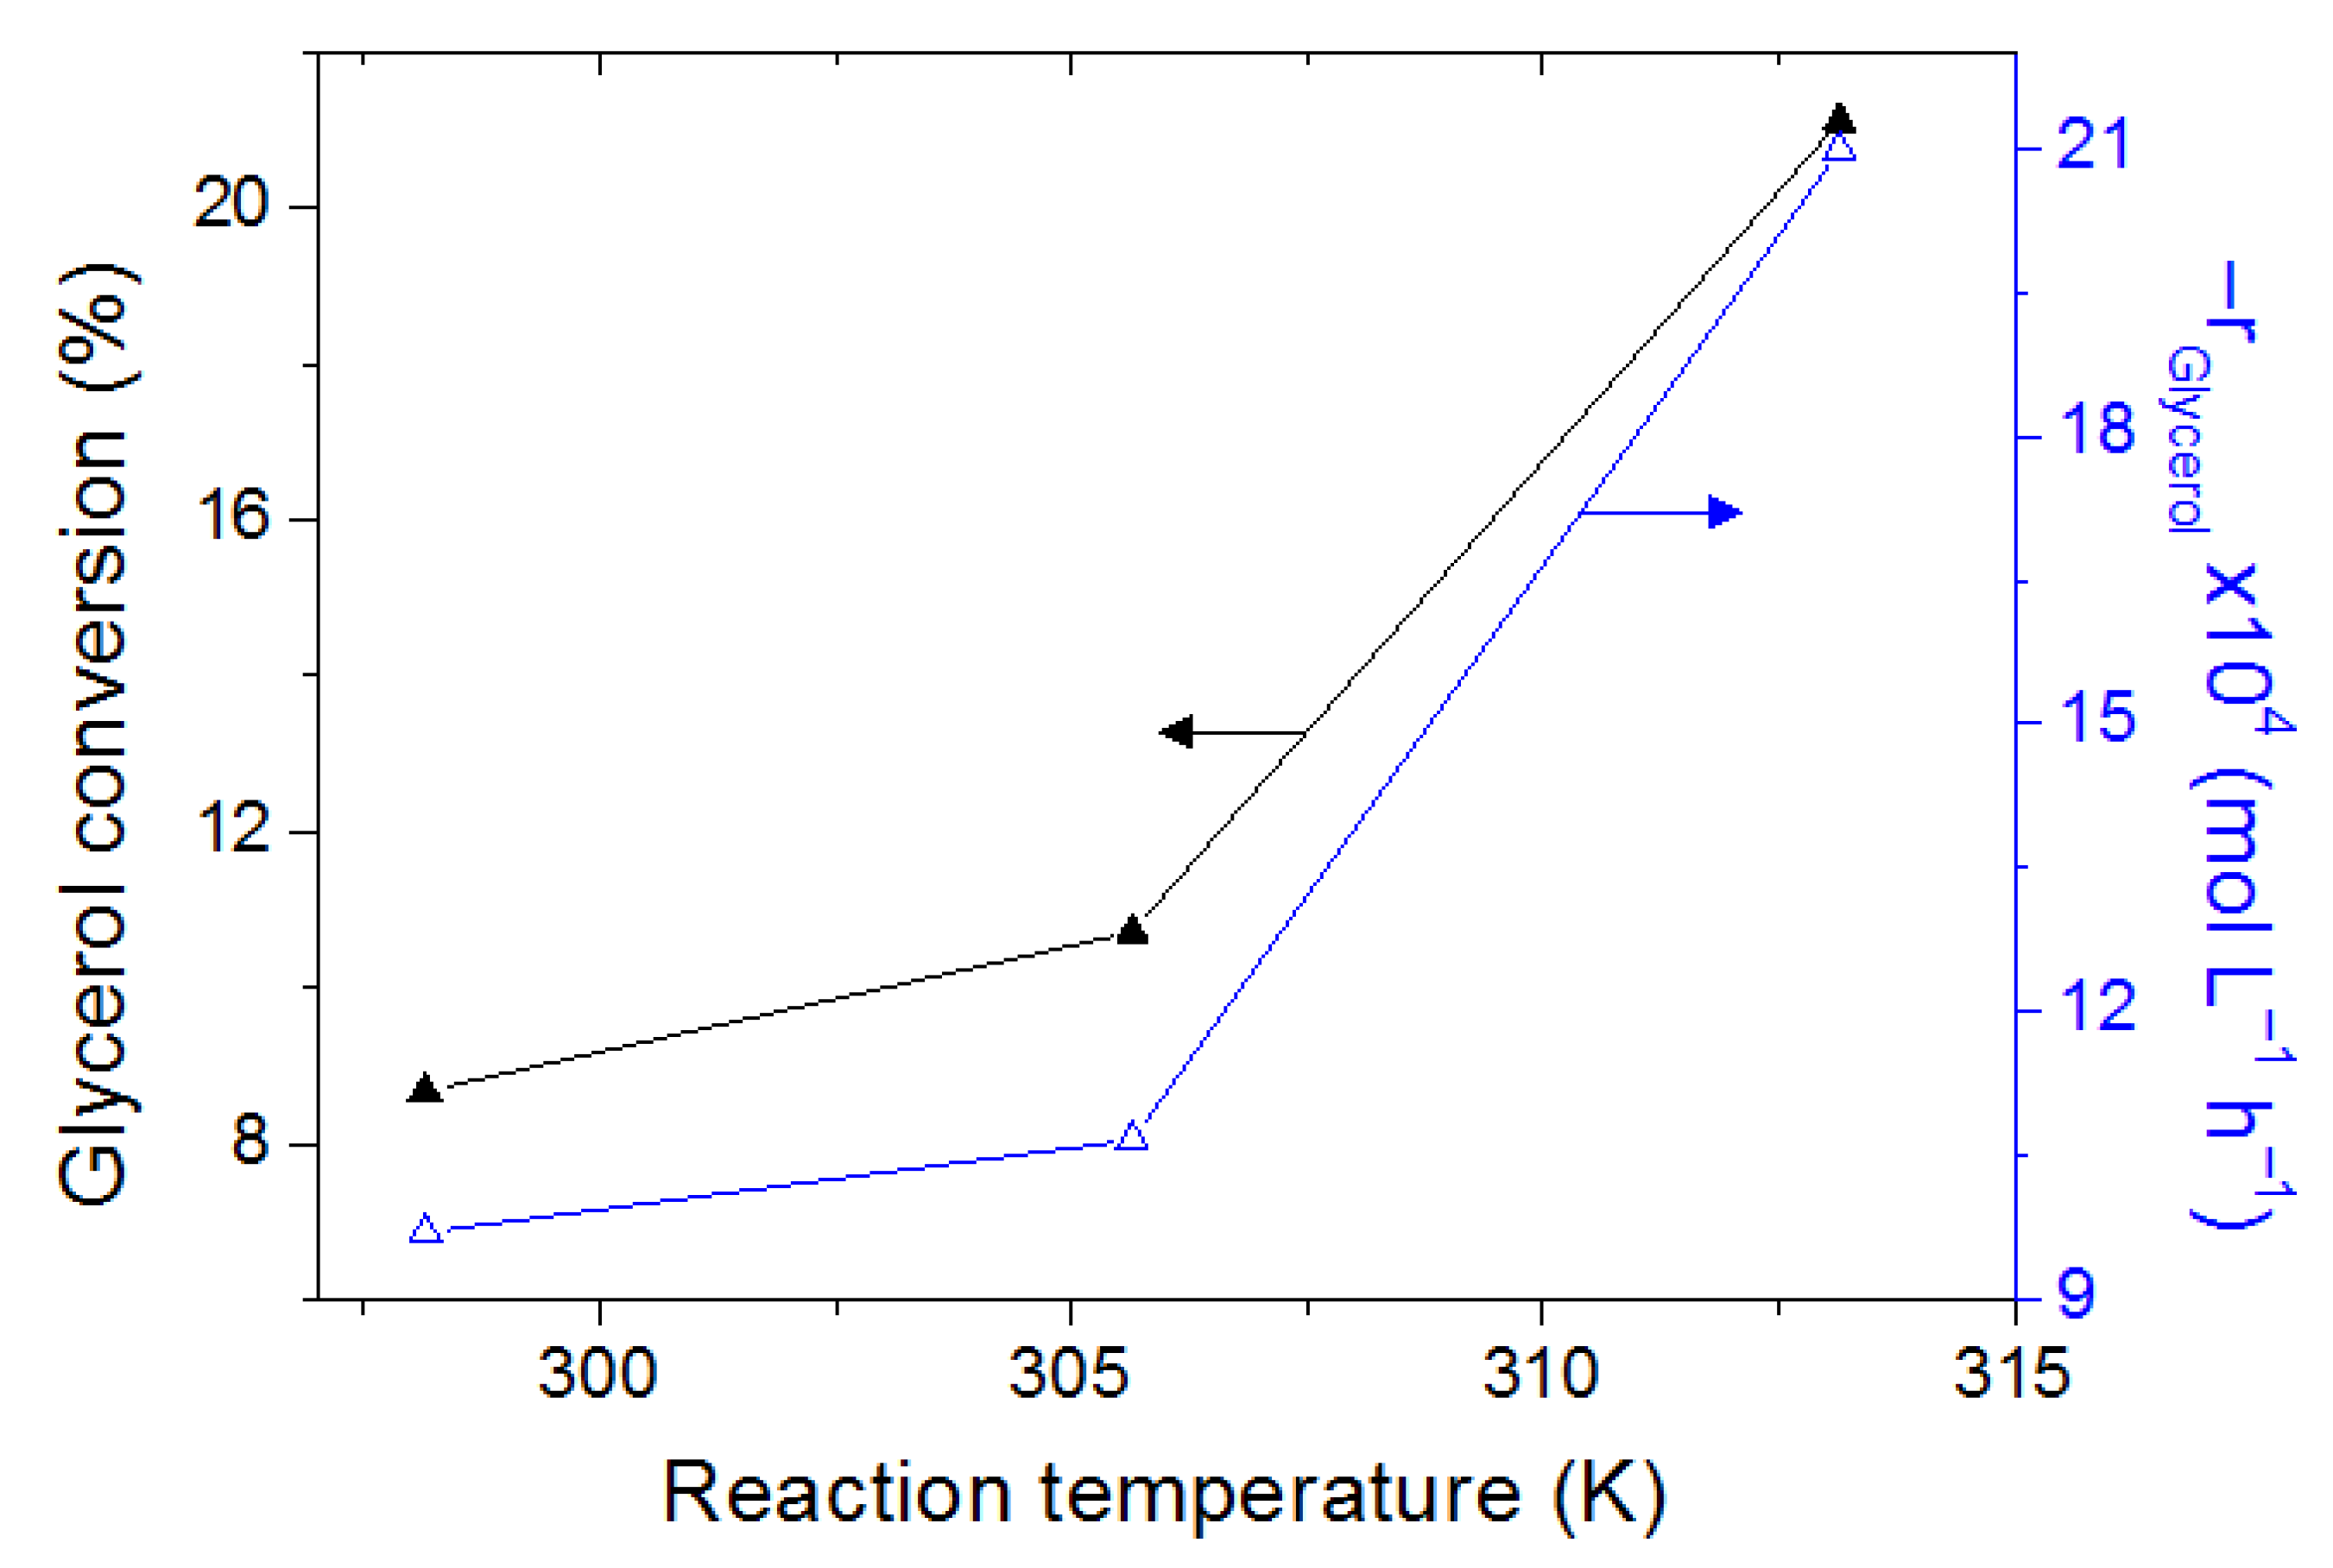
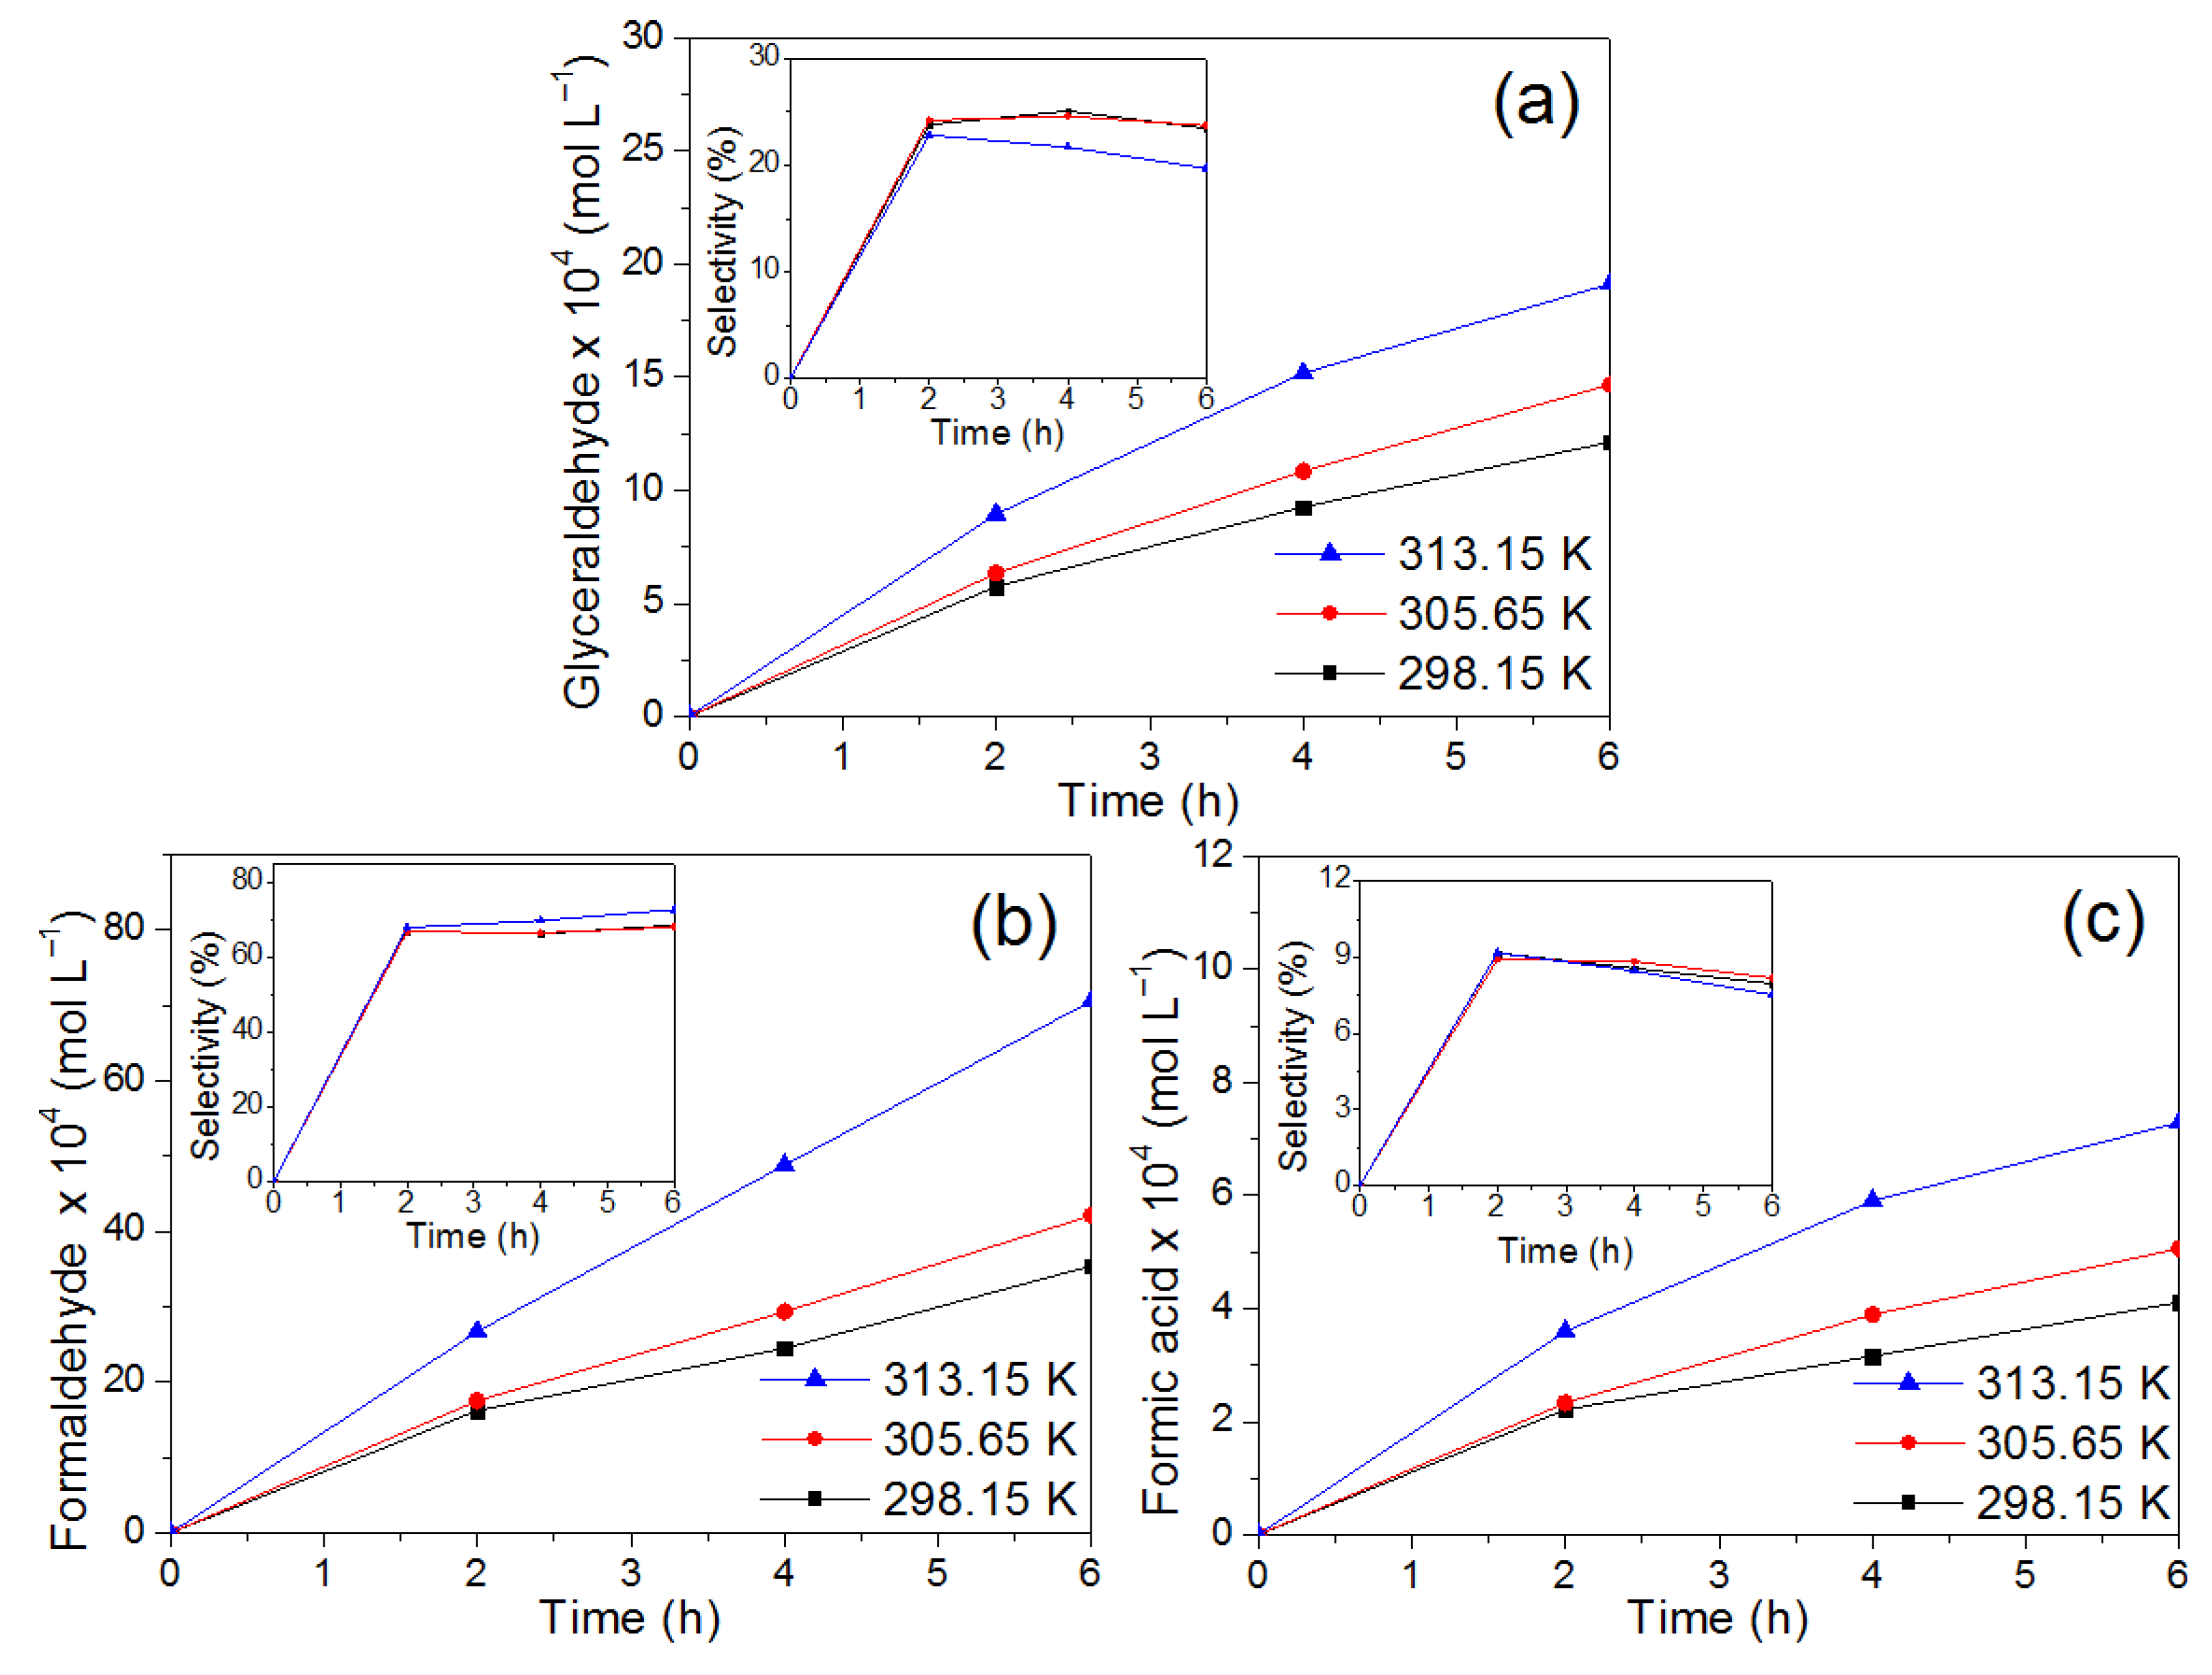
2.2.2. Effect of Reaction Temperature

The effect of reaction temperature was studied in the range of 298.15–313.15 K while keeping the concentration of catalyst (0.25 g/L) and glycerol (6.25 × 10⁻² M) constant. Figure 10 shows the glycerol conversion and initial reaction rate with different temperatures on the photo-oxidation reactions. As can be seen, the increase in temperature promotes the degradation of glycerol, achieving a conversion of 21% at 313.15 K in 6 h. This is related to a greater molecular excitation that favors the interaction between the glycerol molecules and the catalyst, which increases the catalytic activity [52]. Likewise, initial reaction rates are favored by the increase in temperature. The decrease in glycerol concentration due to evaporation from solution is considered negligible.
Figure 11 shows the effect of reaction temperature on concentration and selectivity of the products formed during glycerol photo-oxidation. It is worth noticing that the accumulation of GCD is favored by the increase of temperature, see Figure 11a, which is associated with an increase in the oxidation rate of glycerol [53]. These results indicate the reaction, beyond temperatures of 305 K, is being photo- and thermo-activated. The GCD concentration increases 57% as the temperature increases from 298.15 K to 313.15 K after 6 h of reaction due to high oxidation. This is supported by the fact that the production rates of the secondary products (FD and FA), see Figure 11b,c, increase according to temperature. The selectivity of these products remained practically constant with the increase in temperature with values around 69% and 8% for FD and FA, respectively. In the case of GCD, the selectivity decreases with high temperature and this can be ascribed to the presumed increase in its oxidation rate. The maximum concentration of 7.06 mM was obtained for formaldehyde compared to the glyceraldehyde (1.91 mM) and formic acid (0.73 mM) products at 313.15 K.

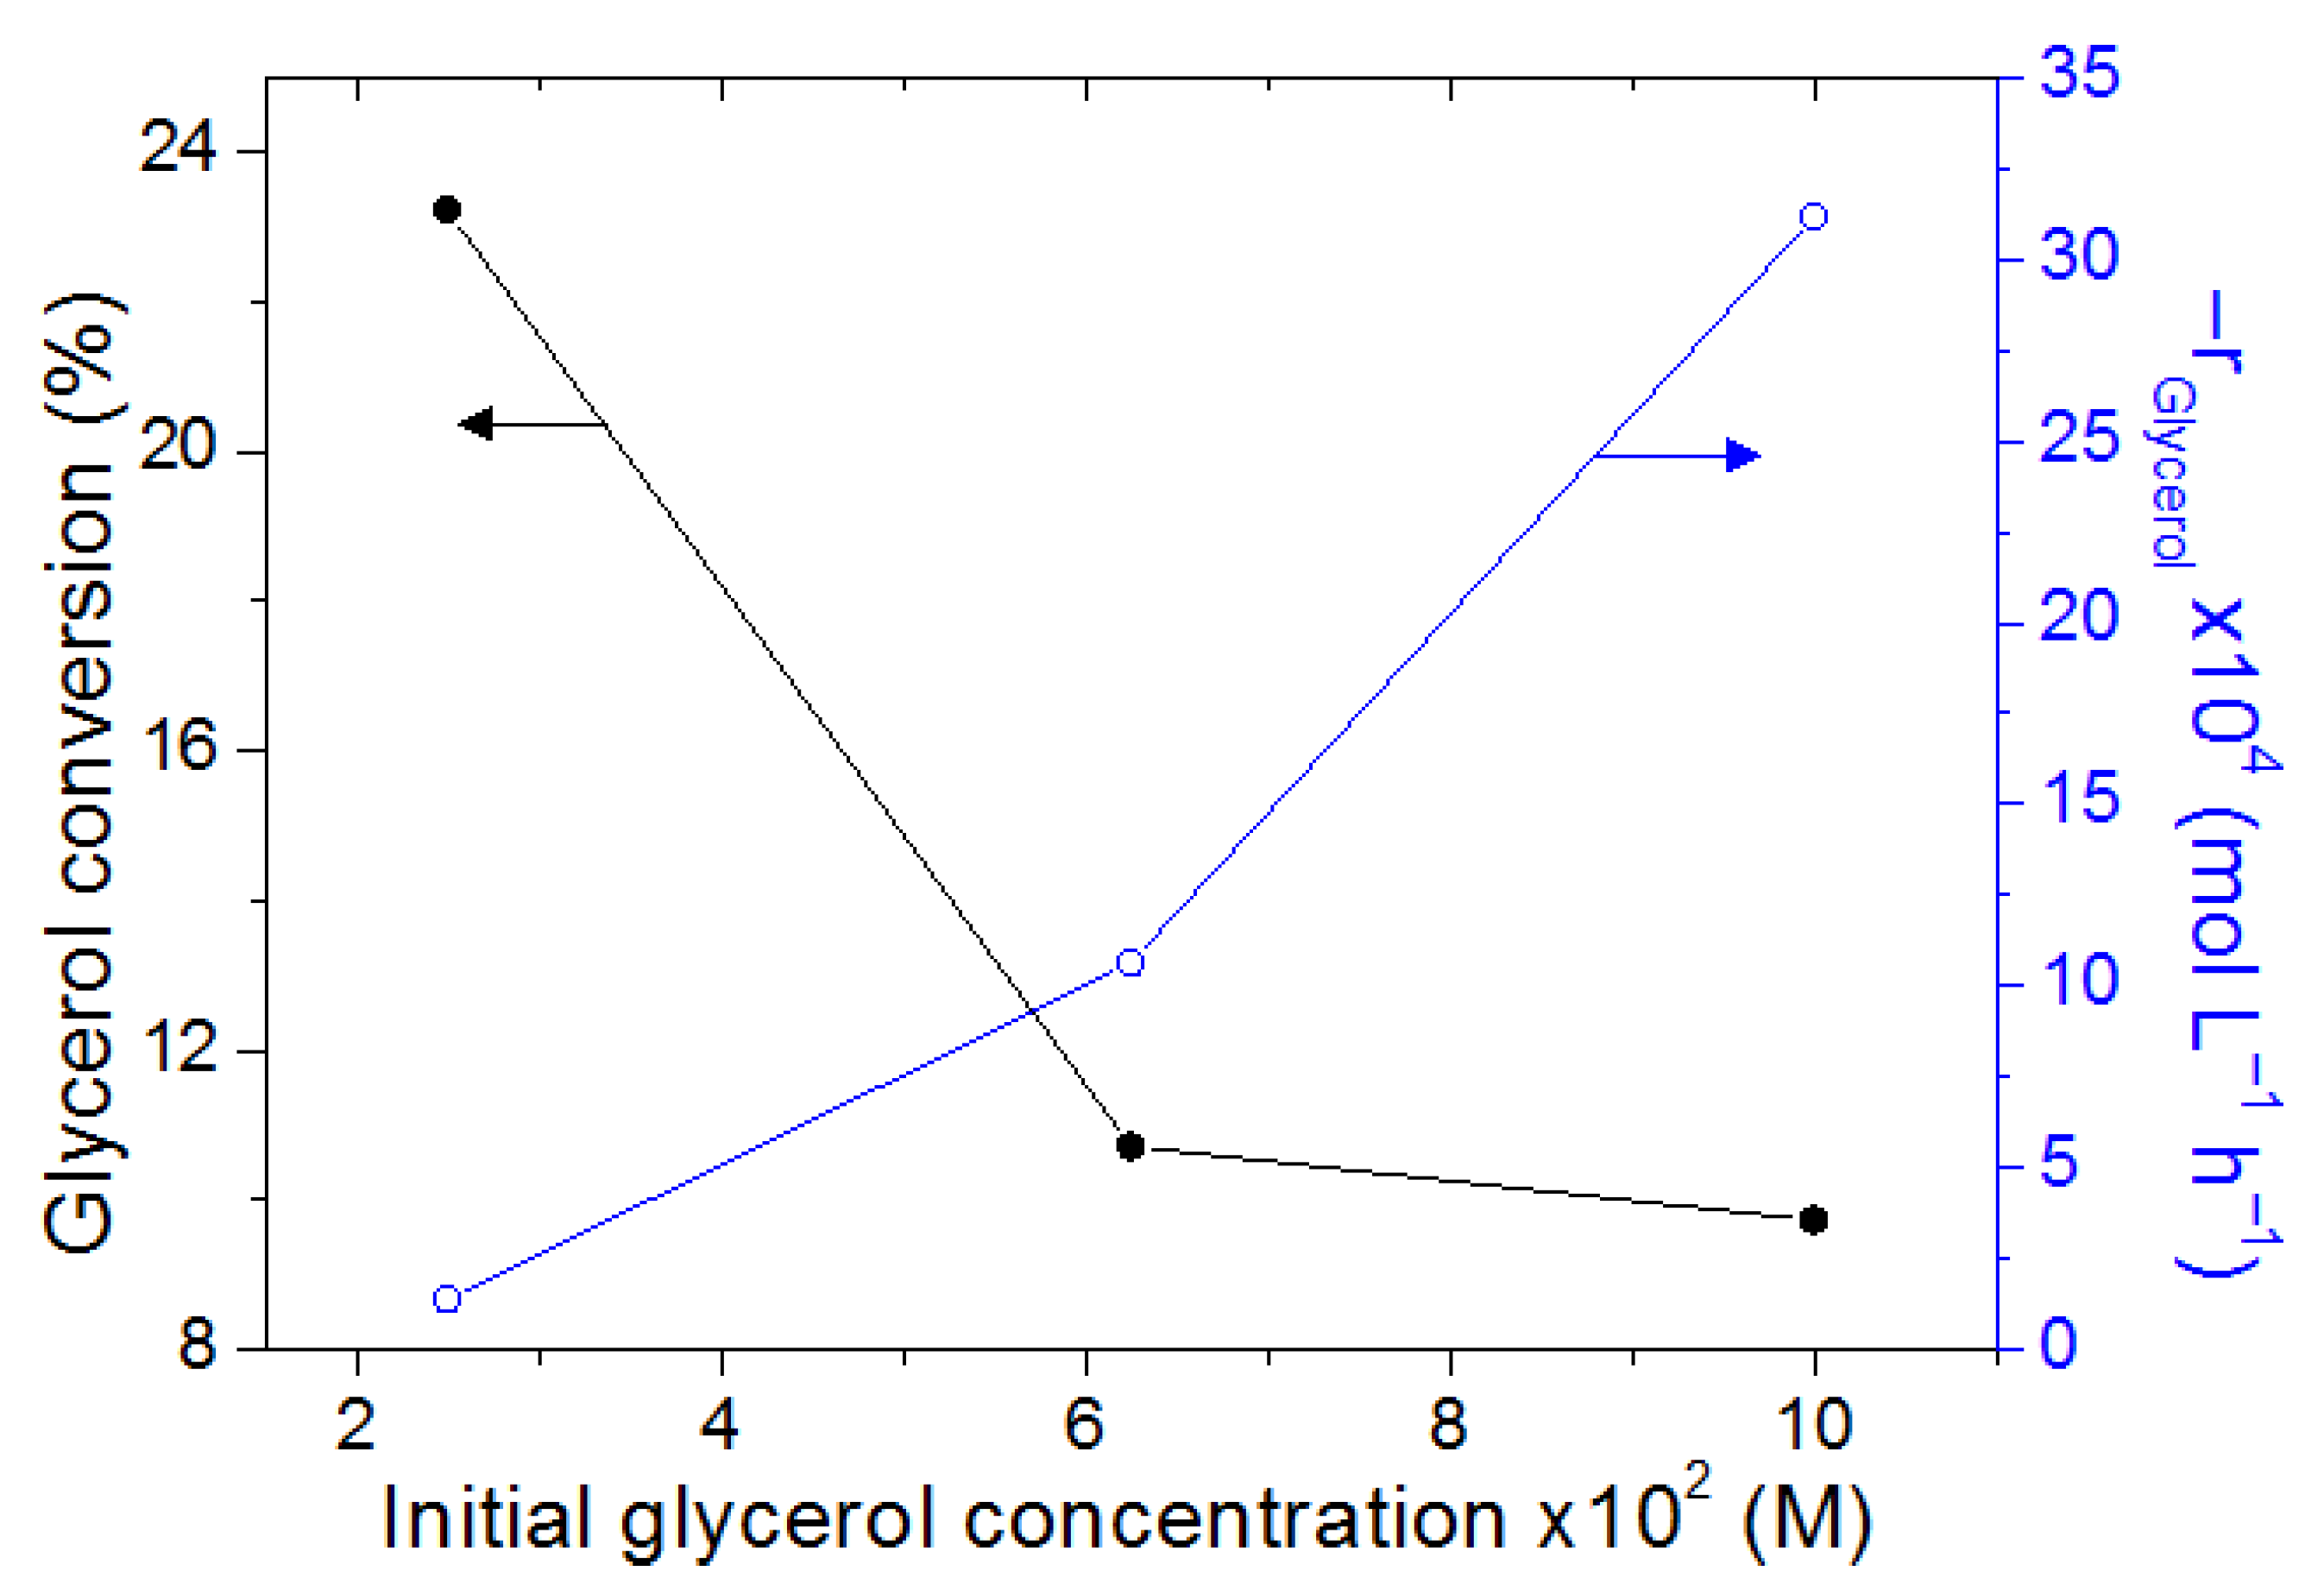
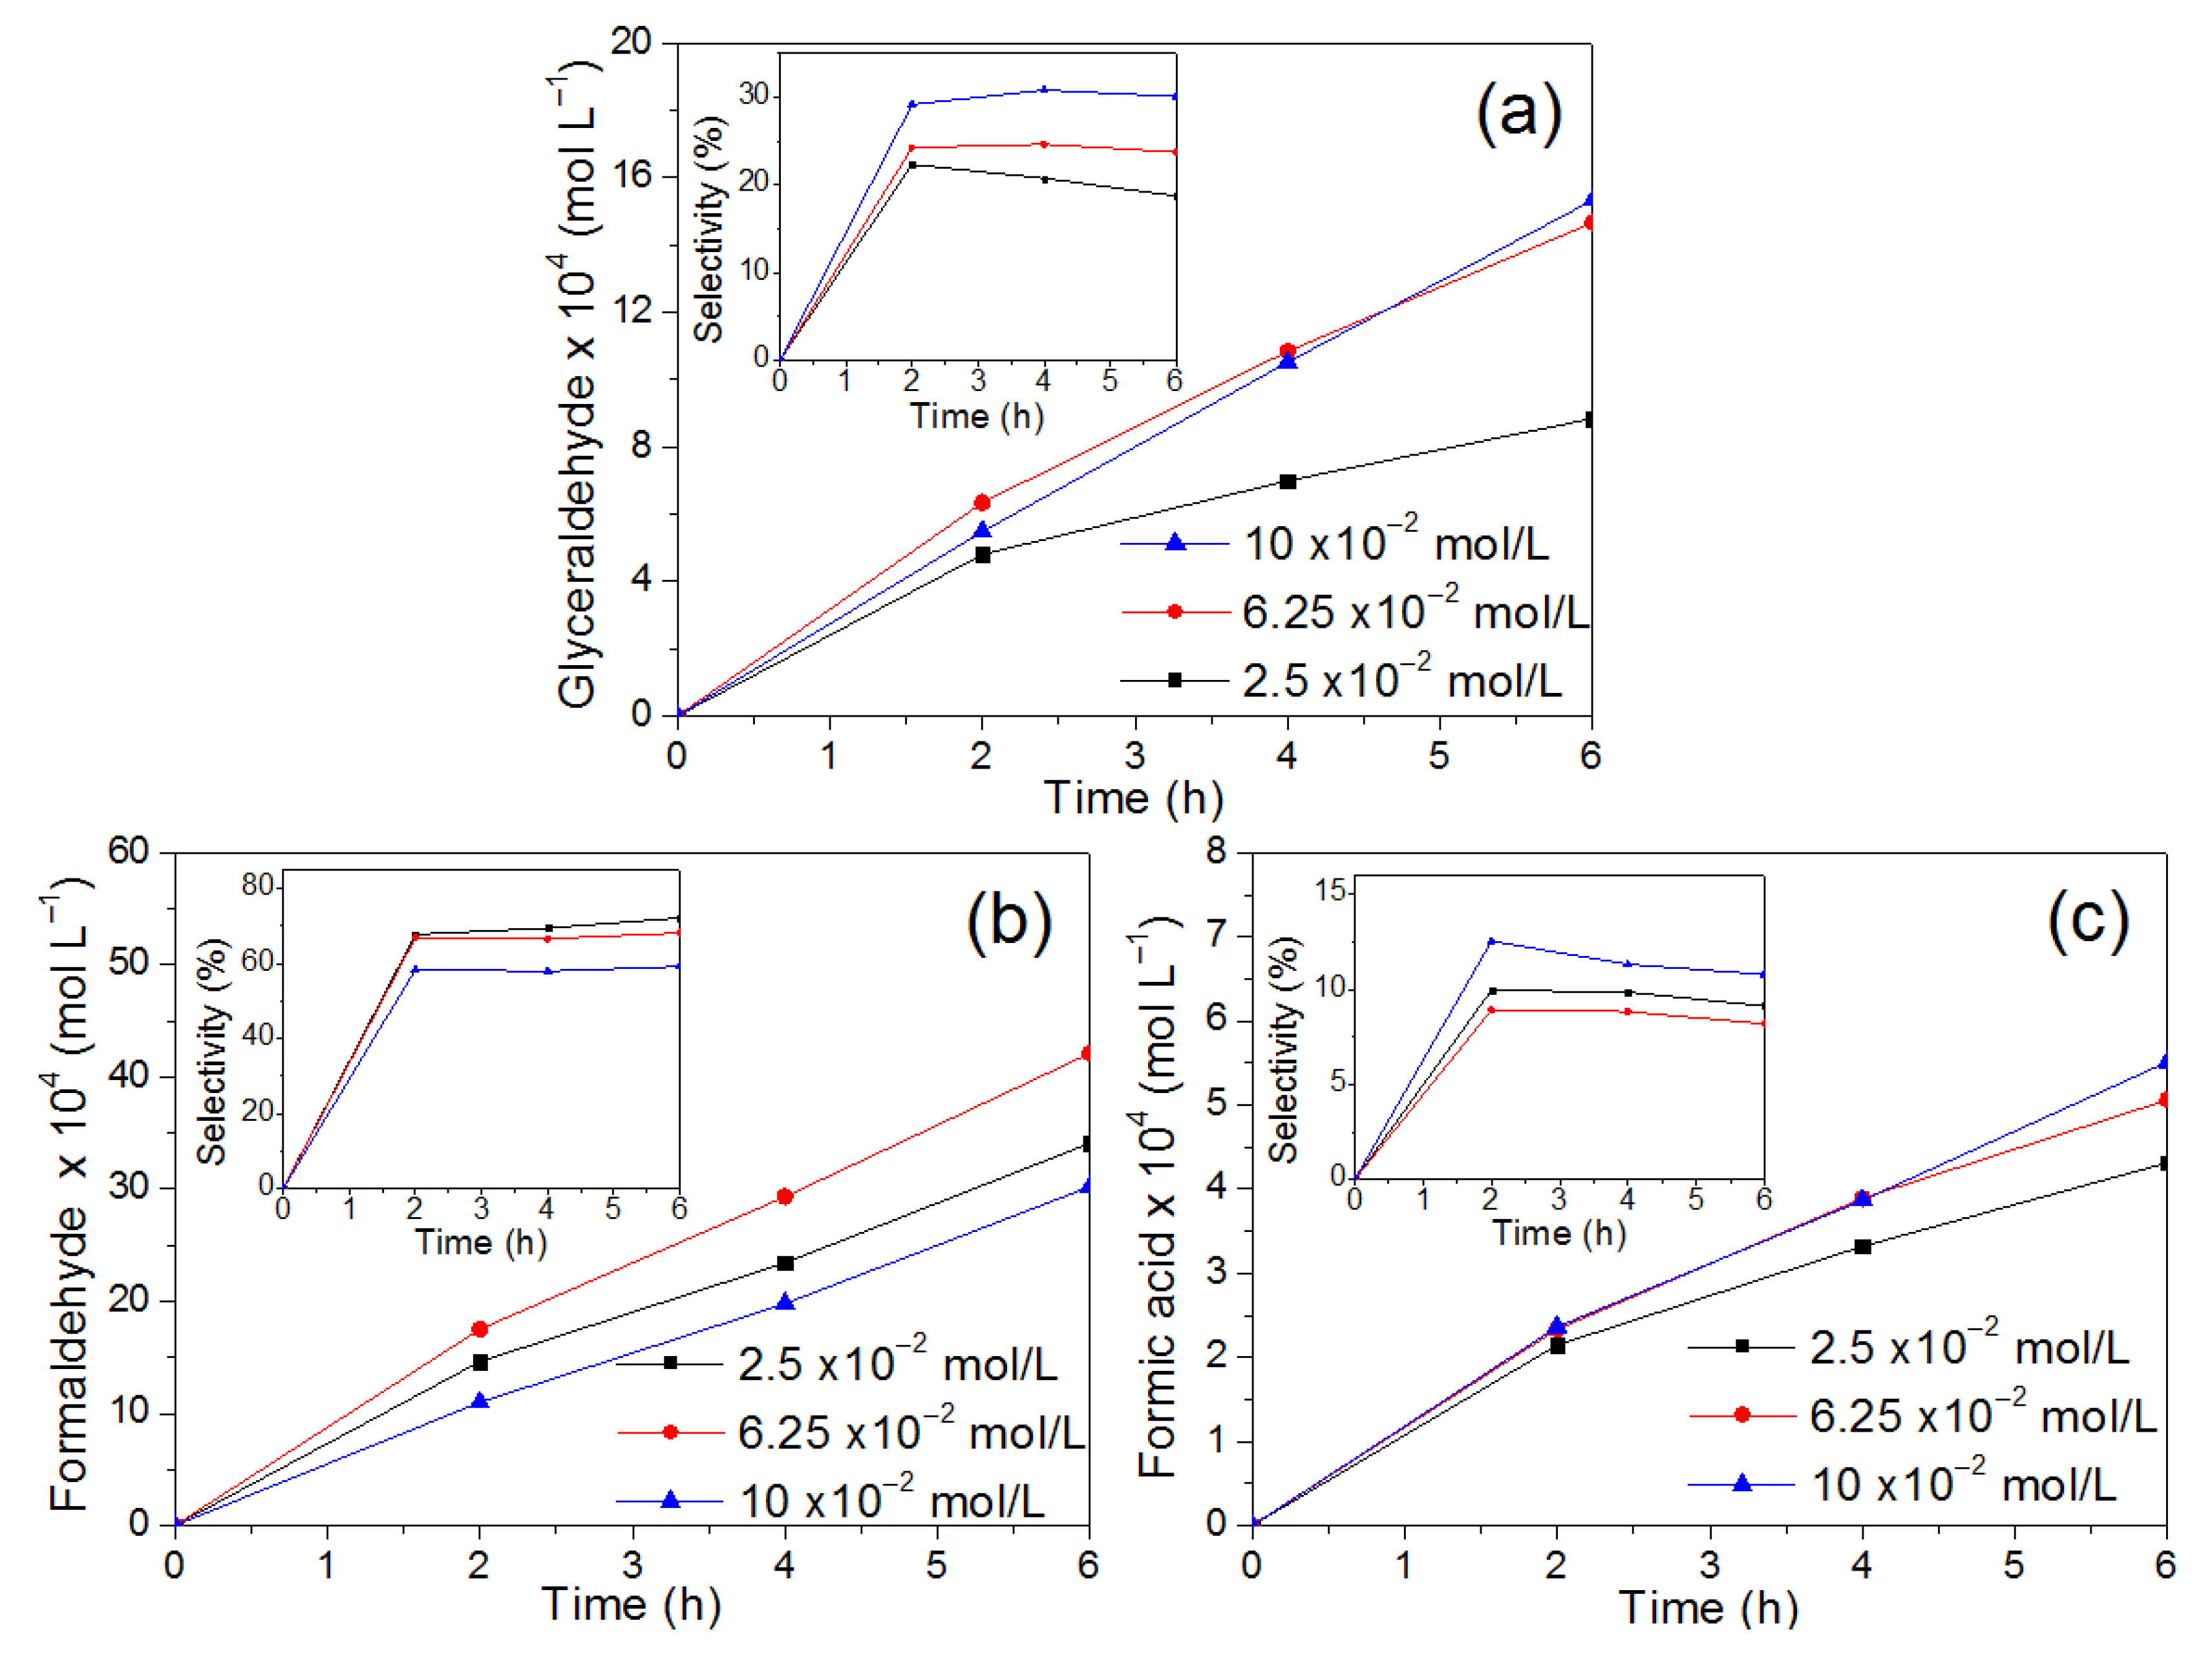
2.2.3. Effect of Initial Glycerol Concentration

The effect of the initial glycerol concentration on the conversion percentage and initial reaction rate of this organic compound is shown in Figure 12. As can be seen, the reaction rate increases from 1.39 × 10⁻⁴ mol/L h to 31.16 × 10⁻⁴ mol/L h when the initial glycerol concentration is quadrupled from 0.025 M to 0.10 M, which is related to a high oxidation at the beginning of the reaction due to the presence of a greater amount of organic glycerol molecules. A decrease in the amount of glycerol was also observed for the three tested concentrations due to oxidative processes. Low glycerol concentrations (25 mM) exhibited higher percentages of decrease (23.2%) when compared to high initial concentrations (100 mM) that showed a decrease of 9.7%. This behavior is associated with a saturation effect on the active sites of the catalyst, which reduces the activity [54].
The products formed with an effect on the initial glycerol concentration are shown in Figure 13. In this figure, it is observed that the formation of GCD is favored at high concentrations of glycerol and long reaction times. The maximum formation of GCD and selectivity were obtained of 1.53 mM and 30%, respectively, with a glycerol concentration of 10 × 10−2 mol/L at 6 h of reaction, as shown in Figure 13a. On the other hand, the generation of formaldehyde is not directly related to the increase in glycerol concentration, because its maximum concentration was obtained by using the intermediate initial concentration of 6.25 × 10⁻² mol/L, as can be seen in Figure 13b. With respect to formic acid, a considerable effect was not observed with the initial amount of glycerol; however, an increase in selectivity occurs when a high initial concentration of glycerol is used according to Figure 13c. Both FD and FA were identified from low glycerol concentrations as they are secondary reaction products. Formaldehyde is the reaction product that exhibited the highest formation with a concentration of 4.2 mM. Although other products generated during the oxidation of glycerol have been reported by other investigations (glycolic and glyceric acids) as precursor compounds of formaldehyde and formic acid [31,55], in this study, such products were not identified.

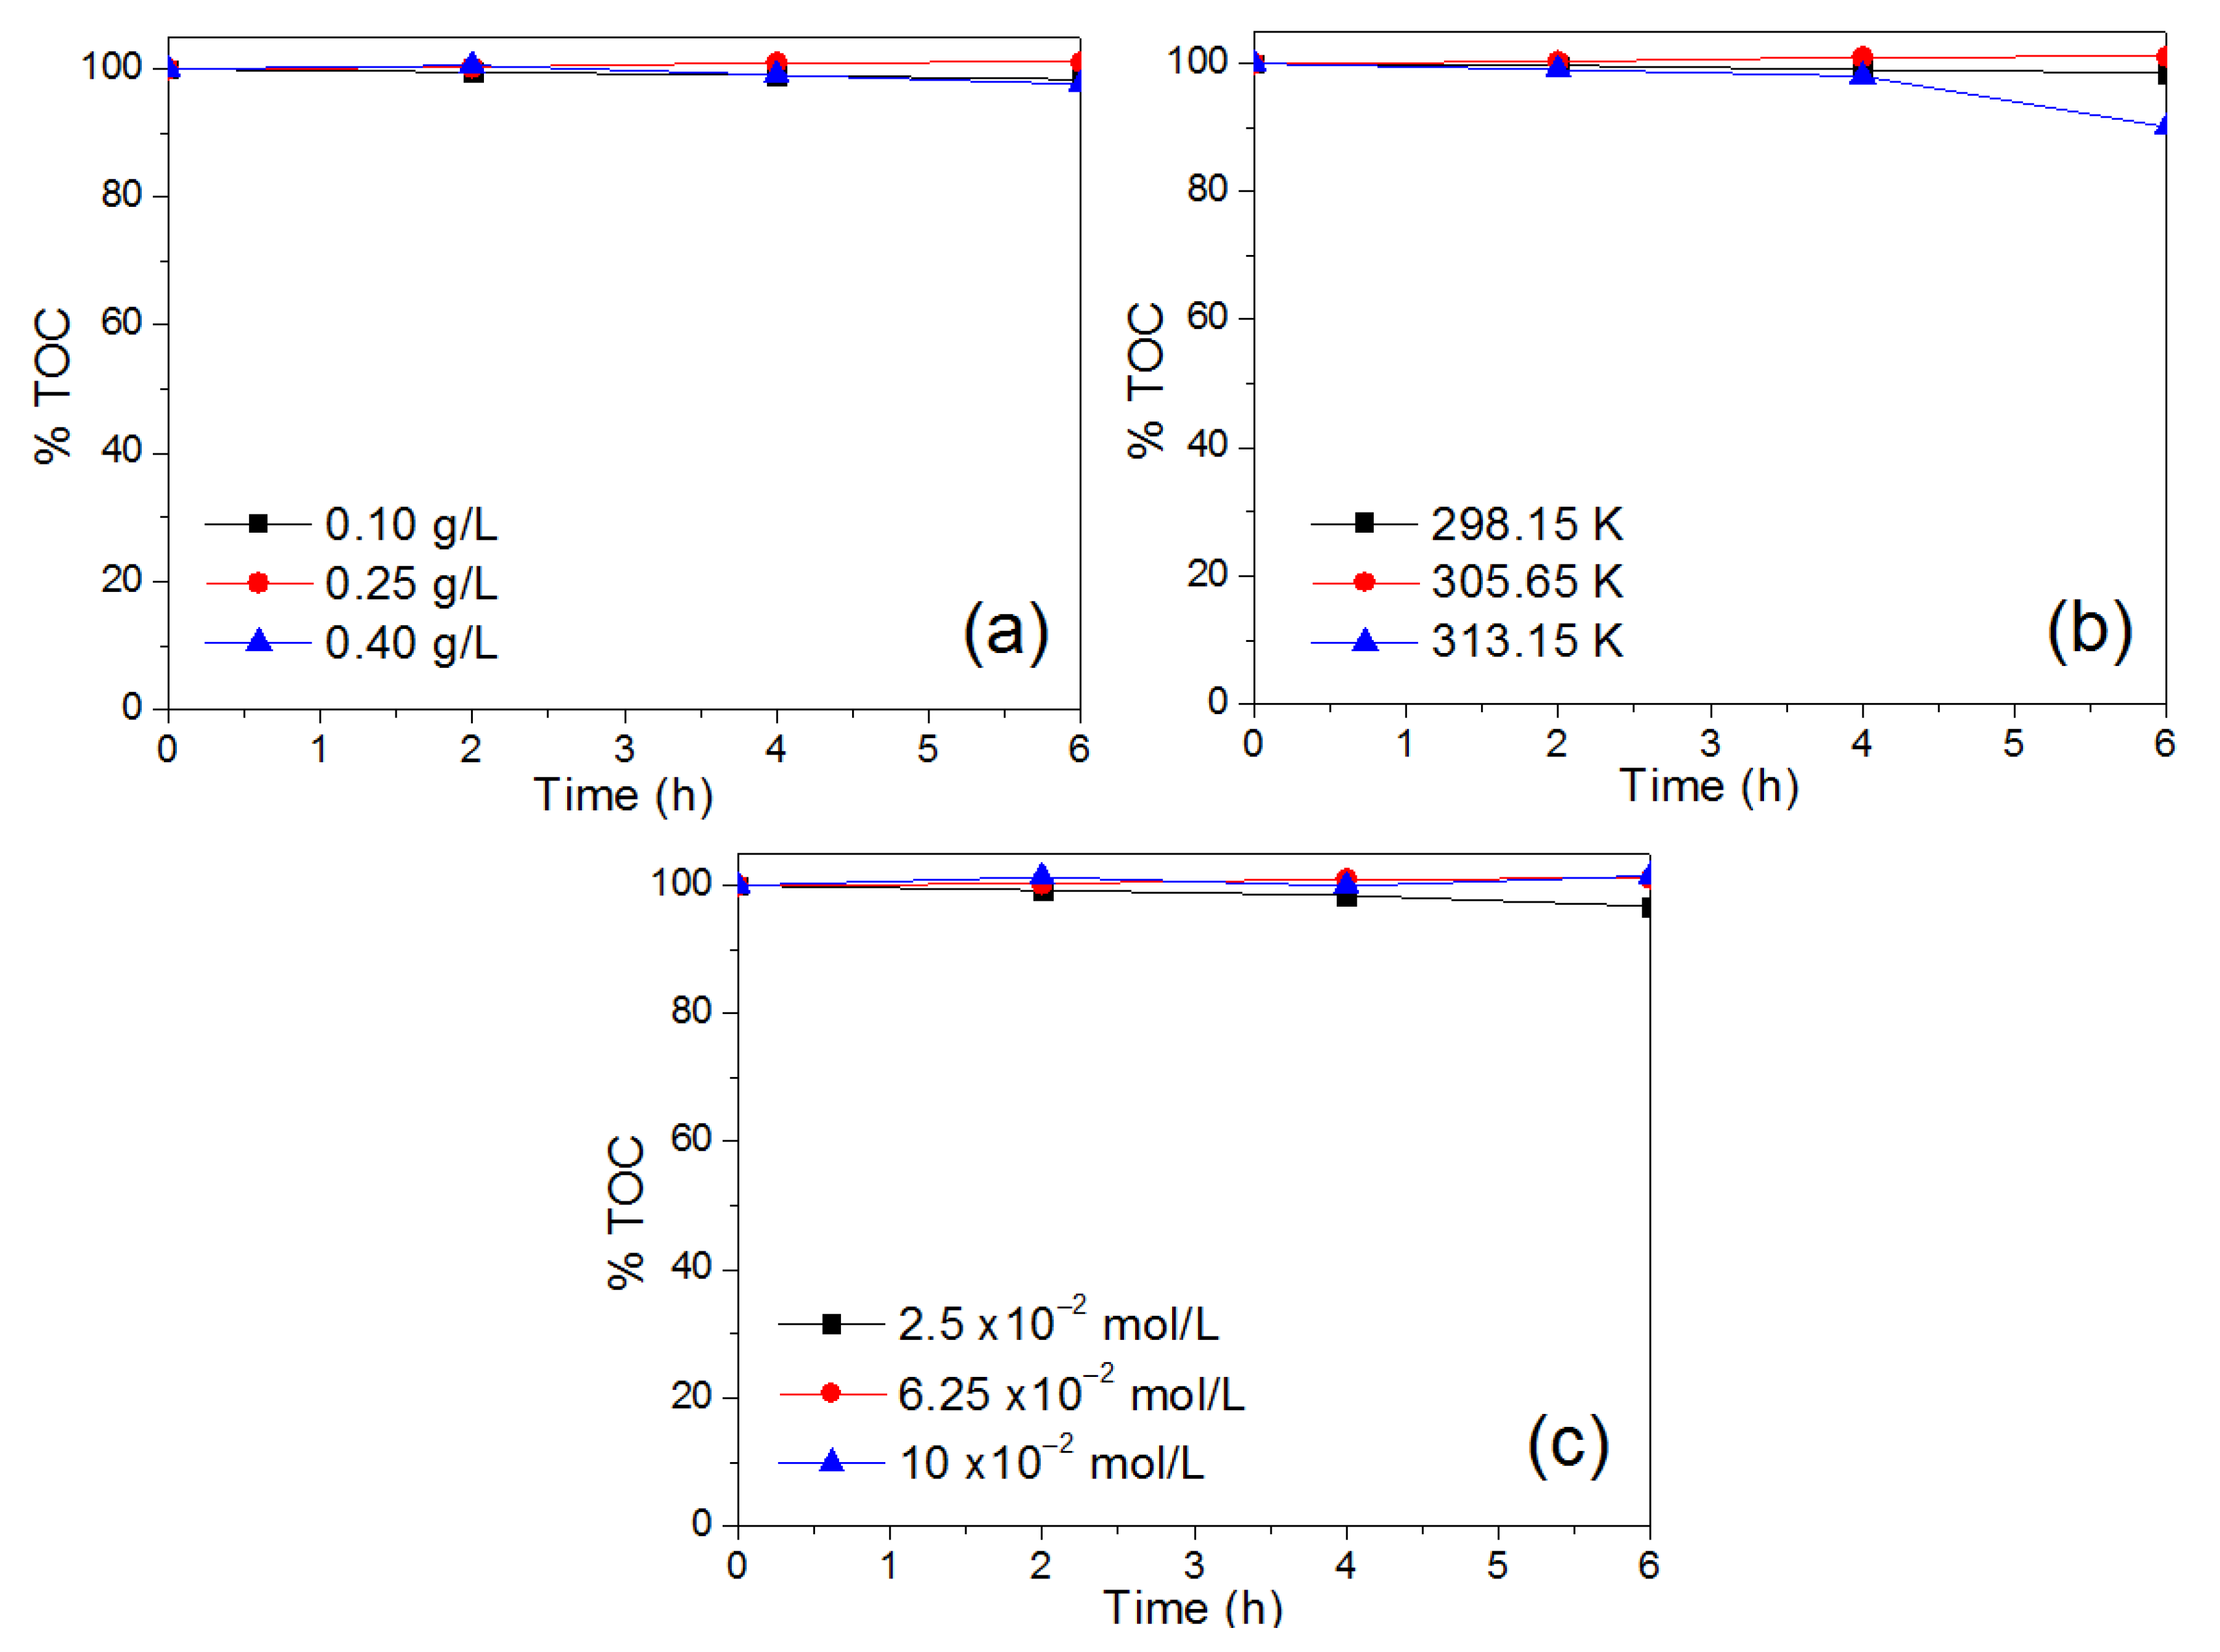
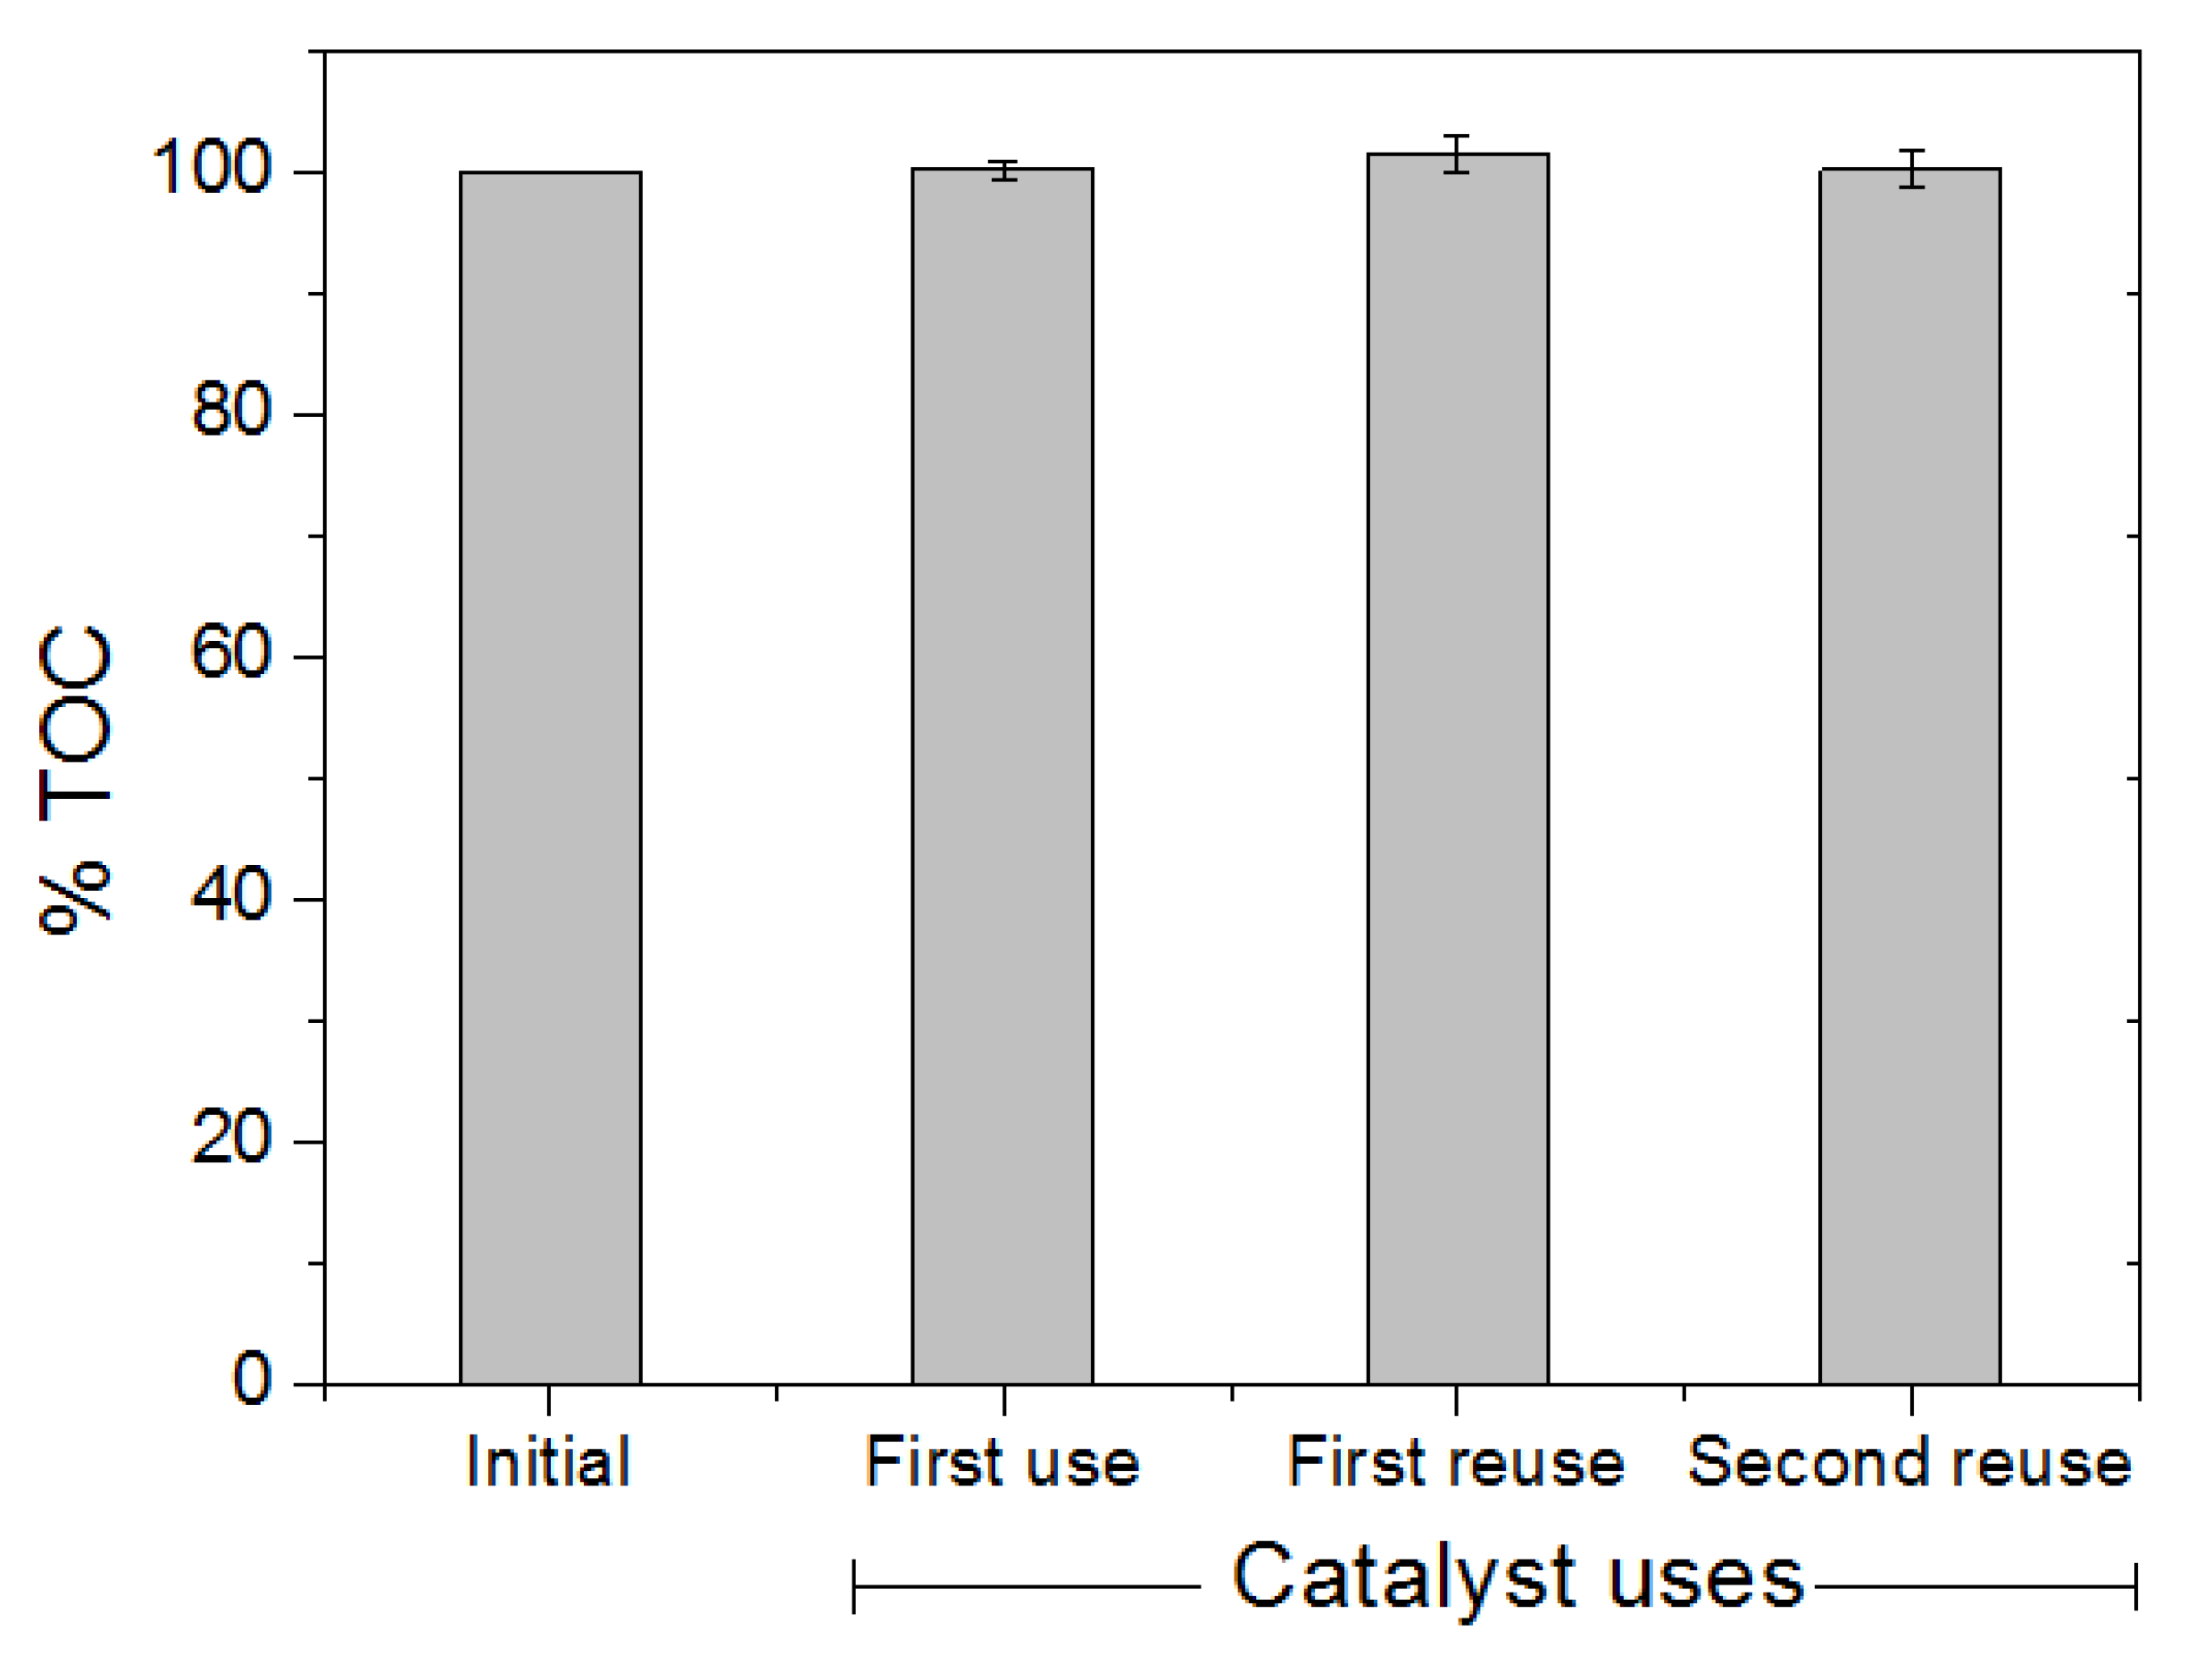
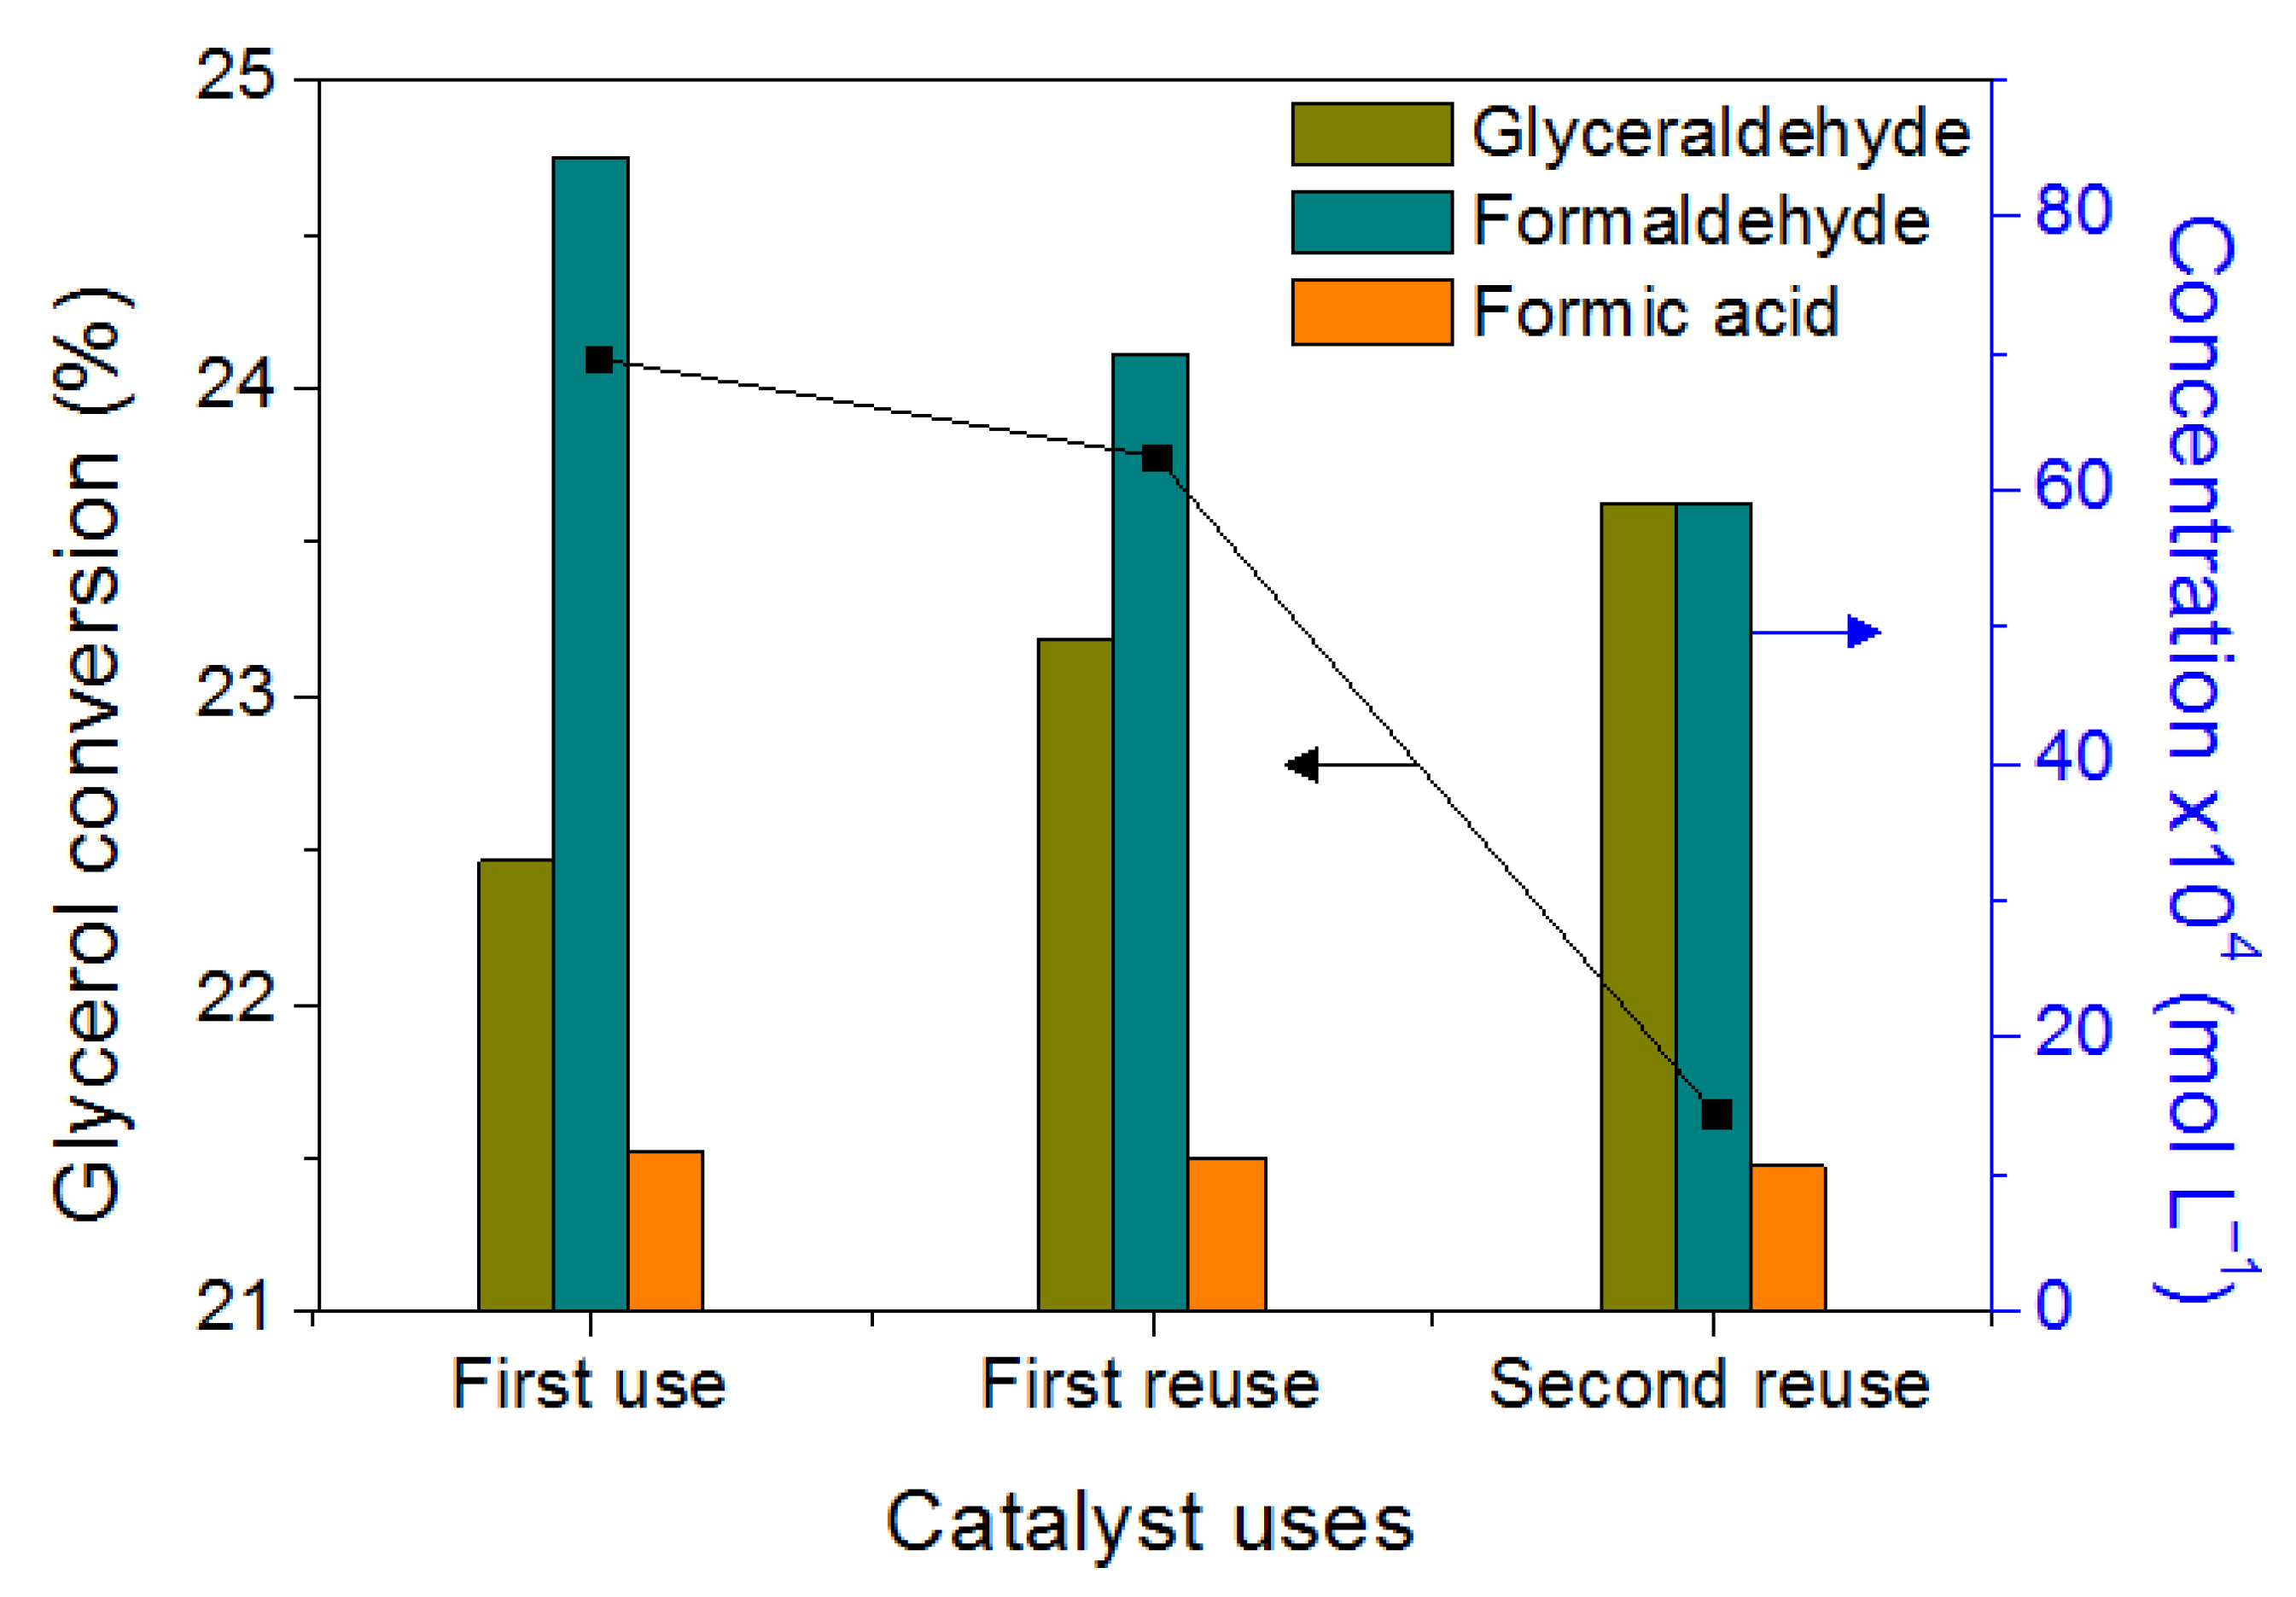
2.2.4. Total Organic Carbon Content
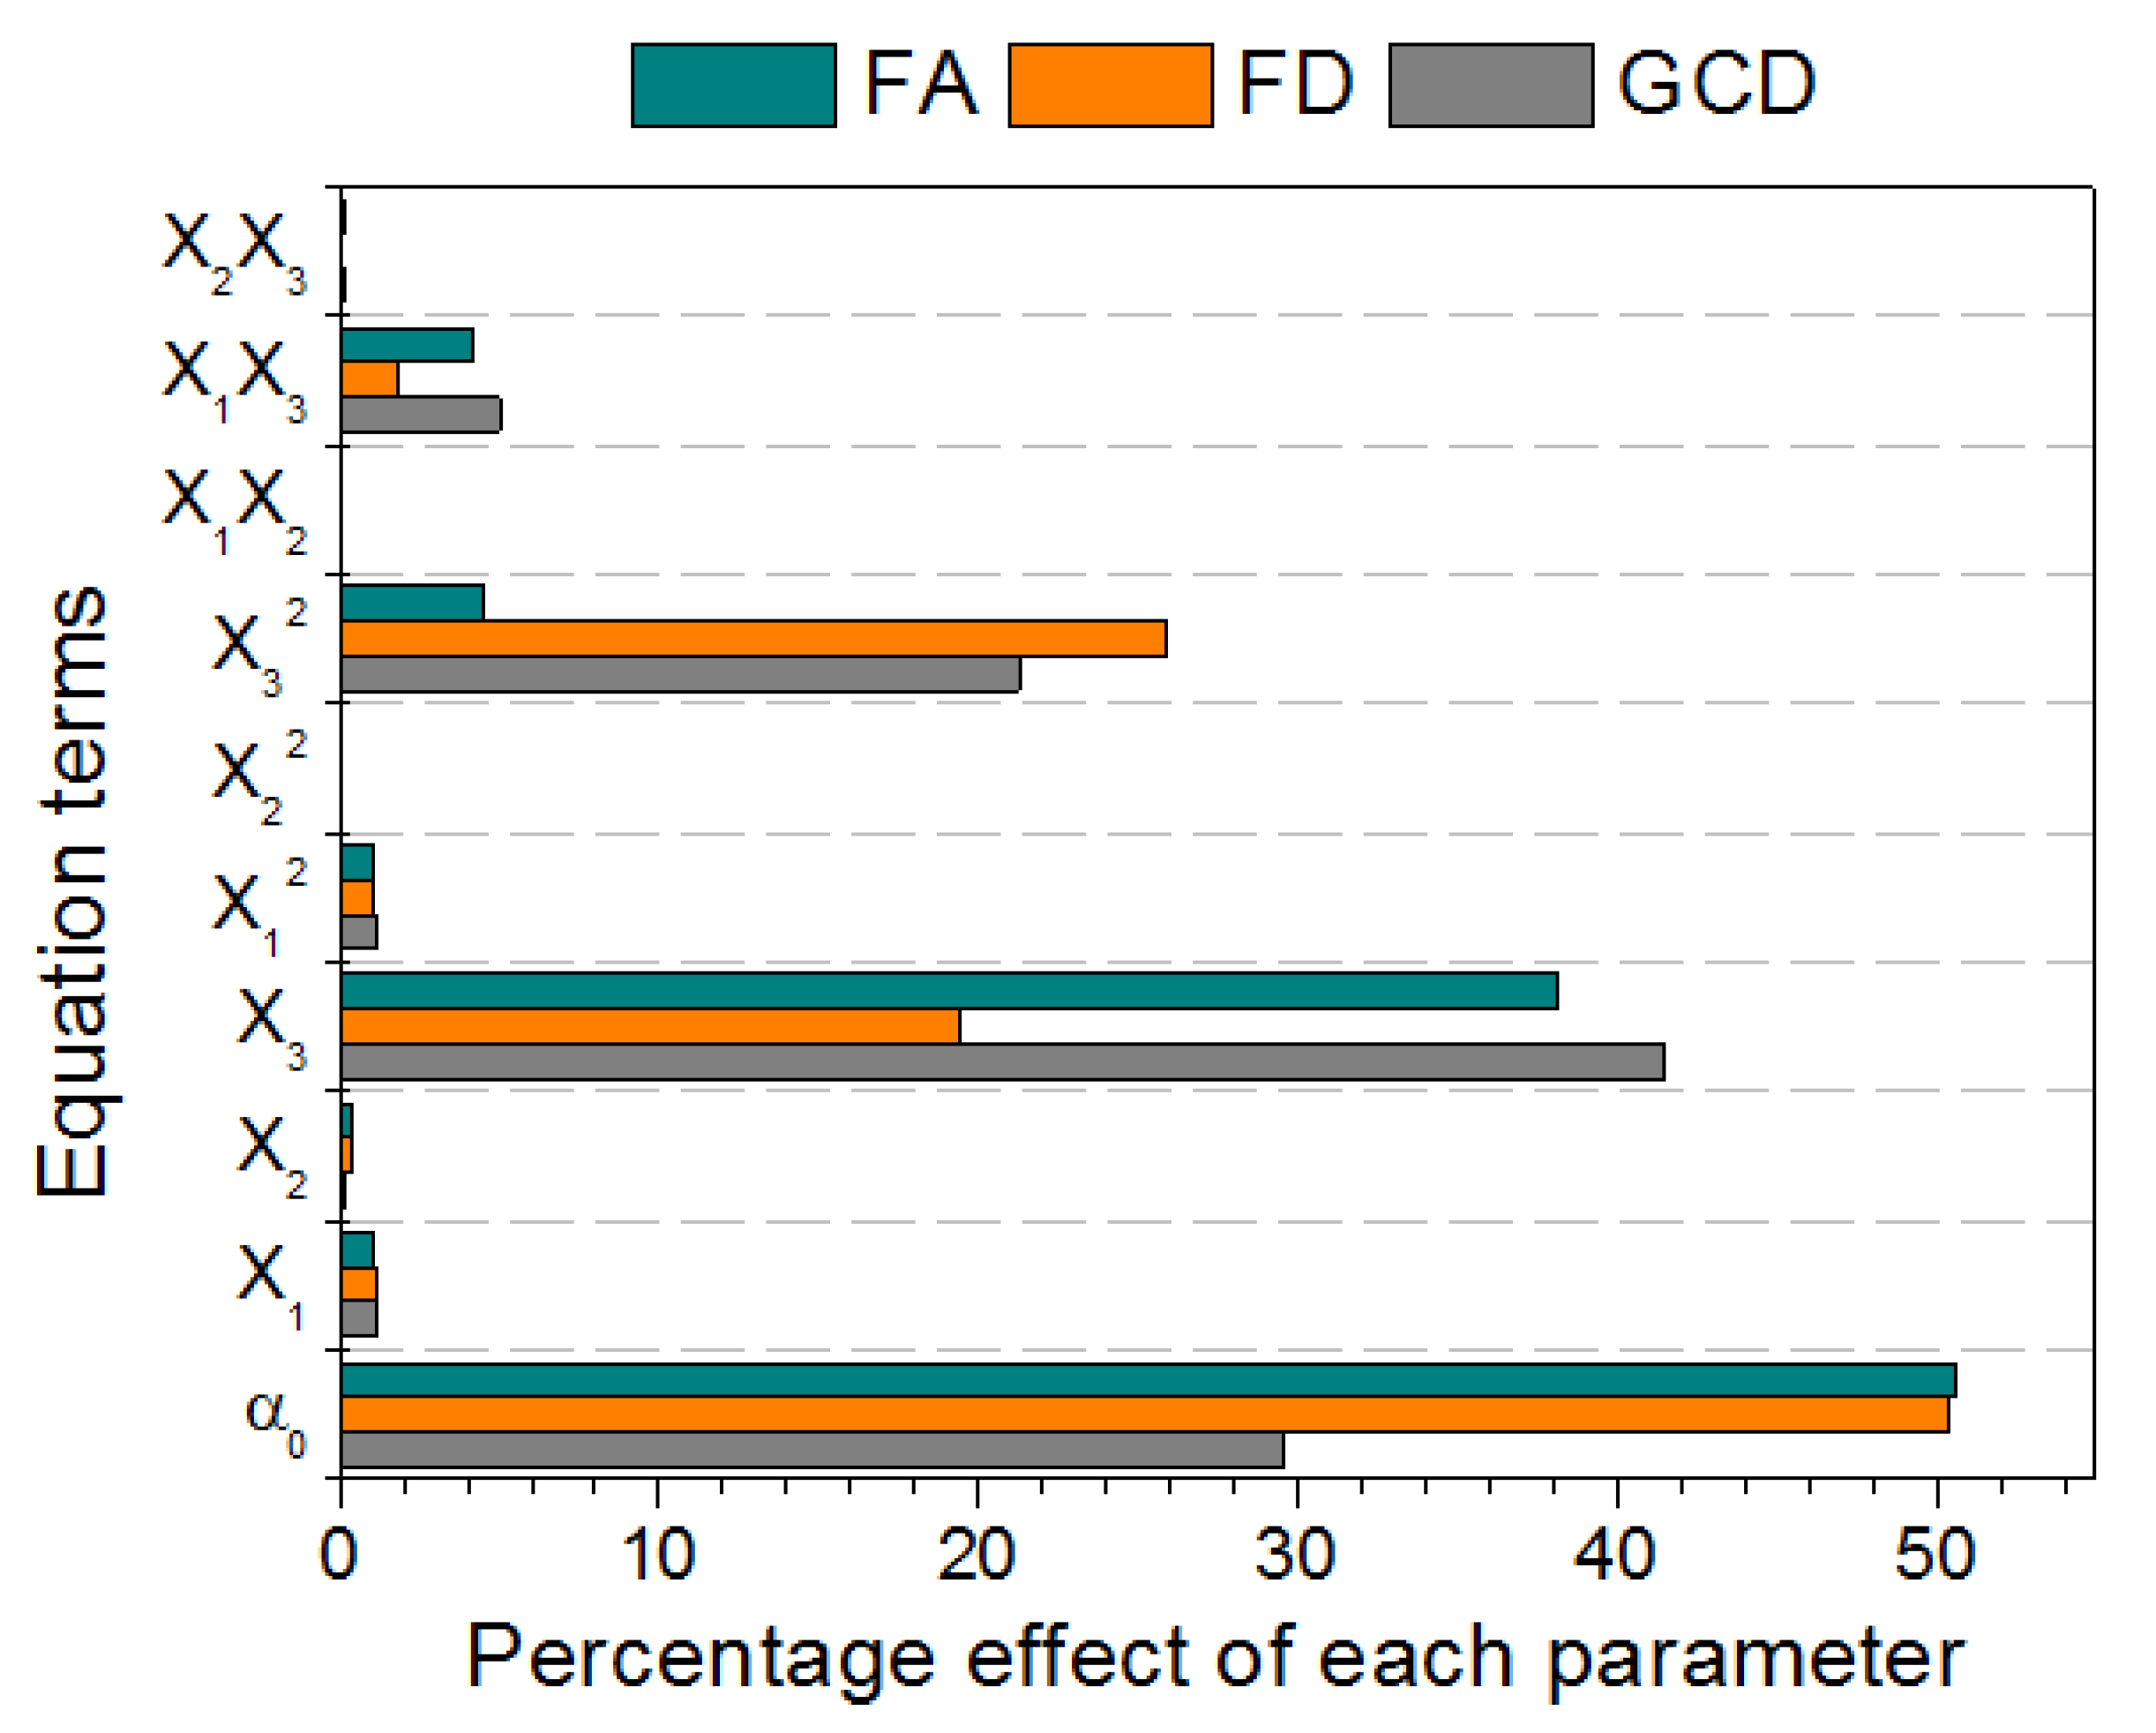
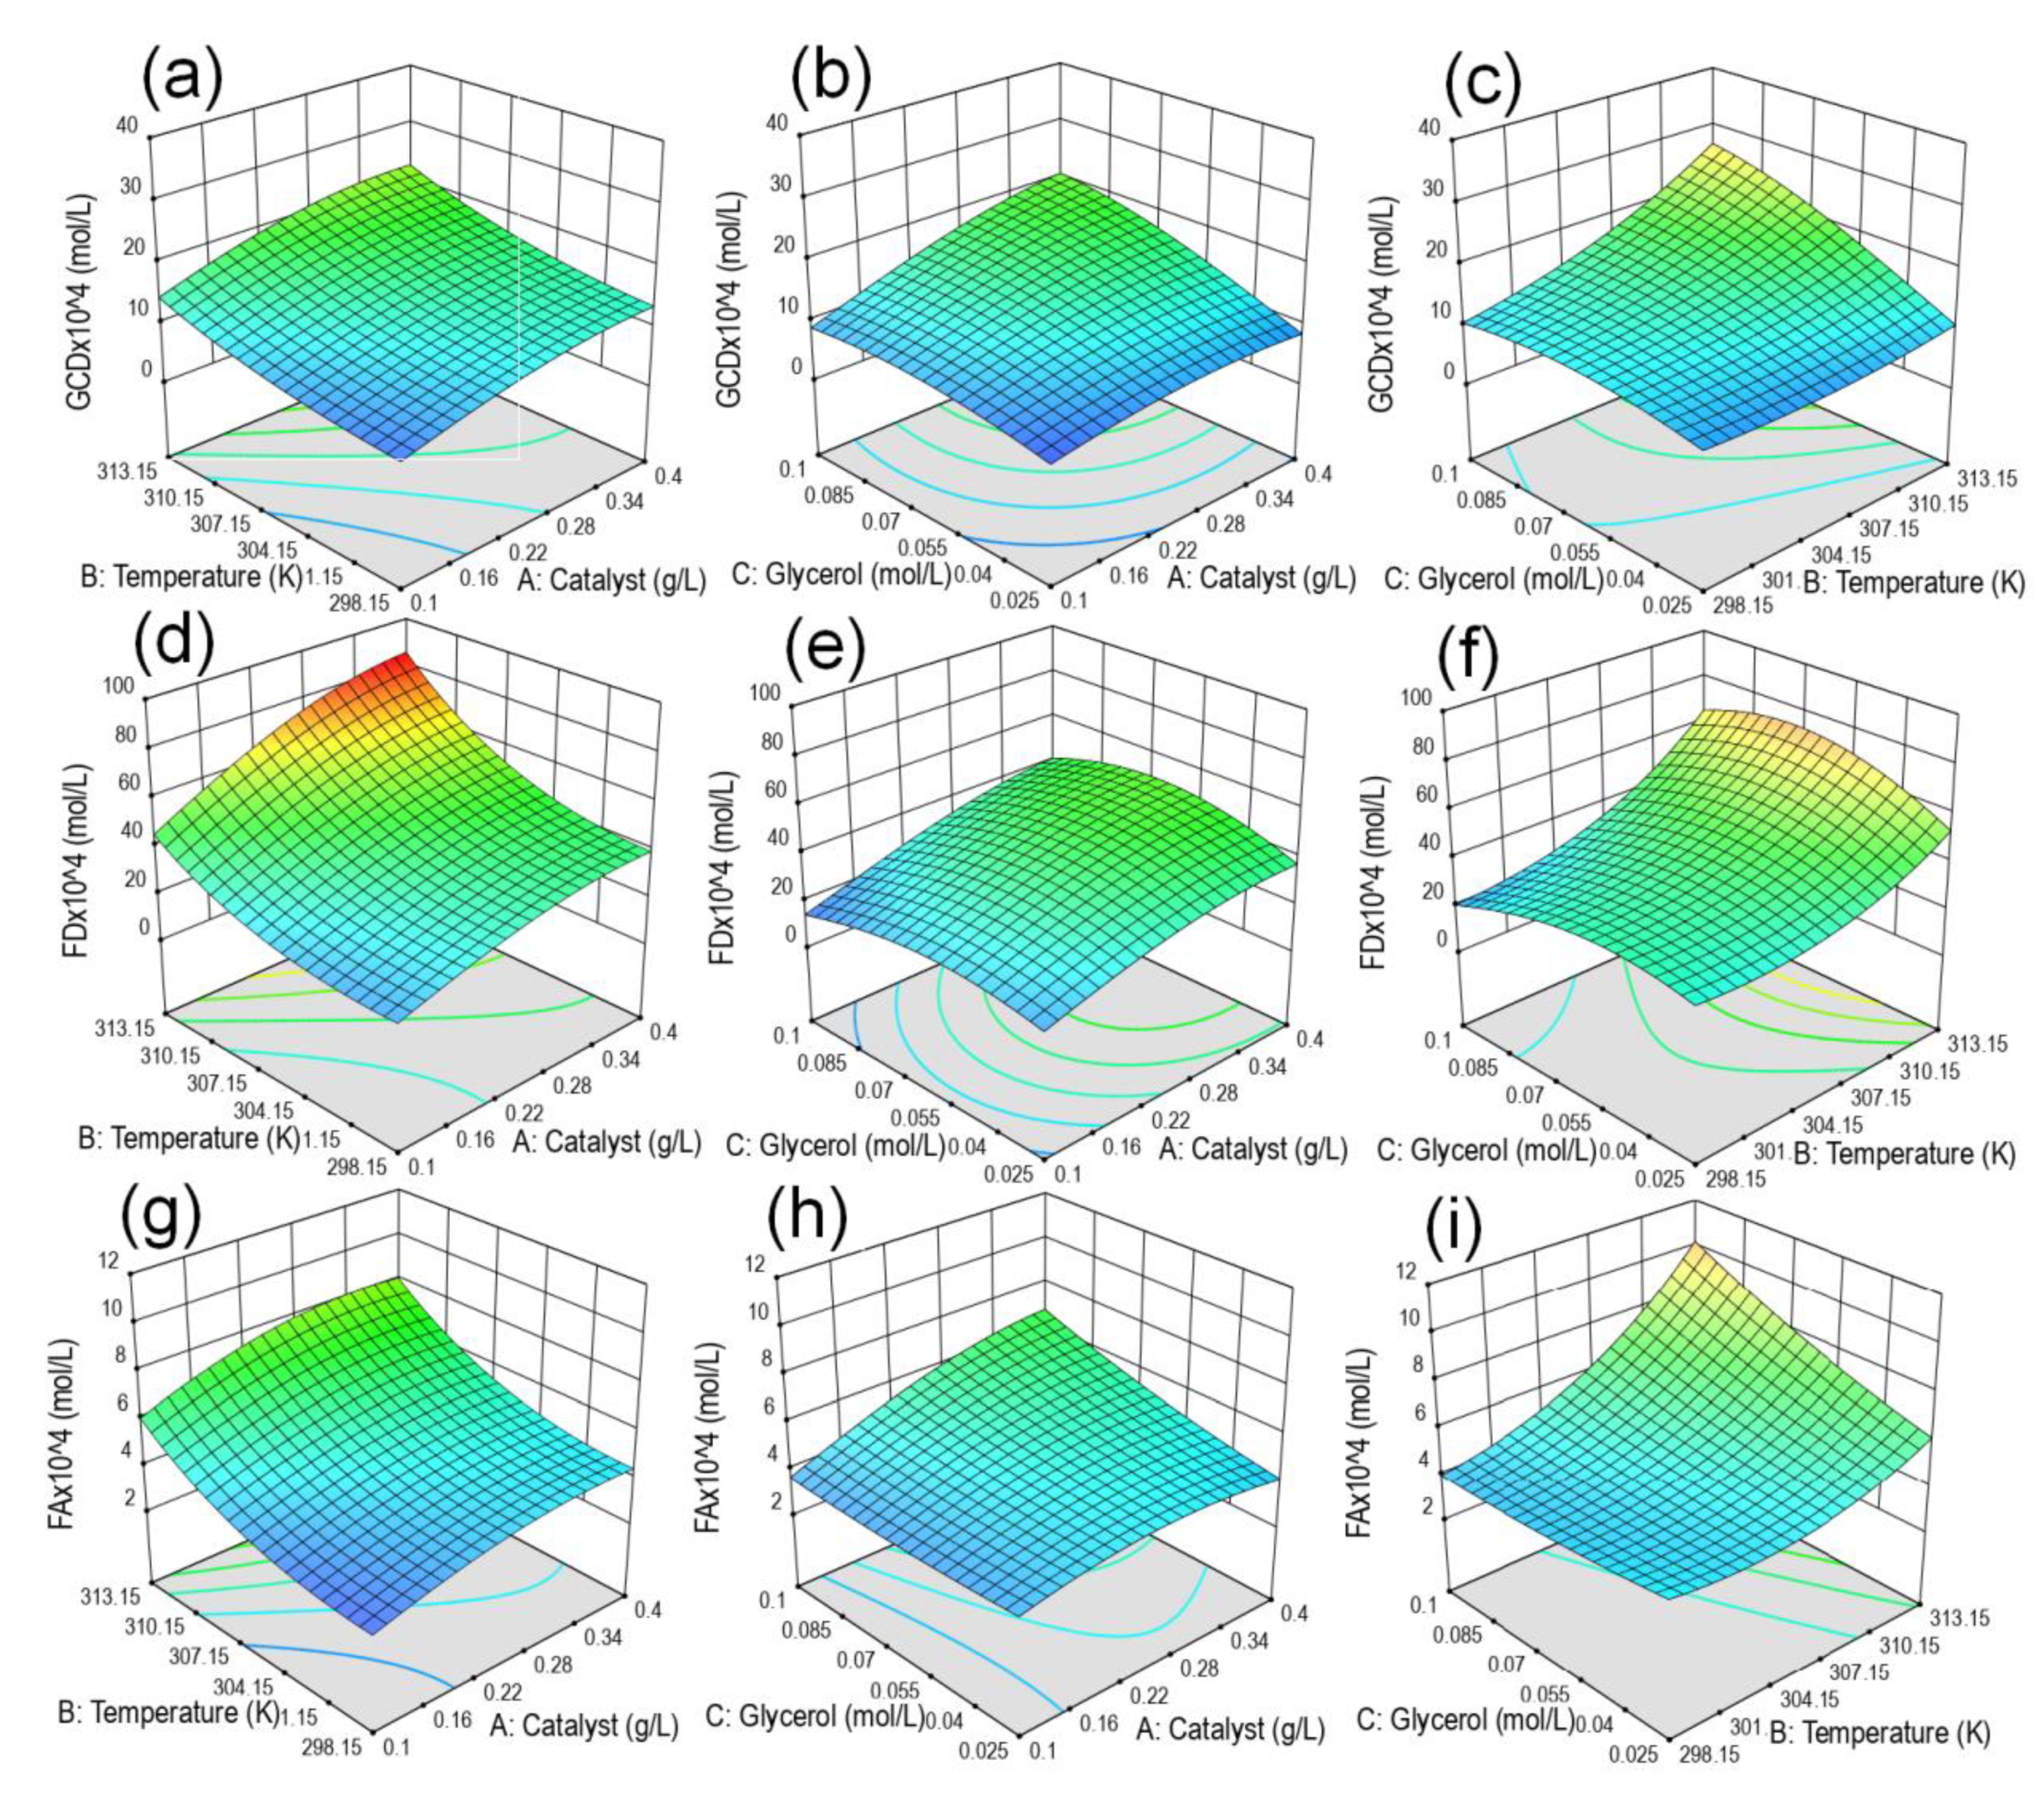
In order to evaluate the degree of mineralization during the glycerol photo-oxidation tests, measurements of the total organic carbon (TOC) content were carried out and the results are shown in Figure 14. As can be seen, the deep oxidation of glycerol towards CO2 and H2O was not achieved with respect to the variables studied. However, when a reaction temperature of 313.15 K is used, the maximum change in the TOC value is achieved with a decrease of 10% after 6 h of reaction, as can be seen in Figure 14b. This phenomenon is related to the high oxidation of the organic molecule, as well as of the intermediate compounds.

2.2.5. Optimization

The experimental design for the optimization of the independent variables, catalyst amount (X1), reaction temperature (X2), and glycerol concentration (X3), towards the concentration of the products is shown in Table 4. The polynomial equation for each response variable with its corresponding coefficients calculated from the experimental values using the response surface methodology is shown in Equations (5)–(7).
Sqrt (GCD × 104) = 301.49 + 11.25X₁ − 1.95X₂ − 423.22X₃ − 11.98X₁2 + 0.003X₂2 − 216.90X₃2 − 0.017X₁X₂ + 51.06X₁X₃ + 1.48X₁X₃
Sqrt (FD × 104) = 1133.21 − 25.54X₁ − 7.44X₂ − 435.56X₃ − 22.88X₁2 + 0.012X₂2 − 582.62X₃2 + 0.137X₁X₂ + 40.26X₁X₃ + 1.62X₁X₃
Sqrt (FA × 104) = 318.16 + 6.48X₁ − 2.08X₂ − 239.91X₃ − 6.40X₁2 + 0.003X₂2 + 28.46X₃2 − 0.012X₁X₂ + 26.49X₁X₃ + 0.764X₁X₃
The analysis of variance (ANOVA), as can be seen in Table S1 of the Supplementary Information, suggests a quadratic polynomial model with a square root transform for a better representation of the experimental data according to the value obtained from the coefficient of determination (R2), with values of 0.9908, 0.9949, and 0.9857 for the response variables GCD, FD, and FA, respectively. R2 values close to unity indicate a better fit of the data; otherwise small values indicate that the response values are not adequate to explain the behavior [56]. The values of the determination coefficients obtained in our study are higher than 0.7, therefore the effect of the independent variables on the response values can be appropriately described by the quadratic polynomial model (Fit Statistics can be seen in Table S1).
Pareto analysis was performed according to Equation (8) in order to determine the percentage effect of each factor (Pi) on the responses,
P i = ( α i i α i ) × 100
Figure 15 shows the Pareto graphic analysis. The results in this figure suggest that among the variables, α₃ (glycerol concentration, mol/L) produces the largest effect: 41.52%, 19.36%, and 38.16% on all responses (GCD, FD, and FA), respectively. Moreover, the interaction term α₁₃ (catalyst amount (g/L)*glycerol concentration (mol/L)), produces a medium effect 5.01%, 1.79%, and 4.21% on all responses (GCD, FD, and FA), respectively.
In order to observe the influence of the amount of catalyst, reaction temperature, and glycerol concentration on the response variables (products concentration), 3D plots are shown in Figure 16 by keeping one independent variable constant (at the central value) and varying the other two variables within the studied range. Figure 16a,d,g shows the change in reaction temperature and amount of catalyst with a constant glycerol concentration of 0.0625 mol/L, Figure 16b,e,h presents the variation in glycerol concentration and catalyst amount with a constant reaction temperature of 305.65 K, and Figure 16c,f,i exhibits the change in glycerol concentration and reaction temperature with a constant catalyst amount of 0.25 g/L, which allows to graphically observe the interaction of all the independent variables involved in this study.
The optimization of the values for the response variables is shown in Table 5. The optimization was carried out considering as objective goal the maximization of the GCD, FD, and FA products within the entire range of values of the independent variables. The result obtained with the highest desirability (0.984) was selected as the optimum point. The optimized reaction conditions were using a catalyst amount of 0.4 g/L, reaction temperature of 313.15 K, and glycerol concentration of 0.1 mol/L. The values of the response variables at the optimal conditions were 32.27 × 10⁻⁴, 81.74 × 10⁻⁴, and 11.47 × 10⁻⁴ mol/L for GCD, FD, and FA, respectively.
The optimal reaction conditions towards the maximization of the products were evaluated using TiO2 + UV, UV and visible light (λ > 400 nm), and the results are shown in Figure 17. Therefore, the photocatalytic activity during glycerol oxidation is lower in all processes compared to the Cu/TiO2 + UV system. The absence of copper species in titania (TiO2 + UV system) significantly reduces the concentration of the products, which is due to the fact that copper acts as an electron trap, see Equation (4), by reducing the recombination of photogenerated charges, which increases the formation of the main oxidative species (hydroxyl radicals). It can also be observed in Figure 17 that the glycerol oxidation also proceeds with UV light only. This might be due to the production of hydroxyl radicals from hydrogen peroxide that is being produced via the following two reactions [51],
H + O2 → HO2
HO2 + HO2 → H2O2 + O2
The generation of H2O2 was previously proven in the same reaction system, i.e., lamp and reactor [51]. Once the H2O2 is formed, this might be dissociated into hydroxyl radicals (responsible of glycerol oxidation) by a Fenton-like mechanism favored by the presence of Cu [51]. The proton that is activated for reaction (9) to proceed is believed to come from the interaction of an energetic enough light source and glycerol [51]. The oxygen in reaction (9) is the one in solution.
Thus, by contrasting the results in Figure 17, the photocatalytic effect of the synthesized material can be concluded. No effect of photolysis with visible radiation was observed.
On the other hand, only glyceraldehyde was obtained as a primary oxidation product with a concentration of 2.22 × 10⁻⁴ mol/L when using Cu/TiO2 + visible light, and a low concentration of formaldehyde (6.92 × 10⁻⁴ mol/L) and formic acid (0.92 × 10⁻⁴ mol/L) as secondary products compared to those obtained with Cu/TiO2 + UV radiation (84.29 × 10⁻⁴ mol/L and 11.61 × 10⁻⁴ mol/L, respectively), according to the scheme proposed in Figure 9. This behavior is related to the low activation of the catalyst, since the visible radiation did not provide enough energy to generate a greater number of electron/hole pairs (see Figure S2), despite the fact that the semiconductor presented a reduction in the band-gap energy (see Table 2), which has been reported in other investigations [38,39,40]. However, the selectivity towards formaldehyde is favored by using visible radiation (69%) instead of UV light (65%), as can be seen in Figure 17. The pH before (5.8) and after (3.6) the process for the Cu/TiO2 + UV system suggests the generation of acid species, in this case the formation of formic acid as a secondary product during the photo-oxidation of glycerol [57].
The stability of the synthesized Cu/TiO2 catalyst was evaluated under optimal reaction conditions using two catalyst reuse cycles. The TOC content was evaluated after each cycle and the results are shown in Figure 18. As can be seen, there is no change in the TOC value at the end of each cycle, which is related to the partial oxidation of glycerol without reaching a deep level of oxidation in terms of mineralization in each reuse. This is a relevant result since mineralization is a main cause of selectivity loss reported in other works [58]. Although H2 has been identified and quantified as a product from the photocatalytic oxidation of glycerol [21,27], in this study, the investigation was centered only on the generated organic products.
The percentage of glycerol degradation and distribution of products formed for each reuse cycle are shown in Figure 19. During the catalyst recycling experiments, a decrease of only 2.5% in the percentage of glycerol degradation can be observed. This decrease can be ascribed to the inherent experimental error and to catalyst loss during sampling and recovery in each cycle [59]. The oxidation towards formaldehyde as secondary reaction product is also diminished and the accumulation of glyceraldehyde, as a primary product, is increased after each reuse cycle.
The main species involved in the oxidation of organic molecules were evaluated. The effect of scavengers of holes and hydroxyl radicals was studied on the percentage of glycerol degradation and the results are shown in Figure 20. As can be seen in Figure 20, the presence of methanol (MeOH) in the reaction system as a hole scavenger [60,61] inhibits the conversion of glycerol to approximately 7%. Similarly, the introduction of salicylic acid (SA) as a scavenger of hydroxyl radicals [62] inhibits the conversion of glycerol to a greater extent. The almost null conversion using SA confirms that hydroxyl radicals are the dominant oxidative species, whose generation is through reactions (2), (12), (13) and (14). In addition, the results when using MeOH suggest that holes on the titania surface are also reactive species in the glycerol oxidation. On the other hand, the electron trapped by the copper species can be scavenged by the oxygen present and by the hydrogen peroxide formed [38], thus generating other reactive species by reactions (11) and (12), which becomes a cycle of electron capture and donation during photocatalytic activation. The presence of Cu2+ species after the catalyst first use was corroborated by XPS analysis (see Figure S3).
Cu+ + O2 → Cu2+ + O2
Cu+ + H2O2 → Cu2+ + OH + OH
H2O2 + hv → 2OH
H2O2 + ecbOH + OH
The production rate values for GCD and FD obtained with TiO2 and other metal/TiO2 catalysts are summarized in Table 6. Formic acid was not considered in this table because it was not quantified in the related literature. It is worth pointing out that the comparison should be taken with caution since the values reported in Table 6 were obtained under a different radiation field and a reactor completely different to that used in this work. At this point, it is worth recalling that the radiation intensity and reactor design affect oxidation rate [63]. Nevertheless, it is important to notice that the accumulation rate of GCD and FD in this work is one and two orders of magnitude higher, respectively, than in previous studies where the glycerol photo-oxidation is catalyzed by other metals. It is worth clarifying that it was decided to use the term accumulation rather than production because is likely that those values are reflecting the rate of production and consumption. This is because oxidation is acknowledged to proceed via the attack of hydroxyl radicals, which are not selective at all. Thus, these radicals may be attacking the glycerol molecule and concomitantly, albeit at a different rate, the oxidation products such as GCD and FD in such a way that a higher amount of available hydroxyl radicals will be reflected in a higher oxidation degree of all molecules, which will also decrease the concentration of all of them. Therefore, the values in Table 6 suggest that Cu/TiO2 is not more active than the other catalysts but is more selective by “dosing” the hydroxyl radical production.
Based on the results found with the Cu/TiO2 catalyst presented in this work, it can be said that one of its advantages over the other TiO2-based catalysts presented in Table 6, is to attain a high selectivity towards formaldehyde and glyceraldehyde without using an expensive metal as platinum. Another advantage is its capability of being re-used.

3. Materials and Methods

3.1. Synthesis of Photocatalysts

The synthesis through the EISA approach was carried out according to the following methodology: titanium butoxide (Ti(OC4H9)4) was added to ethanol (C2H6O) to form a sol, then a surfactant (copolymer P123) was incorporated and the mixture was kept under stirring for 30 min. Subsequently, the copper precursor (Cu(NO3)2∙3H2O) was added in a ratio of 5 at.% Cu with respect to the Ti species, and finally nitric acid (HNO3) was dropwise added. The mixture was kept under constant stirring for 3 h, dried in a rotary evaporator, and calcined at 400 °C for 4 h with an intermediate stage at 300 °C for 1 h and a rate of 1 °C/min. Titanium precursor, solvent, surfactant, and acid were used in a molar ratio of 5.8 × 10⁻³:1.085 × 10⁻¹:1.03 × 10⁻⁴:2.06 × 10⁻², respectively. Cu-free TiO2 was synthesized by the same methodology for comparative purposes.

3.2. Characterization

X-ray diffraction (XRD) was used to characterize the synthesized materials using a Bruker diffractometer (Advanced D8, Billerica, MA, USA) with Kα radiation and the spectra were recorded in 2θ degrees between 22–66°. The crystal size (D) of the nanostructures was estimated by the Debye–Scherrer equation (D = kλ/β cos θ), while the distortion of the crystal lattice by Ɛ = β/4 tg θ, where k = 0.9, λ = 1.54 Å is the wavelength of the X-ray radiation, θ is the diffraction angle, and β is the full-width at half-maximum (FWHM) of the anatase peak.
The textural properties of the catalysts were determined by nitrogen physisorption using Autosorb equipment (Quantachrome, Boynton Beach, FL, USA) at 77 K. The specific surface area and the average pore diameter were estimated by the BET and BJH methods, respectively. Before the analysis, the samples were degassed under vacuum for 2 h at 250 °C.
Band-gap energies were determined by UV–Vis diffuse reflectance spectroscopy (DRS) using a spectrophotometer (Lambda 35, Perkin-Elmer, Waltham, MA, USA) equipped with an integrating sphere (Labsphere RSA-PE-20, North Sutton, NH, USA).
The copper content was determined by atomic absorption spectroscopy (AAS). The solid was dissolved by hydrofluoric acid, diluted in deionized water and analyzed in a Perkin Elmer Spectrophotometer (AAnalyst 200, Waltham, MA, USA).
Images of the crystalline particles were obtained by transmission electron microscopy (TEM) using a JEOL 2100 microscope at 200 kV and with a LaB6 filament (Peabody, MA, USA). The size and shape of the catalytic particles were determined by scanning electron microscopy (SEM) with a JEOL microscope (JSM-6510LV model, Peabody, MA, USA) at 25 kV. Energy dispersive X-ray spectroscopy (EDS) was carried out to estimate the copper composition in the synthesized catalyst using a voltage of 20 kV and a magnification of 550×.
Analysis by XPS (X-ray photoelectron spectroscopy) were carried out in a JPS-9200 spectrometer (Peabody, MA, USA) using an Al Kα radiation source and taking as reference the binding energy of C 1s (284.6 eV).

3.3. Photo-Oxidation of Glycerol

The photo-oxidation reactions of glycerol were conducted in a batch type annular reactor with an internal diameter of 2.5 cm and a height of 20 cm. The radiation source was supplied by a mercury UV lamp of 8 W (Analytik Jena, Upland, CA, USA) placed at the center of the reactor with a typical intensity of 166 W/m2 and a primary wavelength of 254 nm. The desired temperature was kept constant inside the reactor during all the photocatalytic tests by means of a thermal bath. A typical reaction was carried out as follows: 0.1 L of glycerol solution was placed in the reactor and then the catalyst was added and kept under constant stirring, finally the UV lamp was turned on to start the catalytic photo-oxidation, which was maintained for 6 h. Amount of catalyst (0.1, 0.25, and 0.4 g/L), glycerol concentration (0.025, 0.0625, and 0.1 M), and reaction temperature (298.15, 305.65, and 313.15 K) were the studied variables. The best reaction conditions were compared to TiO2 + UV, UV, and visible light processes. Visible light (λ > 400 nm) was supplied by three linear fluorescent lamps (TL5 Essential 14 W/840, Philips Lighting, Amsterdam, the Netherlands). Deionized water was used in all experiments.

3.4. Analytical Methods

To assess the glycerol oxidation, several aliquots were removed from the reaction system every 2 h, filtered (nylon membrane 0.2 μm) to remove solid particles, and analyzed by ultra high-performance liquid chromatography (UHPLC). The chromatograph (Vanquish) equipped with a RefractoMax 521 Refractive Index Detector (Thermo Scientific, Waltham, MA, USA) was used to identify the glycerol and products obtained after oxidation. The column (5 µm, 7.8 × 300 mm, Carbomix Ca-NP, Newark, DE, USA) was kept at 80 °C with a flow rate of 0.6 mL/min (deionized water). For acid compounds, a column (9 µm, 7.8 × 300 mm, Aminex HPX-87H, Hercules, CA, USA) at 60 °C and a flow rate of 0.5 mL/min (3 mM H2SO4 solution) was used. The reaction products were quantified using calibration curves.
The Total Organic Carbon (TOC) content was determined with a TOC-L analyzer (Shimadzu, TOC-L CPH/CPN PC-Controlled model, Kyoto, Japan) by catalytic combustion oxidation and infrared identification. Before analysis, 100 µL of the previously filtered sample was added to a 10 mL volumetric flask with deionized water. The TOC concentration was determined according to the corresponding calibration curve.

3.5. Experimental Design

The effect of the independent variables namely, catalyst amount (X1), reaction temperature (X2), and glycerol concentration (X3) on the concentration of the GCD (Y1), FD (Y2), and FA (Y3) products was studied using the response surface methodology, which follows a face-centered central composite design (FCCCD) with three factors with three levels (see Table 7). Twenty treatments were used randomly according to the central composite design with eight factorial, six axial, and six central points. In addition, a polynomial model of second order was used to evaluate the response values (GCD, FD, and FA concentration) as a function of the independent variables, as shown in Equation (15).
Yi = α₀ + α₁X₁ + α₂X₂ + α₃X₃ + α₁₁X₁2 + α₂₂X₂2 + α₃₃X₃2 + α₁₂X₁X₂ + α₁₃X₁X₃ + α₂₃X₂X₃
where Yi represents the values of each response variable, the alpha terms are the coefficients (linear, quadratic, and interactive), and the term α0 is a constant. The calculation of the coefficients and the statistical parameters were determined using the Design Expert software (version 10.0.8).

4. Conclusions

In this study, titania doped with Cu2+ cations was successfully prepared using the EISA method. The incorporation of copper doping species doubled the surface area of TiO2 up to 242 m2/g and a reduction of the band gap energy was obtained to a value of 2.55 eV. This method allowed obtaining anatase crystalline phase nanocrystals with average sizes of approximately 8 nm and irregular particle sizes ranging from 30 to 100 μm.
The synthesized material proved to be a promising catalyst in selective oxidation during the photocatalytic reaction of glycerol. The compounds formed as a result of the glycerol oxidation were glyceraldehyde, formaldehyde, and formic acid, which are value-added products with industrial importance. The selectivity was favored towards formaldehyde as a secondary product, compared to glyceraldehyde, which is the primary product during glycerol oxidation. Complete oxidation of the glycerol molecule was not observed.
The response surface methodology was used to optimize the independent variables (catalyst amount, reaction temperature, and glycerol concentration) and their relationship with the response variables (product concentration). The optimal conditions towards the maximization of the products considering the desirability function were achieved with the highest values of the independent variables (catalyst loading = 0.4 g/L, glycerol concentration = 0.1 mol/L, and temperature 313.15 K), obtaining concentrations for glyceraldehyde, formaldehyde, and formic acid of 3.23, 8.17, and 1.15 mM, respectively. Under these conditions, the Cu/TiO2 + UV system was superior to the TiO2 + UV, UV, and Cu/TiO2 + Vis processes. The selectivity towards formaldehyde was improved with visible radiation under the optimal reaction conditions. It was found that glycerol oxidation photo-catalyzed by Cu/TiO2 proceeds mainly by hydroxyl radicals attack.
The independent variable affecting the most of responses is glycerol concentration and therefore special attention should be given to such a variable. The synthesized catalyst exhibits an excellent capability for being re-used.

Supplementary Materials

The following supporting information can be downloaded at: https://www.mdpi.com/article/10.3390/catal12080835/s1, Figure S1: Energy Dispersive Spectroscopy analyzes for the Cu/TiO2 catalyst; Figure S2: Photometric spectrum of the visible radiation lamp used during the photocatalytic tests; Figure S3: XPS spectra of (a) Ti 2p, (b) O 1s, and (c) Cu 2p for the Cu/TiO2 catalyst after first use; Table S1: ANOVA for Quadratic model.

Author Contributions

Conceptualization, R.N. and O.A.-G.; methodology, R.N., S.L.M.-V., J.E.-V. and A.M.-Z.; software, S.L.M.-V. and A.R.-M.; validation, O.A.-G.; formal analysis, R.N., S.L.M.-V. and O.A.-G.; investigation, O.A.-G. and A.M.-Z.; resources, R.N., R.R. and J.E.-V.; data curation, A.R.-M. and O.A.-G.; writing—original draft preparation, O.A.-G.; writing—review and editing, R.N., R.R. and A.R.-M.; visualization, O.A.-G. and A.M.-Z.; supervision, R.N., R.R. and A.M.-Z.; project administration, R.N. and R.R.; funding acquisition, R.N., R.R. and J.E.-V. All authors have read and agreed to the published version of the manuscript.

Funding

O. Avilés is grateful to COMECYT–Mexico (CAT2021-0032) and authors are grateful to UAEMex for financial support through project 6518/2022CIB.

Data Availability Statement

The data presented in this study are available on request from corresponding author (R.N.).

Acknowledgments

Authors are grateful to CCIQS (UAEM-UNAM) for the provided support. The technical support of María Citlalit Martínez Soto is also acknowledged.

Conflicts of Interest

The authors declare no conflict of interest.

References

  1. Garlapati, V.K.; Shankar, U.; Budhiraja, A. Bioconversion technologies of crude glycerol to value added industrial products. Biotechnol. Rep. 2016, 9, 9–14. [Google Scholar] [CrossRef] [PubMed] [Green Version]
  2. Bagnato, G.; Iulianelli, A.; Sanna, A.; Basile, A. Glycerol Production and Transformation: A Critical Review with Particular Emphasis on Glycerol Reforming Reaction for Producing Hydrogen in Conventional and Membrane Reactors. Membranes 2017, 7, 17. [Google Scholar] [CrossRef] [PubMed]
  3. Zhang, P.; Yue, C.; Fan, M.; Haryonob, A.; Leng, Y.; Jiang, P. The selective oxidation of glycerol over metal-free photocatalysts: Insights into the solvent effect on catalytic efficiency and product distribution. Catal. Sci. Technol. 2021, 11, 3385–3392. [Google Scholar] [CrossRef]
  4. Villa, A.; Jouve, A.; Sanchez Trujillo, F.J.; Motta, D.; Prati, L.; Dimitratos, N. Exploring the Effect of Au/Pt Ratio on Glycerol Oxidation in Presence and Absence of a Base. Catalysts 2018, 8, 54. [Google Scholar] [CrossRef] [Green Version]
  5. Li, X.; Zhang, Y. Oxidative Dehydration of Glycerol to Acrylic Acid over Vanadium-Substituted Cesium Salts of Keggin-Type Heteropolyacids. ACS Catal. 2016, 6, 2785–2791. [Google Scholar] [CrossRef]
  6. Jedsukontorn, T.; Meeyoo, V.; Saito, N.; Hunsom, M. Route of glycerol conversion and product generation via TiO2-induced photocatalytic oxidation in the presence of H2O2. Chem. Eng. J. 2015, 281, 252–264. [Google Scholar] [CrossRef]
  7. Lu, Z.; Demianets, I.; Hamze, R.; Terrile, N.J.; Williams, T.J. A Prolific Catalyst for Selective Conversion of Neat Glycerol to Lactic Acid. ACS Catal. 2016, 6, 2014–2017. [Google Scholar] [CrossRef]
  8. Chi, Z.; Pyle, D.; Wen, Z.; Frear, C.; Chen, S. A laboratory study of producing docosahexaenoic acid from biodiesel-waste glycerol by microalgal fermentation. Process Biochem. 2007, 42, 1537–1545. [Google Scholar] [CrossRef]
  9. Liu, C.; Hirohara, M.; Maekawa, T.; Chang, R.; Hayashi, T.; Chiang, C.-Y. Selective electro-oxidation of glycerol to dihydroxyacetone by a non-precious electrocatalyst–CuO. Appl. Catal. B Environ. 2020, 265, 118543. [Google Scholar] [CrossRef]
  10. Hermes, N.A.; Corsetti, A.R.; Pacheco, A.S.; Lansarin, M.A. Photocatalytic Oxidation of Glycerol over ZnO: Systematic Evaluation of Reaction Parameters. J. Adv. Oxid. Technol. 2015, 18, 315–321. [Google Scholar] [CrossRef] [Green Version]
  11. Zhang, Y.; Zhang, N.; Tang, Z.-R.; Xu, Y.-J. Identification of Bi2WO6 as a highly selective visible-light photocatalyst toward oxidation of glycerol to dihydroxyacetone in water. Chem. Sci. 2013, 4, 1820–1824. [Google Scholar] [CrossRef]
  12. Ning, X.; Li, Y.; Yu, H.; Peng, F.; Wang, H.; Yang, Y. Promoting role of bismuth and antimony on Pt catalysts for the selective oxidation of glycerol to dihydroxyacetone. J. Catal. 2016, 335, 95–104. [Google Scholar] [CrossRef]
  13. Chong, R.; Li, J.; Zhou, X.; Ma, Y.; Yang, J.; Huang, L.; Han, H.; Zhang, F.; Li, C. Selective photocatalytic conversion of glycerol to hydroxyacetaldehyde in aqueous solution on facet tuned TiO2-based catalysts. Chem. Commun. 2014, 50, 165–167. [Google Scholar] [CrossRef] [PubMed]
  14. Chen, X.; Xie, Z.; Liang, Y.; Wei, J.; Zhu, Y.; Huo, Y.; Zhang, X.; Wang, H. Hybridizing TiO2 with Nitrogen-Doped Carbon: A New Route to A Highly Visible Light-Active Photocatalyst. ChemistrySelect 2017, 2, 1565–1572. [Google Scholar] [CrossRef]
  15. Cai, Q.; Hu, J. Effect of UVA/LED/TiO2 photocatalysis treated sulfamethoxazole and trimethoprim containing wastewater on antibiotic resistance development in sequencing batch reactors. Water Res. 2018, 140, 251–260. [Google Scholar] [CrossRef]
  16. Jedsukontorn, T.; Saito, N.; Hunsom, M. Photoinduced Glycerol Oxidation over Plasmonic Au and AuM (M = Pt, Pd and Bi) Nanoparticle-Decorated TiO2 Photocatalysts. Nanomaterials 2018, 8, 269. [Google Scholar] [CrossRef] [Green Version]
  17. Islam, S.Z.; Nagpure, S.; Kim, D.Y.; Rankin, S.E. Synthesis and Catalytic Applications of Non-Metal Doped Mesoporous Titania. Inorganics 2017, 5, 15. [Google Scholar] [CrossRef]
  18. Husin, H.; Mahidin, M.; Pontas, K.; Ahmadi, A.; Ridho, M.; Erdiwansyah, E.; Nasution, F.; Hasfita, F.; Hussin, M.H. Microwave-assisted catalysis of water-glycerol solutions for hydrogen production over NiO/zeolite catalyst. Heliyon 2021, 7, e07557. [Google Scholar] [CrossRef] [PubMed]
  19. Martín-Gómez, J.; Hidalgo-Carrillo, J.; Montes, V.; Estévez-Toledano, R.C.; Escamilla, J.C.; Marinas, A.; Urbano, F.J. EPR and CV studies cast further light on the origin of the enhanced hydrogen production through glycerol photoreforming on CuO:TiO2 physical mixtures. J. Environ. Chem. Eng. 2021, 9, 105336. [Google Scholar] [CrossRef]
  20. Macedo, M.S.; Soria, M.A.; Madeira, L.M. Process intensification for hydrogen production through glycerol steam reforming. Renew. Sustain. Energy Rev. 2021, 146, 111151. [Google Scholar] [CrossRef]
  21. Maslova, V.; Quadrelli, E.A.; Gaval, P.; Fasolini, A.; Albonetti, S.; Basile, F. Highly-dispersed ultrafine Pt nanoparticles on microemulsion-mediated TiO2 for production of hydrogen and valuable chemicals via oxidative photo-dehydrogenation of glycerol. J. Environ. Chem. Eng. 2021, 9, 105070. [Google Scholar] [CrossRef]
  22. Rangarajan, G.; Pal, R.; Farnood, R. Visible light driven selective photocatalytic synthesis of high-value carbonyl compounds from glycerol over Ag-AgBr/TiO2 nanocomposites in acetonitrile. Mater. Lett. 2021, 292, 129535. [Google Scholar] [CrossRef]
  23. Jedsukontorn, T.; Ueno, T.; Saito, N.; Hunsom, M. Narrowing band gap energy of defective black TiO2 fabricated by solution plasma process and its photocatalytic activity on glycerol transformation. J. Alloys Compd. 2018, 757, 188–199. [Google Scholar] [CrossRef]
  24. Jedsukontorn, T.; Saito, N.; Hunsom, M. Photocatalytic behavior of metal-decorated TiO2 and their catalytic activity for transformation of glycerol to value added compounds. Mol. Catal. 2017, 432, 160–171. [Google Scholar] [CrossRef]
  25. Dodekatos, G.; Tüysüz, H. Plasmonic Au/TiO2 nanostructures for glycerol oxidation. Catal. Sci. Technol. 2016, 6, 7307–7315. [Google Scholar] [CrossRef]
  26. Bagheri, S.; Julkapli, N.M.; Yehye, W.A. Catalytic conversion of biodiesel derived raw glycerol to value added products. Renew. Sustain. Energy Rev. 2015, 41, 113–127. [Google Scholar] [CrossRef]
  27. Maslova, V.; Fasolini, A.; Offidani, M.; Albonetti, S.; Basile, F. Solar-driven valorization of glycerol towards production of chemicals and hydrogen. Catal. Today 2021, 380, 147–155. [Google Scholar] [CrossRef]
  28. Valter, M.; dos Santos, E.C.; Pettersson, L.G.M.; Hellman, A. Partial Electrooxidation of Glycerol on Close-Packed Transition Metal Surfaces: Insights from First-Principles Calculations. J. Phys. Chem. C 2020, 124, 17907–17915. [Google Scholar] [CrossRef]
  29. Len, C.; Luque, R. Continuous flow transformations of glycerol to valuable products: An overview. Sustain. Chem. Processes 2014, 2, 1. [Google Scholar] [CrossRef] [Green Version]
  30. Grabowska, E.; Marchelek, M.; Paszkiewicz-Gawron, M.; Zaleska-Medynska, A. 3-Metal oxide photocatalysts. In Metal Oxide-Based Photocatalysis; Zaleska-Medynska, A., Ed.; Elsevier: Amsterdam, The Netherlands, 2018; pp. 51–209. [Google Scholar] [CrossRef]
  31. He, Z.; Ning, X.; Yang, G.; Wang, H.; Cao, Y.; Peng, F.; Yu, H. Selective oxidation of glycerol over supported noble metal catalysts. Catal. Today 2021, 365, 162–171. [Google Scholar] [CrossRef]
  32. Yang, L.; Li, X.; Chen, P.; Hou, Z. Selective oxidation of glycerol in a base-free aqueous solution: A short review. Chin. J. Catal. 2019, 40, 1020–1034. [Google Scholar] [CrossRef]
  33. Mehmood, T.; Ahmed, A.; Ahmad, A.; Ahmad, M.S.; Sandhu, M.A. Optimization of mixed surfactants-based β-carotene nanoemulsions using response surface methodology: An ultrasonic homogenization approach. Food Chem. 2018, 253, 179–184. [Google Scholar] [CrossRef] [PubMed]
  34. Mancuso, A.; Sacco, O.; Vaiano, V.; Sannino, D.; Pragliola, S.; Venditto, V.; Morante, N. Visible light active Fe-Pr co-doped TiO2 for water pollutants degradation. Catal. Today 2021, 380, 93–104. [Google Scholar] [CrossRef]
  35. Avilés-García, O.; Espino-Valencia, J.; Romero, R.; Rico-Cerda, J.L.; Natividad, R. Oxidation of 4-Chlorophenol by Mesoporous Titania: Effect of Surface Morphological Characteristics. Int. J. Photoenergy 2014, 2014, 210751. [Google Scholar] [CrossRef]
  36. Prashad Ojha, D.; Babu Poudel, M.; Joo Kim, H. Investigation of electrochemical performance of a high surface area mesoporous Mn doped TiO2 nanoparticle for a supercapacitor. Mater. Lett. 2020, 264, 127363. [Google Scholar] [CrossRef]
  37. Caudillo-Flores, U.; Avilés-García, O.; Alonso-Núñez, G.; Kubacka, A.; Fernández-García, M. Assessing quantitatively charge carrier fate in 4-chlorophenol photocatalytic degradation using globular titania catalysts: Implications in quantum efficiency calculation. J. Environ. Chem. Eng. 2021, 9, 106074. [Google Scholar] [CrossRef]
  38. Avilés-García, O.; Espino-Valencia, J.; Mendoza-Zepeda, A.; Donkor, K.; Brewer, S.; Romero, R.; Natividad, R. Removal of metoprolol by means of photo-oxidation processes. Catal. Today 2021, 397–399, 562–573. [Google Scholar] [CrossRef]
  39. Bensouici, F.; Bououdina, M.; Dakhel, A.A.; Tala-Ighil, R.; Tounane, M.; Iratni, A.; Souier, T.; Liu, S.; Cai, W. Optical, structural and photocatalysis properties of Cu-doped TiO2 thin films. Appl. Surf. Sci. 2017, 395, 110–116. [Google Scholar] [CrossRef]
  40. Sudrajat, H.; Nguyen, T.K. Key factors controlling the durability of a Cu-doped TiO2 photocatalyst. Optik 2020, 217, 164914. [Google Scholar] [CrossRef]
  41. Avilés-García, O.; Espino-Valencia, J.; Romero, R.; Rico-Cerda, J.L.; Arroyo-Albiter, M.; Natividad, R. W and Mo doped TiO2: Synthesis, characterization and photocatalytic activity. Fuel 2017, 198, 31–41. [Google Scholar] [CrossRef]
  42. Crişan, M.; Răileanu, M.; Drăgan, N.; Crişan, D.; Ianculescu, A.; Niţoi, I.; Oancea, P.; Şomăcescu, S.; Stănică, N.; Vasile, B.; et al. Sol–gel iron-doped TiO2 nanopowders with photocatalytic activity. Appl. Catal. A Gen. 2015, 504, 130–142. [Google Scholar] [CrossRef]
  43. Avilés-García, O.; Espino-Valencia, J.; Romero-Romero, R.; Rico-Cerda, J.; Arroyo-Albiter, M.; Solís-Casados, D.; Natividad-Rangel, R. Enhanced Photocatalytic Activity of Titania by Co-Doping with Mo and W. Catalysts 2018, 8, 631. [Google Scholar] [CrossRef] [Green Version]
  44. Samet, L.; March, K.; Stephan, O.; Brun, N.; Hosni, F.; Bessousa, F.; Benasseur, J.; Chtourou, R. Radiocatalytic Cu-incorporated TiO2 nano-particles for the degradation of organic species under gamma irradiation. J. Alloys Compd. 2018, 743, 175–186. [Google Scholar] [CrossRef] [Green Version]
  45. Zhang, J.; Xu, L.J.; Zhu, Z.Q.; Liu, Q.J. Synthesis and properties of (Yb, N)-TiO2 photocatalyst for degradation of methylene blue (MB) under visible light irradiation. Mater. Res. Bull. 2015, 70, 358–364. [Google Scholar] [CrossRef]
  46. Payormhorm, J.; Idem, R. Synthesis of C-doped TiO2 by sol-microwave method for photocatalytic conversion of glycerol to value-added chemicals under visible light. Appl. Catal. A Gen. 2020, 590, 117362. [Google Scholar] [CrossRef]
  47. Bautista, E.; Ávila-Martínez, E.G.; Natividad, R.; Murcia, J.J.; Romero, R.; Cubillos, J.; Rojas, H.; Hernández, J.S.; Cárdenas, O.; Hidalgo, M.C.; et al. Fluorinated and Platinized Titania for Glycerol Oxidation. Mater. Proc. 2021, 4, 37. [Google Scholar] [CrossRef]
  48. Galindo, C.; Jacques, P.; Kalt, A. Photodegradation of the aminoazobenzene acid orange 52 by three advanced oxidation processes: UV/H2O2, UV/TiO2 and VIS/TiO2: Comparative mechanistic and kinetic investigations. J. Photochem. Photobiol. A Chem. 2000, 130, 35–47. [Google Scholar] [CrossRef]
  49. Chekuri, R.D.; Tirukkovalluri, S.R. One step synthesis and characterization of copper doped sulfated titania and its enhanced photocatalytic activity in visible light by degradation of methyl orange. Chin. J. Chem. Eng. 2016, 24, 475–483. [Google Scholar] [CrossRef]
  50. Jedsukontorn, T.; Ueno, T.; Saito, N.; Hunsom, M. Mechanistic aspect based on the role of reactive oxidizing species (ROS) in macroscopic level on the glycerol photooxidation over defected and defected-free TiO2. J. Photochem. Photobiol. A Chem. 2018, 367, 270–281. [Google Scholar] [CrossRef]
  51. Mendoza, A.; Romero, R.; Gutiérrez-Cedillo, G.P.; López-Tellez, G.; Lorenzo-González, O.; Gómez-Espinosa, R.M.; Natividad, R. Selective production of dihydroxyacetone and glyceraldehyde by photo-assisted oxidation of glycerol. Catal. Today 2020, 358, 149–154. [Google Scholar] [CrossRef]
  52. Hu, W.; Knight, D.; Lowry, B.; Varma, A. Selective Oxidation of Glycerol to Dihydroxyacetone over Pt−Bi/C Catalyst: Optimization of Catalyst and Reaction Conditions. Ind. Eng. Chem. Res. 2010, 49, 10876–10882. [Google Scholar] [CrossRef]
  53. Gil, S.; Marchena, M.; Sánchez-Silva, L.; Romero, A.; Sánchez, P.; Valverde, J.L. Effect of the operation conditions on the selective oxidation of glycerol with catalysts based on Au supported on carbonaceous materials. Chem. Eng. J. 2011, 178, 423–435. [Google Scholar] [CrossRef]
  54. Oliveira, V.L.; Morais, C.; Servat, K.; Napporn, T.W.; Olivi, P.; Kokoh, K.B.; Tremiliosi-Filho, G. Kinetic Investigations of Glycerol Oxidation Reaction on Ni/C. Electrocatalysis 2015, 6, 447–454. [Google Scholar] [CrossRef]
  55. Wu, G.; Liu, Y.; He, Y.; Feng, J.; Li, D. Reaction pathway investigation using in situ Fourier transform infrared technique over Pt/CuO and Pt/TiO2 for selective glycerol oxidation. Appl. Catal. B Environ. 2021, 291, 120061. [Google Scholar] [CrossRef]
  56. Jensen, W.A. Response Surface Methodology: Process and Product Optimization Using Designed Experiments. In Journal of Quality Technology, 4th ed.; Taylor & Francis: Oxfordshire, UK, 2017; Volume 49, pp. 186–188. [Google Scholar] [CrossRef]
  57. Augugliaro, V.; El Nazer, H.A.H.; Loddo, V.; Mele, A.; Palmisano, G.; Palmisano, L.; Yurdakal, S. Partial photocatalytic oxidation of glycerol in TiO2 water suspensions. Catal. Today 2010, 151, 21–28. [Google Scholar] [CrossRef]
  58. Yu, J.; Dappozze, F.; Martín-Gomez, J.; Hidalgo-Carrillo, J.; Marinas, A.; Vernoux, P.; Cravana, A.; Guillard, C. Glyceraldehyde production by photocatalytic oxidation of glycerol on WO3-based materials. Appl. Catal. B Environ. 2021, 299, 120616. [Google Scholar] [CrossRef]
  59. Hurtado, L.; Avilés, O.; Brewer, S.; Donkor, K.K.; Romero, R.; Gómez-Espinosa, R.M.; Alvarado, O.; Natividad, R. Al/Cu-PILC as a Photo-Fenton Catalyst: Paracetamol Mineralization. ACS Omega 2022, 7, 23821–23832. [Google Scholar] [CrossRef] [PubMed]
  60. Wang, J.; Cherevan, A.S.; Hannecart, C.; Naghdi, S.; Nandan, S.P.; Gupta, T.; Eder, D. Ti-based MOFs: New insights on the impact of ligand composition and hole scavengers on stability, charge separation and photocatalytic hydrogen evolution. Appl. Catal. B Environ. 2021, 283, 119626. [Google Scholar] [CrossRef]
  61. Wei, Y.; Cheng, G.; Xiong, J.; Zhu, J.; Gan, Y.; Zhang, M.; Li, Z.; Dou, S. Synergistic impact of cocatalysts and hole scavenger for promoted photocatalytic H2 evolution in mesoporous TiO2NiSx hybrid. J. Energy Chem. 2019, 32, 45–56. [Google Scholar] [CrossRef]
  62. Peralta, E.; Roa, G.; Hernandez-Servin, J.A.; Romero, R.; Balderas, P.; Natividad, R. Hydroxyl Radicals quantification by UV spectrophotometry. Electrochim. Acta 2014, 129, 137–141. [Google Scholar] [CrossRef]
  63. Alvarado-Rolon, O.; Natividad, R.; Ramírez-García, J.; Orozco-Velazco, J.; Hernandez-Servin, J.A.; Ramírez-Serrano, A. Kinetic modelling of paracetamol degradation by photocatalysis: Incorporating the competition for photons by the organic molecule and the photocatalyst. J. Photochem. Photobiol. A Chem. 2021, 412, 113252. [Google Scholar] [CrossRef]
Figure 1. (a) N2 adsorption-desorption isotherms and (b) pore size distributions of Cu/TiO2 and TiO2 catalysts.
Catalysts 12 00835 g001
Figure 2. X-ray diffraction patterns of the synthesized Cu/TiO2 and TiO2 catalysts.
Catalysts 12 00835 g002
Figure 3. SEM images of catalysts (a) Cu/TiO2 and (b) TiO2.
Catalysts 12 00835 g003
Figure 4. TEM and HRTEM micrographs of catalysts (a,b) Cu/TiO2 and (c,d) TiO2.
Catalysts 12 00835 g004
Figure 5. Tauc graphs for band-gap energies of synthesized catalysts. Inset: DRS spectra for each catalyst.
Catalysts 12 00835 g005
Figure 6. XPS spectra of (a) Ti 2p, (b) O 1s, and (c) Cu 2p for the Cu/TiO2 catalyst.
Catalysts 12 00835 g006
Figure 7. Effect of catalyst concentration on glycerol conversion and initial reaction rate (Initial glycerol concentration = 6.25 × 10⁻² M, T = 305.65 K, Cu/TiO2 catalyst).
Catalysts 12 00835 g007
Figure 8. Effect of catalyst amount on concentration and selectivity towards (a) glyceraldehyde (GCD), (b) formaldehyde (FD), and (c) formic acid (FA). Initial glycerol = 6.25 × 10⁻² M, T = 305.65 K, Cu/TiO2 catalyst.
Catalysts 12 00835 g008
Figure 9. Proposed reaction scheme for the photo-oxidation of glycerol by Cu/TiO2.
Catalysts 12 00835 g009
Figure 10. Effect of reaction temperature on the glycerol conversion and initial reaction rate (initial glycerol = 6.25 × 10⁻² M, Cu/TiO2 = 0.25 g/L).
Catalysts 12 00835 g010
Figure 11. Effect of reaction temperature on concentration and selectivity towards (a) glyceraldehyde (GCD), (b) formaldehyde (FD), and (c) formic acid (FA). Initial glycerol = 6.25 × 10⁻² M, Cu/TiO2 = 0.25 g/L.
Catalysts 12 00835 g011
Figure 12. Effect of initial glycerol concentration on the glycerol conversion and initial reaction rate (T = 305.65 K, Cu/TiO2 = 0.25 g/L).
Catalysts 12 00835 g012
Figure 13. Effect of initial glycerol concentration on the selectivity and concentration of (a) glyceraldehyde (GCD), (b) formaldehyde (FD), and (c) formic acid (FA). T = 305.65 K, Cu/TiO2 = 0.25 g/L.
Catalysts 12 00835 g013
Figure 14. Percentage of total organic carbon during glycerol photo-oxidation with effect on (a) amount of catalyst, (b) reaction temperature, and (c) initial glycerol concentration.
Catalysts 12 00835 g014
Figure 15. Pareto chart analysis.
Catalysts 12 00835 g015
Figure 16. Response surface plots for all possible combinations when two independent variables change and the other variable remains constant at the center point. (a,d,g) show the change in reaction temperature and catalyst amount with a constant glycerol concentration. (b,e,h) show the variation in glycerol concentration and catalyst amount with a constant reaction temperature. (c,f,i) show the change in glycerol concentration and reaction temperature with a constant catalyst amount.
Catalysts 12 00835 g016
Figure 17. Comparison of the best reaction conditions using UV and visible light towards the concentration and selectivity of products during the glycerol selective oxidation.
Catalysts 12 00835 g017
Figure 18. TOC percentage at the end of each catalyst reuse cycle.
Catalysts 12 00835 g018
Figure 19. Glycerol degradation percentage and product concentration for different Cu/TiO2 catalyst reuse cycles.
Catalysts 12 00835 g019
Figure 20. Percentage of glycerol converted in the presence of radical and hole scavengers.
Catalysts 12 00835 g020
Table 1. Selective oxidation of glycerol by photocatalysis on TiO2 and metal/TiO2 catalysts.
Reaction ConditionsStudied
Variables
Obtained ProductsSelectivity
(Principal Product)
Reference
Catalyst: Pt/TiO2
Catalyst: 0.5 g/L
Glycerol: 1 M
Temperature: 30 °C
Reactor type: batch
λ: simulated sunlight
Reaction time: 6 h
Catalyst synthesis methodCompound (selectivity):
Glyceraldehyde (46%)
Glycolaldehyde (54%)
Glycolaldehyde (54%)[21]
Catalyst: Ag-AgBr/TiO2
Catalyst: 1 g/L
Glycerol: 4.5 mM
Temperature: 25 °C
Reactor type: batch
λ: simulated sunlight
Reaction time: 4 h
Catalyst typeCompound (selectivity):
Glyceraldehyde (52%)
Dihydroxyacetone (36%)
Glycolic acid (8%)
Glyceric acid (4%)
Glyceraldehyde (52%)[22]
Catalyst: TiO2
Catalyst: 3 g/L
Glycerol: 0.3 M
Temperature: 25 °C
Reactor type: batch
λ: 100–600 nm
Reaction time: 24 h
Catalyst synthesis methodCompound (yield):
Glycolaldehyde (39.2%)
Glyceraldehyde (4.9%)
Dihydroxyacetone (3.3%)
Glycolic acid (2.2%)
Hydroxypyruvic acid (2.1%)
Formic acid (26.6%)
Glycolaldehyde (50%)[23]
Catalyst: (Bi, Pd, Pt, Au)/TiO2
Catalyst: 3 g/L
Glycerol: 0.3 M
Temperature: 25 °C
Reactor type: batch
λ: 200–600 nm
Reaction time: 14 h
Metal typeCompound (yield):
Glyceraldehyde (23.1%)
Dihydroxyacetone (12%)
Glycolic acid (10.7%)
Hydroxypyruvic acid (13.6%)
Formic acid (15.3%)
Glyceraldehyde (31%)[24]
Catalyst: Au/TiO2
Catalyst: 1 g/L
Glycerol: 0.05 M
Temperature: 90 °C
Reactor type: batch (5 bar)
λ > 420 nm
Reaction time: 5 h
Support typeGlyceraldehyde
Dihydroxyacetone
Glycolic acid
Oxalic acid
Dihydroxyacetone (63%)[25]
Table 2. Textural properties and band-gap energies of Cu/TiO2 and TiO2 catalysts.
CatalystSpecific Surface
Area (m2/g)
Pore Volume
(cm3/g)
Pore Diameter
(nm)
Band Gap
(eV)
Cu/TiO2242.40.485.72.55
TiO2121.50.265.73.24
Table 3. Structural properties of Cu/TiO2 and TiO2 catalysts.
CatalystAnatase Plane
(101)
Average Crystallite
Size (nm)
Lattice Distortion
(Ɛ)
Cu wt.%
Cu/TiO225.37.980.01983.8
TiO225.28.220.0193-
Table 4. Experimental design with independent variables and response variables for the selective photo-oxidation of glycerol.
RunIndependent VariablesResponse Variables
Catalyst
Concentration
(g/L)
Reaction
Temperature
(K)
Glycerol
Concentration
(mol/L)
GCD × 104
(mol/L)
FD × 104
(mol/L)
FA × 104
(mol/L)
10.40313.150.025010.10358.8345.582
20.10313.150.100017.64836.3287.507
30.10305.650.06258.15122.6693.078
40.40298.150.100013.77225.3084.762
50.25298.150.062512.13235.4324.112
60.40305.650.062516.86251.6475.304
70.40298.150.02508.53233.8064.221
80.25305.650.062514.66742.1215.061
90.10298.150.02506.07817.4913.725
100.25305.650.062514.69742.1605.079
110.25305.650.02508.84434.1044.316
120.25305.650.062514.63742.0825.043
130.25305.650.062514.69142.1785.067
140.10298.150.10004.8638.7612.309
150.25313.150.062519.12970.6017.295
160.25305.650.062514.64442.0655.055
170.10313.150.02508.39134.6855.517
180.25305.650.062514.73142.2735.089
190.25305.650.100015.33830.2375.513
200.40313.150.100032.83484.29411.613
Table 5. Optimum and experimental values of the response variables.
Response VariablesOptimum
× 104 (mol/L)
Experimental
× 104 (mol/L)
Glyceraldehyde (GCD)32.26732.834
Formaldehyde (FD)81.74184.294
Formic acid (FA)11.46511.613
Table 6. Comparison of accumulation rate of glyceraldehyde (GCD) and formaldehyde (FD) with TiO2, Cu/TiO2 and other metal-decorated TiO2.
CatalystProductmol × 104/gcat·hReference
Pt/TiO2GCD11.000[21]
Ag-AgBr/TiO2GCD3.250[22]
TiO2GCD
FD
0.934
0.233
[24]
Bi/TiO2GCD
FD
0.807
0.339
Pd/TiO2GCD
FD
1.255
0.388
Pt/TiO2GCD
FD
1.680
0.425
Au/TiO2GCD
FD
1.279
0.504
Cu/TiO2GCD
FD
13.681
35.122
This work
Table 7. Levels of the independent variables for the selective photo-oxidation of glycerol.
Independent VariablesLevels
−10+1
Catalyst amount (g/L)0.1000.25000.40
Reaction temperature (K)298.150305.6500313.15
Glycerol concentration (mol/L)0.0250.06250.10
Publisher’s Note: MDPI stays neutral with regard to jurisdictional claims in published maps and institutional affiliations.

