Article

Degradation of Tetracycline Hydrochloride by a Novel CDs/g-C3N4/BiPO4 under Visible-Light Irradiation: Reactivity and Mechanism

1
School of Environment, Jinan University, Guangzhou 510632, China
2
College of Resources and Environment, Zhongkai University of Agriculture and Engineering, Guangzhou 510225, China
3
Huafeng Bijiang Environmental Protection Technology Co., Ltd., Zhaoqing 526108, China
*
Authors to whom correspondence should be addressed.
Catalysts 2022, 12(7), 774; https://doi.org/10.3390/catal12070774
Submission received: 20 June 2022 / Revised: 9 July 2022 / Accepted: 11 July 2022 / Published: 13 July 2022

Abstract

:
In recent years, with the large-scale use of antibiotics, the pollution of antibiotics in the environment has become increasingly serious and has attracted widespread attention. In this study, a novel CDs/g-C3N4/BiPO4 (CDBPC) composite was successfully synthesized by a hydrothermal method for the removal of the antibiotic tetracycline hydrochloride (TC) in water. The experimental results showed that the synthesized photocatalyst was crystalline rods and cotton balls, accompanied by overlapping layered nanosheet structures, and the specific surface area was as high as 518.50 m2/g. This photocatalyst contains g-C3N4 and bismuth phosphate (BiPO4) phases, as well as abundant surface functional groups such as C=N, C-O, and P-O. When the optimal conditions were pH 4, CDBPC dosage of 1 g/L, and TC concentration of 10 mg/L, the degradation rate of TC reached 75.50%. Active species capture experiments showed that the main active species in this photocatalytic system were holes (h+), hydroxyl radicals, and superoxide anion radicals. The reaction mechanism for the removal of TC by CDBPC was also proposed. The removal of TC was mainly achieved by the synergy between the adsorption of CDBPC and the oxidation of both holes and hydroxyl radicals. In this system, TC was adsorbed on the surface of CDBPC, and then the adsorbed TC was degraded into small molecular products by an attack with holes and hydroxyl radicals and finally mineralized into carbon dioxide and water. This study indicated that this novel photocatalyst CDBPC has a huge potential for antibiotic removal, which provides a new strategy for antibiotic treatment of wastewater.

1. Introduction

According to the Chinese Academy of Sciences’ antibiotic pollution map, more than 6100 tons of tetracycline (TC) antibiotics are discharged into the soil and groundwater environment every year [1]. Antibiotic concentrations in Chinese rivers generally reach 15 μg/L, far exceeding their toxicity threshold [2,3]. Tetracyclic antibiotics are mainly treated by biological, physical, and chemical oxidation methods [4]. Biological treatment methods mainly rely on microbial decomposition to breakdown pollutants. Tetracycline antibiotics are difficult to completely remove by conventional biological treatment [5,6]. Physical treatment methods include adsorption and membrane treatment technology; however, pollutants are not degraded and can easily cause secondary pollution [7,8,9]. Chemical oxidation methods mainly degrade various types of pollutants by oxidation and reduction reactions, including ozone oxidation [10], Fenton oxidation [11,12], persulfate oxidation [13,14] and photocatalytic technology [15,16]. Photocatalytic degradation of antibiotics with higher efficiency and broader applicability has been studied and applied by a large number of scholars at this stage for the treatment of various antibiotic contaminations [17]. In recent years, graphitic carbon nitride (g-C3N4) has been widely used in photocatalysis. g-C3N4 is a typical conjugated polymer in photocatalysts [18,19,20]. The conjugated polymer facilitates the transport and separation of photoinduced electrons and holes due to its unique internal conjugated π-bond structure. Additionally, its unique two-dimensional layered structure could assist the transport and migration of electrons, and with the advantages of nontoxicity and visible light response (semiconductor band gap of 2.7 eV), it is widely applied in photocatalytic degradation [21]. However, g-C3N4 suffers from a high photogenerated electron-hole recombination rate, which limits its quantum efficiency [22]. Therefore, promoting the separation of its photogenerated carriers is crucial to promoting its photocatalytic efficiency. It is an effective way to composite different materials to overcome their respective defects. Some researchers have prepared different composites, such as g-C3N4/MoS2 [23], g-C3N4/BiOBr [24], and g-C3N4/BiVO4 [25], which show superior photocatalytic performance. The material composite of BiPO4 and g-C3N4 can compensate for each other’s defects and take advantage of the high carrier separation efficiency of BiPO4 and the wide range of light absorption of g-C3N4 [26]. The photocatalytic degradation rate of the g-C3N4/BiPO4 composite photocatalyst was 4.5 times higher than that of P25 TiO2 and 2.5 times higher than that of pure BiPO4 under UV irradiation [27]. This value is 2.5 times higher than that of single mesoporous g-C3N4 under visible light irradiation [28]. Additionally, g-C3N4/BiPO4 composites showed superior catalytic degradation performance in the degradation of TC, SMD, SD, and other pollutants [29,30,31].
However, the g-C3N4/BiPO4 material could still not absorb sunlight with wavelengths longer than 420 nm. Carbon dots (CDs) have excellent optical properties and can make full use of visible light over 500 nm [32,33]. CDs take advantage of water solubility and biocompatibility. In this paper, we prepared CDs/g-C3N4/BiPO4 composite-based precursors of g-C3N4 and inspected the performance of photocatalytic degradation TC solution, mainly in the following aspects: (a) physicochemical characterization of the CDBPC composite; (b) degradation performance of TC by the CDBPC composite under visible light; (c) degradation kinetics of TC; and (d) proposed reaction mechanism of TC degradation.

2. Results and Discussion

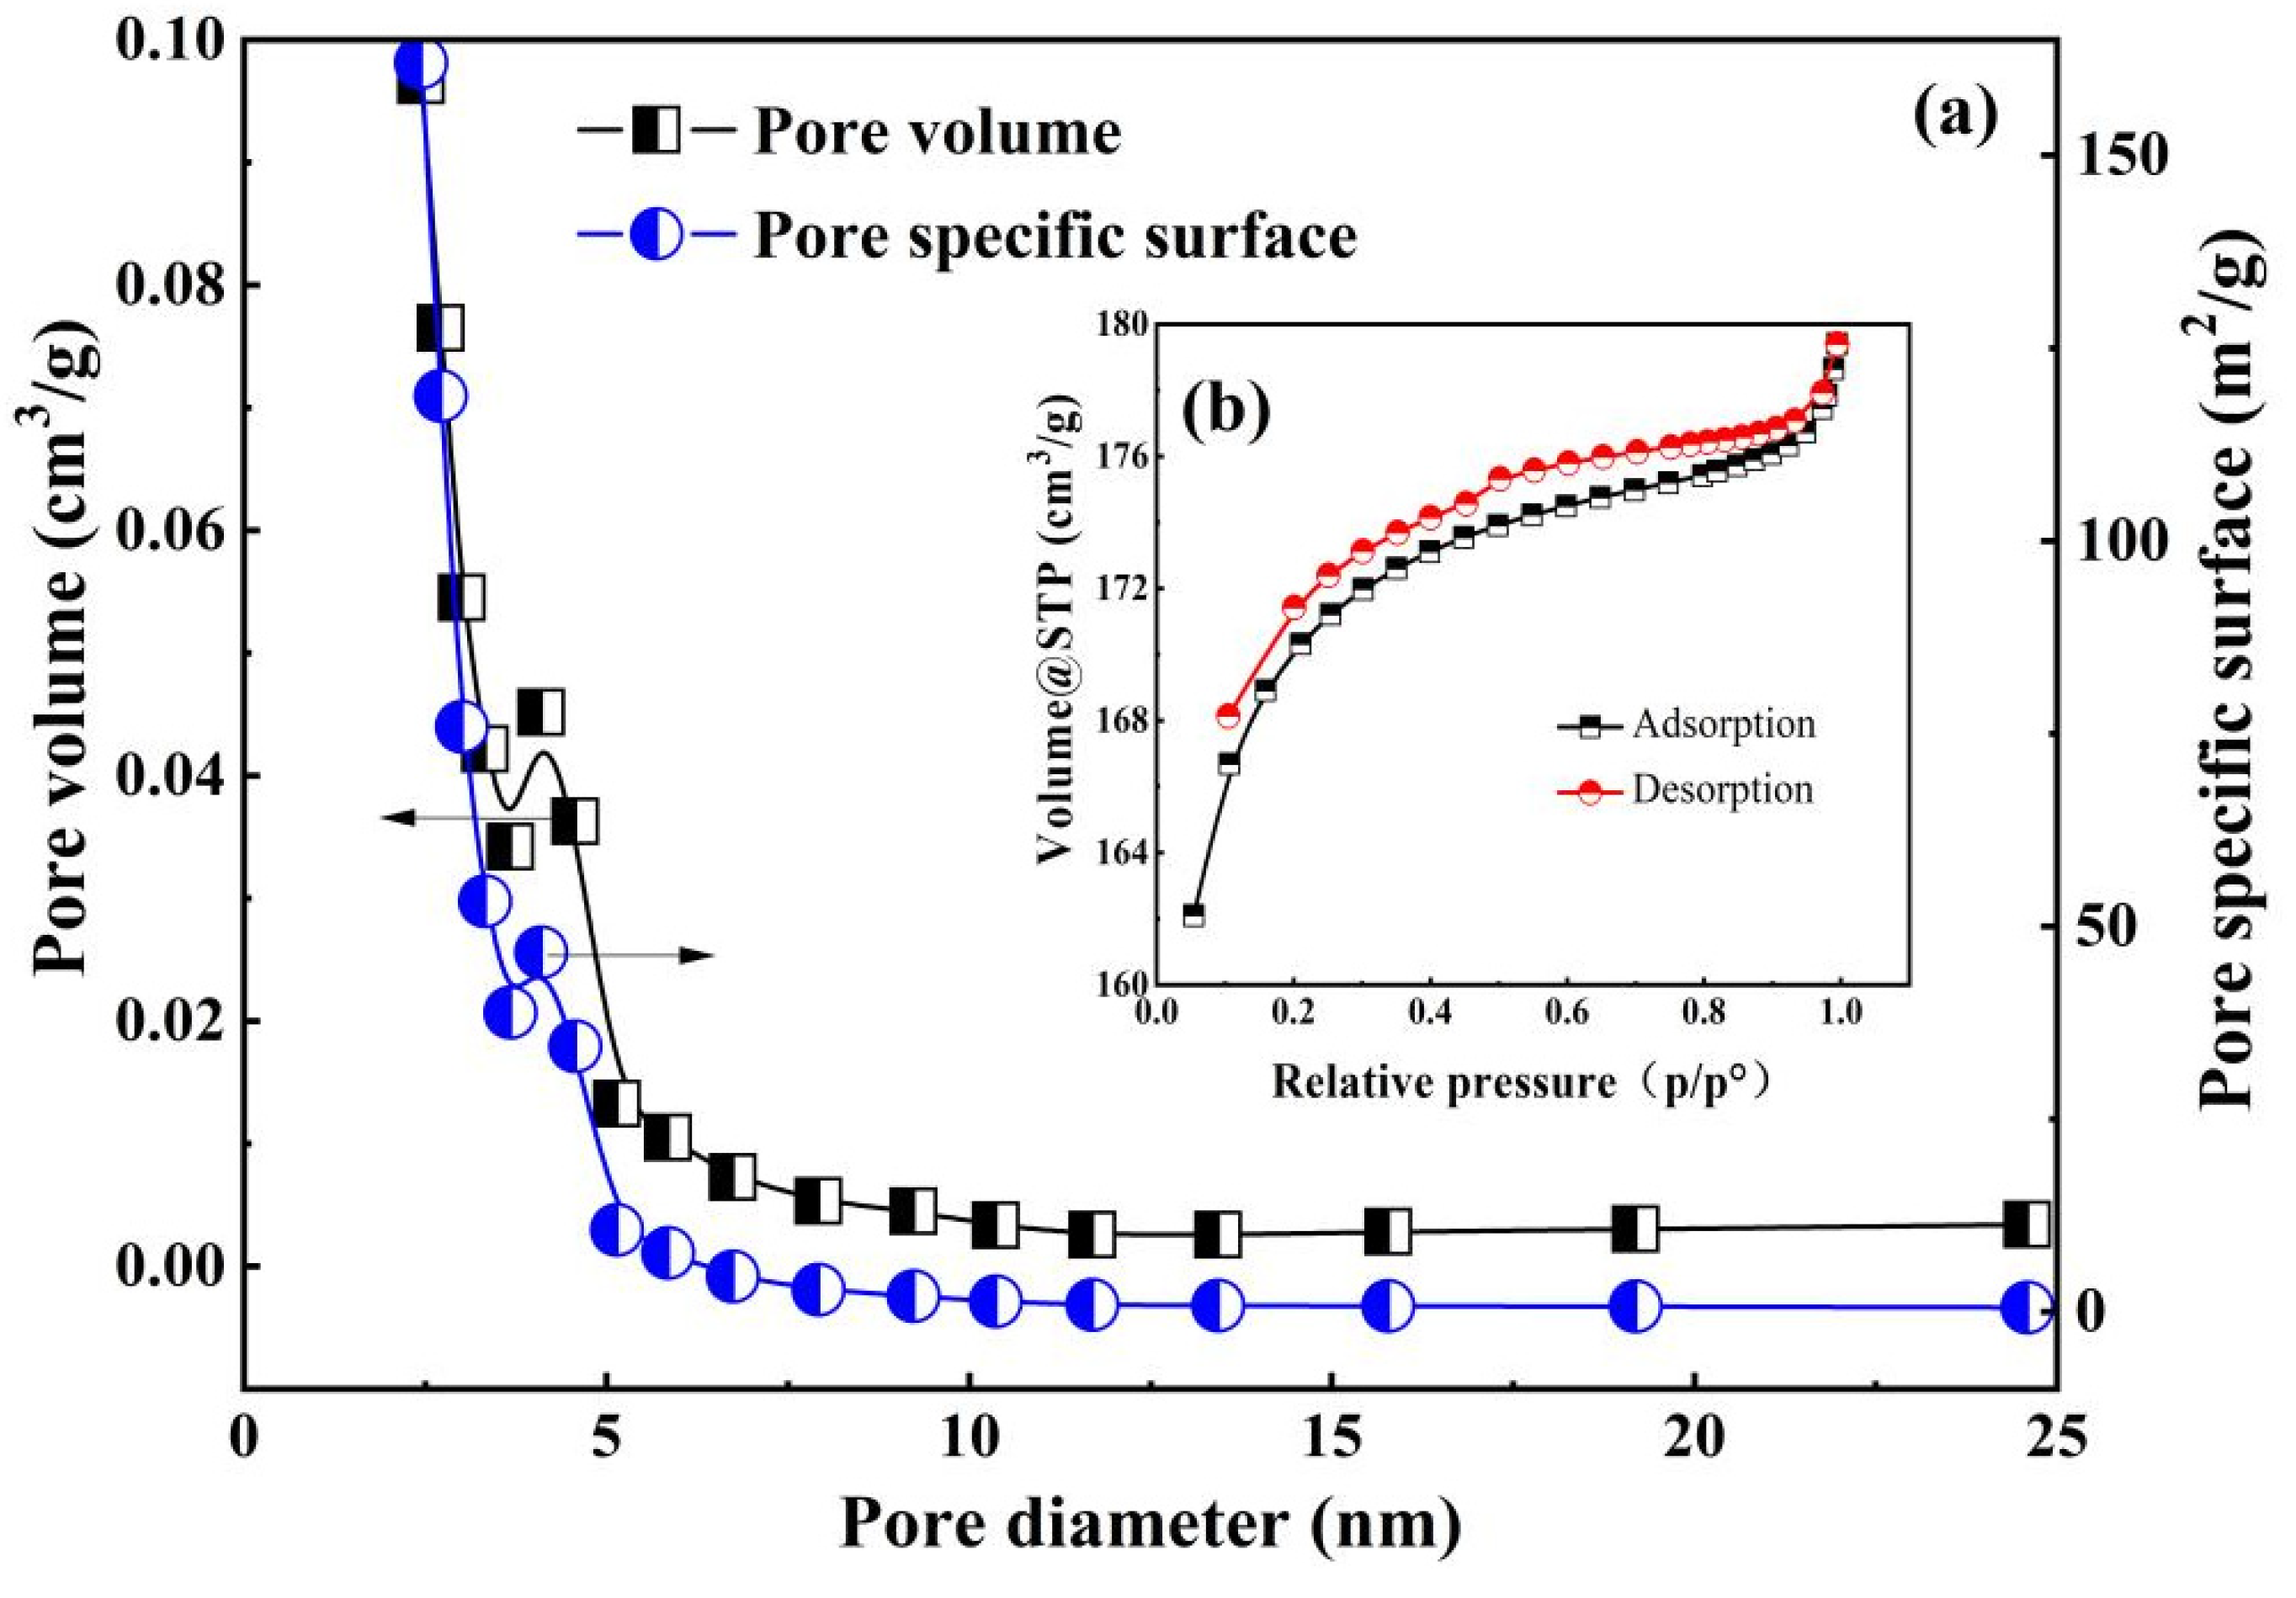
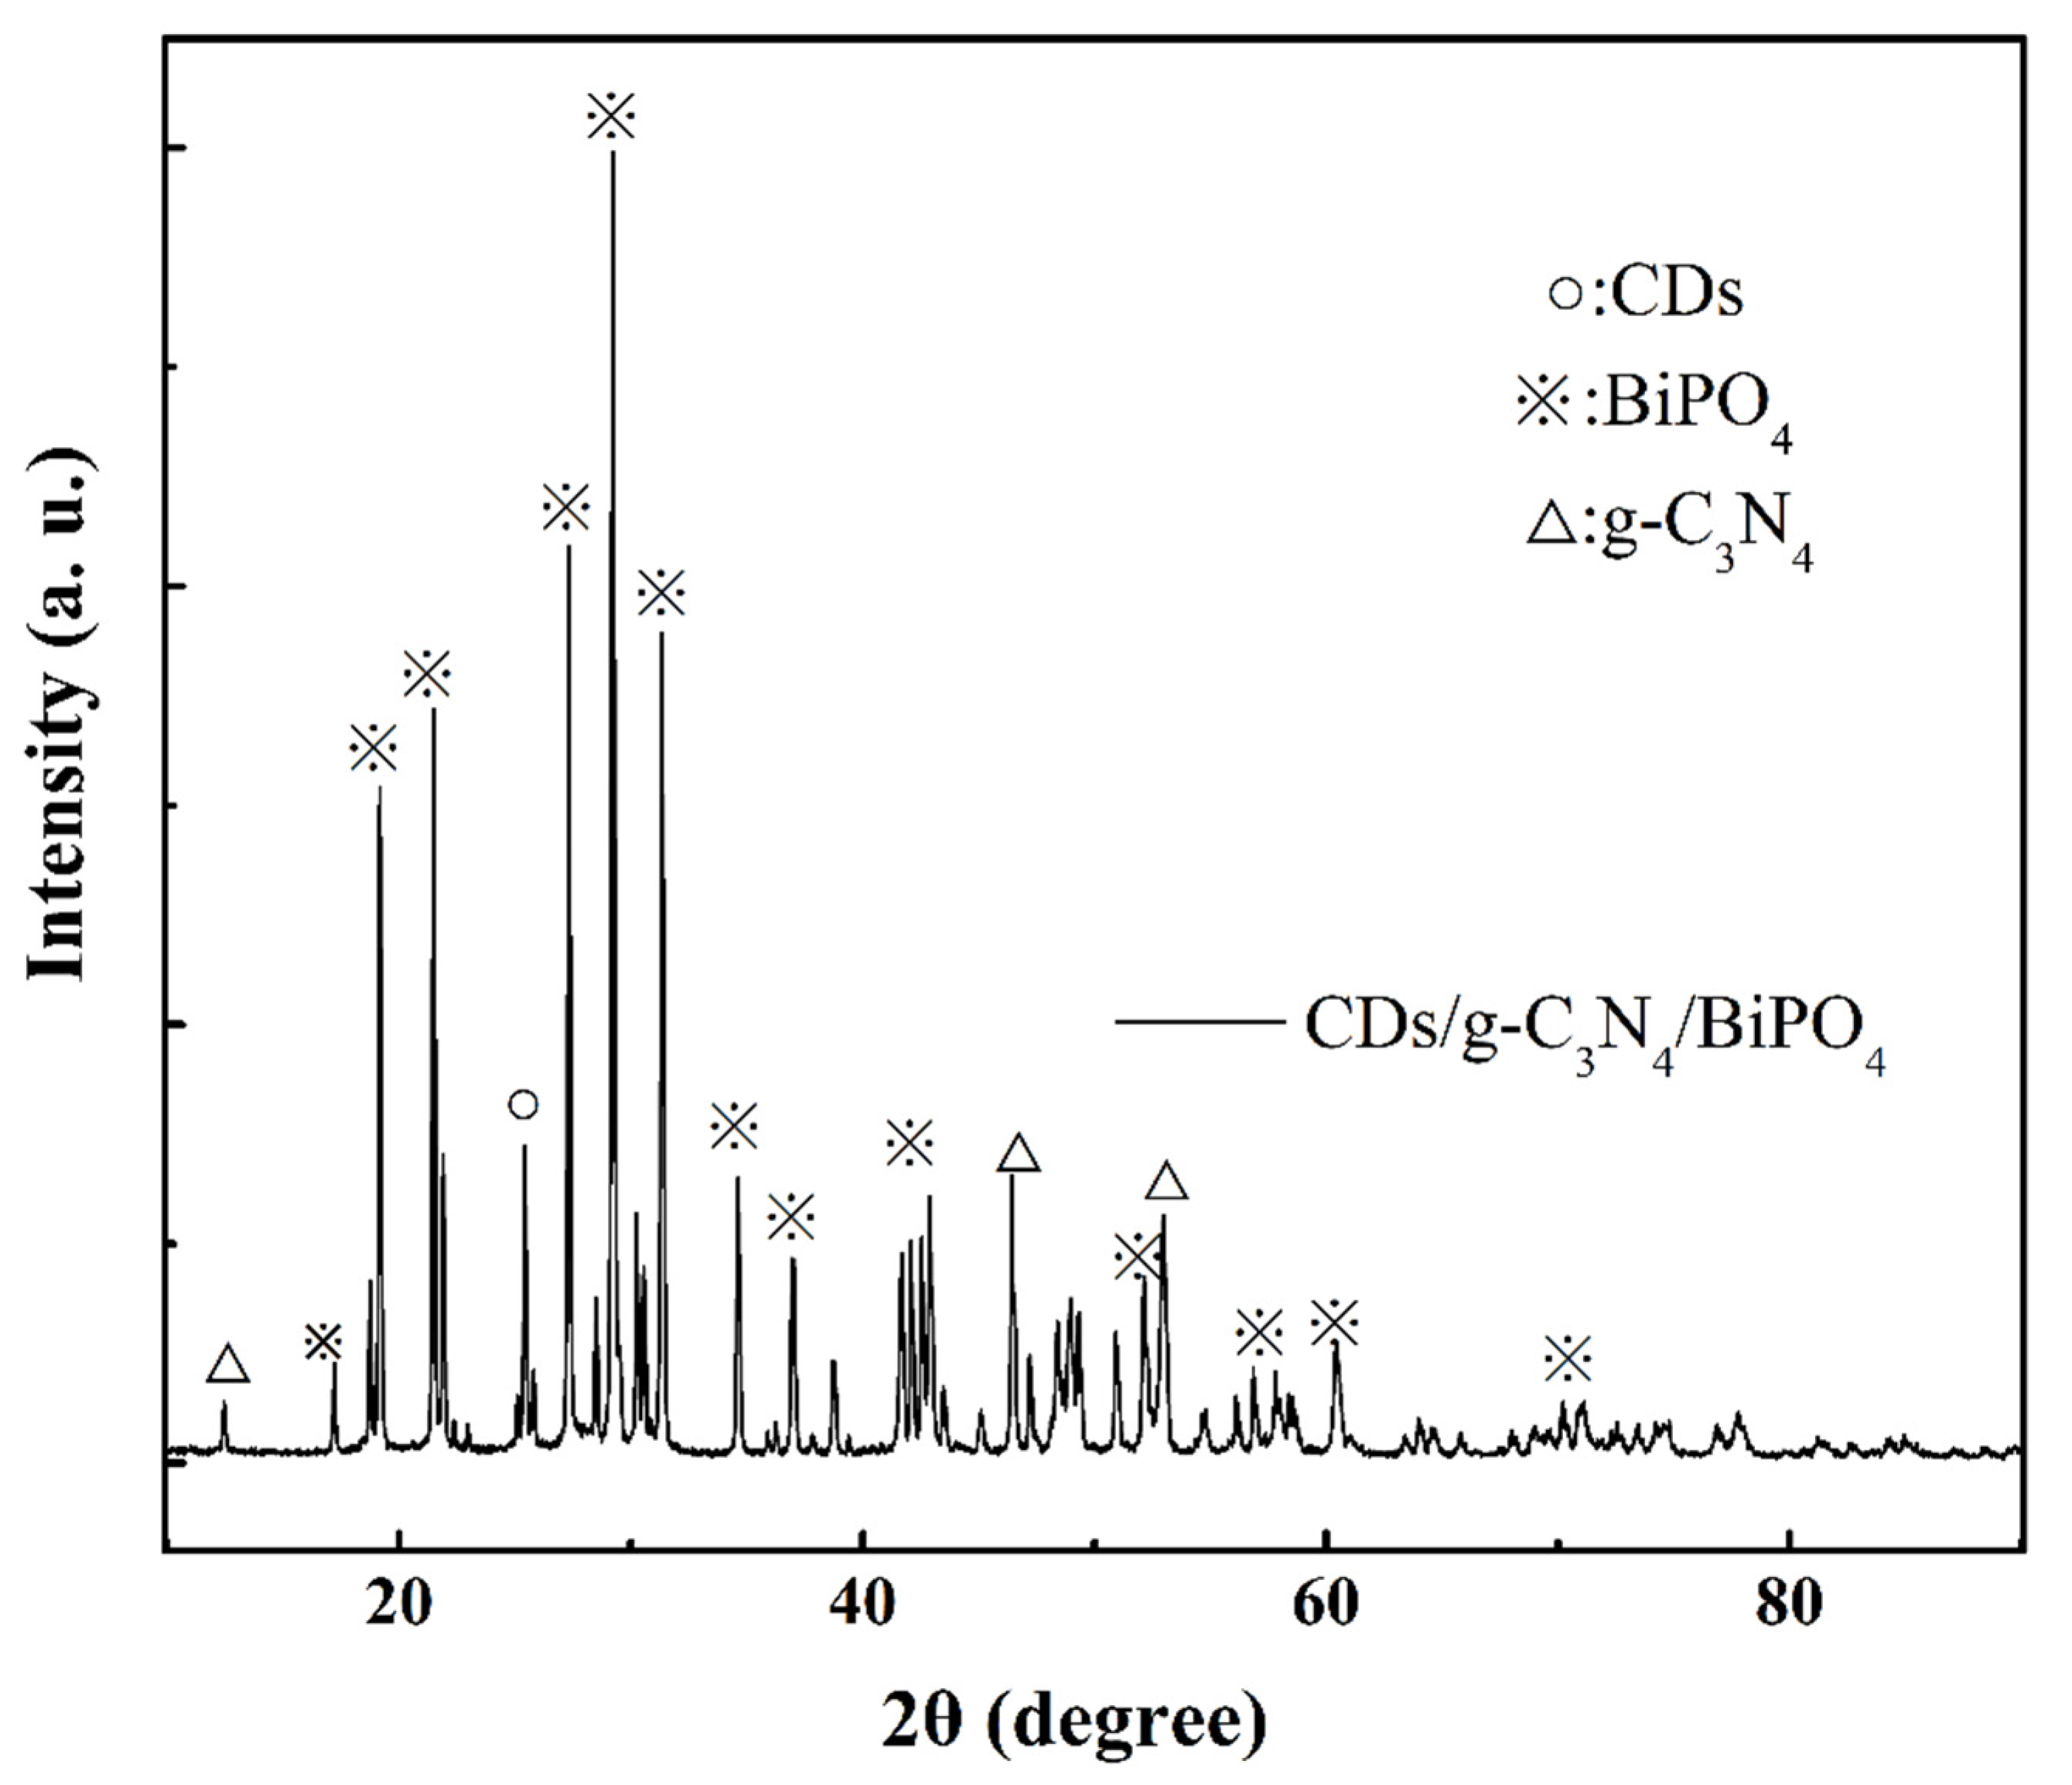
2.1. Characterization of CDBPC

As shown in Figure 1a, the CDBPC catalytic material presented crystal rods and spherical crystals, which agglomerated together and were accompanied by tiny spherical crystals. It was presumed that the crystal rods might be BiPO4. As shown in Figure 1b, the diameter range of crystal rods varied in size, fluctuating in the range of 100–900 nm, while the diameter of spherical crystals was approximately 1 µm. The crystal rods had a smoother surface than the spherical crystals but still had tiny spherical crystals at the edges. In contrast, the surface of the spherical crystals was rougher and more porous. Figure 1c,d presents the transmission electron microscopy scans of the CDBPC composite material. Figure 1c shows that the crystal rods and spherical crystals were tightly wrapped together. Figure 1d shows that the spherical crystal structure was evenly attached to the crystal rods. Therefore, it was presumed that spherical crystals were CD crystals, which was consistent with the results of previous studies [34]. The distribution of elements on the surface of CDBPC material was analyzed by EDS mapping, and the results are shown in Figure 1e–j. The CDBPC sample was mainly composed of five elements, including C, N, O, P, Bi, etc. As shown in the SEM image (Figure 1), the rod-shaped crystals of BiPO4 were mainly concentrated in the southwest corner, while g-C3N4 was mainly distributed in the northeast corner. EDS mapping scans revealed that P, O, and Bi elements were mainly concentrated in the southwest corner and N elements were mainly distributed in the northeast corner, which was consistent with the distribution of BiPO4 and g-C3N4 materials. The C element is evenly distributed on the surface of the material, mainly because the C element consists of CDs and g-C3N4. Additionally, CDs exhibited excellent water solubility and were evenly distributed on the surface of materials.
The semi-quantitative mass ratio and atomic fraction analysis of each element was carried out by EDS, and the results were shown in Table 1. Accordingly, the C element accounted mass ratio of 34.84 wt%, N element mass ratio accounted for 27.98 wt%, the P element mass ratio accounted for 1.61 wt%, and the Bi mass ratio element accounted for 9.66 wt%.
As seen in Figure 2b, the adsorption–desorption curve of the CDBPC material was type IV, indicating the presence of a homogeneous mesoporous structure in the material, which was multilayered. Therefore, it caused the hysteresis loops. The curve belonged to the H3 type. The hysteresis loop was not closed, probably because the adsorption equilibrium was not reached when the relative pressure was close to the saturation vapor pressure [35]. This result indicated that the CDBPC materials had narrow and long pore structures. The jump in the curve of the adsorption isotherm at a relative pressure of 0.1 could illustrate the presence of microporosity in the sample material. From Figure 2a, CDBPC was a mesoporous material with a high pore volume. When the average pore size was between 25 and 5 nm, the pore volume accumulated to 0.01 cm3/g, and the average pore size was ≥5 nm. The cumulative rate of pore volume increased when the average pore size was between 5 and 2.5 nm, reaching a maximum of 0.09 cm3/g cumulatively at an average pore size ≥2.5 nm. The pore-specific surface area reached a maximum value of 162 m2/g when the average pore size was ≥2.5 nm. After calculation by the BET method, the specific surface area of the CDBPC material reached 518.4978 m2/g with an average pore diameter of 2.14 nm and a pore volume of 0.2774 cm3/g.
As shown in Figure 3, CDBPC exhibited the peaks at 17.02°, 19.18°, 21.50°, 27.32°, 29.00°, 31.33°, 34.62°, 36.84°, 41.92°, 52.80°, 56.68°, 61.22° and 70.91°, corresponding to (101), (011), (111), (200), (120), (200), (−212), (202), (−103), (−402), (132), (233) and (−134) of BiPO4 (JCPDS 80-0209), respectively. The lattice spacing of d(120) is 0.3706 and was calculated by Bragg’s diffraction law, which is confirmed by the HRTEM reported in the study [10]. Our calculated value was in very good approximation to standard values. The diffraction peak of CDBPC materials at 26.1° was the characteristic peak of hexagonal CDs (JCPDS 87-1523). CDBPC had broad peaks at 13.0°, 47.62°, and 53.66°, which were characteristic of g-C3N4 (JCPDS 87-1524, 87-1526). The diffraction peaks of BiPO4 and g-C3N4 were sharp and intense, indicating their highly crystalline nature. No impurity peaks were observed, confirming the high purity of the products. From the number and area of peaks detected by XRD, it was shown that BiPO4, followed by g-C3N4 and CDs, was the main component, which was consistent with the results of previous studies [36,37].
The CDBPC material was analyzed by Fourier transform infrared spectrograms, and the results are shown in Figure 4. The peaks in the wavenumber range between 680 and 480 cm−1 were caused by bending vibrations of BiPO4, while the peaks near 560 cm−1 were due to O-P-O bonding vibrations. A sharp peak at approximately 1100 cm−1 with a small and not obvious width was due to the stretching vibration of C-O, and the adsorption peak at 1400 cm−1 resulted from C-OH stretching vibrations, which was consistent with previous studies [38]. The characteristic peak near 1500 cm−1 was attributed to the C=N stretching vibration in the carbon–nitrogen heterocycle, which was in agreement with other studies [39]. The spike near 1700 cm−1 with a small width belonged to the C=O stretching vibration of the carboxylic groups, which meant that carboxylic groups were present on the surface of the composite material. There was also a relatively wide peak near 3400 cm−1, and such a peak was mainly caused by C-H bending; another weaker and relatively wide peak near 3500 cm−1 was due to the bending vibration of -OH.
As seen in Figure 5a, both CDBPC and BiPO4/g-C3N4 had obvious absorption band edges at 280 nm and 410 nm. Compared with BiPO4/g-C3N4, the absorption intensity of CDBPC decreased, but its absorption range increased significantly. A redshift in the absorption band edge of CDBPC implied that the addition of g-C3N4 reduced the band gap of the photocatalyst. The energy band gap of the two materials was calculated by a Tauc plot, and the results are shown in Figure 5b. The energy band gap was 2.98 eV for BiPO4/g-C3N4, 2.68 eV for the CDBPC material, and 2.98 eV for BiPO4/g-C3N4, indicating that the addition of CDs reduced the energy band gap and resulted in a wider light absorption range.

2.2. Effect of Preparation Conditions on CDBPC Catalytic Performance

The effect of CD loading on the catalytic efficiency of TC degradation was investigated, with CD loading ranging from 3% to 30%, and the results are shown in Figure 6. After 60 min of light avoidance adsorption, the highest removal rate of TC was only 4%, which indicated that the adsorption performance of the CDBPC material was poor. During the photocatalytic reaction, the degradation rate of TC gradually improved with increasing time and became stable at 210 min. The catalytic degradation efficiency was 45.5%. When the CDs loading was 3 wt%, the catalytic degradation efficiency was 48.5% at 210 min, and the catalytic degradation efficiency reached 68.86% when the CDs loading was 5 wt%. Subsequently, when the CDs loading was increased to 10 wt% and 20 wt%, the degradation effect decreased slightly. When the loading of CDs was raised to 30 wt%, the removal efficiency dropped dramatically, and the final degradation rate was only 27.27%. Firstly, due to the excessive CDs covering the g-C3N4 and BiPO4 materials, the two materials could not be excited by light to produce electron holes, and only the light energy that penetrated the CDs could have an effect [39]. Secondly, it was possible that the excessive CDs reduced the number of active sites in the CDs/g-C3N4/BiPO4 composites, which reduced the effective collision probability between the composites and TC [40]. Thus, it was observed that increasing the loading of CDs appropriately was beneficial to improve the degradation efficiency of TC. However, excessive loading was not conducive to degradation. Under the experimental conditions of this paper, the optimal CDs loading was 5 wt%.

2.3. Effects of Operating Parameters on the Degradation of TC

The pH had a strong impact on the photocatalytic degradation process. It determined the surface charge properties of the composite, affected the adsorption and degradation ability of the composite on the target pollutant, and determined the ionized state of the catalyst surface. In this paper, the effect of pH on the degradation rate of CDBPC was investigated, and the results are shown in Figure 7a. According to the figure, the pH variation had little effect on the adsorption efficiency during the light-avoidance adsorption stage, which was maintained at a low level. In the photocatalytic degradation stage, the pH was in the range of 4–14, and the degradation rate decreased gradually from 74.89% to 13.67% with increasing pH. When the pH was 2, the degradation rate of TC was 75.02%, which was close to that at pH 4. This was mainly caused by two reasons: (a) acidic conditions could inhibit the decomposition of −OH and the oxygen evolution reaction and improve the utilization of free radicals; (b) compared with the −OH oxidation potential under alkaline conditions (2.02 V), the −OH oxidation potential under acidic conditions (2.85 V) exhibited stronger oxidation performance. After comprehensive consideration, the optimal pH value was 4. In general, the acidic conditions were more favorable for the photocatalytic degradation of TC by CDBPC.
The effect of CBPC dosage on the degradation efficiency of TC was studied, and the results are shown in Figure 7b. When the doses of CDBPC were 0.1 g/L, 0.2 g/L, 0.5 g/L and 1 g/L, the degradation rates of TC were 39.6%, 49.3%, 69.5% and 73.2%, respectively. At this time, as the dosage increased, the degradation rate increased, mainly because the addition of a catalyst could enhance the chance of contact between the catalyst and solute, thereby improving the degradation efficiency. As the dosage continued to increase to 2 g/L and 3 g/L, the degradation rate of TC not only did not improve but also decreased slightly to 71.4% and 71.7%, respectively. This might be due to the high dosage of CDBPC, which caused the materials to block the light from each other and reduced the production of active species. A large number of catalysts might agglomerate to hinder the contact between the materials and the contaminants.
Figure 7c shows the effect of the initial concentration of TC solution on the photocatalytic degradation rate. In general, the initial concentration of TC had little effect on the light-avoiding adsorption stage. In the photocatalytic stage, when the concentration of TC was 5 mg/L, 10 mg/L, 20 mg/L, 30 mg/L, 50 mg/L, and 100 mg/L, the degradation rates were 79.3%, 75.5%, 69.0%, 51.2%, 34.9%, and 19.7%, respectively. As the initial concentration increased, the degradation rate gradually decreased, while the amount of TC degradation increased instead. Mainly due to the high initial concentration of the TC solution, the catalyst had more contact opportunities with TC, and thus, the amount of TC degradation was greater. Similarly, because of the high initial concentration of TC solution, the degradation rate of TC was lower, which was consistent with previous studies. In summary, under the current experimental conditions, CDBPC materials provided excellent photocatalytic degradation effects for TC solutions within 20 mg/L.

2.4. Degradation Kinetics of TC

TC degradation was fitted to pseudo-first-order kinetics and pseudo-second-order kinetics models, respectively (Figure 8). The goodness of (R2), slope (k), and half-lives (t1/2) of the kinetic equations for the different TC initial concentrations and different initial pH values were calculated in Table 2. For different initial TC concentration conditions, the R2 values of the pseudo-first-order kinetics model ranged from 0.9314 to 0.9937, while that of the pseudo-second-order kinetics model ranged from 0.955 to 0.9949. This suggests that TC degradation was more consistent with the pseudo-second-order kinetics model. As shown in Figure 8c,d, there was a significant difference in the degradation effect under different initial pH conditions. The fitting linear correlation coefficient was only 0.63–0.74 when the pH value was greater than 7. In the range of pH 2–7, the R2 values for the pseudo-first-order kinetics ranged from 0.9087 to 0.972, while the R2 values ranged from 0.9438 to 0.9985 for the pseudo-second-order kinetics, suggesting that TC degradation with different pH conditions was more consistent with the pseudo-second-order kinetics.
As seen in Table 2, when the initial concentration of TC was 5 mg/L, the degradation rate constant was the largest (2.3 × 10⁻³ min−1) and the t1/2 time was the lowest (only 87 min). As the initial concentration increased, the degradation rate constant decreased continuously. When the initial concentration of TC was 100 mg/L, the degradation rate constant was 0.03 × 10⁻³ min−1, and t1/2 was 333.3 min. Compared with the initial concentration of TC of 5 mg/L, the degradation rate constant was only 1/76, and t1/2 was 3.83 times longer.
As shown in Table 3, a lower pH value was more favorable for the degradation of TC due to the higher OH oxidation potential. When the pH value was 2, the degradation rate was 1.5 × 10⁻³ min−1, and t1/2 was 67.9 min. When the pH value was 4, the highest degradation rate constant was reached, which was 1.9 × 10⁻³ min−1, and t1/2 was 53.2 min. As the pH value increased, the degradation rate constant gradually decreased, while t1/2 gradually increased. When the pH value reached 12, the degradation rate constant was 0.05 × 10⁻³ min−1, and the t1/2 was 1904.2 min. Compared with the pH of 4, the degradation rate constant was 1/38, and the t1/2 was 35.79 times longer.

2.5. Free Radical Identification

BQ, EDTA-2Na and TBA were used as superoxide radical (O2−), hole (h+), and hydroxyl radical (OH) scavengers, respectively [41]. As shown in Figure 9, the photocatalytic reaction was almost completely inhibited by the addition of EDTA disodium, indicating that hole (h+) was the most dominant active substance for TC degradation. The addition of BQ and TBA also had some effect on the photocatalytic performance, but the effect was not as obvious as that of the hole (h+), indicating that ∙O2− and OH were also involved in the photocatalytic reaction. The CDs/g-C3N4/BiPO4 composite prepared in this study exhibited an excellent photocatalytic performance.

2.6. Proposed Reaction Mechanism

Figure 10 displays the possible photocatalytic degradation mechanism of T composites. The semiconductor BiPO4 and g-C3N4 were combined to form a heterogeneous structure with CDs attached to its surface and junction. The semiconductor BiPO4 could directly absorb energy with wavelengths less than 320 nm in sunlight, and g-C3N4 could directly absorb energy with wavelengths less than 420 nm. The two materials could absorb solar energy with wavelengths greater than 500 nm by the CDs particles attached to their surfaces to enhance the utilization. After the absorption of solar energy by both materials, electrons in the VB were excited and jumped to the CB, thus generating holes in the VB. The holes (h+) could directly degrade TC into intermediate products CO2 and H2O, and the holes (h+) could also react with OH− or H2O to produce −OH. Then, the hydroxyl radicals could interact directly with TC degradation [42,43,44]. The jumped electrons then combined with O2 to produce ∙O2−, and superoxide radicals could catalyze TC degradation.

3. Materials and Methods

3.1. Materials and Chemicals

TC was purchased from Aladdin Reagent (Shanghai) Co., Ltd. (Shanghai, China) and stored at 4 °C. EDTA disodium, tert-butyl alcohol (TBA), benzoquinone (BQ) and other chemicals were obtained from Sinopharm Chemical Reagent Co., Ltd., (Shanghai, China). All chemicals used in the experiments were of analytical grade. A stock standard solution of TC (1000 mg/L) was prepared in ultrapure water and then diluted with double distilled water.

3.2. Preparation of CDs/g-C3N4/BiPO4

Graphitic carbon nitride (g-C3N4) was prepared by high-temperature calcination at 550 °C employing melamine as the source material. A certain amount of citric acid and ethylenediamine monohydrate was placed in a hydrothermal reactor and reacted at 180 degrees C for 24 h. The mixed solution was subsequently freeze-dried to obtain CDs. A certain amount of g-C3N4 was placed in water for ultrasonic stirring, and then Bi(NO3)3·5H2O and NaH2PO4·2H2O were added in a molar ratio of 1:1 and synthesized in a hydrothermal reactor at 160 °C. The suspended solid was subsequently filtered, washed, and dried to obtain the g-C3N4/BiPO4 complex. Certain amounts of CDs were codissolved with g-C3N4/BiPO4 in ethanol and then dried at 70 °C. The materials were calcined in a muffle furnace at 300 °C to obtain 3 wt%, 5 wt%, 10 wt%, 20 wt%, and 30 wt% CDBPC composite photocatalysts.

3.3. Photocatalytic Activity of the CDBPC Composite by Beaker Experiments

All of the experiments in this work were carried out in a dedicated photocatalytic reactor, as illustrated in Figure 11. The adsorption phase was carried out in the dark, and the photocatalytic phase was carried out with a 500 W xenon lamp that simulated visible light, with the UV component isolated by a filter.
To evaluate the effect of an initial pH value, experiments were conducted in the initial pH range of 2.0–12.0. 0.1 M NaOH and H2SO4 was used to adjust the pH values. The related description has been added in the revised manuscript accordingly. Four catalyst dosages (0.2, 0.5, 1.0, 2.0, and 3.0 g/L) were used to assess the effect of the photocatalyst dosages on TC degradation. The effect of the initial TC concentration was examined at five concentrations (5, 10, 20, 30, 50, and 100 mg/L). To identify the role of the generated reactive oxygen species such as holes (h+), HO, and O2−, scavengers such as EDTA disodium, tert-butyl alcohol, and benzoquinone (BQ) were used. All experiments except repetitive experiments were conducted three times, and the relative standard deviations were usually within 3% unless otherwise stated.

3.4. Analytical Methods

The TC concentration was analyzed by an Agilent 1100 LC system using a C18 column (5 μm, 150 × 4.6 mm, Phenomenex, Torrance, CA, USA) with a UV detector at 280 nm. The X-ray diffraction (XRD) pattern was conducted on a D/max 2200 vpc Diffractometer (Rigaku Corporation, Tokyo, Japan) with a Cu Karadiation at 30 kV and 30 mA. Scanning electron microscopy (SEM) was performed on gold-coated samples using a Quanta-400F-mode field emission scanning electron microscope (FEI, Lausanne, Switzerland). The SBET was determined with an Autosorb-iQ-MP automated gas sorption analyzer (Quantachrome Instruments, Boynton Beach, FL, USA) by nitrogen adsorption/desorption isotherms and calculated by the Brunauer–Emmett–Teller (BET) method.

3.5. Reaction Kinetics

The photocatalytic degradation of TC can be described by the pseudo-first-order kinetic and pseudo-second-order kinetic models, as shown in Equations (1) and (2), respectively [45].
l n ( C 0 / C t ) = k × t
C t 1 C 0 1 = k × t
The half-lives (t1/2) of the first-order kinetic and pseudo-second-order kinetic models were calculated via Equations (3) and (4):
t 1 / 2 = I n ( 2 ) × k 1
t 1 / 2 = C 0 1 × k 1
where C 0 is the TC concentration at the initial time, C t is the TC concentration at any time “ t ”, and k is the degradation rate constant.

4. Conclusions

This paper constructed a novel CDs/g-C3N4/BiPO4 composite photocatalyst, which could overcome the respective defects of g-C3N4 and BiPO4. The introduction of CDs could enhance the visible light utilization range and solubility and improve catalytic efficiency. The CDs/g-C3N4/BiPO4 composite catalytic material exhibited excellent catalytic activity. During the visible light photocatalytic reaction, CDs/g-C3N4/BiPO4 showed the strongest catalytic activity when the loading of CDs was 5 wt%, and the TC degradation rate reached 68.85%. The CDs/g-C3N4/BiPO4 composite had a wider adsorption range with an energy band gap of 2.68 eV, and the main active species were holes (h+), followed by OH and O2−. Finally, the probable photocatalytic mechanism for TC degradation over the CDBPC composite photocatalyst was shown.

Author Contributions

Conceptualization, Z.D. and M.L.; methodology, Z.L.; software, Z.J.; validation, Y.W. and Z.L.; formal analysis, W.Q.; writing—original draft preparation, W.Q. and W.H.; writing—review and editing, Z.D.; supervision, M.L. All authors have read and agreed to the published version of the manuscript.

Funding

This work was funded by the Project of Educational Commission of Guangdong Province of China (No. 2019KTSCX067), College Students’ Innovation and Entrepreneurship Competition (No. 202211347036 and No. S202111347080), Guangdong Special Commissioners in Agricultural Science and Technology (No. KTP20190016), Special project in key areas of Guangdong Province Ordinary Universities (Nos. 2020ZDZX1003 and 2021ZDJS007), Key Realm R&D Program of Guangdong Province (Nos. 2020B1111350002 and 2020B0202080002) and the National Natural Science Foundation of China (No.21407155).

Data Availability Statement

Not applicable.

Conflicts of Interest

The authors declare no conflict of interest.

References

  1. Zhang, Q.Q.; Ying, G.G.; Pan, C.G.; Liu, Y.S.; Zhao, J.L. Comprehensive evaluation of antibiotics emission and fate in the river basins of China: Source analysis, multimedia modeling, and linkage to bacterial resistance. Environ. Sci. Technol. 2015, 49, 6772. [Google Scholar] [CrossRef] [PubMed]
  2. Lu, P.; Fang, Y.; Barvor, J.B.; Neth, N.L.K.; Fan, N.; Li, Z.; Cheng, J. Review of Antibiotic Pollution in the Seven Watersheds in China. Pol. J. Environ. Stud. 2019, 28, 4045–4055. [Google Scholar] [CrossRef]
  3. Jia, L.; Lya, C.; Lan, Z.B.; By, B.; Li, W. Antibiotics in soil and water in China—A systematic review and source analysis. Environ. Pollut. 2020, 266, 115147. [Google Scholar]
  4. Kumar, M.; Jaiswal, S.; Sodhi, K.K.; Shree, P.; Singh, D.K.; Agrawal, P.K.; Shukla, P. Antibiotics bioremediation: Perspectives on its ecotoxicity and resistance. Environ. Int. 2019, 124, 448–461. [Google Scholar] [CrossRef] [PubMed]
  5. Hain, E.; Adejumo, H.; Anger, B.; Orenstein, J.; Blaney, L. Advances in antimicrobial activity analysis of fluoroquinolone, macrolide, sulfonamide, and tetracycline antibiotics for environmental applications through improved bacteria selection. J. Hazard. Mater. 2021, 415, 125686. [Google Scholar] [CrossRef] [PubMed]
  6. Danner, M.C.; Robertson, A.; Behrends, V.; Reiss, J. Antibiotic pollution in surface fresh waters: Occurrence and effects. Sci. Total Environ. 2019, 664, 793–804. [Google Scholar] [CrossRef]
  7. Tang, J.; Fang, J.; Tam, N.F.; Yang, Y.; Dai, Y.; Zhang, J.; Shi, Y. Impact of Phytoplankton Blooms on Concentrations of Antibiotics in Sediment and Snails in a Subtropical River, China. Environ. Sci. Technol. 2021, 55, 1811–1821. [Google Scholar] [CrossRef]
  8. Chao, Y.; Zhang, J.; Li, H.; Wu, P.; Li, X.; Chang, H.; Zhu, W. Synthesis of boron nitride nanosheets with N-defects for efficient tetracycline antibiotics adsorptive removal. Chem. Eng. J. 2020, 387, 124138. [Google Scholar] [CrossRef]
  9. Zhou, Y.; Gao, Y.; Jiang, J.; Shen, Y.M.; Pang, S.Y.; Wang, Z.; Duan, J.; Guo, Q.; Guan, C.; Ma, J. Transformation of tetracycline antibiotics during water treatment with unactivated peroxymonosulfate. Chem. Eng. J. 2020, 379, 122378. [Google Scholar] [CrossRef]
  10. Liu, L.; Xu, Q.; Owens, G.; Chen, Z. Fenton-oxidation of rifampicin via a green synthesized rGO@nFe/Pd nanocomposite. J. Hazard. Mater. 2020, 402, 123544. [Google Scholar] [CrossRef]
  11. Jeong, W.G.; Kim, J.G.; Baek, K. Removal of 1,2-dichloroethane in groundwater using Fenton oxidation. J. Hazard. Mater. 2022, 428, 128253. [Google Scholar] [CrossRef]
  12. Mizuno, Y.; Yahaya, A.G.; Kristof, J.; Blajan, M.G.; Murakami, E.; Shimizu, K. Ozone Catalytic Oxidation for Gaseous Dimethyl Sulfide Removal by Using Vacuum-Ultra-Violet Lamp and Impregnated Activated Carbon. Energies 2022, 15, 3314. [Google Scholar] [CrossRef]
  13. Fu, C.; Yi, X.; Liu, Y.; Zhou, H. Cu2+ activated persulfate for sulfamethazine degradation. Chemosphere 2020, 257, 127294. [Google Scholar] [CrossRef] [PubMed]
  14. Fagan, W.P.; Zhao, J.; Villamena, F.A.; Zweier, J.L.; Weavers, L.K. Synergistic, aqueous PAH degradation by ultrasonically activated persulfate depends on bulk temperature and physicochemical parameters-ScienceDirect. Ultrason. Sonochem. 2020, 67, 105172. [Google Scholar] [CrossRef] [PubMed]
  15. Huang, S.; Wang, G.; Liu, J.; Du, C.; Su, Y. A novel CuBi2O4/BiOBr direct Z-scheme photocatalyst for efficient antibiotics removal: Synergy of adsorption and photocatalysis on degradation kinetics and mechanism insight. ChemCatChem 2020, 12, 4431–4445. [Google Scholar] [CrossRef]
  16. Das, S.; Ahn, Y.H. Synthesis and application of CdS nanorods for LED-based photocatalytic degradation of tetracycline antibiotic. Chemosphere 2022, 291, 132870. [Google Scholar] [CrossRef]
  17. Gholami, P.; Khataee, A.; Bhatnagar, A.; Vahid, B. Synthesis of N-Doped Magnetic WO3-x @Mesoporous Carbon Using a Diatom Template and Plasma Modification: Visible-Light-Driven Photocatalytic Activities. ACS Appl. Mater. Interfaces 2021, 13, 13072–13086. [Google Scholar] [CrossRef]
  18. Ahmaruzzaman, M.; Mishra, S.R. Photocatalytic performance of g-C3N4 based nanocomposites for effective degradation/ removal of dyes from water and wastewater. Mater. Res. Bull. 2021, 143, 111417. [Google Scholar] [CrossRef]
  19. Chang, X.; Wang, Y.; Zhou, X.; Song, Y.; Zhang, M. ZIF-8-derived carbon-modified g-C3N4 heterostructure with enhanced photocatalytic activity for dye degradation and hydrogen production. Dalton Trans. 2021, 50, 17618–17624. [Google Scholar] [CrossRef]
  20. Nemiwal, M.; Zhang, T.C.; Kumar, D. Recent Progress in g-C3N4, TiO2 and ZnO Based Photocatalysts for Dye Degradation: Strategies to Improve Photocatalytic Activity. Sci. Total Environ. 2021, 767, 144896. [Google Scholar] [CrossRef]
  21. Zhao, L.; Jin, R.; Zhang, B. A novel Z-scheme g-C3N4-Pt-BiPO4 photocatalyst for enhanced photocatalytic degradation of azofuchsin and ciprofloxacin. J. Am. Ceram. Soc. 2021, 104, 6319–6334. [Google Scholar] [CrossRef]
  22. Yu, H.; Xu, S.; Zhang, S.; Wang, S.; He, Z. In-situ construction of core-shell structured TiB2-TiO2@g-C3N4 for efficient photocatalytic degradation. Appl. Surf. Sci. 2022, 579, 152201. [Google Scholar] [CrossRef]
  23. Nouri, A.; Faraji Dizaji, B.; Kianinejad, N.; Jafari Rad, A.; Rahimi, S.; Irani, M.; Sharifian Jazi, F. Simultaneous linear release of folic acid and doxorubicin from ethyl cellulose/chitosan/g-C3N4/MoS2 core-shell nanofibers and its anticancer properties. J. Biomed. Mater. Res. Part A 2021, 109, 903–914. [Google Scholar] [CrossRef] [PubMed]
  24. Shi, Z.; Zhang, Y.; Shen, X.; Duoerkun, G.; Zhu, B.; Zhang, L.; Li, M.; Chen, Z. Fabrication of g-C3N4/BiOBr heterojunctions on carbon fibers as weaveable photocatalyst for degrading tetracycline hydrochloride under visible light. Chem. Eng. J. 2020, 386, 124010. [Google Scholar] [CrossRef]
  25. Dai, D.; Wang, P.; Bao, X.; Xu, Y.; Wang, Z.; Guo, Y.H. g-C3N4/ITO/Co-BiVO4 Z-scheme composite for solar overall water splitting. Chem. Eng. J. 2022, 433, 134476. [Google Scholar] [CrossRef]
  26. Liu, N.; Lu, N.; Yu, H.; Chen, S.; Quan, X. Enhanced degradation of organic water pollutants by photocatalytic in situ activation of sulfate based on Z-scheme g-C3N4/BiPO4. Chem. Eng. J. 2022, 428, 132116. [Google Scholar] [CrossRef]
  27. Li, J.; Zhao, L.; Zhang, R.; Teng, H.H.; Padhye, L.P.; Sun, P. Transformation of tetracycline antibiotics with goethite: Mechanism, kinetic modeling and toxicity evaluation. Water Res. 2021, 199, 117196. [Google Scholar] [CrossRef]
  28. Chen, Y.; Yin, R.; Zeng, L.; Guo, W.; Zhu, M. Insight into the effects of hydroxyl groups on the rates and pathways of tetracycline antibiotics degradation in the carbon black activated peroxydisulfate oxidation process. J. Hazard. Mater. 2021, 412, 125256. [Google Scholar] [CrossRef]
  29. Zhao, Z.; Zhang, G.; Zhang, Y.; Dou, M.; Li, Y. Fe3O4 accelerates tetracycline degradation during anaerobic digestion: Synergistic role of adsorption and microbial metabolism. Water Res. 2020, 185, 116225. [Google Scholar] [CrossRef]
  30. Ahamad, T.; Mu, N.; Alzaharani, Y.; Alshehri, S.M. Photocatalytic degradation of bisphenol-A with g-C3N4/MoS2-PANI nanocomposite: Kinetics, main active species, intermediates and pathways. J. Mol. Liq. 2020, 311, 113339. [Google Scholar] [CrossRef]
  31. Zhu, Y.; Zhao, F.; Wang, F.; Zhou, B.; Chen, H.; Yuan, R.; Liu, Y.; Chen, Y. Combined the photocatalysis and fenton-like reaction to efficiently remove sulfadiazine in water using g-C3N4/ag/γ-feooh: Insights into the degradation pathway from density functional theory. Front. Chem. 2021, 9, 742459. [Google Scholar] [CrossRef] [PubMed]
  32. Jaleel, U.; Devi, K.; Madhushree, R.; Pinheiro, D. Statistical and experimental studies of MoS2/g-C3N4/TiO2: A ternary Z-scheme hybrid composite. J. Mater. Sci. 2021, 56, 6922–6944. [Google Scholar] [CrossRef]
  33. Yang, Q.; Fang, C.; Zhao, N.; Jiang, Y.; Xu, B.; Chai, S.; Zhou, Y. Enhancing electron-hole utilization of cds based on cucurbiturils vis electrostatic interaction in visible light. J. Solid State Chem. 2019, 270, 450–457. [Google Scholar] [CrossRef]
  34. Samsudin, M.F.R.; Sufian, S. Hybrid 2D/3D g-C3N4/BiVO4 photocatalyst decorated with RGO for boosted photoelectrocatalytic hydrogen production from natural lake water and photocatalytic degradation of antibiotics-ScienceDirect. J. Mol. Liq. 2020, 314, 113530. [Google Scholar] [CrossRef]
  35. Wang, Q.; Lin, Y.; Li, P.; Ma, M.; Zhang, R. An efficient Z-scheme (Cr, B) codoped g-C3N4/BiVO4 photocatalyst for water splitting: A hybrid DFT study. Int. J. Hydro. Energy 2020, 46, 247–261. [Google Scholar] [CrossRef]
  36. Zhang, X.; Zhang, X.; Yang, P.; Jiang, S.P. Transition metals decorated g-C3N4/n-doped carbon nanotube catalysts for water splitting: A review. J. Electroanal. Chem. 2021, 895, 115510. [Google Scholar] [CrossRef]
  37. Ma, X.; Hu, J.; Hua, H.; Shijie, D.; Chuyun, H.; Xiaobo, C. New Understanding on Enhanced Photocatalytic Activity of g-C3N4/BiPO4 Heterojunctions by Effective Interfacial Coupling. ACS Appl. Nano Mater. 2018, 1, 5507–5515. [Google Scholar] [CrossRef]
  38. Xia, J.; Zhao, J.; Chen, J.; Di, J.; Ji, M.; Xu, L. Facile fabrication of g-C3N4/BiPO4 hybrid materials via a reactable ionic liquid for the photocatalytic degradation of antibiotic ciprofloxacin. J. Photochem. Photobiol. A Chem. 2017, 339, 59–66. [Google Scholar] [CrossRef]
  39. He, Y.; Li, J.; Sheng, J.; Chen, S.; Dong, F.; Sun, Y. Crystal-Structure Dependent Reaction Pathways in Photocatalytic Formaldehyde Mineralization on BiPO4. J. Hazard. Mater. 2021, 420, 126633. [Google Scholar] [CrossRef]
  40. Wang, Y.; Ding, K.; Xu, R.; Yu, D.; Liu, B. Fabrication of BiVO4/BiPO4/GO composite photocatalytic material for the visible light-driven degradation. J. Clean. Prod. 2020, 247, 119108. [Google Scholar] [CrossRef]
  41. Li, Y.; Zhang, H.; Rashid, A.; Hu, A.; Xin, K.; Li, H.; Adyari, B.; Wang, Y.; Yu, C.P.; Sun, Q. Bisphenol A attenuation in natural microcosm: Contribution of ecological components and identification of transformation pathways through stable isotope tracing. J. Hazard. Mater. 2020, 385, 121584.1–121584.10. [Google Scholar] [CrossRef] [PubMed]
  42. Chen, L.C.; Pan, G.T.; Yang, C.K.; Chung, T.W.; Huang, C.M. In situ DRIFT and kinetic studies of photocatalytic degradation on benzene vapor with visible-light-driven silver vanadates. J. Hazard. Mater. 2010, 178, 644–651. [Google Scholar] [CrossRef] [PubMed]
  43. Asadzadeh-Khaneghah, S.; Habibi-Yangjeh, A. g-C3N4/carbon dot-based nanocomposites serve as efficacious photocatalysts for environmental purification and energy generation: A review. J. Clean. Prod. 2020, 276, 124319. [Google Scholar] [CrossRef]
  44. Zhu, X.; Wang, Y.; Guo, Y.; Sun, C. Environmental-friendly synthesis of heterojunction photocatalysts g-C3N4/BiPO4 with enhanced photocatalytic performance. Appl. Surf. Sci. 2020, 544, 148872. [Google Scholar] [CrossRef]
  45. Olfa, B.; Lobna, J.; Wahiba, N.; Sami, S. Photocatalytic degradation of bisphenol a in the presence of ce–zno: Evolution of kinetics, toxicity and photodegradation mechanism. Mater. Chem. Phys. 2016, 173, 95–105. [Google Scholar]
Figure 1. SEM (a,b,j) and TEM (c,d) images of CDBPC, EDS elemental mapping images of the corresponding area: (e) Bi, (f) P, (g) O, (h) C and (i) N.
Catalysts 12 00774 g001
Figure 2. Pore size and volume accumulation curves (a) and (b) nitrogen adsorption–desorption isotherm of CDBPC.
Catalysts 12 00774 g002
Figure 3. XRD patterns of CDBPC.
Catalysts 12 00774 g003
Figure 4. FT−IR spectra of the CDBPC composite.
Catalysts 12 00774 g004
Figure 5. (a) UV–Vis absorption spectra, (b) Tauc plots curve of CDBPC.
Catalysts 12 00774 g005
Figure 6. Degradation efficiency of TC versus time with different CD quality fractions.
Catalysts 12 00774 g006
Figure 7. Degradation efficiency of TC versus time with (a) different initial pH values, (b) doses of CDBPC composite, and (c) initial TC concentrations.
Catalysts 12 00774 g007
Figure 8. TC degradation of (a) pseudo-first-order kinetics and (b) pseudo-second-order kinetics with different TC concentration, (c) pseudo-first-order kinetics and (d) pseudo-second-order kinetics with different initial pH values.
Catalysts 12 00774 g008
Figure 9. Effect of different quenchers on the photocatalytic degradation of TC.
Catalysts 12 00774 g009
Figure 10. Schematic image of the probable photocatalytic mechanism for TC degradation over the CDBPC composite photocatalyst.
Catalysts 12 00774 g010
Figure 11. Schematic diagram of the photocatalysis experimental device.
Catalysts 12 00774 g011
Table 1. Elemental composition of CDBPC composite.
Chemical ElementsCNBiPO
mass ratio (wt %)34.8437.9815.911.619.66
atomic fraction (%)43.2640.450.690.7814.83
Table 2. TC degradation kinetics parameters with different TC initial concentrations.
Initial Concentration
(mg/L)
Pseudo-First-Order Kinetic ModelPseudo-Second-Order Kinetic Model
K (min−1)R2t1/2 (min)K (10−3 min−1)R2t1/2 (min)
50.00720.945996.32.30.987687.0
100.0070.931499.00.90.9858111.1
200.00650.9731106.60.50.9965100.0
300.00470.9485147.50.20.9606166.7
500.00230.9481301.40.10.955200.0
1000.00050.99371386.30.030.9949333.3
Table 3. TC degradation kinetics parameters with different initial pH.
Initial Concentration
(mg/L)
Pseudo-First-Order Kinetic ModelPseudo-Second-Order Kinetic Model
K (min−1)R2t1/2 (min)K (10−3 min−1)R2t1/2 (min)
50.00720.945996.32.30.987687.0
100.0070.931499.00.90.9858111.1
200.00650.9731106.60.50.9965100.0
300.00470.9485147.50.20.9606166.7
500.00230.9481301.40.10.955200.0
1000.00050.99371386.30.030.9949333.3
Publisher’s Note: MDPI stays neutral with regard to jurisdictional claims in published maps and institutional affiliations.

