Article

Decomposition of Naphthalene by Dielectric Barrier Discharge in Conjunction with a Catalyst at Atmospheric Pressure

1
College of Sciences, Shihezi University, Shihezi 832003, China
2
Key Laboratory of Materials Modification by Laser, Ion, and Electron Beams, Dalian University of Technology, Ministry of Education, Dalian 116024, China
3
Key Laboratory of Environmental Monitoring and Pollutant Control of Xinjiang Bingtuan, Shihezi University, Shihezi 832003, China
*
Authors to whom correspondence should be addressed.
Catalysts 2022, 12(7), 740; https://doi.org/10.3390/catal12070740
Submission received: 4 June 2022 / Revised: 25 June 2022 / Accepted: 2 July 2022 / Published: 5 July 2022

Abstract

:
In this study, coaxial dielectric barrier discharge (DBD) plasma, in conjunction with a metal oxide catalyst, was used to degrade naphthalene. The characteristics of plasma discharge were studied by measuring voltage and current waveforms and the Lissajous figure. The effects of different parameters of the process on naphthalene decomposition in air were investigated. XRD, BET, and SEM data were used to investigate the nature, specific surface area, and surface morphology of the catalyst. The results show that the mineralization of naphthalene reached 82.2% when the initial naphthalene concentration was 21 ppm and the total gas flow rate was 1 L/min in the DBD reactor filled with Al2O3. The mineralization of naphthalene first increased and then became stable with the increase in treatment time and discharge power. The TiO2 catalyst has more apparent advantages than the two other studied catalysts in terms of the removal efficiency and mineralization of naphthalene due to this catalyst’s large specific surface area, porous structure, and photocatalytic properties. In addition, the introduction of a small amount of water vapor can promote the mineralization and CO2 selectivity of naphthalene. With further increases in the water vapor, Fe2O3 has a negative effect on the naphthalene oxidation due to its small pore size. The TiO2 catalyst can overcome the adverse effects of water molecule attachment due to its photocatalytic properties.

1. Introduction

As a result of the development of society and industry, the content of polycyclic aromatic hydrocarbons (PAHs) in the environment has increased significantly. PAHs are a form of persistent organic pollutant having different structures and toxicity levels [1,2]. Due to their carcinogenicity and persistence, PAHs in air, water, and soil have become a serious threat to human health [3]. Therefore, PAH emission has received special attention from the World Health Organization [4], and the degradation and removal of PAHs have also become the focus of scientific research [5].
As the simplest PAH, naphthalene has attracted much attention due to its strong volatility and ubiquity in the atmosphere [6]. Many methods have been applied to degrade naphthalene in the environment, such as biodegradation, catalytic oxidation, and physical adsorption [7,8]. However, the above methods have limitations in terms of decomposition time, energy efficiency, adsorption capacity, etc. [9,10]. Compared with the above methods, non-thermal plasma (NTP) technology has the advantages of high removal efficiency, short treatment time, and wide applicability [11,12]. Thus, NTP has become an essential technology for degrading naphthalene and has received widespread attention.
In NTP, the particle temperature ranges from room temperature to approximately 3 × 10 4   K [13]. At room temperature, high-energy electrons generated by NTP are like “electronic scissors”. Through the collisions of electrons with background gases, the carrier gas molecules are dissociated, excited, and ionized to produce active particles such as excited particles, ions, free radicals, and electrons [14,15]. Then, these oxidize, reduce, or decompose pollutants, resulting in the effective degradation of naphthalene [16]. NTP can be produced using various approaches, including electron beams, corona discharge, gliding arc discharge, dielectric barrier discharge, and microwave plasma [17,18]. Dielectric barrier discharge (DBD) is one of the most commonly used methods to generate NTP in atmospheric air [19]. Wu et al. [6] reported the effect of different background gases on naphthalene decomposition in DBD. It was found that the O2 concentration was a key influencing factor in the naphthalene decomposition and COx formation. Rdeolfi et al. [20] studied the decomposition of naphthalene using a DBD reactor and found that the introduction of water vapor in the discharge could further promote the naphthalene degradation by OH atoms, which have better oxidation capacity than O atoms.
Compared with the process using plasma alone, the combination of DBD plasma and a catalyst further promotes the decomposition of gas-phase pollutants. Furthermore, it also addresses the problem of insufficient mineralization and reduces the generation of undesirable by-products. Nguyen et al. [21] used a Ag/α -Al2O3 catalyst coupled with DBD plasma to improve the conversion of soot simulant (naphthalene). The results showed that the combined use of the catalyst and plasma solved the problem of the poor removal of naphthalene at low operating temperatures. The plasma–catalyst completely decomposed the naphthalene at 350 °C with specific input energy of 90 J/L. Wu et al. [4] used a DBD reactor driven by a nanosecond pulse to oxidize naphthalene by combining plasma and a TiO2/diatomite catalyst. The study showed that the addition of the TiO2/diatomite catalyst effectively improved the conversion rate of naphthalene (up to 92%) and COx selectivity (up to 40%), and significantly reduced the formation of aerosols and secondary volatile organic compounds compared with the plasma-alone process. Therefore, it is necessary to investigate the treatment of naphthalene by combining plasma and catalysts.
The transition metal oxides, which include Fe2O3, ZnO2, TiO2, CuO, Al2O3, and MgO, can be widely used as catalysts due to their low cost, anti-toxicity, and high catalytic activity [22,23,24]. Choi et al. [25] mentioned that Al2O3 was usually used as a catalyst because of its thermally stable and relatively high thermal conductivity. Wu et al. [26] investigated the effect of Fe2O3 on the chemical looping generation of NH3, and found that Fe2O3 can reduce the activation energy of the N-desorption step due to its considerable catalytic effect on the reaction. Bagheri et al. [27] found that TiO2, a photocatalyst, is widely applied in industry due to its high physical and chemical stability, in addition to its high activity.
In this study, a plasma catalytic degradation platform was independently constructed. A uniform and stable coaxial DBD plasma, in conjunction with three transition metal oxides (Al2O3, Fe2O3, and TiO2), was used to degrade naphthalene. The synergy of each catalyst with DBD was investigated based on discharge characteristics, removal efficiency, mineralization, and CO2 selectivity. In this paper, the effects of initial naphthalene concentration, total gas flow rate, discharge power, treatment time, and relative humidity (RH) on mineralization and CO2 selectivity in the DBD reactor filled with the catalyst are discussed. Finally, a discussion of the physical structure of the catalysts is presented, in which the specific surface area, surface morphology, and microstructure are taken into account.

2. Materials and Methods

2.1. Materials

In this study, three transition metal oxides (Al2O3, Fe2O3, and TiO2) were used as catalysts to fill the discharge gap. All of these filling materials were purchased from advanced material professional manufacture Co., Ltd. Their particle sizes were 1–3 mm, and they had a purity of 99.9%. Naphthalene at a purity of 99.7% was provided by Shanghai Macklin Biochemical Co., Ltd. The materials are commercially available and were untreated.

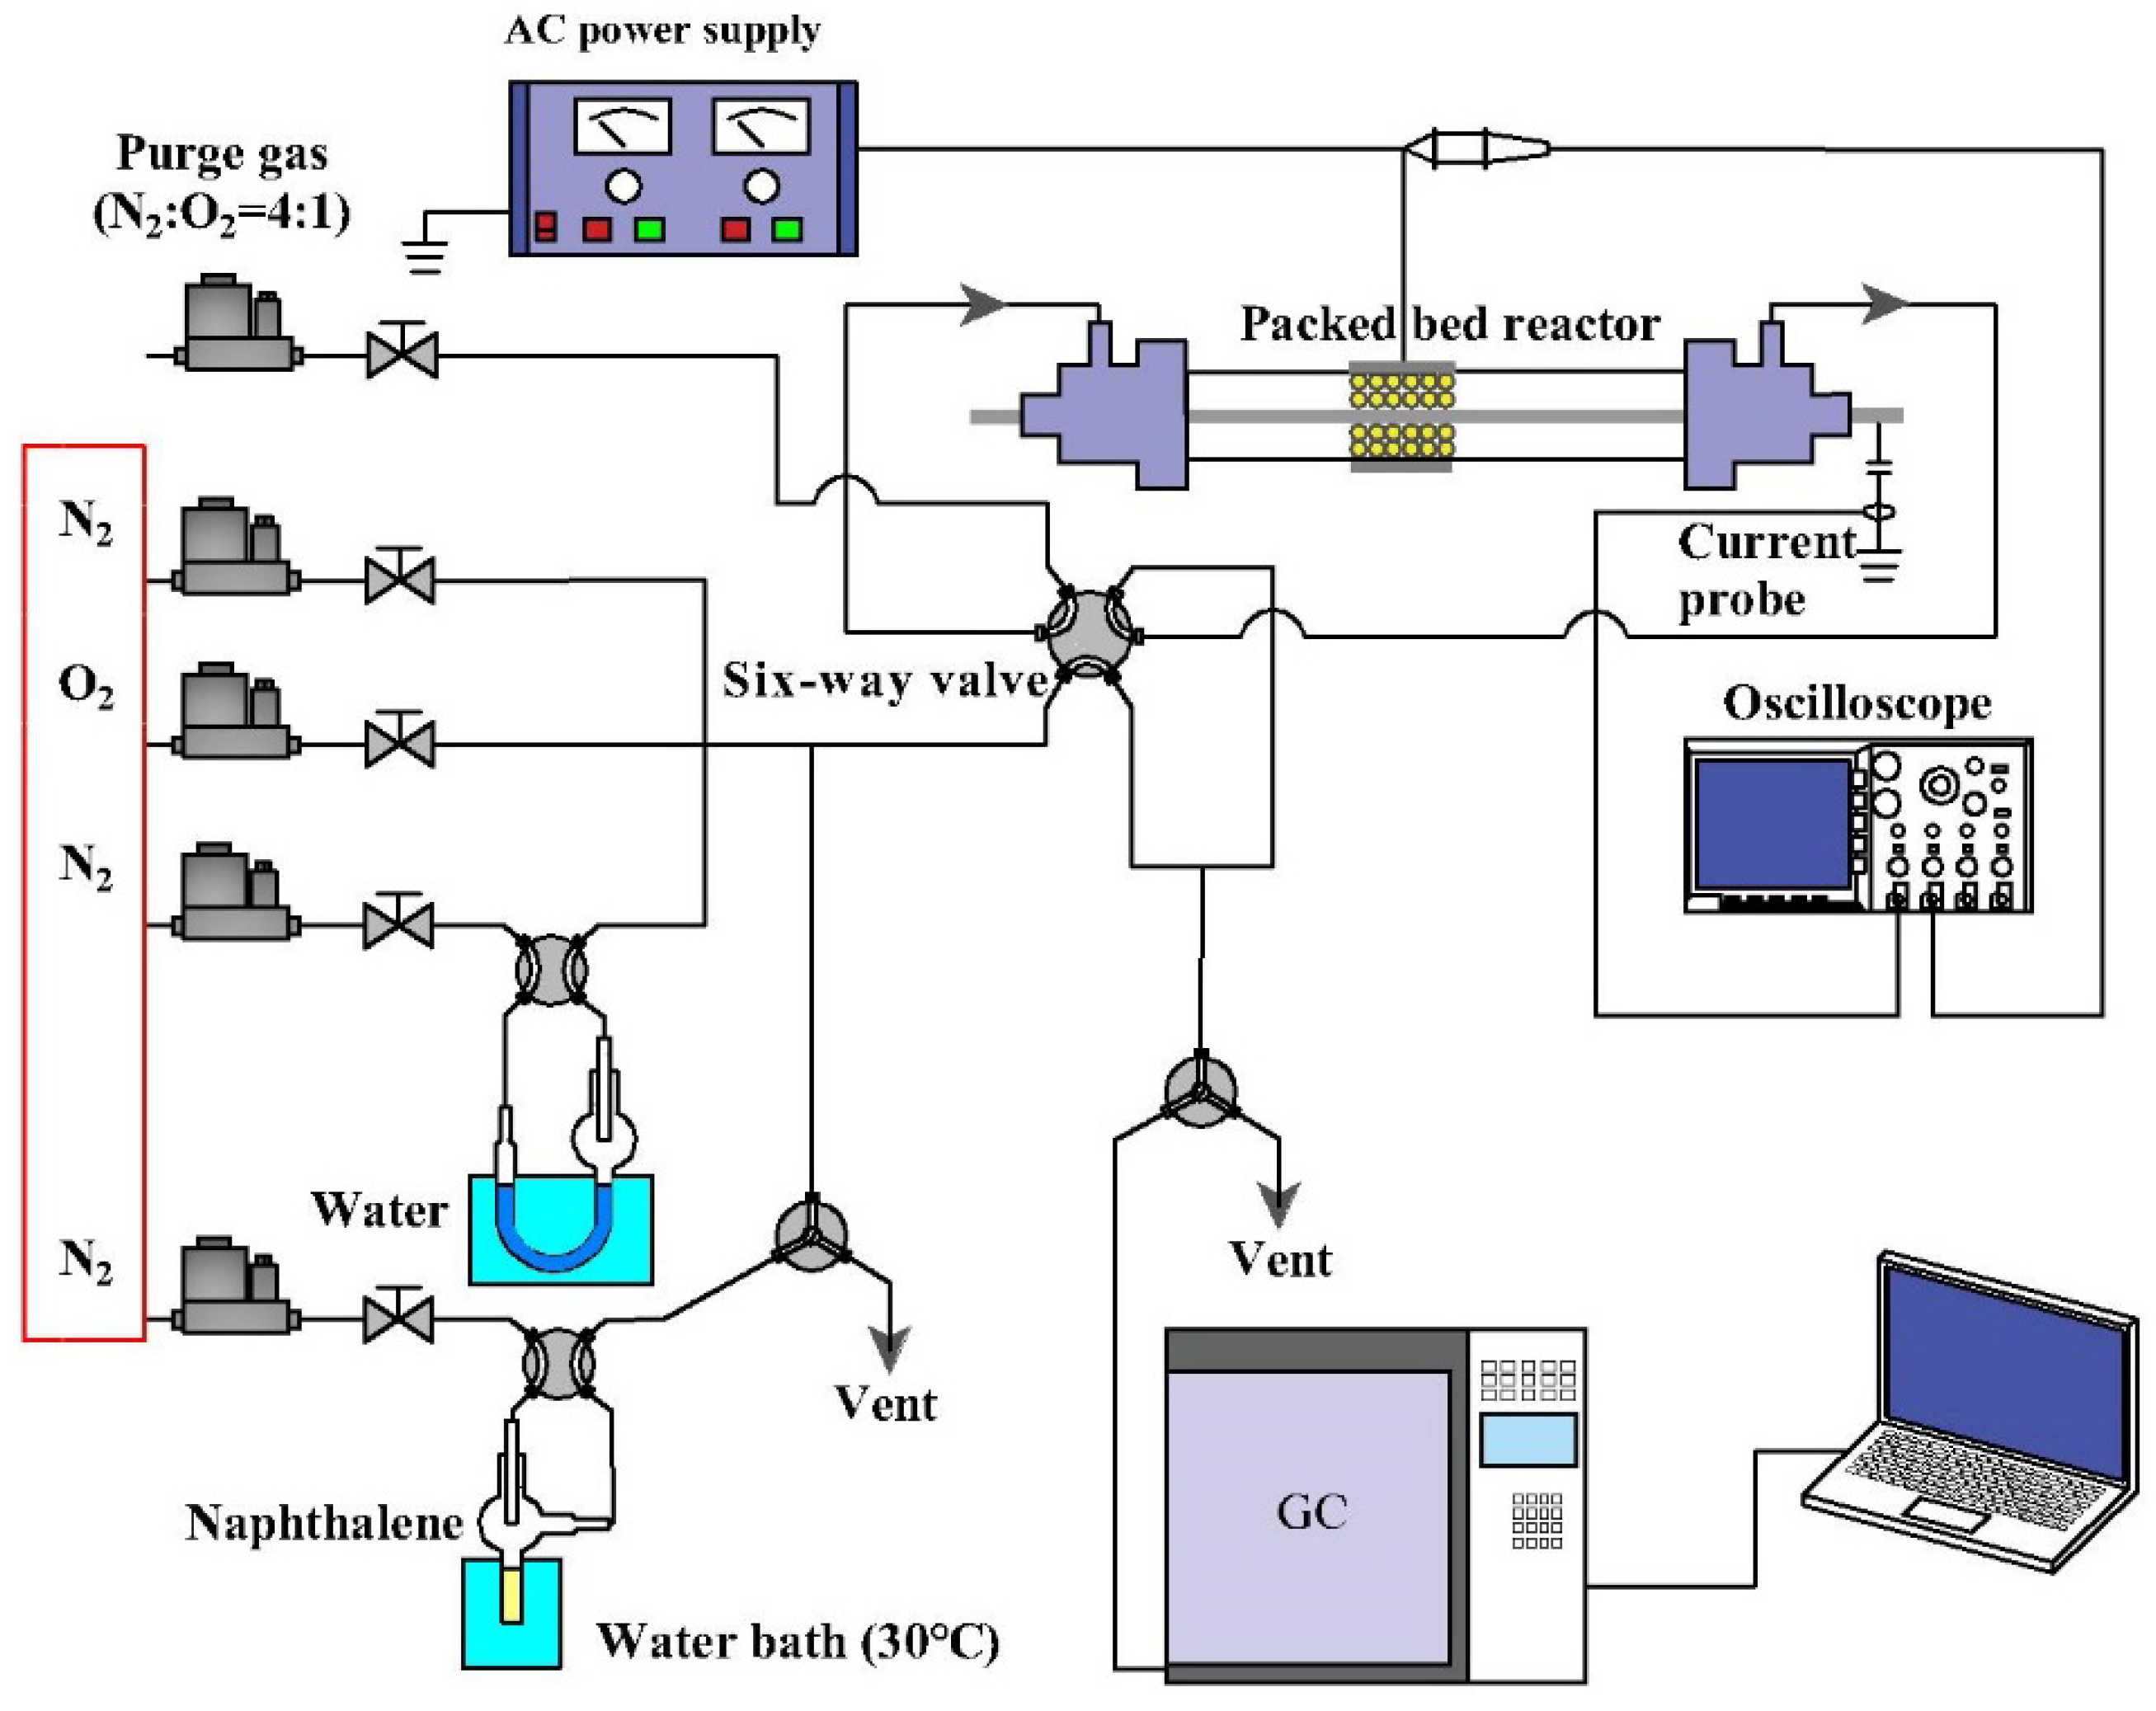
2.2. Experimental Setup

A schematic of the experimental setup used in the present study is shown in Figure 1. The gas supplied by the system was composed of synthetic air (N2:O2 = 4:1) (99.99% purity). The total gas flow rate was maintained at 500 mL/min and controlled by the mass flow controller (MFC). In order to ensure the stability of the gas-phase naphthalene and the water vapor input to the reactor, N2 in synthetic air was separated into three paths, two of which were dedicated to carrying naphthalene and water vapor. The naphthalene vapor was generated by placing a sealed quartz tube filled with 3 g naphthalene into a 30 °C water bath pot. N2 was passed through the quartz tube as the carrier gas of the naphthalene vapor, and the flow rate was set to 200 mL/min. A heating tape system (55~60 °C) was equipped in the inlet gas line to prevent the condensation of the naphthalene vapor. The naphthalene in the N2 carrier gas was collected by another quartz tube filled with 5 mL of anhydrous ethanol, and the naphthalene concentration was measured by an ultraviolet spectrophotometer (UV-Vis-NIR, Agilent Technologies). A portion of the carrier gas was passed through a bubble bottle, which was placed in an insulated drum with cold water and combined with another portion of the dry gas to control the proportion of humidity.
The reactor used in this work was a coaxial DBD reactor consisting of a quartz tube having an inner diameter of 12 mm, a thickness of 1.5 mm, and a length of 250 mm. A piece of silver-plated copper (25 mm height) was wrapped around the quartz tube as a high-voltage electrode. A stainless steel rod having a 6 mm diameter was inserted into the quartz tube as a low-voltage electrode. The transition metal oxides (3 g) were placed in the discharge gap with a packing length of 25 mm to constitute a plasma–catalyst reactor.

2.3. Testing Methods

An AC power supply (CTP-2000K, Nanjing Suman) was used to supply the DBD reactor voltage with a fixed frequency of 12.6 kHz. The applied voltage and current waveforms were measured using a 1:1000 HV probe (P6015A, Tektronix) and a current probe (TPP0500B, Tektronix), respectively. The electrical signals were recorded by a digital oscilloscope (OSC, MDO3034, Tektronix). The discharge power was determined by the product of the discharge energy and the driving frequency. The gas from the outlet of the DBD reactor was analyzed using a gas chromatograph (GC 7900, Techcomp) equipped with a carbon molecular sieve column and a PEG-20000 capillary column, two flame ionization detectors (FID) for each column, and a methanation converter, where the methanation converter was used to measure CO and CO2 concentrations. The specific surface area, microstructure, and surface morphology of the catalysts were characterized using the Brunauer–Emmett–Teller method, X-ray diffraction, and scanning electron microscopy, respectively.
The discharge power P (W) of the DBD reactor was calculated by Equation (1):
P ( W ) = f × E = f × C × S ,
where f is the driving frequency, C is the additional capacitance (0.22 μF in this study), and S is the integral area of the closed Lissajous figure.
The removal efficiency of naphthalene (ηnaphthalene), mineralization ( M CO x ), CO2 selectivity ( S CO 2 ), and COx concentration ( C CO x ) are defined in Equations (2)–(5):
η naphthalene ( % ) = ( C in C out C in ) × 100 ,
M CO x ( % ) = C CO 2 + C CO 10 C nap × 100 ,
S CO 2 ( % ) = C CO 2 C CO 2 + C CO × 100 ,
C CO x ( ppm ) = C CO 2 + C CO ,
where C in and C out are the concentrations of naphthalene at the inlet and outlet, respectively. C CO and C CO 2 are the concentrations of produced CO and CO2, respectively. Cnap is the naphthalene concentration passing through the reactor.

3. Results and Discussion

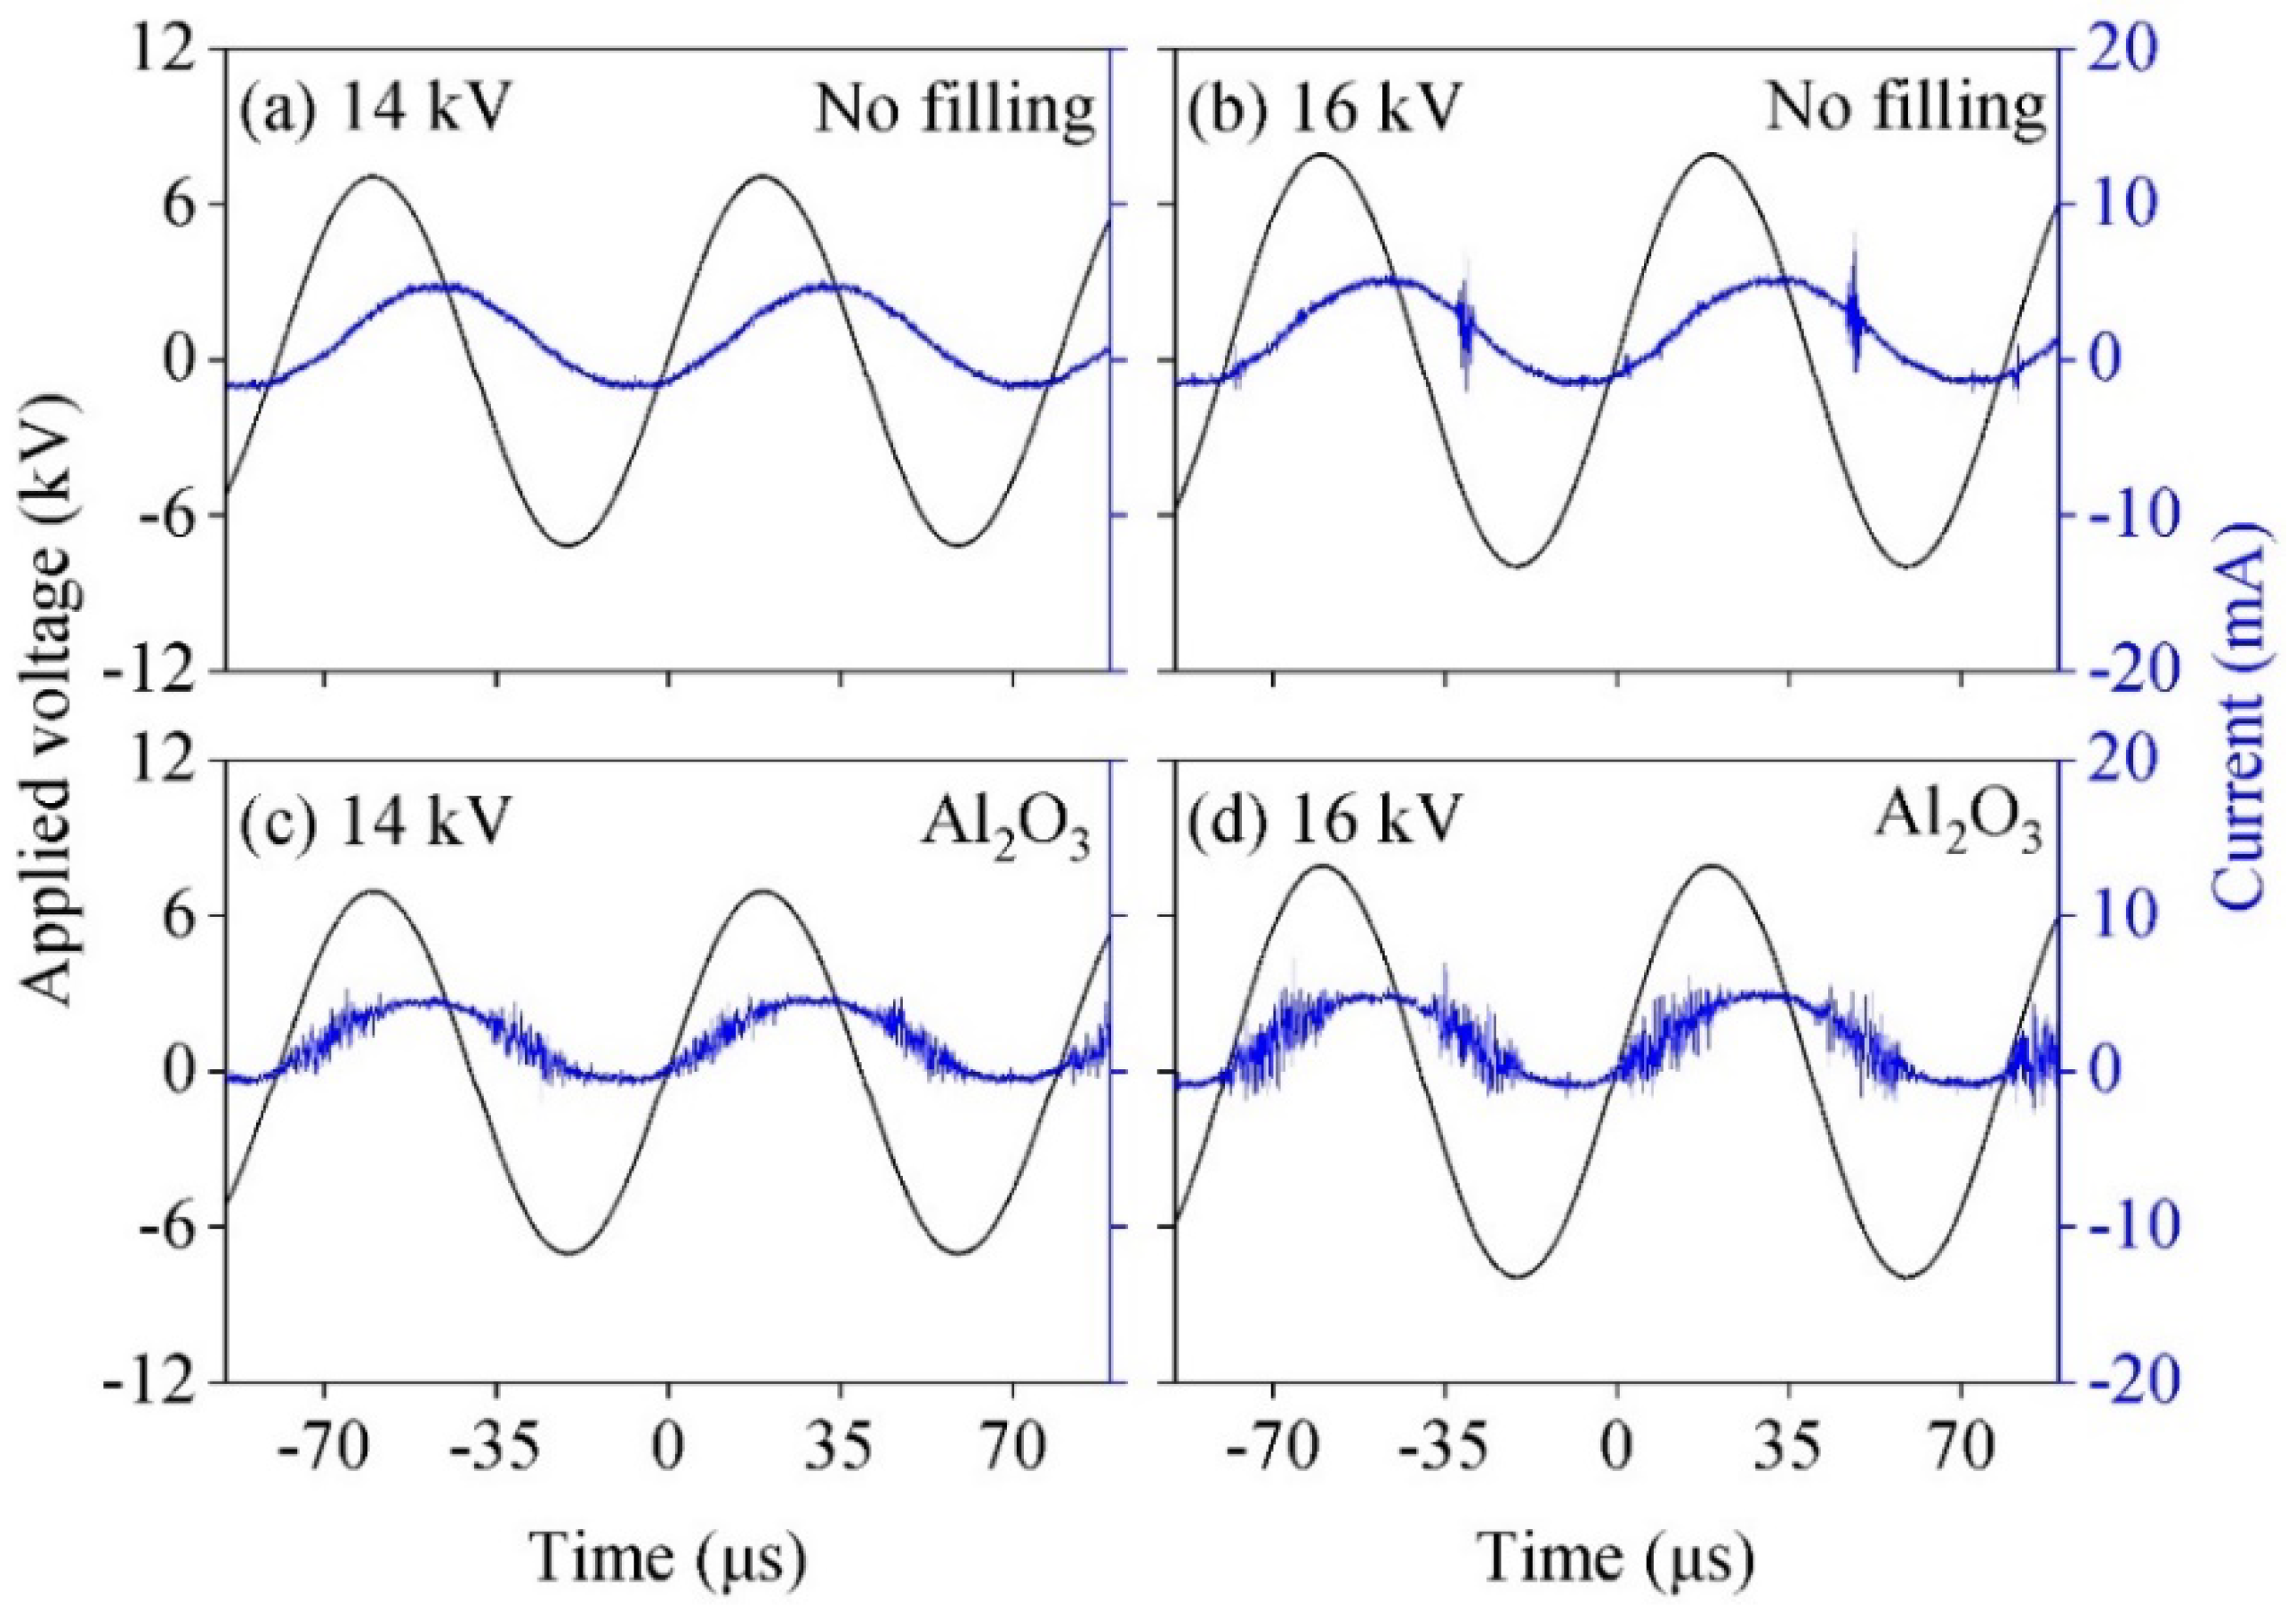
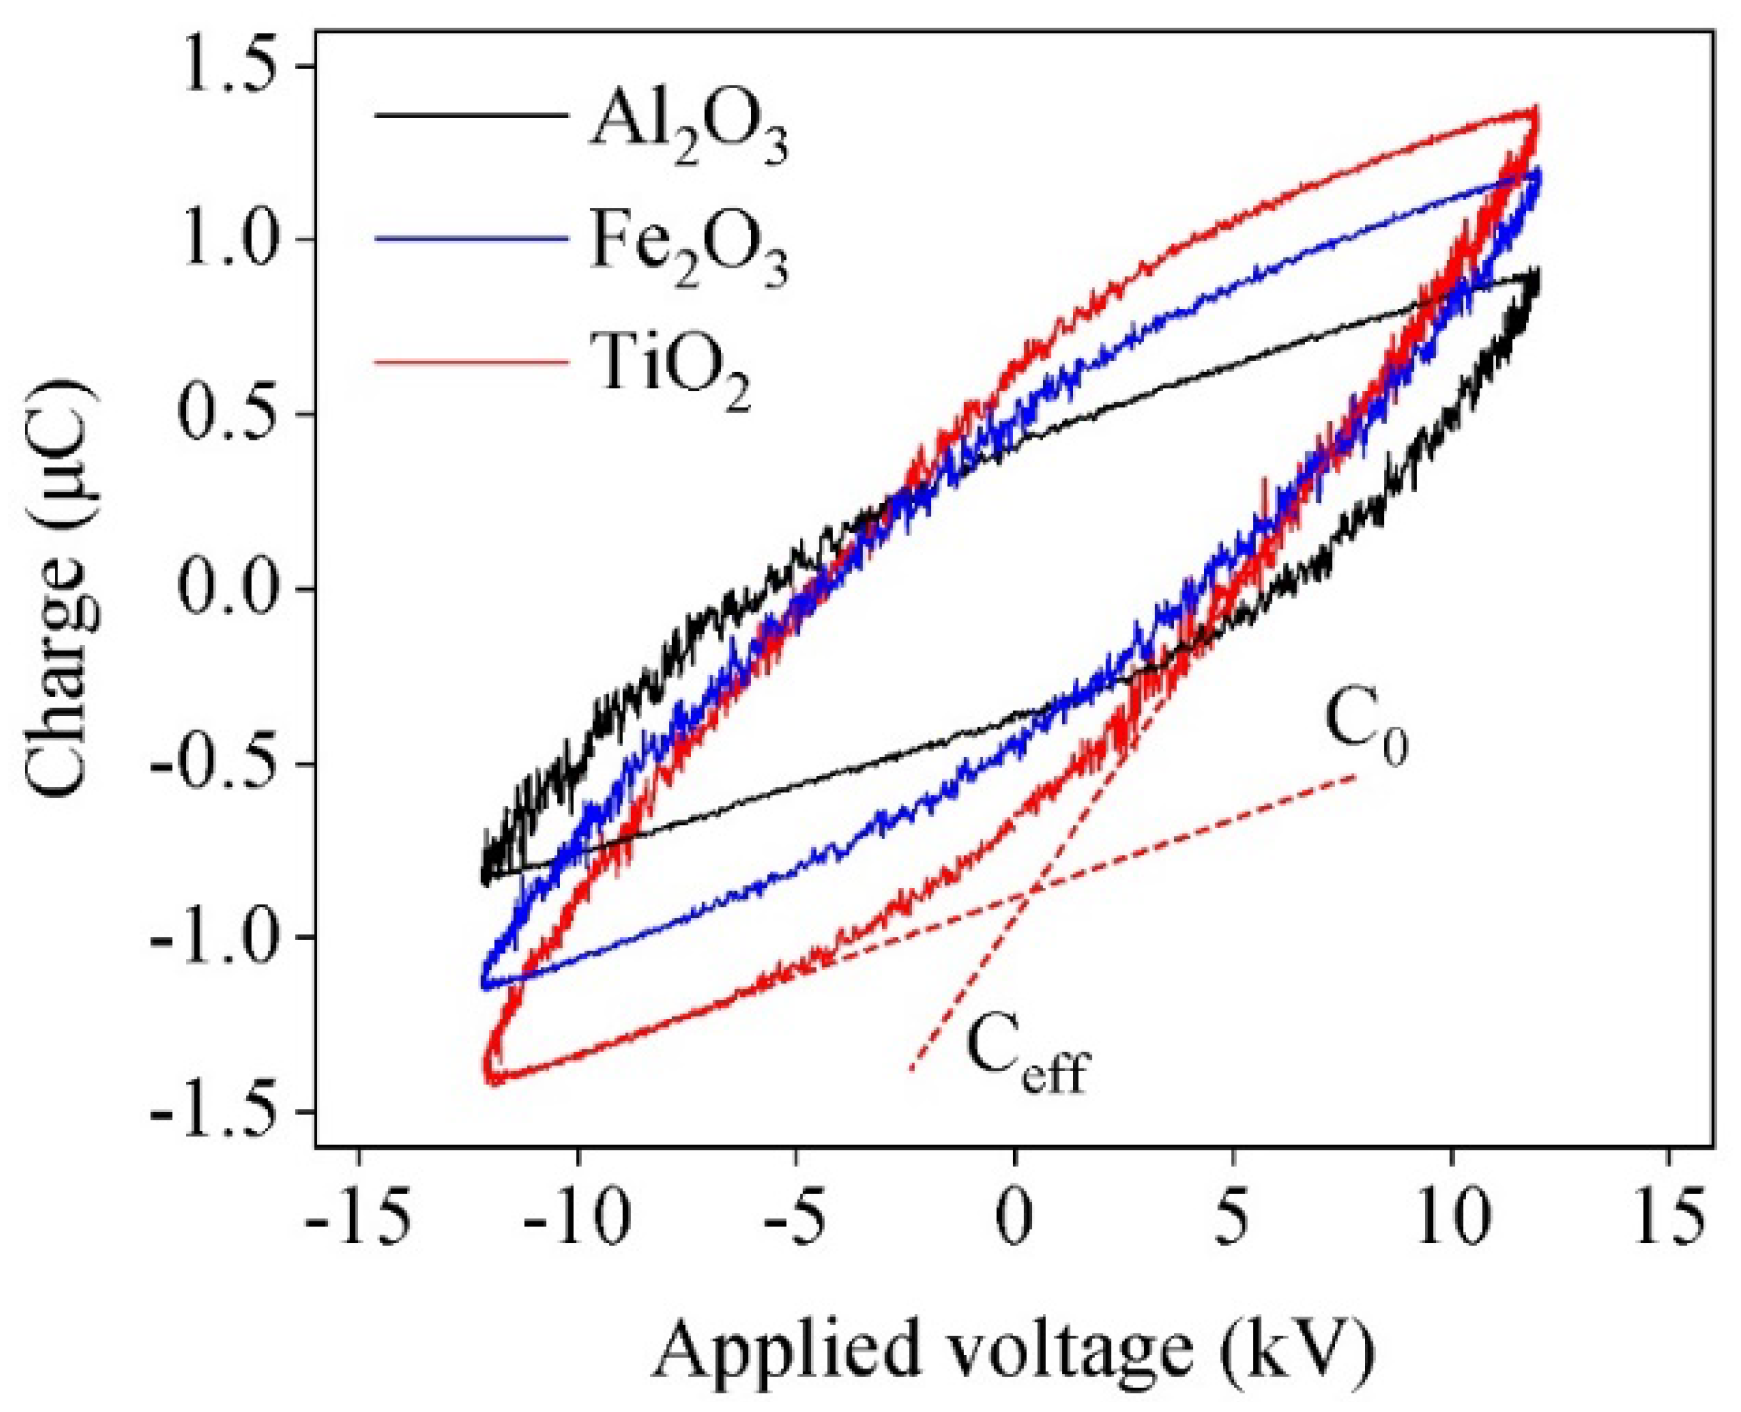
3.1. Discharge Characteristics

Figure 2 plots the voltage and current waveforms of the DBD reactor without a catalyst and filled with an Al2O3 catalyst. The driving frequency was fixed at 12.6 kHz. As shown in Figure 2, the discharge current filaments without a catalyst at 14 kV are almost invisible because the gas was not broken down in the plasma discharge region (Figure 2a). In comparison, the gas was broken down in the discharge gap, and the discharge current filaments can be clearly observed in the DBD reactor filled with Al2O3 at 14 kV (Figure 2c). This phenomenon shows that the addition of catalysts can decrease the breakdown voltage in the discharge gap. Furthermore, the discharge current filaments and uniformity apparently increased with the introduction of the catalyst at 16 kV (Figure 2b,d). These results occurred because Al2O3 has a higher dielectric constant than gas, and the introduction of the catalyst reduces the discharge gap of gas [28]. As such, an intense electric field is created in the areas of the contact points among the catalyst pellets, which decreases the breakdown voltage of the discharge gap and increases the number of micro-discharges [29]. As previously mentioned, the filling materials play a vital role in DBD. It is necessary to explore the influence of filling materials in plasma technology experiments.
Figure 2c,d shows that the number of micro-discharges and the amplitude of the current pulse increased with the increase in the applied voltage. The maximum amplitude of the current pulse increased from 5 to 7 mA. The main discharge patterns in the DBD reactor filled with Al2O3 are those of current filament discharge and surface discharge [30]. Many current pulses are generated per half-cycle of the applied voltage in the same periodicity, and the number of current pulses in the positive cycle is nearly equal to that in the negative cycle [31,32].
An additional capacitor providing much greater capacitance that that of the DBD reactor was used in series with the discharge circuit to accumulate the total charge during one AC half-cycle; its voltage can be plotted versus the discharge voltage in the Lissajous figure [31,33]. As shown in Figure 3, the closed curve area corresponds to the energy Ek consumed per cycle of the operating voltage [33,34]. Moreover, at the same input voltage, the Lissajous figure of the packing TiO2 has a larger area than the other catalysts, which means that TiO2 can further enhance the discharge power. From the slopes of the graph, it can be concluded that the TiO2 catalyst has greater effective capacitance Ceff [35]; that is, the TiO2 catalyst has a stronger charge-transfer ability than the other two metallic oxides.

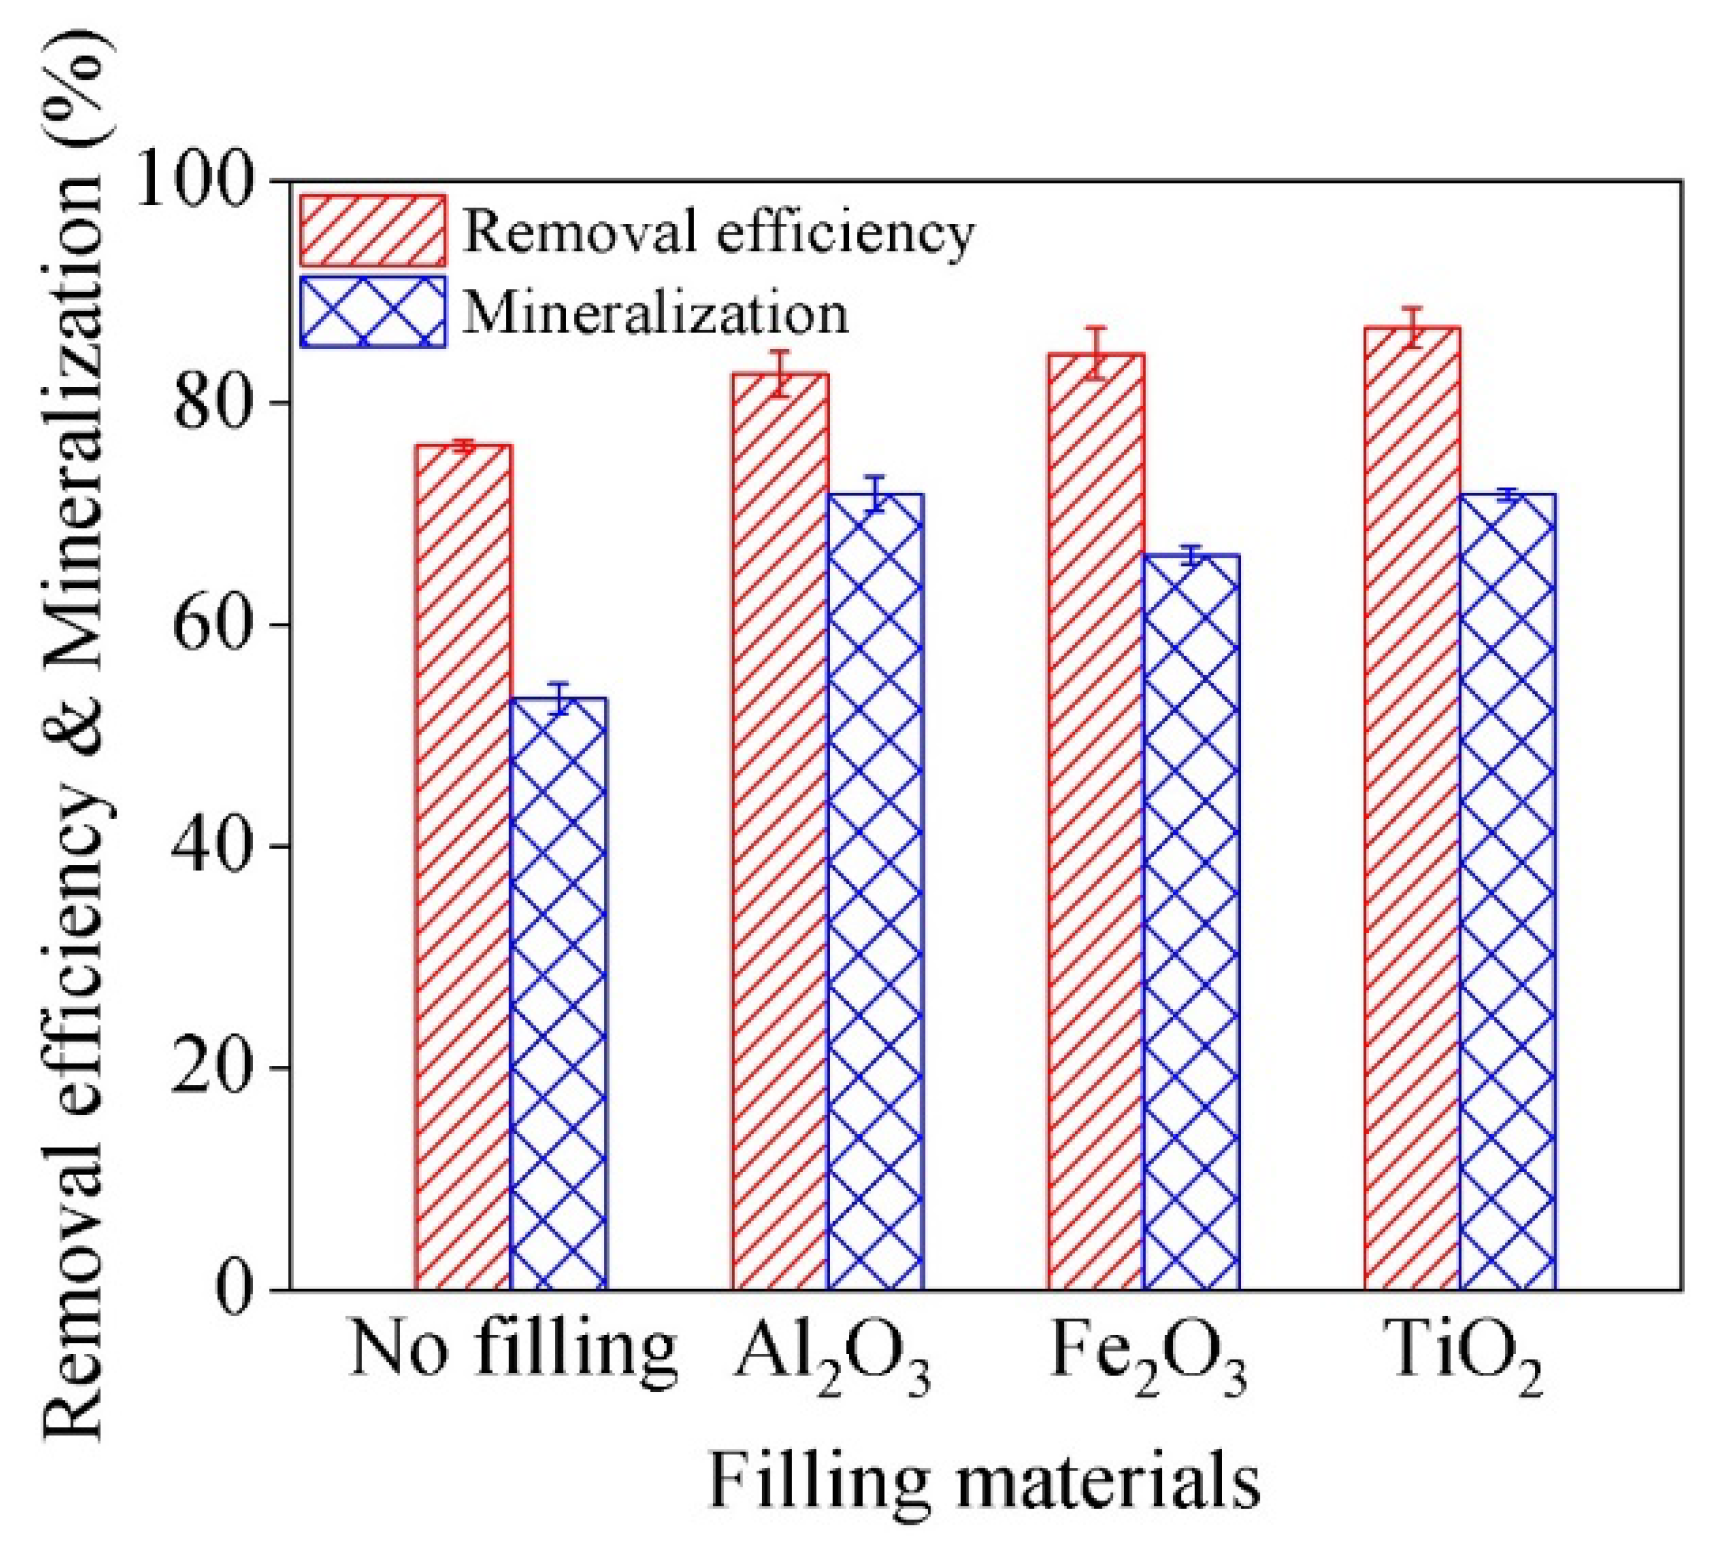
3.2. The Influence of Different Filling Materials on Naphthalene Decomposition

The removal efficiency and the mineralization of naphthalene under different filling materials are presented in Figure 4. It can be seen that the removal efficiency and the mineralization of naphthalene in the DBD reactor filled with Al2O3, Fe2O3, and TiO2 are higher than those without filling materials. When the applied voltage was 24 kV, the removal efficiency and the mineralization of naphthalene in the DBD reactor without filling materials were 76.1% and 53.4%, respectively. At an applied voltage of 24 kV, the removal efficiency of naphthalene in the DBD reactor filled with Al2O3, Fe2O3, and TiO2 was 82.6%, 84.5%, and 86.8%, respectively, and the mineralization of naphthalene in the DBD reactor filled with Al2O3, Fe2O3, and TiO2 was 71.8%, 66.3%, and 71.7% at 24 kV, respectively. This is because adding catalysts can increase the electric field intensity in the discharge gap via the discharge characteristics discussed in the former section [29], and promote the formation of more reactive oxygenated radicals [36]. In addition, the catalysts affect the removal efficiency and mineralization of naphthalene due to the different catalytic activity [36,37].
It is worth noting that carbon oxides and other by-products are produced during the degradation of naphthalene by plasma. It is difficult to analyze these by-products due to their complex composition [4,38]. The mineralization of pollutants reflects the proportion of by-products formed. The degree of mineralization is higher, which means fewer by-products are produced [39]. It is necessary to study the mineralization in pollutant decomposition.

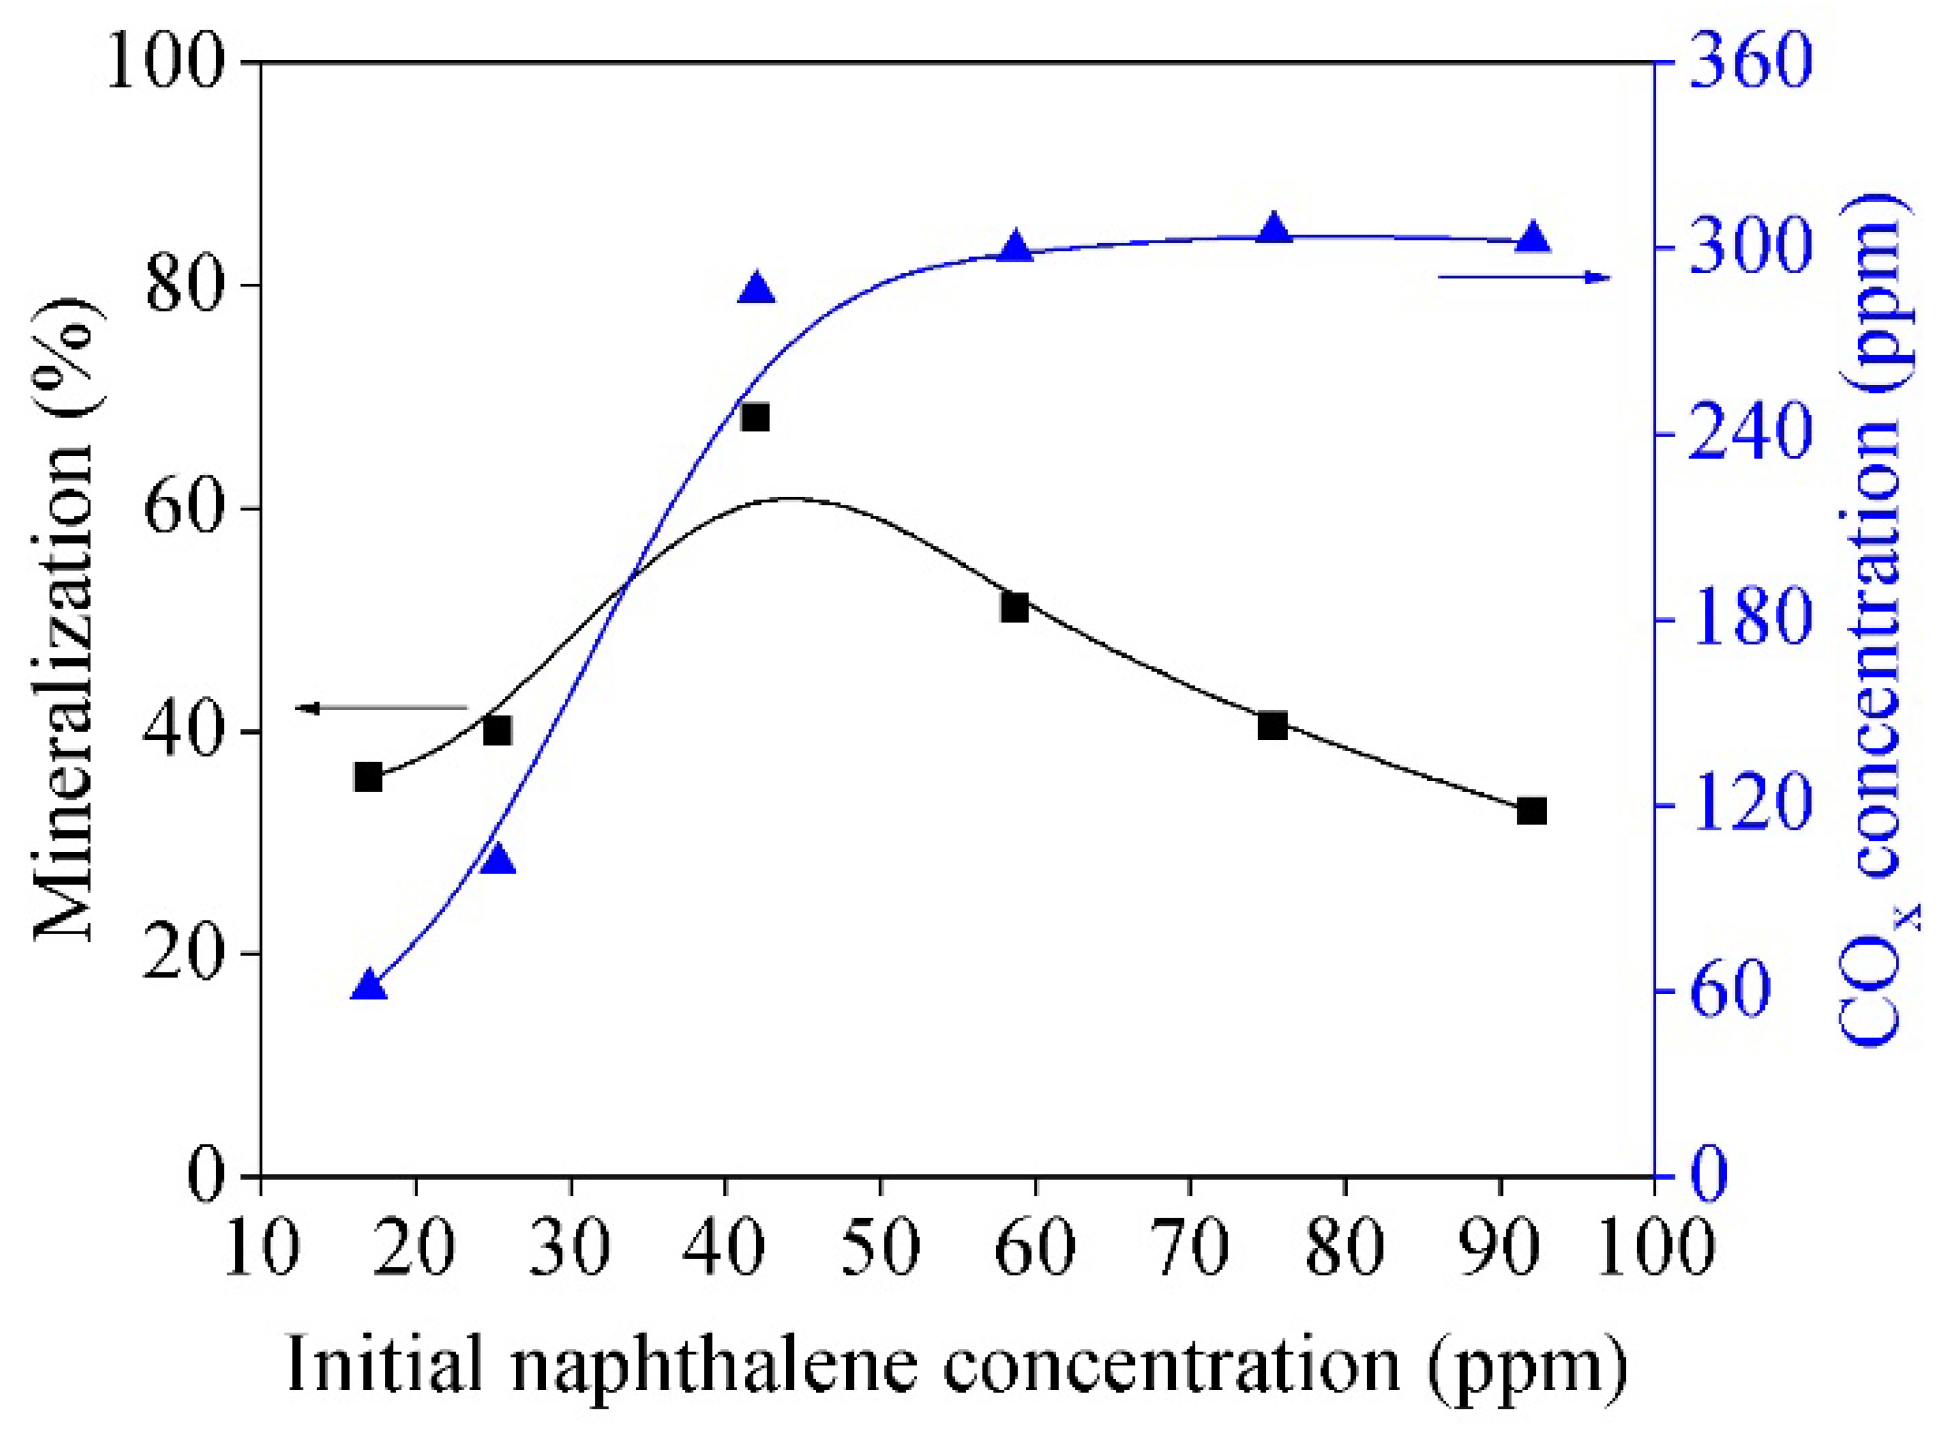
3.3. The Influence of Initial Naphthalene Concentration on Mineralization

Figure 5 shows the effect of initial naphthalene concentration (Ci) on the mineralization and COx concentration in the DBD reactor filled with Al2O3 at 55 W. The mineralization increased from 35.8% to 68.1% and the COx concentration increased from 60 to 286 ppm when Ci rose from 17 to 42 ppm. It is worth mentioning that, although the concentration of COx produced remained stable, the mineralization decreased with increasing Ci at higher Ci (Ci > 42 ppm). The mineralization decreased from 68.1% to 32.8% when Ci increased from 42 to 92 ppm. These results indicate that the increase in the number of naphthalene molecules per unit time is conducive to the oxidation of naphthalene within a suitable Ci range [40], which increases mineralization and COx concentration, while the naphthalene decomposition reaction competes with the oxidation of intermediate products. The oxidation of intermediate products is inhibited at higher Ci; thus, the COx concentration no longer increases and the mineralization decreases as Ci increases further [41]. As previously mentioned, the concentration of naphthalene plays a vital role in carbon oxide formation and the deep oxidation of naphthalene. The oxidation reaction of naphthalene (C10H8) is as follows [4]:
C10H8 + A* → Intermediate products
Intermediate products + A* → CO + CO2
where A* is an active species, which can be an O atom or/and •OH.

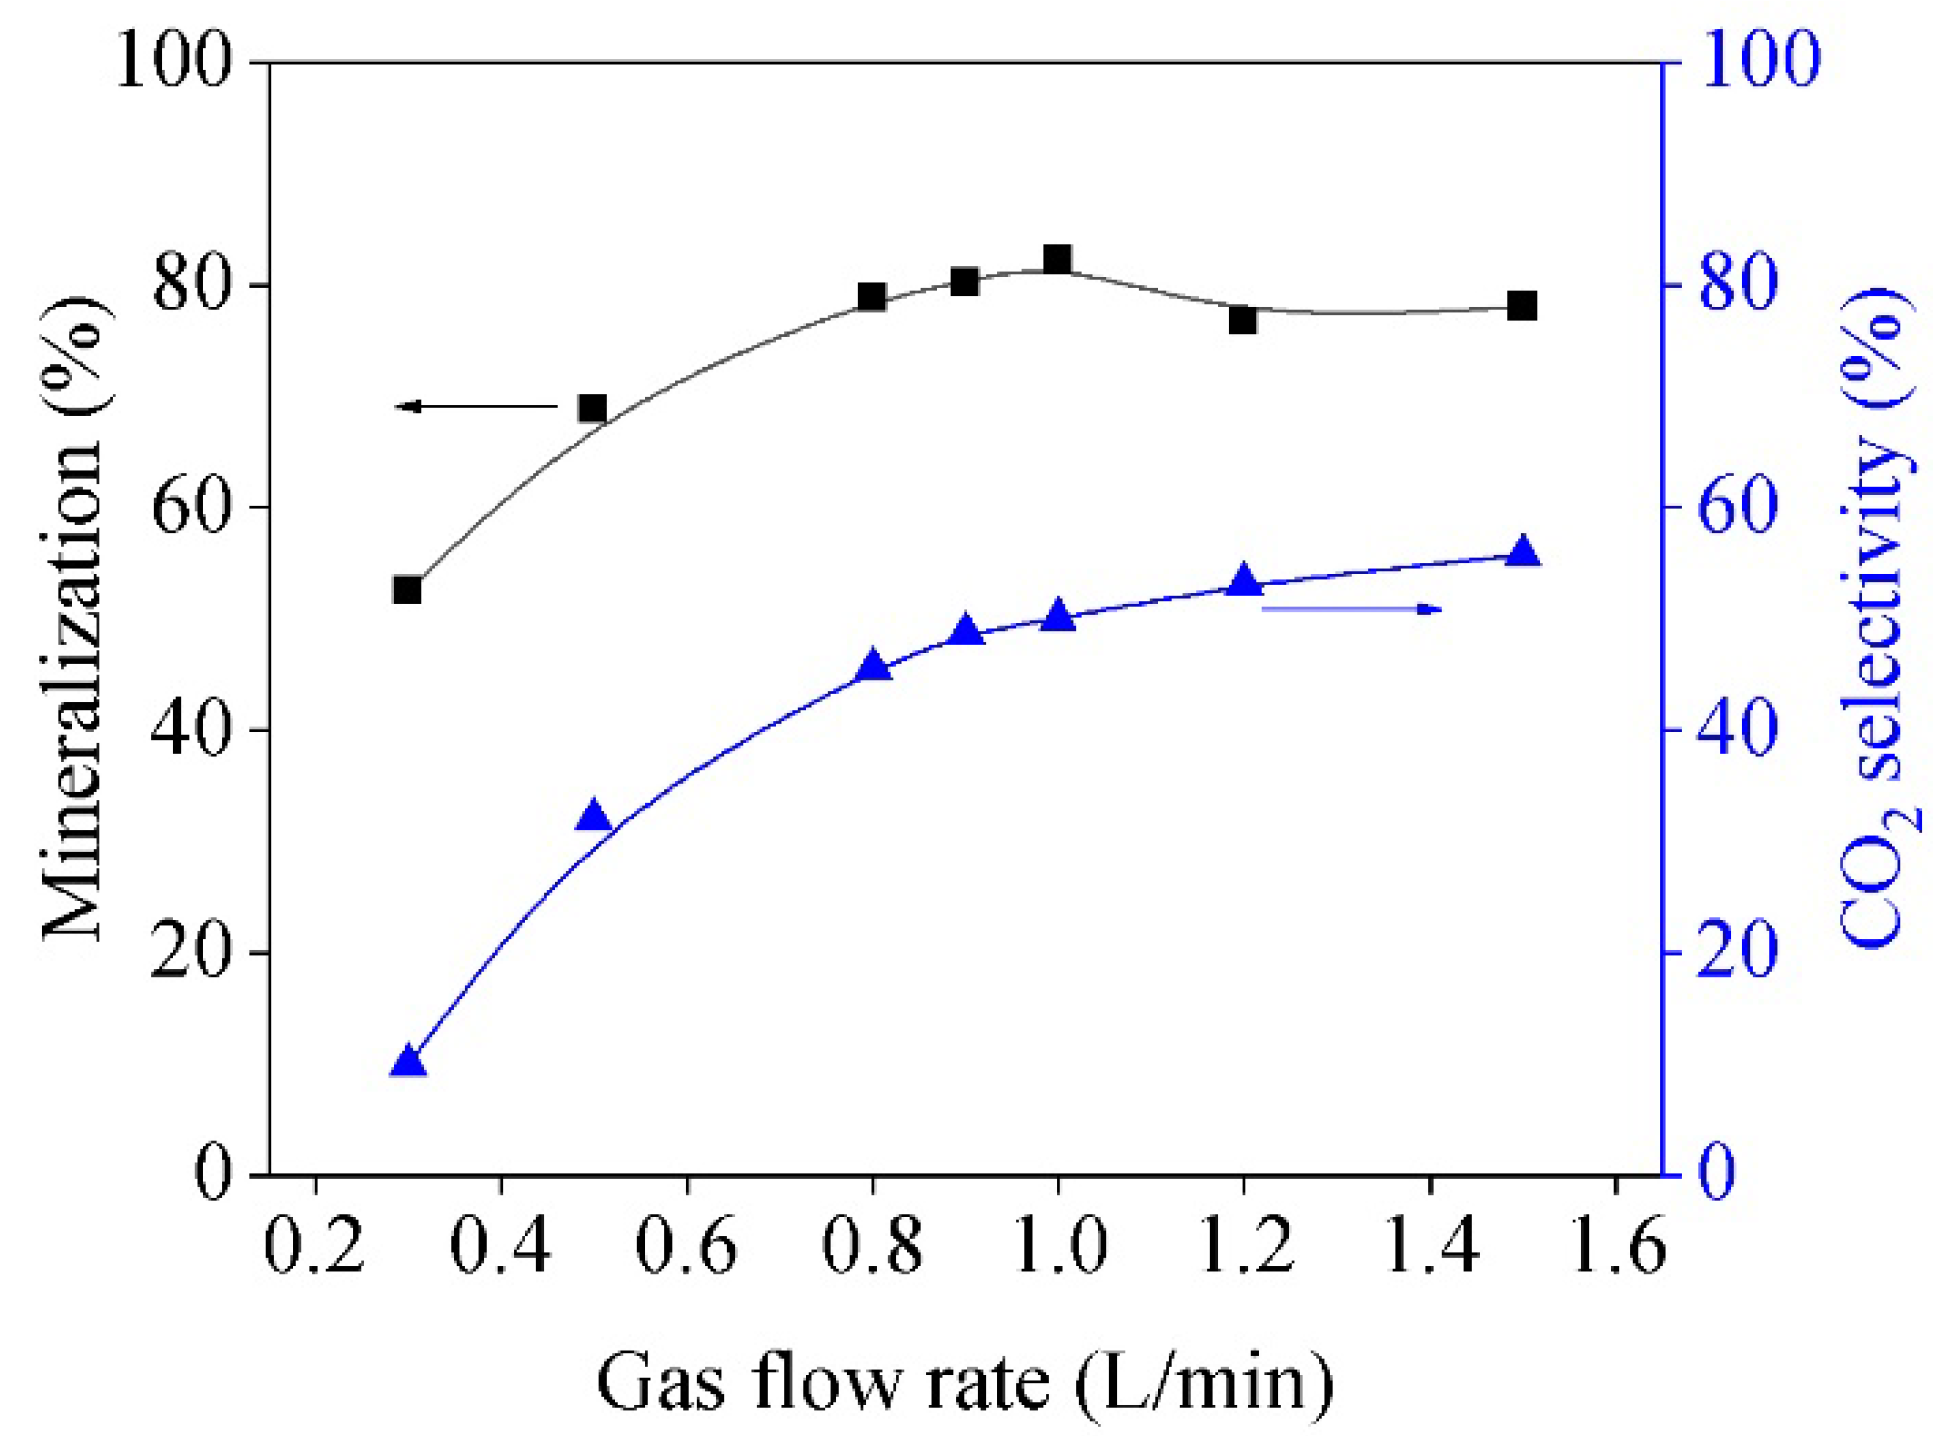
3.4. The Influence of Flow Rate on Mineralization and CO2 Selectivity

The influence of the total gas flow rate on the mineralization and CO2 selectivity in a DBD plasma reactor having a discharge power of 55 W is depicted in Figure 6. The flow rate of the naphthalene carrying gas was fixed at 200 mL/min, and the total gas flow rate of the reactor was changed by adjusting the flow rate of the other gas paths. Figure 6 illustrates that the total gas flow rate significantly affects the formation of carbon oxides during naphthalene decomposition, as evidenced by increasing mineralization from 51.6% to 82.2% when the total gas flow rate increased from 0.2 to 1.0 L/min [35]. However, the mineralization no longer significantly changed when the feeding gas was further increased. These results indicate that the total gas flow rate of 1.0 L/min is an optimum condition for the generation of carbon oxides in the DBD system. The mineralization of naphthalene reached 82.2% when the naphthalene carrying gas flow rate was 200 mL/min (Ci = 21 ppm) and the total gas flow rate was 1 L/min in the DBD reactor filled with Al2O3. The gas penetration increased as the total gas flow rate increased; as a result, the gas has greater contact with the surface of the filling materials and the oxidation of naphthalene is greater [40]. This was also confirmed by the rise in CO2 selectivity as the total gas flow rate increased, as shown in Figure 6. However, the gas was fully in contact with the filling materials when the gas flow rate increased to 1 L/min, and the contact area between the gas and the filling materials did not change with the further increase in the total gas flow rate. Thus, the oxidation of naphthalene was no longer significantly changed, and the mineralization tended to be relatively stable.

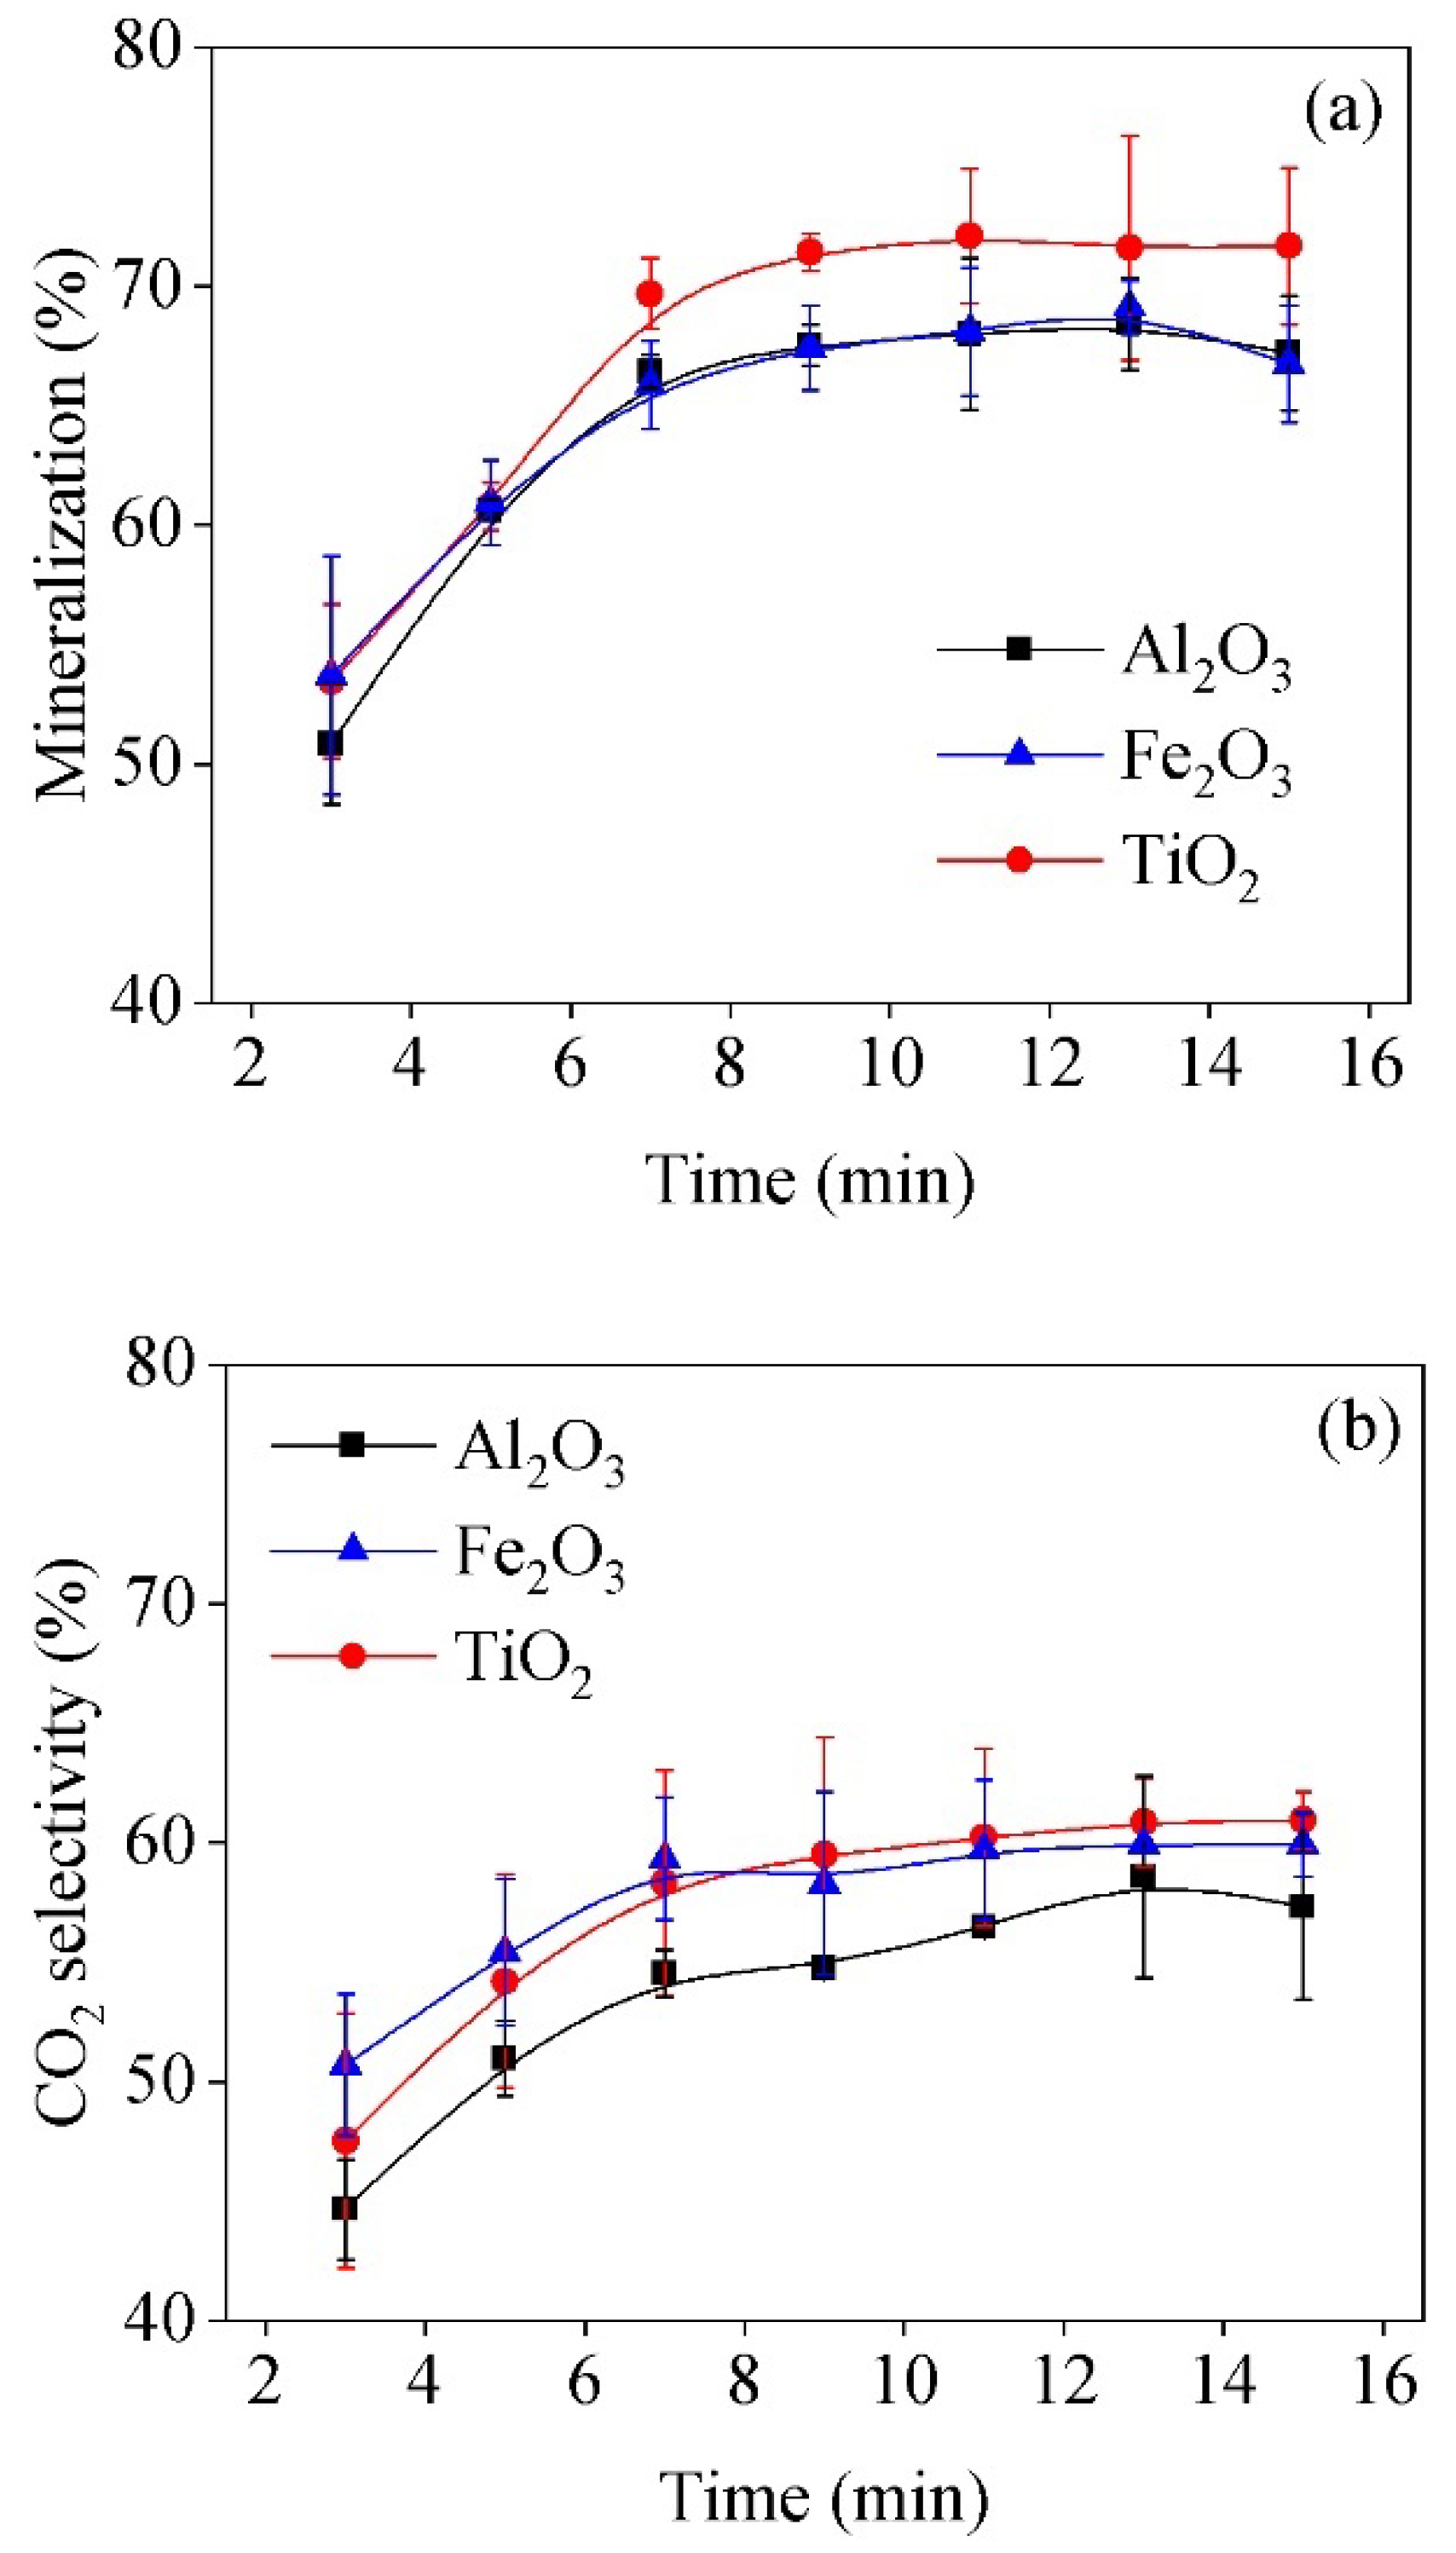
3.5. The Influence of Discharge Time on Mineralization and CO2 Selectivity

Figure 7 shows the mineralization and CO2 selectivity under different filling materials in the DBD reactor having a discharge power of 55 W. The mineralization and CO2 first increases, and then stabilized with time. This is because some carbonaceous by-products were attached to the catalyst and enriched in the process of naphthalene decomposition; this increases the probability of collisions with the carbonaceous by-products and the oxidation with active species [42]. Furthermore, as the discharge time increases, the high-energy particles produced by plasma continuously bombard the catalyst, enhancing the desorption of the carbonaceous by-products on the catalyst. The reaction eventually achieves dynamic equilibrium through the continuous cycle of adsorption and desorption on the catalyst surface [43].
As shown in Figure 7a, the mineralization in the DBD reactor filled with Fe2O3 was almost the same as that filled with Al2O3, and both were lower than that of the DBD reactor filled with TiO2. However, the CO2 selectivity of the DBD reactor filled with Fe2O3 and TiO2 was better than that of the DBD reactor filled with Al2O3 (Figure 7b). These results indicate that Fe2O3 and TiO2 have a better oxidation performance during the reaction than Al2O3. In addition, TiO2 shows more apparent advantages in carbon oxide formation than the other catalysts. This may be due to the fact that TiO2 is a photocatalyst, and can therefore use the ultraviolet light generated by the discharge to generate electron–hole pairs that promote the production of various strong active species, such as •OH and •HO2 [44]. Thus, the decomposition of naphthalene can be promoted. The active species can be produced via the following reactions (see (R3)–(R9)) [44,45]. These findings indicate that the catalytic performance of filling materials plays a vital role in carbon oxide formation.
TiO2 + hv → e + h+
h+ + H2O → OH + H+
h+ + OH → •OH
e + O2 → O2
O2 + H+ → •HO2
HO2 + H+ + e → •H2O2
H2O2 + e → •OH + OH

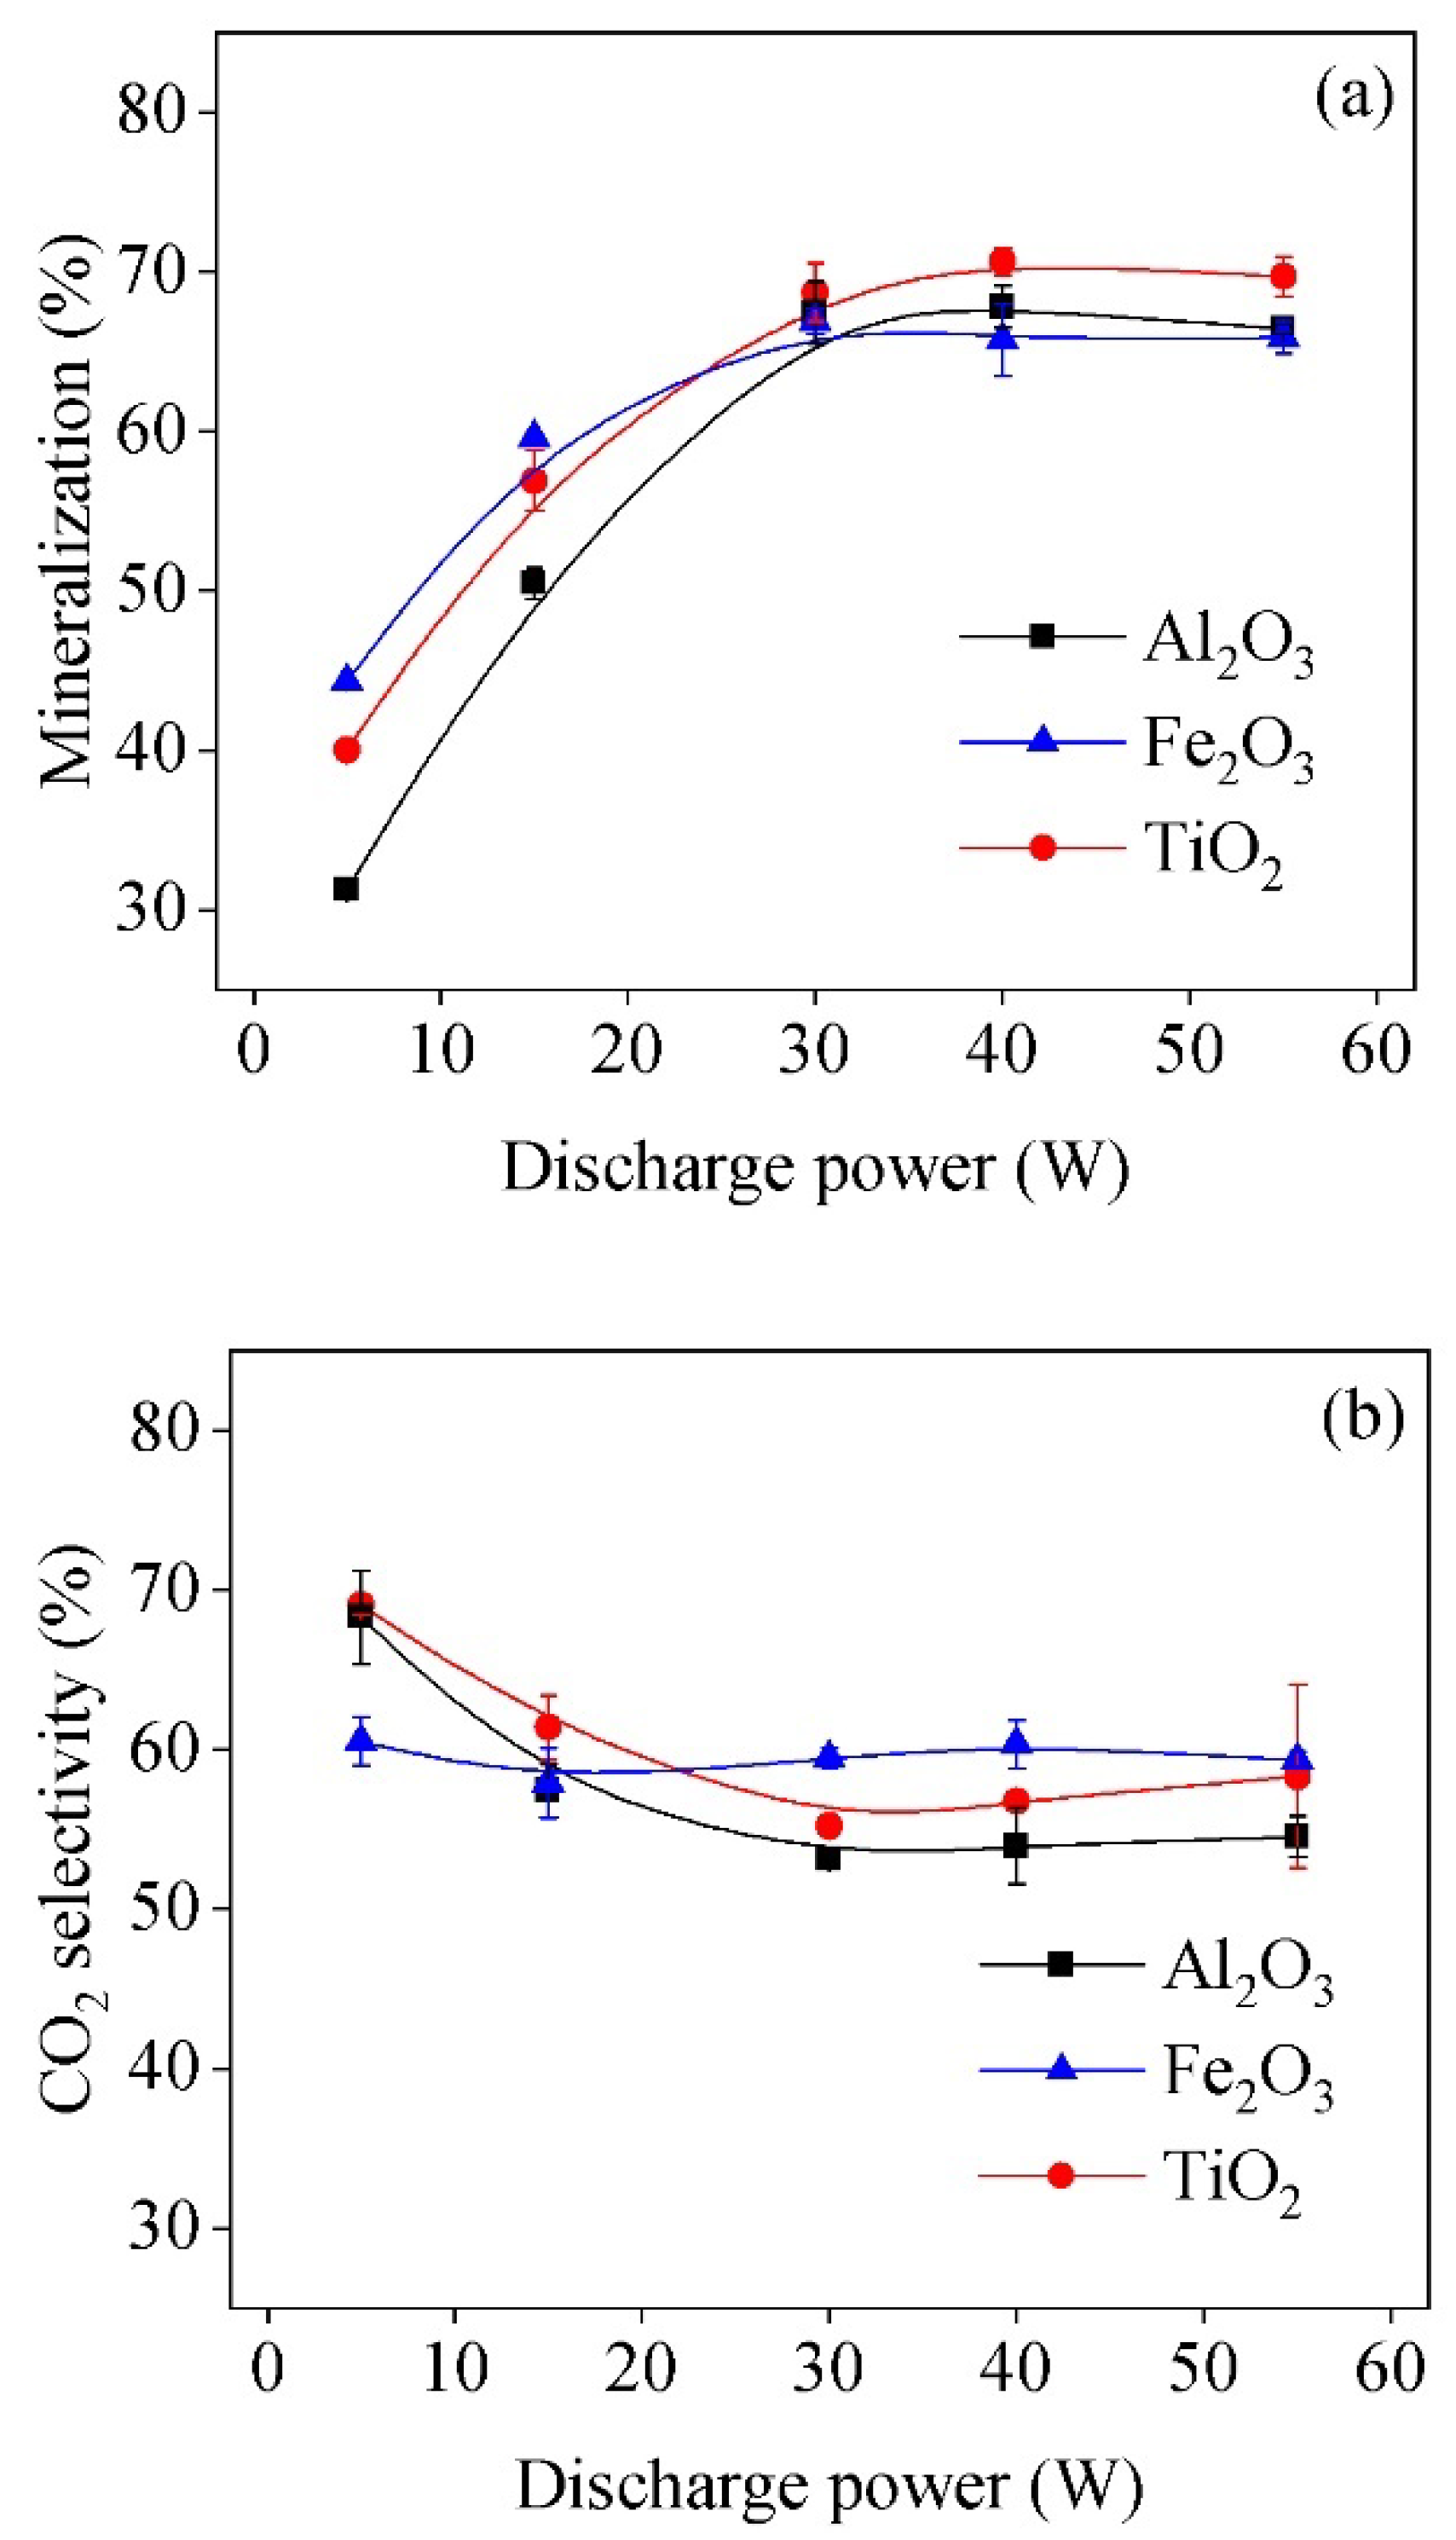
3.6. The Influence of Discharge Power on Mineralization and CO2 Selectivity

The formation of the active species is closely related to the discharge power, which is an important electrical parameter [46]. The mineralization and CO2 selectivity under three different catalysts at the treatment time of 7 min are displayed in Figure 8. It can be seen that the mineralization increased with increasing discharge power when the discharge power was not higher than 30 W under the three different catalysts. The electron energy increases with an increase in the discharge power, which increases the number of active species [40] and promotes collisions between active particles and background gas molecules in the discharge zone [38]. Thus, the oxidation of naphthalene is enhanced. Furthermore, the mineralization in the DBD reactor filled with Fe2O3 was the highest. As a p-type multivalent metal oxide, the Fe2O3 catalyst is expected to have high activity due to its highly mobile chemisorbed oxygen [47].
However, when the discharge power was not higher than 30 W, the CO2 selectivity decreased with the increase in discharge power in the DBD reactors filled with TiO2 and Al2O3 (Figure 8b). The increase in energy input intensifies the bombardment of the catalyst by the active particles, which results in further desorption of intermediate products on the catalyst [38]. Thus, the number of intermediate products increases in the reaction region, which reduces the number of active substances available for CO2 production and the selectivity of CO2 [40]. In contrast, the CO2 selectivity changed little in the DBD reactor filled with Fe2O3 (Figure 8b). This is because the Fe2O3 catalyst has more catalytic activity, and thus has a strong oxidation capacity for naphthalene; this was also confirmed by the mineralization in the DBD reactor filled with Fe2O3. The discharge wire covered the surface of the electrode and the micro-discharge quantity did not increase significantly when the discharge power increased to a certain value [48]. At this time, the generation of carbon oxides tended to be stable.

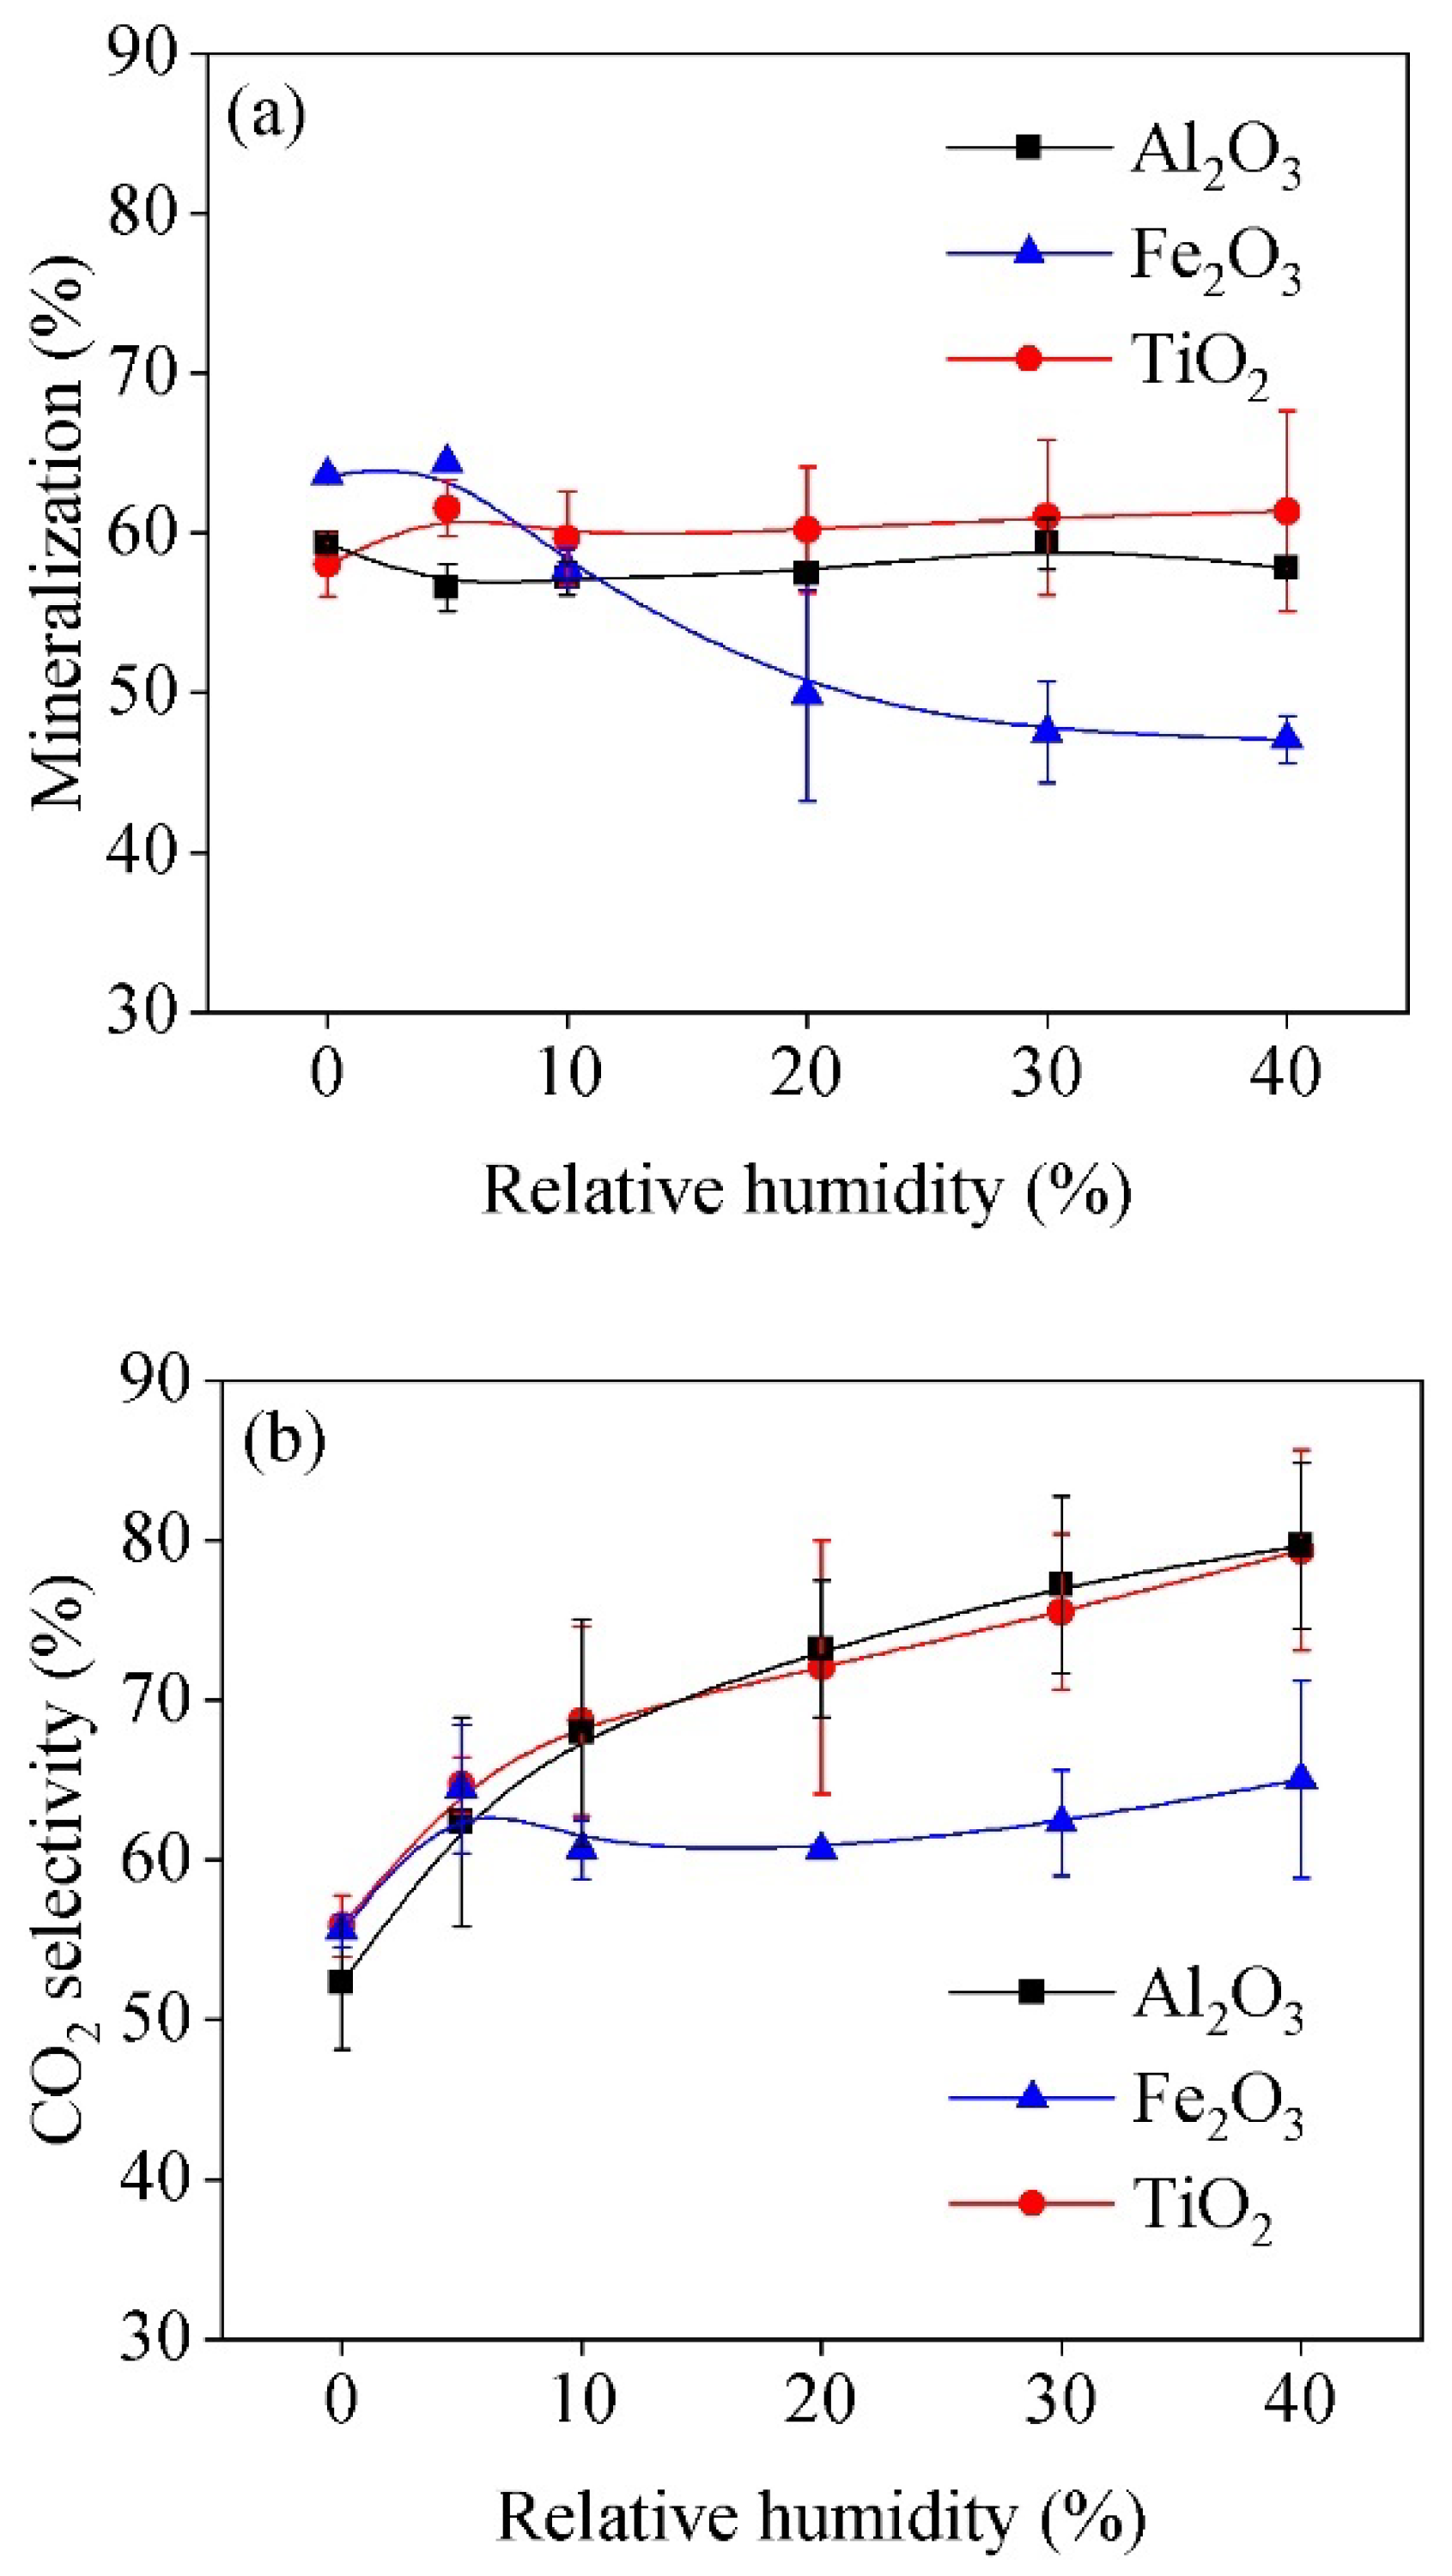
3.7. The Influence of Relative Humidity on Mineralization and CO2 Selectivity

Figure 9 shows the mineralization and CO2 selectivity as a function of RH at a discharge power of 55 W and an initial naphthalene concentration of 28 ppm. The mineralization slightly increased when RH ≤ 5% but decreased with the further increase in RH in the DBD reactor filled with Fe2O3 (Figure 9). The injection of a small amount of water vapor provides a large amount of •OH for improving naphthalene oxidation [49]. However, undissociated water molecules adhere to the catalyst as RH continues to increase, resulting in a decrease in the number of active sites for naphthalene oxidation and a drop in the formation of carbon oxides [50]. This can be illustrated by the change in CO2 selectivity in the DBD reactor filled with Fe2O3, as shown in Figure 9b. Although RH had little influence on mineralization, which remained at about 57.9%, the introduction of water vapor promoted the oxidation of CO so that the CO2 selectivity increased in the DBD reactor filled with Al2O3.
It is worth noting that the addition of steam increased the mineralization and the increase was most obvious when RH was 5% in the DBD reactor filled with TiO2. Compared with the DBD reactor filled with Al2O3, the mineralization of naphthalene in the DBD reactor filled with TiO2 was higher and its CO2 selectivity was also slightly higher. These phenomena can be attributed to the injection of a small amount of water vapor, which provides a large amount of •OH for the reaction. The •OH can be produced via the following reactions [51,52]:
H2O + e → •H + •OH + e
O2 + e → O3(P) + O1(D) +e
O1(D) + H2O → 2•OH
The •OH is highly active in naphthalene decomposition, contributing to enhanced mineralization and CO2 selectivity. Furthermore, although the enhancement of RH causes undissociated water molecules to adhere to the catalyst, TiO2 is a photocatalyst that can effectively use the ultraviolet light generated by the discharge to generate electron–hole pairs [44]. The holes generate •OH with H2O, and the electrons also generate •OH with O2 [53], which promotes the decomposition of water and overcomes the adverse effects of water to a certain extent.

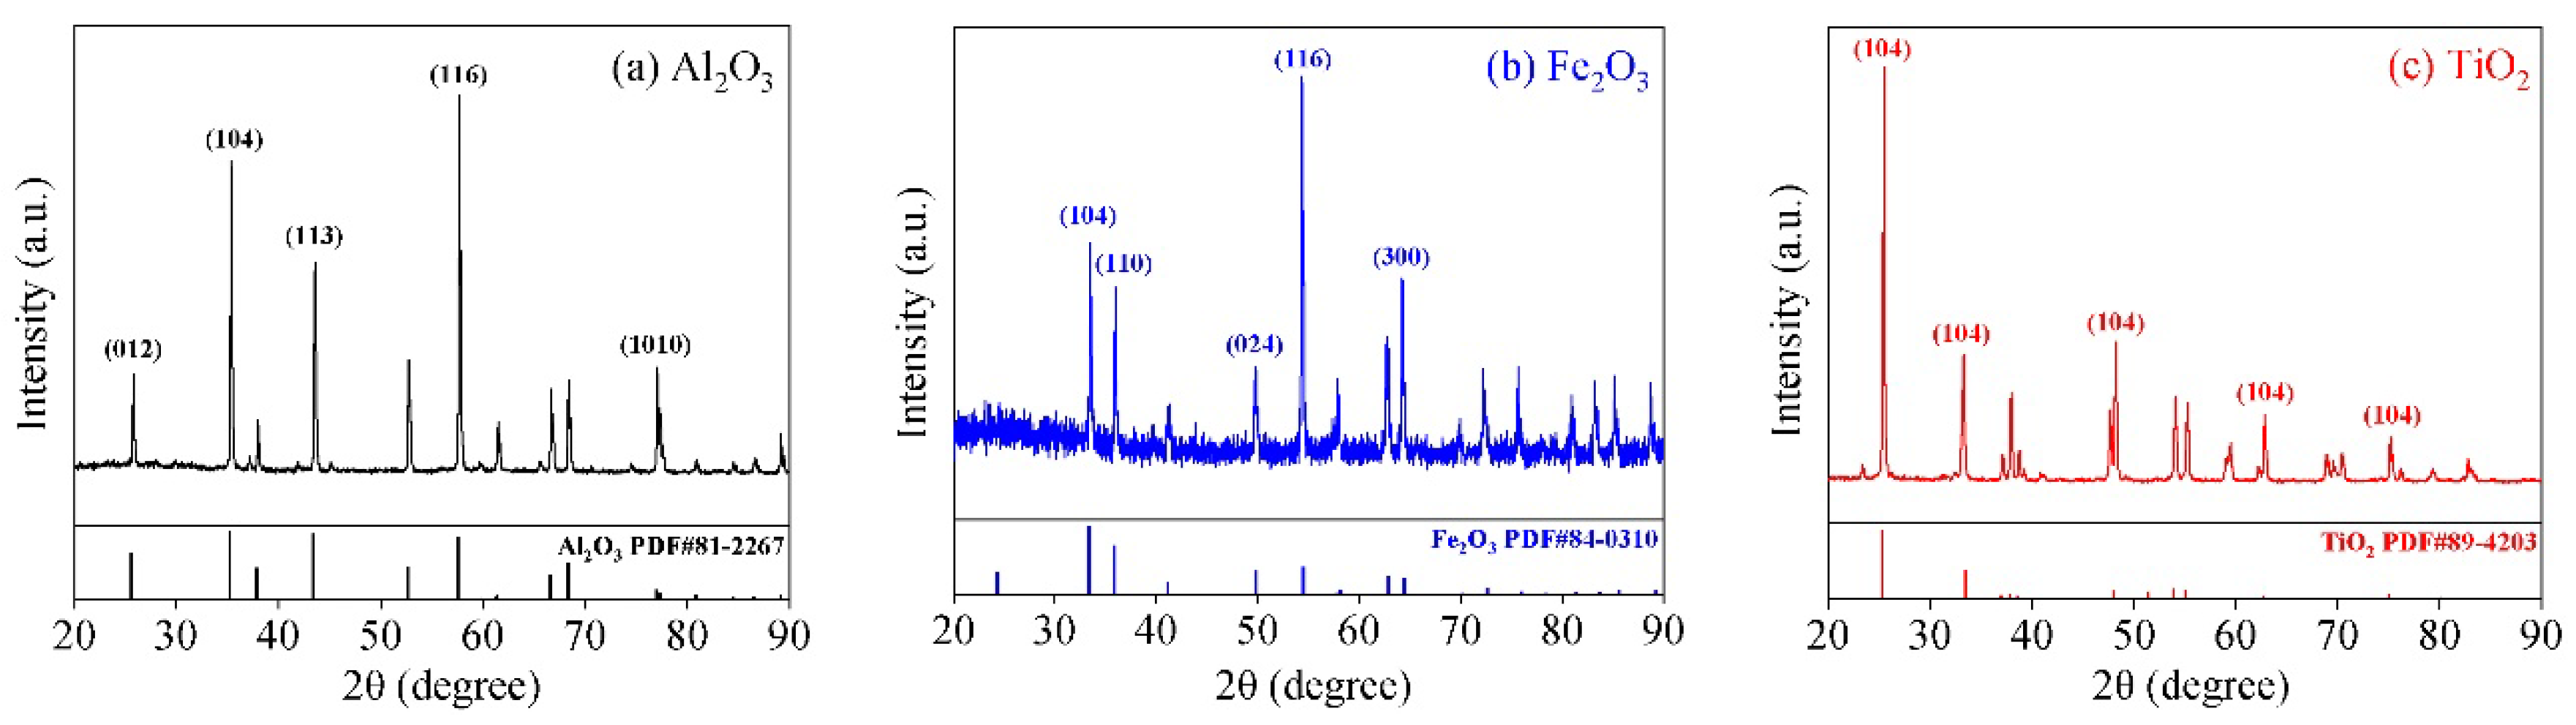
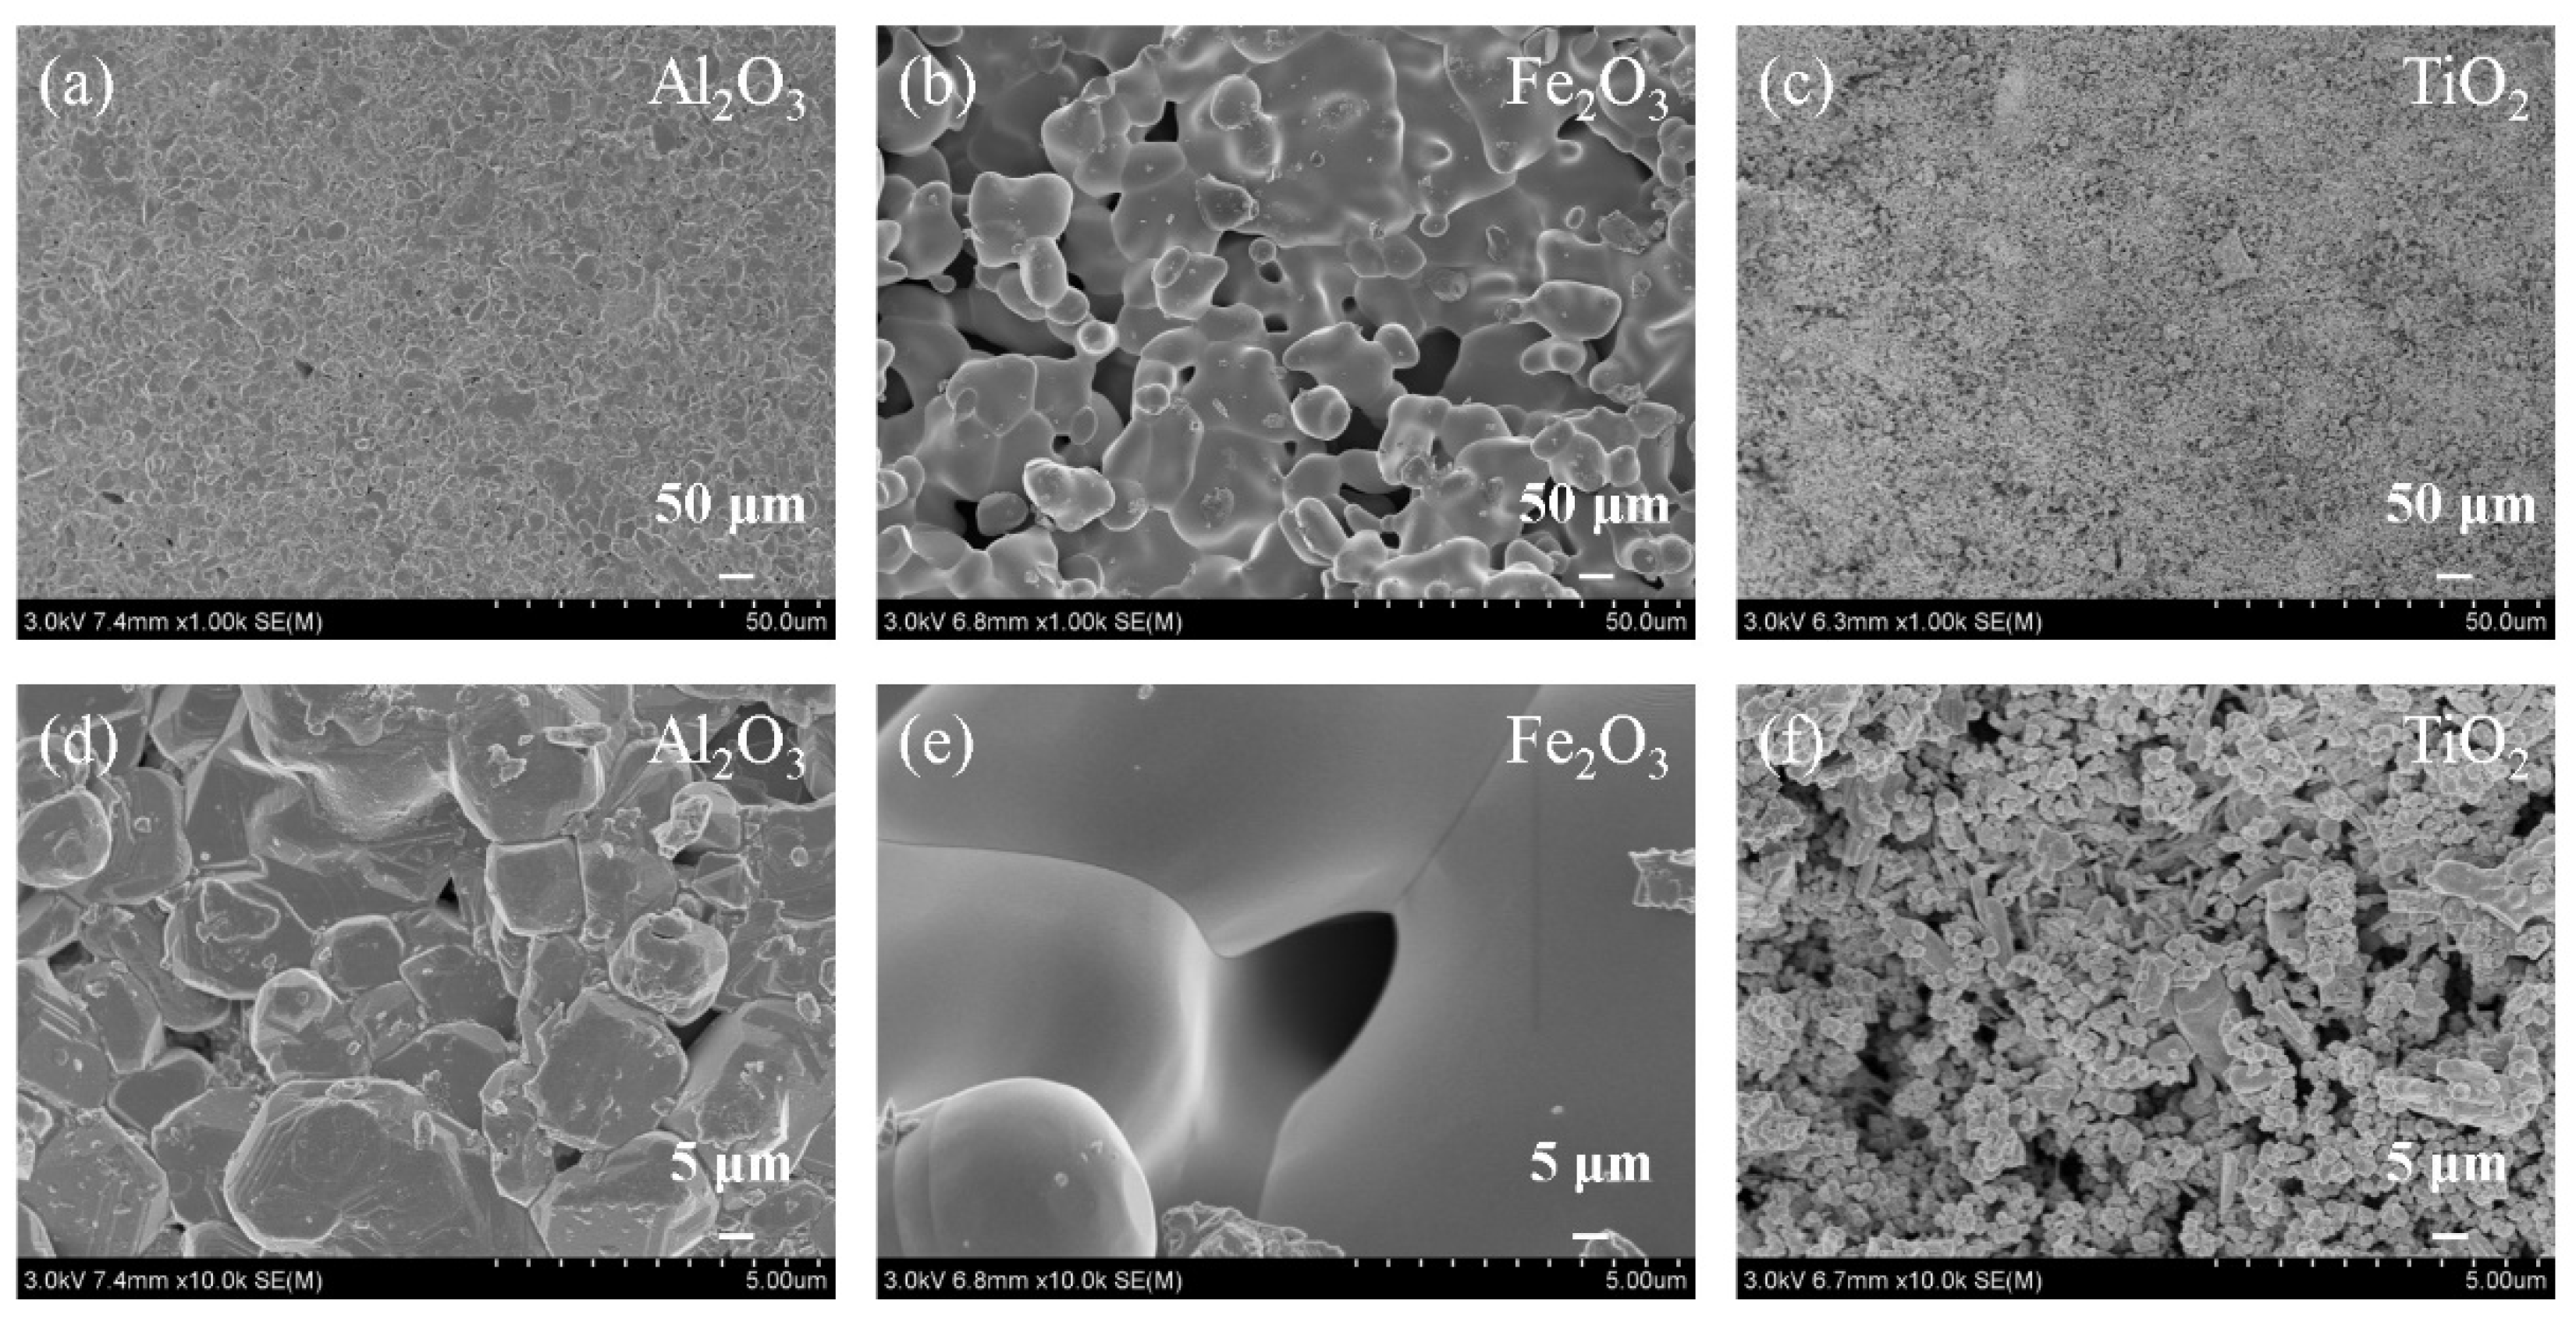
3.8. The Characterization of the Catalysts

The three transition metal oxides (Al2O3, Fe2O3, and TiO2) were examined by XRD analysis. As presented in Figure 10, diffraction peaks are compared with the Inorganic Crystal Structure Database (ICSD) data to obtain the crystal parameters of the sample surface [54]. The diffraction peaks of the Al2O3 catalyst can be observed at 2θ of 25.6°, 35.2°, 43.4°, 57.6°, and 76.9°, corresponding to the (012), (104), (113), (202), (116), and (1010) crystal facets. The peaks of the Fe2O3 catalyst at 33.4°, 35.8°, 49.8°, 54.5°, and 64.4° correspond to (104), (110), (024), (116), and (300) crystal planes. The Ti2O catalyst shows diffraction angles (25.3°, 33.5°, 48.0°, 62.7°, and 75.0°) which correlate to the (101), (110), (200), (204), and (215) crystal planes [55].
Table 1 shows BET data analysis of the three catalyst samples. The specific surface area, pore volume, and pore size of the catalysts are summarized in the table. The metal oxides having weak adsorption capacity are used for naphthalene degradation, which exclude the influence of naphthalene adsorption on the catalyst. Among these, Al2O3 and Fe2O3 have a similar specific surface area and different pore size, and Al2O3 and TiO2 have a similar pore size and different specific surface area. As can be seen from the table, Fe2O3 shows a smaller pore size than the other catalysts; thus, the Fe2O3 catalyst is more negatively affected because undissociated water molecules cover its surface, as shown when exploring the influence of RH (Figure 9a) [56]. In addition, TiO2 shows a higher specific surface area, pore volume, and pore size than the other catalysts; these characteristics are conducive to the exposure of the active sites, and promote the photocatalytic performance of the catalyst [55].
The surface morphology of the three samples was studied using SEM, as shown in Figure 11. The samples have micron-sized pores, as seen from the SEM images. The Al2O3 catalyst possesses a smooth surface and a structure having fewer pores, as shown in Figure 11a,d. The surface of the Fe2O3 catalyst has loose porosity, and its pores are large (Figure 11b,e). The TiO2 catalyst has a coarse surface and a finer porous structure than the other two catalysts (Figure 11c,f). The porous structure of the TiO2 catalyst is conducive to the exposure of the active sites, thus promoting the photocatalytic performance of the catalyst. The analysis of the catalysts’ specific surface area also confirms this viewpoint, as shown in Table 1. Thus, TiO2 shows more apparent advantages in terms of the decomposition and mineralization of naphthalene than the other two catalysts.

4. Conclusions

In this study, an AC power supply-excited packed-bed DBD in synthetic air was used to oxidate naphthalene. The results show that the filling materials, initial naphthalene concentration, gas flow rate, discharge power, treatment time, and RH all have certain effects on the decomposition of naphthalene and the generation of carbon oxides. The addition of filling materials reduces the breakdown voltage in the discharge gap and increases the number of micro-discharges. Furthermore, the catalytic performance of the filling materials plays a vital role in naphthalene decomposition. In general, TiO2 has more obvious advantages than the other two catalysts in terms of the reaction because of its photocatalytic properties and large specific surface area. The mineralization reached 82.2% at a discharge power of 55 W when Ci was 21 ppm and the total gas flow rate was 1 L/min in the DBD reactor filled with Al2O3.
As the treatment time increased, the reaction eventually achieved a dynamic equilibrium through the continuous cycle of adsorption and desorption on the catalyst surface in the discharge process. The discharge wire covered the electrode surface and the micro-discharge quantity did not increase significantly when the discharge power increased to a certain value. The effect of humidity on the discharge was related to the proportion of the introduced water vapor and the type of catalyst in the reactor. Fe2O3 had a positive effect on the naphthalene oxidation when the amount of water vapor was low, but a negative effect when the water vapor increased, due to its small pore size. The TiO2 catalyst can overcome the adverse effects of water molecule attachment due to its photocatalytic properties and porous structure.

Author Contributions

Conceptualization, D.C. and D.Y.; methodology, D.C., Y.L. (Yunhu Liu) and T.F.; software, J.L. and Y.L. (Yueyue Liu); validation, Z.Z. and X.C.; formal analysis, J.L. and Z.Z.; investigation, J.L.; resources, D.C. and D.Y.; data curation, D.C.; writing—original draft preparation, J.L.; writing—review and editing, D.C.; visualization, J.L.; supervision, D.C.; project administration, D.C.; funding acquisition, D.C. and D.Y. All authors have read and agreed to the published version of the manuscript.

Funding

This research was funded by the National Natural Science Foundation of China, grant number 51967017; the Science and Technology Plan Project of the Ninth Fund of Xinjiang Production and Construction, grant number 2021JS005, 2021JS003; the Fundamental Research Funds for the Central Universities, grant number RCZK2018C36.

Data Availability Statement

Not available.

Conflicts of Interest

The authors declare no conflict of interest.

References

  1. Zhang, X.; Yu, T.; Li, X.; Yao, J.; Liu, W.; Chang, S.; Chen, Y. The fate and enhanced removal of polycyclic aromatic hydrocarbons in wastewater and sludge treatment system: A review. Crit. Rev. Environ. Sci. Technol. 2019, 49, 1425–1475. [Google Scholar] [CrossRef]
  2. Qiao, X.; Zheng, B.; Li, X.; Zhao, X.; Dionysiou, D.D.; Liu, Y. Influencing factors and health risk assessment of polycyclic aromatic hydrocarbons in groundwater in China. J. Hazard. Mater. 2021, 402, 123419. [Google Scholar] [CrossRef]
  3. Santos, P.M.; Sánchez, M.d.N.; Pavón, J.L.P.; Cordero, B.M. Determination of polycyclic aromatic hydrocarbons in human biological samples: A critical review. TrAC-Trend. Anal. Chem. 2019, 113, 194–209. [Google Scholar] [CrossRef]
  4. Wu, Z.; Zhu, Z.; Hao, X.; Zhou, W.; Han, J.; Tang, X.; Yao, S.; Zhang, X. Enhanced oxidation of naphthalene using plasma activation of TiO2/diatomite catalyst. J. Hazard. Mater. 2018, 347, 48–57. [Google Scholar] [CrossRef]
  5. Mallah, M.A.; Changxing, L.; Mallah, M.A.; Noreen, S.; Liu, Y.; Saeed, M.; Xi, H.; Ahmed, B.; Feng, F.; Mirjat, A.A.; et al. Polycyclic aromatic hydrocarbon and its effects on human health: An overeview. Chemosphere 2022, 296, 133948. [Google Scholar] [CrossRef] [PubMed]
  6. Wu, Z.; Wang, J.; Han, J.; Yao, S.; Xu, S.; Martin, P. Naphthalene Decomposition by Dielectric Barrier Discharges at Atmospheric Pressure. IEEE Trans. Plasma Sci. 2017, 45, 154–161. [Google Scholar] [CrossRef]
  7. Wang, J.; Zhang, X.; Zhou, X.; Waigi, M.G.; Gudda, F.O.; Zhang, C.; Ling, W. Promoted oxidation of polycyclic aromatic hydrocarbons in soils by dual persulfate/calcium peroxide system. Sci. Total Environ. 2021, 758, 143680. [Google Scholar] [CrossRef]
  8. Aziz, K.H.H.; Mahyar, A.; Miessner, H.; Mueller, S.; Kalass, D.; Moeller, D.; Khorshid, I.; Rashid, M.A.M. Application of a planar falling film reactor for decomposition and mineralization of methylene blue in the aqueous media via ozonation, Fenton, photocatalysis and non-thermal plasma: A comparative study. Process Saf. Environ. 2018, 113, 319–329. [Google Scholar] [CrossRef]
  9. Li, F.; Chen, J.; Hu, X.; He, F.; Bean, E.; Tsang, D.C.W.; Ok, Y.S.; Gao, B. Applications of carbonaceous adsorbents in the remediation of polycyclic aromatic hydrocarbon-contaminated sediments: A review. J. Clean. Prod. 2020, 255, 120263. [Google Scholar] [CrossRef]
  10. Bai, Y.; Chen, S.B.; Wang, H.Y.; Wang, E.G.; Kong, X.H.; Gai, Y.S.; Qu, X.C.; Li, Q.; Xue, S.; Guo, P.W.; et al. Chemical warfare agents decontamination via air mircoplasma excited by a triboelectric nanogenerator. Nano Energy 2022, 95, 106992. [Google Scholar] [CrossRef]
  11. Debonoa, O.; Hequetb, V.; Le Coqb, L.; Locogea, N.; Theveneta, F. VOC ternary mixture effect on ppb level photocatalytic oxidation: Removal kinetic, reaction intermediates and mineralization. Appl. Catal. B-Environ. 2017, 218, 359–369. [Google Scholar] [CrossRef] [Green Version]
  12. Gao, J.; Ma, C.; Xing, S.; Sun, L.; Liu, J. Polycyclic aromatic hydrocarbon emissions of non-road diesel engine treated with non-thermal plasma technology. Korean J. Chem. Eng. 2016, 33, 3425–3433. [Google Scholar] [CrossRef]
  13. Sonar, S.; Giraudon, J.-M.; Veerapandian, S.K.P.; Lamonier, J.-F.; Morent, R.; Löfberg, A.; De Geyter, N. Adsorption Followed by Plasma Assisted Catalytic Conversion of Toluene into CO2 on Hopcalite in an Air Stream. Catalysts 2021, 11, 845. [Google Scholar] [CrossRef]
  14. Kulawik, P.; Kumar Tiwari, B. Recent advancements in the application of non-thermal plasma technology for the seafood industry. Crit. Rev. Food. Sci. 2019, 59, 3199–3210. [Google Scholar] [CrossRef] [PubMed]
  15. Feng, X.; Liu, H.; He, C.; Shen, Z.; Wang, T. Synergistic effects and mechanism of a non-thermal plasma catalysis system in volatile organic compound removal: A review. Catal. Sci. Technol. 2018, 8, 936–954. [Google Scholar] [CrossRef]
  16. Savinov, S.Y.; Lee, H.; Song, H.K.; Na, B.K. The Effect of Vibrational Excitation of Molecules on Plasmachemical Reactions Involving Methane and Nitrogen. Plasma Chem. Plasma Process. 2003, 23, 159–173. [Google Scholar] [CrossRef]
  17. Aziz, K.H.H.; Miessner, H.; Mahyar, A.; Mueller, S.; Kalass, D.; Moeller, D.; Omer, K.M. Removal of dichloroacetic acid from aqueous solution using non-thermal plasma generated by dielectric barrier discharge and nano-pulse corona discharge. Sep. Purif. Technol. 2019, 216, 51–57. [Google Scholar] [CrossRef]
  18. Aziz, K.H.H.; Miessner, H.; Mahyar, A.; Mueller, S.; Moeller, D.; Mustafa, F.; Omer, K.M. Degradation of perfluorosurfactant in aqueous solution using non-thermal plasma generated by nano-second pulse corona discharge reactor. Arab. J. Chem. 2021, 14, 103366. [Google Scholar] [CrossRef]
  19. Liang, W.; Sun, H.; Shi, X.; Zhu, Y. Abatement of Toluene by Reverse-Flow Nonthermal Plasma Reactor Coupled with Catalyst. Catalysts 2020, 10, 511. [Google Scholar] [CrossRef]
  20. Redolfi, M.; Blin-Simiand, N.; Duten, X.; Pasquiers, S.; Hassouni, K. Naphthalene oxidation by different non-thermal electrical discharges at atmospheric pressure. Plasma Sci. Technol. 2019, 21, 055503. [Google Scholar] [CrossRef]
  21. Nguyen, V.T.; Nguyen, D.B.; Heo, I.; Mok, Y.S. Plasma-Assisted Selective Catalytic Reduction for Low-Temperature Removal of NOX and Soot Simulant. Catalysts 2019, 9, 853. [Google Scholar] [CrossRef] [Green Version]
  22. Kazachenko, A.S.; Vasilieva, N.Y.; Fetisova, O.Y.; Sychev, V.V.; Elsuf’ev, E.V.; Malyar, Y.N.; Issaoui, N.; Miroshnikova, A.V.; Borovkova, V.S.; Kazachenko, A.S.; et al. New reactions of betulin with sulfamic acid and ammonium sulfamate in the presence of solid catalysts. Biomass Convers. Biorefin. 2022, 12, 2190–6815. [Google Scholar] [CrossRef]
  23. Qu, M.; Cheng, Z.; Sun, Z.; Chen, D.; Yu, J.; Chen, J. Non-thermal plasma coupled with catalysis for VOCs abatement: A review. Process Saf. Environ. 2021, 153, 139–158. [Google Scholar] [CrossRef]
  24. Tarabanko, N.; Tarabanko, V.E.; Taran, O.P. Unidimensional Approximation of the Diffuse Electrical Layer in the Inner Volume of Solid Electrolyte Grains in the Absence of Background Ions. ChemPhysChem 2020, 21, 1925–1933. [Google Scholar] [CrossRef]
  25. Choi, Y.M.; Lee, Y.-I.; Kim, S.; Myung, N.V.; Choa, Y.-H. Synthesis of macro-mesoporous Pt/alumina catalyst to enhance catalytic activity of hydrogen oxidation. Electron. Mater. Lett. 2012, 8, 225–230. [Google Scholar] [CrossRef]
  26. Wu, Y.; Jiang, G.; Zhang, H.; Sun, Z.; Gao, Y.; Chen, X.; Liu, H.; Tian, H.; Lai, Q.; Fan, M.; et al. Fe2O3, a cost effective and environmentally friendly catalyst for the generation of NH3—A future fuel—Using a new Al2O3-looping based technology. Chem. Commun. 2017, 53, 10664–10667. [Google Scholar] [CrossRef]
  27. Bagheri, S.; Muhd Julkapli, N.; Bee Abd Hamid, S. Titanium dioxide as a catalyst support in heterogeneous catalysis. Sci. World J. 2014, 2014, 727496. [Google Scholar] [CrossRef] [Green Version]
  28. Yu, X.; Dang, X.Q.; Li, S.J.; Zhang, J.L.; Zhang, Q.; Cao, L. A comparison of in- and post-plasma catalysis for toluene abatement through continuous and sequential processes in dielectric barrier discharge reactors. J. Clean. Prod. 2020, 276, 124251. [Google Scholar] [CrossRef]
  29. Gadkari, S.; Gu, S. Influence of catalyst packing configuration on the discharge characteristics of dielectric barrier discharge reactors: A numerical investigation. Phys. Plasmas 2018, 25, 063513. [Google Scholar] [CrossRef]
  30. Li, J.; Zhai, X.; Ma, C.; Zhu, S.; Yu, F.; Dai, B.; Ge, G.; Yang, D. DBD Plasma Combined with Different Foam Metal Electrodes for CO2 Decomposition: Experimental Results and DFT Validations. Nanomaterials 2019, 9, 1595. [Google Scholar] [CrossRef] [Green Version]
  31. Zhou, S.; Huang, X.; Liu, M. Electrical model and experimental analysis of a double spiral structure surface dielectric barrier discharge. Plasma Sci. Technol. 2019, 21, 065401. [Google Scholar] [CrossRef]
  32. Tao, X.; Lu, R.; Li, H. Electrical Characteristics of Dielectric-Barrier Discharges in Atmospheric Pressure Air Using a Power-Frequency Voltage Source. Plasma Sci. Technol. 2012, 14, 723–727. [Google Scholar] [CrossRef]
  33. Bian, D.L.; Wu, Y.; Jia, M. Characterization of surface dielectric barrier discharge (SDBD) based on PI/Al2O3 nanocomposite. Plasma Process. Polym. 2018, 15, 1700236. [Google Scholar]
  34. Hähnel, M.; Woedtke, T.v.; Weltmann, K.-D. Influence of the Air Humidity on the Reduction ofBacillusSpores in a Defined Environment at Atmospheric Pressure Using a Dielectric Barrier Surface Discharge. Plasma Process. Polym. 2010, 7, 244–249. [Google Scholar] [CrossRef]
  35. Li, J.; Zhu, S.; Lu, K.; Ma, C.; Yang, D.; Yu, F. CO2 conversion in a coaxial dielectric barrier discharge plasma reactor in the presence of mixed ZrO2-CeO2. J. Environ. Chem. Eng. 2021, 9, 104654. [Google Scholar] [CrossRef]
  36. Li, Y.W.; Yuan, H.; Zhou, X.F.; Liang, J.P.; Liu, Y.Y.; Chang, D.L.; Yang, D.Z. Degradation of Benzene Using Dielectric Barrier Discharge Plasma Combined with Transition Metal Oxide Catalyst in Air. Catalysts 2022, 12, 203. [Google Scholar] [CrossRef]
  37. Tarabanko, N.; Tarabanko, V.E.; Kukhtetskiy, S.V.; Taran, O.P. Electrical Double Layer as a Model of Interaction between Cellulose and Solid Acid Catalysts of Hydrolysis. ChemPhysChem 2019, 20, 706–718. [Google Scholar] [CrossRef] [Green Version]
  38. Lee, B.; Kim, D.; Park, D. Dielectric barrier discharge reactor with the segmented electrodes for decomposition of toluene adsorbed on bare-zeolite. Chem. Eng. J. 2019, 357, 188–197. [Google Scholar] [CrossRef]
  39. Qin, C.; Guo, H.; Liu, P.; Bai, W.; Huang, J.; Huang, X.; Dang, X.; Yan, D. Toluene abatement through adsorption and plasma oxidation using ZSM-5 mixed with γ-Al2O3, TiO2 or BaTiO3. J. Ind. Eng. Chem. 2018, 63, 449–455. [Google Scholar] [CrossRef]
  40. Wang, B.; Chi, C.; Xu, M.; Wang, C.; Meng, D. Plasma-catalytic removal of toluene over CeO2 -MnOX catalysts in an atmosphere dielectric barrier discharge. Chem. Eng. J. 2017, 322, 679–692. [Google Scholar] [CrossRef]
  41. Liu, Y.; Liang, J.; Zhou, X.; Yuan, H.; Li, Y.; Chang, D.; Yang, K.; Yang, D. Degradation of persistent organic pollutants in soil by parallel tubes-array dielectric barrier discharge plasma cooperating with catalyst. Chem. Eng. J. 2022, 437, 135089. [Google Scholar] [CrossRef]
  42. Subrahmanyam, C.; Renken, A.; Kiwi-Minsker, L. Catalytic abatement of volatile organic compounds assisted by non-thermal plasma. Appl. Catal. B-Environ. 2006, 65, 157–162. [Google Scholar] [CrossRef]
  43. Hossain, M.M.; Mok, Y.S.; Nguyen, D.B.; Ahmed, R.; Saud, S.; Heo, I. Effective removal of toluene at near room temperature using cyclic adsorption-oxidation operation in alternative fixed-bed plasma-catalytic reactor. Chem. Eng. Res. Des. 2020, 164, 299–310. [Google Scholar] [CrossRef]
  44. Kopf, P.; Gilbert, E.; Eberle, S.H. TiO2 photocatalytic oxidation of monochloroacetic acid and pyridine influence of ozone. J. Photochem. Photobiol. A 2000, 136, 163–168. [Google Scholar] [CrossRef]
  45. Shayegan, Z.; Lee, C.-S.; Haghighat, F. TiO2 photocatalyst for removal of volatile organic compounds in gas phase—A review. Chem. Eng. J. 2018, 334, 2408–2439. [Google Scholar] [CrossRef] [Green Version]
  46. Uhm, H.S.; Jang, D.G.; Kim, M.S.; Suk, H. Density dependence of capillary plasma on the pressure and applied voltage. Phys. Plasmas 2012, 19, 024501. [Google Scholar] [CrossRef]
  47. Zhang, Z.; Jiang, Z.; Shangguan, W. Low-temperature catalysis for VOCs removal in technology and application: A state-of-the-art review. Catal. Today 2016, 264, 270–278. [Google Scholar] [CrossRef]
  48. Dong, L.F.; Li, X.C.; Yin, Z.Q.; Qian, S.F.; Ouyang, J.T.; Wang, L. Self-organized filaments in dielectric barrier discharge in air at atmospheric pressure. Chin. Phys. Lett. 2001, 18, 1380–1382. [Google Scholar]
  49. Zhang, H.; Zhu, F.; Li, X.; Xu, R.; Li, L.; Yan, J.; Tu, X. Steam reforming of toluene and naphthalene as tar surrogate in a gliding arc discharge reactor. J. Hazard. Mater. 2019, 369, 244–253. [Google Scholar] [CrossRef]
  50. Wang, R.; Ren, J.; Wu, J.; Wu, L. Characteristics and mechanism of toluene removal by double dielectric barrier discharge combined with an Fe2O3/TiO2/γ-Al2O3 catalyst. RSC Adv. 2020, 10, 41511–41522. [Google Scholar] [CrossRef]
  51. Sankaranarayanan, R.; Pashaie, B.; Dhali, S.K. Laser-induced fluorescence of OH radicals in a dielectric barrier discharge. Appl. Phys. Lett. 2000, 77, 2970–2972. [Google Scholar] [CrossRef]
  52. Magne, L.; Pasquiers, S.; Blin-Simiand, N.; Postel, C. Production and reactivity of the hydroxyl radical in homogeneous high pressure plasmas of atmospheric gases containing traces of light olefins. J. Phys. D Appl. Phys. 2007, 40, 3112–3127. [Google Scholar] [CrossRef]
  53. Mei, D.; Zhu, X.; Wu, C.; Ashford, B.; Williams, P.T.; Tu, X. Plasma-photocatalytic conversion of CO2 at low temperatures: Understanding the synergistic effect of plasma-catalysis. Appl. Catal. B-Environ. 2016, 182, 525–532. [Google Scholar] [CrossRef] [Green Version]
  54. Wang, R.X.; Xia, Z.C.; Kong, X.H.; Liang, L.H.; Ostrikov, K. Etching and annealing treatment to improve the plasma-deposited SiOx film adhesion force. Surf. Coat. Technol. 2021, 427, 127840. [Google Scholar] [CrossRef]
  55. Lu, K.; Wang, Z.; Dai, B.; Han, Y.; Chen, X.; Yu, J.; Yang, K.; Yang, D.; Ma, C.; Yu, F. Construction of graphitic-N-rich TiO2-N-C interfaces via dye dissociation and reassembly for efficient oxygen evolution reaction. Chem. Eng. J. 2022, 431, 133246. [Google Scholar] [CrossRef]
  56. Mastral, A.M.; Garcia, T.; Murillo, R.; Callen, M.S.; Lopez, J.M.; Navarro, M.V. Moisture effects on the phenanthrene adsorption capacity by carbonaceous materials. Energy Fuels 2002, 16, 205–210. [Google Scholar] [CrossRef]
Figure 1. Schematic diagram of the experimental setup.
Catalysts 12 00740 g001
Figure 2. The voltage and current waveforms of discharge in the DBD reactor: (a) without a catalyst at 14 kV; (b) without a catalyst at 16 kV; (c) filled with Al2O3 at 14 kV; (d) filled with Al2O3 at 16 kV. (Driving frequency: 12.6 kHz; total gas flow rate: 500 mL/min; discharge gap: 3 mm).
Catalysts 12 00740 g002
Figure 3. The Lissajous figures of the reactor filled with Al2O3, Fe2O3, and TiO2. (Driving frequency: 12.6 kHz; peak applied voltage: 24 kV; total gas flow rate: 500 mL/min; discharge gap: 3 mm).
Catalysts 12 00740 g003
Figure 4. The removal efficiency and the mineralization of naphthalene under different filling materials. (Applied voltage: 24 kV; driving frequency: 12.6 kHz; initial naphthalene concentration: 21.5 ppm; total gas flow rate: 500 mL/min; discharge gap: 3 mm).
Catalysts 12 00740 g004
Figure 5. Effect of initial naphthalene concentration on the mineralization and COx concentration in a DBD reactor filled with Al2O3. (Discharge power: 55 W; driving frequency: 12.6 kHz; initial naphthalene concentration: 21.5 ppm; total gas flow rate: 500 mL/min; discharge gap: 3 mm).
Catalysts 12 00740 g005
Figure 6. Effect of the total gas flow rate on the mineralization and CO2 selectivity in a DBD reactor filled with Al2O3. (Discharge power: 55 W; driving frequency: 12.6 kHz; naphthalene carrying gas: 200 mL/min; discharge gap: 3 mm).
Catalysts 12 00740 g006
Figure 7. Effect of time on (a) the mineralization and (b) the CO2 selectivity in a DBD reactor filled with Al2O3, Fe2O3, and TiO2. (Discharge power: 55 W; driving frequency: 12.6 kHz; initial naphthalene concentration: 21.5 ppm; total gas flow rate: 500 mL/min; discharge gap: 3 mm).
Catalysts 12 00740 g007
Figure 8. Effect of discharge power on (a) the mineralization and (b) the CO2 selectivity in the DBD reactor filled with Al2O3, Fe2O3, and TiO2. (Driving frequency: 12.6 kHz; initial naphthalene concentration: 21.5 ppm; total gas flow rate: 500 mL/min; discharge gap: 3 mm).
Catalysts 12 00740 g008
Figure 9. Effect of relative humidity on (a) the mineralization and (b) the CO2 selectivity in the DBD reactor filled with Al2O3, Fe2O3, and TiO2. (Discharge power: 55 W; driving frequency: 12.6 kHz; initial naphthalene concentration: 28 ppm; total gas flow rate: 500 mL/min; discharge gap: 3 mm).
Catalysts 12 00740 g009
Figure 10. X-ray diffraction (XRD) patterns of the (a) Al2O3 catalyst, (b) Fe2O3 catalyst, and (c) TiO2 catalyst.
Catalysts 12 00740 g010
Figure 11. The scanning electron microscope (SEM) images of (a,d) Al2O3 catalyst, (b,e) Fe2O3 catalyst, and (c,f) TiO2 catalyst.
Catalysts 12 00740 g011
Table 1. BET data analysis of the three catalyst samples.
CatalystsSpecific Surface Area (m2/g)Pore Volume (cm3/g)Pore Size (nm)
Al2O30.30560.00062917.7985
Fe2O30.77850.0012637.0580
TiO26.78800.02551919.7173
BET: Brunauer–Emmett–Teller.
Publisher’s Note: MDPI stays neutral with regard to jurisdictional claims in published maps and institutional affiliations.

