
High-Performance Hydrogel Based on Modified Chitosan for Removal of Heavy Metal Ions in Borehole: A Case Study from the Bahariya Oasis, Egypt


Abstract
:1. Introduction
2. Results
2.1. Characterization of Sorbent
2.1.1. Physical Characterization
2.1.2. Chemical Characterization
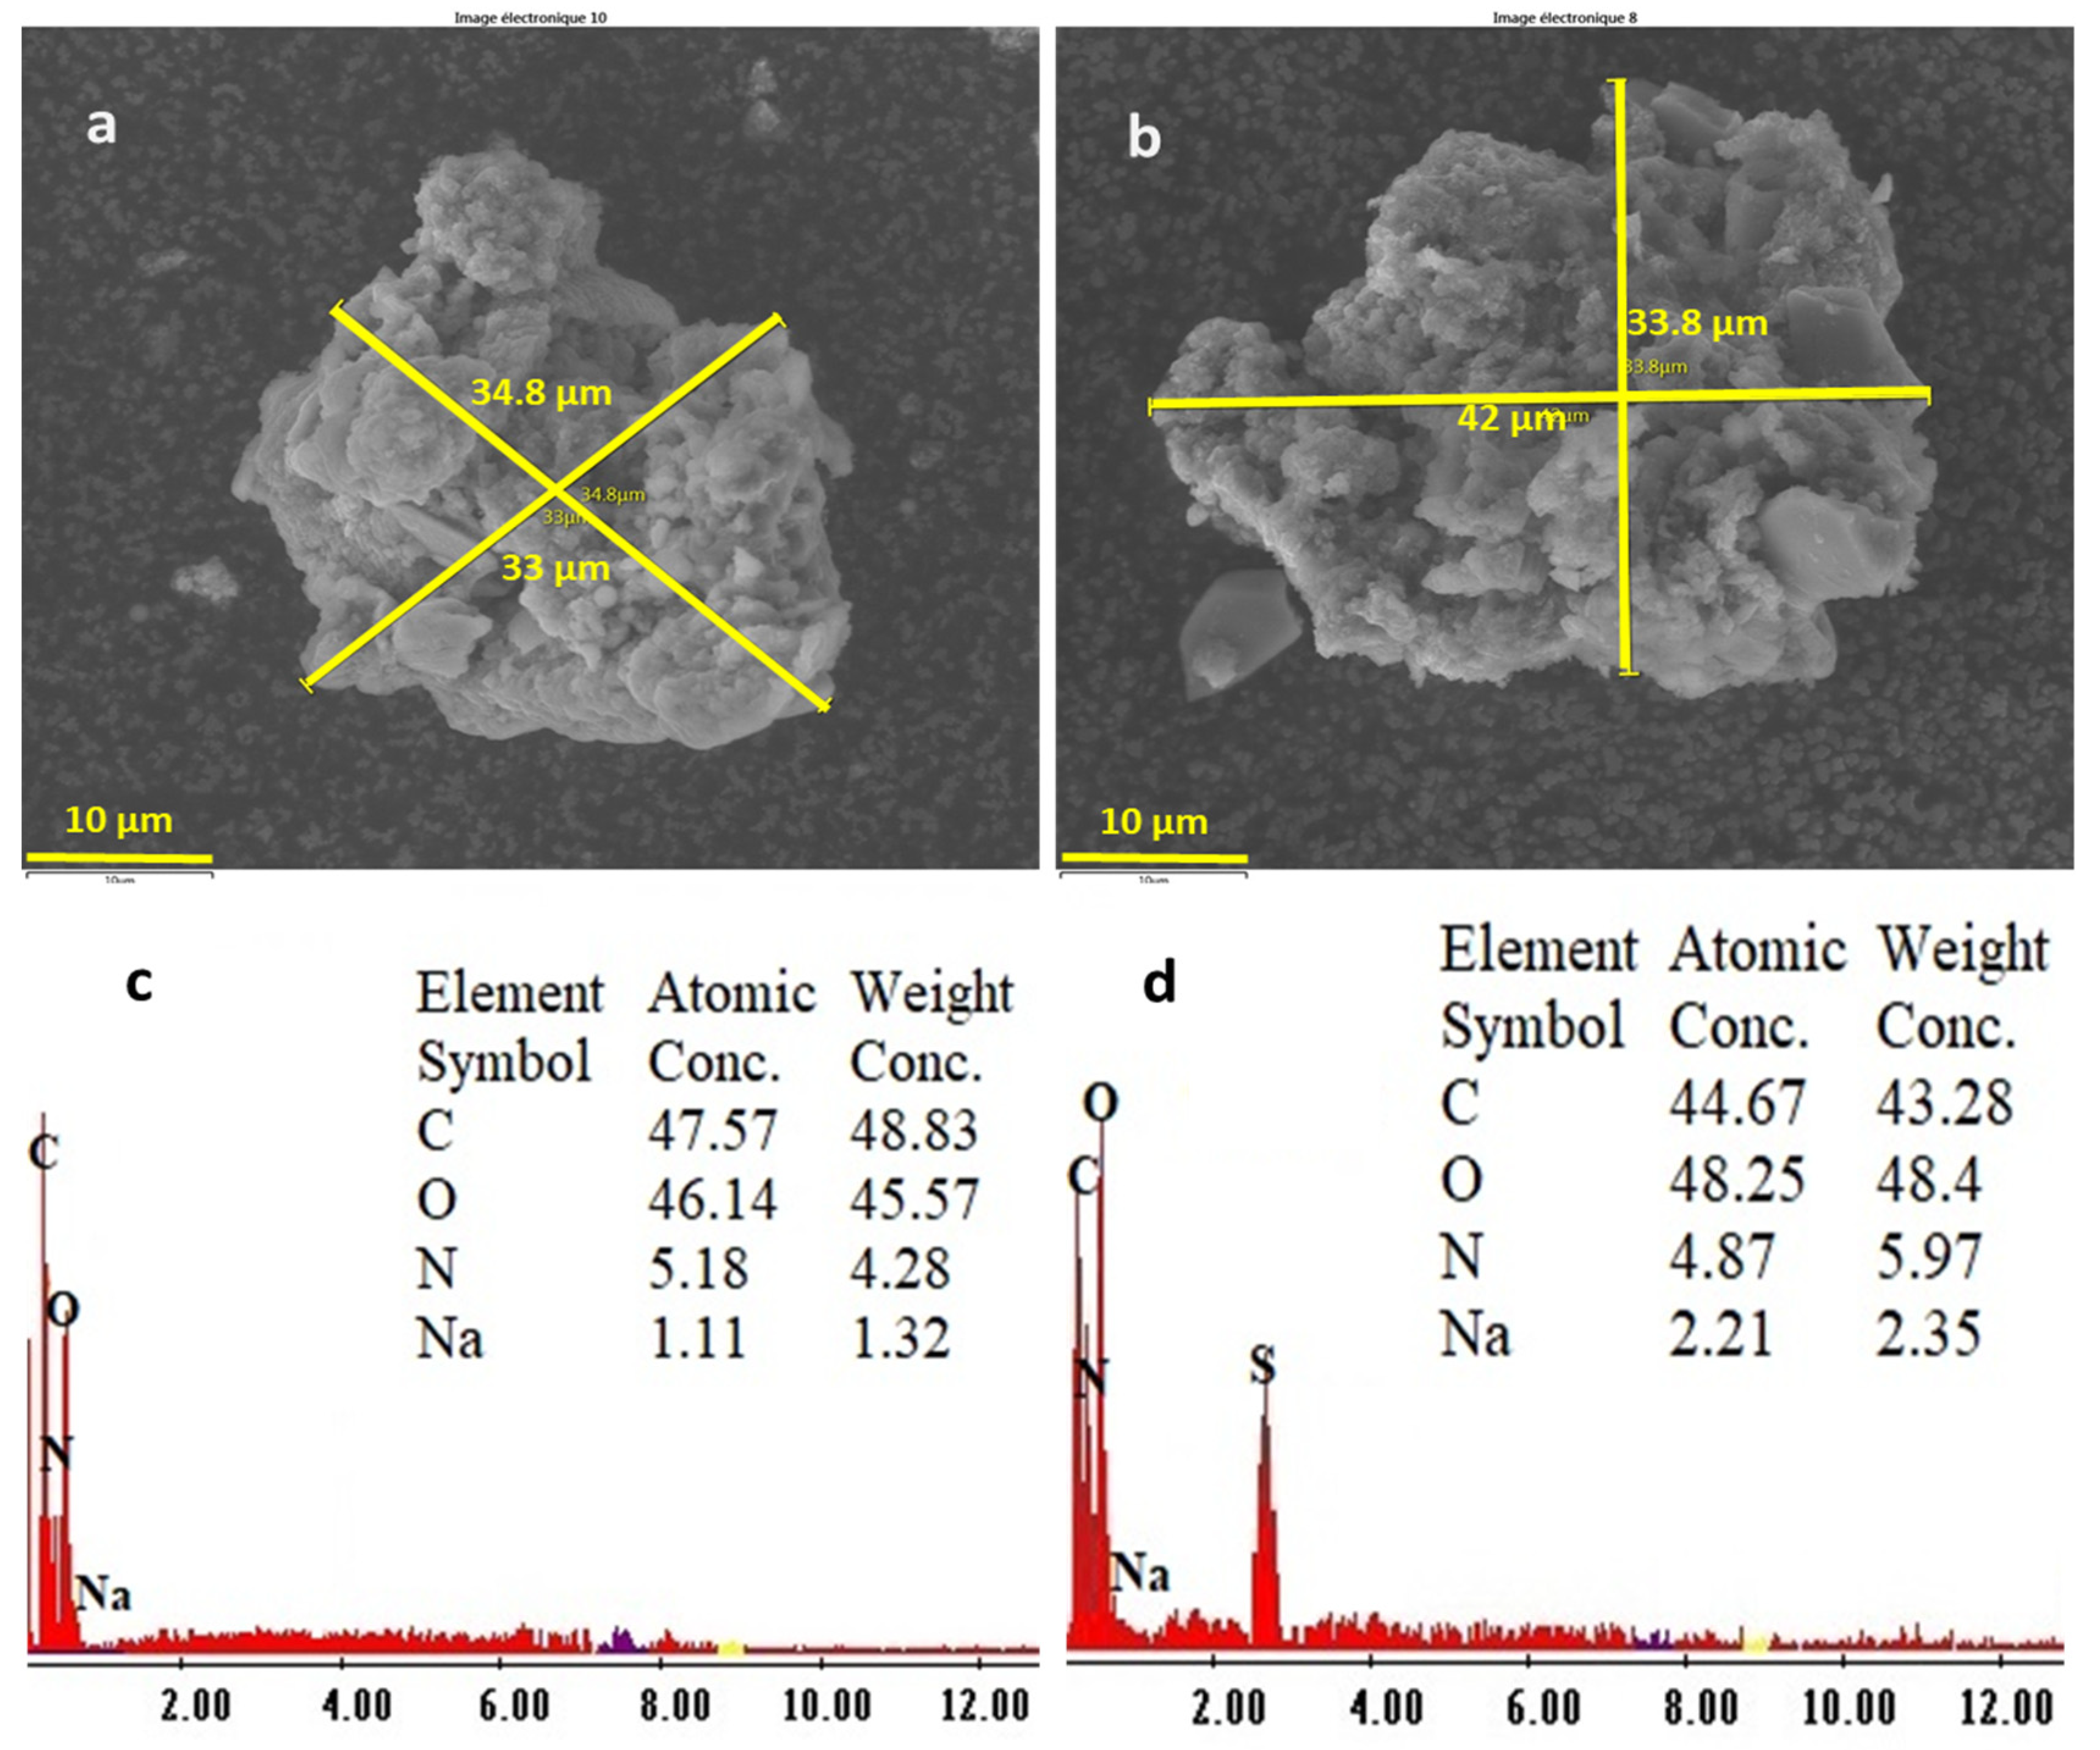
Elemental Analyses
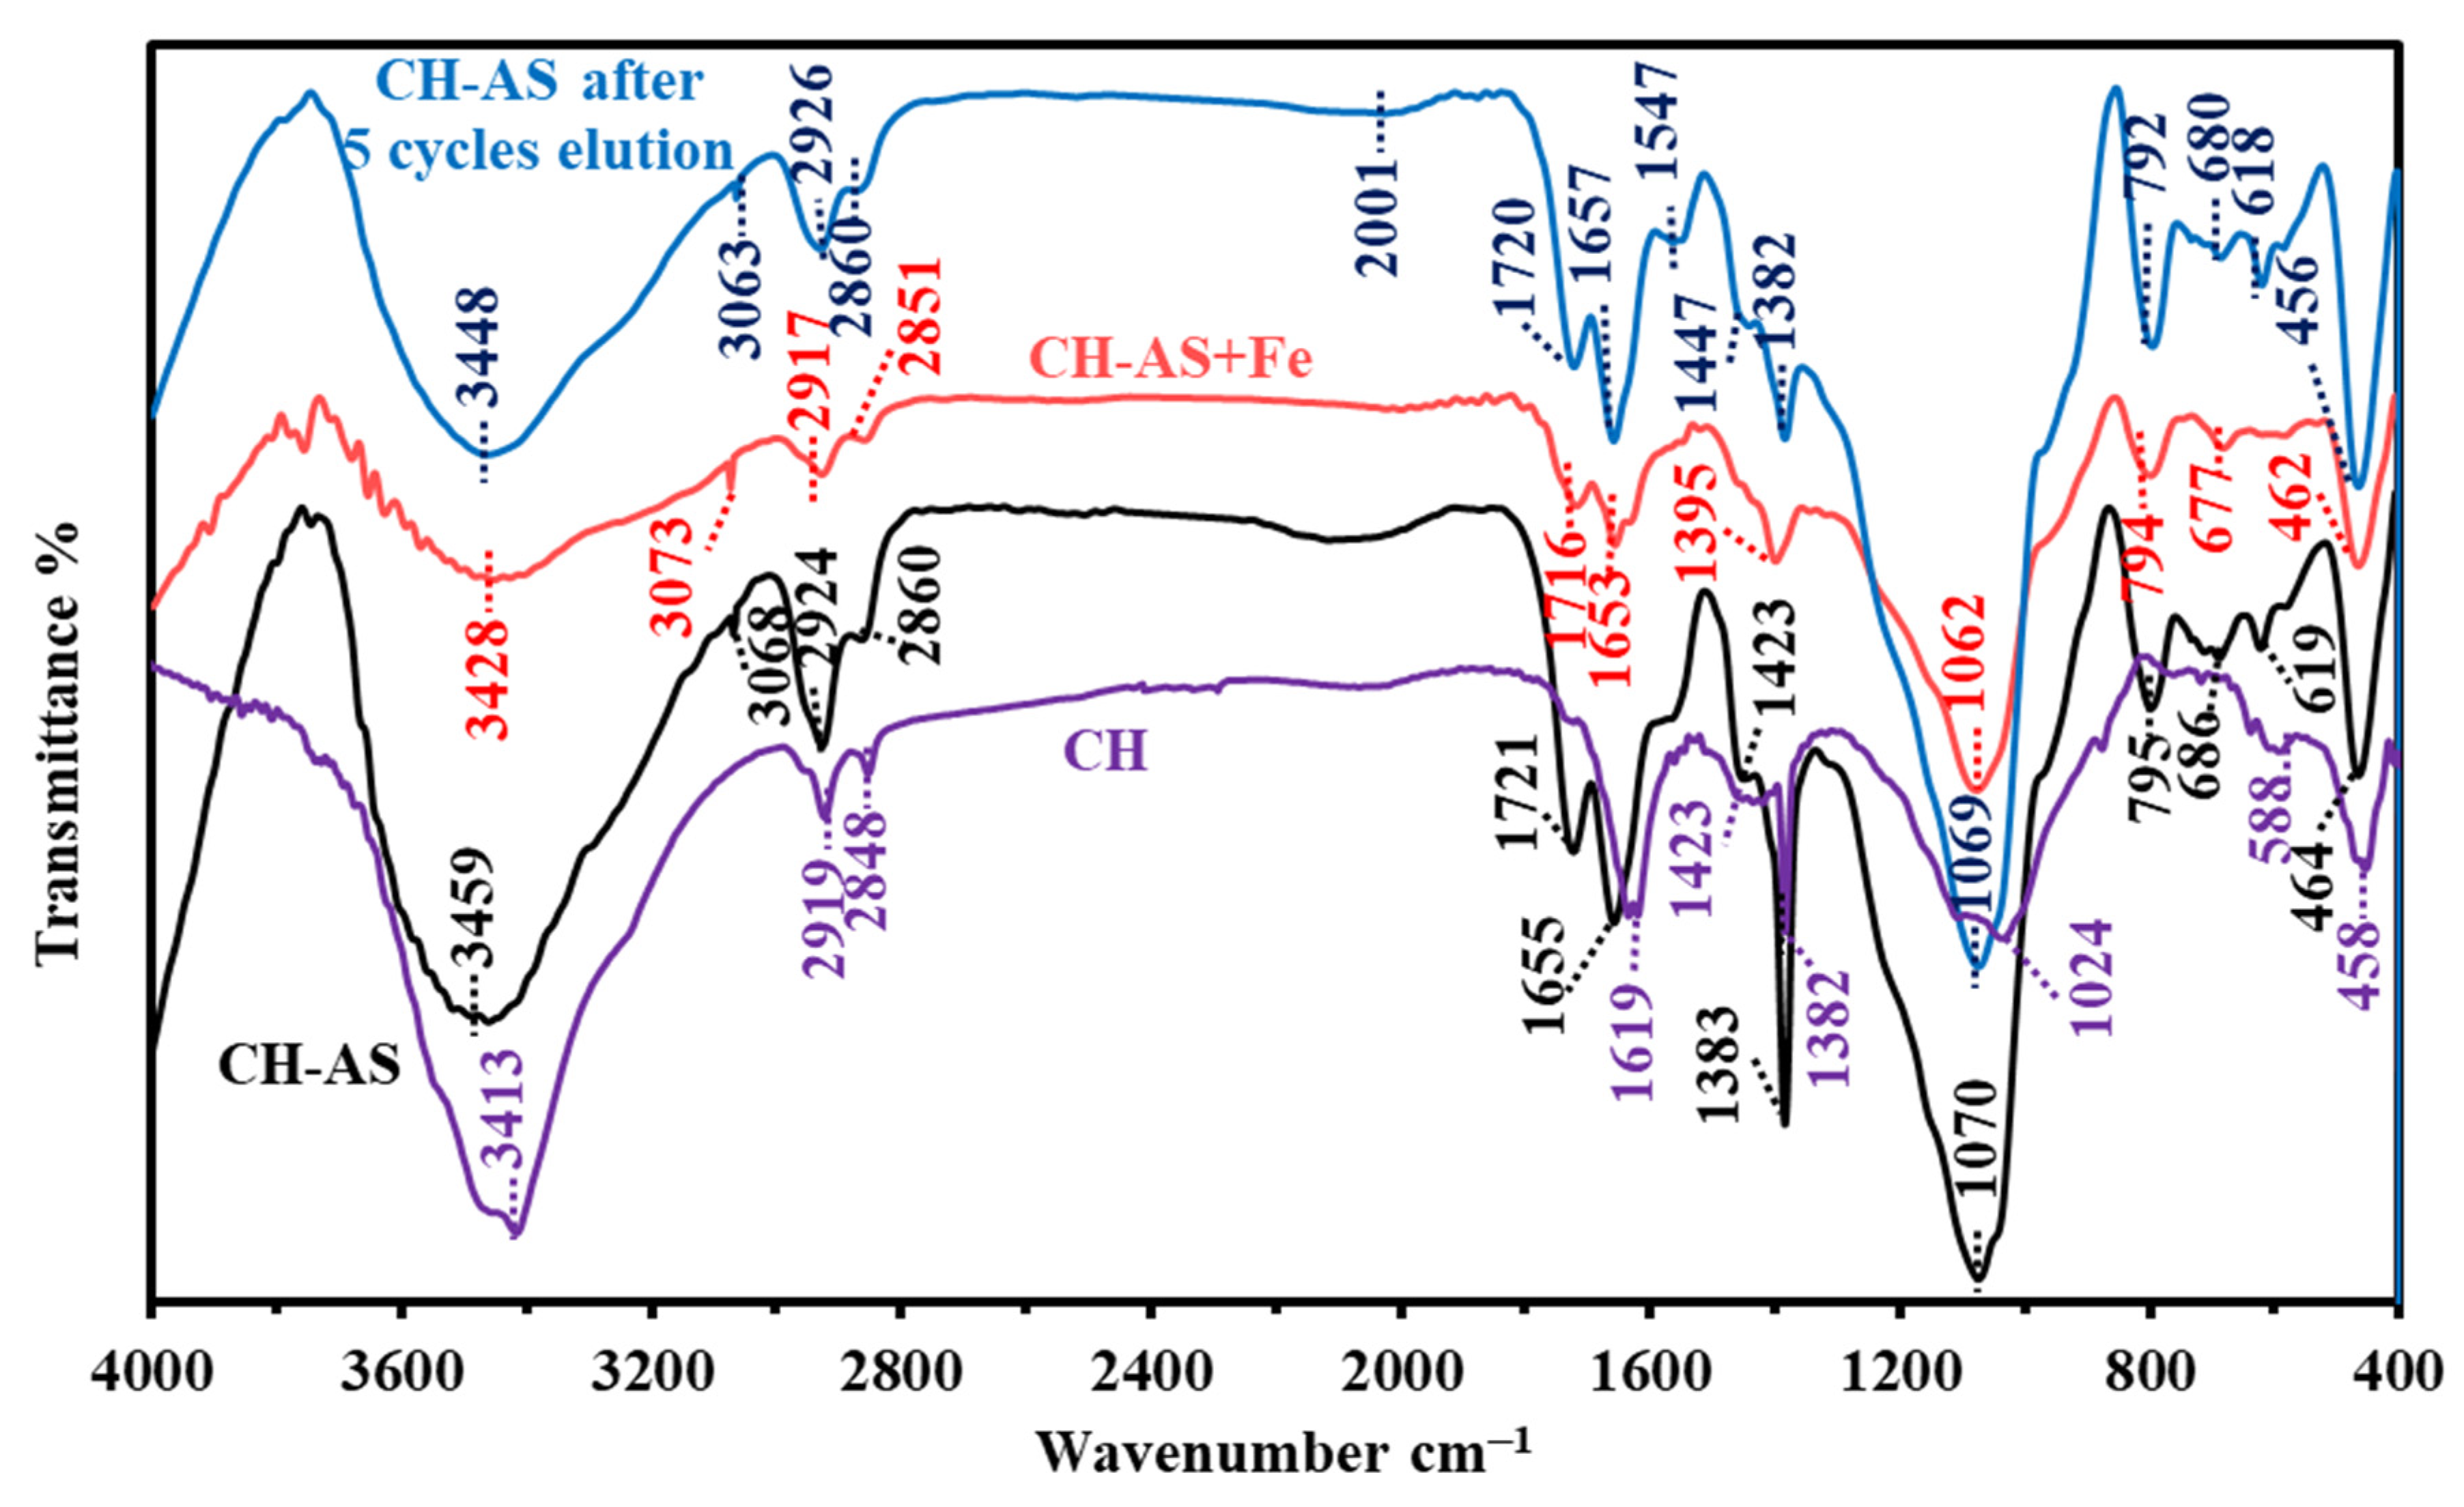
FTIR Spectroscopy
- (a)
- Appearance of a peak at 3068 cm−1 for CH str. of the aromatic ring from the grafted moiety;
- (b)
- The peak is close to 1720 ± 5 cm−1, which is assigned to C=C of Comb. aromatic bands (sh.) from the grafted moiety;
- (c)
- Peak at 795 cm−1 for CO wag. Out-of-phase, skeletal vibration;
- (d)
- Appearance of the peaks in the range of 686 cm−1 for N-C-N in-plane bending, for attaching the amine groups with the chitosan moiety;
- (e)
- Appearance of a peak at 618 for -S-O str. of the grafted sulfonic group.
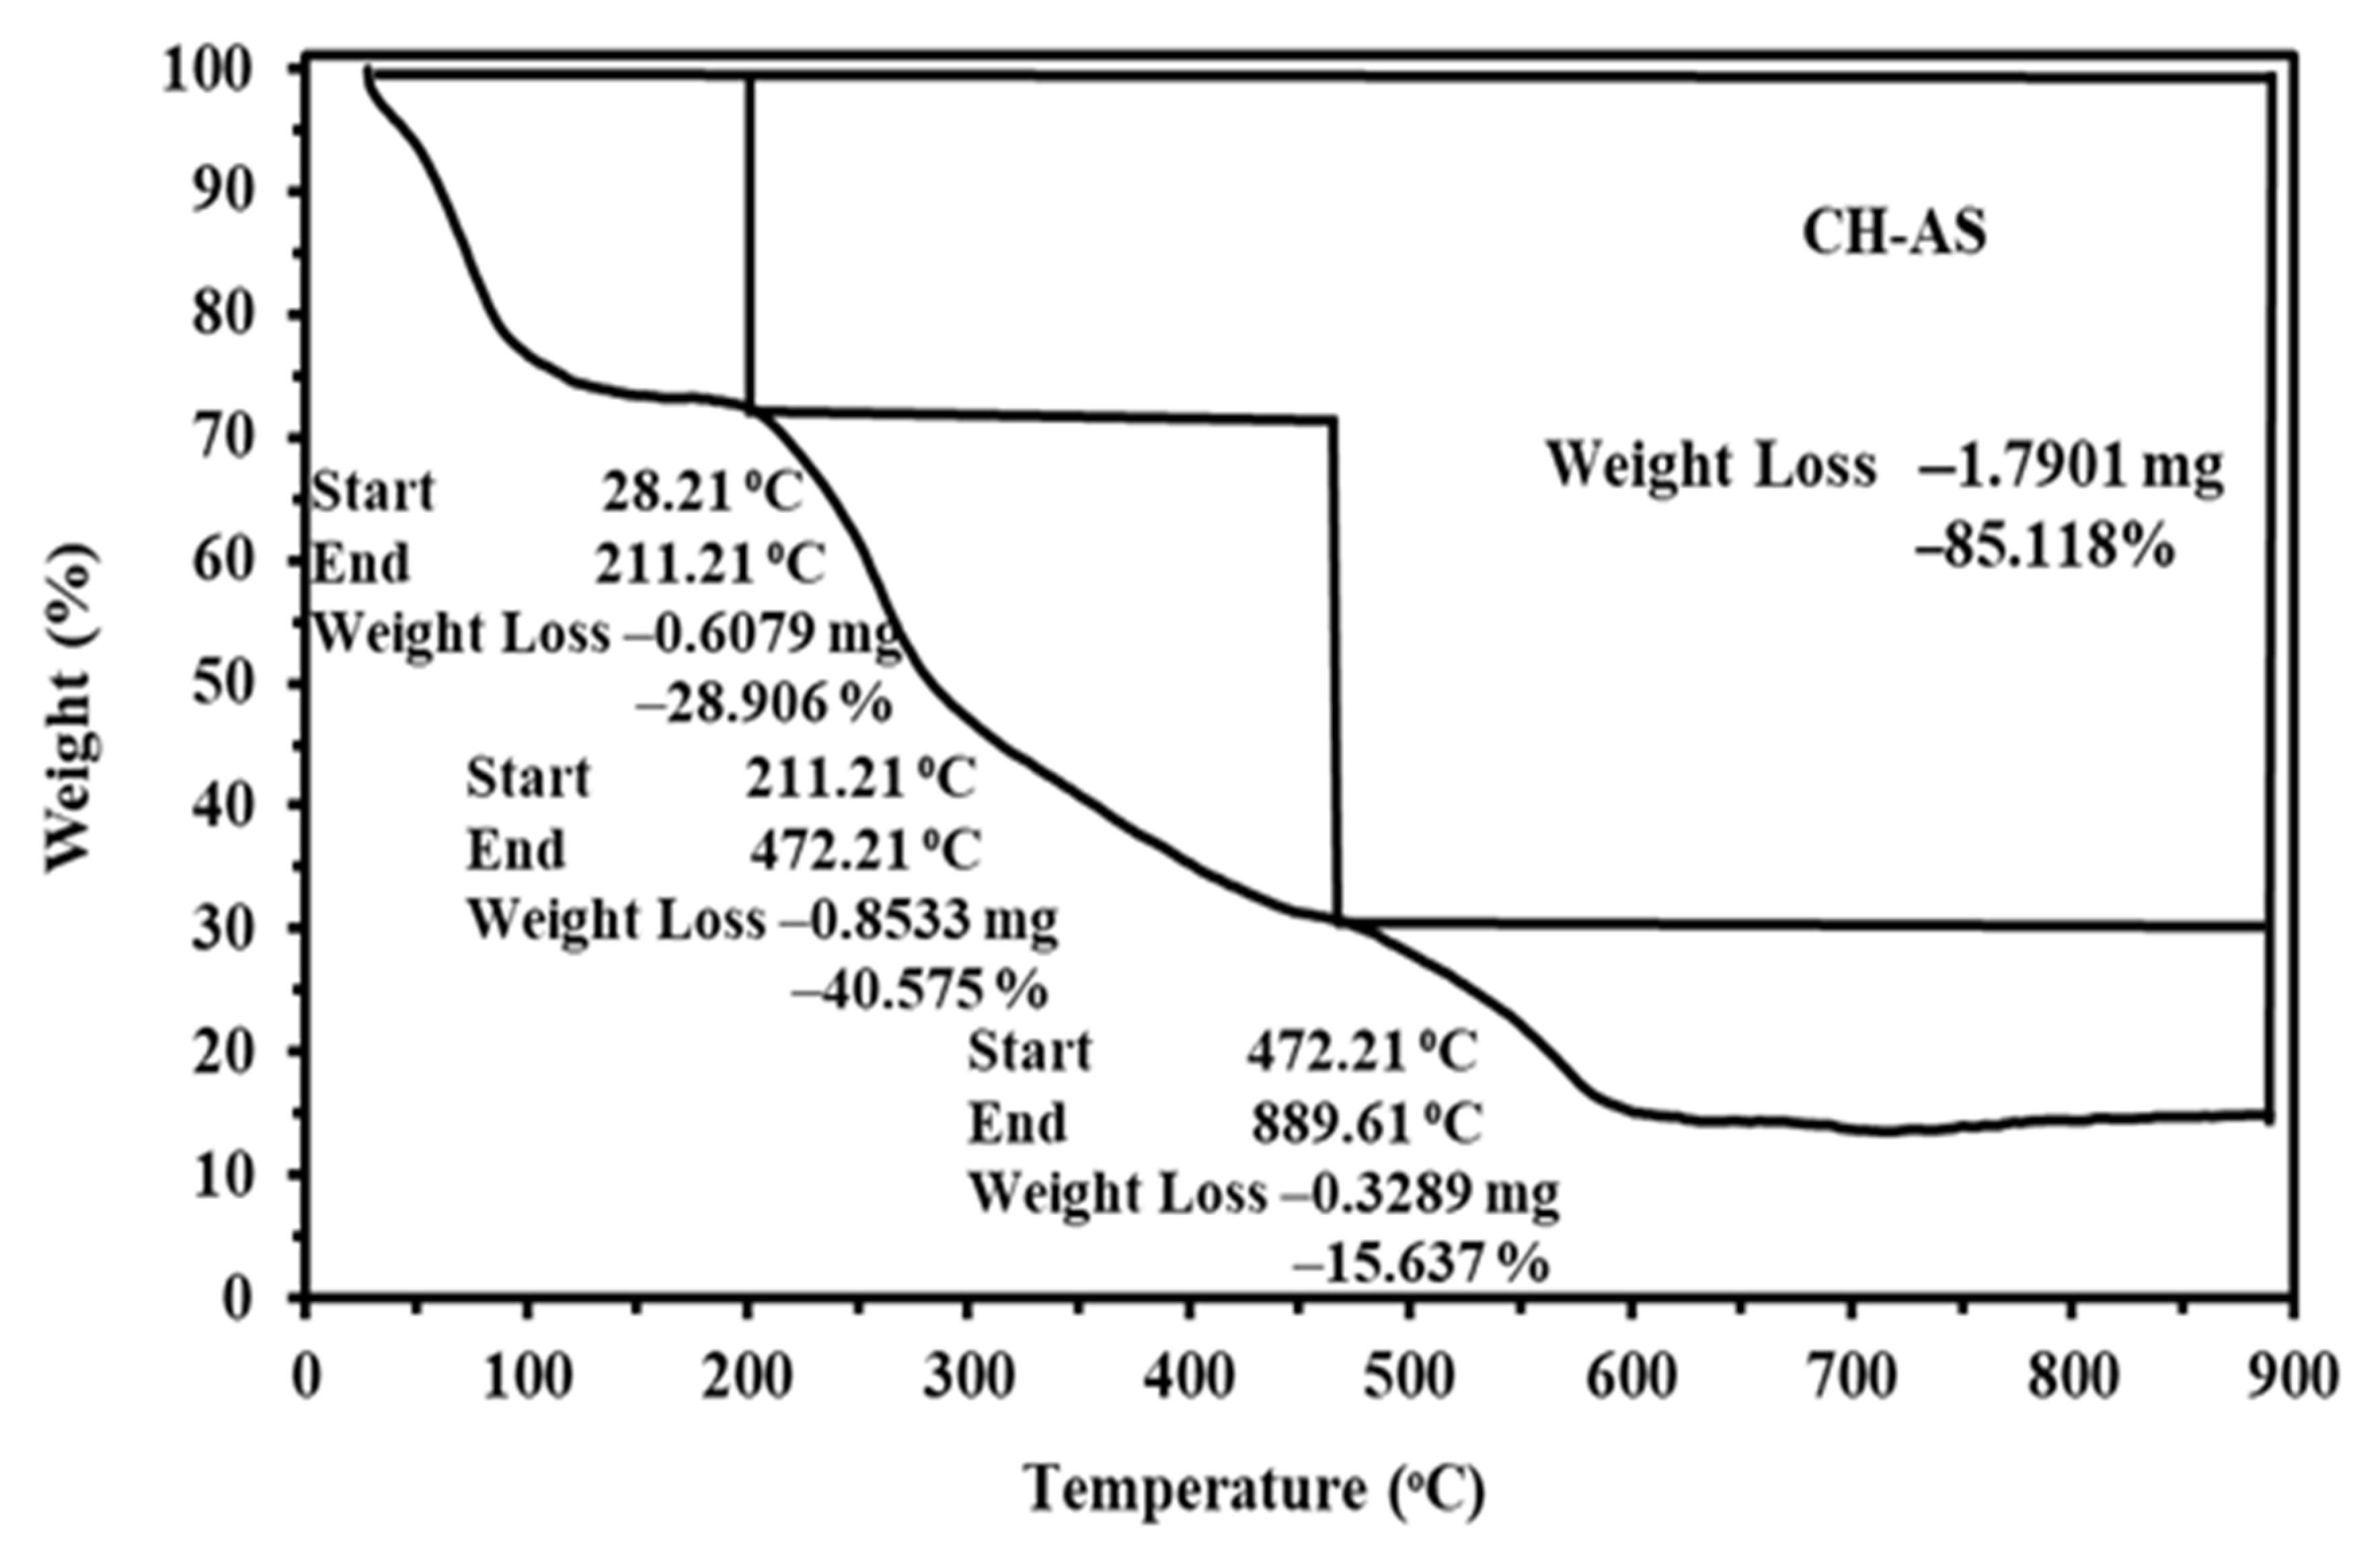
TGA Analysis
- (a)
- The water loss (from the surface or porous) is assigned to 211.21 °C. The total loss at this stage is around 28.9%;
- (b)
- Between 211.21 and 472.21 °C (additional loss: ≈ 40.575%), this stage is defined by the degradation and depolymerization of carbohydrates in the polysaccharide moieties and that of reactive groups (amines and hydroxyls) depolymerization of the polymers;
- (c)
- Above 472.21 °C and up to 900 °C (additional loss: ≈ 15.637%), which is attributed to the decomposition of the rest of the organic functional groups and the degradation of the polymer char. Several waves in the dTGA spectrum, as reported in Figure S2, were identified at 85.62, 337.4, 574.6, and 740.2 °C.
pHPZC
2.2. Sorption Properties
2.2.1. pH Effect
2.2.2. Uptake Kinetics
2.2.3. Sorption Isotherm
2.2.4. Desorption and Sorbent Recycling
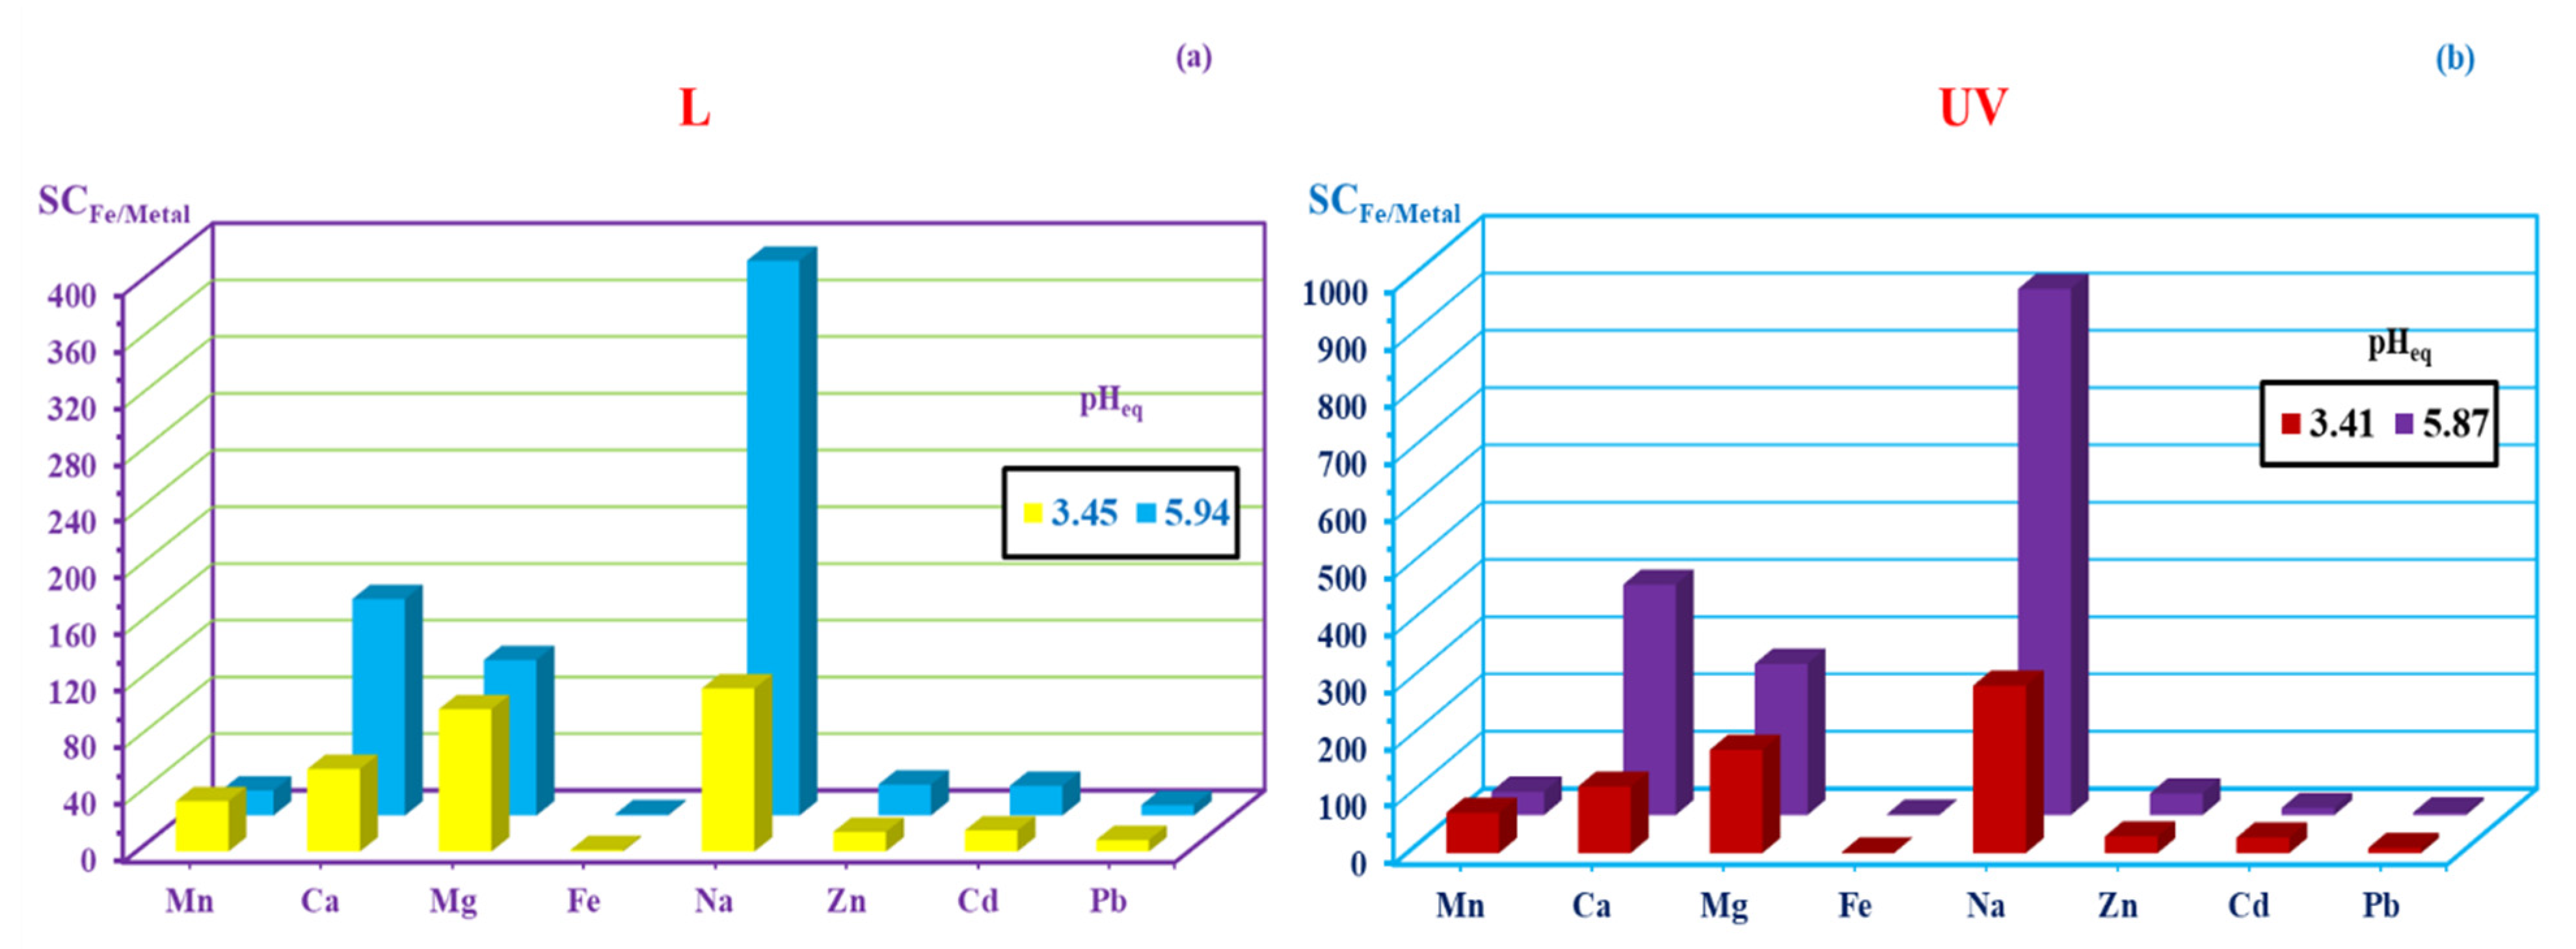
2.3. Effect of Light Mechanism on Fe(III) Sorption
2.4. The Study Area and Sampling Site
2.5. Geology and Hydrogeology of the Studied Area
2.6. Treatment of Mine Contaminated Water
3. Materials and Methods
3.1. Materials and Reagents
3.2. Synthesis of the Sorbents (CH and CH-AS)
3.3. Characterization
3.4. Sorption Studies
4. Conclusions
Supplementary Materials
Author Contributions
Funding
Data Availability Statement
Acknowledgments
Conflicts of Interest
References
- Shiklomanov, I.A. The world’s water resources. In Proceedings of the International Symposium to Commemorate; UNESCO: Paris, France, 1991; pp. 93–126. [Google Scholar]
- Shiklomanov, I.A.; Rodda, J.C. World Water Resources at the Beginning of the Twenty-First Century; Cambridge University Press: Cambridge, UK, 2004. [Google Scholar]
- Boretti, A.; Rosa, L. Reassessing the projections of the World Water Development Report. NPJ Clean Water 2019, 2, 15. [Google Scholar] [CrossRef]
- Leal Filho, W.; Totin, E.; Franke, J.A.; Andrew, S.M.; Abubakar, I.R.; Azadi, H.; Nunn, P.D.; Ouweneel, B.; Williams, P.A.; Simpson, N.P. Understanding responses to climate-related water scarcity in Africa. Sci. Total Environ. 2022, 806, 150420. [Google Scholar] [CrossRef] [PubMed]
- Ahmed, M.; Sultan, M.; Wahr, J.; Yan, E. The use of GRACE data to monitor natural and anthropogenic induced variations in water availability across Africa. Earth-Sci. Rev. 2014, 136, 289–300. [Google Scholar] [CrossRef]
- Ahmed, M.; Wiese, D.N. Short-term trends in Africa’s freshwater resources: Rates and drivers. Sci. Total Environ. 2019, 695, 133843. [Google Scholar] [CrossRef]
- Mekonnen, M.M.; Hoekstra, A.Y. Four billion people facing severe water scarcity. Sci. Adv. 2016, 2, e1500323. [Google Scholar] [CrossRef] [PubMed] [Green Version]
- FAO; UNICEF; WFP; WHO. The State of Food Security and Nutrition in the World 2019. Safeguarding against Economic Slowdowns and Downturns; FAO: Rome, Italy, 2020; pp. 1–239. [Google Scholar]
- WHO. World Health Statistics 2018: Monitoring Health for the SDGs, Sustainable Development Goals; World Health Organization: Geneva, Switzerland, 2018. [Google Scholar]
- Heggy, E.; Sharkawy, Z.; Abotalib, A.Z. Egypt’s water budget deficit and suggested mitigation policies for the Grand Ethiopian Renaissance Dam filling scenarios. Environ. Res. Lett. 2021, 16, 074022. [Google Scholar] [CrossRef]
- El Bedawy, R. Water resources management: Alarming crisis for Egypt. J. Mgmt. Sustain. 2014, 4, 108. [Google Scholar] [CrossRef] [Green Version]
- Central Agency for Public Mobilization and Statistics (CAPMAS) Released Statistical Yearbook; CAPMAS: Cairo, Egypt, 2020.
- Egypt, M. Water Challenges in Egypt; Online Pamphlet; Ministry of Water Resources and Irrigation: Giza Governorate, Egypt, 2010.
- Gleeson, T.; Befus, K.M.; Jasechko, S.; Luijendijk, E.; Cardenas, M.B. The global volume and distribution of modern groundwater. Nat. Geosci. 2016, 9, 161–167. [Google Scholar] [CrossRef]
- Richter, B.; Kreitler, C. Geochemical Techniques for Indentifying Sources of Groundwater Salinization; CK Smoley: Boca Katon, FL, USA, 1993; Volume 258. [Google Scholar]
- Prior, J.C.; Boekhoff, J.L.; Howes, M.R.; Libra, R.D.; VanDorpe, P.E. Iowa’s Groundwater Basics: A Geological Guide to the Occurence, Use, and Vulnerability of Iowa’s Aquifers; National Academy of Sciences: Washington, DC, USA, 2003. [Google Scholar]
- Mashaal, N.; Akagi, T.; Ishibashi, J. Hydrochemical and isotopic study of groundwater in Wadi El-Natrun, Western Desert, Egypt: Implication for salinization processes. J. Afr. Earth Sci. 2020, 172, 104011. [Google Scholar] [CrossRef]
- Hem, J.D. Study and interpretation of the chemical characteristics of natural water. In US Geological Survey Water-Supply Paper 2254, 3rd ed.; United States Government Printing Office: Washington, DC, USA, 1985. [Google Scholar]
- Sawyer, C.N.; McCarty, P.L. Chemistry for Sanitary Engineers; McGraw, Hill Book Company: New York, NY, USA, 1967. [Google Scholar]
- Khozyem, H.; Hamdan, A.; Tantawy, A.A.; Emam, A.; Elbadry, E. Distribution and origin of iron and manganese in groundwater: Case study, Balat-Teneida area, El-Dakhla Basin, Egypt. Arab. J. Geosci. 2019, 12, 523. [Google Scholar] [CrossRef]
- WHO. Guidelines for Drinking-Water Quality; WHO: Geneva, Switzerland, 2011; Volume 216, pp. 303–304. [Google Scholar]
- Fouda, A.; Eid, A.M.; EL-Belely, E.F.; Awad, M.A.; Hassan, S.E.-D.; AL-Faifi, Z.E.; Hamza, M.F. Enhanced antimicrobial, cytotoxicity, larvicidal, and repellence activities of phyco-synthesized magnesium oxide nanoparticles using brown algae, Cystoseira crinita. Front. Bioeng. Biotechnol. 2022, 10, 849921. [Google Scholar] [CrossRef] [PubMed]
- Kavak, D. Removal of lead from aqueous solutions by precipitation: Statistical analysis and modeling. Desalination Water Treat. 2013, 51, 1720–1726. [Google Scholar] [CrossRef]
- Zhizhaev, A.M.; Merkulova, E.N.; Bragin, I.V. Copper precipitation from sulfate solutions with calcium carbonates. Russ. J. Appl. Chem. 2007, 80, 1632–1635. [Google Scholar] [CrossRef]
- Matlock, M.M.; Howerton, B.S.; Atwood, D.A. Irreversible precipitation of mercury and lead. J. Hazard. Mater. 2001, 84, 73–82. [Google Scholar] [CrossRef]
- Hamza, M.F.; Roux, J.-C.; Guibal, E. Metal valorization from the waste produced in the manufacturing of Co/Mo catalysts: Leaching and selective precipitation. J. Mater. Cycles Waste Manag. 2019, 21, 525–538. [Google Scholar] [CrossRef]
- Hamza, M.F.; El-Aassy, I.E.; Guibal, E. Integrated treatment of tailing material for the selective recovery of uranium, rare earth elements and heavy metals. Miner. Eng. 2019, 133, 138–148. [Google Scholar] [CrossRef]
- Zhu, Z.W.; Pranolo, Y.; Cheng, C.Y. Uranium recovery from strong acidic solutions by solvent extraction with Cyanex 923 and a modifier. Miner. Eng. 2016, 89, 77–83. [Google Scholar] [CrossRef]
- Jha, M.K.; Gupta, D.; Choubey, P.K.; Kumar, V.; Jeong, J.; Lee, J.-C. Solvent extraction of copper, zinc, cadmium and nickel from sulfate solution in mixer settler unit (MSU). Sep. Purif. Technol. 2014, 122, 119–127. [Google Scholar] [CrossRef]
- Gavilan, K.C.; Pestov, A.V.; Garcia, H.M.; Yatluk, Y.; Roussy, J.; Guibal, E. Mercury sorption on a thiocarbamoyl derivative of chitosan. J. Hazard. Mater. 2009, 165, 415–426. [Google Scholar] [CrossRef]
- Fadel, D.A.; El-Bahy, S.M.; Abdelaziz, Y.A. Heavy metals removal using iminodiacetate chelating resin by batch and column techniques. Desalination Water Treat. 2016, 57, 25718–25728. [Google Scholar] [CrossRef]
- Hamza, M.F. Grafting of quaternary ammonium groups for uranium (VI) recovery: Application on natural acidic leaching liquor. J. Radioanal. Nucl. Chem. 2019, 322, 519–532. [Google Scholar] [CrossRef]
- Hamza, M.F.; Fouda, A.; Wei, Y.; El Aassy, I.E.; Alotaibi, S.H.; Guibal, E.; Mashaal, N.M. Functionalized biobased composite for metal decontamination-Insight on uranium and application to water samples collected from wells in mining areas (Sinai). Chem. Eng. J. 2021, 431, 133967. [Google Scholar] [CrossRef]
- Hamza, M.F.; Wei, Y.; Khalafalla, M.S.; Abed, N.S.; Fouda, A.; Elwakeel, K.Z.; Guibal, E.; Hamad, N.A. U (VI) and Th (IV) recovery using silica beads functionalized with urea-or thiourea-based polymers–Application to ore leachate. Sci. Total Environ. 2022, 821, 153184. [Google Scholar] [CrossRef] [PubMed]
- Hamza, M.F.; Khalafalla, M.S.; Wei, Y.; Hamad, N.A. Effect of bi-functionalization silica micro beads on uranium adsorption from synthetic and washing pregnant uranyl solutions. J. Radioanal. Nucl. Chem. 2021, 330, 191–206. [Google Scholar] [CrossRef]
- Pehlivan, E.; Altun, T. Ion-exchange of Pb2+, Cu2+, Zn2+, Cd2+, and Ni2+ ions from aqueous solution by Lewatit CNP 80. J. Hazard. Mater. 2007, 140, 299–307. [Google Scholar] [CrossRef]
- Hamza, M.F.; Mubark, A.E.; Wei, Y.; Vincent, T.; Guibal, E. Quaternization of composite algal/PEI beads for enhanced uranium sorption—Application to ore acidic leachate. Gels 2020, 6, 12. [Google Scholar] [CrossRef] [Green Version]
- Hamza, M.F. Removal of uranium (VI) from liquid waste of calcareous shale, Allouga, southwestern Sinai, Egypt. Desalination Water Treat. 2015, 54, 2530–2540. [Google Scholar] [CrossRef]
- Hamza, M.F. Uranium recovery from concentrated chloride solution produced from direct acid leaching of calcareous shale, Allouga ore materials, southwestern Sinai, Egypt. J. Radioanal. Nucl. Chem. 2018, 315, 613–626. [Google Scholar] [CrossRef]
- Zahra, M.H.; Hamza, M.F.; El-Habibi, G.; Abdel-Rahman, A.A.-H.; Mira, H.I.; Wei, Y.; Alotaibi, S.H.; Amer, H.H.; Goda, A.E.-S.; Hamad, N.A. Synthesis of a Novel Adsorbent Based on Chitosan Magnetite Nanoparticles for the High Sorption of Cr (VI) ions: A Study of Photocatalysis and Recovery on Tannery Effluents. Catalysts 2022, 12, 678. [Google Scholar] [CrossRef]
- Dai, X.; Nhung, N.T.H.; Hamza, M.F.; Guo, Y.; Chen, L.; He, C.; Ning, S.; Wei, Y.; Dodbiba, G.; Fujita, T. Selective adsorption and recovery of scandium from red mud leachate by using phosphoric acid pre-treated pitaya peel biochar. Sep. Purif. Technol. 2022, 292, 121043. [Google Scholar] [CrossRef]
- Hamza, M.F.; Hamad, N.A.; Hamad, D.M.; Khalafalla, M.S.; Abdel-Rahman, A.A.-H.; Zeid, I.F.; Wei, Y.; Hessien, M.M.; Fouda, A.; Salem, W.M. Synthesis of Eco-Friendly Biopolymer, Alginate-Chitosan Composite to Adsorb the Heavy Metals, Cd (II) and Pb (II) from Contaminated Effluents. Materials 2021, 14, 2189. [Google Scholar] [CrossRef] [PubMed]
- Hamza, M.F.; Wei, Y.; Benettayeb, A.; Wang, X.; Guibal, E. Efficient removal of uranium, cadmium and mercury from aqueous solutions using grafted hydrazide-micro-magnetite chitosan derivative. J. Mater. Sci. 2020, 55, 4193–4212. [Google Scholar] [CrossRef]
- Hamza, M.F.; Abdel-Rahman, A.A.H.; Guibal, E. Magnetic glutamine-grafted polymer for the sorption of U (VI), Nd (III) and Dy (III). J. Chem. Technol. Biotechnol. 2018, 93, 1790–1806. [Google Scholar] [CrossRef]
- Wei, Y.; Salih, K.A.; Lu, S.; Hamza, M.F.; Fujita, T.; Vincent, T.; Guibal, E. Amidoxime functionalization of algal/polyethyleneimine beads for the sorption of Sr (II) from aqueous solutions. Molecules 2019, 24, 3893. [Google Scholar] [CrossRef] [PubMed] [Green Version]
- Hamza, M.F.; Ahmed, F.Y.; El-Aassy, I.; Fouda, A.; Guibal, E. Groundwater purification in a polymetallic mining area (SW Sinai, Egypt) using functionalized magnetic chitosan particles. Water Air Soil Pollut. 2018, 229, 360. [Google Scholar] [CrossRef]
- Vijayaraghavan, K.; Thilakavathi, M.; Palanivelu, K.; Velan, M. Continuous sorption of copper and cobalt by crab shell particles in a packed column. Environ. Technol. 2005, 26, 267–276. [Google Scholar] [CrossRef]
- Mata, Y.N.; Blazquez, M.L.; Ballester, A.; Gonzalez, F.; Munoz, J.A. Biosorption of cadmium, lead and copper with calcium alginate xerogels and immobilized Fucus vesiculosus. J. Hazard. Mater. 2009, 163, 555–562. [Google Scholar] [CrossRef]
- Wang, S.; Vincent, T.; Faur, C.; Guibal, E. Alginate and algal-based beads for the sorption of metal cations: Cu(II) and Pb(II). Int. J. Mol. Sci. 2016, 17, 1453. [Google Scholar] [CrossRef] [Green Version]
- Hamza, M.F.; Fouda, A.; Elwakeel, K.Z.; Wei, Y.; Guibal, E.; Hamad, N.A. Phosphorylation of guar gum/magnetite/chitosan nanocomposites for uranium (VI) sorption and antibacterial applications. Molecules 2021, 26, 1920. [Google Scholar] [CrossRef]
- Croisier, F.; Jérôme, C. Chitosan-based biomaterials for tissue engineering. Eur. Polym. J. 2013, 49, 780–792. [Google Scholar] [CrossRef] [Green Version]
- Hamza, M.F.; Aly, M.M.; Abdel-Rahman, A.A.-H.; Ramadan, S.; Raslan, H.; Wang, S.; Vincent, T.; Guibal, E. Functionalization of magnetic chitosan particles for the sorption of U (VI), Cu (II) and Zn (II)—Hydrazide derivative of glycine-grafted chitosan. Materials 2017, 10, 539. [Google Scholar] [CrossRef] [PubMed] [Green Version]
- Hamza, M.F.; Gamal, A.; Hussein, G.; Nagar, M.S.; Abdel-Rahman, A.A.H.; Wei, Y.; Guibal, E. Uranium (VI) and zirconium (IV) sorption on magnetic chitosan derivatives–effect of different functional groups on separation properties. J. Chem. Technol. Biotechnol. 2019, 94, 3866–3882. [Google Scholar] [CrossRef]
- Yang, Z.; Chai, Y.; Zeng, L.; Gao, Z.; Zhang, J.; Ji, H. Efficient removal of copper ion from wastewater using a stable chitosan gel material. Molecules 2019, 24, 4205. [Google Scholar] [CrossRef] [PubMed] [Green Version]
- Peniche, C.; Argüelles-Monal, W.; Goycoolea, F. Chitin and Chitosan: Major Sources, Properties and Applications, Monomers, Polymers and Composites from Renewable Resources; Elsevier: Amsterdam, The Netherlands, 2008; pp. 517–542. [Google Scholar]
- Zargar, V.; Asghari, M.; Dashti, A. A review on chitin and chitosan polymers: Structure, chemistry, solubility, derivatives, and applications. ChemBioEng Rev. 2015, 2, 204–226. [Google Scholar] [CrossRef]
- Hamza, M.F.; Salih, K.A.; Zhou, K.; Wei, Y.; Khoziem, H.A.A.; Alotaibi, S.H.; Guibal, E. Effect of bi-functionalization of algal/polyethyleneimine composite beads on the enhancement of tungstate sorption: Application to metal recovery from ore leachate. Sep. Purif. Technol. 2022, 290, 120893. [Google Scholar] [CrossRef]
- Ashrafizadeh, M.; Mohammadinejad, R.; Kailasa, S.K.; Ahmadi, Z.; Afshar, E.G.; Pardakhty, A. Carbon dots as versatile nanoarchitectures for the treatment of neurological disorders and their theranostic applications: A review. Adv. Colloid Interface Sci. 2020, 278, 102123. [Google Scholar] [CrossRef]
- Hamza, M.F.; Abdel-Rahman, A.A.-H. Extraction studies of some hazardous metal ions using magnetic peptide resins. J. Dispers. Sci. Technol. 2015, 36, 411–422. [Google Scholar] [CrossRef]
- Wang, L.; Hu, D.; Kong, X.; Liu, J.; Li, X.; Zhou, K.; Zhao, H.; Zhou, C. Anionic polypeptide poly (γ-glutamic acid)-functionalized magnetic Fe3O4-GO-(o-MWCNTs) hybrid nanocomposite for high-efficiency removal of Cd (II), Cu (II) and Ni (II) heavy metal ions. Chem. Eng. J. 2018, 346, 38–49. [Google Scholar] [CrossRef]
- Aguila, B.; Sun, Q.; Perman, J.A.; Earl, L.D.; Abney, C.W.; Elzein, R.; Schlaf, R.; Ma, S. Efficient mercury capture using functionalized porous organic polymer. Adv. Mater. 2017, 29, 1700665. [Google Scholar] [CrossRef]
- Li, H.; Niu, Y.; Xue, Z.; Mu, Q.; Wang, K.; Qu, R.; Chen, H.; Bai, L.; Yang, H.; Wei, D. Adsorption property and mechanism of PAMAM dendrimer/silica gel hybrids for Fe (III) and Ag (I) from N, N-dimethylformamide. J. Mol. Liq. 2019, 273, 305–313. [Google Scholar] [CrossRef]
- Piasek, Z.; Urbanski, T. The infra-red absorption spectrum and structure of urea. Bull. Pol. Acad. Sci. 1962, 10, 113–120. [Google Scholar]
- Manivannan, M.; Rajendran, S. Investigation of inhibitive action of urea-Zn2+ system in the corrosion control of carbon steel in sea water. Int. J. Environ. Sci. Technol. 2011, 3, 8048–8060. [Google Scholar]
- Jin, W.; Shen, D.; Liu, Q.; Xiao, R. Evaluation of the co-pyrolysis of lignin with plastic polymers by TG-FTIR and Py-GC/MS. Polym. Degrad. Stab. 2016, 133, 65–74. [Google Scholar] [CrossRef]
- Coates, J. Interpretation of Infrared Spectra, A Practical Approach. In Encyclopedia of Analytical Chemistry; John Wiley & Sons, Ltd.: Hoboken, NJ, USA, 2006; pp. 1–23. [Google Scholar]
- Zhang, Z.; Cao, Y.L.; Chen, L.N.; Huang, Z.Y. Preparation of thiol-functionalized cellulose and its application to the removal of Hg(II) from water environment. Cellul. Chem. Technol. 2017, 51, 559–567. [Google Scholar]
- Chandra, S.; Saleem, H.; Sundaraganesan, N.; Sebastian, S. Experimental and theoretical vibrational spectroscopic and HOMO, LUMO studies of 1,3-dimethylbarbituric acid. Ind. J. Chem. 2009, 48A, 1219–1227. [Google Scholar]
- Corazzari, I.; Nistico, R.; Turci, F.; Faga, M.G.; Franzoso, F.; Tabasso, S.; Magnacca, G. Advanced physico-chemical characterization of chitosan by means of TGA coupled on-line with FTIR and GCMS: Thermal degradation and water adsorption capacity. Polym. Degrad. Stabil. 2015, 112, 1–9. [Google Scholar] [CrossRef]
- Lawrie, G.; Keen, I.; Drew, B.; Chandler-Temple, A.; Rintoul, L.; Fredericks, P.; Grondahl, L. Interactions between alginate and chitosan biopolymers characterized using FTIR and XPS. Biomacromolecules 2007, 8, 2533–2541. [Google Scholar] [CrossRef]
- Duarte, M.L.; Ferreira, M.C.; Marvao, M.R.; Rocha, J. An optimised method to determine the degree of acetylation of chitin and chitosan by FTIR spectroscopy. Int. J. Biol. Macromol. 2002, 31, 1–8. [Google Scholar] [CrossRef]
- Caetano, C.S.; Caiado, M.; Farinha, J.; Fonseca, I.M.; Ramos, A.M.; Vital, J.; Castanheiro, J.E. Esterification of free fatty acids over chitosan with sulfonic acid groups. Chem. Eng. J. 2013, 230, 567–572. [Google Scholar] [CrossRef]
- Hamza, M.F.; Adel, A.-H.; Hawata, M.A.; El Araby, R.; Guibal, E.; Fouda, A.; Wei, Y.; Hamad, N.A. Functionalization of magnetic chitosan microparticles–Comparison of trione and trithione grafting for enhanced silver sorption and application to metal recovery from waste X-ray photographic films. J. Environ. Chem. Eng. 2022, 10, 107939. [Google Scholar] [CrossRef]
- Hamza, M.F.; Salih, K.A.; Adel, A.-H.; Zayed, Y.E.; Wei, Y.; Liang, J.; Guibal, E. Sulfonic-functionalized algal/PEI beads for scandium, cerium and holmium sorption from aqueous solutions (synthetic and industrial samples). Chem. Eng. J. 2021, 403, 126399. [Google Scholar] [CrossRef]
- Hamza, M.F.; Abdel-Rahman, A.A.-H.; Negm, A.S.; Hamad, D.M.; Khalafalla, M.S.; Fouda, A.; Wei, Y.; Amer, H.H.; Alotaibi, S.H.; Goda, A.E.-S. Grafting of Thiazole Derivative on Chitosan Magnetite Nanoparticles for Cadmium Removal—Application for Groundwater Treatment. Polymers 2022, 14, 1240. [Google Scholar] [CrossRef] [PubMed]
- Hamza, M.F.; Goda, A.E.-S.; Ning, S.; Mira, H.I.; Abdel-Rahman, A.A.-H.; Wei, Y.; Fujita, T.; Amer, H.H.; Alotaibi, S.H.; Fouda, A. Photocatalytic Efficacy of Heterocyclic Base Grafted Chitosan Magnetite Nanoparticles on Sorption of Pb (II); Application on Mining Effluent. Catalysts 2022, 12, 330. [Google Scholar] [CrossRef]
- Akkoz, Y.; Coskun, R.; Delibas, A. Preparation and characterization of sulphonated bio-adsorbent from waste hawthorn kernel for dye (MB) removal. J. Mol. Liq. 2019, 287, 11. [Google Scholar] [CrossRef]
- Urbano, B.; Rivas, B.L. Poly(sodium 4-styrene sulfonate) and poly(2-acrylamido glycolic acid) polymer–clay ion exchange resins with enhanced mechanical properties and metal ion retention. Polym. Int. 2012, 61, 23–29. [Google Scholar] [CrossRef]
- Tien, C. Adsorption Calculations and Modeling; Butterworth-Heinemann: Newton, MA, USA, 1994; p. 243. [Google Scholar]
- Ho, Y.S.; McKay, G. Pseudo-second order model for sorption processes. Process Biochem. 1999, 34, 451–465. [Google Scholar] [CrossRef]
- Crank, J. The Mathematics of Diffusion, 2nd ed.; Oxford University Press: Oxford, UK, 1975. [Google Scholar]
- Fang, N.; He, Q.; Sheng, L.; Xi, Y.; Zhang, L.; Liu, H.; Cheng, H. Toward broader applications of iron ore waste in pollution control: Adsorption of norfloxacin. J. Hazard. Mater. 2021, 418, 126273. [Google Scholar] [CrossRef]
- Khan, N.A.; Ahmed, S.; Farooqi, I.H.; Ali, I.; Vambol, V.; Changani, F.; Yousefi, M.; Vambol, S.; Khan, S.U.; Khan, A.H. Occurrence, sources and conventional treatment techniques for various antibiotics present in hospital wastewaters: A critical review. TrAC Trends Anal. Chem. 2020, 129, 115921. [Google Scholar] [CrossRef]
- Hanna, N.; Sun, P.; Sun, Q.; Li, X.; Yang, X.; Ji, X.; Zou, H.; Ottoson, J.; Nilsson, L.E.; Berglund, B. Presence of antibiotic residues in various environmental compartments of Shandong province in eastern China: Its potential for resistance development and ecological and human risk. Environ. Int. 2018, 114, 131–142. [Google Scholar] [CrossRef]
- Kuhlmann, J.; Dalhoff, A.; Zeiler, H.-J. Quinolone Antibacterials; Springer Science & Business Media: Berlin/Heidelberg, Germany, 2012. [Google Scholar]
- Zhou, C.; Zhang, Y.; Liu, H. A novel nanofibrous film chemosensor for detecting and adsorbing Fe3+. J. Braz. Chem. Soc. 2018, 29, 457–462. [Google Scholar] [CrossRef]
- Chatterjee, S.; Gohil, H.; Paital, A.R. Dual functions of selective ferric ion detection and removal by a recyclable fluorescence active multifunctional silica material and toxic dye removal from aqueous solution. ChemistrySelect 2017, 2, 5348–5359. [Google Scholar] [CrossRef]
- Wang, C.; Hu, T.; Wen, Z.; Zhou, J.; Wang, X.; Wu, Q.; Wang, C. Concentration-dependent color tunability of nitrogen-doped carbon dots and their application for iron (III) detection and multicolor bioimaging. J. Colloid Interface Sci. 2018, 521, 33–41. [Google Scholar] [CrossRef] [PubMed]
- Mohamed, A.E.; Elgammal, W.E.; Eid, A.M.; Dawaba, A.M.; Ibrahim, A.G.; Fouda, A.; Hassan, S.M. Synthesis and characterization of new functionalized chitosan and its antimicrobial and in-vitro release behavior from topical gel. Int. J. Biol. Macromol. 2022, 207, 242–253. [Google Scholar] [CrossRef] [PubMed]
- El Akkad, S.; Issawi, B. Geology and Iron Ore Deposits of the Bahariya Oasis; Paper 18; Geological Survey: Egypt, Cairo, 1963; p. 300.
- Catuneanu, O.; Khalifa, M.A.; Wanas, H. Sequence stratigraphy of the lower cenomanian bahariya formation, bahariya oasis, western desert, Egypt. Sediment. Geol. 2006, 190, 121–137. [Google Scholar] [CrossRef]
- Plyusnina, E.E.; Sallam, E.S.; Ruban, D.A. Geological heritage of the Bahariya and Farafra oases, the central Western Desert, Egypt. J. Afr. Earth Sci. 2016, 116, 151–159. [Google Scholar] [CrossRef]
- Khalifa, M. Geological and Sedimentological Studies of El Hefhuf Area, Bahariya Oasis, Western Desert, Egypt. Master’s Thesis, Cairo University, Cairo, Egypt, 1977. [Google Scholar]
- Said, R. The Geology of Egypt; Elsevier Science Pub. Co.: Amsterdam, The Netherlands, 1962; Volume 377. [Google Scholar]
- Said, R.; Issawi, B. Geology of Northern Plateau, Bahariya Oasis, Egypt; Paper 29; Geological Survey of Egypt: Cairo, Egypt, 1964. [Google Scholar]
- Said, R. The Geology of Egypt; Routledge: London, UK, 2017. [Google Scholar]
- Hamdan, A.M.; Sawires, R.F. Hydrogeological studies on the Nubian sandstone aquifer in El-Bahariya oasis, Western Desert, Egypt. Arab. J. Geosci. 2013, 6, 1333–1347. [Google Scholar] [CrossRef]
- Sharaky, A.M.; Abdoun, S.H. Assessment of groundwater quality in Bahariya Oasis, Western Desert, Egypt. Environ. Earth Sci. 2020, 79, 145. [Google Scholar] [CrossRef]
- Rgional Strategy for the Utilization of the Nubian Sandstone Aquifer System; Hydrogeolgy; CEDARE: Cairo, Egypt, 2001; Volume II.
- Bakhbakhi, M. Nubian Sandstone Aquifer System, Non-Renewable Groundwater Resources: A Guidebook on Socially Sustainable Management for Water-Policy Makers; IHP-VI Series on Groundwater 10; United Nations Educational, Scientific and Cultural Organization: Paris, Frence, 2006; pp. 75–81. [Google Scholar]
- Schneider, M. Hydrogeologie des Nubischen Aquifersystems am Südrand des Dakhla-Beckens, Südägypten/Nordsudan; Reimer: Berlin, Germany, 1986. [Google Scholar]
- Hesse, K.-H.; Hissene, A.; Kheir, O.; Schnaecker, E.; Schneider, M.; Thorweihe, U. Hydrogeological Investigations in the Nubian aquifer System, Eastern Sahara; Dietrich Reimer: Berlin, Germany, 1987. [Google Scholar]
- Heinl, M.; Thorweihe, U. Groundwater resources and management in SW Egypt. Catena Suppl. 1993, 26, 99–121. [Google Scholar]
- Masoud, M.; El Osta, M. Evaluation of groundwater vulnerability in El-Bahariya Oasis, Western Desert, Egypt, using modelling and GIS techniques: A case study. J. Earth Syst. Sci. 2016, 125, 1139–1155. [Google Scholar] [CrossRef] [Green Version]
- El Kashouty, M.; Aziz, A.A.; Soliman, M.; Mesbah, H. Hydrogeophysical investigation of groundwater potential in the El Bawiti, Northern Bahariya Oasis, Western Desert, Egypt. Arab. J. Geosci. 2012, 5, 953–970. [Google Scholar] [CrossRef]
- Rabeh, T.; Bedair, S.; Abdel Zaher, M. Structural control of hydrogeological aquifers in the Bahariya Oasis, Western Desert, Egypt. Geosci. J. 2018, 22, 145–154. [Google Scholar] [CrossRef]
- Hermina, M. The surrounding of Kharga, Dakhle and Farafra. In Geology of Egypt; Balkema: Leiden, The Netherlands, 1990. [Google Scholar]
- Klitzsch, E.; Wycisk, P. Beckenentwicklung und Sedimentationsprozesse in Kratonalen Bereichen Nordost-Afrikas im Phanerozoikum, Nordost-Afrika: Strukturen und Ressourcen: Ergebnisse aus dem Sonderforschungsbereich “Geowissenschaftliche Probleme in Ariden und Semiariden Gebieten”; John Wiley & Sons, Inc.: Hoboken, NJ, USA, 1999; pp. 61–108. [Google Scholar]
- Korany, E. On the demonstration of the hydrogeological control by local geologic structures, Bahariya Oasis, Egypt. In Proceedings of the EGS 3rd Annual Meeting, El Bahariya Oasis, Egypt, 1984; pp. 335–341. [Google Scholar]
- El Hossary, M. Ensuring sustainable development via groundwater management (case study: El Bahariya Oasis). J. Am. Sci. 2013, 9, 6–13. [Google Scholar]
- Lopez-Ramon, M.V.; Stoeckli, F.; Moreno-Castilla, C.; Carrasco-Marin, F. On the characterization of acidic and basic surface sites on carbons by various techniques. Carbon 1999, 37, 1215–1221. [Google Scholar] [CrossRef]
- Langmuir, I. The adsorption of gases on plane surfaces of glass, mica and platinum. J. Am. Chem. Soc. 1918, 40, 1361–1402. [Google Scholar] [CrossRef] [Green Version]
- Freundlich, H.M.F. Uber die adsorption in lasungen. Z. Phys. Chem. 1906, 57, 385–470. [Google Scholar]


| Sorbent | C | N | H | O | S |
|---|---|---|---|---|---|
| CH: (%) | 46.75 | 4.75 | 7.02 | 41.48 | 0 |
| CH: mmol | 38.923 | 3.3914 | 69.65 | 25.927 | 0 |
| CH-AS: (%) | 42.85 | 6.04 | 6.55 | 42.28 | 2.28 |
| CH-AS: mmol | 35.676 | 4.312 | 64.987 | 26.427 | 0.7112 |
| Assignment | CH | CH-AS | CH-AS+Fe | CH-AS 5th Cycles | Ref. |
|---|---|---|---|---|---|
| N-H and OH str. | 3413 | 3459 | 3428 | 3448 | [63,64] |
| Aromatic CH str. | 3068 | 3073 | 3063 | ||
| Aliphatic C-H str. | 2919, 2848 | 2924, 2860 | 2917, 2851 | 2926, 2860 | [65,66] |
| Comb. aromatic bands (sh.) | 1721 | 1716 | 1720 | [66] | |
| C=O C=C(aromatic) and C=N str. N-H bend and open-chain azo (-N=N-) | 1619 | 1655 | 1653 | 1657 | [63,64,67] |
| C-N/C-C str., and CH2 bend | 1423 | 1423 | 1395 | 1447 | [63,64,68,69,70] |
| Secondary amine | 1382 | 1383 | 1382 | [66] | |
| C-O-C asymm./C-O str. and NH2 rock. | 1024 | 1070 | 1069 | 1062 | [71] |
| Aromatic C-H bend (in-plane) | [63] | ||||
| NH2/CO wag. Out-of-phase | 795 | 794 | 792 | [63,66] | |
| N-C-N in-plane bending | 686 | 677 | 680 | [68,69] | |
| O- H bend out-of-plane, C-H (def.), and -S-O (str.) | 588 | 618 | 618 | [66] | |
| C-S (str.) | 458 | 464 | 462 | 456 | [72,73] |
| Visible Light (L) | Ultra Violet | ||||||
|---|---|---|---|---|---|---|---|
| Model | Parameter | #1 | #2 | #3 | #1 | #2 | #3 |
| Exp. | qeq (mmol Fe g−1) | 2.69 | 2.71 | 2.78 | 3.12 | 3.06 | 3.14 |
| PFORE | qeq,1 (mmol Fe g−1) | 2.65 | 2.77 | 2.81 | 3.16 | 2.99 | 3.11 |
| k1 × 102 (min−1) | 2.18 | 2.11 | 3.92 | 5.93 | 6.72 | 6.92 | |
| R2 | 0.983 | 0.988 | 0.989 | 0.992 | 0.989 | 0.991 | |
| AIC | −98.77 | −78.9 | −101.1 | −104.5 | −95.8 | −112.3 | |
| PSORE | qeq,2 (mmol Fe g−1) | 1.87 | 2.48 | 2.22 | 2.37 | 2.61 | 2.69 |
| k2 × 102 (L mmol−1 min−1) | 3.87 | 2.96 | 1.99 | 9.85 | 12.4 | 15.8 | |
| R2 | 0.795 | 0.801 | 0.881 | 0.816 | 0.875 | 0.881 | |
| AIC | −21.1 | −36.55 | −41.43 | −76.3 | −73.2 | −58.6 | |
| RIDE | De × 108 (m2 min−1) | 1.11 | 2.18 | 1.65 | 1.75 | 1.16 | 1.59 |
| R2 | 0.899 | 0.917 | 0.879 | 0.942 | 0.939 | 0.967 | |
| AIC | −65.44 | 36.4 | −33.2 | −92.9 | −98.0 | −101.4 | |
| Model | Parameter | 1 | 2 | 3 | 1 | 2 | 3 | |
|---|---|---|---|---|---|---|---|---|
| Experimental | qm,exp. | mmolFeg−1 | 4.773 | 4.528 | 4.352 | 5.04 | 5.32 | 4.99 |
| Langmuir | qm,L | mmol Fe g−1 | 4.711 | 4.498 | 4.361 | 4.98 | 5.27 | 5.04 |
| bL | L mmol−1 | 1.97 | 1.53 | 1.68 | 2.65 | 3.11 | 2.95 | |
| R2 | - | 0.963 | 0.954 | 0.971 | 0.994 | 0.982 | 0.988 | |
| AIC | - | −154.5 | −148.5 | −166.9 | −132.5 | −171.4 | −147.3 | |
| Freundlich | kF | mmol1−1/n g−1 L1/n | 0.60 | 0.75 | 0.89 | 0.81 | 0.62 | 0.72 |
| nF | - | 2.18 | 2.22 | 2.16 | 1.87 | 2.55 | 3.01 | |
| R2 | - | 0.901 | 0.895 | 0.883 | 0.836 | 0.799 | 0.816 | |
| AIC | - | −38.6 | −42.1 | −48.3 | −21.1 | −36.5 | −32.2 | |
| Sips | qm,S | mmol Fe g−1 | 4.75 | 4.541 | 4.366 | 5.17 | 5.41 | 5.04 |
| bS | L mmol−1 | 0.89 | 0.91 | 0.94 | 0.989 | 0.982 | 0.981 | |
| nS | - | 1.53 | 1.64 | 1.12 | 2.18 | 2.11 | 1.84 | |
| R2 | - | 0.998 | 0.960 | 0.988 | 0.994 | 0.981 | 0.993 | |
| AIC | - | −132 | −144 | −135 | −122.1 | −154.3 | −137.2 |
| Sorbent | Temperature | pH | q mmol g−1 | Reference |
|---|---|---|---|---|
| 5-IOW | 25 | 4.0 | 0.155 | [82] |
| 14-IOW | 25 | 4.0 | 0.116 | [82] |
| Modified Mg-Al Layered double hydroxide | 25 | 6.7 | 0.162 | [83] |
| Spherical mesoporous silica (MCM-14) | 25 | 7.0 | 0.031 | [84] |
| Reference Clay-biochar composite 298 6.1 | 25 | 6.1 | 0.0899 | [85] |
| SiO2-G1.0 | 25 | 4.0 | 0.45 | [62] |
| SiO2-G2.2 | 25 | 4.0 | 0.62 | [62] |
| SiO2-G2.4 | 25 | 6.5 | 0.4 | [62] |
| (acrylonitrile-co-acroleic acid-co-diaminopyridine) Nanofibrous film chemosensor | 25 | 4.0 | 0.249 | [86] |
| Silica gel-based sorbent (SiO2@Nap) | 25 | 4.0 | 1.414 | [87] |
| TiO2-banana cluster | 25 | 4.0 | 2.686 | [88] |
| CHI:L | 22 (±1) | 3.0 | 1.6 | This work |
| CHI:UV | 22 (±1) | 3.0 | 2.1 | This work |
| CH-AS:L | 22 (±1) | 3.0 | 4.551 | This work |
| CH-AS:UV | 22 (±1) | 3.0 | 5.117 | This work |
| Metal Ion | Fe(III) | ||
|---|---|---|---|
| Cycle | Av./St. D | SE | DE |
| 1 | Av. | 81.6 | 100 |
| St. D. | 0.65 | 0.34 | |
| 2 | Av. | 81.4 | 100 |
| St. D. | 0.34 | 0.42 | |
| 3 | Av. | 80.95 | 100 |
| St. D. | 0.25 | 0.37 | |
| 4 | Av. | 80.15 | 100 |
| St. D. | 0.33 | 0.51 | |
| 5 | Av. | 79.8 | 99.9 |
| St. D. | 0.23 | 0.22 | |
Publisher’s Note: MDPI stays neutral with regard to jurisdictional claims in published maps and institutional affiliations. |
© 2022 by the authors. Licensee MDPI, Basel, Switzerland. This article is an open access article distributed under the terms and conditions of the Creative Commons Attribution (CC BY) license (https://creativecommons.org/licenses/by/4.0/).
Share and Cite
Hamza, M.F.; Alotaibi, S.H.; Wei, Y.; Mashaal, N.M. High-Performance Hydrogel Based on Modified Chitosan for Removal of Heavy Metal Ions in Borehole: A Case Study from the Bahariya Oasis, Egypt. Catalysts 2022, 12, 721. https://doi.org/10.3390/catal12070721
Hamza MF, Alotaibi SH, Wei Y, Mashaal NM. High-Performance Hydrogel Based on Modified Chitosan for Removal of Heavy Metal Ions in Borehole: A Case Study from the Bahariya Oasis, Egypt. Catalysts. 2022; 12(7):721. https://doi.org/10.3390/catal12070721
Chicago/Turabian StyleHamza, Mohammed F., Saad H. Alotaibi, Yuezhou Wei, and Noha M. Mashaal. 2022. "High-Performance Hydrogel Based on Modified Chitosan for Removal of Heavy Metal Ions in Borehole: A Case Study from the Bahariya Oasis, Egypt" Catalysts 12, no. 7: 721. https://doi.org/10.3390/catal12070721