Article

Rice Straw as Green Waste in a HTiO2@AC/SiO2 Nanocomposite Synthesized as an Adsorbent and Photocatalytic Material for Chlorpyrifos Removal from Aqueous Solution

by
Abeer El Shahawy
1,*,
Saedah R. Al-Mhyawi
2,
Mahmoud F. Mubarak
3,*,
Abdullah E. Mousa
4 and
Ahmed H. Ragab
5
1
Department of Civil Engineering, Faculty of Engineering, Suez Canal University, Ismailia 41522, Egypt
2
Department of Chemistry, College of Science, University of Jeddah, Jeddah 21419, Saudi Arabia
3
Petroleum Applications Department, Egyptian Petroleum Research Institute (EPRI), Nasr City, Cairo 11727, Egypt
4
Civil Engineering Department, Faculty of Engineering, Suez Canal University, Ismailia 41522, Egypt
5
Department of Chemistry, Faculty of Science, King Khalid University, Abha 62224, Saudi Arabia
*
Authors to whom correspondence should be addressed.
Catalysts 2022, 12(7), 714; https://doi.org/10.3390/catal12070714
Submission received: 27 April 2022 / Revised: 14 June 2022 / Accepted: 27 June 2022 / Published: 29 June 2022
(This article belongs to the Special Issue Catalysis for the Removal of Water Pollutants)

Abstract

:
A nano-HTiO2@activated carbon-amorphous silica nanocomposite catalyst (HTiO2@AC/SiO2) is utilized to photo breakdown catalytically and adsorb chlorpyrifos insecticide. SEM, TEM, and X-ray diffraction were used to examine HTiO2@AC/SiO2, synthesized through sol–gel synthesis. With an average size of 7–9 nm, the crystallized form of HTiO2 is the most common form found. At varied pH, catalyst doses, agitation speed, initial pesticide concentrations, contact periods, and temperatures, HTiO2@AC/SiO2 was examined for efficiency under visible light and in darkness. Because of the pseudo-second-order kinetics observed for chlorpyrifos, chemisorption is believed to dominate the adsorption process, as indicated by an estimated activation energy of 182.769 kJ/mol, which indicates that chemisorption dominates the adsorption process in this study. The maximal adsorption capacity of chlorpyrifos is 462.6 mg g−1, according to the Langmuir isotherms, which infer this value. When exposed to visible light, the adsorption capacity of HTiO2@AC/SiO2 increased somewhat as the temperature rose (283 k 323 k 373 k), indicating an exothermic change in Gibbs free energy during the process (−1.8 kJ/mol), enthalpy change (−6.02 kJ/mol), and entropy change (0.014 J/mol K), respectively, at 298.15 K. Negative (ΔS) describes a process with decreased unpredictability and suggests spontaneous adsorption. HTiO2@AC/SiO2 may be a promising material.

1. Introduction

When there is a growing need for food, agrochemicals, such as pesticides, are used in larger quantities. As a result, pesticides play an essential role in modern agriculture, as they control pests and weed infestations [1,2]. Findings from several studies reveal that chlorinated hydrocarbon pesticide residue can still be discovered in a wide range of environmental compartments, albeit at lower concentrations, decades after their widespread use. Across the globe, in surface water bodies, pesticides have been identified [3], causing harm [4] and a great deal of concern [5]. For the most part, pesticides are introduced into surface water bodies via non-point sources, but wastewater can also include significant concentrations of the chemicals [6,7]. Therefore, efficiently eliminating pesticides, including wastewater, is a major problem for society. Over 20% of pesticides reach non-target species—air, water, and soil. Traces of these products are found in surface water and groundwater, a major source of drinking water. Many different kinds of pesticides and their byproducts are found in water, which worries the public and authorities because exposure to pesticides, even in small amounts, can cause health problems. Pesticide abuse can harm human health. Pesticides are biologically active substances that affect organisms and vary in toxicity. These compounds bioaccumulate in living organisms. Pesticide toxicity is acute or chronic. The acute illness usually occurs quickly after a pesticide’s short contact time. Small doses of some pesticides may cause birth defects, fetus toxicity, genetic changes, and blood and nerve disorders. Several studies have also shown that people exposed to pesticides are more likely to get chronic diseases that affect the nervous, reproductive, renal, cardiovascular, and respiratory systems [2].
Advanced oxidation processes (AOPs) [7,8,9] and other methods have successfully removed organic pollutants, including pesticides, from water. An AOP that has been intensively studied for pesticide removal is photocatalysis [7]. Photocatalysis is a process of converting solar energy into chemical energy; it is a green, energy-saving, and environmentally friendly process. Many different photocatalysts have been developed, such as metal chalcogenides, metal oxides, and perovskite nanocrystals. In contrast, metal oxides, such as TiO2, are extremely suitable for the AOP process due to their high activities and low toxicity [8]. Photocatalytic materials based on titanium dioxide (TiO2) and doped complexes have been developed [9]. UV light drives electrons to the conduction band, whereas electron holes (h+) remain in the valence band. When these electron holes come into contact with water molecules or hydroxyl groups on the TiO2 surface, hydroxyl radicals (OH) are formed, which start the photodegradation of organic pollutants and the generation of hydroxyl radicals. O2−•, which can then react with protons (H+) to form hydroxyl radicals [10,11], is also produced by excited electrons reacting with oxygen molecules. Titanium dioxide can be applied as a suspension [5] or bound to surfaces, such as membranes, carbon nanotube arrays, and graphene oxide nanosheets [7,8], during wastewater treatment. It does not matter how much surface area the solution has; a porous media like a polymer membrane can increase the overall surface area [9,10]. The crystalline structure strongly influences TiO2 photocatalytic activity in addition to the surface area [10,11].
Amorphous TiO2 has no photoactive properties [11]. Despite having a higher bandgap (3.2 eV for anatase vs. 3.0 eV for rutile) [12,13], compared to rutile, anatase in its crystalline form works better as a photocatalyst. Various techniques enhance the photocatalytic response, including TiO2 doping, metal coatings, surface sensitization, and support (immobilization by increasing the illuminated specific catalyst area [14]). Adsorbents, such as silica, alumina, zeolite, or activated carbon [13], have also been tested. AC can absorb pollutants on its own. While the pollutants may be adsorbed on the surface of the TiO2 before decomposing, titanium performs the adsorption process on the surface before the degradation process. Then, the degradation process occurs after the pollutants.
Previous research has shown that recovering and recycling catalysts (adsorbent) in nano-sized titania powders is difficult, making large-scale deployment troublesome. In contrast, cropping structures on activated carbon block organic pollutant diffusion to the catalyst surface and HTiO2 can plug the pore structure [13,14].
Immobilizing photoactive powder on various surfaces has garnered considerable attention [15]. For our investigation, our HTiO2@AC/SiO2 composite exhibits the following properties:
  • In the presence of light, it is nontoxic, photo stable, low cost, and exceedingly effective.
  • Many researchers now focus on the photodegradation of organic pollutants via titanium oxide immobilization on carbon supports. One of the titanium oxide components is employed as a matrix.
  • The synergistic effect of active carbon degradation rates on HTiO2’s catalytic capabilities extends much beyond mere synergy.
  • Adsorption between the catalyst and substrate is made easier with HTiO2@AC/porous SiO2’s support and incorporation of amorphous silica. Both are present in the AC as HTiO2 active centers do not disperse photogenerated oxidizing species (•O.H.); the interface between the catalyst and the water is where the majority of the catalytic reaction occurs.
  • To reduce secondary pollution, we believe that the HTiO2@AC/SiO2 can absorb and/or further oxidize the intermediates generated during degradation [16]. For the most effective treatment of textile waste, activated carbon (AC) should have a high specific surface area and high porosity [17].
The sol–gel approach was used to develop a composite catalyst containing nano-sized HTiO2 and activated carbon, HTiO2@AC/SiO2, capable of reducing pesticide loads in water. Chlorpyrifos (Pestban 48 percent) C9H11Cl3NO3PS (O, O-Diethyl O-(3,5,6-trichloropyridin-2-yl) phosphorothioate) adsorption and photodegradation were studied in darkness and sunlight. It was decided to utilize chlorpyrifos as a model pesticide since it can be used to control nematodes in a wide range of crops [18], including fruits and vegetables, and soya beans and potatoes. The removal efficacy of chlorpyrifos by HTiO2@AC/SiO2 was tested at various pH levels, HTiO2@AC/SiO2 doses, pollutant concentrations, velocities, temperatures, and contact times. Analytical techniques, such as scanning electron microscopy (SEM), transmission electron microscopy (TEM), and an X-ray diffractometer (XRD), were employed to assess the composite catalyst further. The study will compare the adsorption isotherm and kinetic rate of chlorpyrifos breakdown with theoretical models (e.g., pseudo-first- and -second-order kinetics). In the end, new insights into the potential and appropriateness of HTiO2@AC/SiO2 to lower pesticide loads in water and, eventually, wastewater were developed, resulting in a future study.

2. Results and Discussion

2.1. Description of Materials
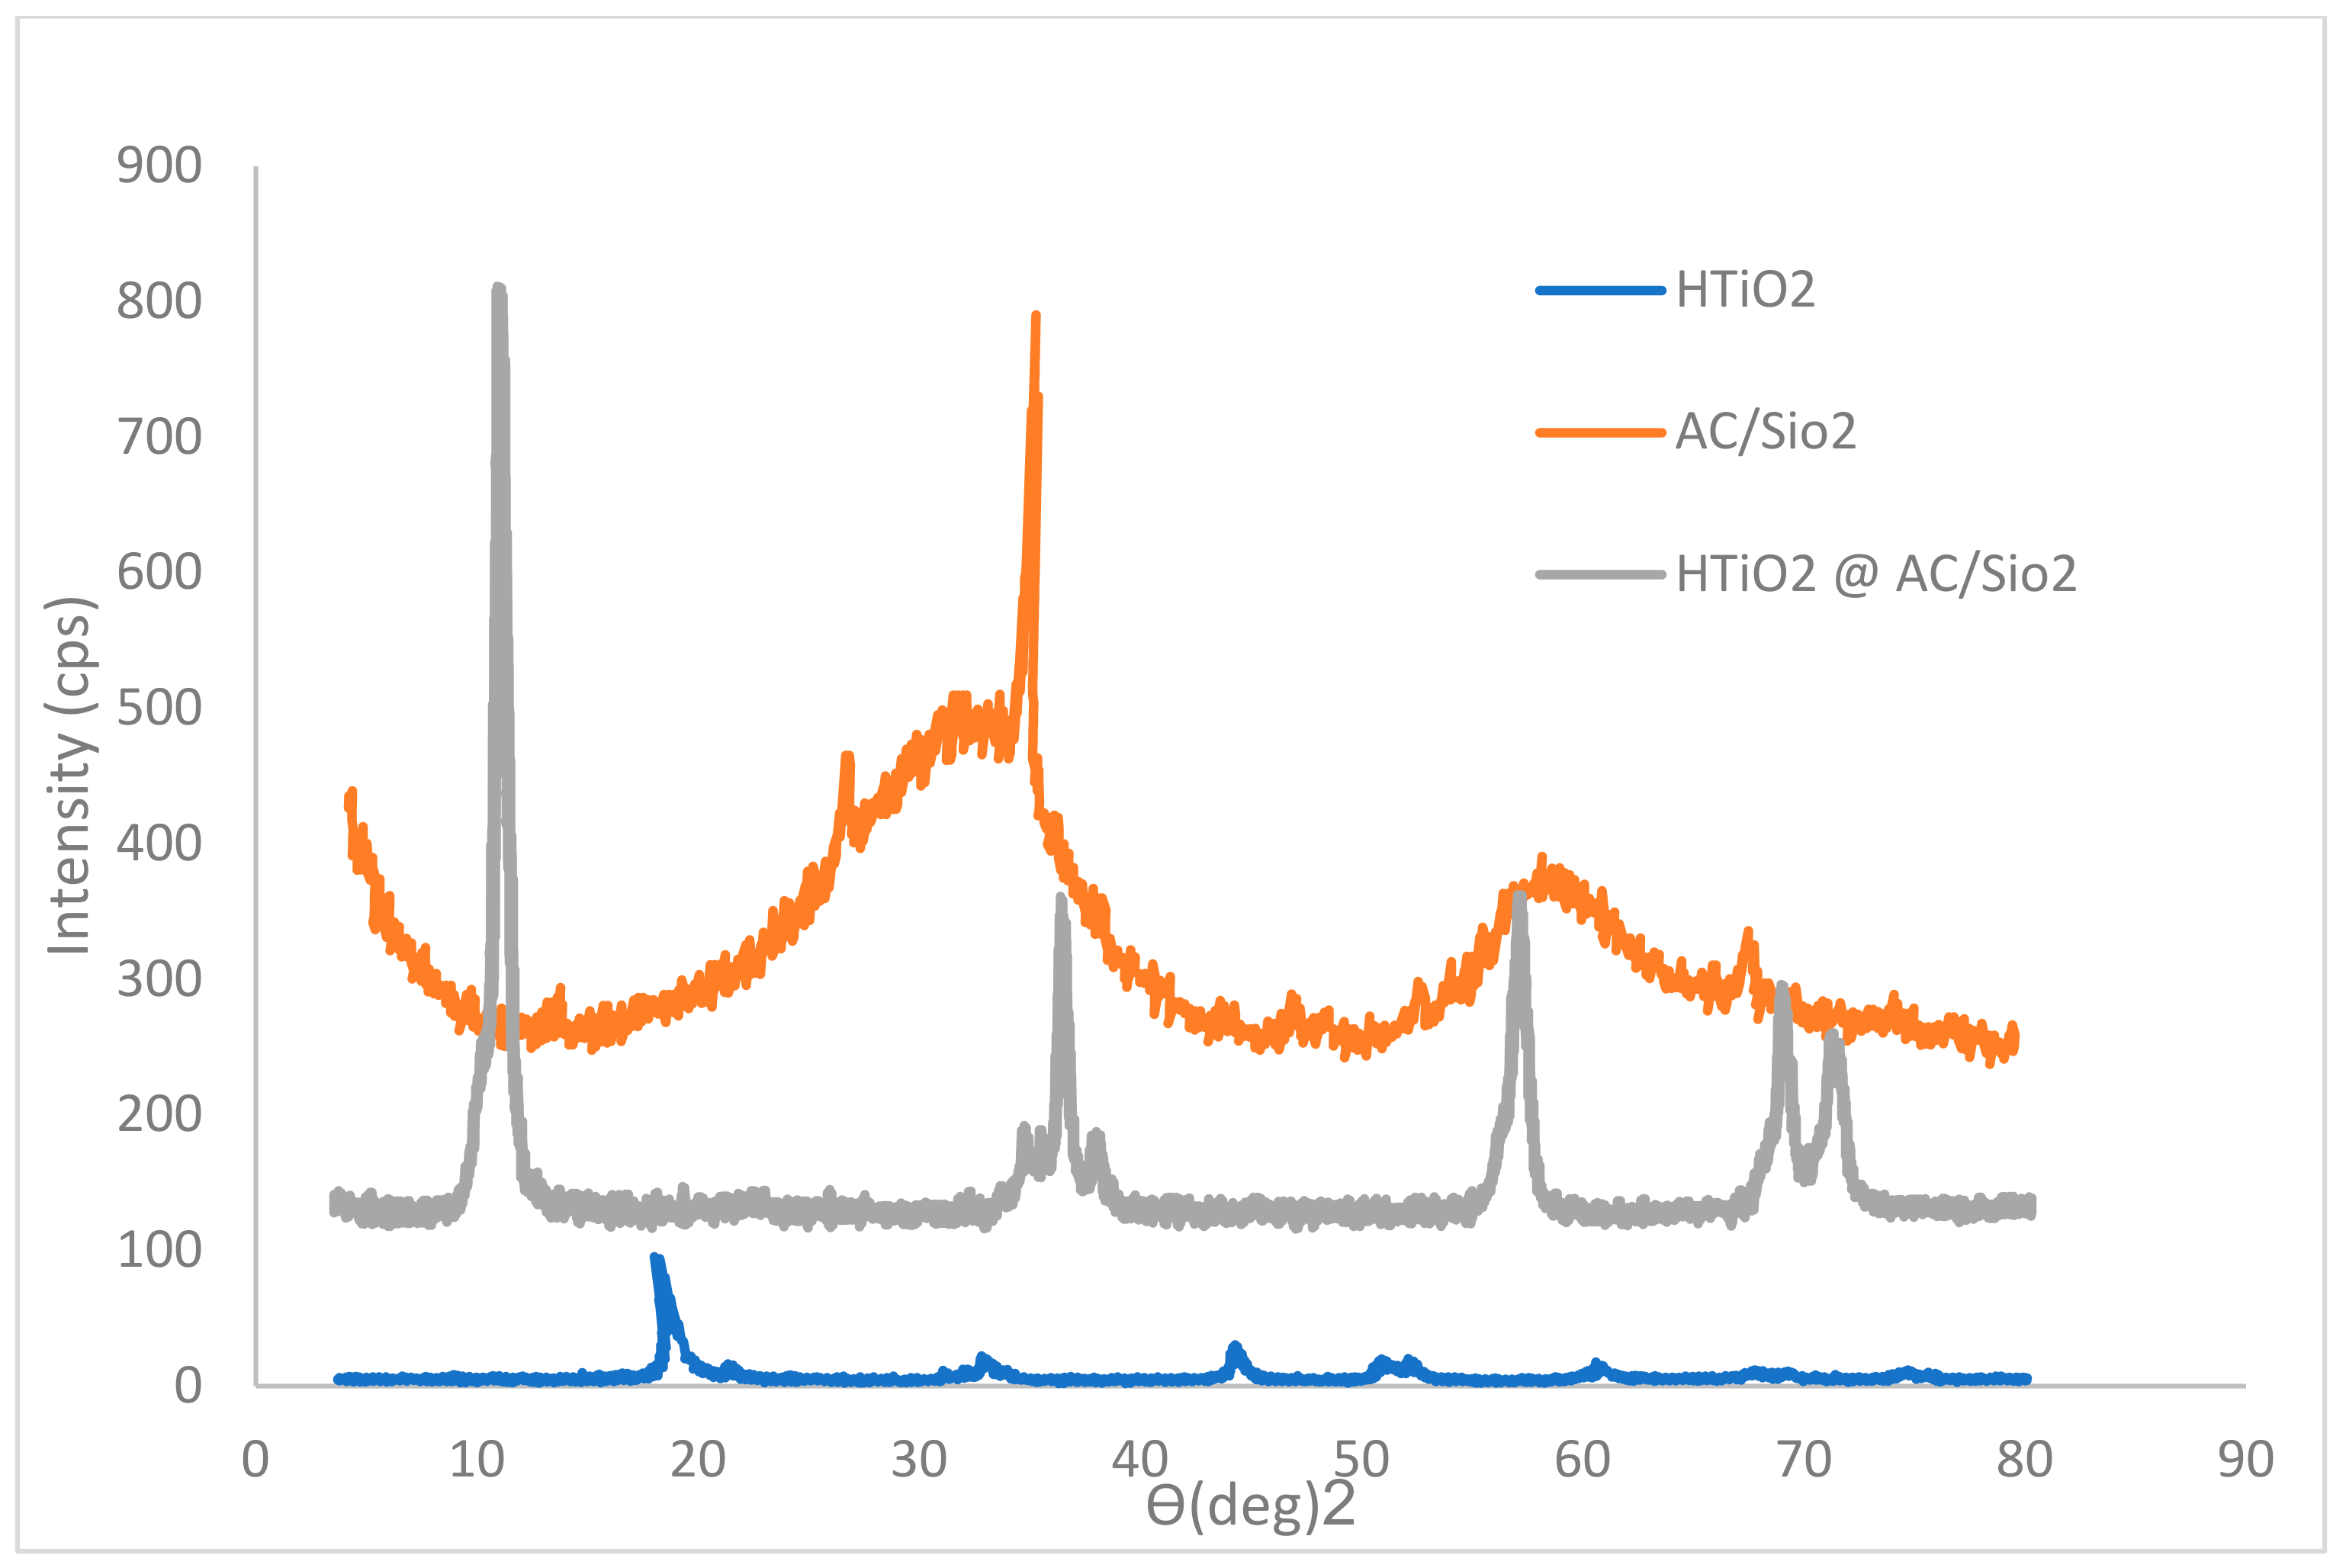
2.1.1. XRD

Figure 1 shows the XRD traces of AC/SiO2, HTiO2, and HTiO2@AC/SiO2. Nanocrystalline anatase was the only phase in the TiO2 and HTiO2@AC/SiO2 composites (TiO2). The (101) plane, at 13.2°, was discovered to be the highest point. This was due to the 500 °C heat treatment, which is notorious for producing large quantities of anatase. Because HTiO2 works better as a photocatalyst, it was calcinated at 500 °C. It has a longer lifetime for electron-hole pairs than rutile and anatase. On the other hand, the presence of AC may affect phase transformation. The AC sample’s primary characteristic peaks in the XRD pattern are 26.8° and 35.02°. The peak intensity of HTiO2@AC/SiO2 composites gradually decreased as the AC increased.
The hydrated TiO2 crystal structure considerably impacted the HTiO2@AC/SiO2 nanocomposite crystal structure, affecting the photodegradation properties of HTiO2@AC/SiO2.
According to Scherrer’s Equation and Equations, the crystalline diameters of synthesized materials were in the 5–10 nm range (1) (Refer to Supplementary Materials):
D = K λ β cos θ
Because its diffraction peaks were wide and flat and its diffraction intensity was low compared to other phases, hydrated TiO2 often had low-crystallinity anatase phases.

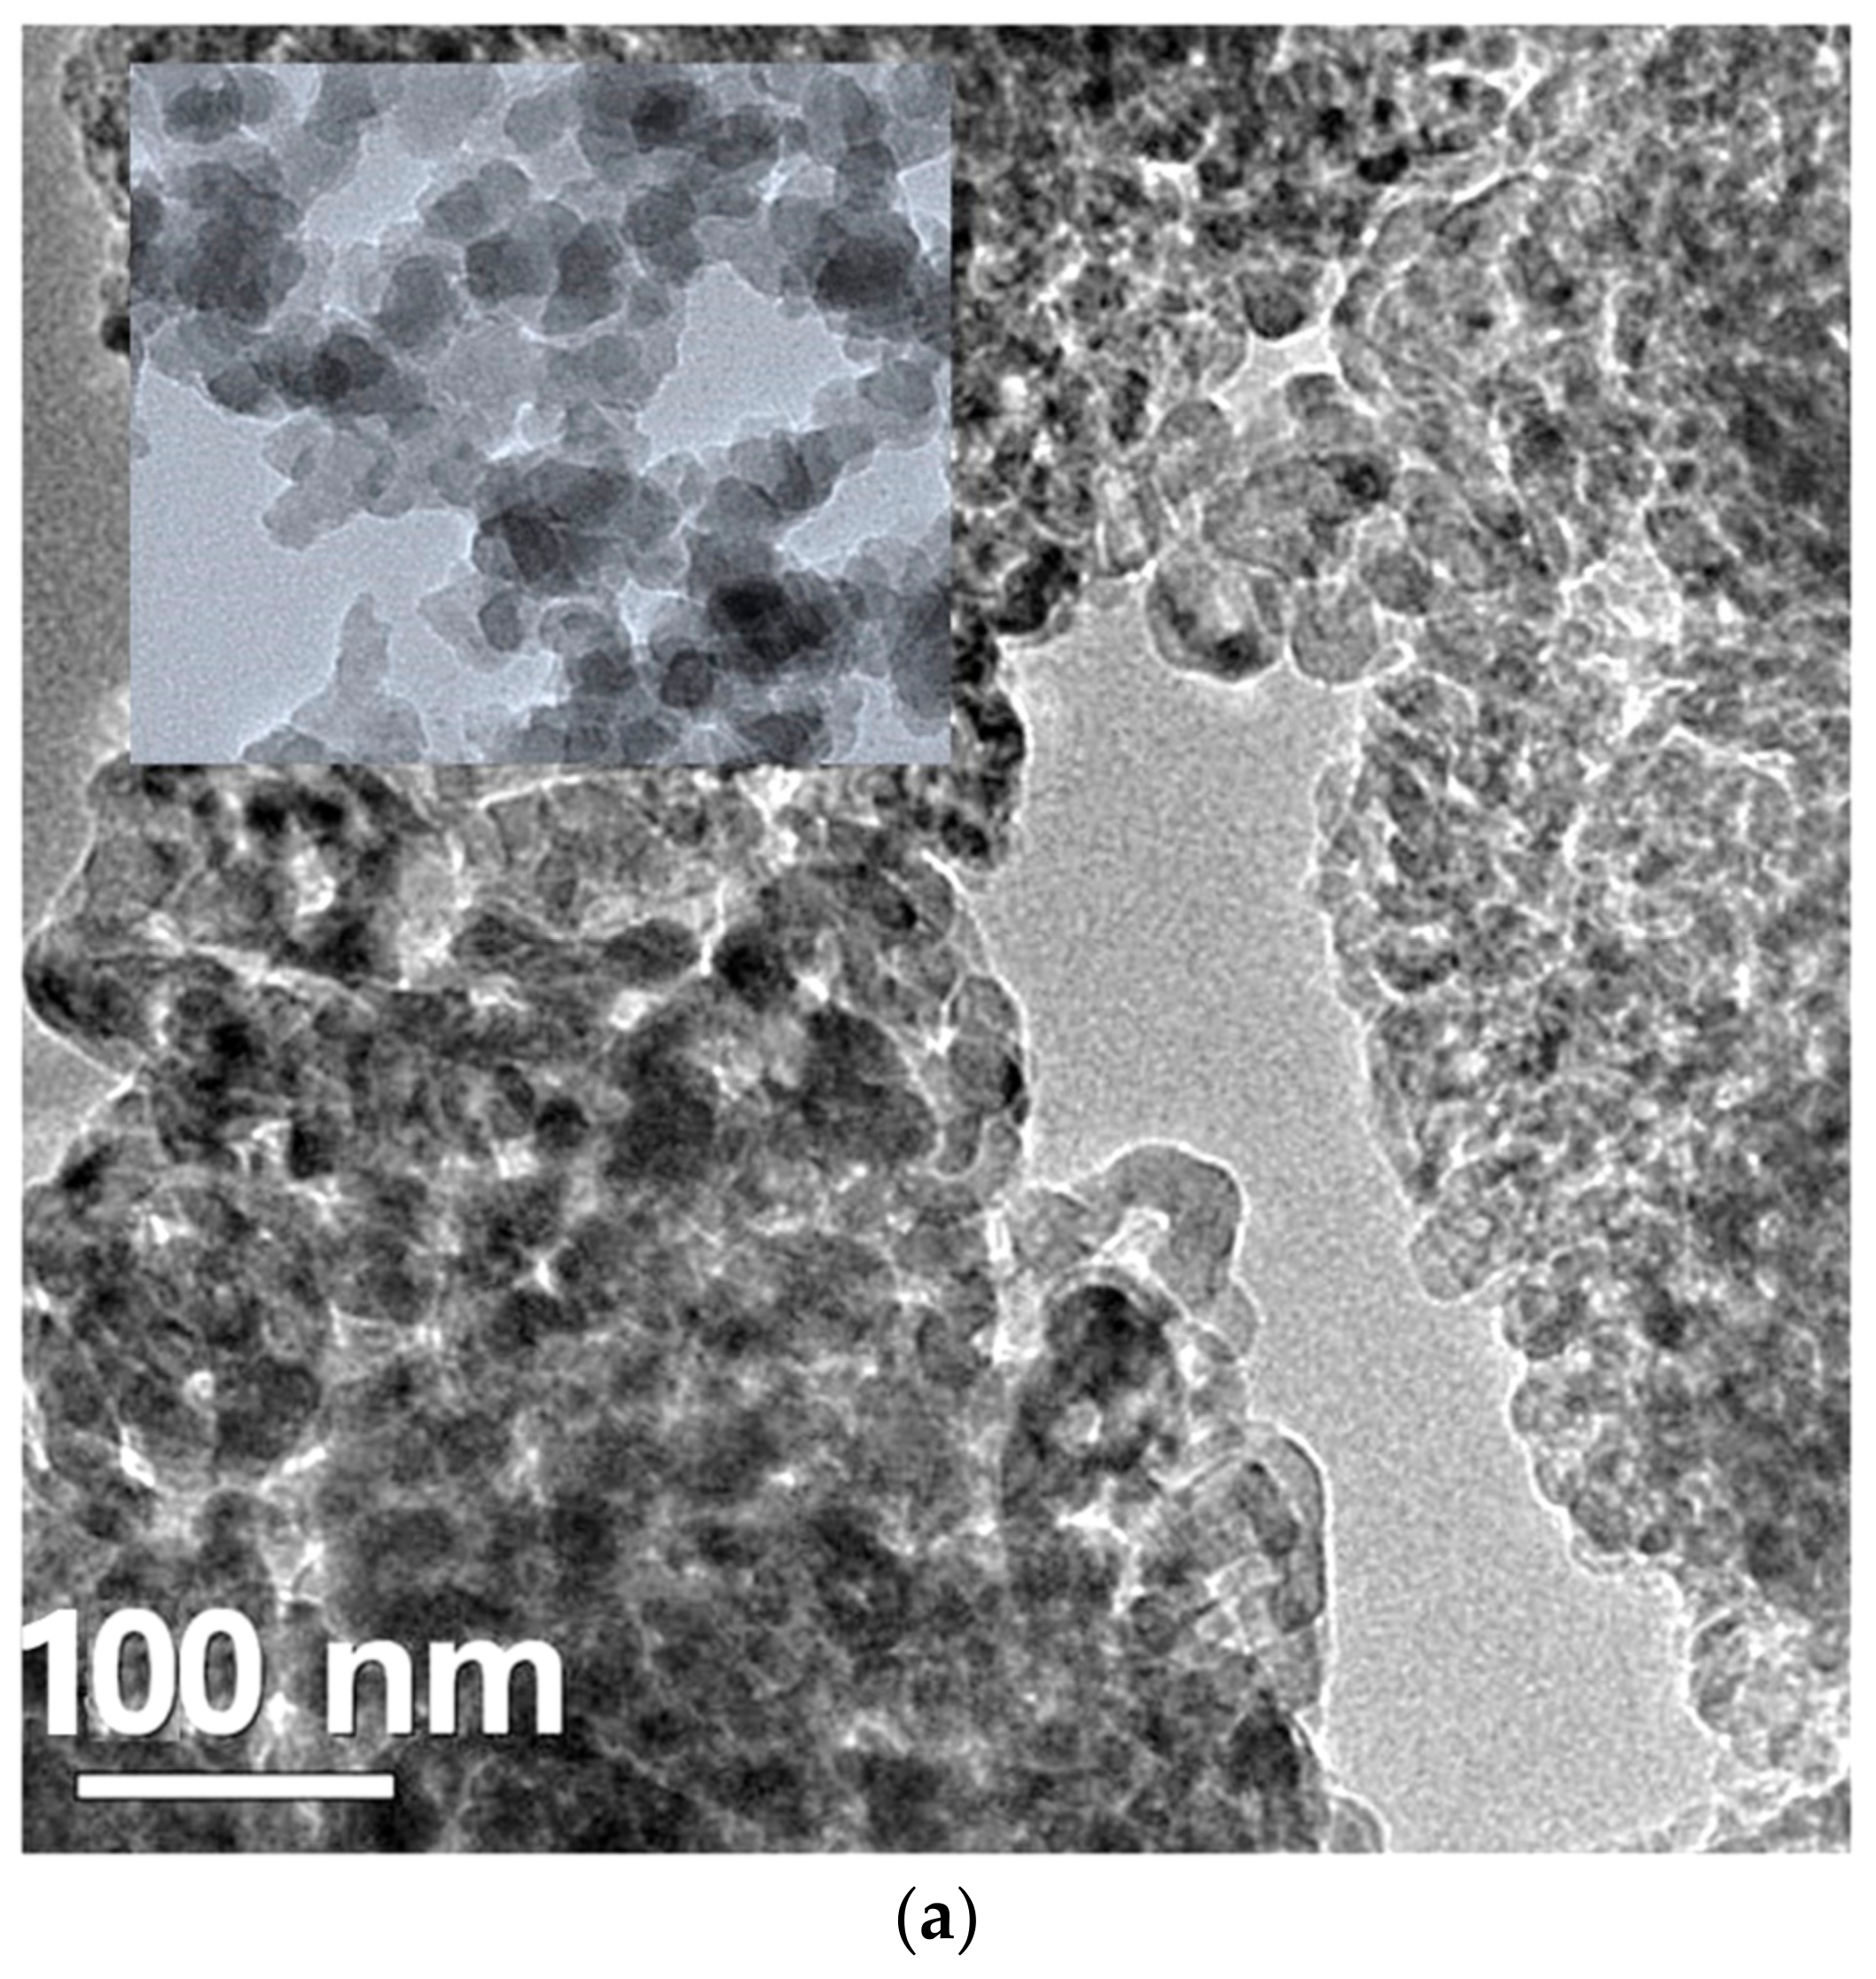
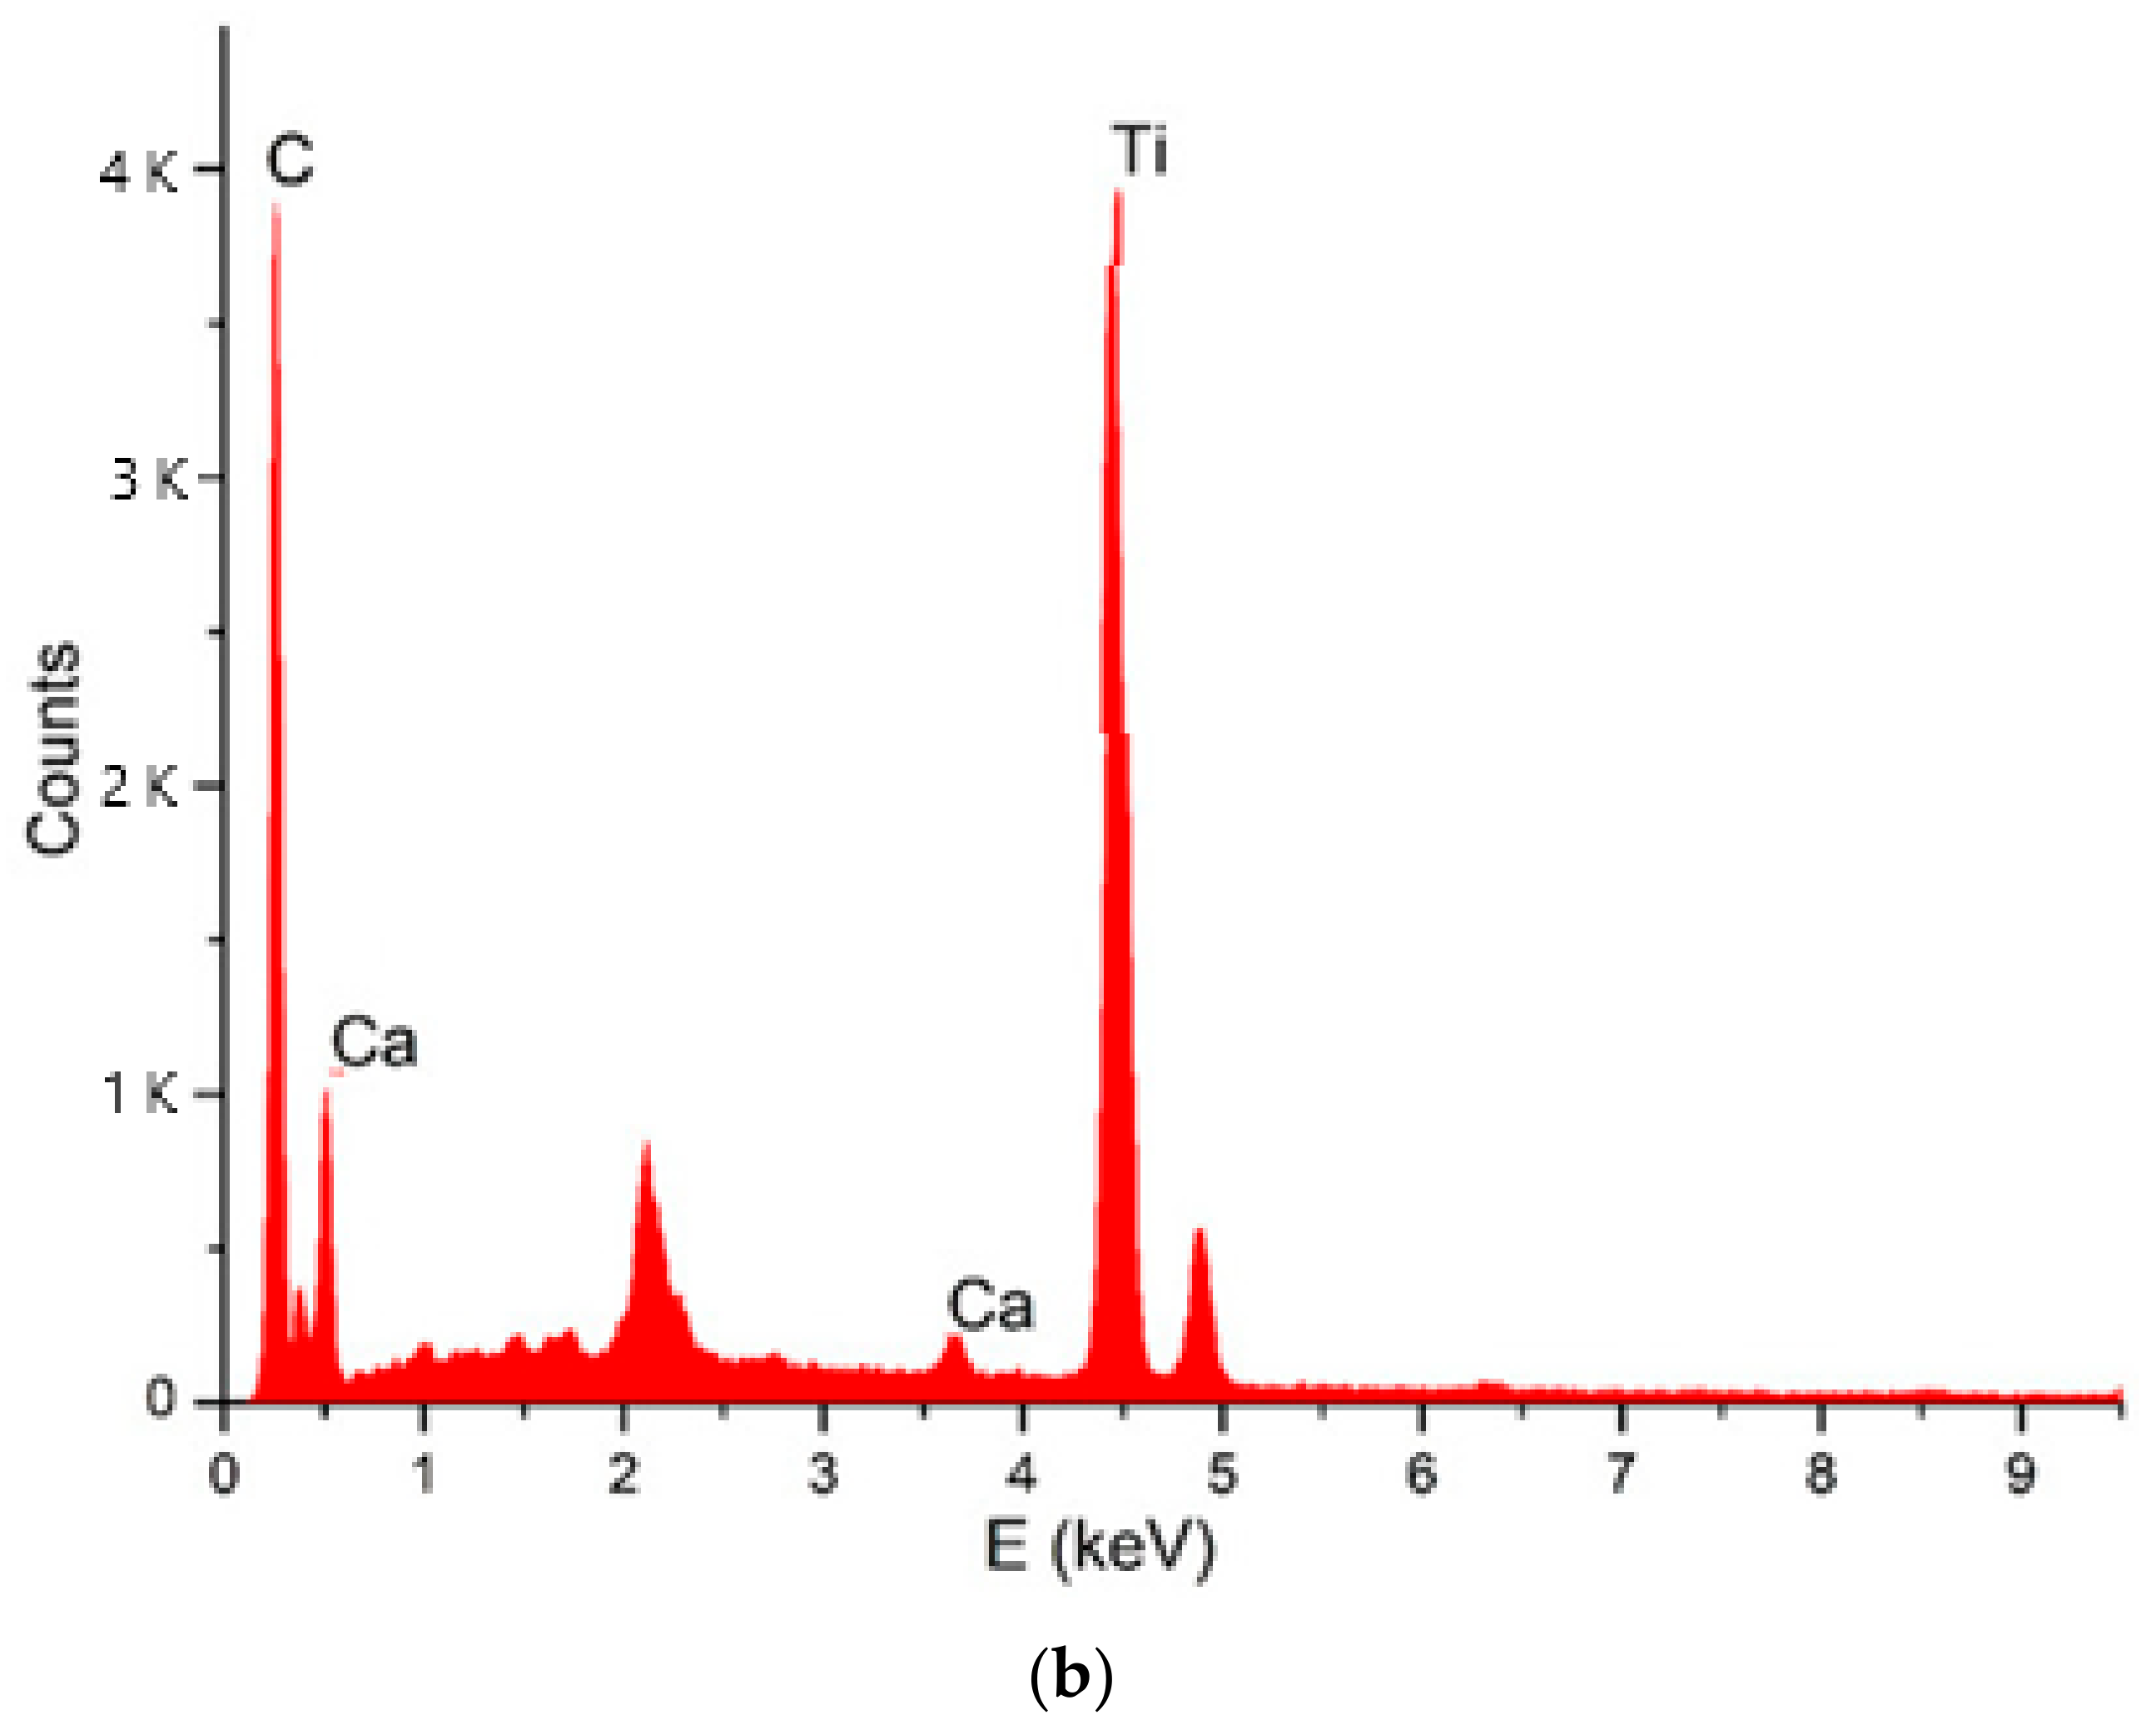
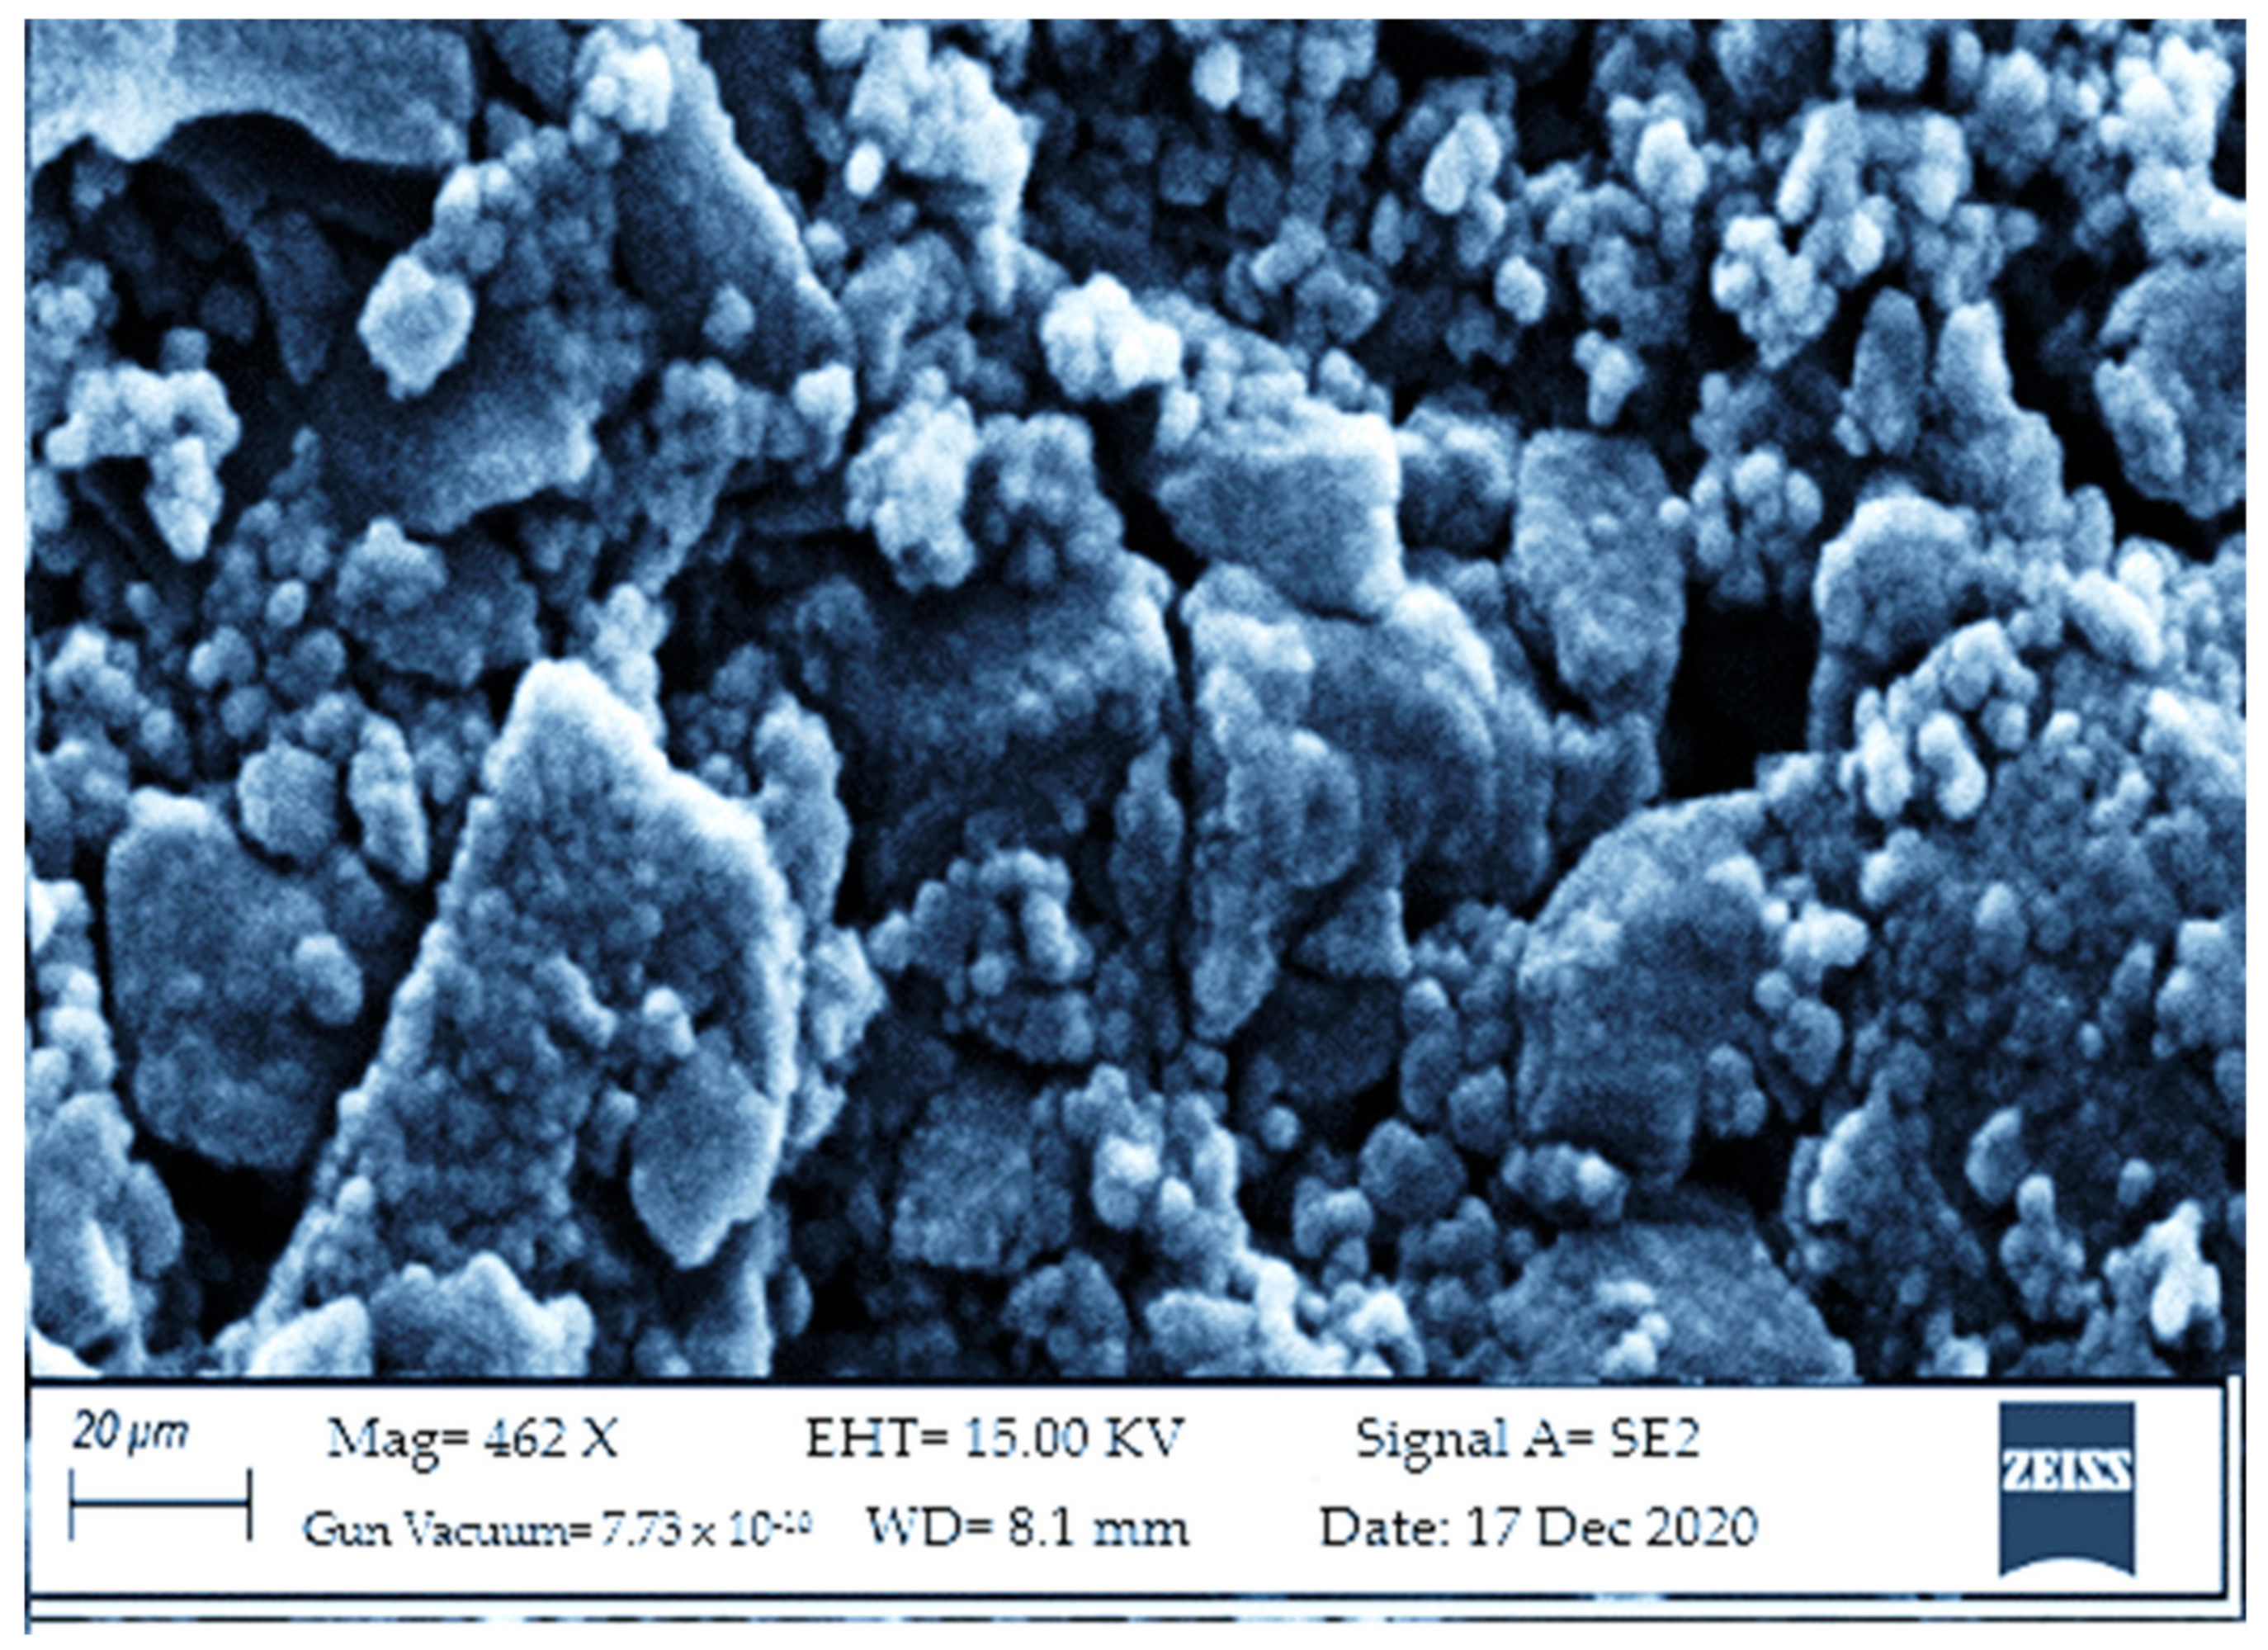
2.1.2. Nanocomposite Morphology

A TEM picture reveals how HTiO2 particles are anchored to the surface of AC (Figure 2a). There was a distinction in the characteristics of HTiO2 crystals and amorphous carbon. Particle homogeneity was excellent. The particle size test findings indicated that the average size was around 40 nm. The size of HTiO2@AC/SiO2 was variable, which could be due to the TiOSO4 solution’s slow hydrolysis rate and uneven hydrolysis process. Photodegradation performance could be improved by improving particle shape and particle size distribution.
The area designated by the white circle in Figure 2b’s point EDX spectrum is shown. The occurrence of C–, O–, F–, and Ti– EDX peaks simultaneously backs up XRD and TEM studies on HTiO2 doping of AC.
The HTiO2 nanocrystals (Figure 2) had a tetragonal shape. An anatase structure is defined by particles with a 20–35 nm diameter. TEM determined particle sizes that were comparable to those determined by XRD. Furthermore, all HTiO2@AC/SiO2 composites were similar to HTiO2 due to the same preparation conditions.
The surface morphology of the HTiO2@AC/SiO2 composite was described using SEM (Figure 3). It was possible to visualize the porous surface of activated carbon. The HTiO2 nanoparticles were equally dispersed and interlaced on the activated carbon surface. Due to the considerable synthesis of early hydration products, other activated carbon structures appear to have a denser and more packed structure than this [19].

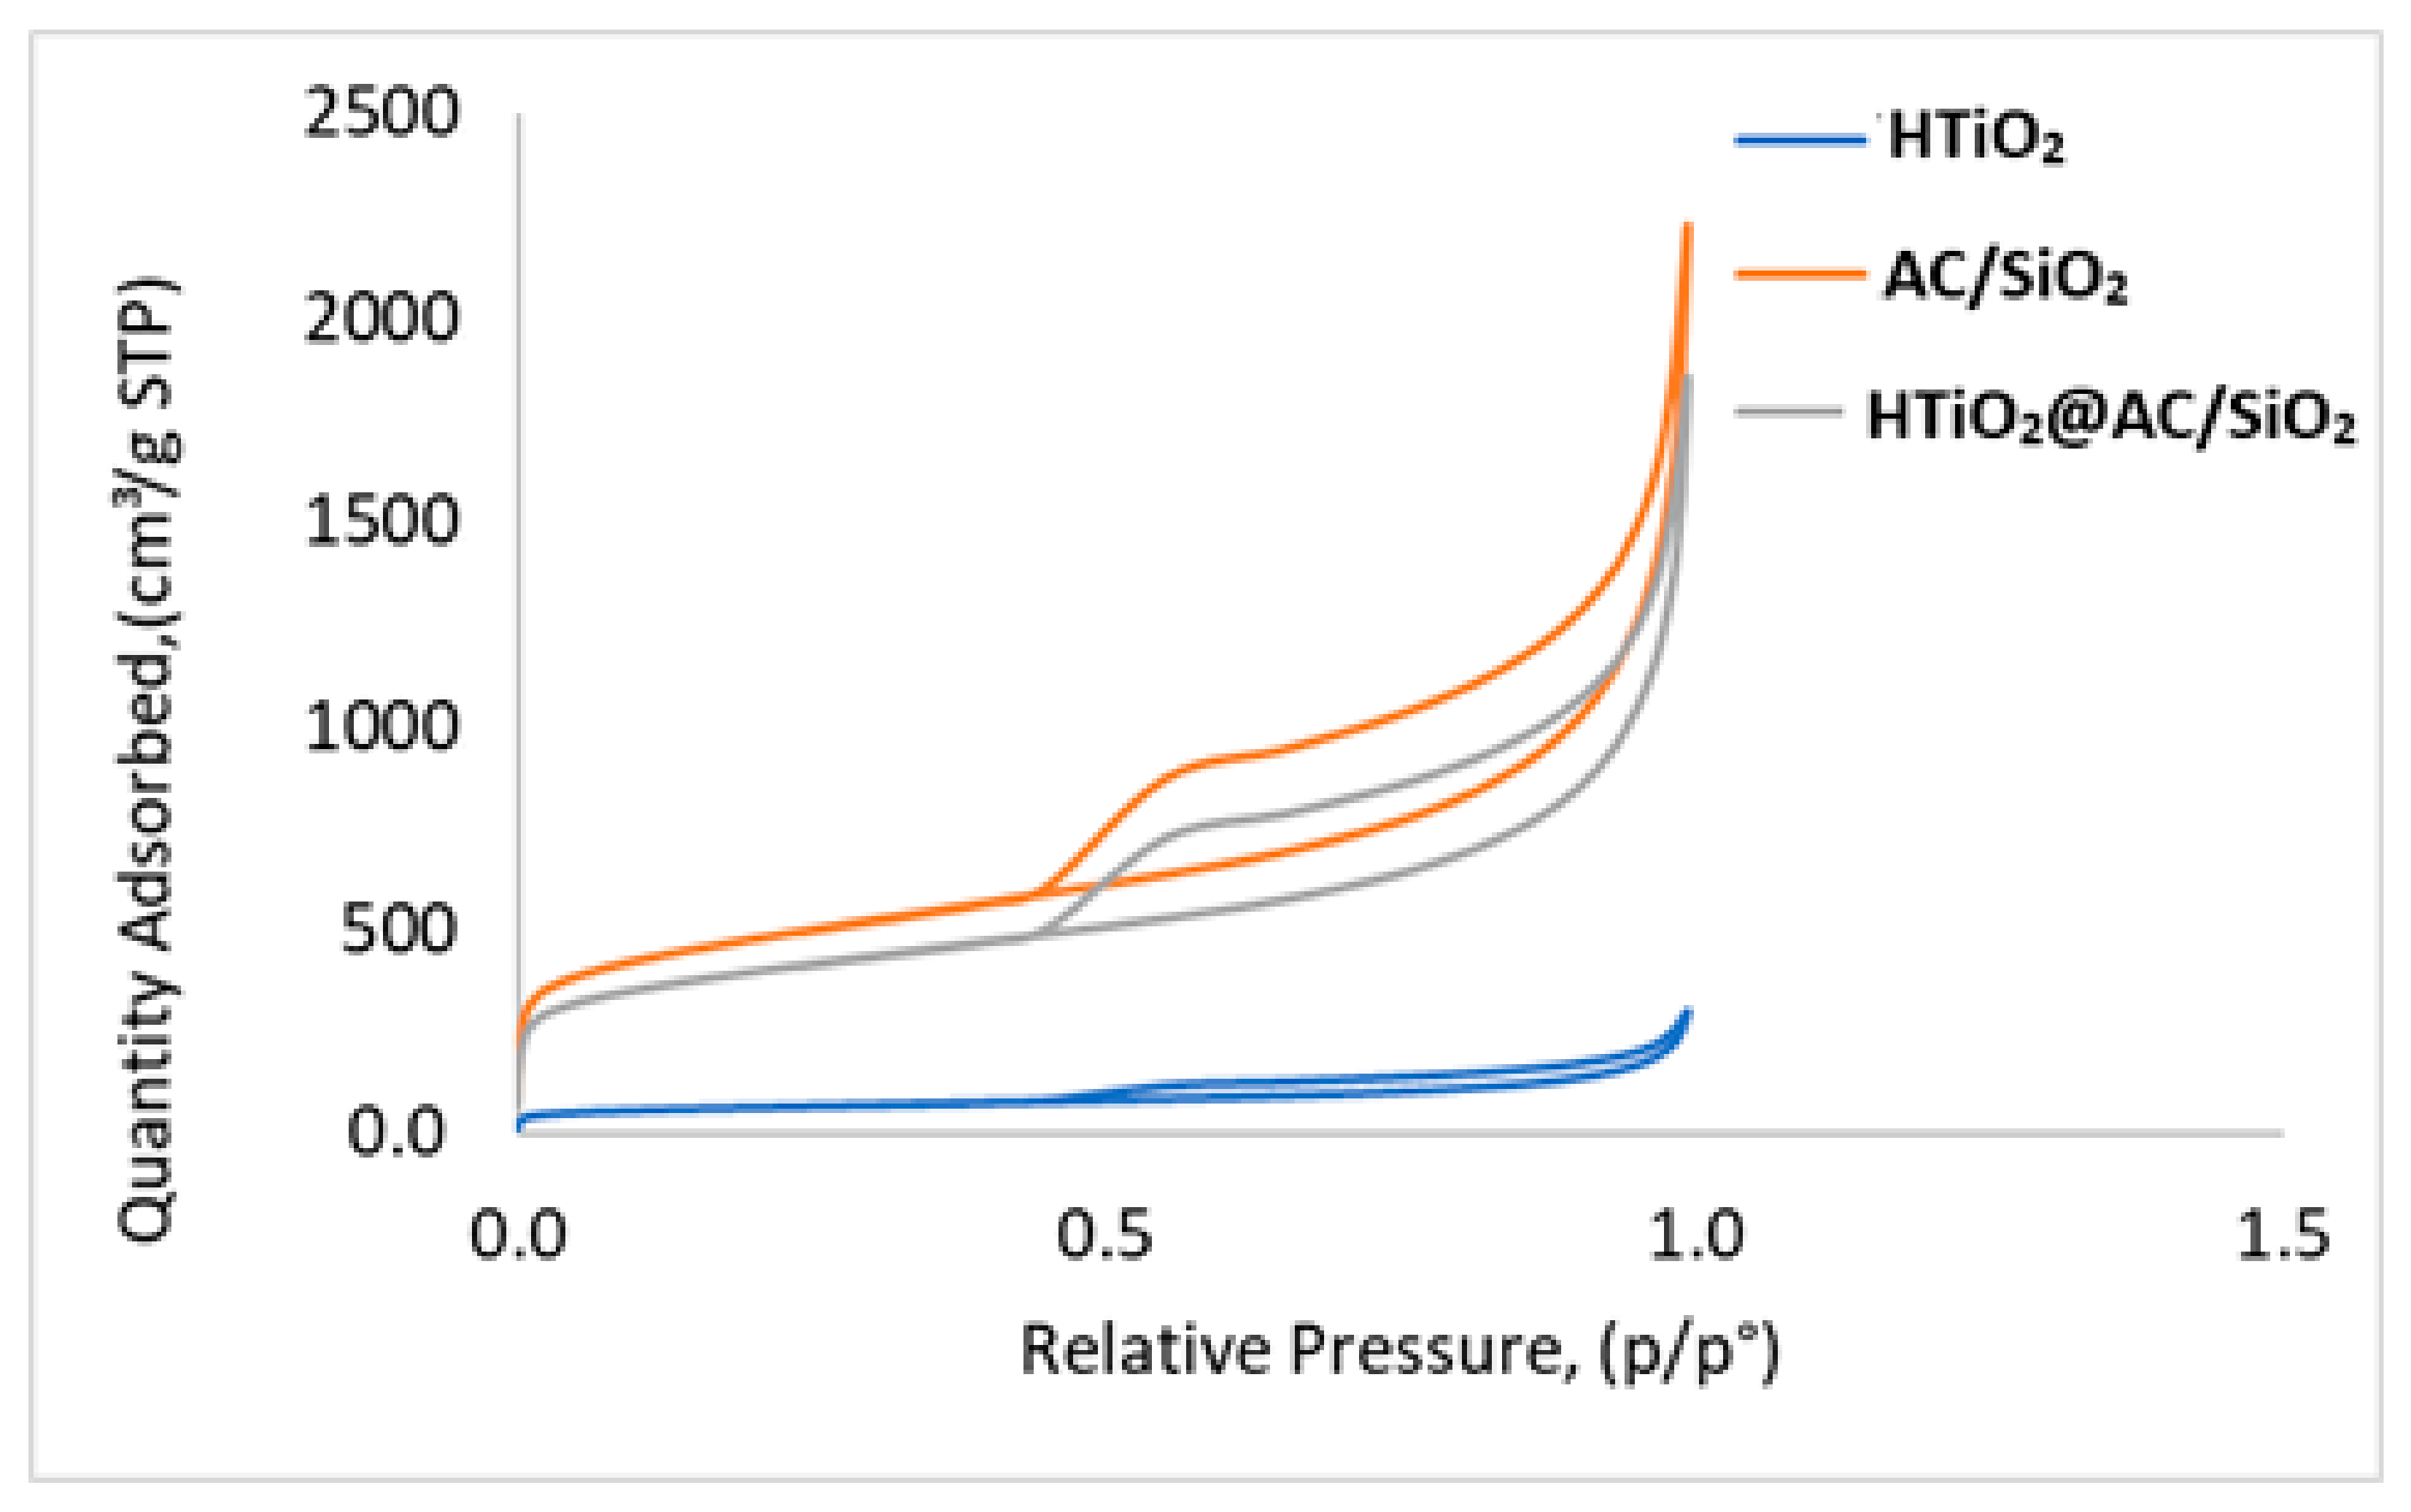
2.1.3. Surface Properties

Data on surface porosity and particle size are also obtained due to the examination. The BET surface area of HTiO2@AC/SiO2, AC/SiO2, and HTiO2 was investigated using nitrogen adsorption. A multipoint BET technique was utilized to calculate the surface area using adsorption data with a relative pressure (P/P0) range of 0.050354–0.60029, 1857, and 251.5 m2/g, respectively. The pore size distribution of the HTiO2@AC/SiO2 nanocomposite was determined using a desorption isotherm and the Barret–Joymer–Halender method, yielding a pore diameter of 2.322 nm and a pore volume of 0.57 cc/g. The pore diameters of AC and HTiO2 were 4.322 and 0.2 nm, respectively, as shown in Figure 4. The surface properties have been described in detail (refer to [20]).

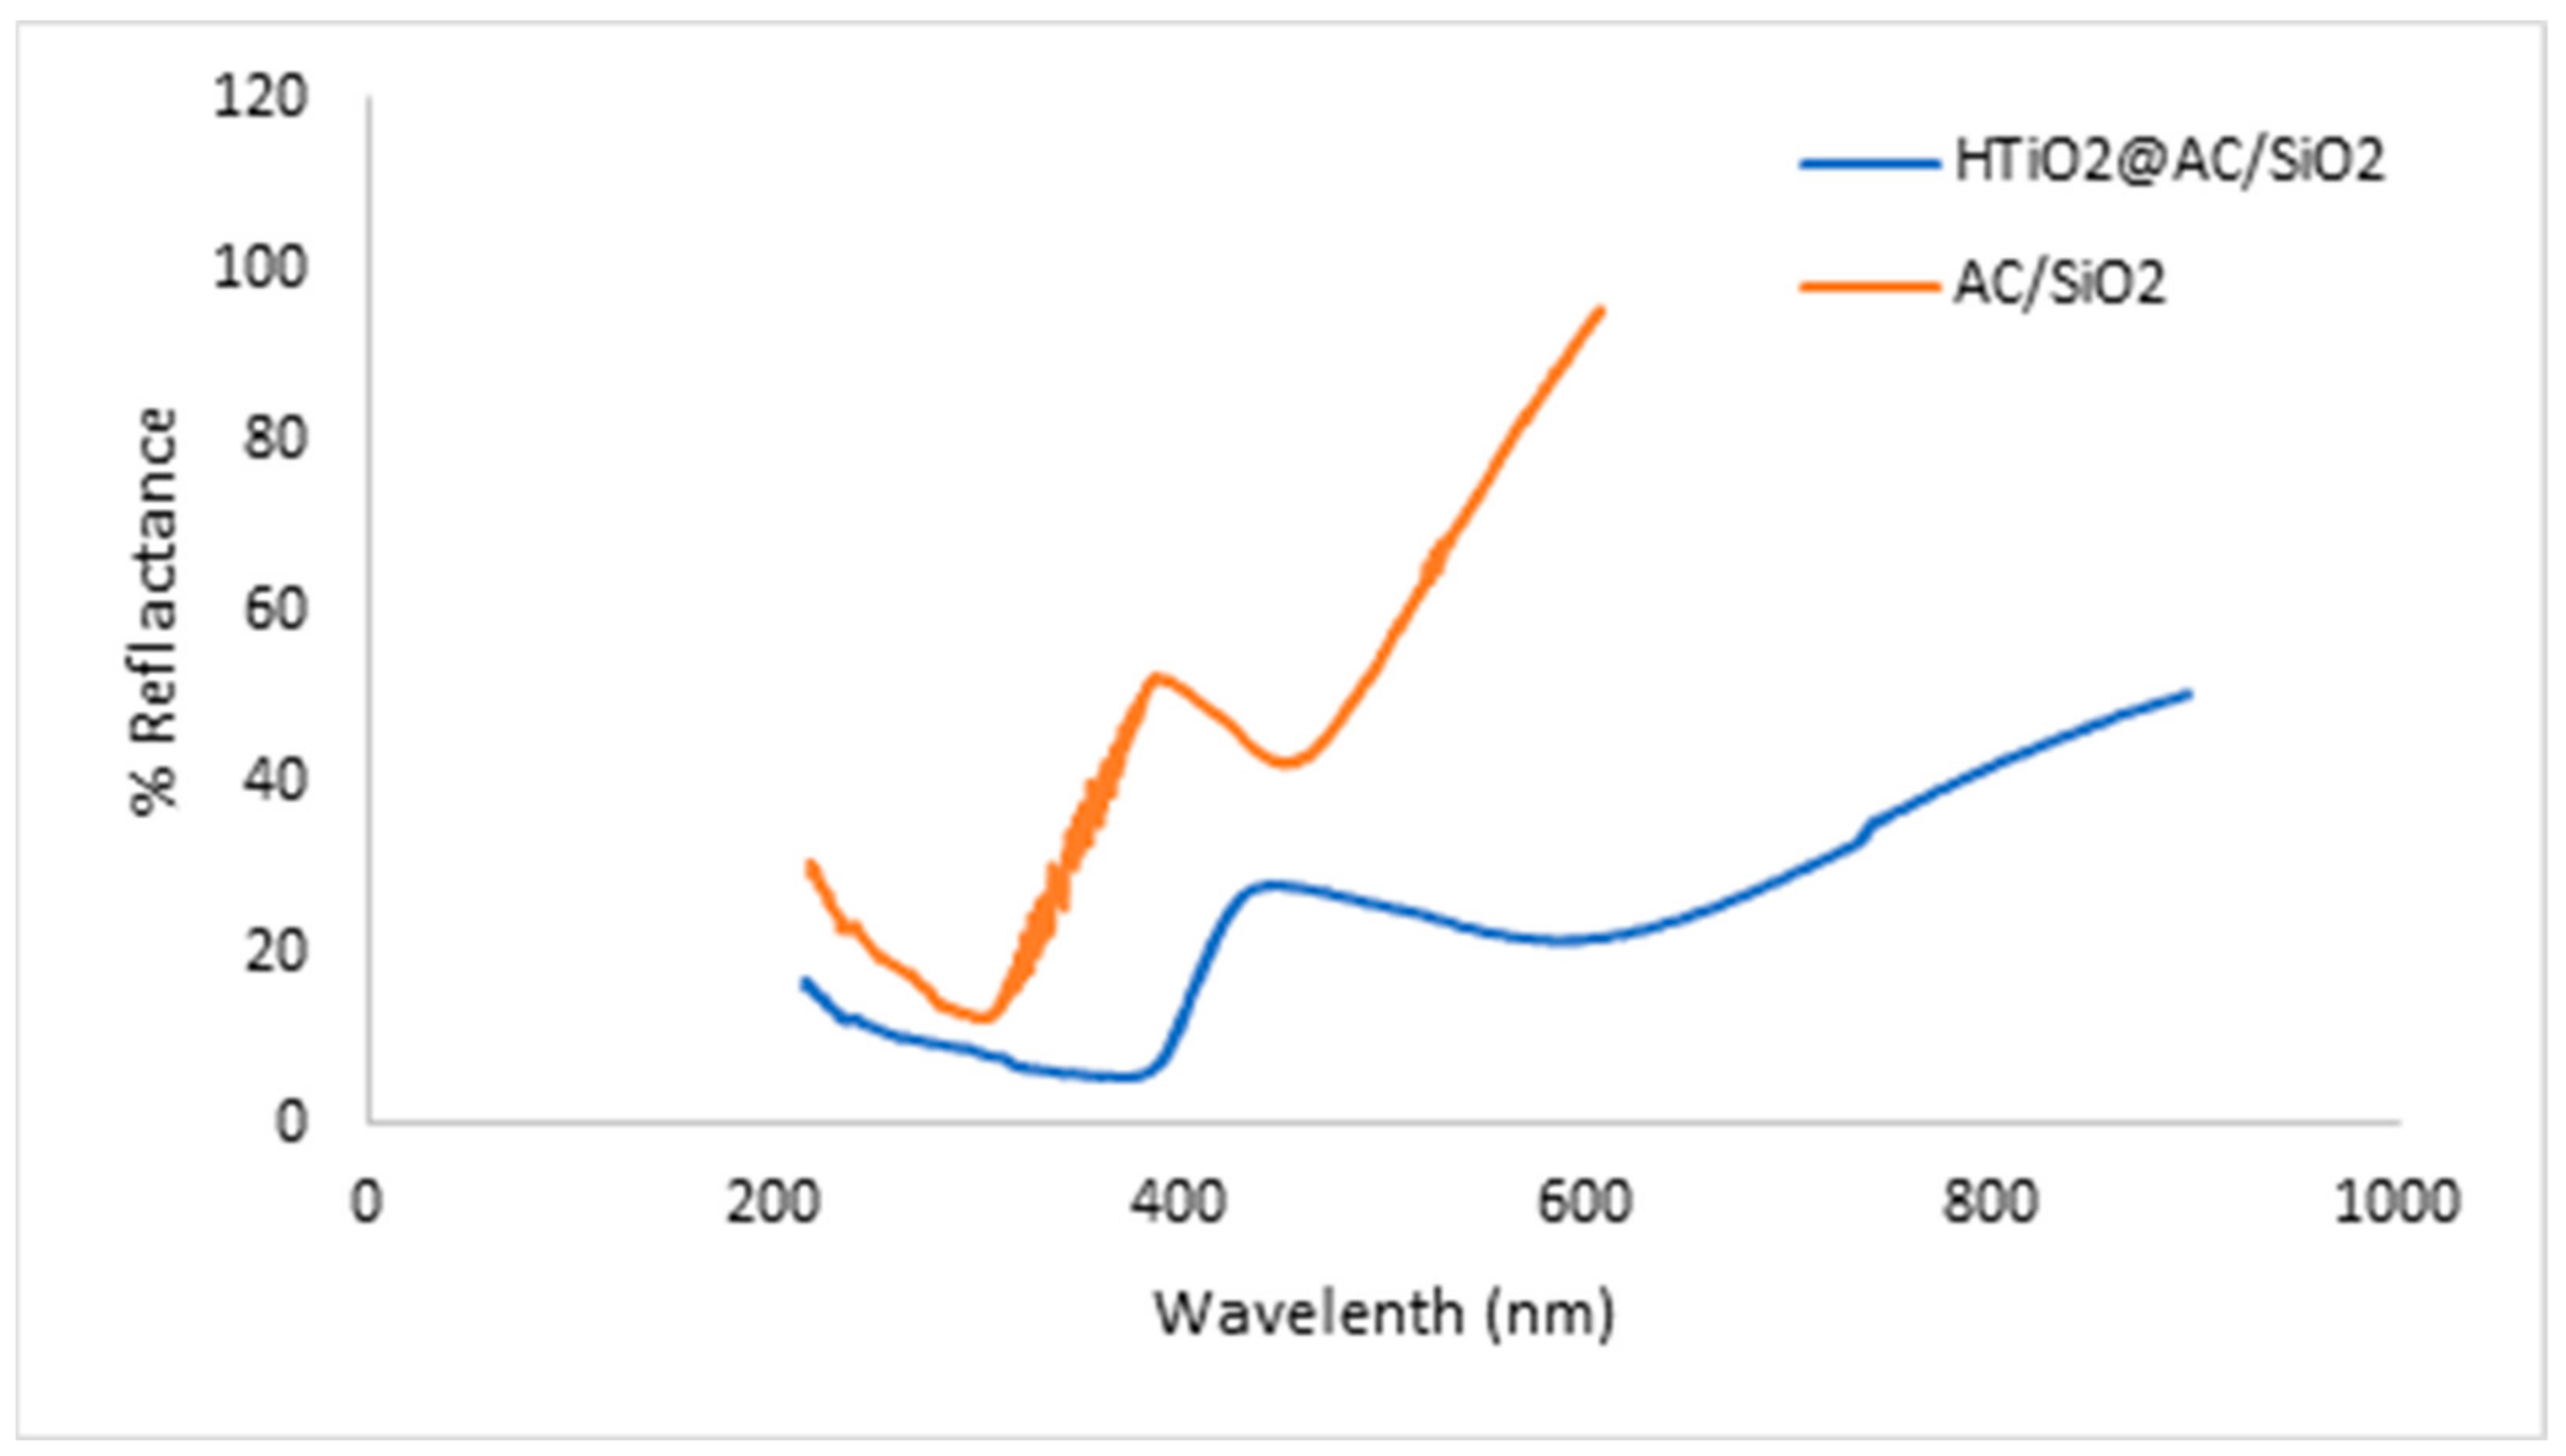
2.1.4. Composite Optical Characterization

Since the composite structure contains oxides (SiO2 and HTiO2), their optical properties need to be examined (Figure 5). The optical characteristics of the AC/SiO2 and HTiO2@AC/SiO2 nanocomposite spheres were evaluated using the D.R.S. method. The photocatalytic activity of the AC/SiO2 sphere is exclusively active in the UV range, as shown in Figure 5. At the same time, a considerable absorption in the visible light region of about 460 nm was found in the D.R.S. of the HTiO2@AC/SiO2 nanocomposite. The visible light absorption zone of HTiO2@AC/SiO2 extends from 400 to 550 nm. These catalysts (adsorbent) effectively improved chlorpyrifos photodegradation in visible light, indicating they were effective. While titanium dioxide’s intrinsic absorption was due to electron transfer from titanium dioxide’s valence to conduction bands, the intrinsic absorption of HTiO2 corresponded to this energy [17]. Because of the different sizes of the crystals in the primary HTiO2@AC/SiO2 nanocomposite, the fine absorption spectra variation may be caused by this [17].

2.2. Batch Studies

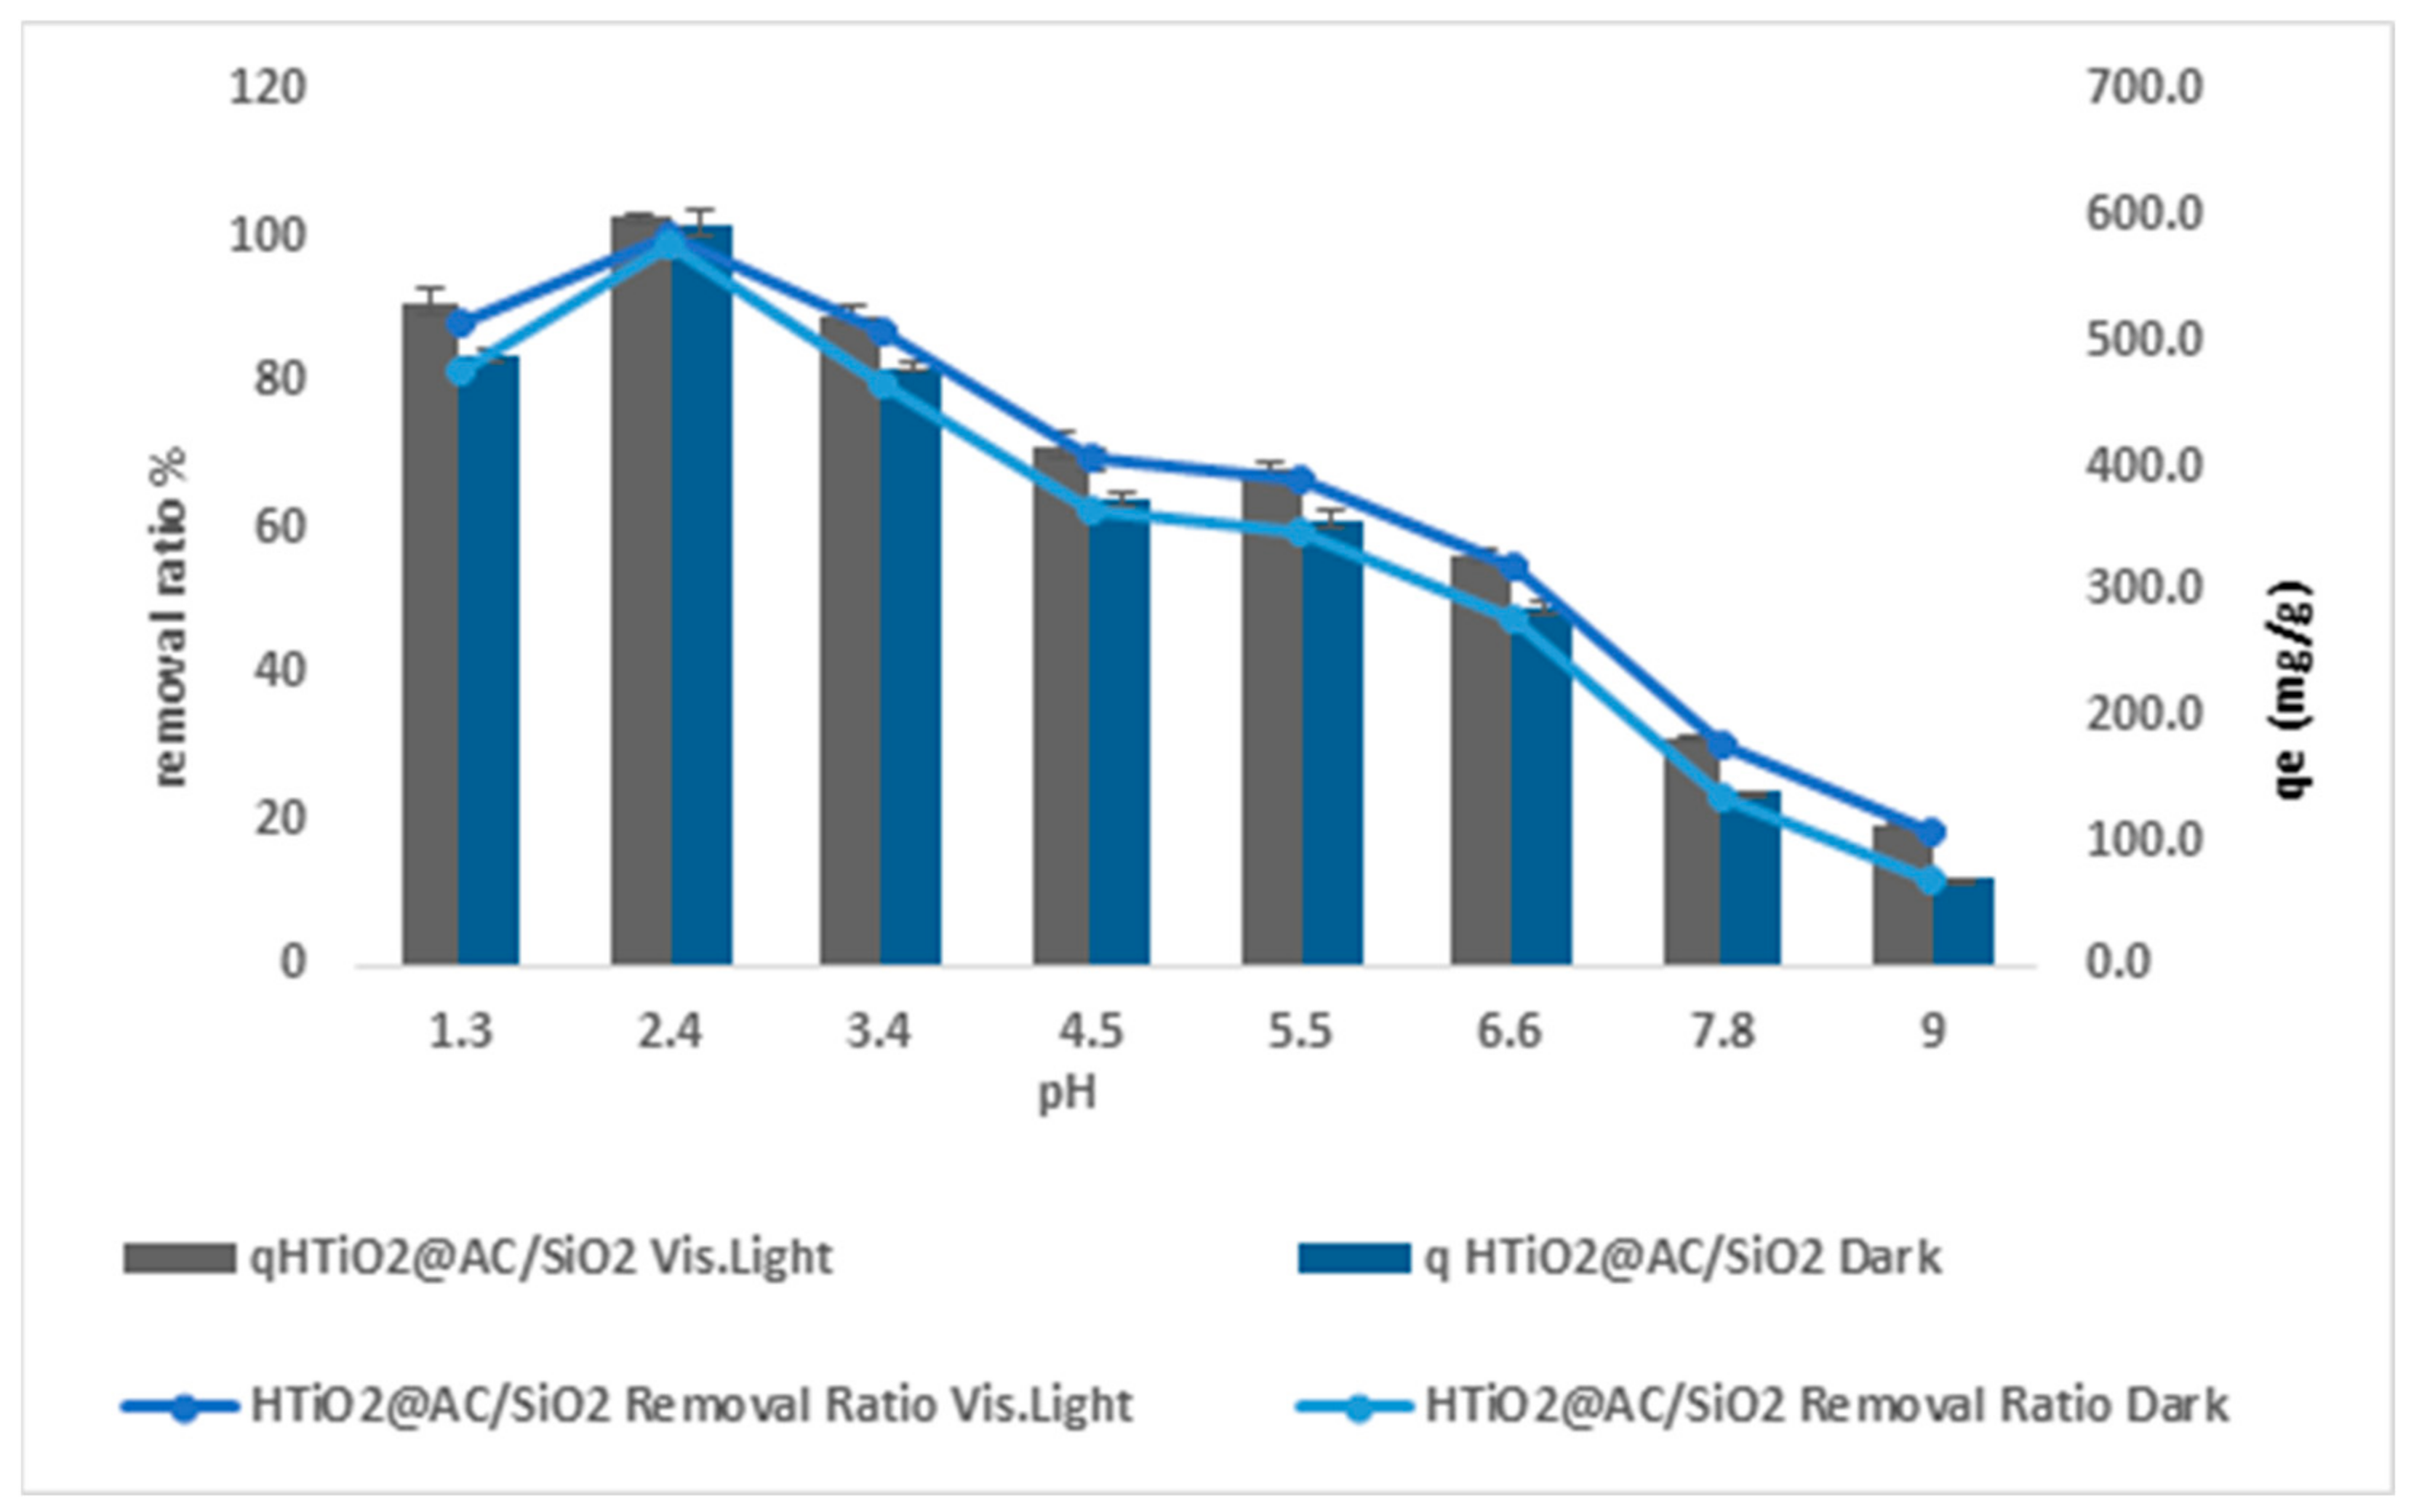
2.2.1. The Influence of pH

Increasing the pH from 2.4 to 9.0 lowered the chlorpyrifos removal ratio from 81.6 percent to 11.6 percent (r 0.95, p 0.0002) in the dark and from 100 percent to 18.6 percent (r 0.96, p 0.0001) in the visible light, respectively. In dark and visible light, increasing the pH from 1.3 to 2.4 improved the efficacy of chlorpyrifos removal from 81.6 percent to 99.2 percent (r 0.95, p 0.0002) and from 88.6 percent to 100.00 percent (r 0.96, p 0.0001), respectively. The increased adsorption of chlorpyrifos by HTiO2@AC/SiO2 is seen in Figure 6.
The pH of pesticide solutions affects the surface charge and controls the ionization of acidic and basic chemicals. As a result of the acidic medium’s ability to boost negatively charged substrate molecules (chlorpyrifos), chlorpyrifos adsorption is larger at lower pH values than at higher pH values. Chlorpyrifos exhibits electron delocalization, making it a negatively charged species with a lower pH adsorption value. Due to electrostatic repulsion between chlorpyrifos molecules and the nanoparticle surface, HTiO2@AC/SiO2 nanoparticles with a higher pH have a bigger negative charge, which does not aid in an apparent decrease in chlorpyrifos adsorption. pH 2.4 was chosen for future research because it has a higher chlorpyrifos elimination effectiveness [19].
The following description of the chlorpyrifos elimination ratio performance is at pH levels ranging from 1.3 to 2.4: The conflict between H+ and chlorpyrifos molecules for active sites on the adsorbent surface decreased adsorption efficacy at extremely low pH values. Chlorpyrifos can migrate toward the adsorbent’s positively charged surface area due to the electrostatic attraction force, boosting its removal at low pH values. The increased electrostatic repulsion between the adsorbent and chlorpyrifos resulted in a considerable increase in adsorption at high pH. The pH of a solution has a considerable impact on adsorption, as is well known. An epoxide group, such as oxacyclopropane or oxirane, is the main active site in all pesticides studied. Nearby substituent acids and bases can quickly affect a strained group [21].

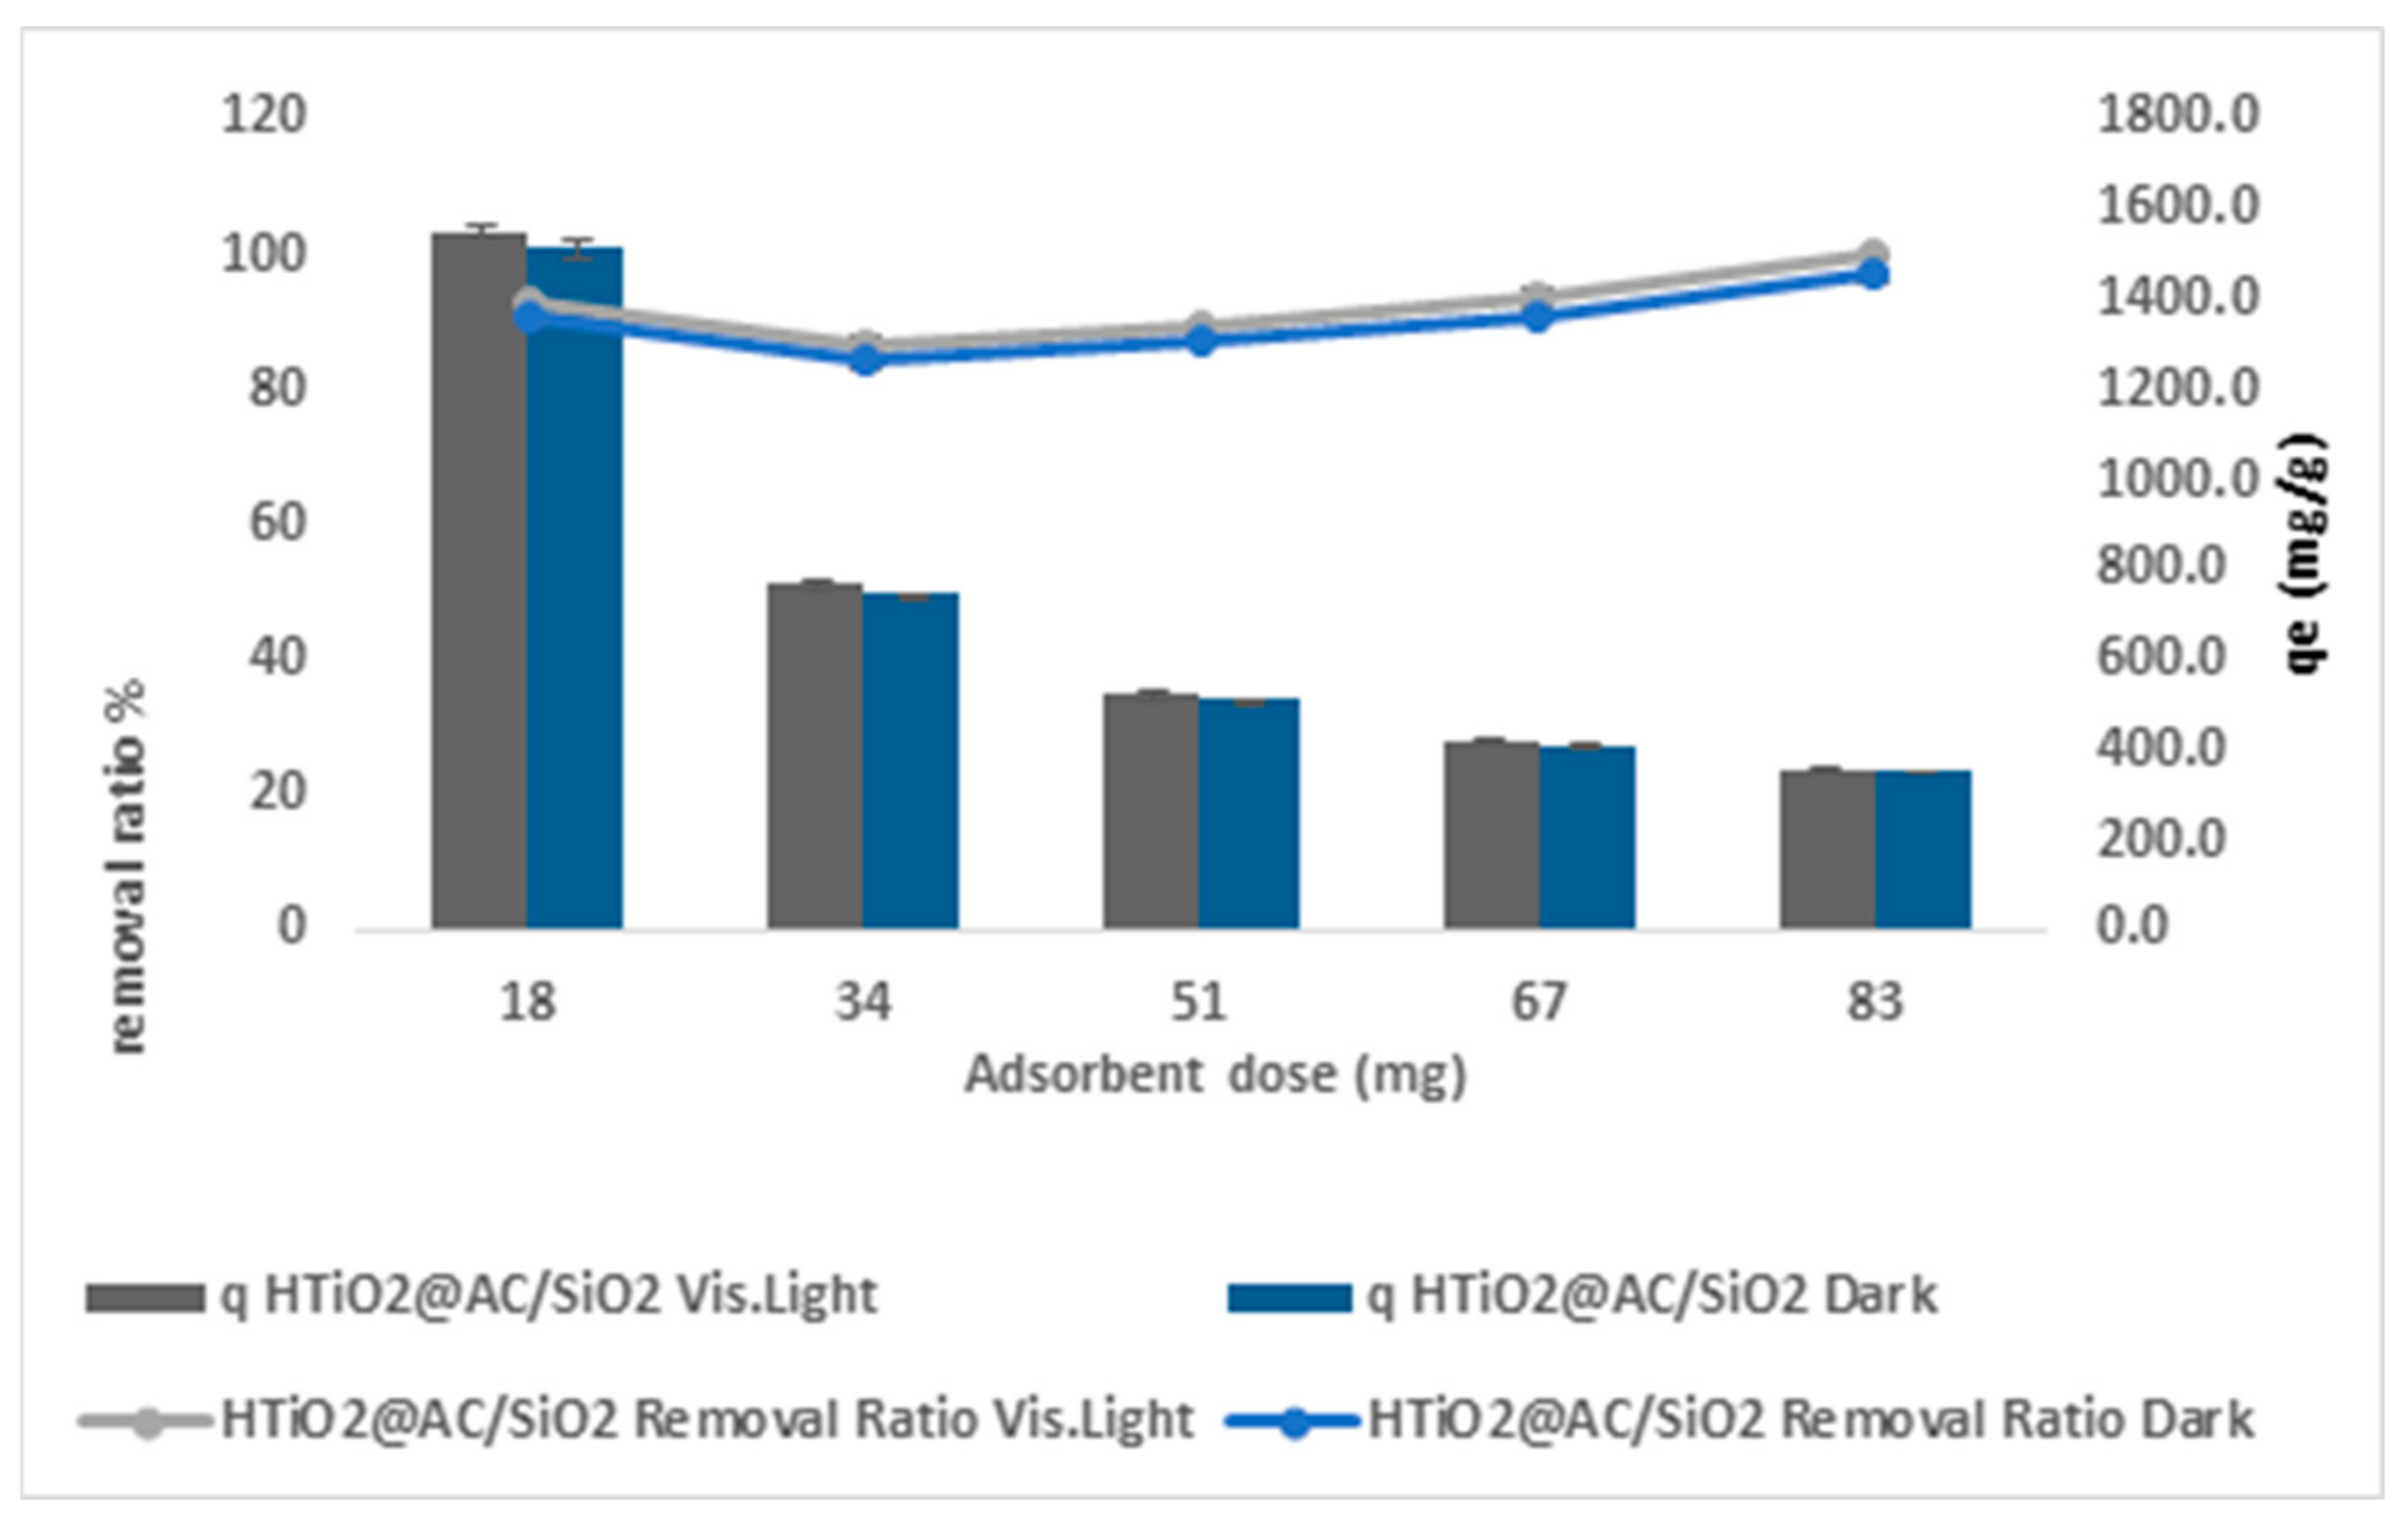
2.2.2. Dosage Effect of HTiO2@AC/SiO2

Figure 7 shows the results of employing HTiO2@AC/SiO2 in dark and visible light. With a HTiO2@AC/SiO2 dose increase from 18 to 83 g L1, the chlorpyrifos elimination ratio steadily increased from 84.5 percent to 97.4 percent (r 0.64, p 0.25) and 86.8 percent to 99.7 percent (r 0.64, p 0.25) in dark and visible light, respectively. Because of the increased surface area accessibility, increasing HTiO2 dosage may improve chlorpyrifos removal [21].
According to Vishnu et al. [22], increasing the particle dosage promotes adsorption. Increasing the slope of the kinetic curve at a given time reduces the time it takes to reach equilibrium. In a liquid, there are more collisions between the surfaces of particles, resulting in faster adsorption. According to prior work by Vishnu et al. [22], increased particle dosages significantly impact removal efficiency. They increase the total quantity of available adsorption surface area.
The obtained qt is 360 mg g−1, and the removal effectiveness is 99.7% at a high particle dosage of 83 mg L−1.
Ferreir et al. [23] also found that greater adsorbent dosages lead to a higher clearance percentage. Diffusion decreases when the adsorbent concentration rises due to various factors, including solute availability, binding site interference, electrostatic interactions, and less mixing due to the high adsorbent concentration in the solution. Due to the adsorbate’s restricted availability, decreasing absorption and adsorption efficacy, many unsaturated adsorption sites remain.

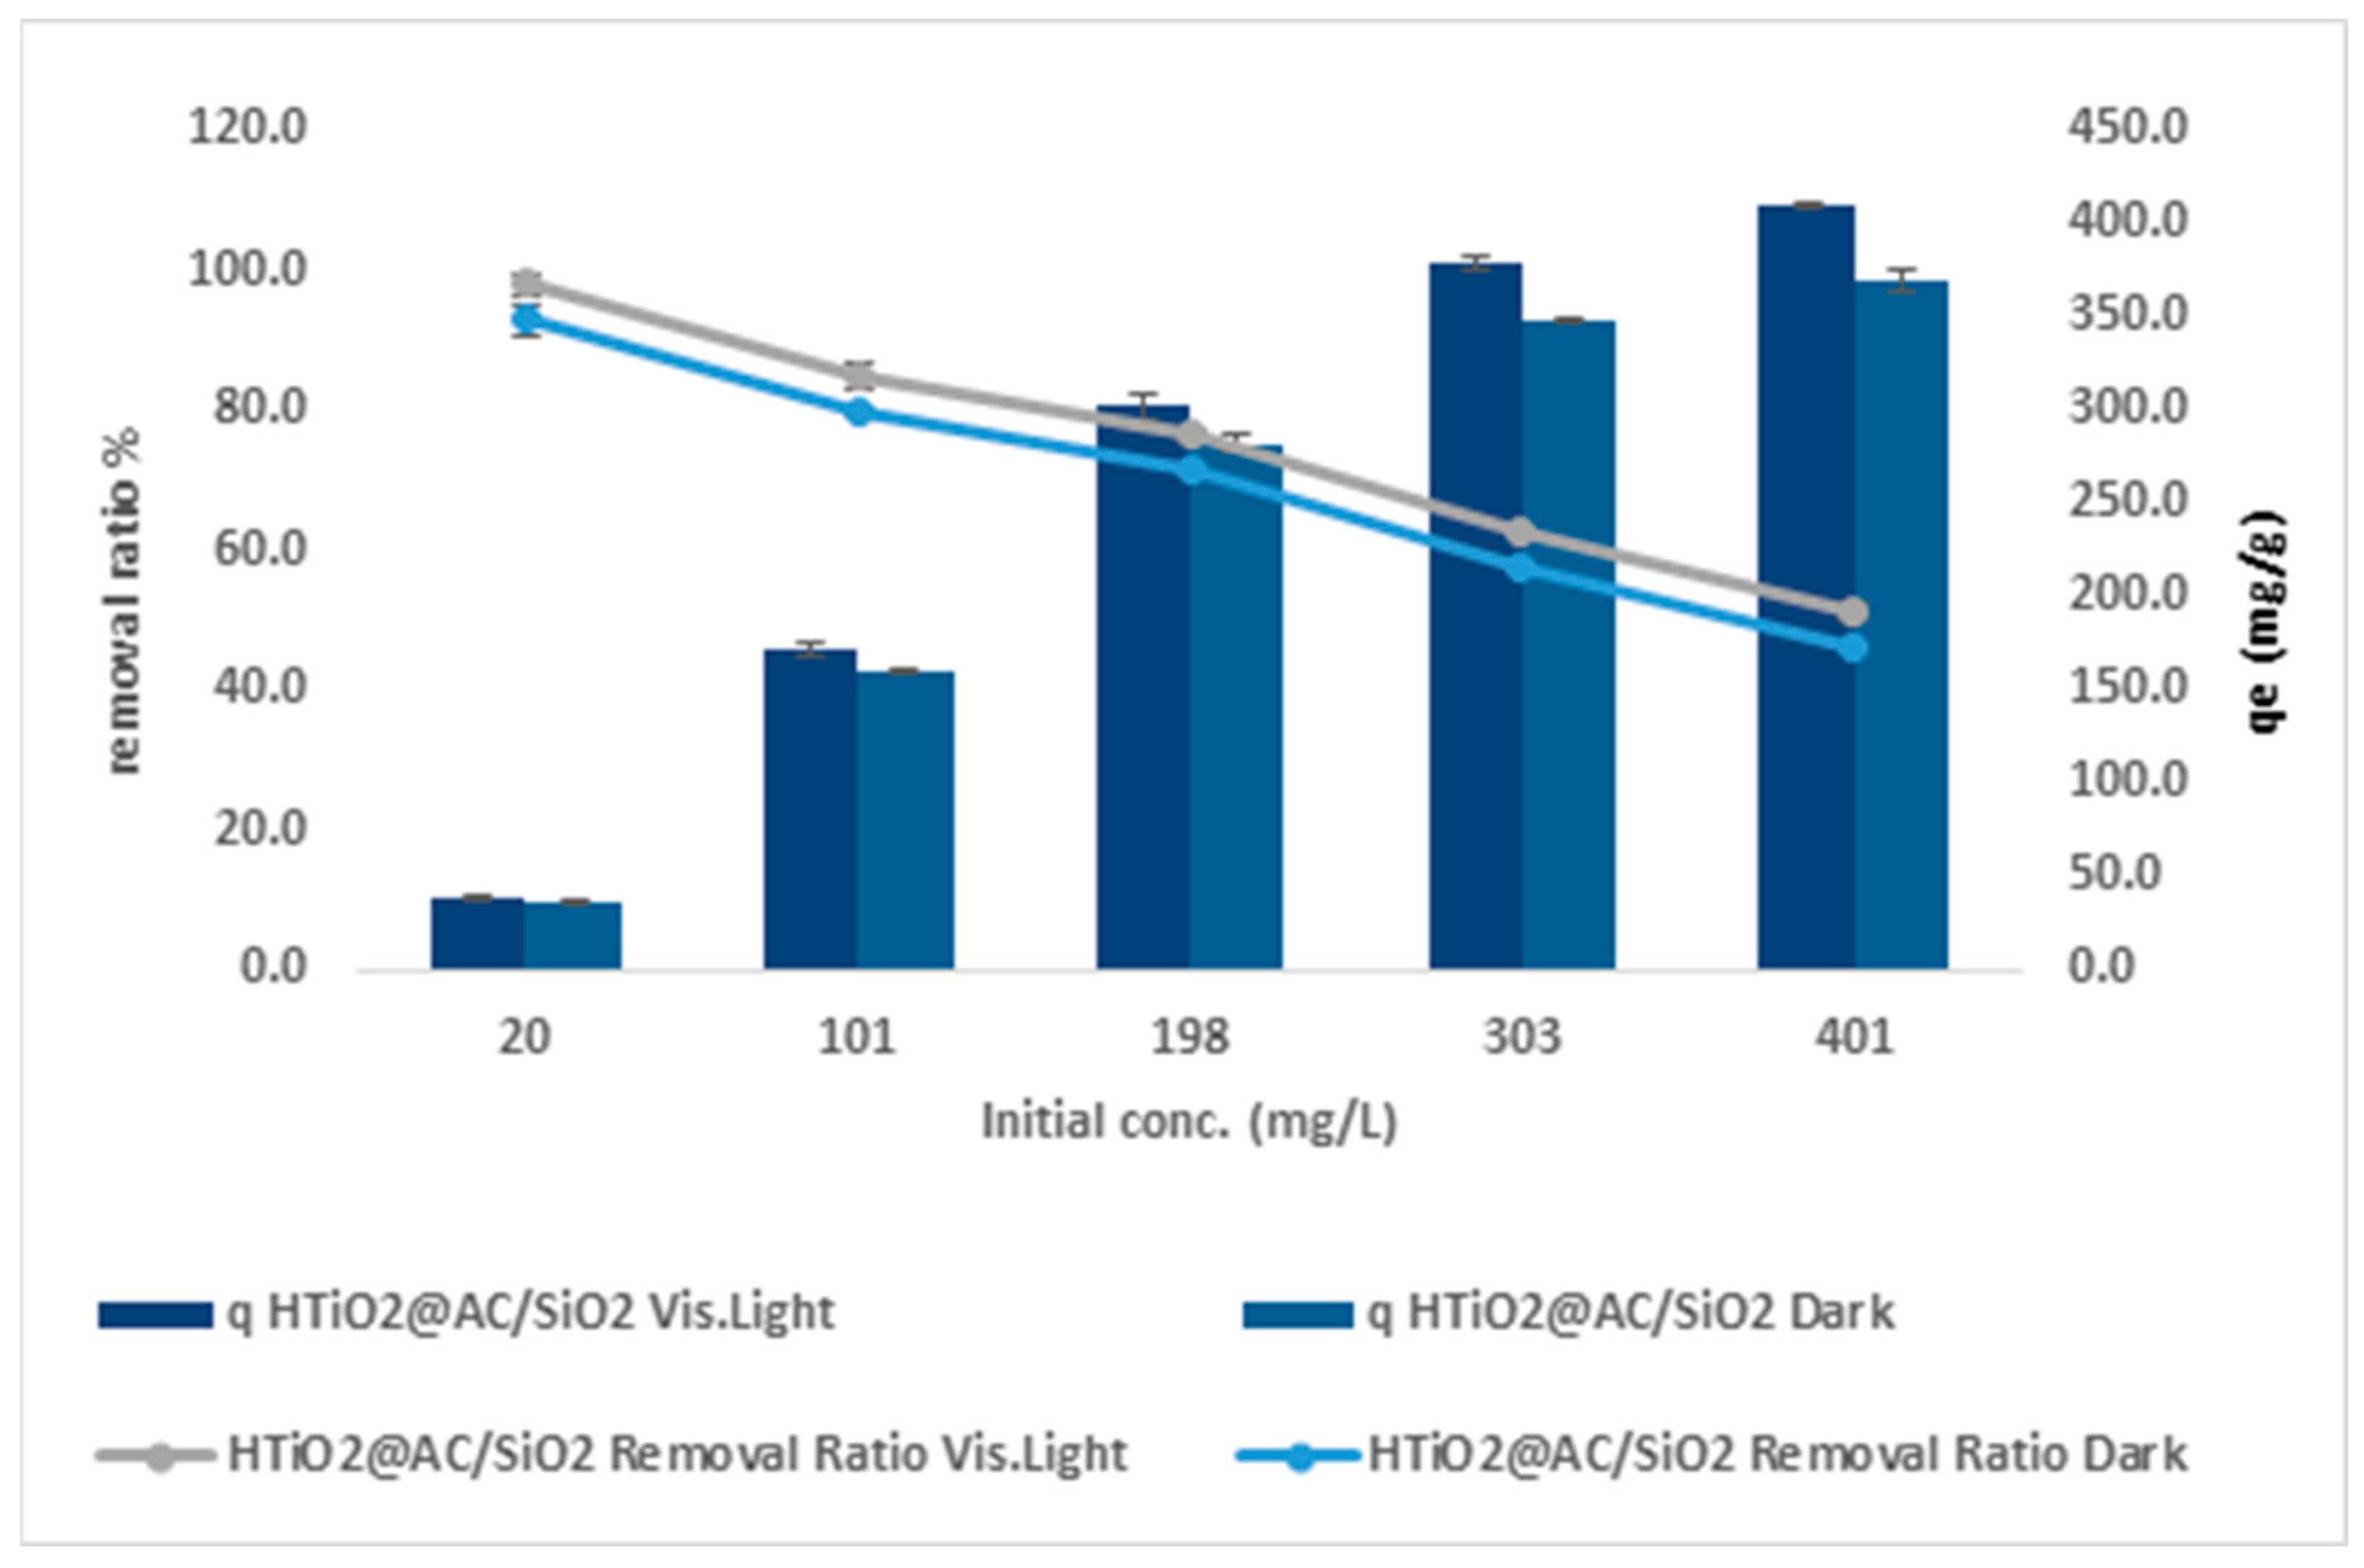
2.2.3. Effect of Initial Concentration

Figure 8 shows the results of employing HTiO2@AC/SiO2 in dark and visible light, with r 0.997, p 0.0001, and r 0.997, p 0.0001, respectively, increasing the initial chlorpyrifos concentration from 20 to 401 mg L−1 and decreasing the chlorpyrifos removal ratios from 93% to 46.1% and 98% to 51.1%. In dark and visible light, qe increased from 37.2 to 369.7 mg g−1, with r 0.957, p 0.01, and from 39.2 to 409.8 mg g−1, with r 0.966, p 0.007, respectively.
According to the findings, increasing the initial chlorpyrifos concentration reduced the availability of active surface sites, resulting in less bleaching and degradation. As a result, radical hydroxyl production was reduced, presumably reducing photocatalytic activity. The path traveled by photons entering the chlorpyrifos solution as they reach the solution’s surface shortens as the chlorpyrifos concentration rises. When chlorpyrifos concentrations are high, the chlorpyrifos molecules absorb a considerable percentage of solar radiation, lowering catalytic performance [24,25]. As a result, a chlorpyrifos concentration of 10 mg L−1 was chosen for future investigation.
When the starting concentration of chlorpyrifos increases, the removal ratios decrease, and the adsorption capacity rises. The number of ions contending for empty active sites in activated carbon and HTiO2@AC/SiO2 reduced with the low-chlorpyrifos load. As a result, the solution had enough surface area to hold the available chlorpyrifos. The saturation of adsorption sites increased with higher initial chlorpyrifos concentrations, and the potential of chlorpyrifos–sorbent interactions increased [26]. A significant driving force of mass transfer is responsible for the increase in loading capacity of HTiO2@AC/SiO2 concerning chlorpyrifos concentration [27].

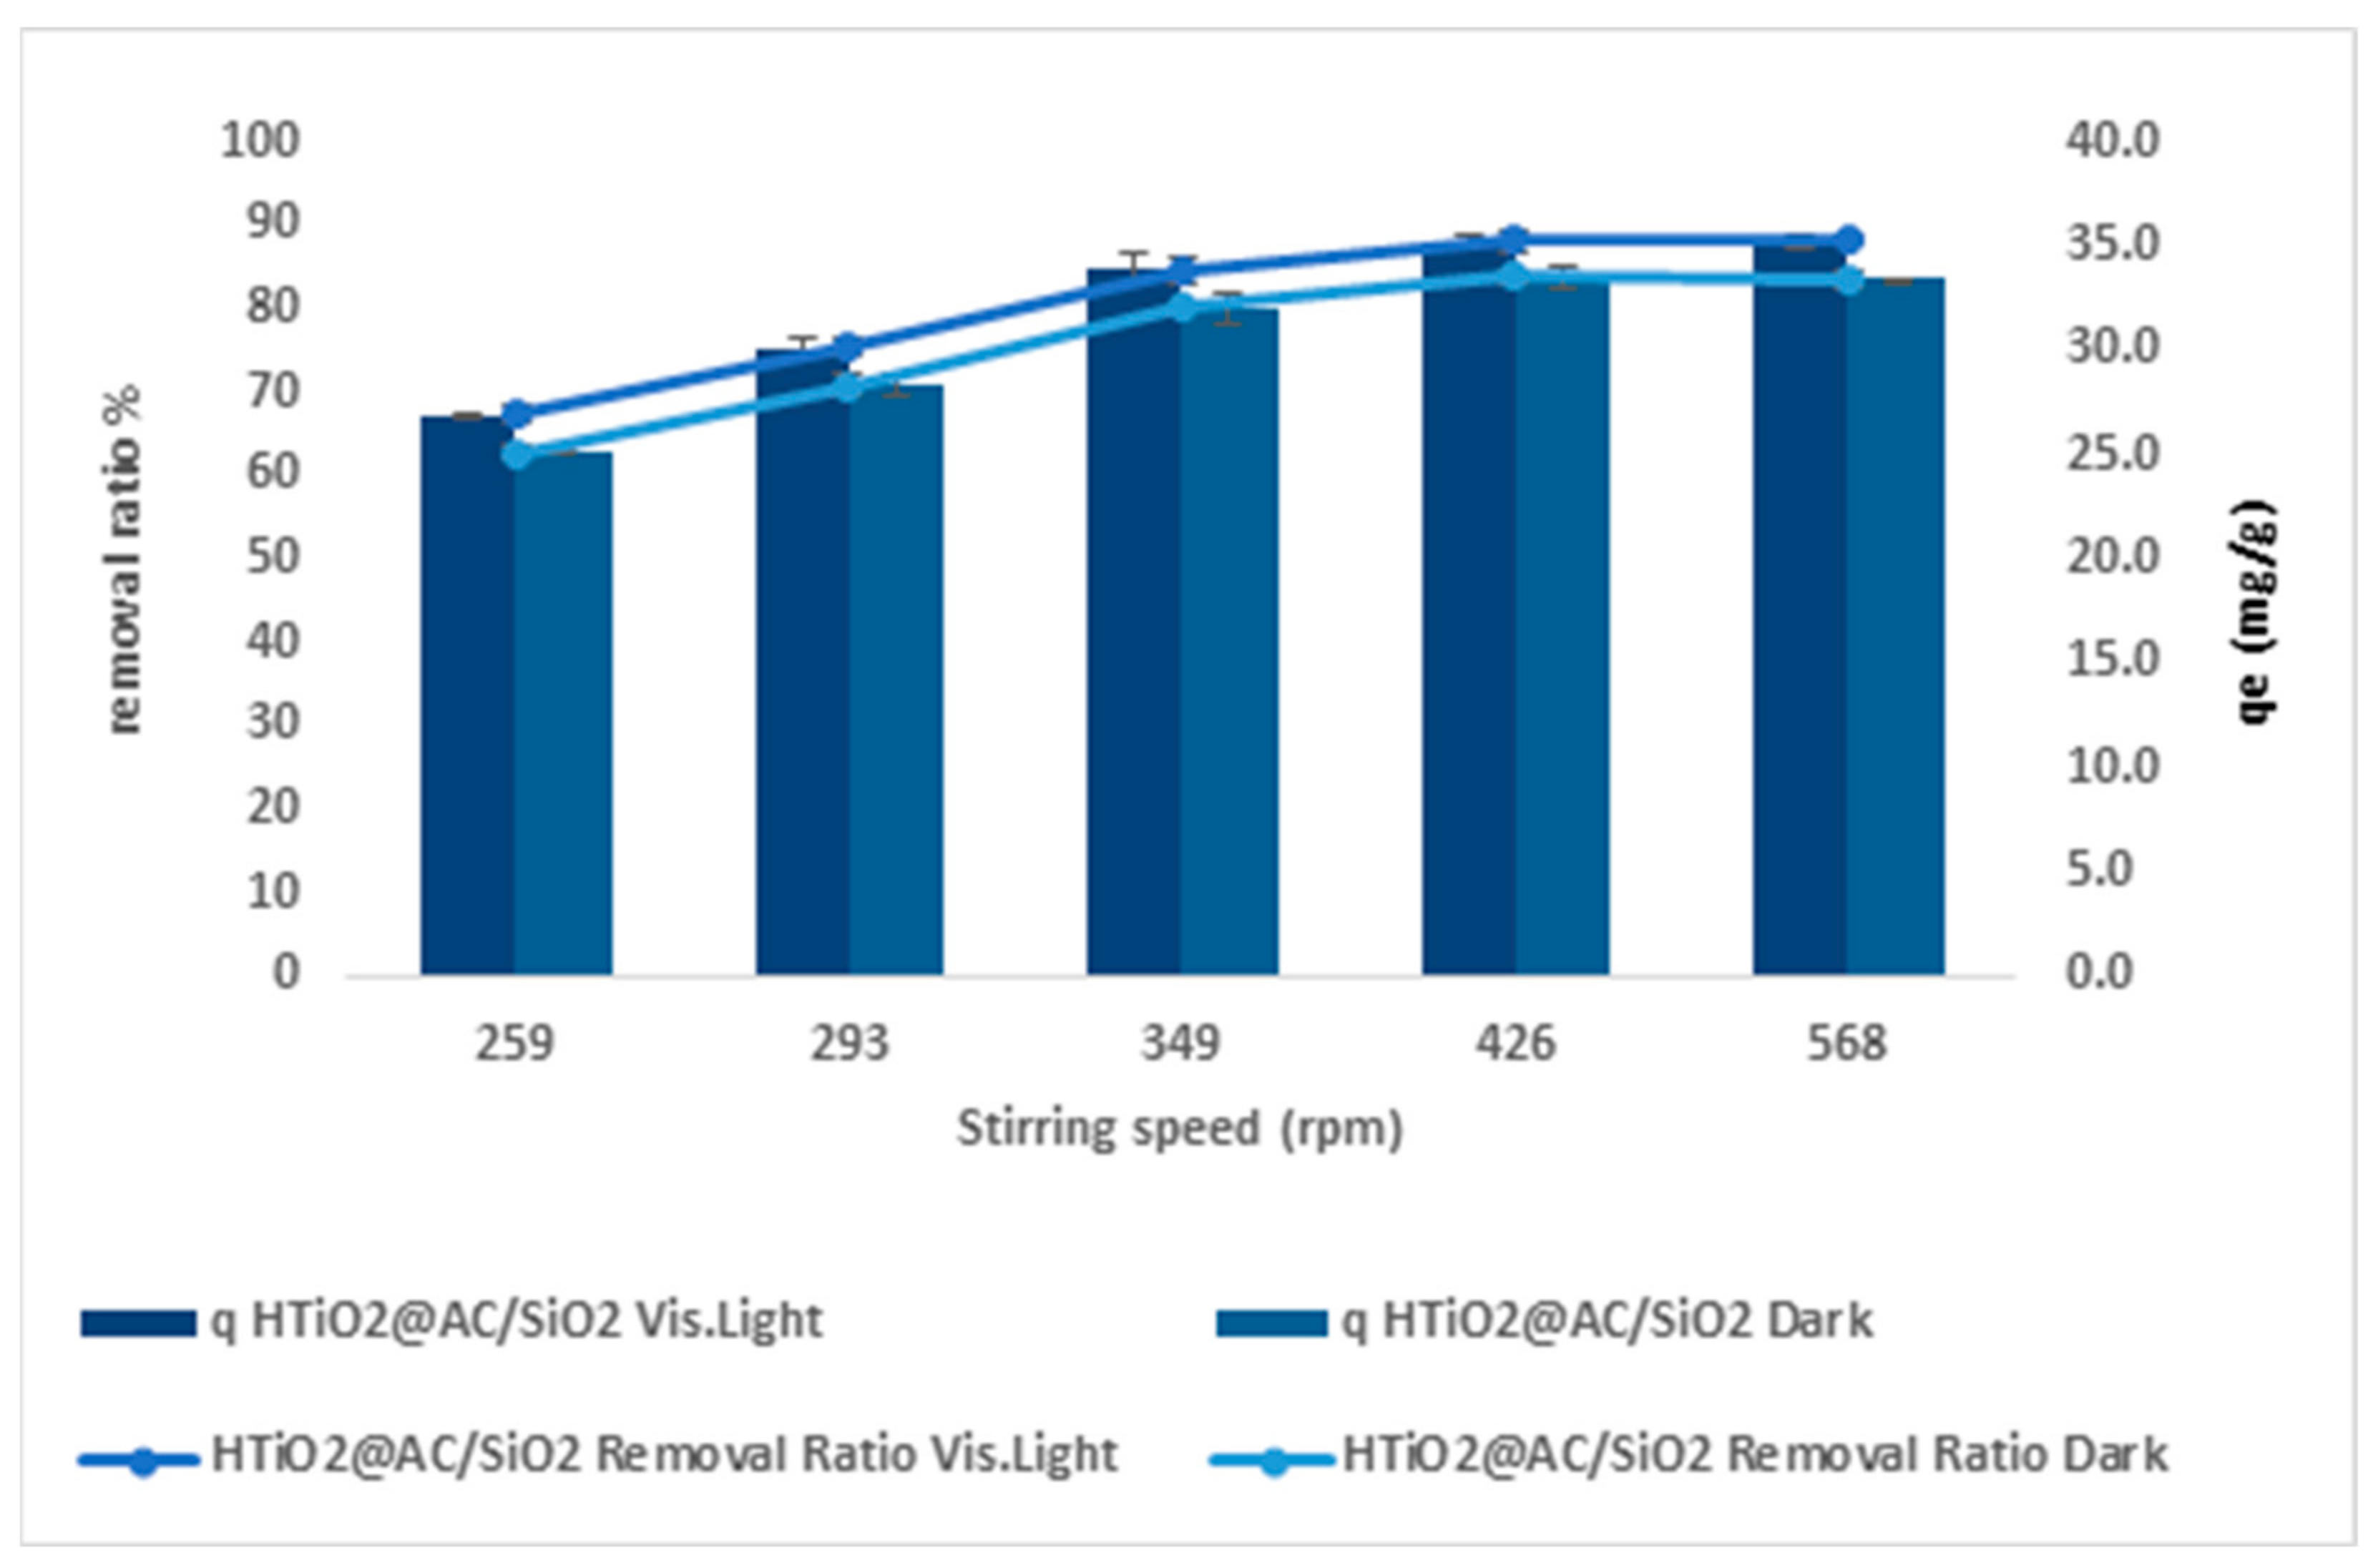
2.2.4. The Stirring Effect

Figure 9 depicts the agitation rate results of employing HTiO2@AC/SiO2 on the chlorpyrifos removal ratio in dark and visible light. At agitation speeds ranging from 259 to 568 rpm, the maximum removal efficiency of 62.7% to 83.5% and 67.2% to 88.2% in dark and visible light, respectively, was recorded with r 0.818, p 0.09 and r 0.82, p 0.09. The results in Figure 9 show that the rate of chlorpyrifos elimination increased as the agitation speed increased.
The dispersion of adsorbent particles in this process is crucial. The adsorption process is governed by mass transfer. The mechanism is assumed to be controlled by the liquid mass transfer resistance. With increasing bulk motion, the adsorption rate rises [14]. The mass transfer rate increases as the agitation speed increases, which has been known for a long time. The adsorbate will detach from the adsorbent surface if the mixing is stronger. This indicates that the adsorbate–adsorbent bond will most likely be broken. Depending on the fluid particle system’s agitation, film or pore diffusion can control the adsorption rate. Film diffusion appears to be a rate-limiting phenomenon at lower agitation rates. Adsorbate mass transfer to the particle interior surface limits adsorption kinetics. Film diffusion achieves a maximum at higher agitation speeds, and pore diffusion takes over as the rate-controlling phase. Stirring the solution enhanced bleaching and deterioration, according to the findings. Initially, agitation causes turbulence in the solution, which encourages the presence of oxygen. To produce hydroxyl radicals and reactive oxygen species, soluble oxygen is required. Pesticide transfer and diffusion to adsorbent surfaces are accelerated when the solution is stirred, which minimizes equilibrium time by speeding up the transfer and diffusion process.

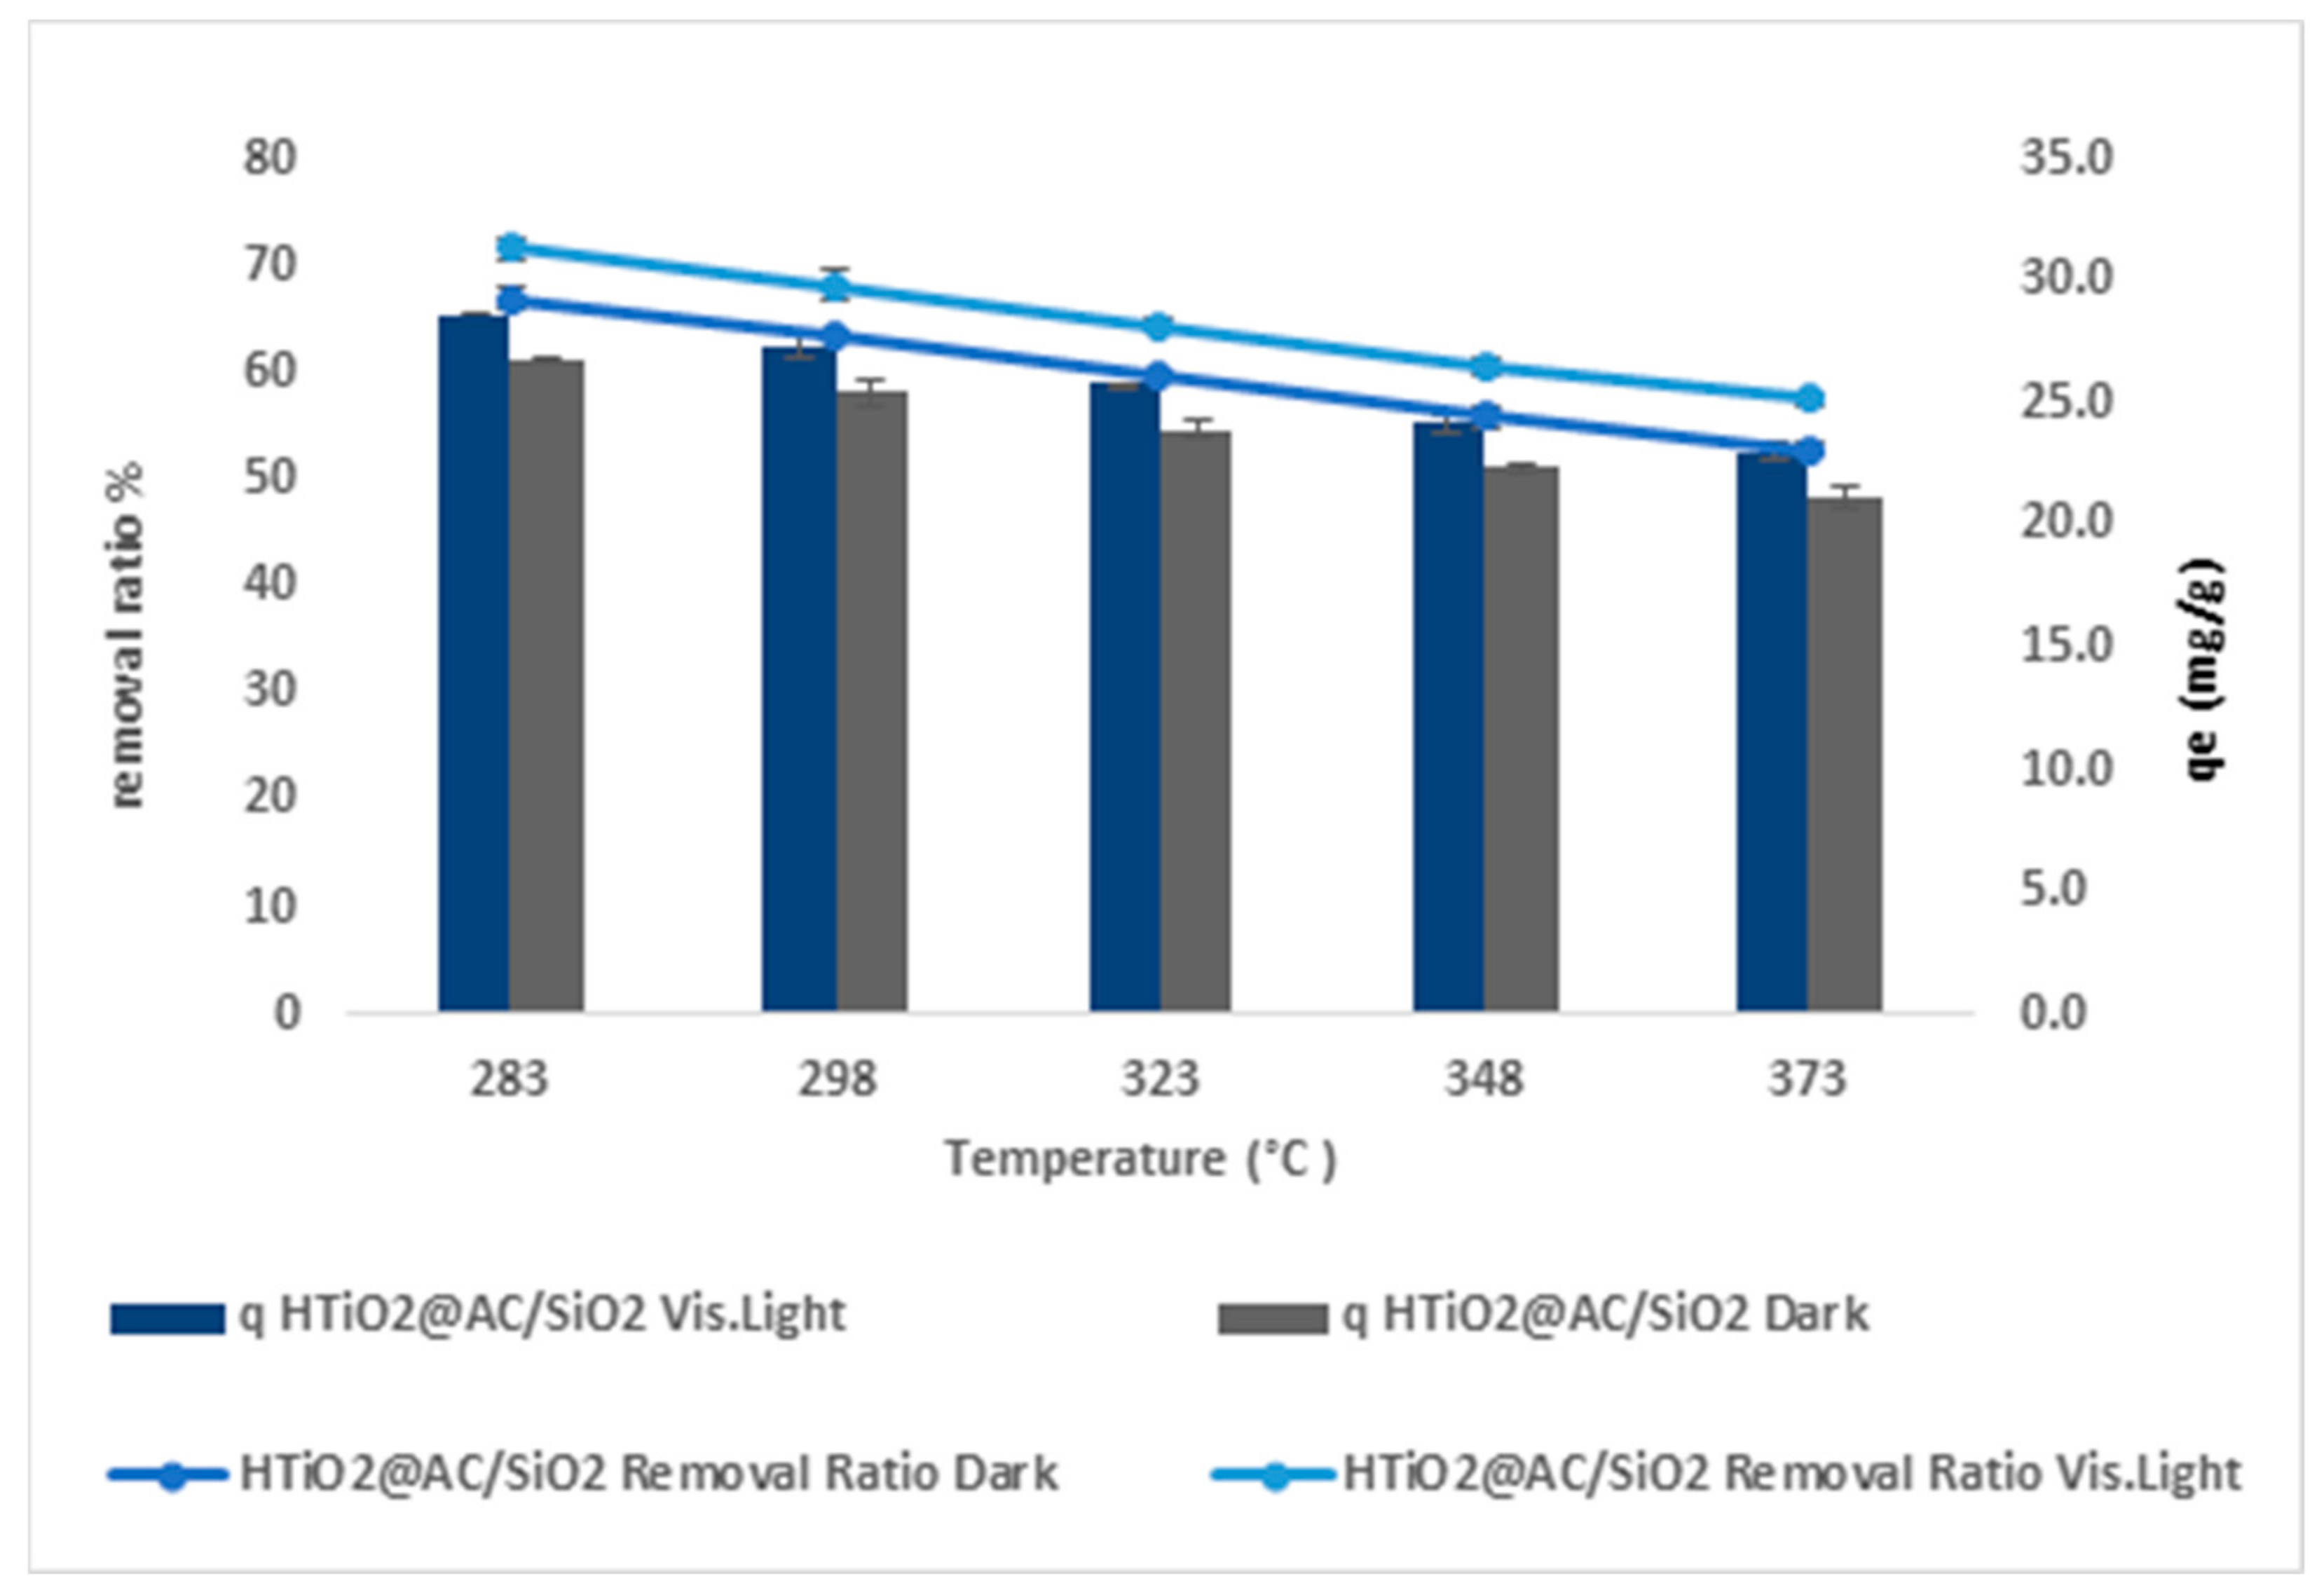
2.2.5. Temperature Impact

Figure 10 shows the removal efficiency and adsorption capacity of chlorpyrifos vs. temperature for an adsorbent dosage of 83 g L−1, pH of 2.4, chlorpyrifos concentration of 20 mg L−1, and agitation speed of 425 rpm. HTiO2@AC/SiO2 photocatalysts were used to study five calcination temperatures of 283, 298, 323, 348, and 373 K. The effect of temperature on chlorpyrifos adsorption utilizing HTiO2@AC/SiO2 is shown in Figure 10 due to the increase in the movability of the chlorpyrifos molecules as the temperature rises from 283 K to 373 K. With increasing temperature, the qe and removal ratios increased marginally. According to the findings, chlorpyrifos adsorption by HTiO2@AC/SiO2 is an endothermic reaction. The rise in qe from 26.8 to 21.2 mg g−1 (r 0.996, p 0.0003) and 28.6 to 23 mg g−1 (r 0.996, p 0.0003) in dark and visible light, respectively, as well as the percentage of removal from 67 to 52.9 percent (r 0.996, p 0.0003) and 71.6 to 57.5 percent (r 0.996, p 0.0003) in dark and visible light, could be linked to an increase in (283 to 373 K).
Increased pore size and swelling effects on the adsorbent internal structure occur due to rising temperatures, allowing pesticide molecules to penetrate the adsorbent more deeply. Furthermore, the active sites on the adsorbent surface may interact with various pesticide compounds if given enough energy. In another study, chlorpyrifos was found to stick to green pea peels, with similar results [28,29].

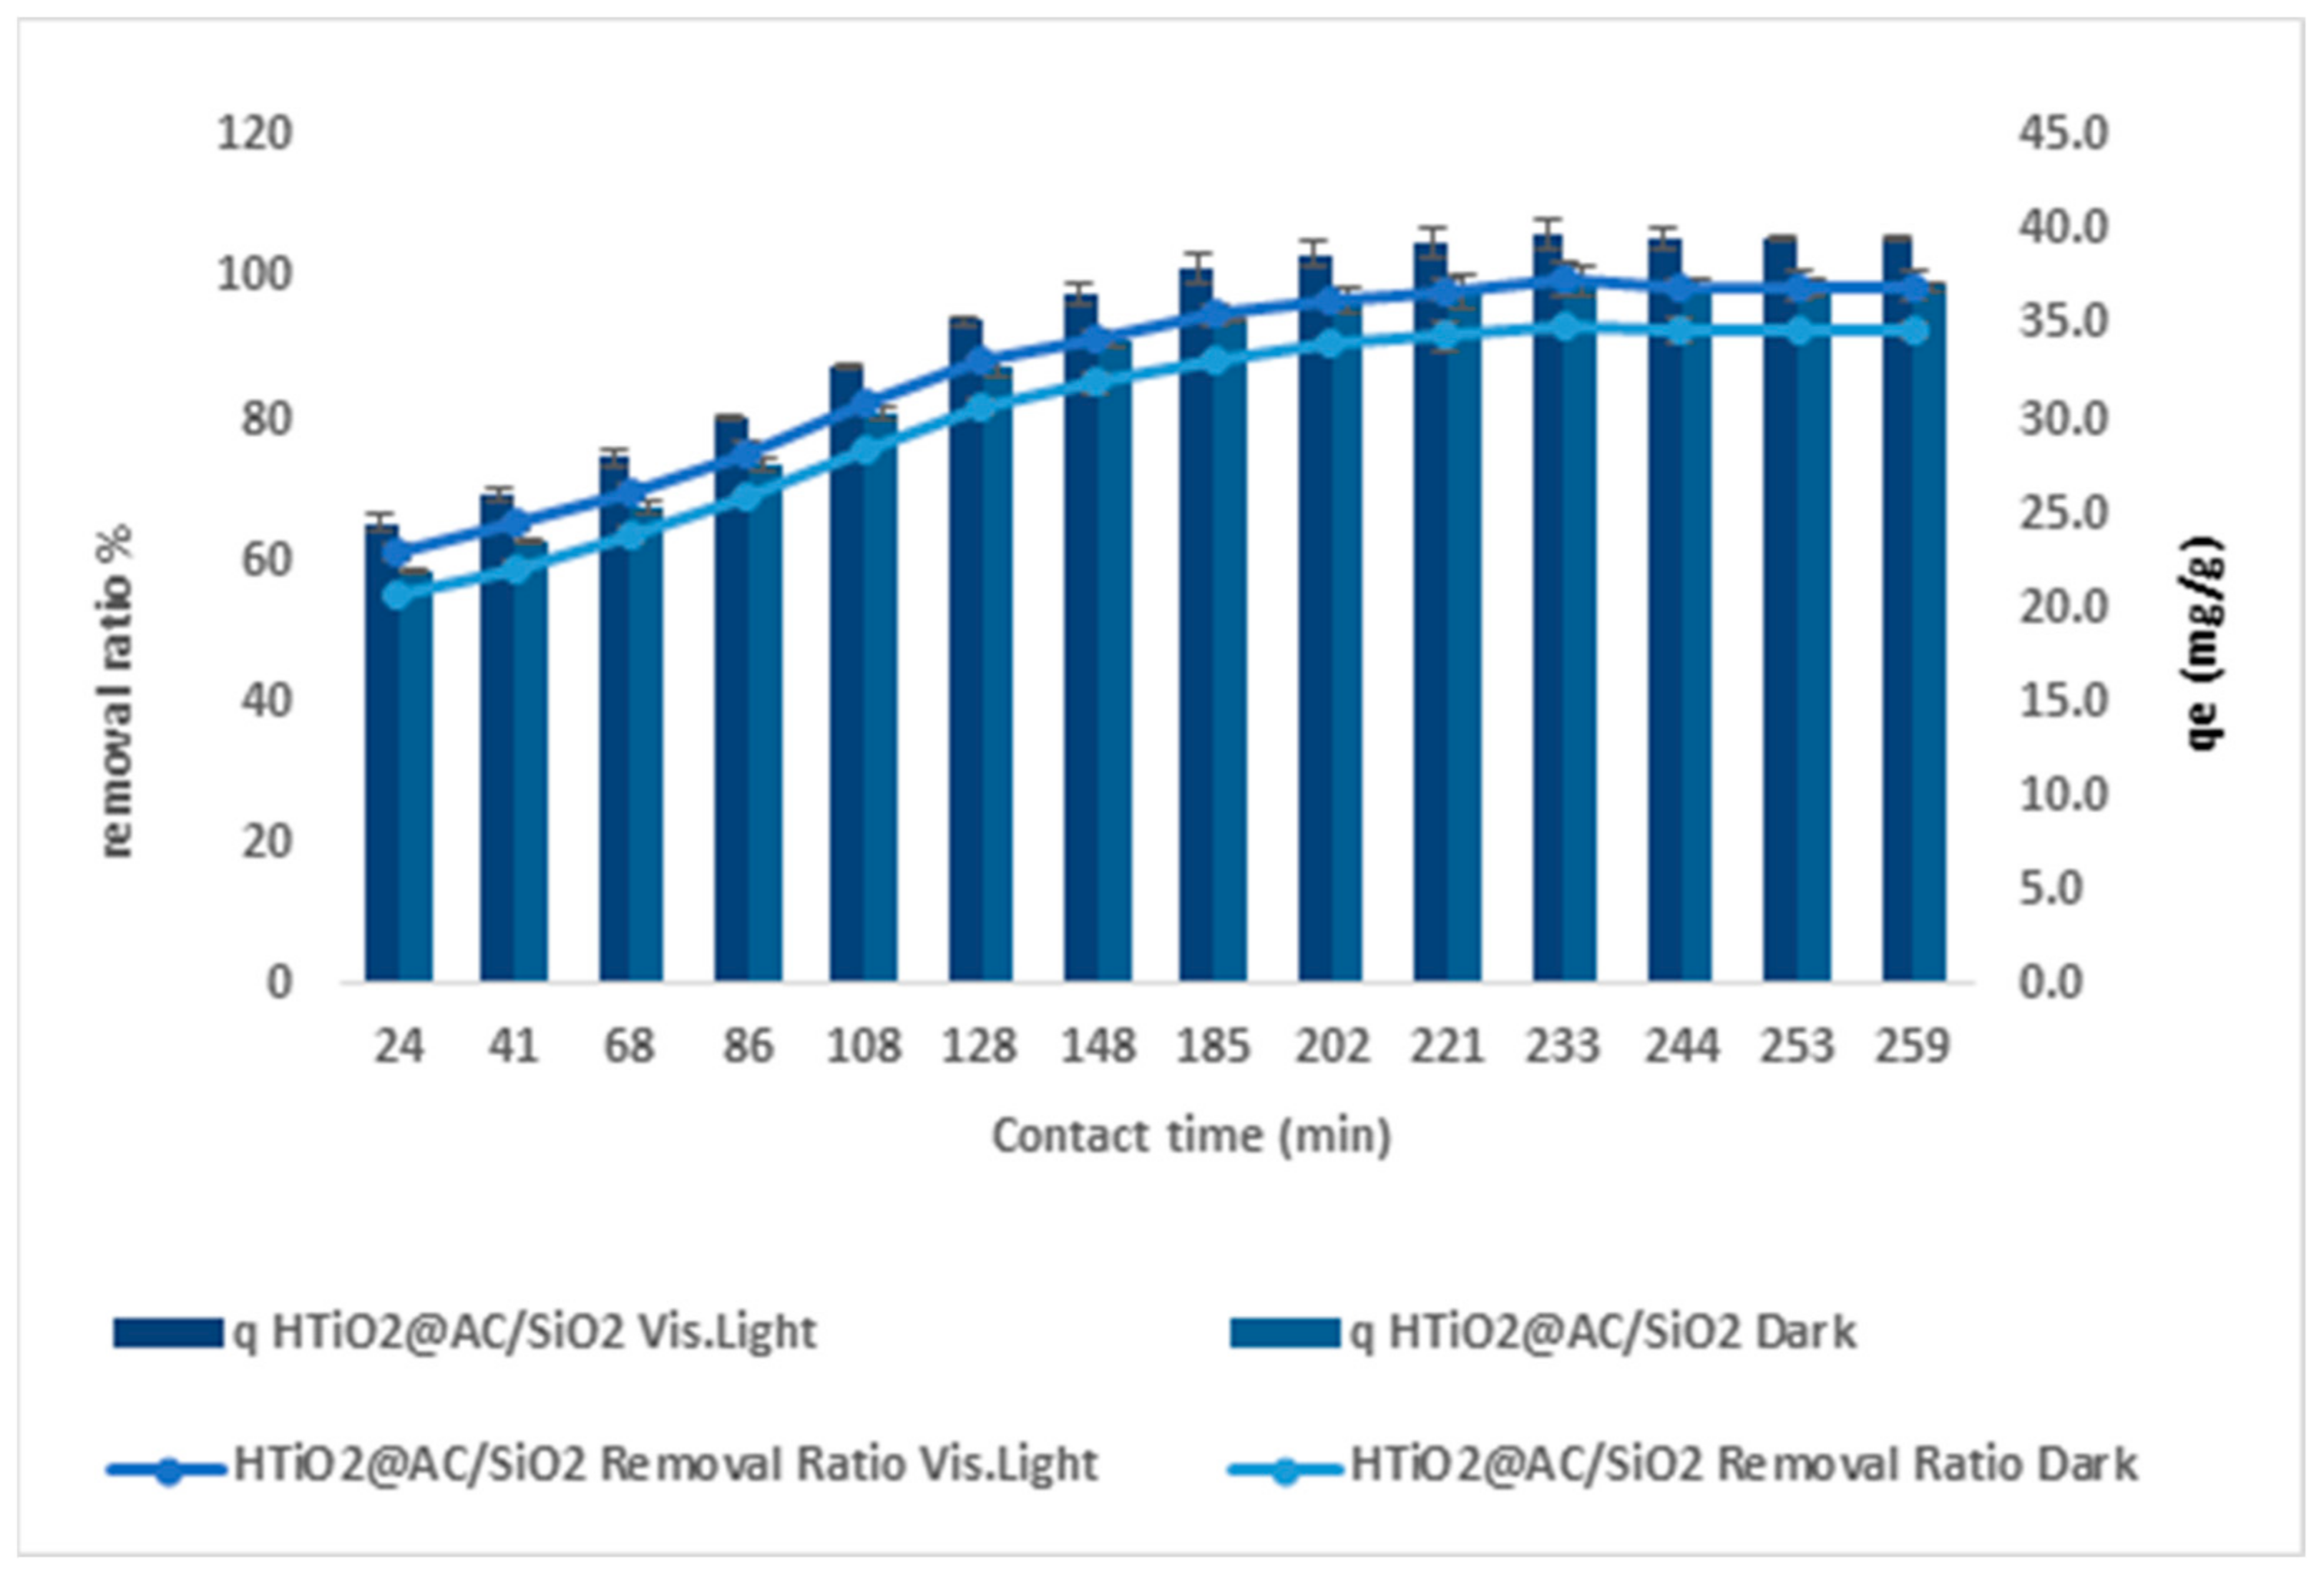
2.2.6. Contact Time and Its Impact

Figure 11 shows the relationship between contact duration, removal efficacy, and chlorpyrifos adsorption capacity at an optimum adsorbent dose of 83 g L−1, a chlorpyrifos concentration of 20 mg L−1, pH = 2.4, and a swirling rate of 425 rpm. Chlorpyrifos removal increased steadily from 55 percent to 92.7 percent and 61.3 percent to 99 percent. The duration increased from 24 to 259 min (r 0.965, p 0.000) in the dark and (r 0.965, p 0.000) in visible light while employing HTiO2@AC/SiO2. At 259 min, qe improved to 37.1 mg g−1 (r 0.965, p 0.000) in the dark and 39.6 mg g−1 (r 0.965, p 0.000) in visible light.
Even after the batch trial was completed for 259 min, an increase in contact time had a significant (p < 0.05) impact on adsorption were observed, showing that contact time is important. A lot of factors have contributed to the long period of equilibrium. The adsorbate diffuses from the surface of the particle to the active site within the pore-filled liquid, then migrates along the pore’s solid surface, where the chlorpyrifos molecule binds to the active sites on the inner surface of the pores, and the chlorpyrifos molecule binds to the active sites on the interior surface of the pores. A quick chlorpyrifos absorption was observed during adsorption, followed by a slower elimination of chlorpyrifos.
The faster and slower phases of pesticide adsorption can be deduced from the number of binding sites on the adsorbent surface and aggregated resistance of chlorpyrifos molecules on the surface [25]. According to the results of this experiment, the amount of chlorpyrifos adsorbed onto activated carbon increased with time until it reached a certain point, beyond which no more chlorpyrifos could be extracted from the solution. According to the findings, chlorpyrifos solutions with 20 mg L-1 starting concentrations took 200 min to reach equilibrium.

2.3. Study of Models

At an initial chlorpyrifos concentration of 20 mg L−1, an appropriate pH, and an optimal adsorbent dosage, the chlorpyrifos adsorption rate was investigated for 200 min at various time intervals. Chlorpyrifos adsorption by HTiO2@AC/SiO2 was studied using isotherm, kinetic, and diffusion models [26].

2.3.1. Isotherm Models

According to adsorption isotherms, the absorption rate of a chemical is proportional to its concentration. Chlorpyrifos adsorption capacity and equilibrium characteristics via HTiO2@AC/SiO2 were investigated using four isotherm models: Langmuir, Freundlich, Dubinin–Radushkevich, and Tempkin [26].

2.3.2. Langmuir Isotherm

The coefficients of determination (R2) for chlorpyrifos were 0.996, 0.997, 0.995, and 0.991, as reported in Table 1. The adsorption of chlorpyrifos by HTiO2@AC/SiO2-Dark and Light was compatible with the Langmuir nonlinear model but not with the linear model. For chlorpyrifos, the K.L. (L mg−1) values were around 0.043 and 0.062 for linear, 0.032 and 0.04 for nonlinear, and the qo (mg g−1) values were around 407.37 and 437.161 for linear, and 427.06 and 462.586 for nonlinear, respectively.
The adsorbed coating appears to be quite thick [27,28]. Chlorpyrifos did not follow Langmuir’s model to the letter.
The Langmuir isotherm’s key characteristics can be described in terms of a dimensionless component (R.L.) as:
R L = 1 1 + K L C o
Table 1 shows the Langmuir model coefficients for chlorpyrifos adsorption using HTiO2@AC/SiO2-Dark and Light, respectively (at 25.00 3.00 °C). The coefficient of determination for chlorpyrifos (R2 = 0.99) was high, indicating that the Langmuir model worked well for HTiO2@AC/SiO2-Light and Dark.

2.3.3. Freundlich Isotherm

The R2 values for chlorpyrifos according to the linear Freundlich model were 0.961, 0.977, 0.977, and 0.991, indicating that the linear model correctly described chlorpyrifos adsorption. For HTiO2@AC/SiO2-Dark and Light, the values of K.F. were 59.442, 77.674, 34.893, and 58.201 mg g−1, while the values of n were 2.834, 3.075, 2.112, and 2.527 L−1 g, respectively. The R2 values for the Freundlich model for HTiO2@AC/SiO2-Dark and Light are provided in Table 1. All model coefficient details were described in [20].
Hui Li et al. [30] investigated the adsorptive properties of polyethylene microplastics (P.E.) with three insecticides in an aqueous solution (Imidacloprid, Buprofezin, Difenoconazole). Imidacloprid, Buprofezin, and Difenoconazole adsorbed (Imidacloprid, Buprofezin) experimental data on polyethylene following Freundlich adsorption isotherms. Table 1 shows the adsorption isotherms for the Freundlich model coefficients, KF, n, and R2.
The linear model for HTiO2@AC/SiO2-Dark and Light produces good R2 values of 0.996, 0.997, 0.995, and 0.991, respectively, when fitting the experimental data to the Langmuir isotherm model. The R2 in the instance of HTiO2@AC/SiO2-Dark is greater than 0.99.
For HTiO2@AC/SiO2-Dark and Light, the nonlinear Freundlich isotherm model values were 0.96 and 0.97, and the linear model values were 0.977 and 0.991, respectively. The nonlinear Tempkin R2 values were 0.968 and 0.941, respectively, and the linear values were 0.968 and 0.941 for HTiO2@AC/SiO2-Light. For HTiO2@AC/SiO2-Dark and HTiO2@AC/SiO2-Light, the Dubinin–Radushkevich R2 for the nonlinear model was 0.676 and 0.966, respectively, linear model, 0.887 and 0.878.
These results show that the Freundlich and nonlinear Langmuir isotherm models can accurately recreate experimental data, whereas the linear Langmuir, Dubinin–Radushkevich, and Tempkin isotherm models cannot.
According to the Langmuir model, HTiO2@AC/SiO2-Dark has a maximum adsorption capacity of 31.27 mg chlorpyrifos/g, while HTiO2@AC/SiO2-Light has a maximum adsorption capacity of 96.6, 70.84 mg chlorpyrifos/g. These values are close to the adsorption isotherm plateau. They are compatible with the reported adsorbed amounts, indicating that the nonlinear models of the adsorption system proposed by Freundlich and Langmuir are correct. Furthermore, the adsorption process in the experimental system could be attributed to monolayer adsorption.
The actual quantities corresponding to the adsorption plateau are lower than the nonlinear regression theoretical monolayer capacity values, indicating that the Dubinin–Radushkevich and Tempkin adsorption system is unsatisfactory, according to the Dubinin–Radushkevich and Tempkin model. On the other hand, Freundlich > Langmuir > Tempkin > Dubinin–Radushkevich best matches the isotherm range for the experimental results in this study.

2.3.4. Models of Kinetics and Diffusion

The film, pore, and intraparticle diffusion assume an immediate interaction between pollutants and active sites concerning diffusion steps, controlling overall diffusion rates [30,31]. Adsorption kinetics were examined using pseudo-first and second-order diffusion models [32].

2.3.5. The Model of Pseudo-First-Order Kinetics

The experimental results were consistent with the computed qe value of the pseudo-first-order model, as shown in Table 2. In addition, for HTiO2-Light, HTiO2@AC/SiO2-Dark and Light, the correlation with the pseudo-first-order model was R2 = 0.932 and 0.933 for linear and R2 = 0.833 and 0.798 for nonlinear, respectively. As a result, this model applies for kinetic adsorption Dark in linear.

2.3.6. The Model of the Pseudo-Second-Order

Table 2 shows the derived data for the pseudo-second-order model: qe (41.14, 77.03 nonlinear, 42.54, 44.82 linear) mg g−1. Furthermore, for HTiO2@AC/SiO2-Dark and Light, the linear model reached R2 = 0.881 and 0.923, respectively, whereas the nonlinear model achieved R2 = 0.987 and 0.989. This indicates that the adsorption of chlorpyrifos followed pseudo-second-order kinetics. When pollutant cations chemically bind to the adsorbent surface, adsorption occurs (usually covalent), the rate-limiting stage occurs, and they tend to find places that maximize their coordination with the surface.

2.3.7. Model of Diffusion

The adsorption rates are controlled by diffusion systems, which are not differentiated in the aforementioned dynamic models. The intraparticle’s dispersion was proved in the light of Weber and Morris’ ideas, which indicate adsorption morphologies. The adsorption rate is determined by the rate at which the adsorbate diffuses to the adsorbent [26]. Table 3 shows the amount of chlorpyrifos adsorbed versus t1/2 (linear) and t (nonlinear) for various initial chlorpyrifos loads. For HTiO2@AC/SiO2-Dark and Light, the model achieves R2 = 0.971 and 0.971, respectively, which does not suit the experimental data well.
The presence of a boundary layer during the early phases of adsorption can be seen in the first segment of an intraparticle diffusion map. Intraparticle diffusion slows dramatically at this time due to the extremely low adsorbate concentrations that remain in the solutions. The progressive adsorption stage is represented by the second section of the linear curve, during which intraparticle diffusion is the rate-limiting component. A third stage, known as the final equilibrium stage, sometimes exists. The second linear segment was used to determine Kid and C. Table 3 shows the estimated intraparticle diffusion parameters for the adsorption process. For a while, a linear relationship existed, but it did not pass through the origin. Although intraparticle diffusion was discovered, it was not the sole rate-controlling mechanism in play [27,30].
The slopes of the lines in stage 2 determine the rates of intra-particle diffusion, kid (Table 3). The maximal value of child for chlorpyrifos using the experimental adsorption setup is 5.836 mg g−1 min−1/2. The intercepts, C, positively correlated with the boundary layer effect, are also generated from the second linear component of the qt vs. t1/2 plots, as shown in Table 3. The HTiO2@AC/SiO2-Dark and Light adsorbents create considerable differences in the linear sections of the qt vs. t1/2 plots near the origin. The mechanism of chlorpyrifos adsorption on HTiO2@AC/SiO2-Dark and Light is complex; furthermore, the adsorption process is not only controlled by the intra-particle diffusion stage, as previously thought [30].
The slopes of the lines in stage 2 determine the rates of intra-particle diffusion as illustrated in Table 3. The maximal value of child for chlorpyrifos using the experimental adsorption setup is 5.836 mg g1 min1/2. The intercepts, C, positively correlated with the boundary layer effect, are also generated from the second linear component of the qt vs. t1/2 plots, as shown in Table 3. The HTiO2@AC/SiO2-Dark and Light adsorbents create considerable differences in the linear sections of the qt vs. t1/2 plots near the origin. The mechanism of chlorpyrifos adsorption on HTiO2@AC/SiO2-Dark and HTiO2@AC/SiO2-Light is complex. The adsorption process is not just controlled by the intra-particle diffusion step, as previously thought [3] (refer to Supplementary Materials):
q t q e = 6 ( D 1 π a 2 ) 0.5 t 0.5 + C
The three-part pattern in chlorpyrifos plots of qt/qe vs. t0.5 is consistent with diffusion. Chlorpyrifos diffusion across the boundary layer from the outer surface of HTiO2@AC/SiO2 displays a dominant control. We can characterize the adsorption kinetics using the pore diffusion model to compare. The following is Reichenberg’s formulation of the pore diffusion equation [31]:
q t q e > 0.85 ,   B t = 0.4977 ln 1 q t q e
q t q e < 0.85 ,     B t = π π π 2 3 × q t q e   2
The fractional absorption of chlorpyrifos (qt/qe) is represented by the square root of time (t0.5). For HTiO2@AC/SiO2, plots of the fractional uptake of chlorpyrifos vs. t0.5 revealed plots with sections indicating an early uptake. The absorption of chlorpyrifos ions into pores followed a pattern similar to intraparticle diffusion, featuring a quick initial adsorption step and a delayed end adsorption stage. Table 3 shows the chlorpyrifos adsorption film diffusion (D1) in the HTiO2@AC/SiO2 based on the slopes of the qt/qe plots against t0.5. The HTiO2@AC/SiO2/chlorpyrifos system generates repulsion from the positively charged chlorpyrifos when it crosses the liquid-layer-pH-positioned adsorbent surface, and roughness on the adsorbent surface is indicated as the reason for the higher D1 value for HTiO2@AC/SiO2 (Michelson et al. [33]). When the film diffusion coefficient is in the 10−6–10−8 cm2 s−1 region, it has been shown that film diffusion plays a role in adsorption. The film diffusion coefficient for HTiO2@AC/SiO2 in our study ranged from 10−7 to 10−8, demonstrating that film diffusion was active during the adsorption of chlorpyrifos on HTiO2@AC/SiO2. The effective pore diffusion coefficient, D2 (m2 S−1), can be calculated using Equation (6) [34].
B = π D 2 r 2
The porosity control sets the mass transfer rate in an ideal linear condition while passing through the original fit (Bt vs. t plot). As a result, it is conceivable to deduce that the film diagram or chemical reaction also controls the adsorption rate. The plot becomes nonlinear or linear only when the intercept differs from zero. The Bt vs. t curves for chlorpyrifos adsorption, as shown in Table 3, were initially unpassed and showed a nonlinear segment at short adsorption durations, confirming previous statements that film dispersion or chemical reactions influence adsorption during that time [22,32,33].
The results of this study were similar to those of [35], where the authors used 0.1, 0.5, 0.8, and 1.2 g of zeolite to investigate the adsorption of the pesticide dichlorodiphenyltrichloroethane (DDT) in an aqueous solution onto the zeolite surface at varying DDT in a range of concentrations, from 5 to 50 mg L−1. In terms of adsorption kinetics and diffusion models, the results show that the pseudo-second-order model best fits the data. Zeolite uses the well-known pseudo-first-order (R2 = 0.997) model for data fitting. As a result, even though DDT adsorption on zeolite is not a first-order reaction, the pseudo-first-order model can describe it. The pseudo-second-order model is a good fit for the experimental data (R2 = 0.995); the results imply that the pseudo-second-order model fits the experimental data reasonably well. The R2 values converged to unity, showing good agreement between experimental and theoretical uptakes. This indicates the appropriateness of the second-order kinetic model for describing DDT adsorption on zeolite. In the DDT adsorption mechanism on the zeolite surface, intraparticle diffusion is not the rate-limiting phase, according to intra-particle models (R2 = 0.866, K1 = 0.448 kg mg−1 h−0.5, C = 0.826). These findings suggest that physical adsorption is the primary action method for activated carbon. Due to macropores, mesopores, and micropores, physical adsorption is the chemical attachment of a non-polar adsorbate to a very large surface area. The kinetic isotherm parameters were calculated using a linear least-squares regression methodology and a trial-and-error nonlinear regression method in Microsoft Excel. The pseudo-first- and pseudo-second-order kinetic parameters were determined by trial and error using the “solver add-in” in Microsoft Excel in the nonlinear technique. The nonlinear approach produced pseudo-first-order and pseudo-second kinetic models compared to the actual data for chlorpyrifos sorption using HTiO2@AC/SiO2-Dark and HTiO2@AC/SiO2-Light [36,37].

2.4. Thermodynamic Study

The integral form of the Van’t Hoff equation, Equation (7), was used to calculate thermodynamic characteristics.
ln K e = Δ S R Δ H R . T .
where Ke denotes equilibrium constants (calculated from Ke = (CoCe)/Ce) [15], i.e., ΔS modifies entropies (kJ/K/mol), H modifies enthalpy (kJ/mol), and ΔG modifies Gibb’s free energy (kJ/mol). T is the temperature in degrees (K) and R is the universal gas constant (8.314103 kJ/mol/K). The Gibbs (ΔG) free energy change can be estimated with Equation (8):
K e = C o C e C e
Δ G = RT   ln K e
The formulae in Equations (7)–(9) were used to calculate the thermodynamic characteristics shown in Table 4. The findings are listed below: ΔG, H, and ΔS. The approach is viable and the adsorption of chlorpyrifos onto HTiO2@AC/SiO2 is a spontaneous process, as indicated by the negative G value. The absolute value of ΔG increases as temperature rises, indicating that adsorption at a higher temperature is more favorable to an endothermic operation. The percentage of chlorpyrifos eliminated from the water increases as the temperature rises.
Furthermore, a negative value for H indicates that chlorpyrifos adsorption on HTiO2@AC/SiO2 is exothermal. Negative ΔS implies that the system’s randomness reduces after adsorption at the solid–liquid interface. Chlorpyrifos and lead adsorption investigation on polyaniline-grafted cross-linked chitosan beads yielded similar results (G.X.C.S.) [20,24].

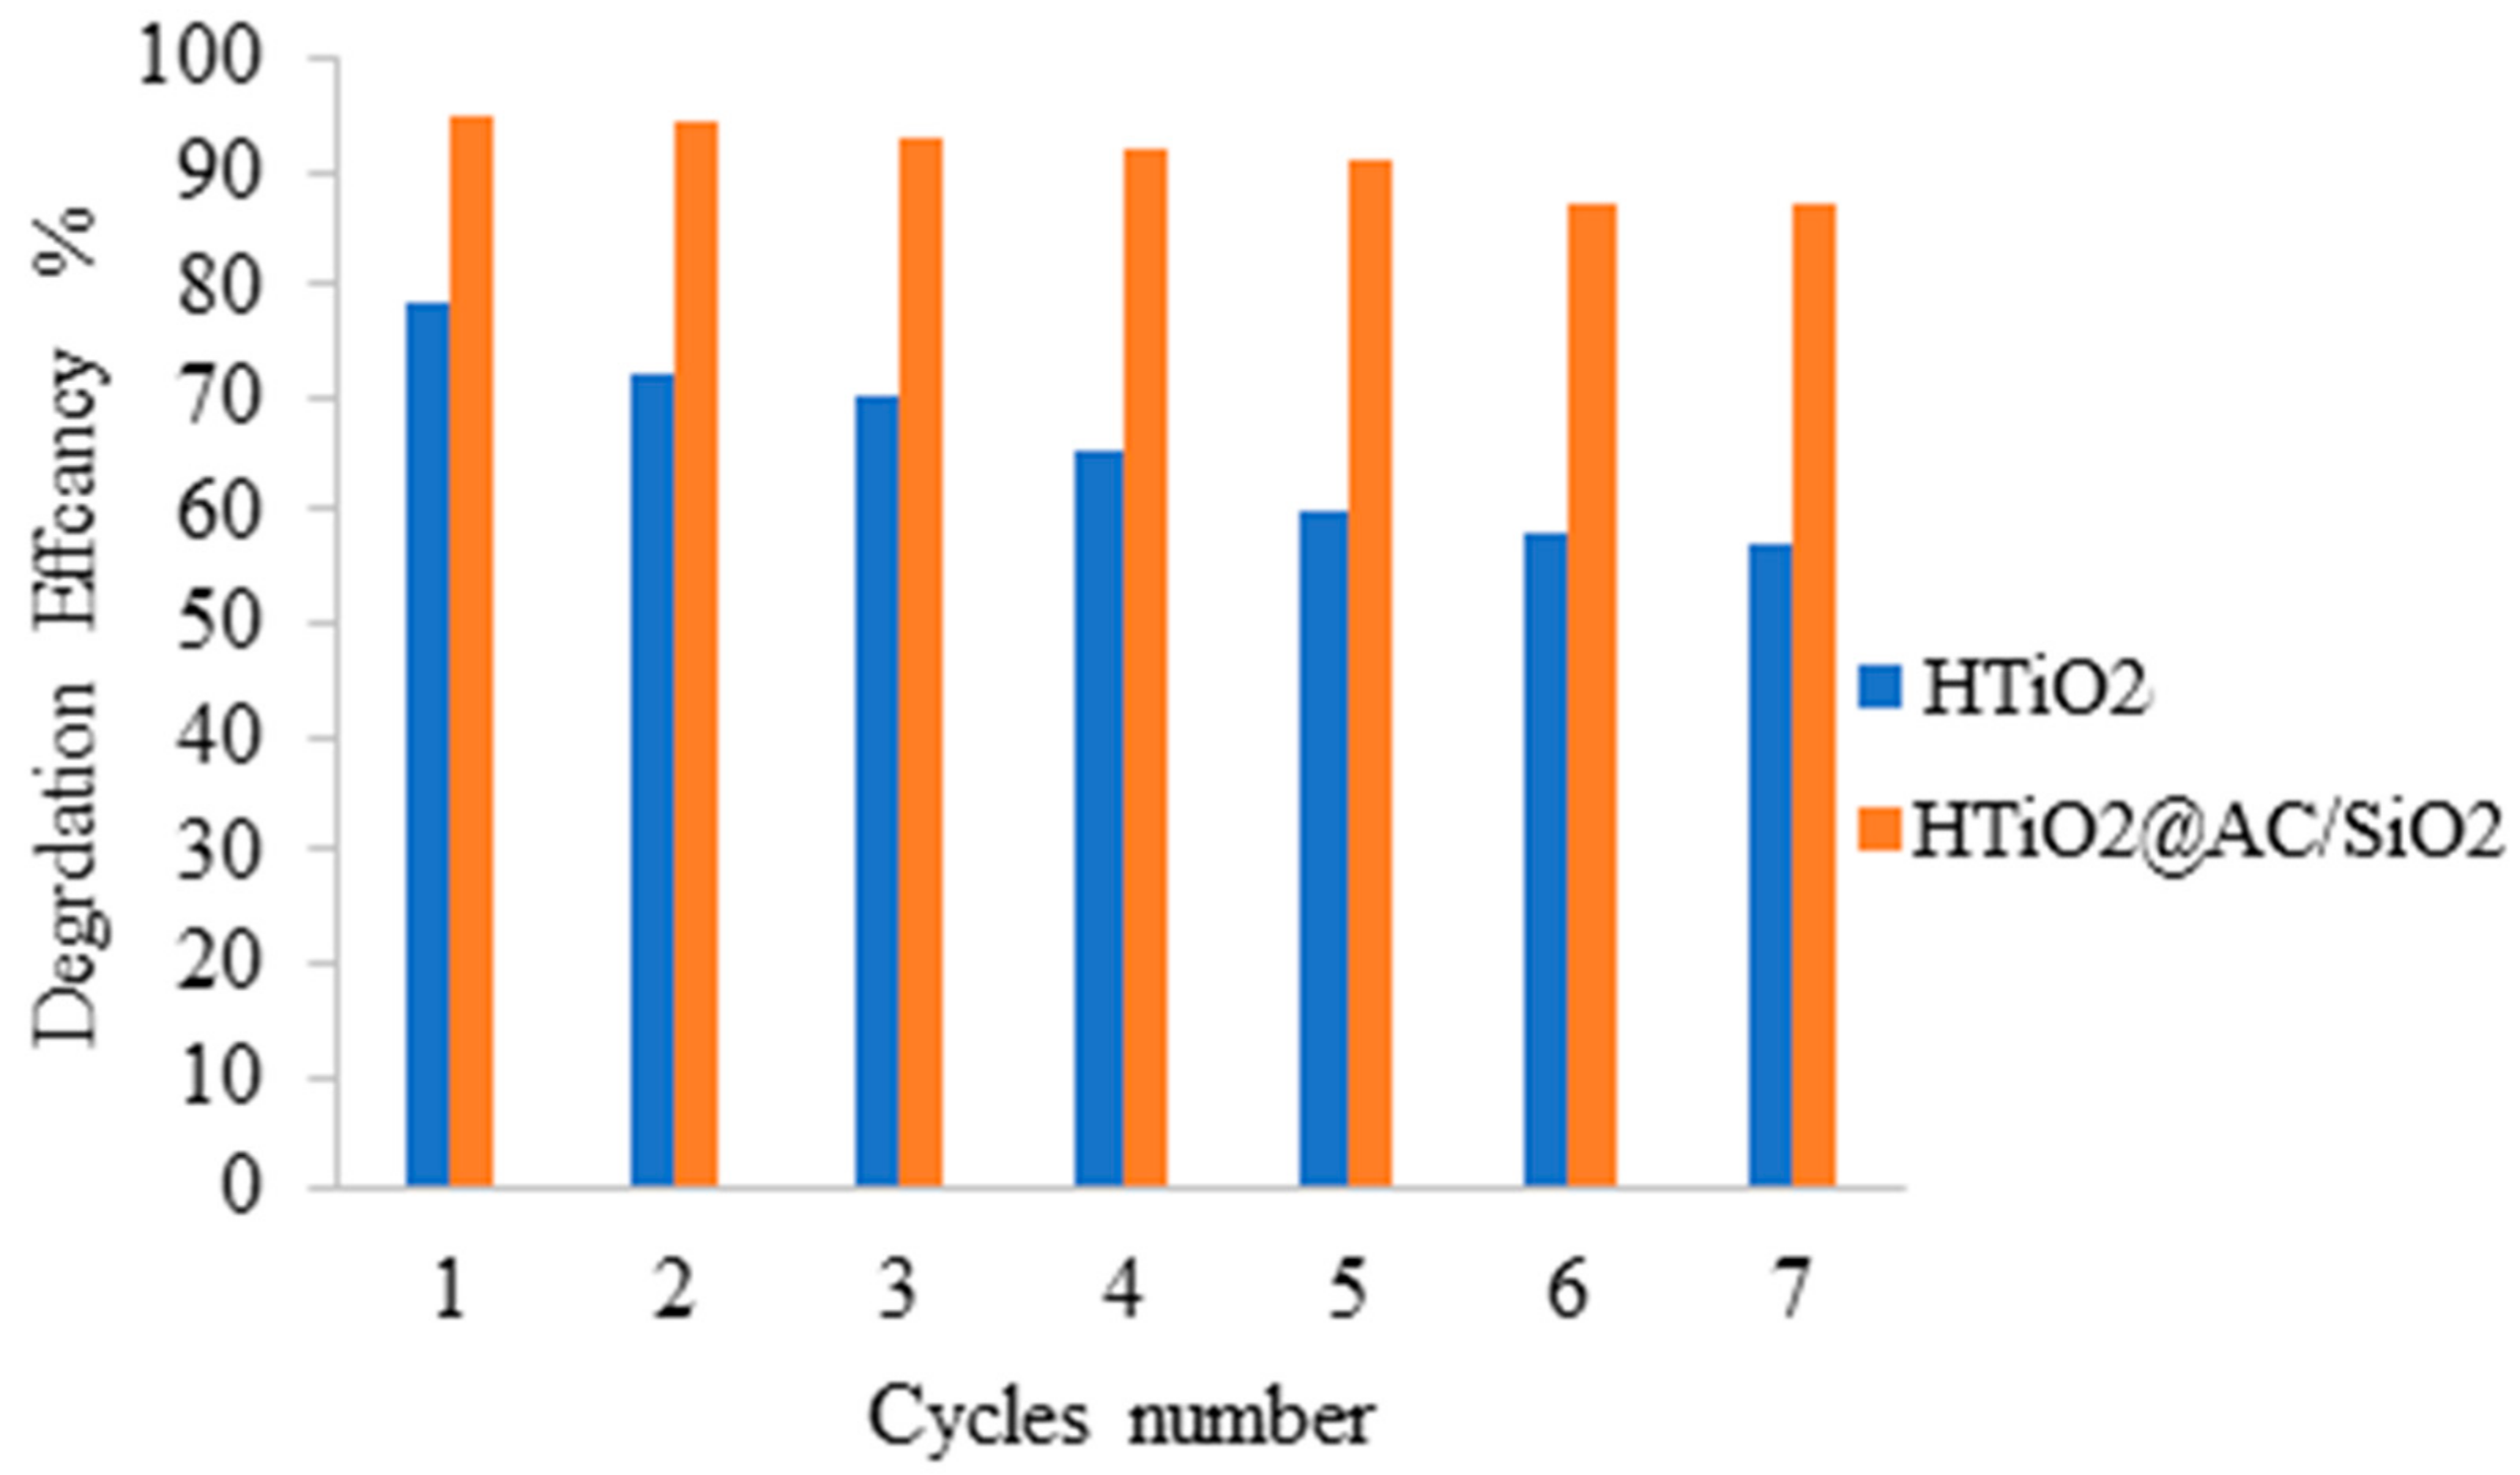
2.5. Photocatalytic Materials Can Be Reused

Repeated degradation studies were conducted under optimum settings to investigate the proposed photocatalysts’ reusability. The suspension was centrifuged at the end of the degrading process, and the catalyst was rinsed with water and dried at 110 °C for future use (Figure 12). For the supported HTiO2@AC/SiO2 and HTiO2 materials, HTiO2@AC/SiO2 and HTiO2, the loss in degrading efficiency is not considerable. However, with a small reduction in the COD, the activity of the unsupported titania powder, HTiO2, decreases. These findings show that utilizing a porous HTiO2@AC/SiO2 has a favorable effect, resulting in greater photocatalytic activity, improved material stability, and a TOC value approaching 2 mg/L in all seven cycles, value to 80 from 100 mg/L.

2.6. Mechanism of Photodegradation

Chlorpyrifos photodegradation involves: (i) demethylation; (ii) shattering the core aromatic ring of chlorpyrifos and then the side aromatic rings; (iii) converting the fragments created in the previous two processes to intermediate species; and (iv) converting these intermediates to the final products, such as CO2, H2O, SO42−, and NH4a+. The shattering of the aromatic ring of chlorpyrifos produces most reaction intermediates. Pesticide fragments degrade into additional reactive intermediates, such as aldehyde, carboxylic species, phenols, and amines, ultimately converted into H2O, CO2, ammonium ions, and sulfate ions. Usually, O2 and OH radicals are responsible for the degradation of chlorpyrifos and were determined via ESR measurements under full-spectrum irradiation in H2O and methanol. Signals with intensity ratios of 1:2:2:1 and 1:1:1:1, the characteristic ratios for OH and O2, were visible in the data [38].

3. Materials and Methods

3.1. Materials

The National Company for Fertilizers and Chemicals provided analytical-grade chlorpyrifos (Agrochem, Saratoga Springs, NY, USA). We acquired (NH4OH), (Ti (OH)4), (TiCl4), HCl, and NaOH from Sigma-Aldrich (St. Louis, MO, USA). Nearby farmland provided samples of rice straw. Serial dilutions of analytical-grade chlorpyrifos in dual-distilled water were performed without altering the pH. All tests and chemical analyses in this study were conducted with this stock solution.

3.2. Rice-Straw-Activated Carbon Silica Composite Synthesis

Samples of rice straw were gathered from a local farm. Small pieces of rice straw were cut from the straw, rinsed, and dried for 24 h at 110 degrees Celsius. Rice straw with less than 5% moisture level was chosen for further investigation. Pulverized rice straw was sieved to collect particles with a 60 mesh size. All solvents and compounds were bought commercially from Sigma-Aldrich Corporation (St. Louis, MO, USA) and were either high-performance liquid chromatography (HPLC) quality or analytical grade.

3.3. Carbonization Step

The lignin with the greatest content was chosen to proceed to the carbonization stage. In a furnace, the rice straw material was carbonized for 3 h at 500 °C. The activated carbon/amorphous silica (AC/SiO2) was obtained after carbonization, and the samples were refrigerated in a desiccator to ambient temperature before being analyzed for chlorpyrifos adsorption.

3.4. Activation Step

Activated carbon is made by two processes: carbonization and activation. In an anoxic environment, carbonization occurs at 450 to 600 °C (often molecular nitrogen). Hydrocarbon molecules and carbonaceous byproducts are formed as the source material degrades. The most volatile chemicals are removed as gaseous wastes. As a result of the porosity of the carbon created during the carbonization, the stage is still insufficient for most applications; it should be improved further. Physical or chemical activation can be used to make activated carbons. Physical activation is usually conducted with carbon dioxide or steam at 700 to 900 °C (water vapor). Dehydrating agents, such as zinc chloride or phosphoric acid, are the most common chemicals in chemical activation. To mention a few, alkali metal salts, hydroxides, and potassium and sodium carbonates are commonly used. However, in the preparation procedure, variable combinations of these two can be used [39].
The activation process was carried out at 100 °C for 3 h using an activating agent of 85% H3PO4 and 85% K.O.H [20].

3.5. HTiO2@AC/SiO2 Nanocomposite Synthesis

The sol–gel method was used to create the HTiO2@AC/SiO2 composite: TiCl4 was added to deionized water at a rate of 10 mL/min while the mixture was constantly stirred at a temperature of 4 °C ± 1 °C. The solution or sol of titanium hydroxide (Ti(OH)4) was prepared. Activated charcoal was added to the sol in various amounts (0, 5, 10, 20, 25, and 30 wt % AC). A droplet of 30 percent v/v ammonium hydroxide (NH4OH) was continuously added until the gel was formed. After that, it was dried for four hours at 100 °C after being washed with distilled water. The dried TiO2 and HTiO2@AC/SiO2 gels were heated to 500 °C at 10 °C min−1 in a nitrogen environment. The sample was dried at 500 °C for another 4 h. However, at 500 °C, there was a minor breakdown of AC (approximately 5%). This number was considered appropriate for using AC as catalyst support [11].

3.6. Photocatalysis

The composite catalyst’s photocatalytic activity (HTiO2@AC/SiO2): The degradation of chlorpyrifos in an aqueous solution under sunlight irradiation was measured. Photospectrometry (JASCO 7800) at 270 nm was used to measure chlorpyrifos concentrations, a cost-effective and acceptable method. A calibration curve based on a starting chlorpyrifos concentration of 100 mgL−1 in distilled water and its serial dilution was used to convert the changes in absorbance to chlorpyrifos concentrations (C/C0 over time) [15]. One hour before being exposed to light, 200 mL of chlorpyrifos solution and 0.4 g of catalyst were mixed in the dark at 30 °C. Pesticide samples were taken every 30 min while the mixture was exposed to the sun for three hours [16].

3.7. Material Characterization

SEM determined powder morphology and homogeneity (Quanta 450 FEG, F.E.I. Company, North Brabant, Netherlands). Images were taken with a secondary electron detector, 5 kV electron beam, 5 mm working distance, and 100,000× magnification. K.E.V.E.X performs EDS (EDS). Si (Li) Brüker determines powder particle chemical composition. XRD precautions and details have been described in detail in [20]. The Brunauer–Emmett–Teller (BET) method was used to determine the specific surface area, SBET, with relative pressure, p/p0, between 0.05 and 0.1. The reactor digestion method, which relies on acidic bichromate oxidation, was used to compute the Chemical Oxygen Demand (COD). After 24 h of outgassing at 10−5 Pa, nitrogen adsorption–desorption isotherms were determined at −196 °C (Fisons Sorptomatic 1990). SBET was determined using the Brunauer–Emmett–Teller (BET) method with p/p0 between 0.05 and 0.1. The acidic bichromate oxidation reactor digestion method was used to calculate COD.

3.8. Adsorption Activity

In 600 mL Erlenmeyer flasks, 500 mL of 300 mg L−1 chlorpyrifos was added, then mixed with 50 mg L−1 HTiO2@AC/SiO2 in an orbital shaker 310 K stirred at 220 rpm. Next, 50 mL water samples were taken at predetermined intervals (every 20 min) for chlorpyrifos measurement. The equilibrium period of the adsorbent was calculated using the following variables: pH, temperature, stirring, and the initial concentration of chlorpyrifos. The pH of the adsorbent, which can change the surface charge of the adsorbent and have ramifications for pesticide removal, is a crucial component impacting adsorption [33,39,40]. This parameter was examined at 1.3, 4, 5, 6, 7, 8, and 9. Temperature also has an impact on adsorption. As a result, this factor was adjusted to 310 to 373 K to determine its effect on chlorpyrifos elimination by the composite. The sample was extracted and analyzed as in [17]. The sample preparation and analysis are described in detail in [20].
Equations (10) and (11) were used to calculate the pesticides’ adsorption capacity qe (mg g−1) and the composite’s elimination efficacy R (%):
Adsorption Capacity:
q e mg / g = ( C o C e )   V W
Removal efficiency [41,42,43]:
R % = ( C o C e ) C o × 100
The pesticide solutions have a starting concentration of Co and a final concentration of Ce (mg/L). The volume of the adsorbate solution is denoted by V. The dry adsorbent mass W is represented by the variables (g). Before adding the adsorbent, 0.1 M HCL and/or 0.1 N NaOH were used to adjust the pH of the solution. To see which was better, kinetic experiments were compared to equilibrium examinations. Different aqueous sample collection times were utilized for pesticide concentrations.

4. Conclusions

The results illustrate how experimental variables, such as adsorbent dosages, pH levels, temperature, pesticide concentration, and contact time, affect chlorpyrifos adsorption capability. The maximum chlorpyrifos adsorption capacity was 462.6 (mg g−1) at pH = 2.4, the dosage of HTiO2@AC/SiO2 83 mg L−1, initial chlorpyrifos concentration from 20 mg L−1, agitation speed of 425 rpm, and contact time was 259 min. Experimental data at equilibrium are well-suited to the Langmuir and Freundlich isotherms, based on correlation coefficients (R2 = 0.997, 0.994). Some of the advantages of the adsorbent utilized in this investigation may become apparent in the future. According to adsorption kinetics, the pseudo-second-order linear model is best represented during adsorption. There is some marginal improvement in removal for the visible light sample compared to dark. The AC/SiO2 sample has a mesoporous pore size distribution (2–20 nm) better suited for chlorpyrifos adsorption; this is described based on physical attributes. According to the findings, HTiO2@AC/SiO2 is a potential wastewater treatment option that is both efficient and cost effective. HTiO2@AC/SiO2 can be recycled and reused, according to chlorpyrifos desorption experiments. Due to its high and low chlorpyrifos levels, ease of regeneration, and high-desorption and -sorption capacity regeneration feasibility, HTiO2@AC/SiO2 has shown exceptional adsorption performance. According to the findings, nano-HTiO2@AC/SiO2 composites will be useful as an adsorbent material for the breakdown of various pesticides in the future.

Supplementary Materials

The following supporting information can be downloaded at: https://www.mdpi.com/article/10.3390/catal12070714/s1, Equations Models.

Author Contributions

Conceptualization, A.E.M., M.F.M. and A.E.S.; methodology, A.E.M., M.F.M. and A.E.S.; software, A.H.R. and S.R.A.-M.; validation, A.E.M., M.F.M. and A.E.S.; formal analysis, A.H.R. and S.R.A.-M.; investigation, A.E.S., M.F.M. and A.E.M.; resources, A.H.R. and S.R.A.-M.; data curation, A.E.M., M.F.M. and A.E.S.; writing—original draft preparation, A.E.M., M.F.M. and A.E.S.; writing—review and editing, A.E.S., M.F.M. and A.E.M.; visualization, S.R.A.-M. and A.H.R.; supervision, A.E.S. and M.F.M., project administration, A.E.S. and M.F.M.; funding acquisition, A.H.R. and S.R.A.-M. All authors have read and agreed to the published version of the manuscript.

Funding

The Dean of Science and Research at King Khalid University assisted and funded this research through the General Research Project: Grant number (R.G.P.1/114/43).

Acknowledgments

The authors thank King Khalid University’s Dean of Science and Research for financial support.

Conflicts of Interest

The authors declare no conflict of interest.

References

  1. Yang, Y.; Chen, C.; Sun, H. LiVPO4F@C particles anchored on boron-doped graphene sheets with outstanding Li+ storage performance for high-voltage Li-ion battery. Solid State Ion. 2019, 331, 6–11. [Google Scholar] [CrossRef]
  2. Aktar, M.W.; Sengupta, D.; Chowdhury, A. Impact of pesticides use in agriculture: Their benefits and hazards. Interdiscip. Toxicol. 2009, 2, 1–12. [Google Scholar] [CrossRef] [PubMed] [Green Version]
  3. Challis, J.K.; Cuscito, L.D.; Joudan, S.; Luong, K.H.; Knapp, C.W.; Hanson, M.L.; Wong, C.S. Inputs, source apportionment, and transboundary transport of pesticides and other polar organic contaminants along the lower Red River, Manitoba, Canada. Sci. Total Environ. 2018, 635, 803–816. [Google Scholar] [CrossRef] [PubMed] [Green Version]
  4. Posthuma, L.; Zijp, M.C.; De Zwart, D.; Van de Meent, D.; Globevnik, L.; Koprivsek, M.; Focks, A.; Van Gils, J.; Birk, S. Chemical pollution imposes limitations to the ecological status of European surface waters. Sci. Rep. 2020, 10, 14825. [Google Scholar] [CrossRef] [PubMed]
  5. Morrissey, C.A.; Mineau, P.; Devries, J.H.; Sanchez-Bayo, F.; Liess, M.; Cavallaro, M.C.; Liber, K. Neonicotinoid contamination of global surface waters and associated risk to aquatic invertebrates: A review. Environ. Int. 2015, 74, 291–303. [Google Scholar] [CrossRef]
  6. Zhang, S.; Jiao, Z.; Zhao, X.; Sun, M.; Feng, X. Environmental exposure to 17β-trenbolone during adolescence inhibits social interaction in male mice. Environ. Pollut. 2021, 289, 117710. [Google Scholar] [CrossRef]
  7. Ali, H.; Khan, E.; Ilahi, I. Environmental Chemistry, and Ecotoxicology of Hazardous Heavy Metals: Environmental Persistence, Toxicity, and Bioaccumulation. J. Chem. 2019, 2019, 6730305. [Google Scholar] [CrossRef] [Green Version]
  8. Trojanowicz, M. Removal of persistent organic pollutants (P.O.P.s) from waters and wastewaters by the use of ionizing radiation. Sci. Total Environ. 2020, 718, 134425. [Google Scholar] [CrossRef]
  9. Bel Hadjltaief, H.; Omri, A.; Ben Zina, M.; Da Costa, P.; Galvez, M.E. Titanium Dioxide Supported on Different Porous Materials as Photocatalyst for the Degradation of Methyl Green in Wastewaters. Adv. Mater. Sci. Eng. 2015, 2015, 759853. [Google Scholar] [CrossRef] [Green Version]
  10. Dutt, M.A.; Hanif, M.A.; Nadeem, F.; Bhatti, H.N. A review of advances in engineered composite materials popular for wastewater treatment. J. Environ. Chem. Eng. 2020, 8, 104073. [Google Scholar] [CrossRef]
  11. Szczepanik, B.; Rogala, P.; Słomkiewicz, P.M.; Banaś, D.; Kubala-Kukuś, A.; Stabrawa, I. Synthesis, characterization and photocatalytic activity of TiO2-halloysite and Fe2O3-halloysite nanocomposites for photodegradation of chloroanilines in water. Appl. Clay Sci. 2017, 149, 118–126. [Google Scholar] [CrossRef]
  12. Etacheri, V.; Di Valentin, C.; Schneider, J.; Bahnemann, D.; Pillai, S.C. Visible-light activation of TiO2 photocatalysts: Advances in theory and experiments. J. Photochem. Photobiol. C Photochem. Rev. 2015, 25, 1–29. [Google Scholar] [CrossRef] [Green Version]
  13. Lu, L.; Shan, R.; Shi, Y.; Wang, S.; Yuan, H. A novel TiO2/biochar composite catalysts for photocatalytic degradation of methyl orange. Chemosphere 2019, 222, 391–398. [Google Scholar] [CrossRef]
  14. Pinna, M.; Binda, G.; Altomare, M.; Marelli, M.; Dossi, C.; Monticelli, D.; Spanu, D.; Recchia, S. Biochar Nanoparticles over TiO2 Nanotube Arrays: A Green Co-Catalyst to Boost the Photocatalytic Degradation of Organic Pollutants. Catalysts 2021, 11, 1048. [Google Scholar] [CrossRef]
  15. Pastrana-Martínez, L.; López-Ramón, M.; Moreno-Castilla, C. Adsorption and thermal desorption of the herbicide fluroxypyr on activated carbon fibers and cloth at different pH values. J. Colloid Interface Sci. 2009, 331, 2–7. [Google Scholar] [CrossRef]
  16. Rao, A.; Kumar, A.; Dhodapkar, R.; Pal, S. Adsorption of five emerging contaminants on activated carbon from aqueous medium: Kinetic characteristics and computational modeling for plausible mechanism. Environ. Sci. Pollut. Res. 2021, 28, 21347–21358. [Google Scholar] [CrossRef]
  17. Derylo-Marczewska, A.; Blachnio, M.; Marczewski, A.W.; Seczkowska, M.; Tarasiuk, B. Phenoxyacid pesticide adsorption on activated carbon—Equilibrium and kinetics. Chemosphere 2019, 214, 349–360. [Google Scholar] [CrossRef]
  18. Mohammad, S.G.; Ahmed, S.M. Preparation of environmentally friendly activated carbon for removal of pesticide from aqueous media. Int. J. Ind. Chem. 2017, 8, 121–132. [Google Scholar] [CrossRef] [Green Version]
  19. Kaur, Y.; Bhatia, Y.; Chaudhary, S.; Chaudhary, G.R. Comparative performance of bare and functionalize ZnO nanoadsorbents for pesticide removal from aqueous solution. J. Mol. Liq. 2017, 234, 94–103. [Google Scholar] [CrossRef]
  20. El Shahawy, A.H.; Ragab, A.; Mubarak, M.F.; Ahmed, I.A.; Mousa, A.E.; Bader, D. Removing the Oxamyl from Aqueous Solution by a Green Synthesized HTiO2@ AC/SiO2 Nanocomposite: Combined Effects of Adsorption and Photocatalysis. Catalysts 2022, 12, 163. [Google Scholar] [CrossRef]
  21. Farghali, R.A.; Sobhi, M.; Gaber, S.E.; Ibrahim, H.; Elshehy, E.A. Adsorption of organochlorine pesticides on modified porous Al30/bentonite: Kinetic and thermodynamic studies. Arab. J. Chem. 2020, 13, 6730–6740. [Google Scholar] [CrossRef]
  22. Priyan, V.V.; Shahnaz, T.; Suganya, E.; Sivaprakasam, S.; Narayanasamy, S. Ecotoxicological assessment of micropollutant Diclofenac biosorption on magnetic sawdust: Phyto, Microbial and Fish toxicity studies. J. Hazard. Mater. 2021, 403, 123532. [Google Scholar] [CrossRef]
  23. da Silva, A.J.F.; de Alencar Moura, M.C.P.; da Silva Santos, E.; Pereira, J.E.S.; de Barros Neto, E.L. Copper removal using carnauba straw powder: Equilibrium, kinetics, and thermodynamic studies. J. Environ. Chem. Eng. 2018, 6, 6828–6835. [Google Scholar] [CrossRef]
  24. Wang, X.Q.; Liu, J.; Zhang, N.; Yang, H. Adsorption, mobility, biotic and abiotic metabolism and degradation of pesticide exianliumi in three types of farmland. Chemosphere 2020, 254, 126741. [Google Scholar] [CrossRef]
  25. Wang, Y.; Lin, C.; Liu, X.; Ren, W.; Huang, X.; He, M.; Ouyang, W. Efficient removal of acetochlor pesticide from water using magnetic activated carbon: Adsorption performance, mechanism, and regeneration exploration. Sci. Total Environ. 2021, 778, 146353. [Google Scholar] [CrossRef]
  26. Gacem, M.A.; Telli, A.; Ould El Hadj Khelil, A. Chapter 15—Nanomaterials for detection, degradation, and adsorption of pesticides from water and wastewater. In Aquananotechnology; Abd-Elsalam, K.A., Zahid, M., Eds.; Elsevier: Amsterdam, The Netherlands, 2021; pp. 325–346. [Google Scholar] [CrossRef]
  27. Rodríguez-Liébana, J.A.; Peña, A. Differences in the sorption kinetics of various non-ionisable pesticides in a limited number of agricultural soils from the Mediterranean basin. J. Environ. Manag. 2020, 276, 111336. [Google Scholar] [CrossRef]
  28. Selmi, T.; Seffen, M.; Celzard, A.; Fierro, V. Effect of the adsorption pH and Temperature on the parameters of the Brouers-Sotolongo models. Environ. Sci. Pollut. Res. Int. 2020, 27, 23437–23446. [Google Scholar] [CrossRef]
  29. Albroomi, H.I.; Elsayed, M.A.; Baraka, A.; Abdelmaged, M.A. Batch and fixed-bed adsorption of tartrazine azo-dye onto activated carbon prepared from apricot stones. Appl. Water Sci. 2016, 7, 2063–2074. [Google Scholar] [CrossRef] [Green Version]
  30. Li, H.; Wang, F.; Li, J.; Deng, S.; Zhang, S. Adsorption of three pesticides on polyethylene microplastics in aqueous solutions: Kinetics, isotherms, thermodynamics, and molecular dynamics simulation. Chemosphere 2021, 264, 128556. [Google Scholar] [CrossRef]
  31. Van Pham, T.; Van Tran, T.; Duy Nguyen, T.; Thi Hong Tham, N.; Thanh Tri Quang, P.; Thi To Uyen, D.; Thi Hong Le, N.; Vo, D.-V.N.; Trung Thanh, N.; Giang Bach, L. Adsorption behavior of Congo red dye from aqueous solutions onto exfoliated graphite as an adsorbent: Kinetic and isotherm studies. Mater. Today Proc. 2019, 18, 4449–4457. [Google Scholar] [CrossRef]
  32. Mueses, M.A.; Colina-Márquez, J.; Machuca-Martínez, F.; Li Puma, G. Recent advances on modeling of solar heterogeneous photocatalytic reactors applied for degradation of pharmaceuticals and emerging organic contaminants in water. Curr. Opin. Green Sustain. Chem. 2021, 30, 100486. [Google Scholar] [CrossRef]
  33. Yeganeh, M.; Charkhloo, E.; Reza Sobhi, H.; Esrafili, A.; Gholami, M. Photocatalytic processes associated with degradation of pesticides in aqueous solutions: Systematic review and meta-analysis. Chem. Eng. J. 2021, 428, 130081. [Google Scholar] [CrossRef]
  34. Umar, M.; Abdul, H. Photocatalytic Degradation of Organic Pollutants in Water. In Organic Pollutants—Monitoring, Risk and Treatment; IntechOpen: London, UK, 2013. [Google Scholar] [CrossRef] [Green Version]
  35. Ahmed, S.M.; Taha, M.R.; Taha, O.M.E. Kinetics and isotherms of dichlorodiphenyltrichloroethane (DDT.) adsorption using soil–zeolite mixture. Nanotechnol. Environ. Eng. 2018, 3, 4. [Google Scholar] [CrossRef]
  36. Zhu, Y.; Liu, Y.; Miller, K.A.; Zhu, H.; Egap, E. Lead halide perovskite nanocrystals as photocatalysts for PET-RAFT polymerization under visible and near-infrared irradiation. ACS Macro Lett. 2020, 9, 725–730. [Google Scholar] [CrossRef]
  37. Zhu, Y.; Liu, Y.; Ai, Q.; Gao, G.; Yuan, L.; Fang, Q.; Tian, X.; Zhang, X.; Egap, E.; Ajayan, P.M.; et al. In situ synthesis of lead-free halide perovskite—COF nanocomposites as photocatalysts for photoinduced polymerization in both organic and aqueous phases. ACS Mater. Lett. 2022, 4, 464–471. [Google Scholar] [CrossRef]
  38. Khan, I.; Saeed, K.; Zekker, I.; Zhang, B.; Hendi, A.H.; Ahmad, A.; Ahmad, S.; Zada, N.; Ahmad, H.; Shah, L.A. Review on Methylene Blue: Its Properties, Uses, Toxicity and Photodegradation. Water 2022, 14, 242. [Google Scholar] [CrossRef]
  39. Kumar, R.; Singh, L.; Zularisam, A. Microbial fuel cells: Types and applications. In Waste Biomass Management—A Holistic Approach; Springer: Berlin/Heidelberg, Germany, 2017; pp. 367–384. [Google Scholar]
  40. Nasrollahzadeh, M.S.; Hadavifar, M.; Ghasemi, S.S.; Arab Chamjangali, M. Synthesis of ZnO nanostructure using activated carbon for photocatalytic degradation of methyl orange from aqueous solutions. Appl. Water Sci. 2018, 8, 104. [Google Scholar] [CrossRef] [Green Version]
  41. Ghasemi, B.; Anvaripour, B.; Jorfi, S.; Jaafarzadeh, N. Enhanced Photocatalytic Degradation and Mineralization of Furfural Using U.V.C./TiO2/G.A.C. Composite in Aqueous Solution. Int. J. Photoenergy 2016, 2016, 2782607. [Google Scholar] [CrossRef]
  42. El-Maghrabi, H.H.; Hosny, R.; Ramzi, M.; Zayed, M.A.; Fathy, M. Preparation and Characterization of Novel Magnetic ZnFe2O4–Hydroxyapatite Core-Shell Nanocomposite and Its Use as Fixed Bed Column System for Removal of Oil Residue in Oily Wastewater Samples. Egypt. J. Pet. 2019, 28, 137–144. [Google Scholar] [CrossRef]
  43. Dotto, G.L.; Cadaval, T.; Pinto, L. Preparation of bionanoparticles derived from Spirulina platensis and its application for Cr (VI) removal from aqueous solutions. J. Ind. Eng. Chem. 2012, 18, 1925–1930. [Google Scholar] [CrossRef]
Figure 1. XRD patterns.
Catalysts 12 00714 g001
Figure 2. Examination of HTiO2 particle anchoring on AC/SiO2 surface; TEM (a) and EDx (b) analysis of HTiO2 particle anchoring on the surface of AC/SiO2.
Catalysts 12 00714 g002aCatalysts 12 00714 g002b
Figure 3. SEM of the composite [20].
Catalysts 12 00714 g003
Figure 4. Adsorption–desorption isotherm.
Catalysts 12 00714 g004
Figure 5. The reflectance spectra.
Catalysts 12 00714 g005
Figure 6. pH effect.
Catalysts 12 00714 g006
Figure 7. HTiO2@AC/SiO2 doses effect.
Catalysts 12 00714 g007
Figure 8. Chlorpyrifos concentration effect.
Catalysts 12 00714 g008
Figure 9. Stirrer rate effect.
Catalysts 12 00714 g009
Figure 10. Temperature effect on HTiO2@AC/SiO2.
Catalysts 12 00714 g010
Figure 11. Contact time effect.
Catalysts 12 00714 g011
Figure 12. Chlorpyrifos degradation by using the produced photocatalysts repeatedly.
Catalysts 12 00714 g012
Table 1. Isothermal model.
LangmuirX-Y AxisHTiO2@AC/SiO2 Caseqo (mg g−1)K.L. (L mg−1)R.L.R2
Nonlinear :   q e   = q o K L C e 1 + K L C e q e     Vs .   C e Dark42.7060.0320.606–0.0710.996
Light46.2580.040.558–0.0590.997
Linear :   C e / q e = 1 / q o K L + C e / q o Ce / q e   Vs .   C e Dark40.7370.0430.533–0.0540.995
Light43.71610.0620.444–0.0380.991
Freundlich Kfn R2
Nonlinear :   q e = K f C e 1 / n   q e     Vs .   C e Dark59.4422.834 0.961
Light77.6743.075 0.977
Linear :   ln q e = ln K F + 1 n ln C e - ln q e   Vs .     ln C e Dark34.8932.112 0.977
Light58.2012.527 0.991
Dubinin–Radushkevich Model qmβER2
Nonlinear : q e = q m e x p β ε 2 q e   Vs .   ε 2 Dark278.1691.130 × 10−6665.0450.676
Light380.0343.497 × 10−5119.5690.966
Linear :   ln q e = ln q m β ε 2 l n   q e   Vs .   ε 2 Dark278.1691.130 × 10−6665.0450.887
Light299.8082.113 × 10−71538.1790.878
Tempkin Model bK.T.BR2
Nonlinear :   q e = R T b ln ( K T C e ) - q e     Vs .   C e Dark36.0530.96368.7210.968
Light40.8393.165260.6670.941
Linear :   q e = R T b ln K T + R T b ln C e q e     Vs .   l n   C e Dark36.0530.96368.7210.968
Light40.8393.165260.6670.941
Table 2. Biosorption kinetics.
The Pseudo-First-Order HTiO2@AC/SiO2 Conditionk1
min−1
qe
mg g−1
R2
NonlinearDark0.0236.070.833
Light0.0338.30.798
LinearDark0.0242.80.932
Light0.0240.670.933
The Pseudo-Second-Order K2
g mg−1 min−1
qe
mg g−1
R2
NonlinearDark0.00141.140.881
Light0.00063177.030.923
LinearDark0.00142.540.987
Light0.00144.820.989
Table 3. Diffusion model.
Diffusion Model Composite Casek1
mg g−1 min−0.5
C
mg g−1
R2
NonlinearDark1.0390.000.971
Light1.4817.120.971
LinearDark1.4814.620.971
Light1.4817.120.971
Pore Diffusion kp
min−0.5
Dii
cm2 min−1
R2
Dark0.0752.752 × 10−80.979
Light0.0823.272 × 10−80.978
Film Diffusion kfd
min−1
Dii
cm2 min−1
R2
Dark0.0134.051 × 10−80.99
Light0.0026.197 × 10−80.98
Table 4. The Thermodynamic model.
The Thermodynamic Temp.Composite Condition ΔG (KJ/mol)ΔH (KJ/mol)ΔS (KJ/mol)R2Ke Model
ln K e = Δ S R Δ H R . T . Nonlinear :   Δ G = RT   ln K e 298.15Dark−1.38−5.720.0140.9971.78
Light−1.89−6.010.0140.9962.185
ln K e = Δ S R Δ H R . T . Linear : Δ G = RT   ln K e 298.15Dark−1.38−5.7170.0140.9970.574
Light−1.89−6.010.0140.9970.782
Publisher’s Note: MDPI stays neutral with regard to jurisdictional claims in published maps and institutional affiliations.

