Article

Sodium Percarbonate Activation by Plasma-Generated Ozone for Catalytic Degradation of Dye Wastewater: Role of Active Species and Degradation Process

College of Biology and the Environment, Nanjing Forestry University, Nanjing 210037, China
*
Author to whom correspondence should be addressed.
These authors contributed equally to this work.
Catalysts 2022, 12(7), 681; https://doi.org/10.3390/catal12070681
Submission received: 3 June 2022 / Revised: 16 June 2022 / Accepted: 20 June 2022 / Published: 22 June 2022

Abstract

:
In this paper, sodium percarbonate (SPC) was activated by ozone (O3) from plasma for catalytic treatment of dye wastewater. Methyl blue (MB), a typical industrial dye, was selected as the target dye contaminant. Results showed that enhancing O3 dosage and reducing MB concentration were beneficial to MB degradation. Compared to acid condition, a higher removal efficiency of MB was obtained in alkaline condition. With an increase of SPC dosage, the removal efficiency of MB first was raised, and then it declined. Under the optimal dosage of 50 mg/L, the removal efficiency of MB reached 85.7% with 30 min treatment time. The energy efficiency was improved from 5.21 g/kWh to 5.71 g/kWh. A synergetic effect can be established between O3 and SPC. Radical capture experiments verified that ·OH, ·O2, 1O2, and ·CO3 played important parts in MB degradation. With increasing reaction time, the amount of total organic carbon (TOC) declined and the amount of ammonia nitrogen (NH3-N) increased. The addition of SPC enhanced the solution’s pH value and conductivity. The degradation pathway was proposed based on density functional theory (DFT) analysis and relevant literatures. The toxicity of MB was alleviated after O3/SPC treatment. The O3/SPC process was also suitable for the treatment of other dyes and actual wastewater.

1. Introduction

The amount of hazardous substances has increased dramatically with the development of industrialization. According to statistics, 10–15% of all dyes are released into the environment during production and use [1]. A great majority of these dyes are very stable and do not easily degrade naturally after entering environmental waters. This can affect the normal life activities of plants and aquatic animals, and even disturb the ecological balance of water bodies [2]. More seriously, dyes are mostly comprised of toxic substances with carcinogenic and teratogenic effects, and their discharge into the environment constitutes a great threat to the health of humans [3]. Therefore, treatment of dye wastewater using efficient technology has become an urgent task.
Various methods have been adopted for the treatment of dye wastewater, such as adsorption [4,5], membrane separation [6,7], ion exchange [8,9], biological treatment [10,11], and advanced oxidation processes (AOPs) [12,13,14]. Although activated carbon and other physical adsorbents have good adsorption effects, most adsorbents are not ideal for the adsorption of soluble dyes [15]. They easily adsorb large molecular weight and non-polar dyes, but the cost is expensive, making it difficult to use them for the treatment of concentrated pollutants. Membrane separation technology was considered as a new high efficiency separation, concentration, and purification technology, having the advantages of high separation efficiency, simple process, convenient operation, easy control, and no pollution [16]. However, in practical application, the main disadvantages are high investment and operation costs, membrane clogging, advanced pretreatment, and regular chemical clean. Ion exchange mainly refers to the exchange of ions between wastewater and adsorbent. Although ion exchange can effectively remove dye, the cost of this method is higher, and the exchange membrane needs backwashing and regeneration [17]. Biological methods have been widely studied for dye wastewater treatment because of their low cost, simple operation, and environmental friendliness [18]. The traditional biological treatment technology has been mature, whereas it is difficult to achieve a satisfactory treatment effect since dye wastewater has the characteristic of high concentration and refractory biodegradation. Moreover, the relatively long treatment times and strict reaction conditions have also restricted their development [10].
Currently, AOPs have been deemed some of the most promising technologies for wastewater treatment, including Fenton [19], cavitation [20], ozonation [21], and photocatalytic oxidation [22]. Among these methods, ozonation is usually considered an eco-friendly and practical process for the elimination of dye contaminants. However, its ability to oxidize some dye molecules or their intermediates is very low, leading to limited mineralization efficiency. Moreover, the formation efficiency of free radicals from ozone was relatively low, especially in the acidic pH range. In recent years, the peroxone process has attracted increasing attention because it effectively improves the efficiency of ozone degradation and the mineralization of pollutants [23,24,25]. In the presence of H2O2, more active free radicals will be generated because of accelerated ozone decomposition, which can significantly accelerate pollutant oxidation. However, the rapid decomposition and explosion of liquid H2O2 in the process of transportation and storage will bring safety risks. Special facilities are required and relevant practitioners need to be trained before dealing with liquid H2O2, which leads to additional costs and limits the practical application [26]. Therefore, the search for alternative oxidants to replace the role of hydrogen peroxide in pollutant remediation has aroused great interest. As a promising in situ chemical oxidation oxidant, sodium percarbonate (2Na2CO3·3H2O2, SP), is considered a potential alternative to H2O2, and has a wider application prospect in contaminated water since its operation is safer and does not introduce any additional, potentially harmful, byproducts into the water matrix [27,28,29,30].
O3 can be generated via various methods, such as the electrochemical method, the photochemical method, and the dielectric barrier discharge (DBD) plasma method [31]. Of those methods, the DBD plasma method is the most widely used to produce O3 with lower energy consumption, a larger ozone output per unit, and higher market share [32]. Thus, we proposed the use of SP activated by plasma-generated O3 for dye wastewater treatment. Methyl blue (MB), a typical industrial dye, can cause adverse symptoms, physiological reactions, and even physiological toxicity with excessive exposure to the environment. Therefore, MP was selected as the target contaminant [33]. The effects of ozone dosage, initial solution concentration, pH value, and SP dosage on dye removal were investigated first. Then, the role of the active species was inspected with various scavengers, including p-benzoquinone, isopropanol, triethylenediamine, and indole. Subsequently, the variation of pH, conductivity, total organic carbon (TOC), chemical oxygen demand (COD), and ammonia nitrogen was measured. The degradation pathways were proposed according to density functional theory (DFT) and previous literature. The toxicities of intermediates were estimated based on the US Environmental Protection Agency Toxicity Estimation Software Tool (US-EPA-TEST). Lastly, the application of O3/SP for other dye degradation and actual wastewater treatment was evaluated.

2. Results

2.1. Effect of O3 Concentration

O3 concentration is a critical parameter for the ozonation degradation process. The effect of O3 concentration on SMX removal was inspected first, and the results are shown in Figure 1a. MB concentration decreased quickly with increasing O3 concentration, suggesting that higher O3 concentration was conductive to MB elimination. When concentration enhanced from 2.0 mg/min to 8.0 mg/min, the removal efficiency increased from 55.9% to 81.7%. The kinetic fitting curve is shown as inset Figure 1a, exhibiting that MB degradation was expedited with higher O3 concentration. When O3 concentration was 2.0 mg/min, 4.0 mg/min, 6.0 mg/min, and 8.0 mg/min, the kinetic constant reached 0.030 min−1, 0.049 min−1, 0.055 min−1 and 0.067 min−1, respectively. Based on Henry’s law, increasing unit volume concentration could increase mass transfer driving force, thus improving O3 mass transfer rate from gas phase to liquid phase [34]. As a result, the removal efficiency of MB was enhanced with higher O3 concentration.

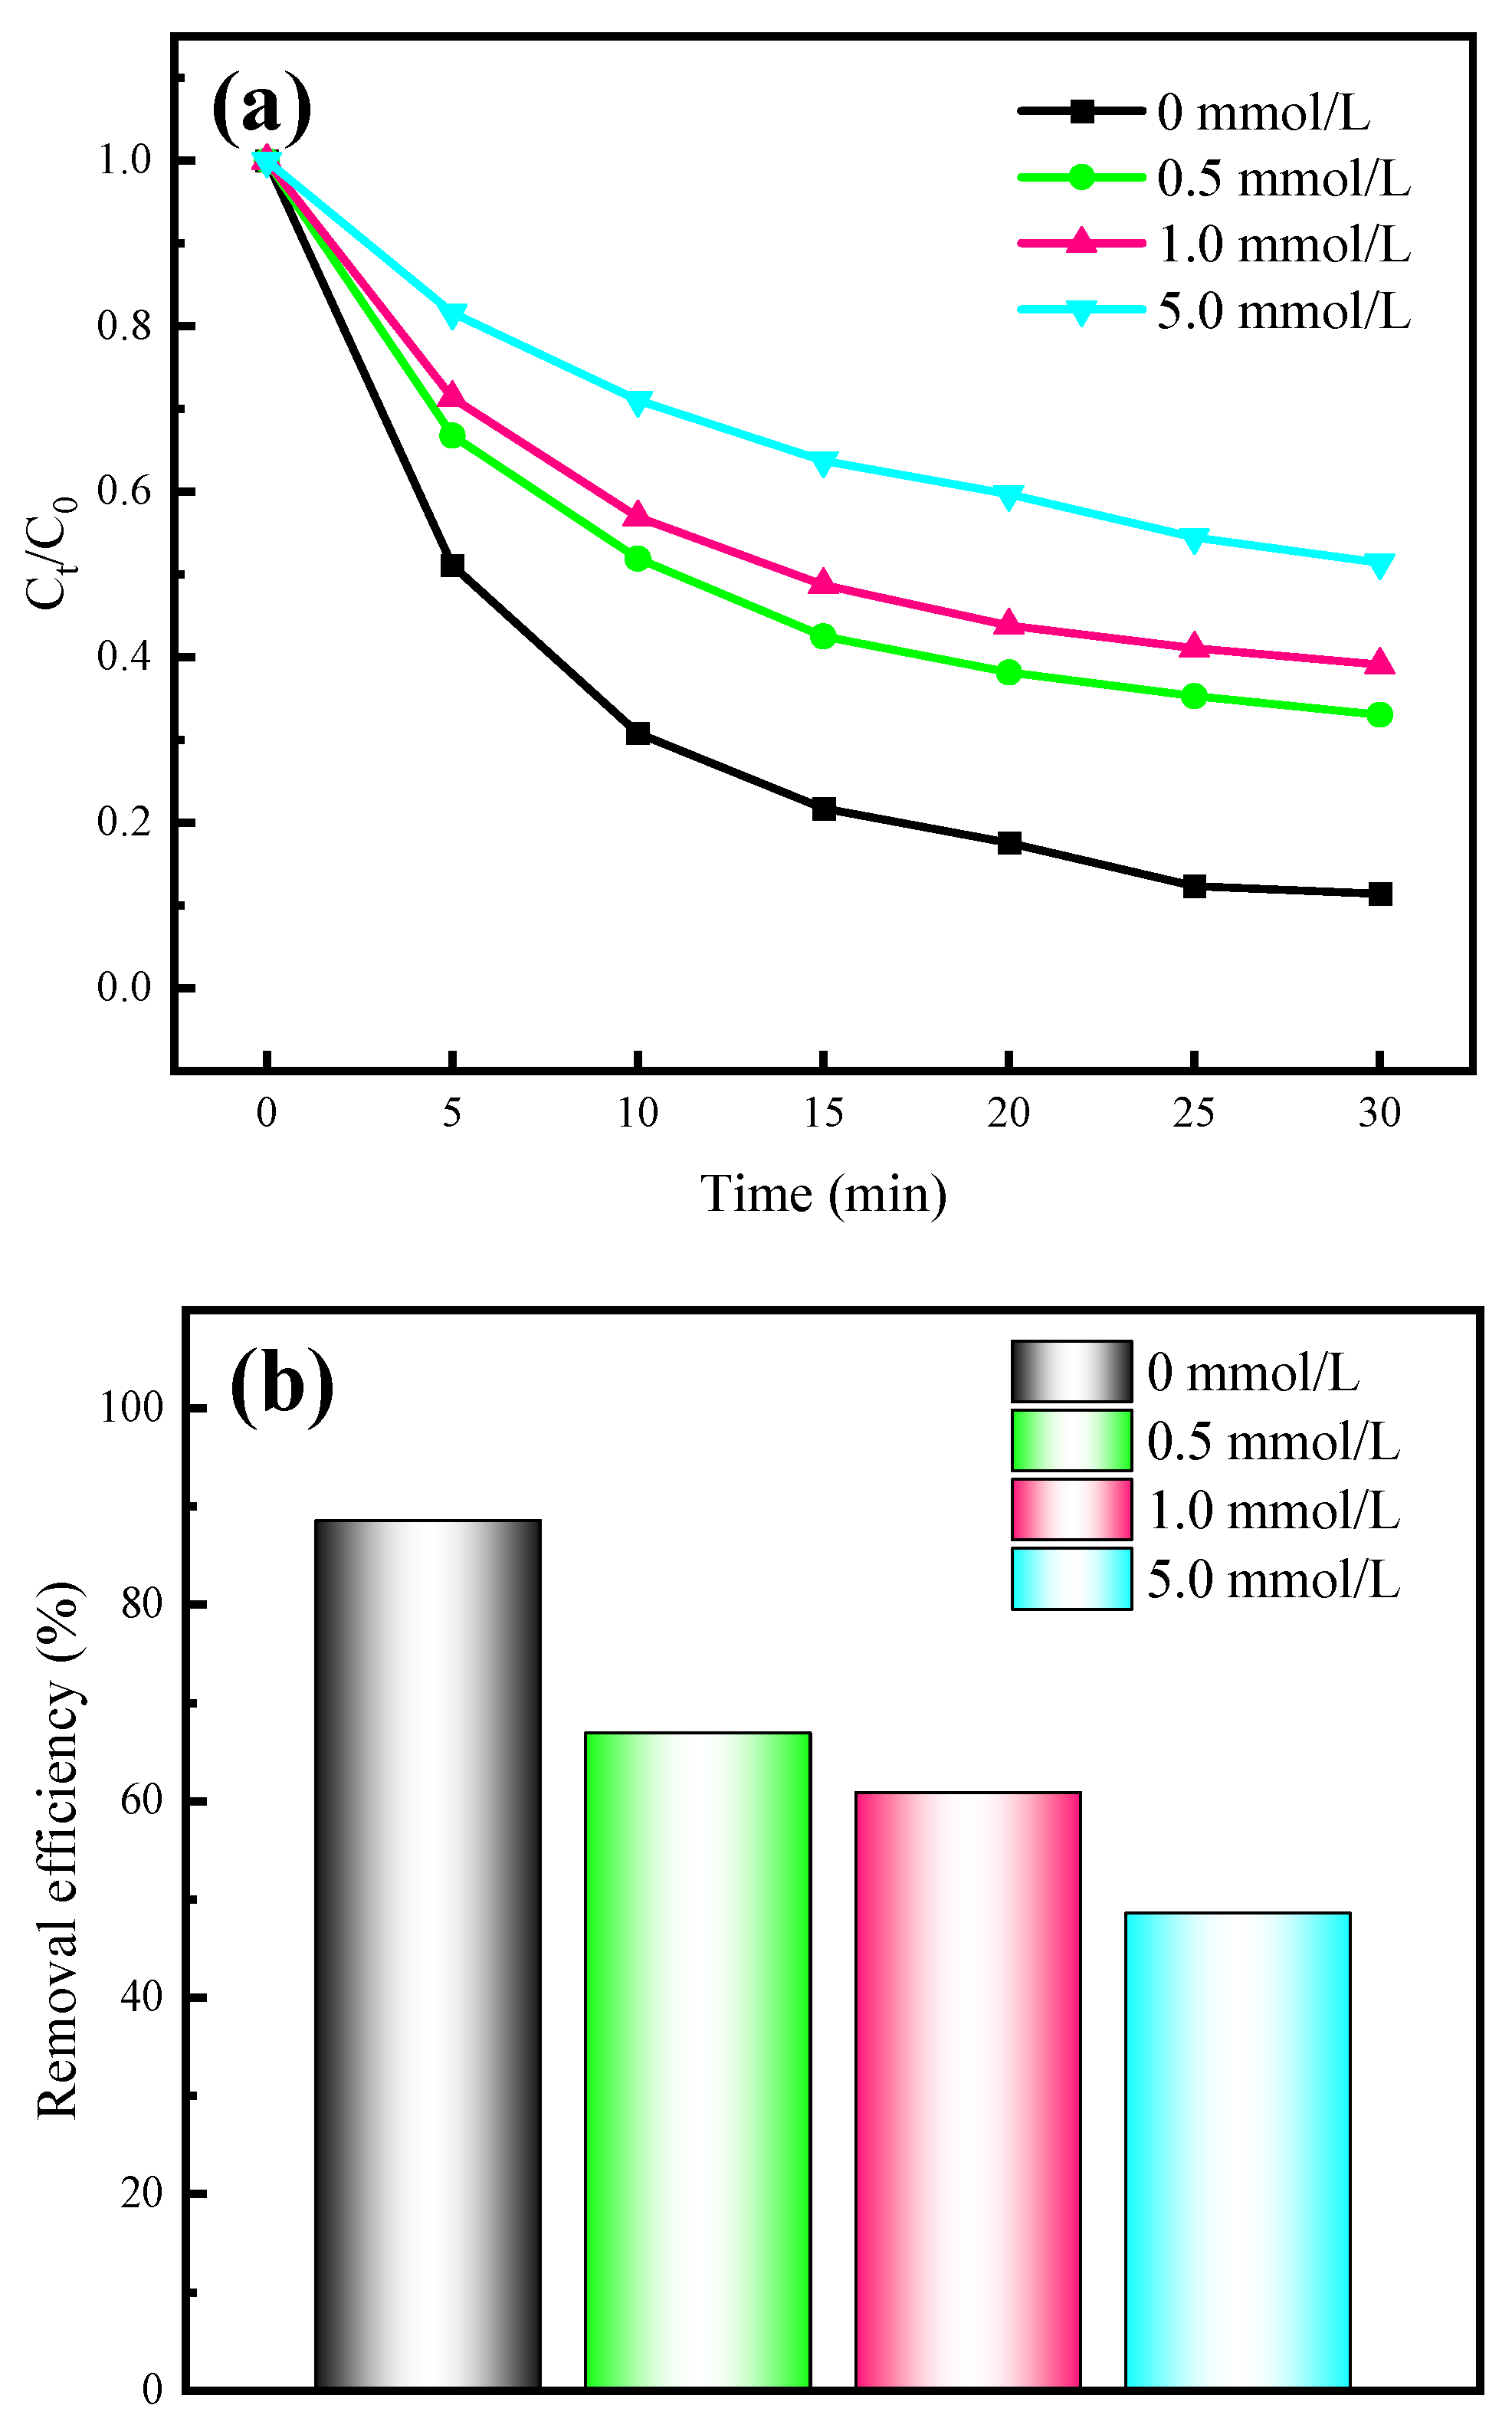
2.2. Effect of MB Concentration

The removal efficiency of various MB concentrations was shown in Figure 1b. It can be seen that higher MB concentration inhibits MB degradation. When the MB concentration was enhanced from 25 mg/L to 50 mg/L, 75 mg/L, and 100 mg/L, the removal efficiency declined from 85.9% to 75.9%, 69.5%, and 62.6%, respectively. Additionally, the removed quantity of MB increased with higher MB concentration, which reached 21.5 mg, 37.9 mg, 52.1 mg and 62.5 mg under MB concentration of 25 mg/L to 50 mg/L, 75 mg/L, and 100 mg/L, respectively. The inset Figure 1b presents the kinetic fitting curve under various MB concentrations, illustrating that the MB degradation rate was reduced by higher MB concentration. Under fixed ozone concentration, the produced active species in water was also definite. With an increase of MB concentration, the amount of pollutants and intermediates in the reaction system would be elevated, and a competitive relationship between MB molecules and their degradation intermediates would exist. However, by increasing the initial concentration, the collision probability between MB and active species was raised. Thus, the absolute removal quality of MB was improved. Therefore, the removal efficiency was reduced, but the absolute removal quality was enhanced with increasing MB concentration.

2.3. Effect of pH Value

The pH value is a crucial parameter for wastewater treatment by ozonation, which affects the existence of active substances in water. Figure 1c depicts the effect of solution pH in the range 2.70–10.68 on MB elimination. With an enhancement of pH value, MB elimination was accelerated, which indicated that the alkaline condition was conductive to MB elimination. The removal efficiency improved from 55.1% to 85.8% when pH value increased from 2.70 to 10.68, and the corresponding kinetic constant increased from 0.026 min−1 to 0.076 min−1 (Figure 1c). As for ozonation, it is widely recognized that direct ozone oxidation is the main process in the acid condition. As for dye decolorization, O3 could attack the chromophoric group (-N=N-) of dye selectively. Under the alkaline condition, O3 could be transformed into ·OH, which possesses a higher oxidation potential and a nonselective characteristic. It can open the ring structure of aromatic dyes, which is beneficial to MB elimination [35]. Thus, a better degradation performance was achieved in the alkaline condition.

2.4. Effect of SP Dosage

The effect of SP dosage on MB elimination is exhibited in Figure 1d. There was almost no removal efficiency for MB elimination with sole SP. Compared to the sole O3 system, SP addition was conductive to MB degradation. With enhanced SP dosage, the removal efficiency of MB improved at first, and then decreased. The optimal SP dosage was verified as 50 mg/L. Under this condition, the removal efficiency of MB was raised from 79.3% to 85.7% with 30 min treatment time. The corresponding kinetic constants were improved from 0.061 min−1 to 0.076 min−1 (Figure 1d), respectively. SP could release H2O2 in an aqueous solution (Equation (1)).
2Na2CO3⋅3H2O2 → 2Na2CO3 + 3H2O2
In the O3 system, when SP was added, the released H2O2 reacted with O3 and generated a peroxygenation reaction, which accelerated the formation of ·OH [36]. In addition, an alkaline solution environment could be generated when SP was added in the O3 system. It is well known that O3 was conductive to transform into ·OH (Equations (2)–(7)), which could also promote MB elimination.
O3 + H2O2 → 2⋅OH + 3O2
O3 + OH → HO2 + O2
O3 + HO2 → ⋅HO2 + O3
⋅HO2 ↔ ⋅O2 + H+
⋅O3 + H+ → ⋅HO3
⋅HO3 → ⋅OH + O2
However, excess SP in O3 system would block the interaction between the MB molecule and the active substance. On the other side, excess SP would release a large amount of H2O2, and it would react with ·OH and consume ·OH (Equations (8)–(12)) [37]. As a result, excess SP dosage hindered MB degradation in the O3 system.
H2O2 → O2 + H2O
H2O2 + ⋅OH → ⋅HO2 + H2O
HO2 + ⋅OH → ⋅HO2 + OH
HCO3 + ⋅OH → ⋅CO3 + H2O
CO 3 2 + · OH · CO 3 + OH
Economic benefit is a significant index for evaluating a technology, and therefore energy efficiency under various SP dosages were calculated (Table 1). It was noted that the energy efficiency in the O3/SP system was higher than that in the sole O3 system. When SP dosage was 50 mg/L, the energy efficiency reached 5.71 g/kWh with 30 min treatment time, which was higher than that (5.29 g/kWh) in the sole O3 system. It was summarized that SP addition could lead to energy conservation for practical application. Synergy factor was adopted to assess the synergy efficiency between various systems [37]. Table 1 also exhibits a synergy effect between O3 and SP. It can be seen that the highest synergy factor was obtained when SP dosage was selected as 50 mg/L, which could reach 1.20. Furthermore, it was worth noting that all synergy factors were greater than 1, demonstrating that a synergy effect could be formed between O3 and SP.

2.5. Role of Active Species

For the free radical capture experiment, different concentrations of free radicals were added to the reaction solution, the effect of different concentrations of free radicals on the degradation efficiency was investigated, and the role of free radicals was given. The potential reactive oxygen species generated in the O3/SP system were evaluated using various radical scavengers. Based on the peroxidation theory, ·OH formation could be promoted by O3 and H2O2, thereby accelerating pollutant degradation. Therefore, isopropanol was selected to distinguish the role of ·OH due to the extreme reaction rate (109 M−1 S−1) between isopropanol and ·OH [38]. The rate is higher than that of isopropanol and other radicals. The corresponding results are shown in Figure 2. It can be seen that MB degradation was greatly inhibited by the addition of isopropanol (Figure 2a). The removal efficiency of MB clearly declined with a higher concentration of isopropanol, declining from 88.5% to 66.0% with 1.00 mmol/L isopropanol (Figure 2b). The result indicated the involvement of ·OH in the degradation of MB.
It has been reported that liquid O3 could transform into ·O2, which possesses higher oxidation capacity, allowing it to participate in contaminant decomposition [39]. Herein, a typical ·O2 scavenger, p-benzoquinone was adopted to inspect the role of ·O2, and the result is shown in Figure 3. It can be seen that, after p-benzoquinone addition, MB removal efficiency was diminished, and the inhibition was strengthened by enhancing the p-benzoquinone concentration (Figure 3a). The removal efficiency was significantly reduced from 88.5% to 30.2% with 3 mmol/L p-benzoquinone (Figure 3b), suggesting that ·O2 was definitely involved in the destruction of MB.
Recent literature has shown that 1O2 with higher oxidation potential could decompose organic compounds through electrophilic reactions [40]. In the O3/SP system, ·OH could react with ·O2 and lead to the generation of 1O2 (Equations (13)–(15)). Therefore, in order to clarify the role of 1O2, triethylenediamine was chosen as the 1O2 scavenger. The effect of triethylenediamine addition on MB elimination is depicted in Figure 4. MB degradation was significantly impeded in the presence of triethylenediamine (Figure 4a). When the concentration of triethylenediamine was 1 mmol/L, 2 mmol/L, or 3 mmol/L, the removal efficiency of MB declined from 88.5% to 46.5%, 37.5%, and 30.2%, respectively (Figure 4b). Therefore, it can be confirmed that 1O2 acted as a critical radical responsible for MB degradation.
·O2 + ·OH → 1O2 + OH
·O2 + ·HO2 + H+1O2 + H2O2
·HO2 + ·HO21O2 + H2O2
Na2CO3 and H2O2 could be released when SP was added in water. The generated CO 3 2 could react with ·OH, or HCO4 could self-decompose and form ·CO3 (Equations (16) and (17)) [29], which could contribute to organic contaminant degradation. To inspect the role of ·CO3, we conducted the experiment with indole (106 M−1 S−1) present, a known quencher of ·CO3 [41]. The result is given in Figure 5. The addition of indole evidently decreased the removal efficiency of MB (Figure 5a). Approximately 88.6% removal efficiency could be achieved after 30 min treatment time without indole, which declined to 56.0% with 5.0 mmol/L indole (Figure 5b). These results suggested that ·CO3 might account for MB degradation in O3/SP systems.
CO 3 2 + · OH · CO 3 + OH
HCO4·CO3 + OH

2.6. UV-Vis Spectra, TOC Removal and Fluorescence Excitation-Emission Matrix Spectra

MB degradation processes at different regular time intervals were estimated by UV-Vis absorption spectra, as shown in Figure 6a. The main peak was located at 309 nm, with a gradual decrease in absorption intensity with an increase in reaction time. These phenomena suggested that MB molecules were decomposed efficiently. Additionally, it is worth noting that the intensity located at the period from 222–268 nm raised as time went on, compared to the original intensity, illustrating that degradation intermediates could be generated. In addition, in the process of degradation, a decolorization of the MB solution occurred, changing from dark blue to light blue to colorless, which meant that the concentration of MB decreased. Figure 6b presents the TOC value under various reaction times. With prolonging treatment time, TOC value was dropped. After 30 min treatment time, TOC value was reduced from 6.3 mg/L to 5.1 mg/L, indicating that MB molecules can be mineralized by O3/SP, although many degradation intermediates were produced.
Fluorescence excitation-emission matrix spectroscopy was evaluated to investigate the decay of MB [42]. Figure 7a exhibits the spectra in the range of emission wavelength 350–600 nm and excitation wavelength 250–600 nm, the fluorescence peaks corresponded to the profile of a humic acid-like substance, suggesting that the structure of MB molecules was similar to that of humic acid [42]. With increasing the reaction time, the peak intensity declined, illustrating that the humic acid-like molecular structure can be destroyed (Figure 7b,c). After 30 min treatment, the fluorescence peaks shifted, possibly due to the interference of degradation intermediates (Figure 7d). An analogous phenomenon was also observed by Zhu, et al. [43]. Therefore, it can be concluded that MB molecules can be successfully decomposed by the O3/SP process.

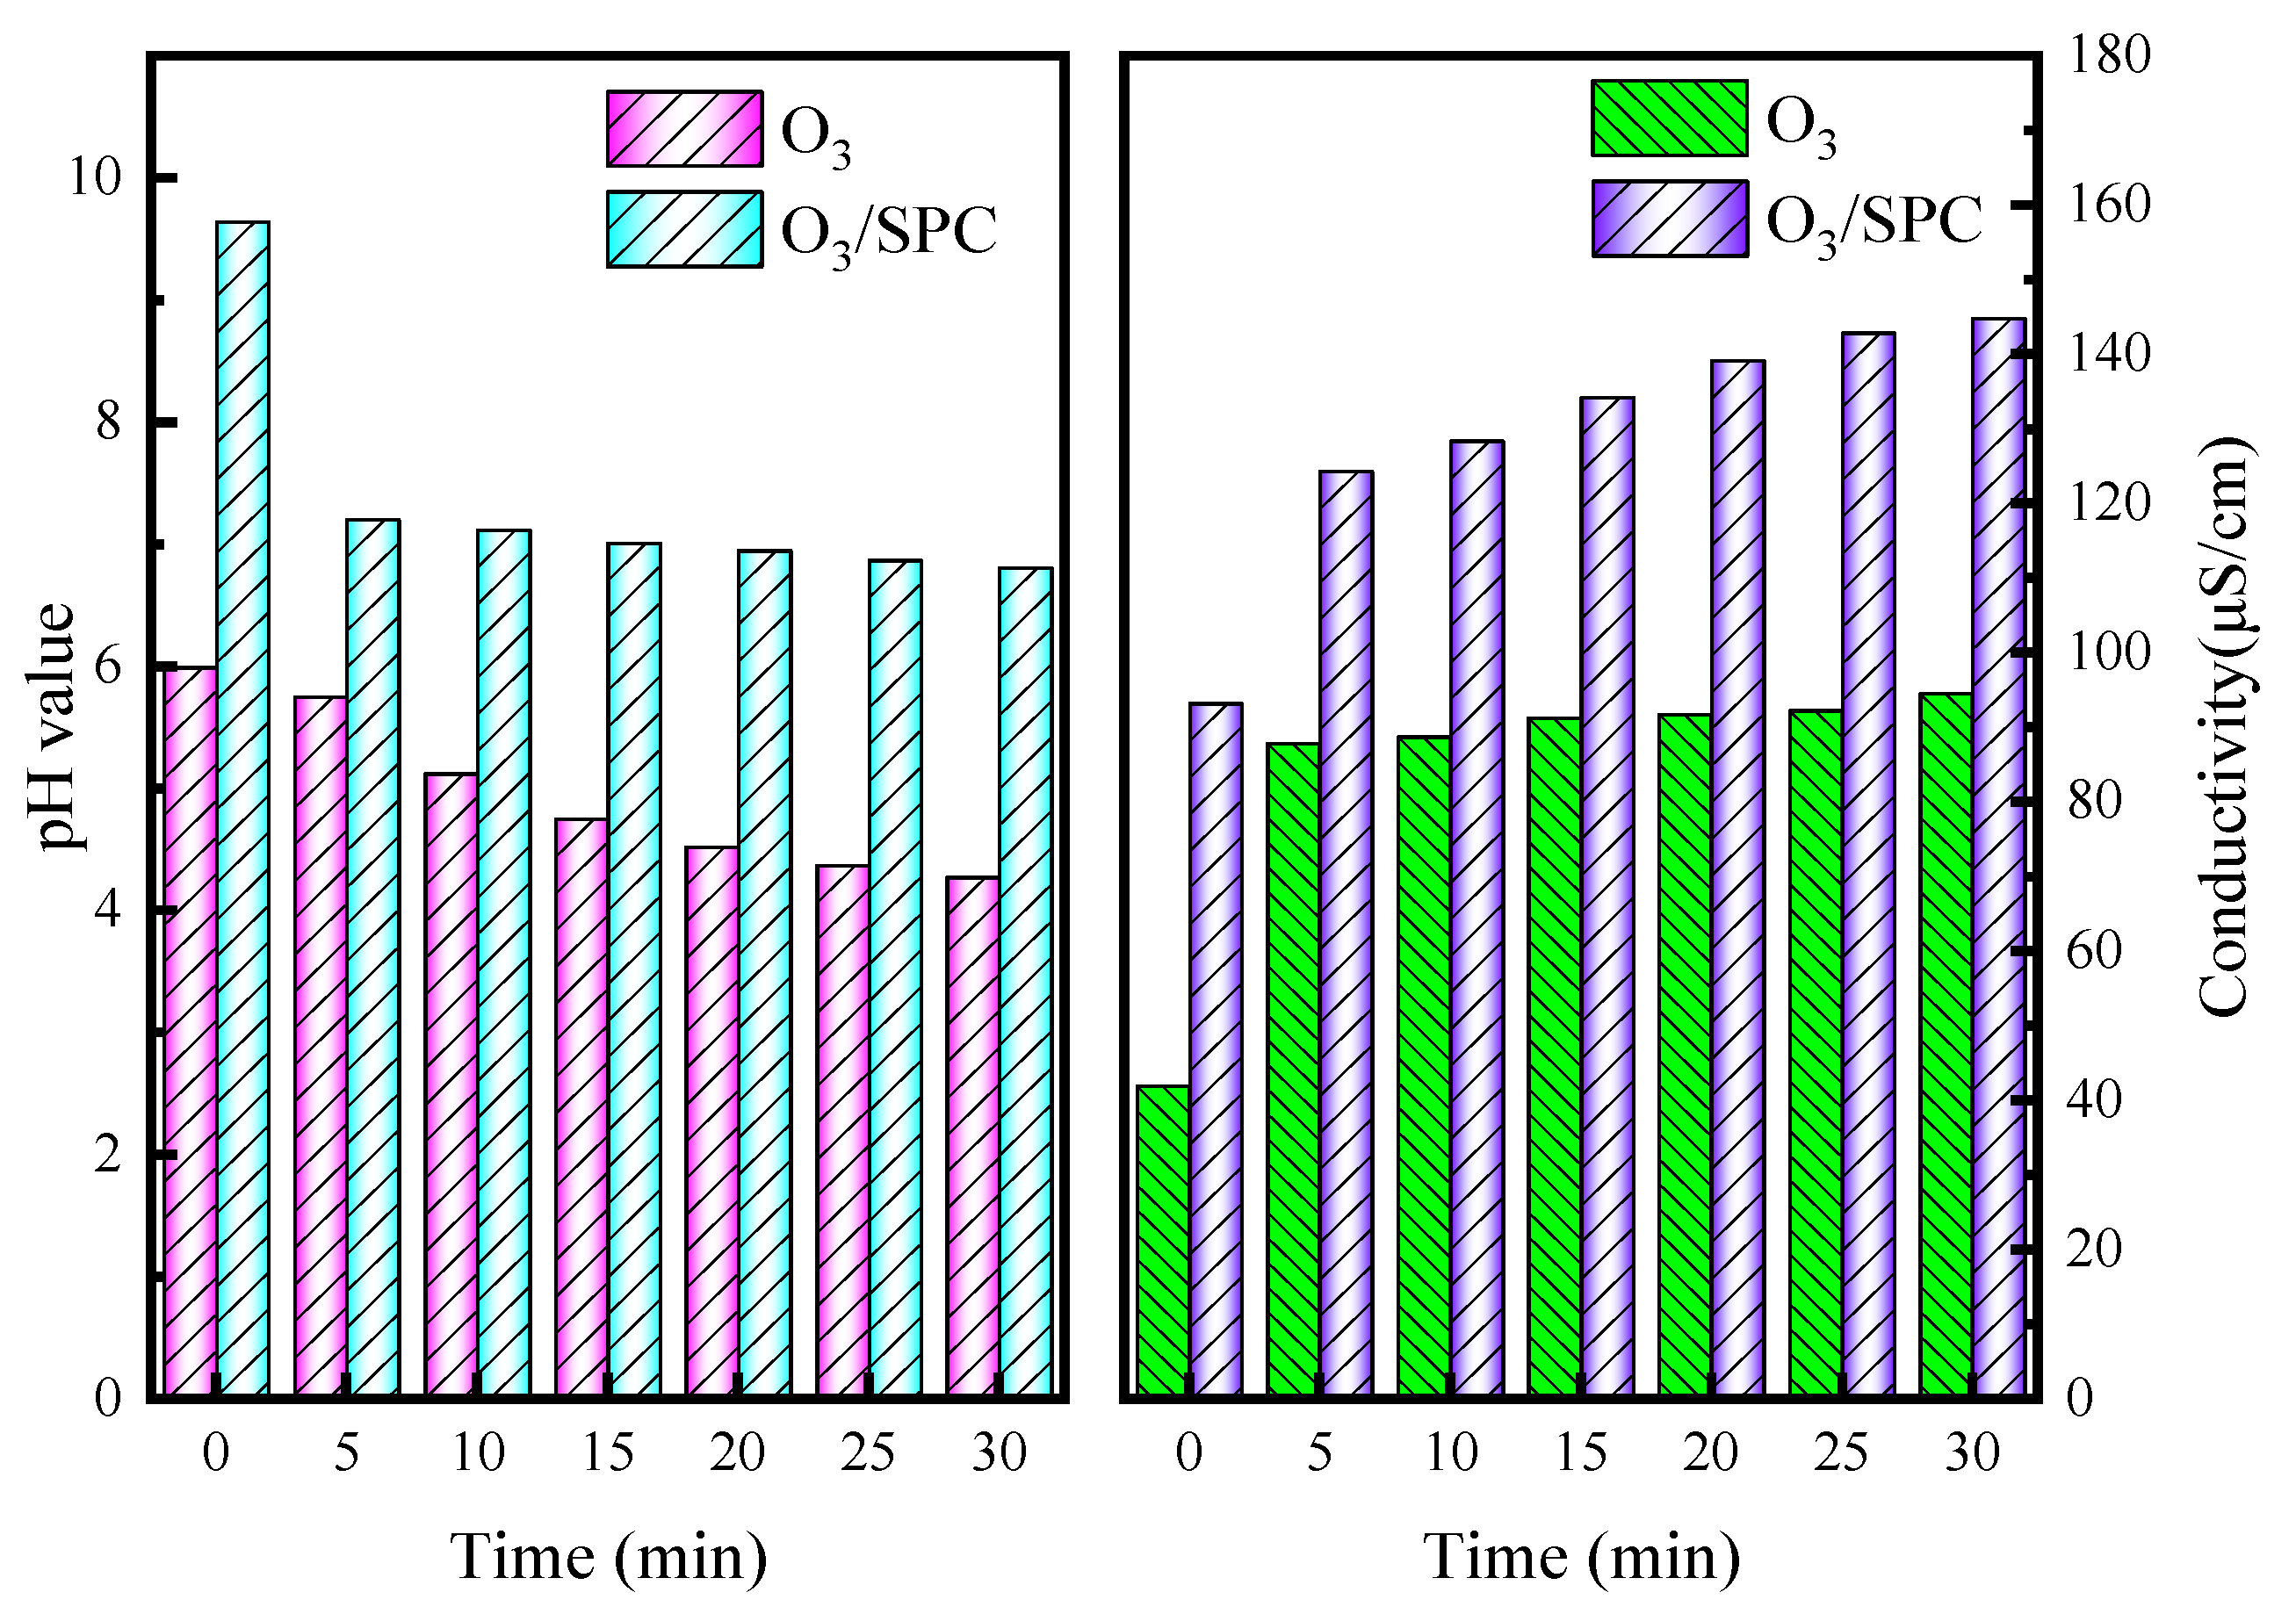
2.7. Variation of pH, Conductivity, and Ammonia Nitrogen

The changes in pH and conductivity under variation reaction systems were shown in Figure 8. Compared to the O3 system, the O3/SP system obtained a higher pH value. Meanwhile, the conductivity of the MB solution was enhanced after SP addition. These results are attributed to the released CO 3 2 and Na2+ in the MB solution, which could enhance the pH value and the conductivity. With increasing treatment time, the pH value decreased. After treatment for 30 min, the pH value declined from a range of 9.64 to 6.81 in the O3/SP system. This was attributed to the generation of organic acid and inorganic acid during MB degradation [44]. Additionally, the conductivity was increased from 93.2 μS/cm to 144.8 μS/cm in the O3/SP system after treatment for 30 min. During MB degradation, NH4+, SO42−, and Na+ can be produced, which would enhance conductivity. From Figure 9, it was found that the amount of NH3-N increased with the delay of processing time, which may be because the nitrogen atom that exists in MB molecules could be mineralized into the free form of NH3-N.

2.8. Degradation Pathway

To explore the degradation pathway of MB, a DFT analysis with the CASTEP module and the Dmol 3 module was performed, illustrating the f0, population, and length of MB molecules. It is worth mentioning that the MB molecule was divided into three major modules, and two of the major modules were similar. The two major module divisions are shown in Table 2 and Table 3. Based on calculated results and literature, we proposed the MB degradation pathway, which is shown in Figure 10. Firstly, the MB central aromatic ring was broken and then the side aromatic rings were ruptured, which produced P1 and P4 [45]. Then C=C was attacked by free radicals, leading to the transformation from P1 to P2. Table 2 shows that S (15) possesses relative large f0. Table 3 shows that C13–S1 have relatively small populations and large lengths. Therefore, P2 was converted into P3. Then, unstable C=N was attacked by free radicals, which induced the P3 change to P5. On the other hand, a conversion from P4 into P5 occurred, similar to the conversion from P2 to P3. Then, the N atom of P5 was apt to attack, resulting in the formation of P6. Then, the ring-opening reaction process of the intermediates occured, which further converted these intermediates to CO2, H2O, SO42−, NH4+, Na+, and the final oxidation products [46,47].

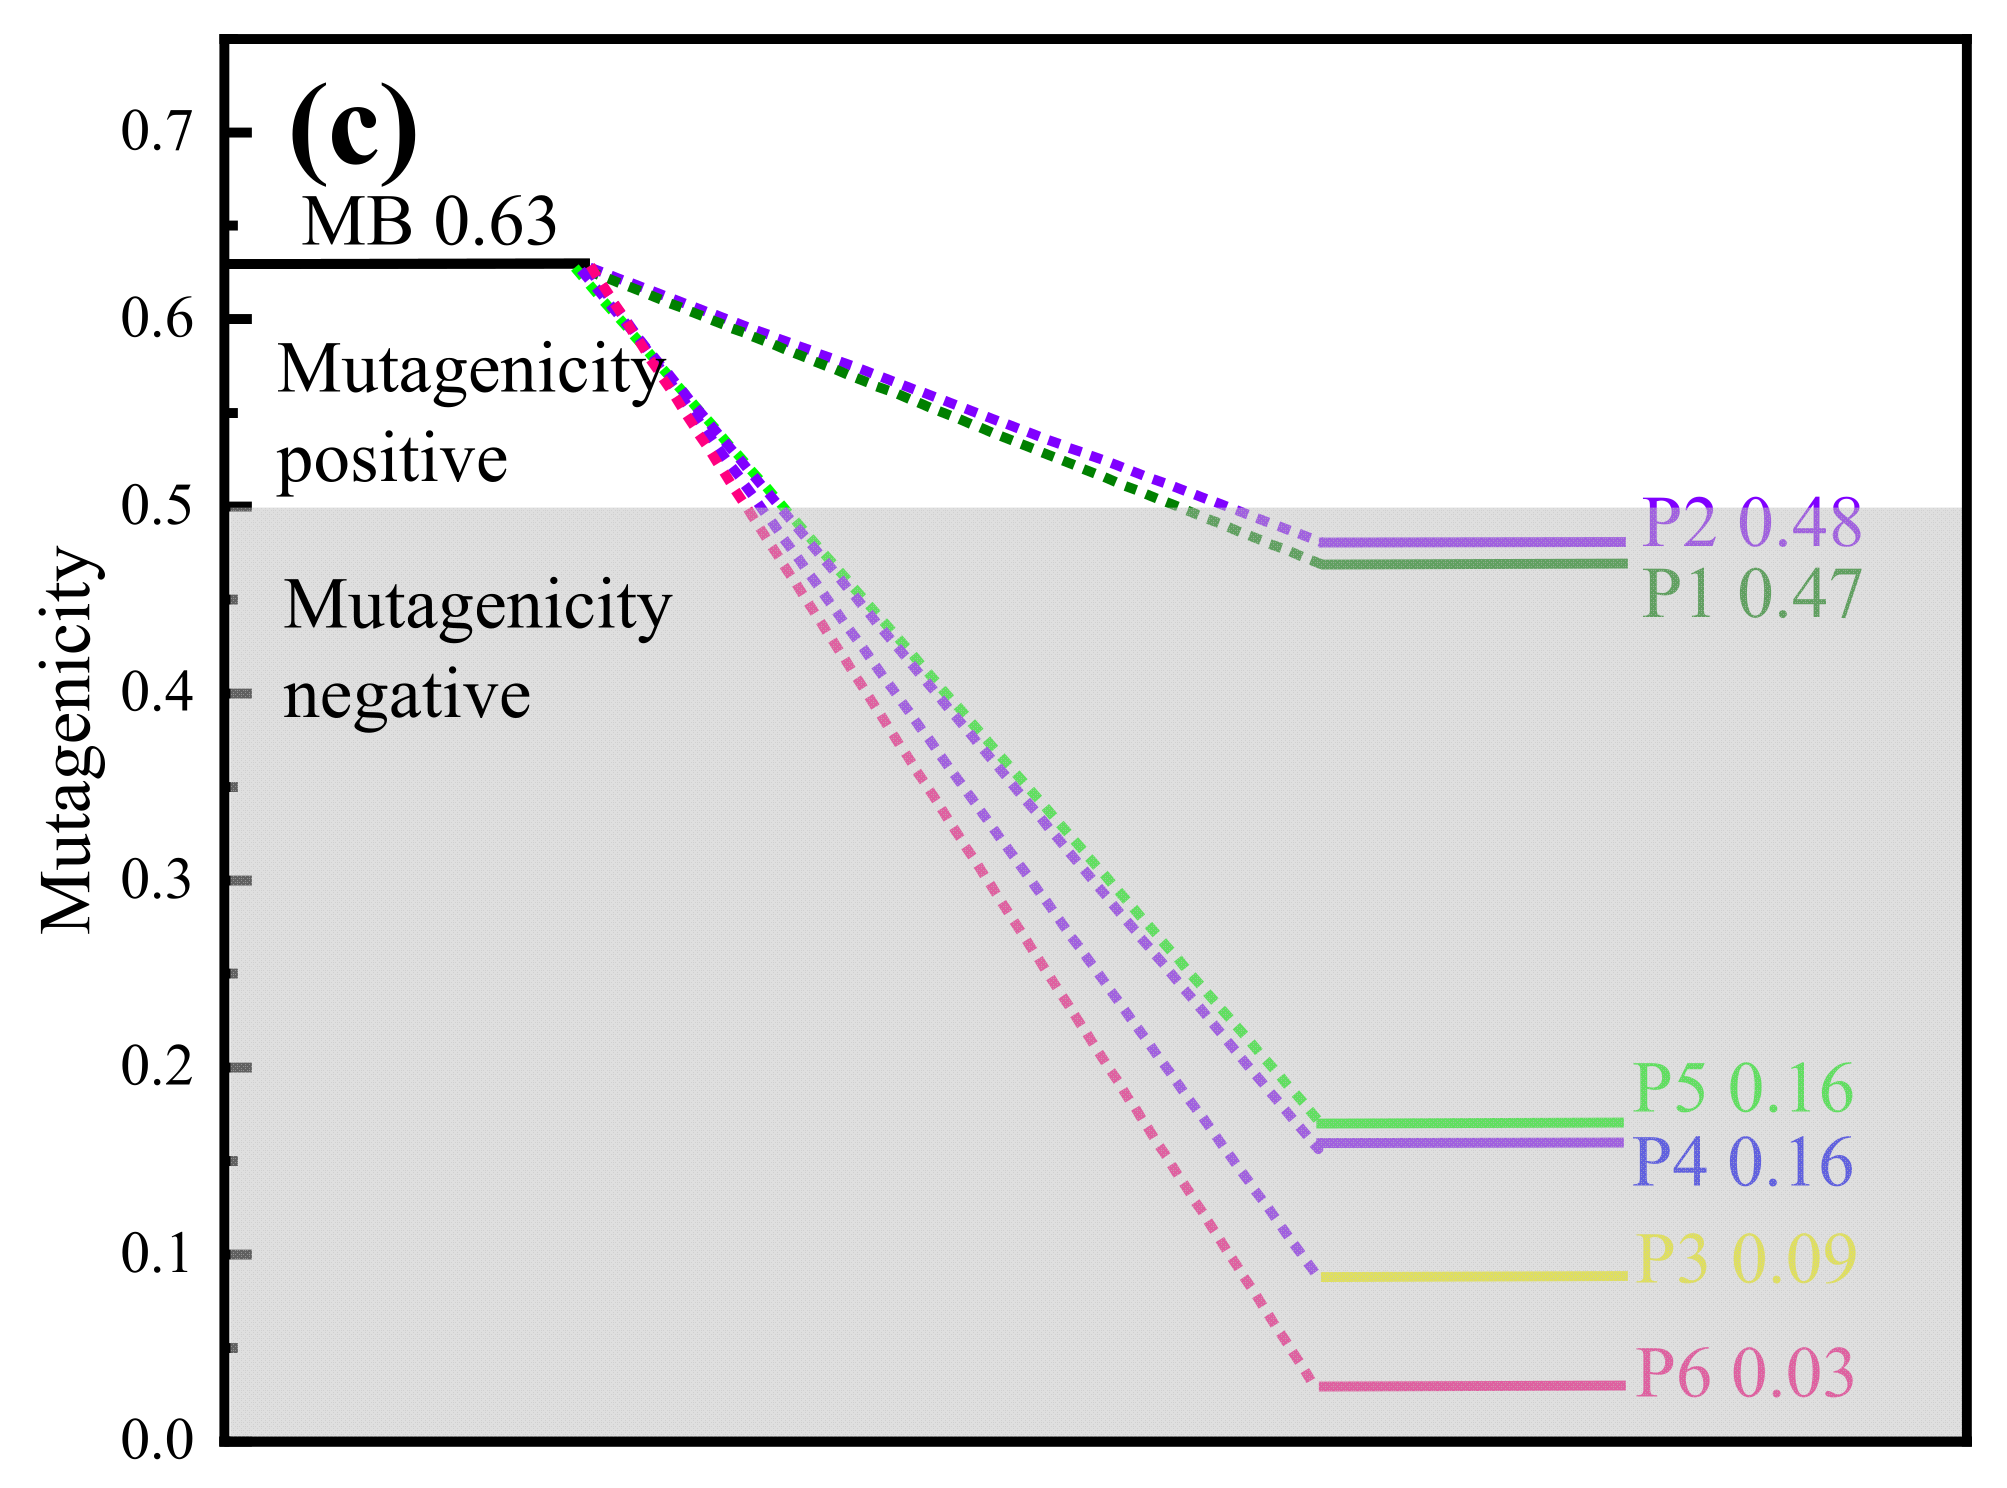
2.9. Toxicity Evaluation

To further understand the toxicity of intermediates, a toxicity assessment of MB and its intermediates was performed using a quantitative structure–activity relationship (QSAR) program based on the QSAR method. In this process, evaluation indexes including oral rat LD50, developmental toxicity, and mutagenicity were chosen. As shown in Figure 11a, aside from P3, the LD50 content of all intermediates were located in the “Toxic” or “Very toxic” regions. It is worth noting that the LD50 content of P4 cannot be predicted due to a limited database. Figure 11b depicts the developmental toxicity of MB and degradation intermediates. It can be noted that P1–P4 were situated at “developmental toxicant”, while P5 and P6 were situated at “developmental non-toxicant”. Figure 11c exhibits the mutagenicity of MB as “Mutagenicity positive”. Surprisingly, the mutagenicities of all intermediates were situated in the “Mutagenicity negative” range. By comprehensive analysis of toxicity evaluation results, it can be summarized that the toxicity of MB could be relieved after O3/SP treatment.

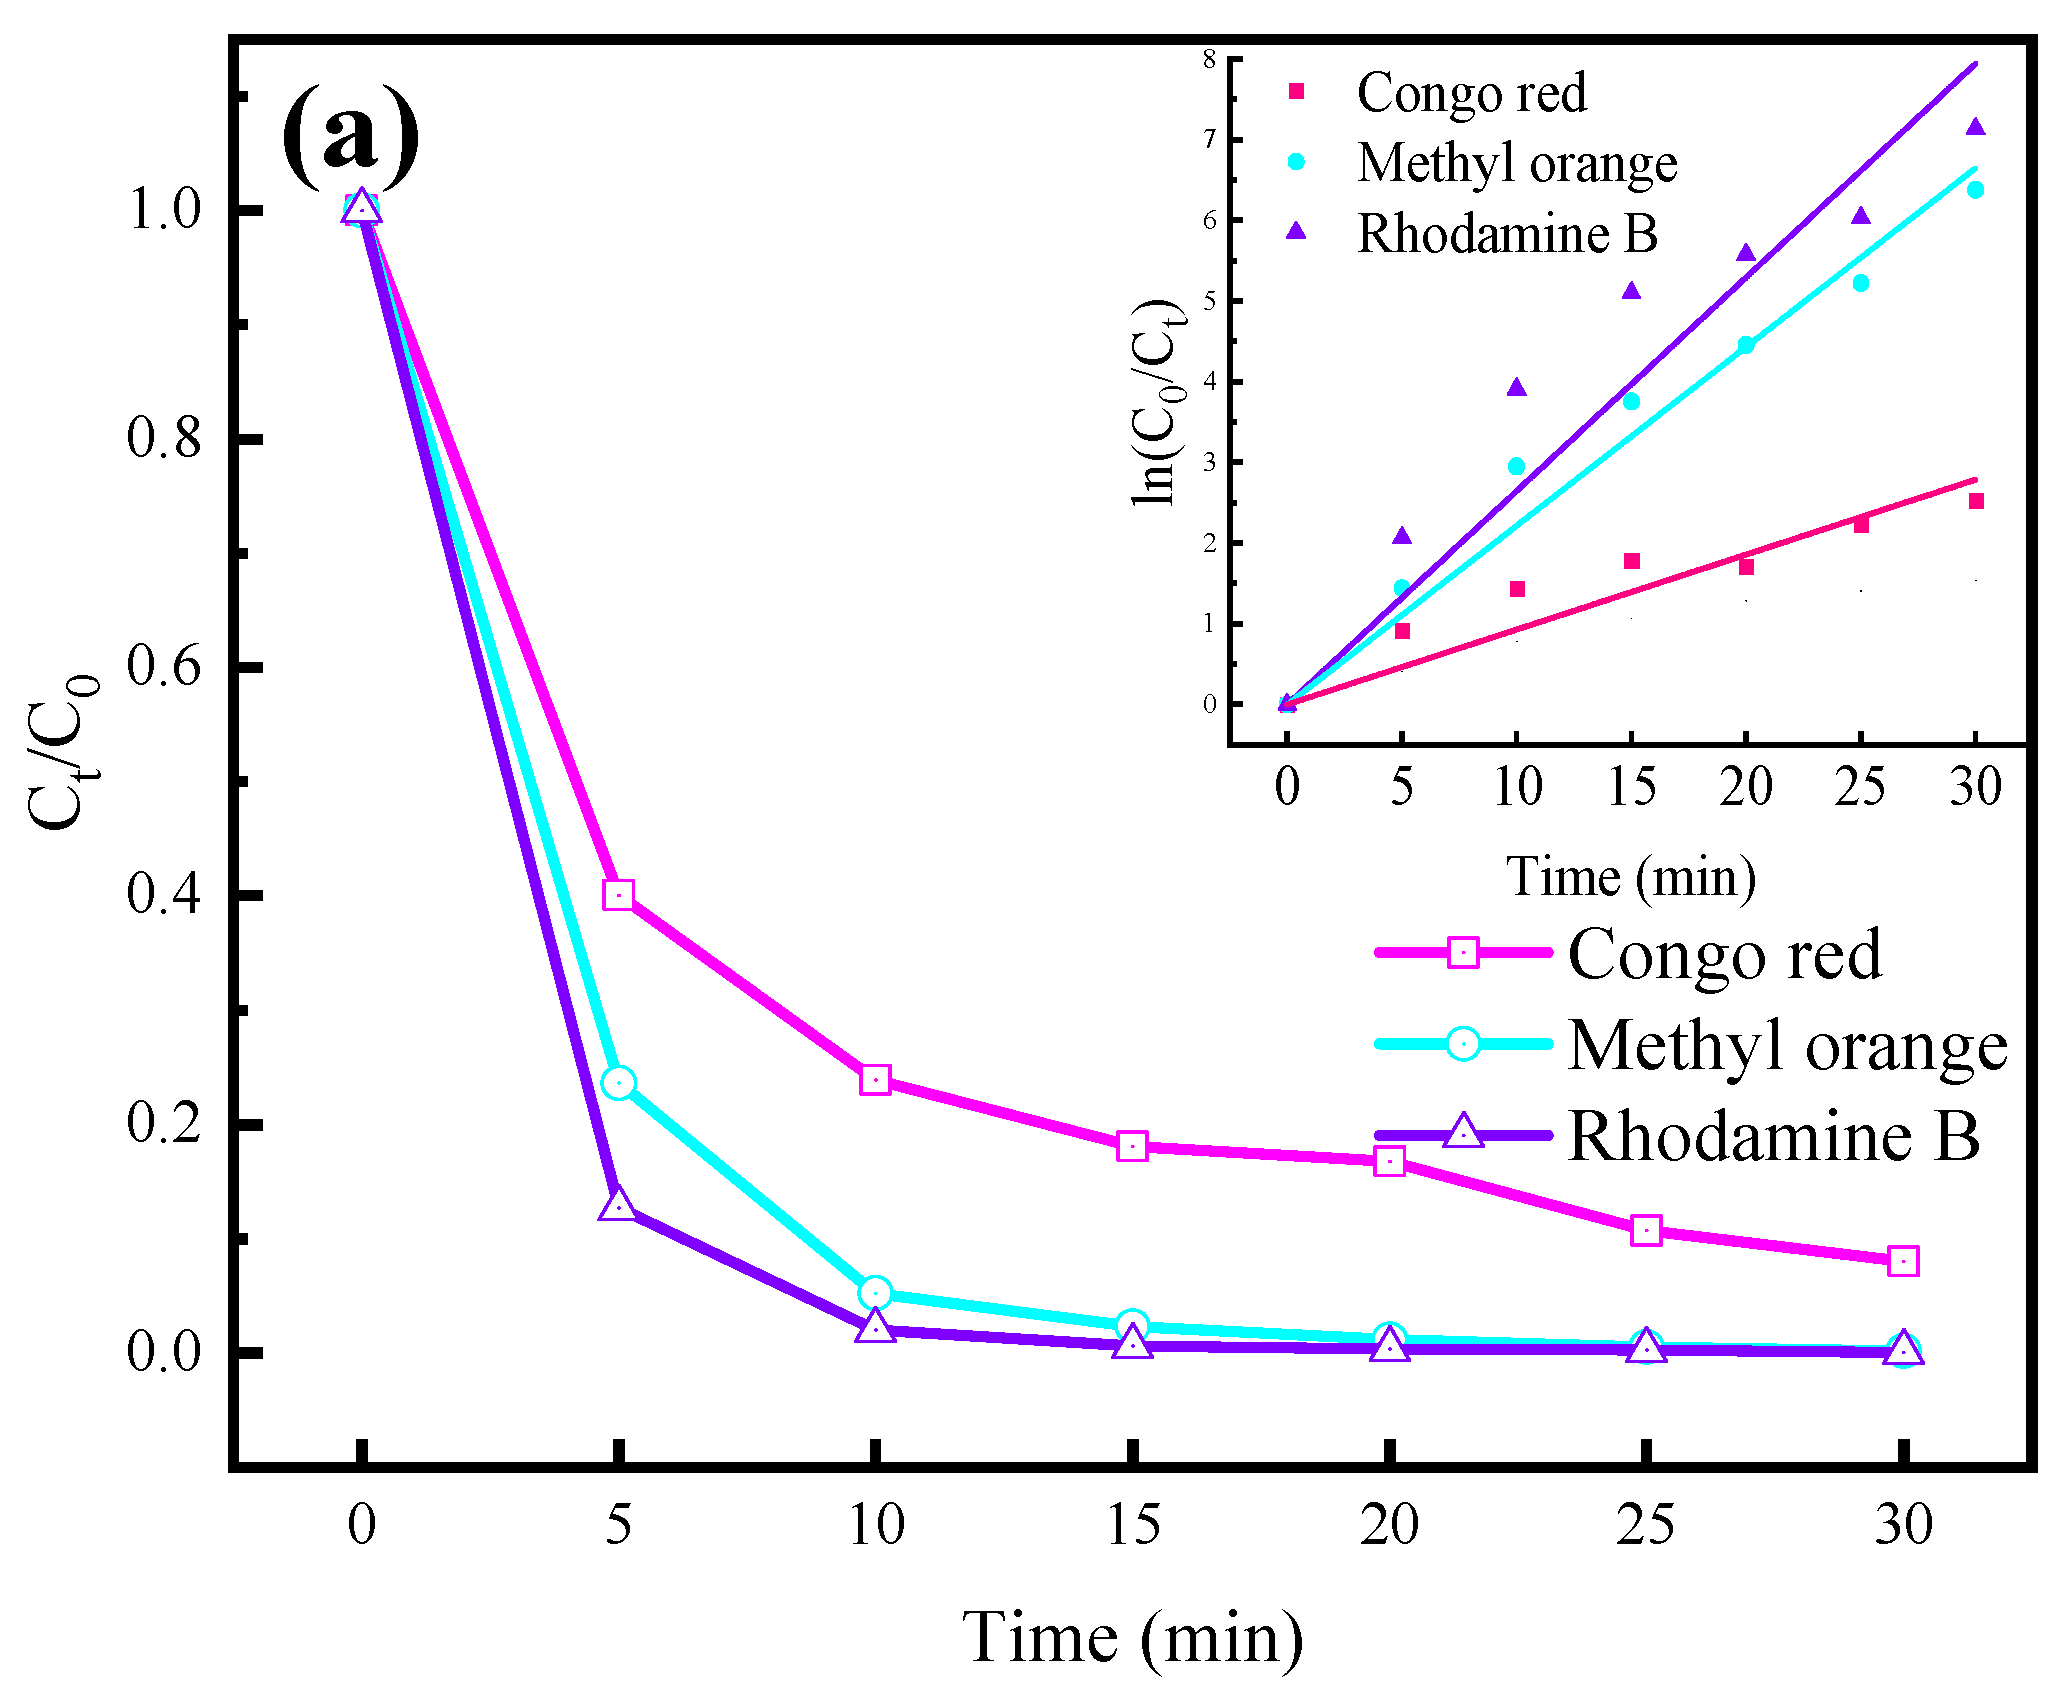
2.10. For Other Dye Removal and Actual Wastewater Treatment

In order to figure out the feasibility of the technology for the degradation of other dyes, congo red, methyl orange, and rhodamine B were selected. Figure 12a shows that the removal efficiency of all dyes was higher than 90% after 30 min treatment time. Furthermore, the kinetic constant also exhibited a higher value. These results indicated that the current process was also suitable for the treatment of dye wastewater. In order to figure out the O3/SP process for actual wastewater treatment, we selected underground wastewater from our university. Figure 12b illustrated that COD value decreased with an increase in reaction time. After 30 min treatment, COD declined from 243.3 mg/L to 205.7 mg/L. Therefore, it can be summarized that the O3/SP process for actual wastewater treatment is feasible by further increasing the treatment time.

3. Materials and Methods

3.1. Chemicals

MB, SP, terephthalic acid, sodium hydroxide, and sodium indigo disulfonate (IDS) were obtained from Aladdin Reagent Co., Ltd. (Shanghai, China) Titanium oxysulfate, hydrogen peroxide 30% aqueous solution, isopropanol (IPA), p-benzoquinone, phosphoric acid, and indole were bought from Sinopharm Chemical Reagent Co., Ltd. (Beijing, China) All aqueous solution was prepared with deionized water, which was prepared by high purity water machine (Biosafer-10R, East Hartford, CT, USA).

3.2. Degradation Analysis

O3 was formed by a DBD plasma ozone generator (Changqing, CQ-802S, Nanjing, China). The reactor was as a cylindrical form style, and the diameter and height were 8 cm and 15 cm, respectively. The concentration was regulated by an atmospheric sampling instrument (Laobao, QC-350, Qingdao, China). Concentration of MB was detected by UV-Vis spectrograph (METASH, UV-5500PC, Shanghai, China) with a detection wavelength of 311 nm. The sampled time was set as every 5 min. The degradation efficiency was calculated as follows:
η = C 0 C t C 0
where C0 is the initial concentration of MB, mg/L; Ct is concentration of MB under t time; mg/L. The degradation kinetic was calculated according to pseudo-first order dynamic model, which is shown as follows [47]:
ln ( C 0 C t ) = k t
where C0 and Ct are defined as the same mean-like formula (18); k is the kinetic constant, min−1; t is the sample time, min. The energy efficiency was calculated as follows [48]:
E = ( η × C 0 ) P t
where C0, η and t are defined as the same mean-like formula (18); P is the power of the plasma generator.
The synergistic effect between O3 and SP was calculated on the basis of the kinetic constant, shown as:
SF = k O 3 + SP k O 3 + k SP
where SF is the synergistic factor; kO3+SP is the kinetic constant for O3/SP; kO3 is the kinetic constant for sole O3; kSP is the kinetic constant for sole SP. During the experiment, SP was dispersed in MB solution evenly. The conductivity and pH were tested by conductivity meter (INESA, DDS-307A, Shanghai, China) and pH meter (INESA, PHS-3C), respectively. TOC detector (SHMADZU, TOC-V CPN, Kyoto, Japan) was adopted to measure TOC. The water quality detector (Lian hua, 5B-6C, Beijing, China) was utilized to test ammonia nitrogen and COD. The fluorescence characteristic of MB molecules was inspected by fluorescence spectrometer (F97Pro, Lingguang, Shanghai, China).

3.3. DFT Analysis and Toxicity Assays

In order to predict the degradation pathway of MB, f0, population and length of MB molecules were calculated based on DFT analysis, which was carried out on Material Studio (MS, version 4.2.1) [49]. The equipped CASTEP module was taken to compute the population, giving the result of population and length. During this calculation, a crystal with parameters of 15 × 15 × 15 A was established. The equipped Dmol 3 module was performed to present Fukui Function, giving the result of f0 [50,51]. The intermediates toxicity was assessed by US Environmental Protection Agency Toxicity Estimation Software Tool (US-EPA-TEST) based on oral rat LD50, developmental toxicity and mutagenicity [52].

4. Conclusions

Herein, SP activated by plasma-generated O3 for dye wastewater treatment was investigated. The effects of ozone dosage, initial MB concentration, pH value, and SP dosage on MB removal was first investigated. A higher removal efficiency of MB was achieved at a higher ozone dosage, lower MB concentration, and higher pH value. The addition of SP could accelerate MB degradation in an O3 system. Energy efficiency can be enhanced with SP addition. Active species consisting of ·OH, ·O2, 1O2, and ·CO3 participated in MB degradation. UV-Vis spectra and fluorescence excitation–emission matrix spectra verified that MB molecules could be decomposed successfully. The pH value and conductivity increased after SP addition. The pH value decreased and conductivity increased as treatment time went on. Additionally, the amount of NH3-N increased with prolonged reaction time. According to DFT analysis and literature, a degradation pathway of MB was proposed, which mainly involved the rupture of the central aromatic ring, C=C, and C=N. Toxicity indexes including oral rat LD50, developmental toxicity, and mutagenicity were assessed. Treatment of other dyes and actual wastewater was feasible by the O3/SP process.

Author Contributions

J.H.: writing—original draft preparation; data curation. C.P.: writing—original draft preparation; investigation; H.G.: Conceptualization, methodology; investigation, writing—review and editing; supervision, project administration.; funding acquisition. All authors have read and agreed to the published version of the manuscript.

Funding

We greatly appreciate financial support from National Natural Science Foundation of China (No. 22006069), Natural Science Foundation of Jiangsu Province in China, (No. BK20200801), Natural Science Foundation of the Jiangsu Higher Education Institution of China (No. 20KJB610015), and Postdoctoral Science Foundation of Jiangsu Province in China (No. 2021K592C).

Institutional Review Board Statement

Not applicable.

Informed Consent Statement

Not applicable.

Data Availability Statement

Not applicable.

Conflicts of Interest

The authors declare no conflict of interest.

References

  1. Donkadokula, N.Y.; Kola, A.K.; Naz, I.; Saroj, D. A review on advanced physico-chemical and biological textile dye wastewater treatment techniques. Rev. Environ. Sci. Bio. 2020, 19, 543–560. [Google Scholar] [CrossRef]
  2. Yaseen, D.A.; Scholz, M. Textile dye wastewater characteristics and constituents of synthetic effluents: A critical review. Int. J. Environ. Sci. Technol. 2019, 16, 1193–1226. [Google Scholar] [CrossRef] [Green Version]
  3. Paździor, K.; Bilińska, L.; Ledakowicz, S. A review of the existing and emerging technologies in the combination of AOPs and biological processes in industrial textile wastewater treatment. Chem. Eng. J. 2019, 376, 120597. [Google Scholar] [CrossRef]
  4. Chen, R.; Cai, J.; Li, Q.; Wei, X.; Min, H.; Yong, Q. Coadsorption behaviors and mechanisms of Pb (II) and methylene blue onto a biodegradable multi-functional adsorbent with temperature-tunable selectivity. RSC Adv. 2020, 10, 35636. [Google Scholar] [CrossRef]
  5. Li, W.; Mu, B.; Yang, Y. Feasibility of industrial-scale treatment of dye wastewater via bio-adsorption technology. Bioresour. Technol. 2019, 277, 157–170. [Google Scholar] [CrossRef]
  6. Yang, Y.; Wang, H.; Li, J.; He, B.; Wang, T.; Liao, S. Novel functionalized nano-TiO2 loading electrocatalytic membrane for oily wastewater treatment. Environ. Sci. Technol. 2012, 46, 6815–6821. [Google Scholar] [CrossRef]
  7. Damodar, R.A.; You, S.J.; Ou, S.H. Coupling of membrane separation with photocatalytic slurry reactor for advanced dye wastewater treatment. Sep. Purif. Technol. 2010, 76, 64–71. [Google Scholar] [CrossRef]
  8. Raghu, S.; Basha, C.A. Chemical or electrochemical techniques, followed by ion exchange, for recycle of textile dye wastewater. J. Hazard. Mater. 2007, 149, 324–330. [Google Scholar] [CrossRef]
  9. Labanda, J.; Sabaté, J.; Llorens, J. Experimental and modeling study of the adsorption of single and binary dye solutions with an ion-exchange membrane adsorber. Chem. Eng. J. 2011, 166, 536–543. [Google Scholar] [CrossRef]
  10. Khalid, A.; Arshad, M.; Crowley, D.E. Biodegradation potential of pure and mixed bacterial cultures for removal of 4-nitroaniline from textile dye wastewater. Water Res. 2009, 43, 1110–1116. [Google Scholar] [CrossRef]
  11. Kanagaraj, J.; Senthilvelan, T.; Panda, R.C. Degradation of azo dyes by laccase: Biological method to reduce pollution load in dye wastewater. Clean Technol. Environ. Policy 2015, 17, 1443–1456. [Google Scholar] [CrossRef]
  12. Arslan-Alaton, I. A review of the effects of dye-assisting chemicals on advanced oxidation of reactive dyes in wastewater. Color. Technol. 2003, 119, 345–353. [Google Scholar] [CrossRef]
  13. Papi, S.; Koprivanac, N.; Boi, A.L.; Vujevi, D.; Dragievi, S.K.; Peternel, H.K. Advanced oxidation processes in azo dye wastewater treatment. Water Environ. Res. 2006, 78, 572–579. [Google Scholar] [CrossRef]
  14. Vaiano, V.; Iervolino, G.; Rizzo, L.; Sannino, D. Advanced oxidation processes for the removal of food dyes in wastewater. Curr. Org. Chem. 2017, 21, 1068–1073. [Google Scholar] [CrossRef]
  15. Mu, B.; Wang, A. Adsorption of dyes onto palygorskite and its composites: A review. J. Environ. Chem. Eng. 2016, 4, 1274–1294. [Google Scholar] [CrossRef]
  16. Thamaraiselvan, C.; Noel, M. Membrane processes for dye wastewater treatment: Recent progress in fouling control. Crit. Rev. Environ. Sci. Technol. 2015, 45, 1007–1040. [Google Scholar] [CrossRef]
  17. Joseph, J.; Radhakrishnan, R.C.; Johnson, J.K.; Joy, S.P.; Thomas, J. Ion-exchange mediated removal of cationic dye-stuffs from water using ammonium phosphomolybdate. Mater. Chem. Phys. 2019, 242, 122488. [Google Scholar] [CrossRef]
  18. Masoudnia, S.; Juybari, M.H.; Mehrabian, R.Z.; Ebadi, M.; Kaveh, F. Efficient dye removal from wastewater by functionalized macromolecule chitosan-sba-15 nanofibers for biological approaches. Int. J. Biol. Macromol. 2020, 165, 118–130. [Google Scholar] [CrossRef]
  19. Zhang, M.H.; Zhao, D.H.L.; Wang, D.X.; Meng, D. A review on fenton process for organic wastewater treatment based on optimization perspective. Sci. Total Environ. 2019, 670, 110–121. [Google Scholar] [CrossRef]
  20. Bagal, M.V.; Gogate, P.R. Wastewater treatment using hybrid treatment schemes based on cavitation and Fenton chemistry: A review. Ultrason. Sonochem. 2014, 21, 1–14. [Google Scholar] [CrossRef]
  21. Jahan, B.N.; Li, L.; Pagilla, K.R. Fate and reduction of bromate formed in advanced water treatment ozonation systems: A critical review. Chemosphere 2020, 266, 128964. [Google Scholar] [CrossRef] [PubMed]
  22. Chong, M.N.; Jin, B.; Chow, C.W.; Saint, C. Recent developments in photocatalytic water treatment technology: A review. Water Res. 2010, 44, 2997–3027. [Google Scholar] [CrossRef]
  23. Turkay, O.; Ersoy, Z.G.; Bar, S. Review-the application of an electro-peroxone process in water and wastewater treatment. J. Electrochem. Soc. 2017, 164, E94–E102. [Google Scholar] [CrossRef]
  24. Chen, H.; Wang, J. Degradation and mineralization of ofloxacin by ozonation and peroxone (O3/H2O2) process. Chemosphere 2021, 269, 128775. [Google Scholar] [CrossRef]
  25. Li, S.; Huang, J.; Ye, Z.; Wang, Y.; Li, L. The mechanism of metal-H2O2 complex immobilized on mcm-48 and enhanced electron transfer for effective peroxone ozonation of sulfamethazine. Appl. Catal. B-Environ. 2021, 280, 119453. [Google Scholar] [CrossRef]
  26. Gao, J.; Song, J.; Ye, J.; Duan, X.; Dionsion, D.D.; Yadav, J.S.; Nadagouda, M.N.; Yang, L.; Luo, S. Comparative toxicity reduction potential of UV/sodium percarbonate and UV/hydrogen peroxide treatments for bisphenol A in water: An integrated analysis using chemical, computational, biological, and metabolomic approaches. Water Res. 2021, 190, 116755. [Google Scholar] [CrossRef]
  27. Miao, Z.; Gu, X.; Lu, S.; Brusseau, M.L.; Zhang, X.; Fu, X.; Danish, M.; Qiu, Z.; Sui, Q. Enhancement effects of chelating agents on the degradation of tetrachloroethene in Fe(III) catalyzed percarbonate system. Chem. Eng. J. 2015, 281, 286–294. [Google Scholar] [CrossRef] [Green Version]
  28. Sablas, M.M.; Luna, M.D.; Garcia-Segura, S.; Chen, C.W.; Dong, C.D. Percarbonate mediated advanced oxidation completely degrades recalcitrant pesticide imidacloprid: Role of reactive oxygen species and transformation products. Sep. Purif. Technol. 2020, 250, 117269. [Google Scholar] [CrossRef]
  29. Tang, S.; Yuan, D.; Rao, Y.; Li, M.; Shi, G.; Gu, J.; Zhang, T. Percarbonate promoted antibiotic decomposition in dielectric barrier discharge plasma. J. Hazard. Mater. 2019, 366, 669–676. [Google Scholar] [CrossRef]
  30. Wang, T.; Jia, H.; Guo, X.; Xia, T.; Qu, G.; Sun, Q.; Yin, X. Evaluation of the potential of dimethyl phthalate degradation in aqueous using sodium percarbonate activated by discharge plasma. Chem. Eng. J. 2018, 346, 65–76. [Google Scholar] [CrossRef]
  31. Wei, C.; Zhang, F.; Yun, H.; Feng, C.; Wu, H. Ozonation in water treatment: The generation, basic properties of ozone and its practical application. Rev. Chem. Eng. 2016, 33, 49–89. [Google Scholar] [CrossRef]
  32. Chen, H.L.; Lee, H.M.; Chen, S.H. Review of packed-bed plasma reactor for ozone generation and air pollution control. Ind. Eng. Chem. Res. 2008, 47, 2122–2130. [Google Scholar] [CrossRef]
  33. Siraj, Z.; Maafa, I.M.; Shafig, I.; Shezad, N.; Akhter, P.; Yang, W.; Hussain, M. KIT-6 induced mesostructured TiO2 for photocatalytic degradation of methyl blue. Environ. Sci. Pollut. Res. 2021, 28, 53340–53352. [Google Scholar] [CrossRef]
  34. Tang, S.; Yuan, D.; Rao, Y.; Qi, J.; Cheng, T.; Sun, Z.; Gu, J.; Huang, H. Persulfate activation in gas phase surface discharge plasma for synergetic removal of antibiotic in water. Chem. Eng. J. 2018, 337, 446–454. [Google Scholar] [CrossRef]
  35. Paździor, K.; Wrębiak, J.; Klepacz-Smółka, A.; Gmurek, M.; Bilińska, L.; Kos, L.; Sójka-Ledakowicz, J.; Ledakowicz, S. Influence of ozonation and biodegradation on toxicity of industrial textile wastewater. J. Environ. Manag. 2017, 195, 166–173. [Google Scholar] [CrossRef]
  36. Fischbacher, A.; Sonntag, J.V.; Sonntag, C.V.; Schmidt, T.C. The ·OH radical yield in the H2O2 + O3 (peroxone) reaction. Environ. Sci. Technol. 2013, 47, 9959–9964. [Google Scholar] [CrossRef]
  37. Shang, K.; Wang, X.; Li, J.; Wang, H.; Lu, N.; Jiang, N.; Wu, Y. Synergetic degradation of acid orange 7 (AO7) dye by DBD plasma and persulfate. Chem. Eng. J. 2017, 311, 378–384. [Google Scholar] [CrossRef]
  38. Kan, H.; Wang, T.; Yang, Z.; Wu, R.; Shen, J.; Qu, G.; Jia, H. High frequency discharge plasma induced plasticizer elimination in water: Removal performance and residual toxicity. J. Hazard. Mater. 2020, 383, 121185. [Google Scholar] [CrossRef]
  39. Malik, M.A.; Ghaffar, A.; Malik, S.A. Water purification by electrical discharges. Plasma Sources Sci. Technol. 2001, 10, 82–91. [Google Scholar] [CrossRef]
  40. Zhou, L.; Song, W.; Chen, Z.Q.; Yin, G.C. Degradation of organic pollutants in wastewater by bicarbonate activated hydrogen peroxide with supported cobalt catalyst. Environ. Sci. Technol. 2013, 47, 3833–3839. [Google Scholar] [CrossRef]
  41. Wang, J.; Wang, K.; Zhang, Y.; Guo, L.; Guo, Z.; Sun, W.; Ye, Z.; Niu, J. Mechanism of bicarbonate enhancing the photodegradation of β-blockers in natural waters. Water Res. 2021, 197, 117078. [Google Scholar] [CrossRef] [PubMed]
  42. Chen, W.; Westerhoff, P.; Leenheer, J.A.; Booksh, K. Fluorescence excitation-emission matrix regional integration to quantify spectra for dissolved organic matter. Environ. Sci. Technol. 2015, 37, 5701–5710. [Google Scholar] [CrossRef] [PubMed]
  43. Zhu, G.; Fang, H.; Xiao, Y.; Hursthouse, A.S. The application of fluorescence spectroscopy for the investigation of dye degradation by chemical oxidation. J. Fluoresc. 2020, 30, 1271–1279. [Google Scholar] [CrossRef] [PubMed]
  44. Guo, H.; Jiang, N.; Wang, H.; Shang, K.; Lu, N.; Li, J.; Wu, Y. Enhanced catalytic performance of graphene-TiO2 nanocomposites for synergetic degradation of fluoroquinolone antibiotic in pulsed discharge plasma system. Appl. Catal. B 2019, 248, 552–566. [Google Scholar] [CrossRef]
  45. He, Z.; Que, W.; Yin, X.; He, Y. Hydrogen titanium oxide hydrate: Excellent performance on degradation of methyl blue in aqueous solutions. RSC Adv. 2014, 4, 39678–39683. [Google Scholar] [CrossRef]
  46. Zhang, T.; Oyama, T.; Aoshima, A.; Hidaka, H.; Zhao, J.; Serpone, N. Photooxidative N-demethylation of methylene blue in aqueous TiO2 dispersions under UV Irradiation. J. Photochem. Photobiol. A 2001, 140, 163–172. [Google Scholar] [CrossRef]
  47. Guo, H.; Wang, Y.; Yao, X.; Zhang, Y.; Li, Z.; Pan, S.; Han, J.; Xu, L.; Qiao, W.; Li, J.; et al. A comprehensive insight into plasma-catalytic removal of antibiotic oxytetracycline based on graphene-TiO2-Fe3O4 nanocomposites. Chem. Eng. J. 2021, 425, 130614. [Google Scholar] [CrossRef]
  48. Wang, Y.; Huang, J.; Guo, H.; Puyang, C.; Han, J.; Li, Y.; Ruan, Y. Mechanism and process of sulfamethoxazole decomposition with persulfate activated by pulse dielectric barrier discharge plasma. Sep. Purif. Technol. 2022, 287, 120540. [Google Scholar] [CrossRef]
  49. Wang, X.; Wang, P.; Liu, X.; Hu, L.; Wang, Q.; Xu, P.; Zhang, G. Enhanced degradation of PFOA in water by dielectric barrier discharge plasma in a coaxial cylindrical structure with the assistance of peroxymonosulfate. Chem. Eng. J. 2020, 389, 124381. [Google Scholar] [CrossRef]
  50. Guo, H.; Li, Z.; Xiang, L.; Jiang, N.; Zhang, Y.; Wang, H.; Li, J. Efficient removal of antibiotic thiamphenicol by pulsed discharge plasma coupled with complex catalysis using graphene-WO3-Fe3O4 nanocomposites. J. Hazard. Mater. 2020, 403, 123673. [Google Scholar] [CrossRef]
  51. Guo, H.; Yang, H.; Huang, J.; Tong, J.; Liu, X.; Wang, Y.; Qiao, W.; Han, J. Theoretical and experimental insight into plasma-catalytic degradation of aqueous p-nitrophenol with graphene-ZnO nanoparticles. Sep. Purif. Technol. 2022, 295, 121362. [Google Scholar] [CrossRef]
  52. USEPA. Toxicity Estimation Software Tool, Version 4.2.1; U.S. Environmental Protection Agency: Washington, DC, USA, 2017.
Figure 1. Effect of (a) ozone dosage; MB concentration: 25 mg/L, pH value: 7.78, SPC dosage: 50 mg/L (b) MB concentration; ozone dosage: 8.0 mg/min, pH value: 7.78, SPC dosage: 50 mg/L (c) pH value; ozone dosage: 8.0 mg/min, MB concentration: 25 mg/L, SPC dosage: 50 mg/L (d) SPC dosage; ozone dosage: 8.0 mg/min, MB concentration: 25 mg/L, pH value: 7.78.
Catalysts 12 00681 g001
Figure 2. Effect of isopropanol: (a) degradation curve; (b) removal efficiency with 30 min treatment. Ozone dosage: 8.0 mg/min, other experimental condition was consistence with Figure 1a.
Catalysts 12 00681 g002
Figure 3. Effect of p-benzoquinone: (a) degradation curve; (b) removal efficiency with 30 min treatment. Ozone dosage: 8.0 mg/min, other experimental condition was consistence with Figure 1a.
Catalysts 12 00681 g003
Figure 4. Effect of triethylenediamine: (a) degradation curve; (b) removal efficiency with 30 min treatment. Ozone dosage: 8.0 mg/min, other experimental condition was consistence with Figure 1a.
Catalysts 12 00681 g004
Figure 5. Effect of indole: (a) degradation curve; (b) removal efficiency with 30 min treatment. Ozone dosage: 8.0 mg/min, other experimental condition was consistence with Figure 1a.
Catalysts 12 00681 g005
Figure 6. (a) UV-Vis spectra of MB and (b) TOC under various treatment time.
Catalysts 12 00681 g006
Figure 7. Fluorescence excitation-emission matrix spectra of MB with various reaction time: (a) 0 min; (b) 10 min; (c) 20 min; (d) 30 min.
Catalysts 12 00681 g007
Figure 8. Variation of pH and conductivity under various treatment time.
Catalysts 12 00681 g008
Figure 9. Variation of NH3-N under various treatment time.
Catalysts 12 00681 g009
Figure 10. Degradation pathway of MB with O3/SPC treatment.
Catalysts 12 00681 g010
Figure 11. Toxicity assessment: (a) Oral rat LD50; (b) Developmental toxicity; (c) Mutagenicity.
Catalysts 12 00681 g011aCatalysts 12 00681 g011b
Figure 12. (a) Applied for other dyes degradation; (b) COD removal for actual wastewater.
Catalysts 12 00681 g012aCatalysts 12 00681 g012b
Table 1. Energy efficiency and synergetic factor.
SPC Addition
(mg/L)
Energy Efficiency (g/kWh)Synergetic Factor
5 min10 min15 min20 min25 min30 min
016.3611.959.077.316.155.29——
3017.5312.229.397.406.385.541.14
5021.3313.9510.178.046.665.711.20
10019.4313.729.487.536.395.701.11
20019.4313.049.827.816.585.651.05
Table 2. DFT analysis results of MB molecule with DMol3 module.
Molecular Formula and Atomic NumberAtomf0Atomf0Atomf0
Catalysts 12 00681 i001C(1)0.028C(11)0.016H(21)0.041
C(2)−0.009C(12)0.024H(22)0.032
C(3)0.018C(13)0.012H(23)0.052
C(4)0.025C(14)0.002H(24)0.051
C(5)0.022S(15)0.060H(25)0.043
C(6)0.016O(16)0.077H(26)0.013
C(7)0.085O(17)0.084H(27)0.045
N(8)0.022O(18)0.058H(28)0.029
C(9)0.020H(19)0.042H(29)0.054
C(10)0.024H(20)0.015
Table 3. DFT analysis results of MB molecule with CASTEP module.
BondPopulationLength (A)BondPopulationLength (A)
Catalysts 12 00681 i002H2-H8−0.200.73C11-C121.001.54
H11-O30.451.11C2-C40.931.54
H7-C90.821.14C4-C61.081.54
H10-C120.821.14C8-C100.991.54
H5-C70.791.14C5-C60.931.54
H9-C110.821.14C9-C101.041.54
H4-C60.801.14C1-C31.081.54
H6-C70.791.14C2-C70.991.54
H1-C10.821.14C1-C20.931.54
H8-C101.101.14C12-C130.991.54
H3-C40.831.14C8-C130.951.54
H2-C31.091.14O2-S10.431.78
C5-N10.851.50O3-S10.181.78
C8-N10.811.51O1-S10.441.78
C3-C50.931.54C13-S10.541.81
C9-C110.961.54
Publisher’s Note: MDPI stays neutral with regard to jurisdictional claims in published maps and institutional affiliations.

