1. Introduction
Nitrogen oxides (NOx) present in the air are considered to be toxic gases. There exist several strategies for NOx removal, focusing either on the emission control and prevention of their formation, or dealing with NOx conversion to N
2 or HNO
3 using additional chemical reagents [
1]. While these methods cannot be used for NOx concentration of parts per billion (ppbv), heterogeneous photocatalysis offers such a possibility [
2,
3,
4,
5].
Because of the need to compare the performance of photocatalysts and assess their environmental applicability, the standard tests for the air-purification performance of semiconductor photocatalytic materials were developed, namely ISO 22197-1:2016, CEN (CEN/TS 16980-1, 2016), and UNI standards for nitric oxide (UNI 11247, 2010 and UNI 114874, 2013), further referred as ISO, CEN, and UNI.
Although these methods are well designed and allow the interlaboratory comparison of results in terms of photocatalytic activity, they are less meaningful for the prediction of the actual environmental impact under real-world conditions. The high input concentration of 500–1000 ppbv NO is one order of magnitude higher than that in heavily polluted air. Only NO is used as the model pollutant (except UNI 11247, 2010), although NO2 is more toxic (its amount in air is restricted by specific limit). While the NOx analyzer (chemiluminescent) specified in ISO 7996 measures only NO selectively, NO2 measurement suffers from the interference of other N-containing gases, including HONO and HNO3.
Thus, to evaluate the real impact of NOx photocatalytic abatement technology, a complete analysis of the degradation intermediates and products even at their very low concentration is of utmost importance. Such analytical data will enable to proceed with a complete balance of NOx compounds. This is necessary for the realistic assessment of the performance of photocatalytic technology.
To address this issue, several strategies were reported (
Table S1). Ifang et al. [
6] suggested testing the photocatalytic activity under relevant atmospheric conditions and low reactant concentrations (<100 ppbv), and strongly recommended NO
2 as a tested reactant. According to the authors, the yield of nitrate formed by the photooxidation of NO
2 should be quantified by ion chromatography to exclude or confirm the formation of other N-containing products. The interference issues of chemiluminescence analyzers can be solved by using carbonate denuder as a trap for HONO [
7].
Besides the common detection of NO and NO
2, several papers have dealt with the detection of other N-containing species. A chemiluminescence method for the detection of HONO was reported [
8]). Alternatively, HONO was detected by employing the long-path absorption photometer (LOPAP) method [
9,
10] developed by Heland et al. [
11]. The detection of NO
2, HONO, and N
2O by the combination of selective catalytic conversion measurement, LOPAP, and the gas chromatography/electron-capture detector, respectively, was published [
12]. Furthermore, these studies also focused on the determination of nitrate (NO
3−) and nitrite (NO
2−) anions adsorbed on the surfaces using ion chromatography. N
2O detected by GC-MS with cryotrapping was found to be the main product from the NO reactant; however, the NO concentration was 100 ppmv, i.e., very high [
13].
The analysis of the all-important N-compounds (NO, NO2, HONO, HNO3, and N2O) needed for the overall evaluation of photocatalyst performance is still exceptional within the research community. Dedicated research dealing with possible solutions of complete NOx degradation monitoring and photocatalytic activity assessment is of great value.
Therefore, we developed a methodology for the continuous monitoring of N-species participating in photocatalytic NOx abatement. Our novel complex apparatus is partly based on the ISO standard (NO analyzer, bed-flow reactor, total reactor flow, light intensity, humidity) in order to enable interlaboratory results; however, we have supplemented it with very sensitive and selective NO2 and HONO analyzers. After optimization procedures, the determination of the full balance of N-products (N+2,3,4,5) was carried out, including those adsorbed in the photocatalyst (HNO3 and HONO). This enabled us to assess more realistically the possible environmental impact of the air purification by means of photocatalysts.
2. Results and Discussion
2.1. Requirements to the Apparatus
There are a number of requirements which should be fulfilled. We show that our analytical system used in the developed experimental set-up fulfills following requirements:
No interference with each other;
Sufficient sensitivity achieving low detection limit;
Good linearity of the response in the needed concentration range;
Rapid response;
Long-term stability–suppressed zero drift;
Reasonable investment and operating costs.
Ad 1: Analyzers connected in parallel must not interfere with each other. Specifically, the analyzers must not exhibit chemical interferences towards other N-containing species. It is desirable to test independently the proper function of each analyzer and perform their calibration. This is realized by a system of three-way valves, as specified below. The whole apparatus tightness is crucial due the toxic gases used, and any leaks must be revealed easily. Therefore, the system should be well-arranged and sufficiently easy to operate. Apparatus materials have to be inert for all the used chemicals, and the tubes should be as short as possible to minimize the sorption of the gases. Chemiluminescence analyzers (HONO and NO
2) were tuned to be interference-free [
14,
15,
16]. The NO
2 analyzer showed no detectable response to 1.0 ppmv of NO, and the HONO analyzer showed no detectable response both to 100 ppbv NO
2 and NO.
Ad 2: Due to the very low concentrations to be monitored, a high sensitivity of analyzers is essential. Techniques based on chemiluminescence detection fulfill this requirement very well. The advantages of chemiluminescence techniques lie in their selectivity as well as very good sensitivity. The sensitivity (and the dynamic range) can be optimized by the composition of the chemiluminescence solutions as well as by the gas flow through the analyzer.
The detection limit ought to be in units of ppbv, as it usually occurs in natural air. The nominal detection limits of the NO
2 and HONO analyzers according to the producers are much lower than is needed for our application [
14,
15,
16]. However, the detection limits determined in our laboratory with the analyzers connected to the measurement system were much higher: 6.0 ppbv for NO
2 and 1.0 ppbv for HONO. Meaningful reasons may be the additional instabilities caused by parallel sampling and the additional adsorption of gases within the tubes. The limit of detection was estimated as the concentration at which the signal would be equal three-times the standard deviation of the background signal.
Ad 3 and 4: For the possible application in kinetic studies, it is crucial that the analyzers respond rapidly with a sufficient frequency of data collection at least in one-second intervals. Furthermore, the response needs to be linear over the range of expected concentrations ranged from 1.0 to 1000 ppbv. For the HONO analyzer, a good linearity was found in the tested range 2.0–300 ppbv. The NO
2 analyzer performed a linear trend for concentrations ranging from 10 to 1000 ppbv. Below 10 ppbv, nonlinearity was observed, as was previously described in the literature [
15].
Ad 5: A critical parameter for the applicability of the selected techniques is their long-term stability. For the chemiluminescence custom-made analyzers, it was tested with following concentrations: 100 ppbv for NO2 and 34 μg L−1 for (corresponding to 12 ppbv of HONO in the air under given experimental conditions). The dosing of the chemicals by peristaltic pumps may be unstable for longer time periods. Therefore, for NO2, the stability was evaluated by observing the averages of the signals by periods of 10 min (122 points) within 10 h, with the standard deviation of those averages being less than 1%. For HONO, the signal was averaged for 5 min before and after 8 h of the photocatalytic experiment (signal obtained from standard solution of ), the difference being 1.5%. Both custom-made analyzers showed acceptable stability during a time period of at least 8 h, which is sufficient to ensure a reliable assessment of the photocatalytic activity.
Ad 6: The investment needed for assembling the custom-made analyzers is given mainly by the cost of the photomultiplier and the pumps (for liquid reagents and gas sampling). From current prices of these components, the estimated cost is below EUR 4000. This is roughly five times lower than the cost of a commercial NO2 analyzer. Currently, commercial analyzers for HONO have not been developed.
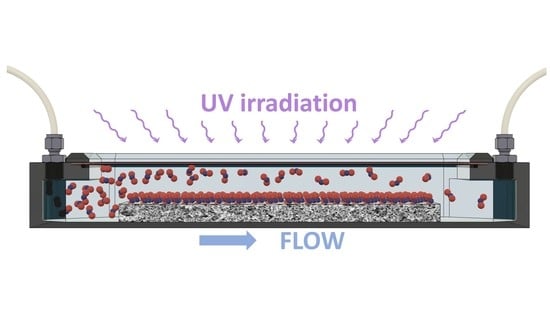
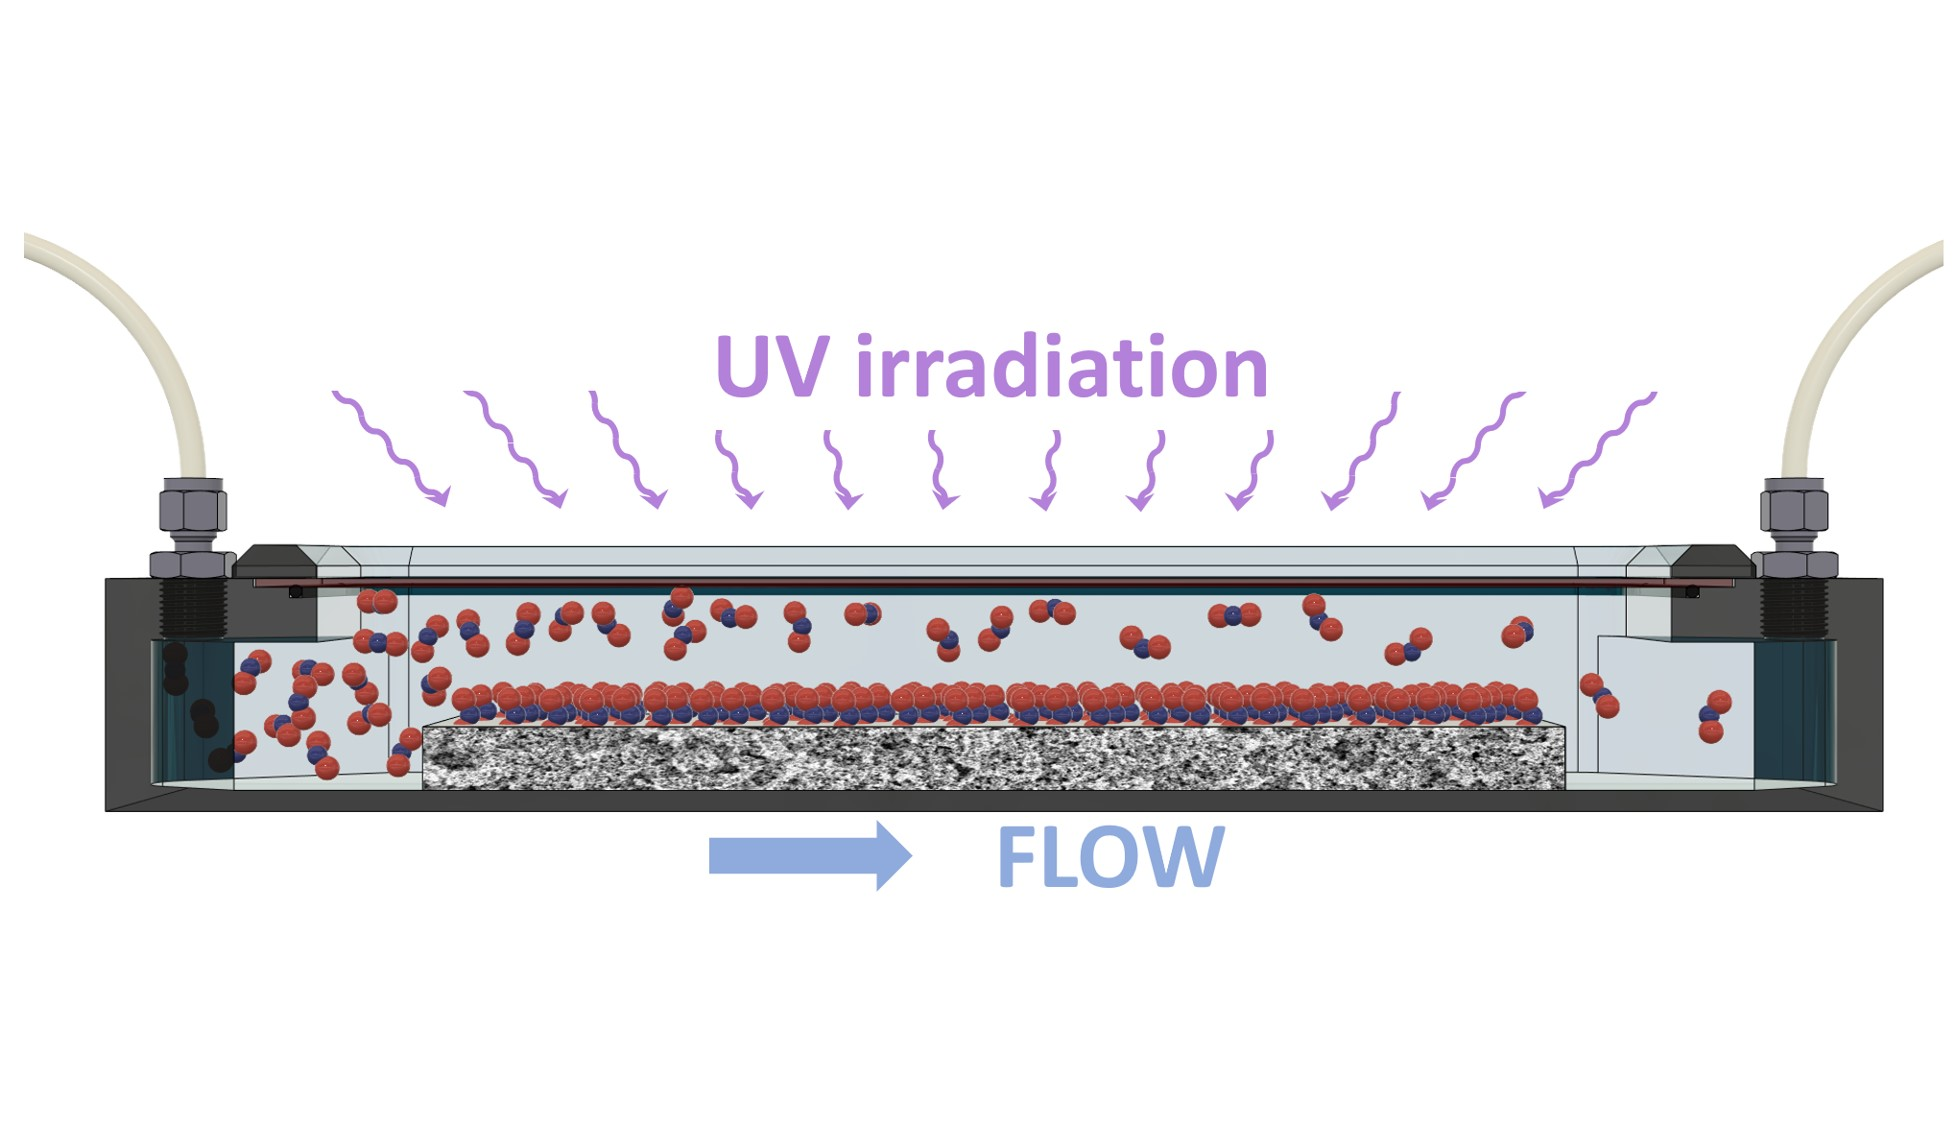
2.2. Photocatalytic Reactor and Analytical System
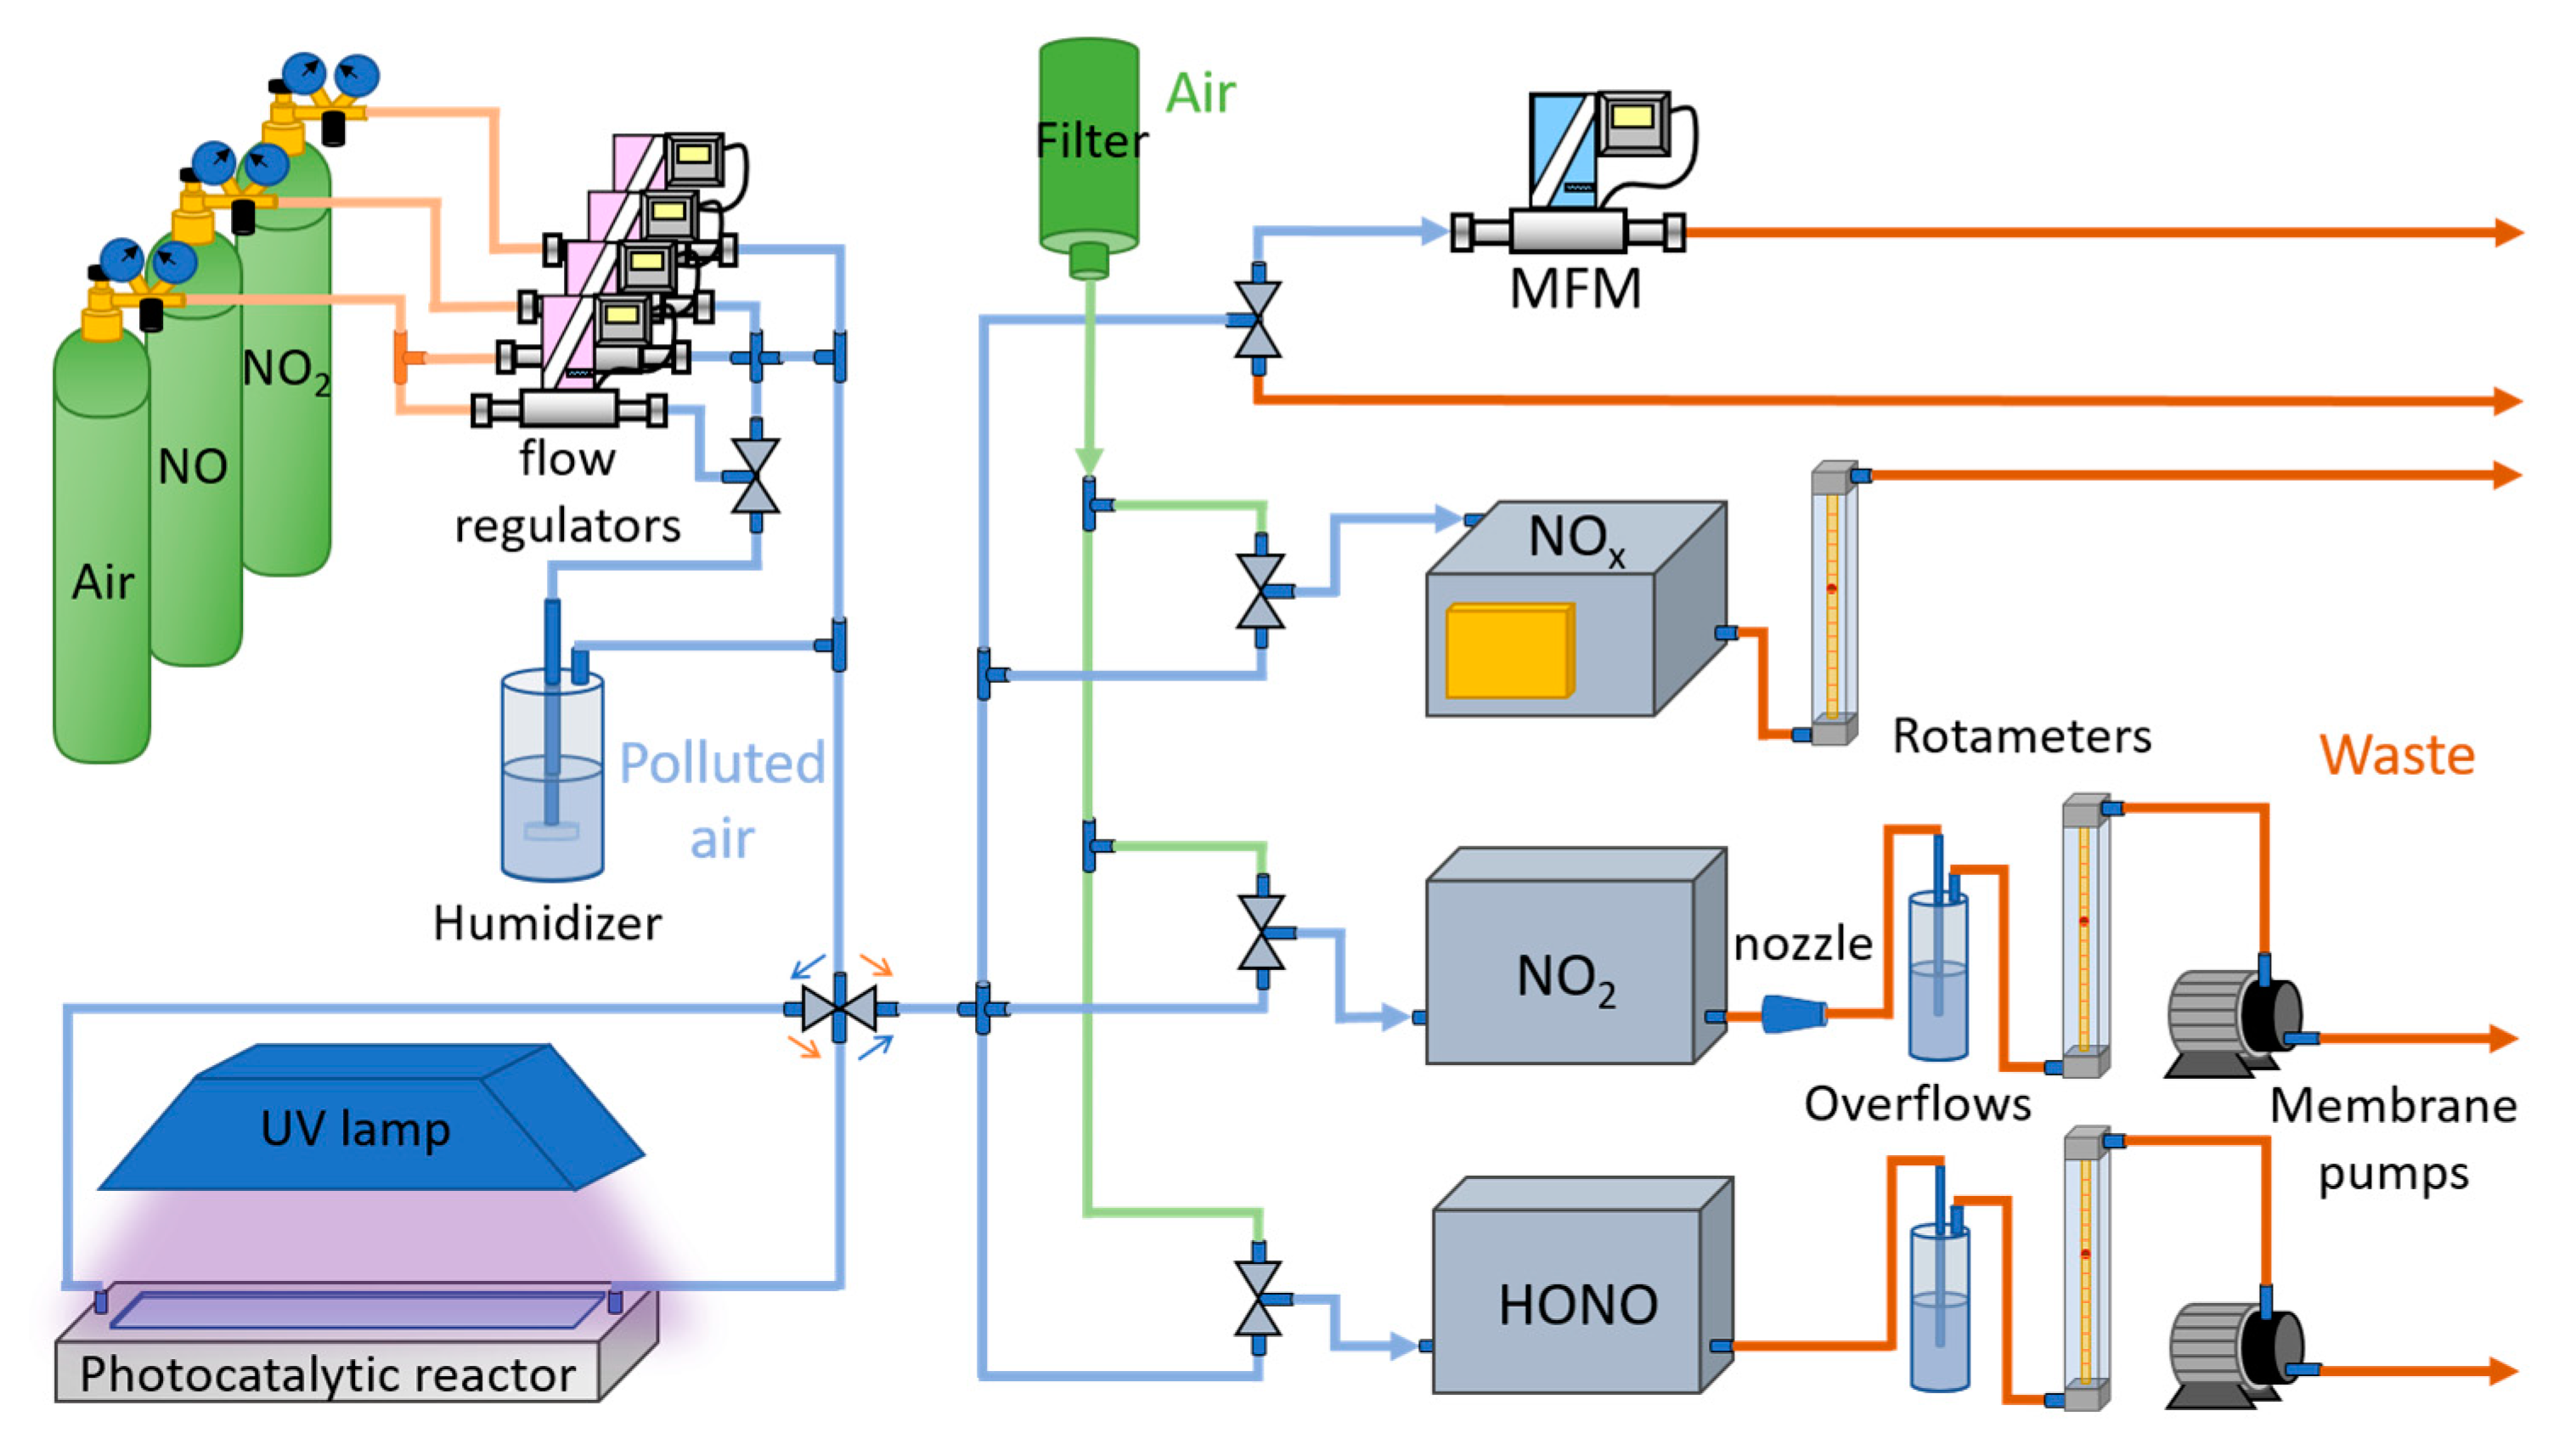
Our self-developed set-up consisted of three main parts: a gas supply manifold, a photoreactor, and an analytical system (
Figure 1). A set of mass flow controllers (Bronkhorst, The Netherlands) was used to dilute the pollutant (50 ppmv NO or NO
2 in N
2, Messer Technogas, Prague, Czech Republic) to the desired concentrations of 100 and 1000 ppbv. The carrier gas (synthetic air) was humidified using a Drechsel bottle. Stream of the gas passed through the photoreactor (ISO 22197-1, 2016) over a photocatalyst layer. Specifically, the following testing conditions have been retained: total flow rate 3 L min
−1, relative humidity 50% at 25 °C, radiation intensity 1.0 mW cm
−2 of UVA light (TL-D 15W BLB, Philips, Prague, Czech Republic) with a dominant wavelength at 365 nm, a geometric area of the layer 5 × 10 cm
2, and the space height of 0.5 cm above the layer for the flowing gas. The output of the reactor was divided into branches leading to the analyzers for HONO, NO
2, and NO
x/NO monitoring (
Figure 1). These are described in the
Supplementary Materials (Figures S1 and S2).
Downstream of the reactor, the gas is simultaneously distributed to the analyzers. They actively suck the gas by pumps, which are protected by liquid overflow bottles placed in front of the pumps. The exhaust tubes downstream of the pumps are equipped by one-way valves, preventing the return of the exhaust gases. The inlet to each analyzer can be switched by a three-way ball valve between the analyzed gas and air from the lab drawn through a filter. The analyzers can thus be tested individually. The excess gas goes either directly to waste or can be passed by a 3-way ball valve through a capillary mass-flow meter (MFM) to test the leakages in the segment of the system, including the photoreactor. The bubbler has to be first bypassed to avoid damaging the MFM by water vapor.
2.3. Determination of Products in Gaseous Phase
The deNOx curves were integrated based on the formula in Equation (1), as follows:
where
p is normal gas pressure (101.325 kPa),
q is the total gas flow (m
3 s
−1),
t is the time of photocatalysis (s),
is a molar fraction of the pollutant in the input gas mixture,
is the measured instantaneous NO
x molar fraction in the gas mixture behind the photoreactor,
R is the molar gas constant (8.314 J.K
−1 mol
−1), and
T is temperature (273.15 K). The gas conditions are given from the mass flow controllers, where the controlled volume flow is given under normal conditions.
2.4. Quantification of and Anions (HONO and HNO3) Adsorbed on the Photocatalyst
Nitrite and nitrate anions accumulated on the layer during the photocatalytic reaction were determined by means of an ultralow-range colorimeter (HI764 Nitrite Checker, Hanna Instruments, Prague, Czech Republic) and corresponding reagents. After a 24 h extraction of the anions to an exact volume (60 or 80 mL) of deionized water, a proper dose of diazotation reagents (Hanna Instruments, Prague, Czech Republic) was added to the solution and stirred carefully. In the presence of anions, the solution became a shade of pink, depending on the nitrite concentration. anions were first reduced to by cadmium (reagents NitraVer6, Hach Lange, GmbH, Berlin, Germany) and, afterwards, analyzed by the equal procedure as for . Concentration values obtained for the nitrites were determined using the known NaNO2 solution concentration, and those for nitrates were adjusted according to the measurement of the known KNO3 solution concentration. In several cases, the solutions with the extracted nitrites/nitrates were analyzed spectrophotometrically in a commercial lab for comparison, and the results were in the reasonable agreement. Always fresh layers were used for these experiments.
2.5. Modified ISO Test Conditions
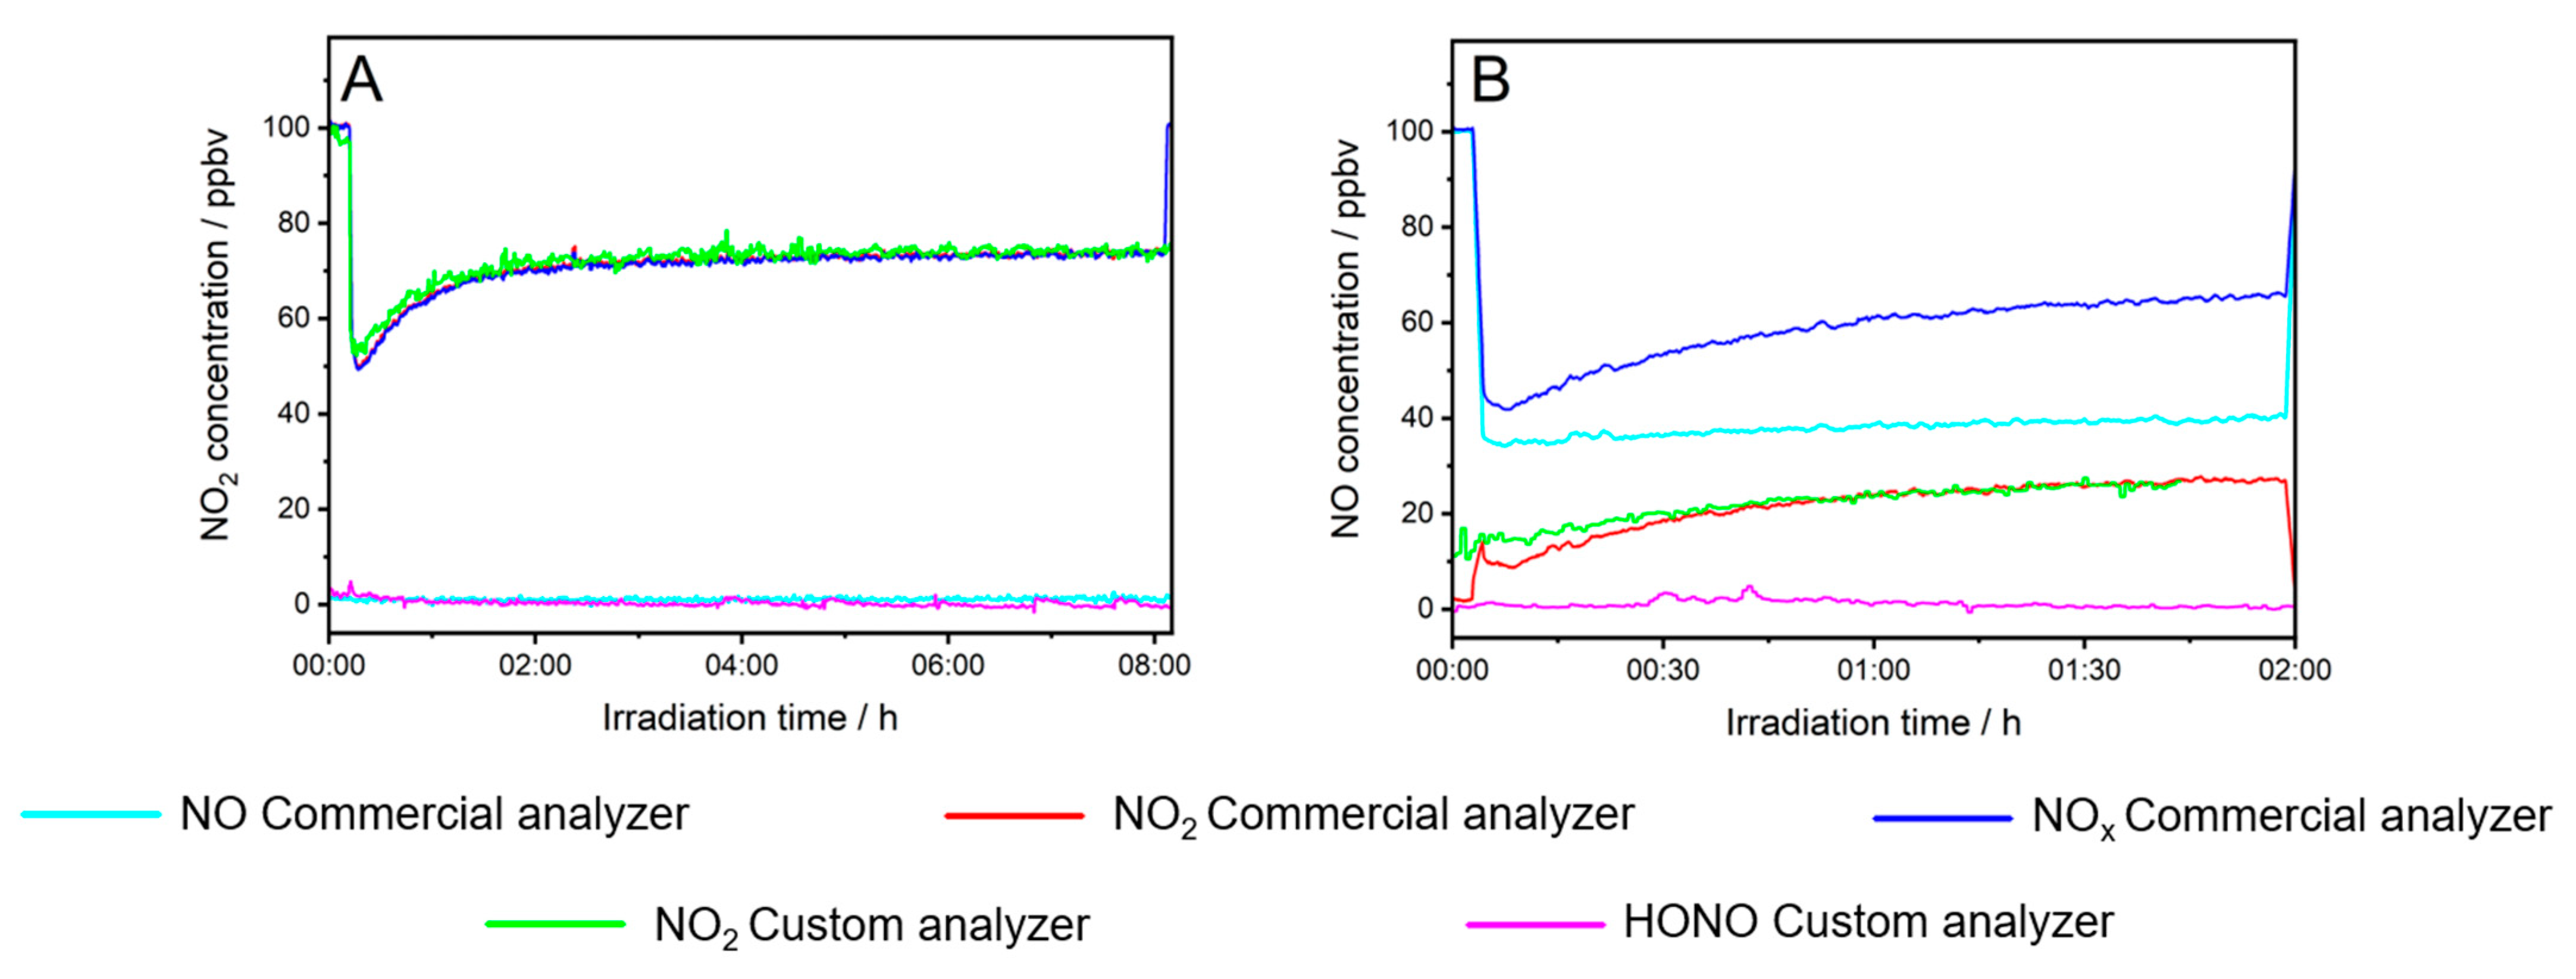
Unlike the standardized methods, we focused on the following experimental conditions. First, the inlet concentration of the model NO or NO2 pollutant was adjusted to 100 ppbv, which corresponds to realistic environmental conditions. Due to simple reaction stoichiometry, the sum of the concentrations of all assumed gaseous N-compounds (NO, NO2, HONO, HNO3, but not N2O) present in the air flow was expected to be the same as the initial concentration of reactant. The standard total gas flow (3 L min−1) through the reactor maintained unmodified.
Second, the duration of the photocatalytic test was longer. Our experiments showed that for highly active samples, the steady-state was not reached even after five hours. Third, three analyzers were used, in contrast to the only one in the ISO standard.


 ,
, 


