Article

Characterization and Evaluation of Natural Bearing and Iron-Enriched Montmorillonitic Clay as Catalysts for Wet Oxidation of Dye-Containing Wastewaters

by
Sanda Andrada Maicaneanu
1,*,
David L. Henninger III
1,
Charles H. Lake
1,
Ethan Addicott
1,
Loredana E. Olar
2 and
Razvan Stefan
2,*
1
Madia Department of Chemistry, Biochemistry, Physics and Engineering, Indiana University of Pennsylvania, Indiana, PA 15705, USA
2
Preclinic Department, University of Agricultural Science and Veterinary Medicine, 3-5 Calea Manastur, 400372 Cluj-Napoca, Romania
*
Authors to whom correspondence should be addressed.
Catalysts 2022, 12(6), 652; https://doi.org/10.3390/catal12060652
Submission received: 31 March 2022 / Revised: 23 May 2022 / Accepted: 9 June 2022 / Published: 14 June 2022
(This article belongs to the Special Issue Catalytic Wet Air Oxidation of Aromatics)

Abstract

:
Natural bearing (raw and calcined at 500 °C) and iron-enriched (impregnation and pillaring) montmorillonitic clay samples were prepared. The obtained samples were characterized (X-ray diffraction, Fourier Transformed Infrared Spectroscopy, Scanning Electron Microscopy, and Energy Dispersive X-ray Spectroscopy) and evaluated as catalysts in catalytic wet oxidation of Brilliant Green and Crystal Violet. Experiments were conducted in the same conditions (0.5 g catalysts, 300 mL air/min or 0.5 mL H2O2, 25 mL of dye solution, 25 °C, initial solution pH = 6.0, for 3 h) in thermostated batch reaction tubes. Process evolution was followed using UV-Vis spectrometry (200–1100 cm−1) and total organic carbon. Dye removal efficiencies (decolorization) between 98 and 99% were determined, while total organic carbon removal efficiencies were calculated to be in the 53–98% range. Iron leakage investigation showed that iron is lost in higher amounts for the catalysts prepared using the impregnation method by comparison with the pillared sample.

1. Introduction

Clay minerals, hydrous aluminosilicates, are extremely versatile materials with applications ranging from industrial to medical. Clays are used to produce ceramics and refractories, soil conditioners, drilling fluids and filters, or as materials for pollutants removal in environmental application [1,2,3,4,5].
The main applications of clay minerals in wastewater treatment are as adsorbents or catalysts. Adsorption allows the removal of pollutant by mass transfer to a solid surface (adsorbent) and is one of the main processes used in the treatment of wastewaters containing dyes [2,3,6,7]. Adsorption has advantages by comparison with other processes as it has a high efficiency for all dyes, the adsorbent can be regenerated, and more than that, clays are cost effective (lowest price per kilogram for effluent treatment) [2,3]. Various types of raw clays (e.g., kaolinite, bentonite, sepiolite) or acid-, base-, surfactant-, polymer-modified clays proved to be extremely efficient in the removal of dyes from wastewater [2,3,6,7]. Advances Oxidation Processes (AOPs) such as catalytic wet air oxidation (CWAO) and catalytic wet peroxide oxidation (CWPO) are heterogeneous processes that require the presence of a catalysts and a strong oxidant (oxygen, ozone, hydrogen peroxide) [4,8]. Pillared clays modified with metals such as aluminum, copper, iron, titanium, mono- or bicomponent are often used as catalysts in such processes [4,5,9].
Dyes are an important class of organic pollutants generated by various industries. Effects on the environment are various: colored water, reduced amounts of dissolved oxygen, and increased biological oxygen demand [10,11]. Most synthetic dyes are toxic to living organisms, mutagenicity and carcinogenicity being the main hazardous effects [10,11]. Considering all these, several methods were developed for removal of dyes from wastewater: adsorption (activated carbon, nanoparticles, low-cost adsorbents from various sources), ion exchange, chemical precipitation, coagulation-flocculation, oxidation, electrochemical treatment, liquid–liquid extraction, membrane filtration, biological treatment, and thermal methods [10,12]. In search for more efficient technologies and since dye effluents are often difficult to treat using conventional methods, scientists are looking more and more towards the oxidation processes, especially catalytic oxidation. AOPs in particular, proved to have a high efficiency in converting toxic organic pollutants to harmless compounds [11,12,13]. The main AOPs studied for dye removal are as follows: ozonation, Fenton process (homogeneous and heterogeneous), photo-Fenton, sono-Fenton, electro-Fenton, CWAO, electrochemical oxidation, and photocatalytic oxidation [11,12,13].
Based on our knowledge, there are not many studies in the literature dealing with the removal of Brilliant Green (BG) and Crystal Violet (CV) dyes using clay mineral as catalysts in CWAO and CWPO processes. The only study found deals with the heterogeneous Fenton-like reaction on an iron-based catalyst prepared by wet impregnation of a Moroccan clay. Iron oxide was identified by the authors in the final structure of the clay, and 99% chemical oxygen demand and decolorization efficiencies were reported [14].
Both selected dyes are triphenylmethane dyes and according to their published Safety Data Sheets are described as dangerous (CV) and hazardous (BG). CV is classified as harmful to aquatic life with long lasting effects and as a severe eye irritant suspected of causing cancer in humans. BG is very toxic to aquatic life, harmful to terrestrial vertebrates and soils environment, and harmful to humans by all exposure routes (oral, dermal, inhalation).
This work proposes the evaluation of the natural bearing and iron-enriched montmorillonitic clays as catalysts for the removal of BG and CV dyes from water using CWAO and CWPO processes (coupled with adsorption) in mild conditions. Seven clay samples were prepared, characterized, and tested in the above-mentioned processes.

2. Results and Discussion

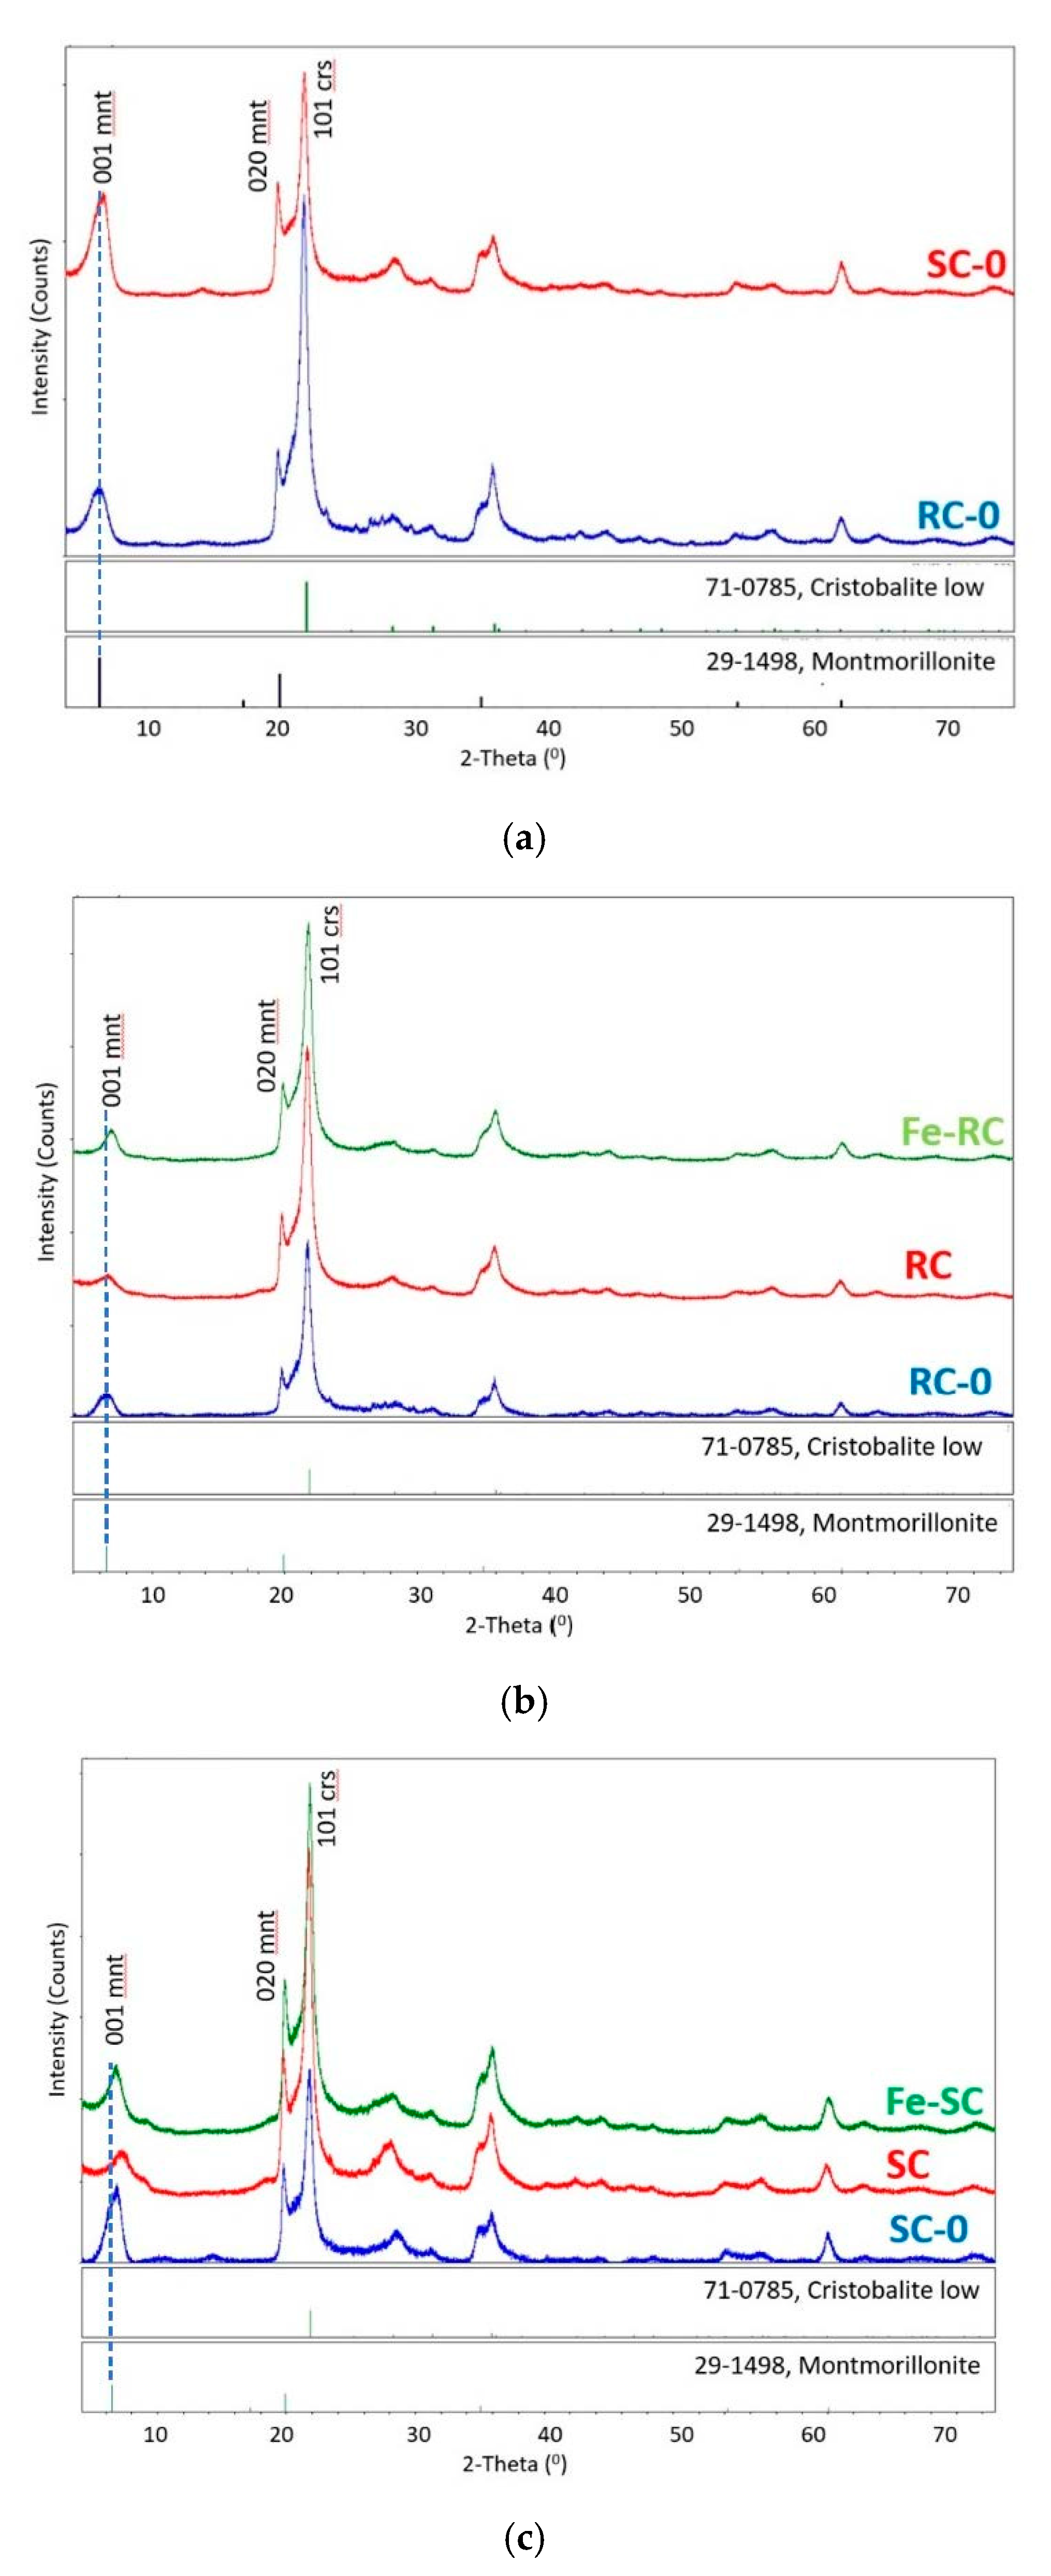
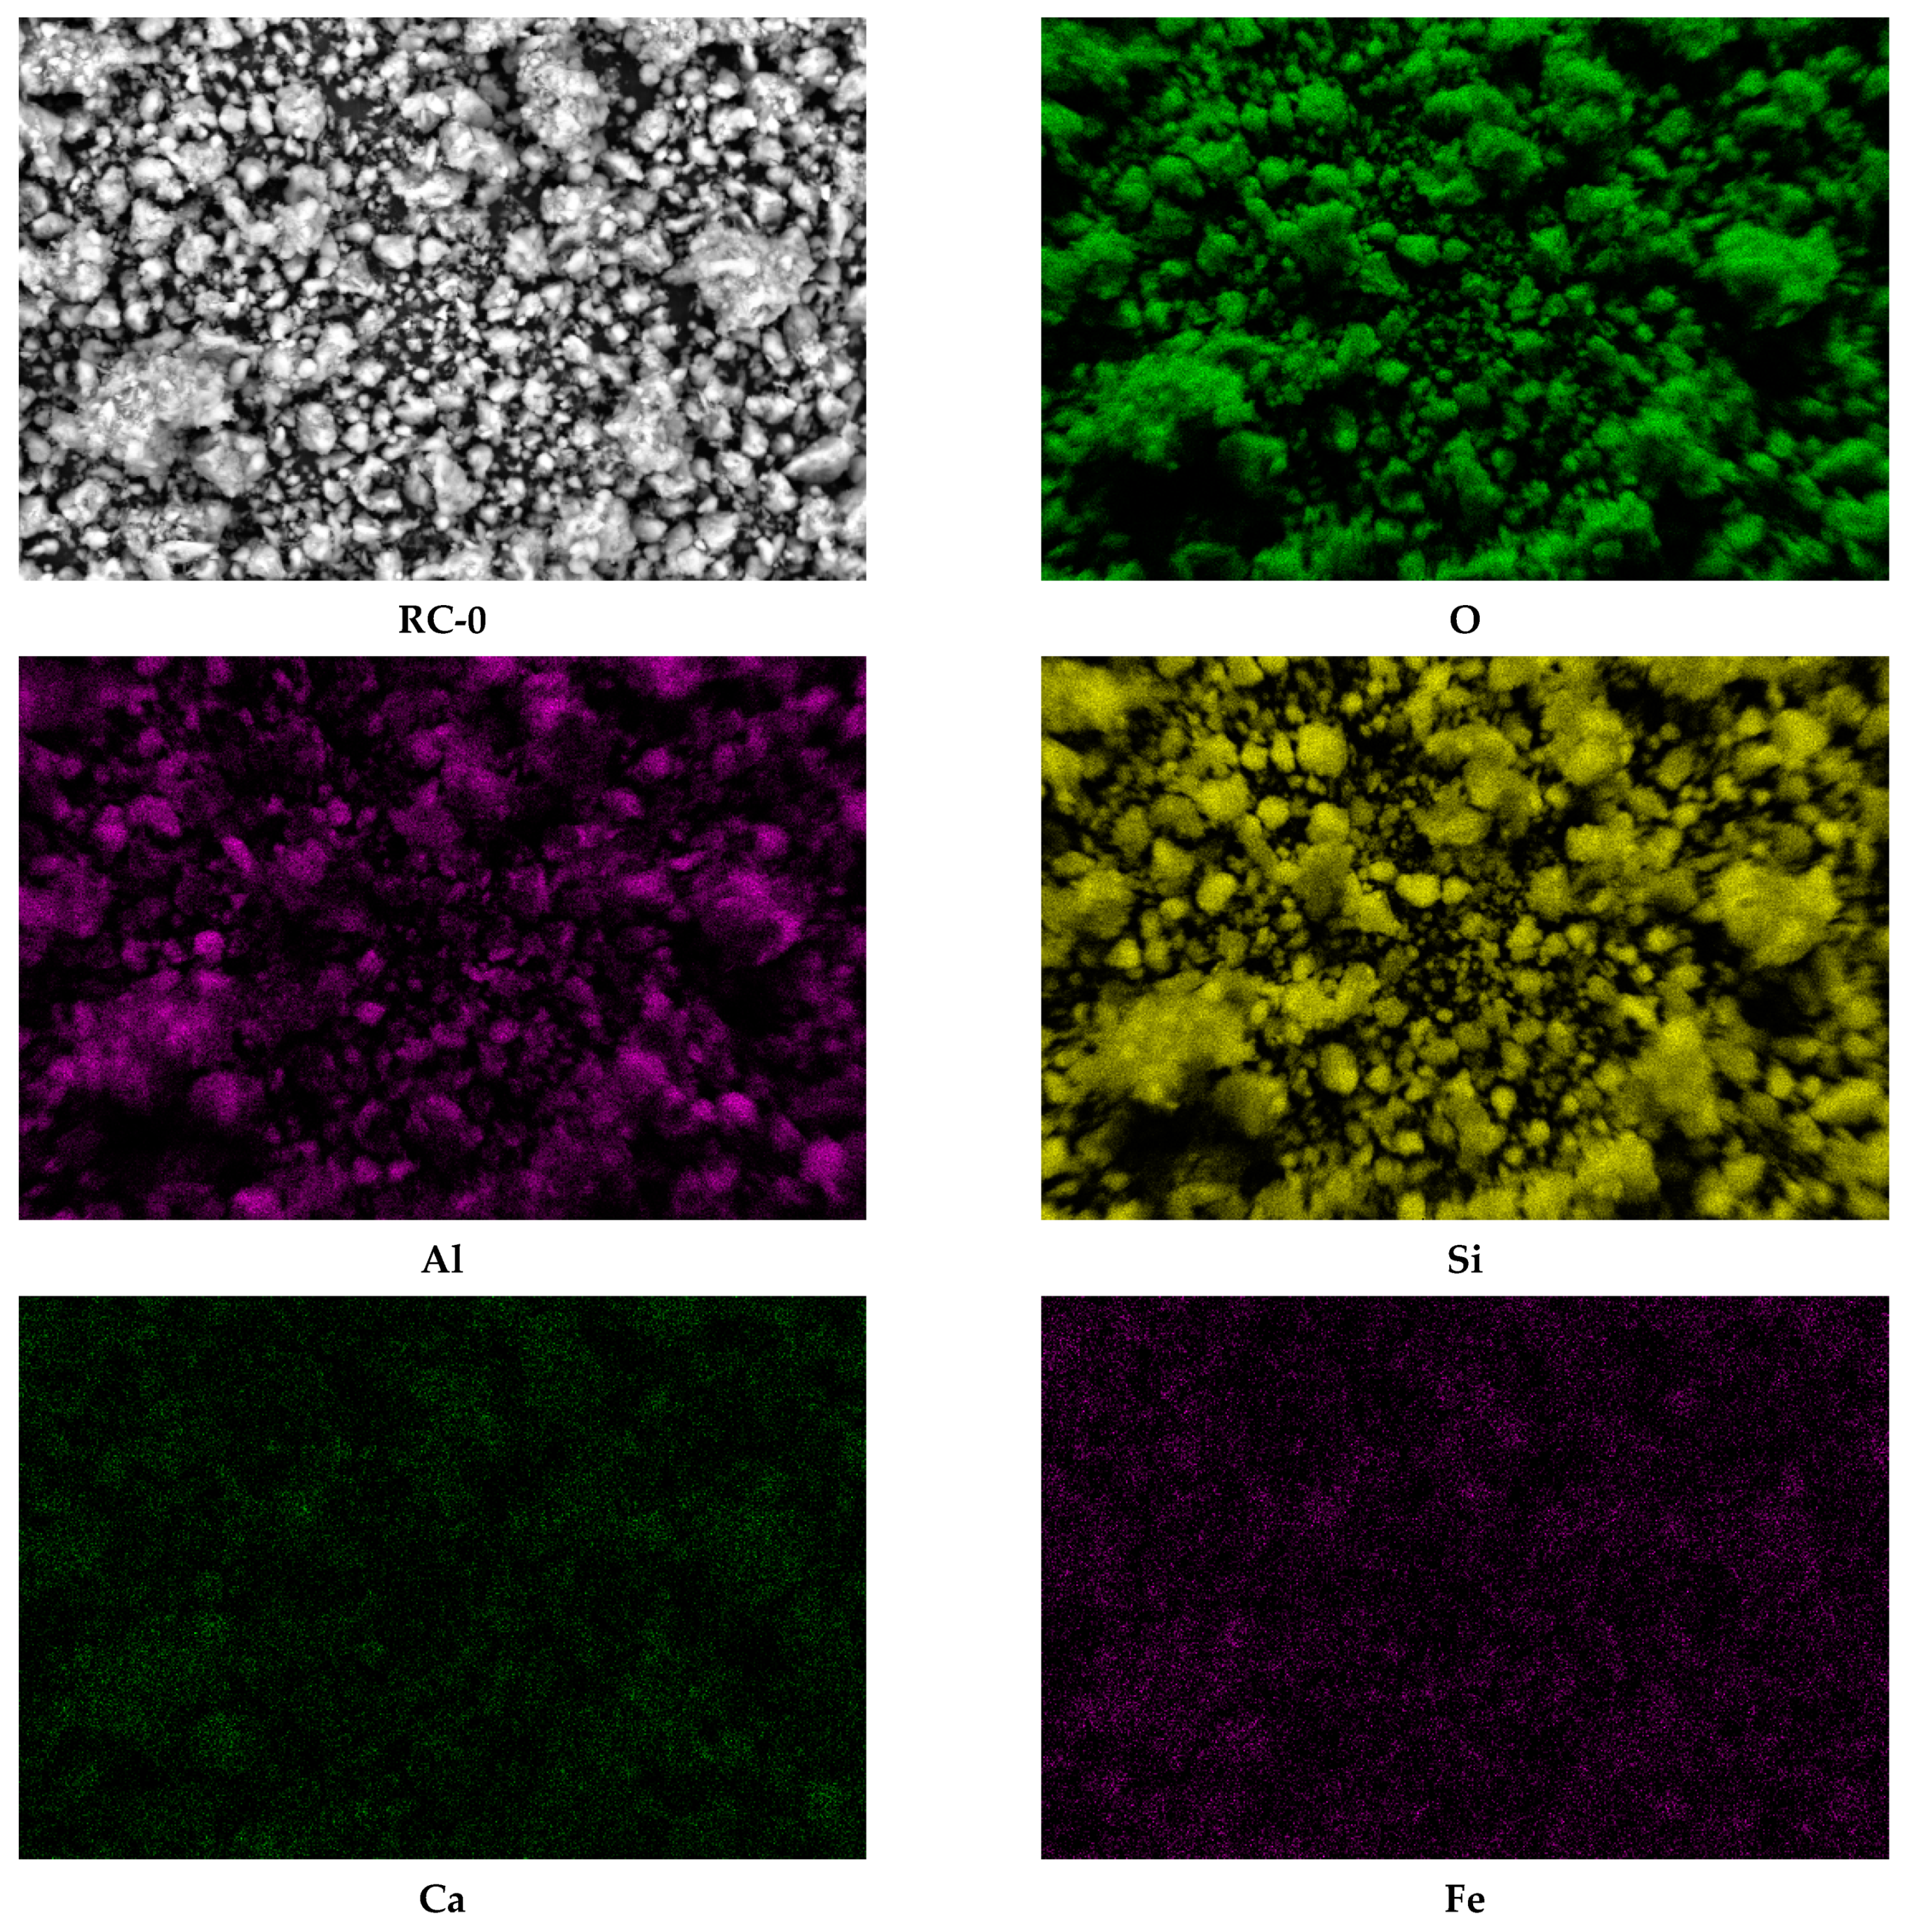
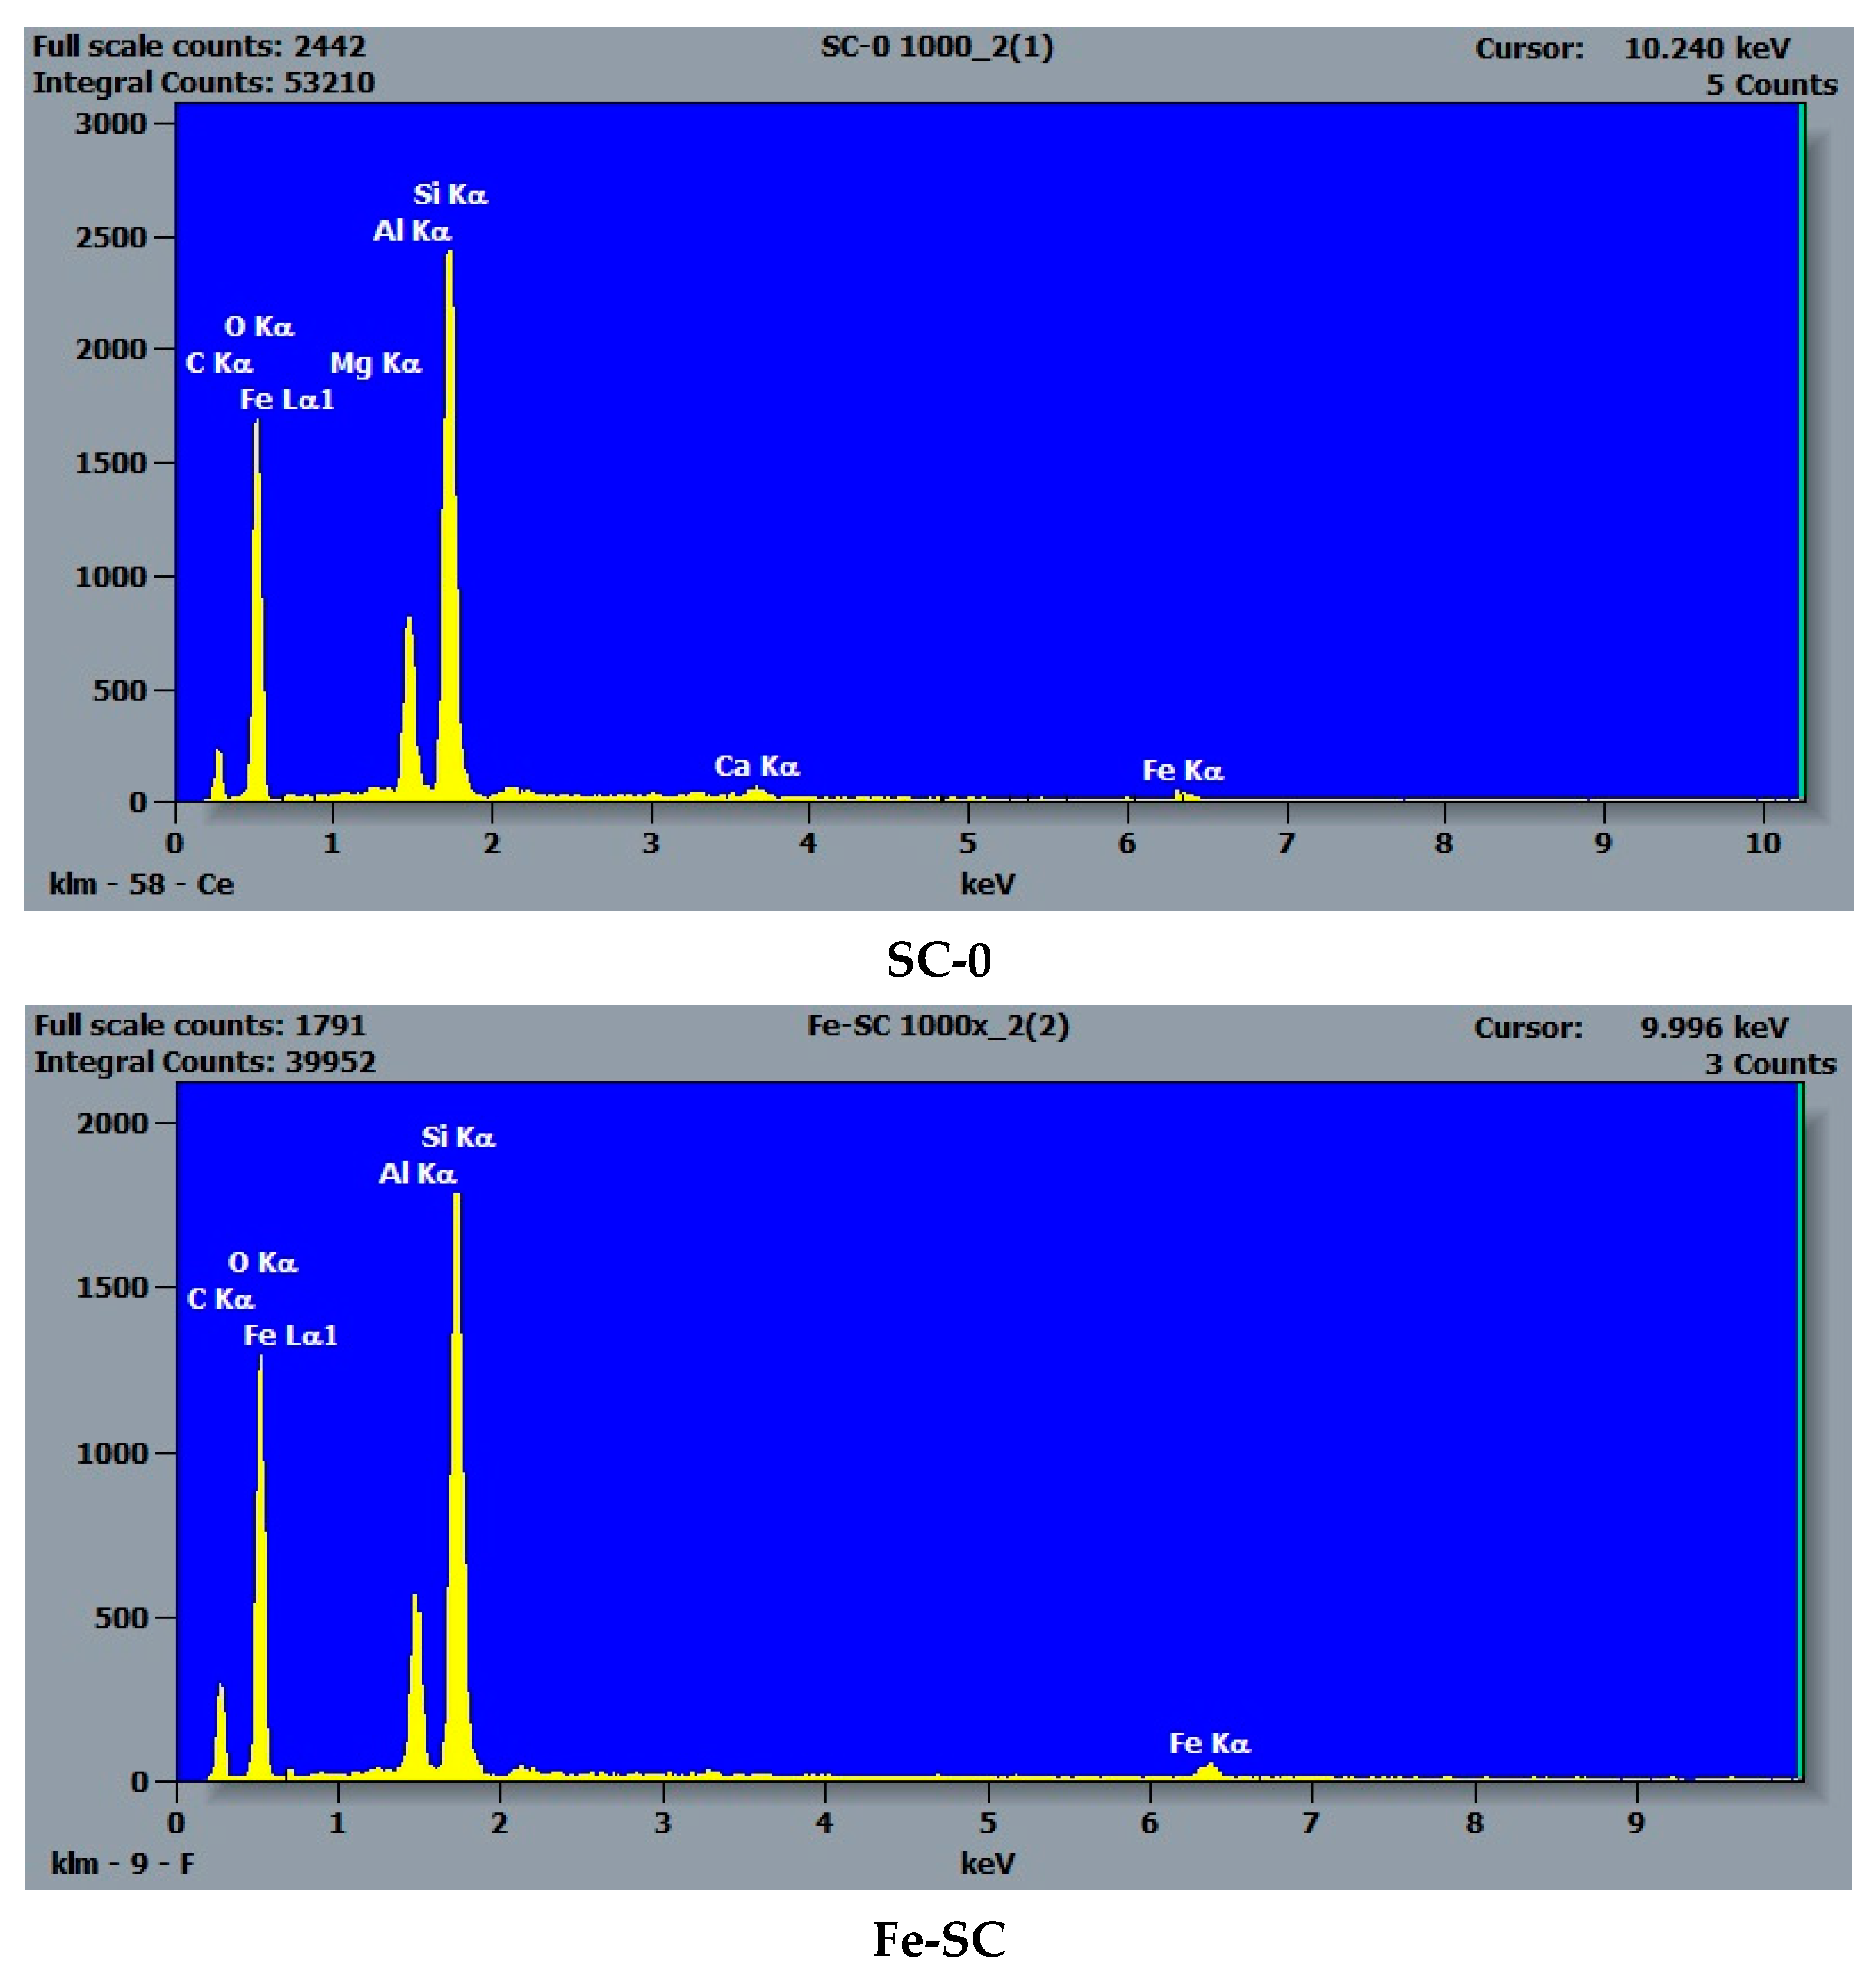
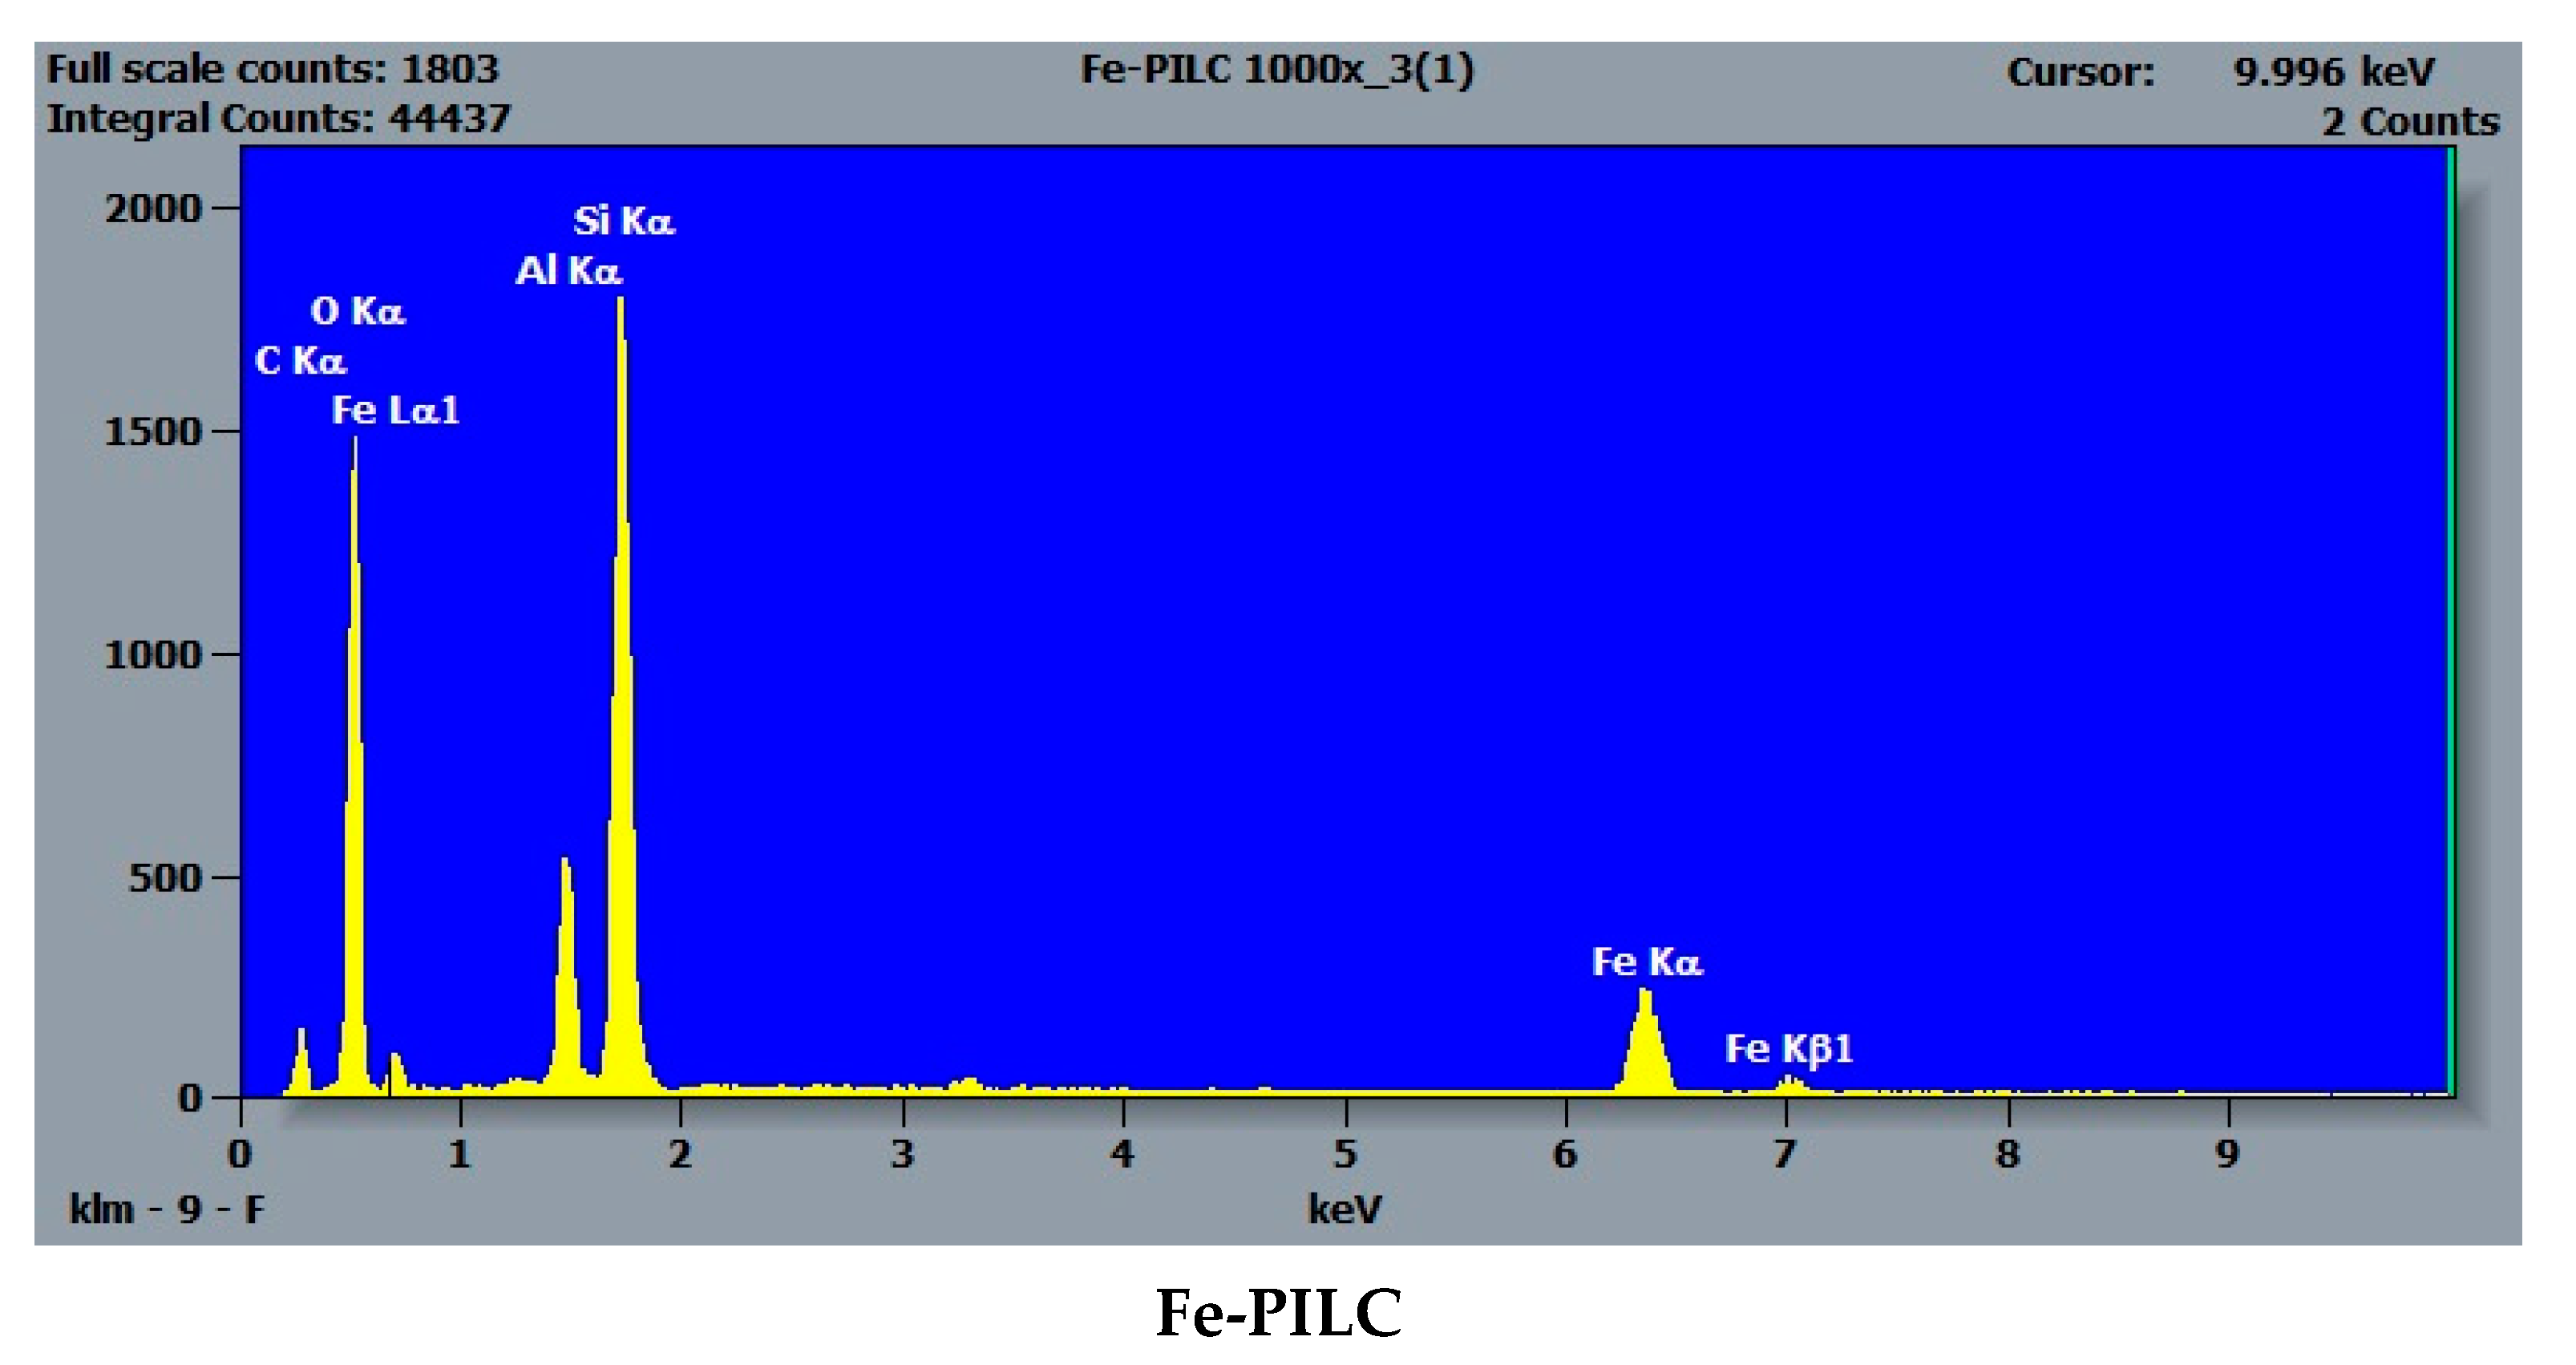
2.1. Clay Samples Characterization

The raw clay used in this study was collected from a deposit located in Oraşul Nou, Satu Mare County, Romania that contains montmorillonite (20–85%, up to 95% in some locations) as the most abundant clay mineral [15]. Samples were collected from various locations in the above-mentioned deposit and mixed to maximise homogeneity.
The XRD diffractograms for SC-0, RC-0, SC, RC, Fe-RC, and Fe-SC, Figure 1, show a similarity in crystal phase content, with the major components being identified as low cristobalite (crs, 71-0785, ICDD PDF2) and montmorillonite (mnt, 29-1498, ICDD, PDF2). An attempt to produce an iron “pillared” clay sample resulted in a significant hematite phase (hem, 33-0664, ICDD PDF2), hinting that the Fe(III) ions diffused out of the montmorillonite layers [16]. The pillaring process and its impact on the studied clay needs further study.
The largest diffraction peak present in all diffractograms, Figure 1, was associated with diffraction from the 101 set of planes of the cristobalite phase. In the montmorillonite phases, two distinct class of reflections are of interest (as in all smectite phases in general). The basal (00l) reflections represent the interlayer spacing between the two-dimensional silicate layers in the montmorillonite clay. This set of reflections is generally highly susceptible to moisture and intercalation with an average d-spacing (001) between 9.6–15 Å. The resulting swelling or contraction of the interlayer d-spacing has a significant impact on the 2θ angle of the associated diffraction peak. The peak widths associated with these basal reflections show significant broadening due to substantial disorder and/or stacking faults within the layers of the crystal structure [17]. The montmorillonite (hk0) class of reflections represent diffraction associated within the two-dimensional dioctahedral silicate layers of atoms in the montmorillonite clay structure. The peak position and width of these reflections are far less susceptible to moisture and intercalation. This can be observed by the consistency of the montmorillonite 020 diffraction peaks as compared to those associated with the 001 layers.
The diffractograms for the raw clay (RC-0) and the separated clay (SC-0) are collected in Figure 1a. The broad montmorillonite 001 peak represents the disorder in the water/cations present in the interlayer spacing. Notice that the raw clay (RC-0) has a larger d-spacing between the smectite layers than that for the separated clay (SC-0).
In the separated clay samples (SC-0, SC, Fe-SC), Figure 1c, the average d-spacing (001) between the smectite layers decreased upon calcination (d(SC-0) = 12.85 Å to d(SC) = 12.04 Å) and re-expanded when Fe(III) was diffused into the layer through Fe-impregnation (d(Fe-SC) = 12.91 Å). For the raw clay samples (RC-0, RC, Fe-RC), Figure 1b, the average d-spacing contracted in the calcined raw sample (d(RC-0) = 13.68 Å to d(RC) = 13.35 Å) and continued to contract upon ion-exchange with Fe(III) (d(Fe-RC) = 12.88 Å). Note that upon impregnation with Fe(III), both RC and SC obtain similar interlayer spacing.
The main distinct bands (i.e., 476, 792, 1047, and 1098 cm−1) of FTIR spectra, Figure 2, that are mostly associated with montmorillonite-like structure [18], are further connected to their characteristic bond vibrations. Their narrow shapes revealed the crystalline structure, in good agreement with XRD diffractograms. The wavenumbers indicated on the figures were measured for the initial samples (RC-0 and SC-0) in both graphs to easier identify the possible shifts after the subsequent treatments.
The main bands that dominate the spectra, located at 1047 and 1098 cm−1, were both assigned to Si–O stretching vibrations inside the tetrahedral sheet, “longitudinal modes” [19]. Their individual broadness and relative intensities changed from one sample to another along with the applied treatment. Because their separation decreased, the first band appears as a shoulder. A specific spectral shift was observed for both lines compared with literature data, while the split indicates the presence of cristobalite (Si–O stretching) in agreement with XRD results [20]. After separation, Figure 2b, these two bands became similar in intensities and kept their spectral positions and separation, even though several treatment steps were applied to the starting sample (SC-0). As a specific feature, the first mentioned band (1047 cm−1) is smaller than the second band (1098 cm−1), not like other monmorillonite-like structures presented in the literature [19]. A shoulder located at 1198 cm−1 in all samples appear in spectra presented in other articles but was not assigned in similar samples of montmorillonite [19].
The second significant spectral range in all spectra is composed by the bands located at: 420, 476, 534, and 625 cm−1, connected with deformations vibrations in Si–O–(Si,Al) like bonds [21].
Between the above-mentioned ranges, a few bands were visible as follows. At 792 cm−1, having an identical spectral position and intensity for all samples, a band assigned to Si–O bending [21] appeared with no shape modifications. The minor shoulders of the bands located at 923 (RC-0), 934 cm−1 (SC-0), 885 cm−1 (RC-0), and 889 cm−1 (SC-0) were connected with Al, Al–OH deformations (900 cm−1 region) and Al, Mg–OH (880 cm−1 region) deformations (aluminum is partially substituted by magnesium in the octahedral layer) [20].
In the 3000–4000 cm−1 spectral range, two bands can be identified in the first group, Figure 2a, one narrow, at 3643 cm−1 which indicates the stretching vibrations of hydroxyl groups and the other, broad, at 3406 cm−1 as an envelope for three different vibrations inside water molecules [21]. After clay separation, Figure 2b, the maxima of the envelope, assigned to H–O–H linkage vibrations, shifts upwards at 3432 cm−1 [20], while the second group, assigned to inner water O–H stretching vibrations, shifts downwards to 3632 cm−1 [21] that indicates new generated environment for water inside the treated montmorillonite. Additionally,
Related to the water presence, a small and broad band is present at 1639 cm−1 generated by the vibrations belonging to O–H band deformations inside the embedded water [19]. As shown in Figure 2, upon treatment, shifts of the main peaks were identified as local environment changes due to the replacement of naturally present counterions with iron ions, in correlation with the X-ray results (d-spacing changes upon modification).
SEM-EDS analyses performed on the natural bearing and iron-enriched samples revealed the surface composition and elemental distribution and confirmed that iron is naturally present in the raw clay samples. Figure 3 presents, as an example, the elemental maps for the main elements (O, Si, Al), calcium, and iron in the raw clay sample, RC-0. The presence of calcium in higher amounts than magnesium, sodium, or potassium indicates that the clay sample is a Ca-montmorillonite clay. The impregnation route for synthesis increased the amount of iron about three times for Fe-RC sample and about four times for Fe-SC sample by comparison with the original raw clay sample (RC-0). The pillaring procedure increased the amount of iron about 20 times by comparison with the same sample (Table 1). The absence of magnesium and calcium in the iron-enriched samples (Table 1) confirmed that iron replaces the exchangeable cations in the clay structure. Figure 4 shows how the iron content increases as added into the SC-0 sample by impregnation (Fe-SC) and pillaring (Fe-PILC). EDS iron maps (not included here) did not acknowledge the presence of a separate phase for hematite in the “pillared” clay sample.

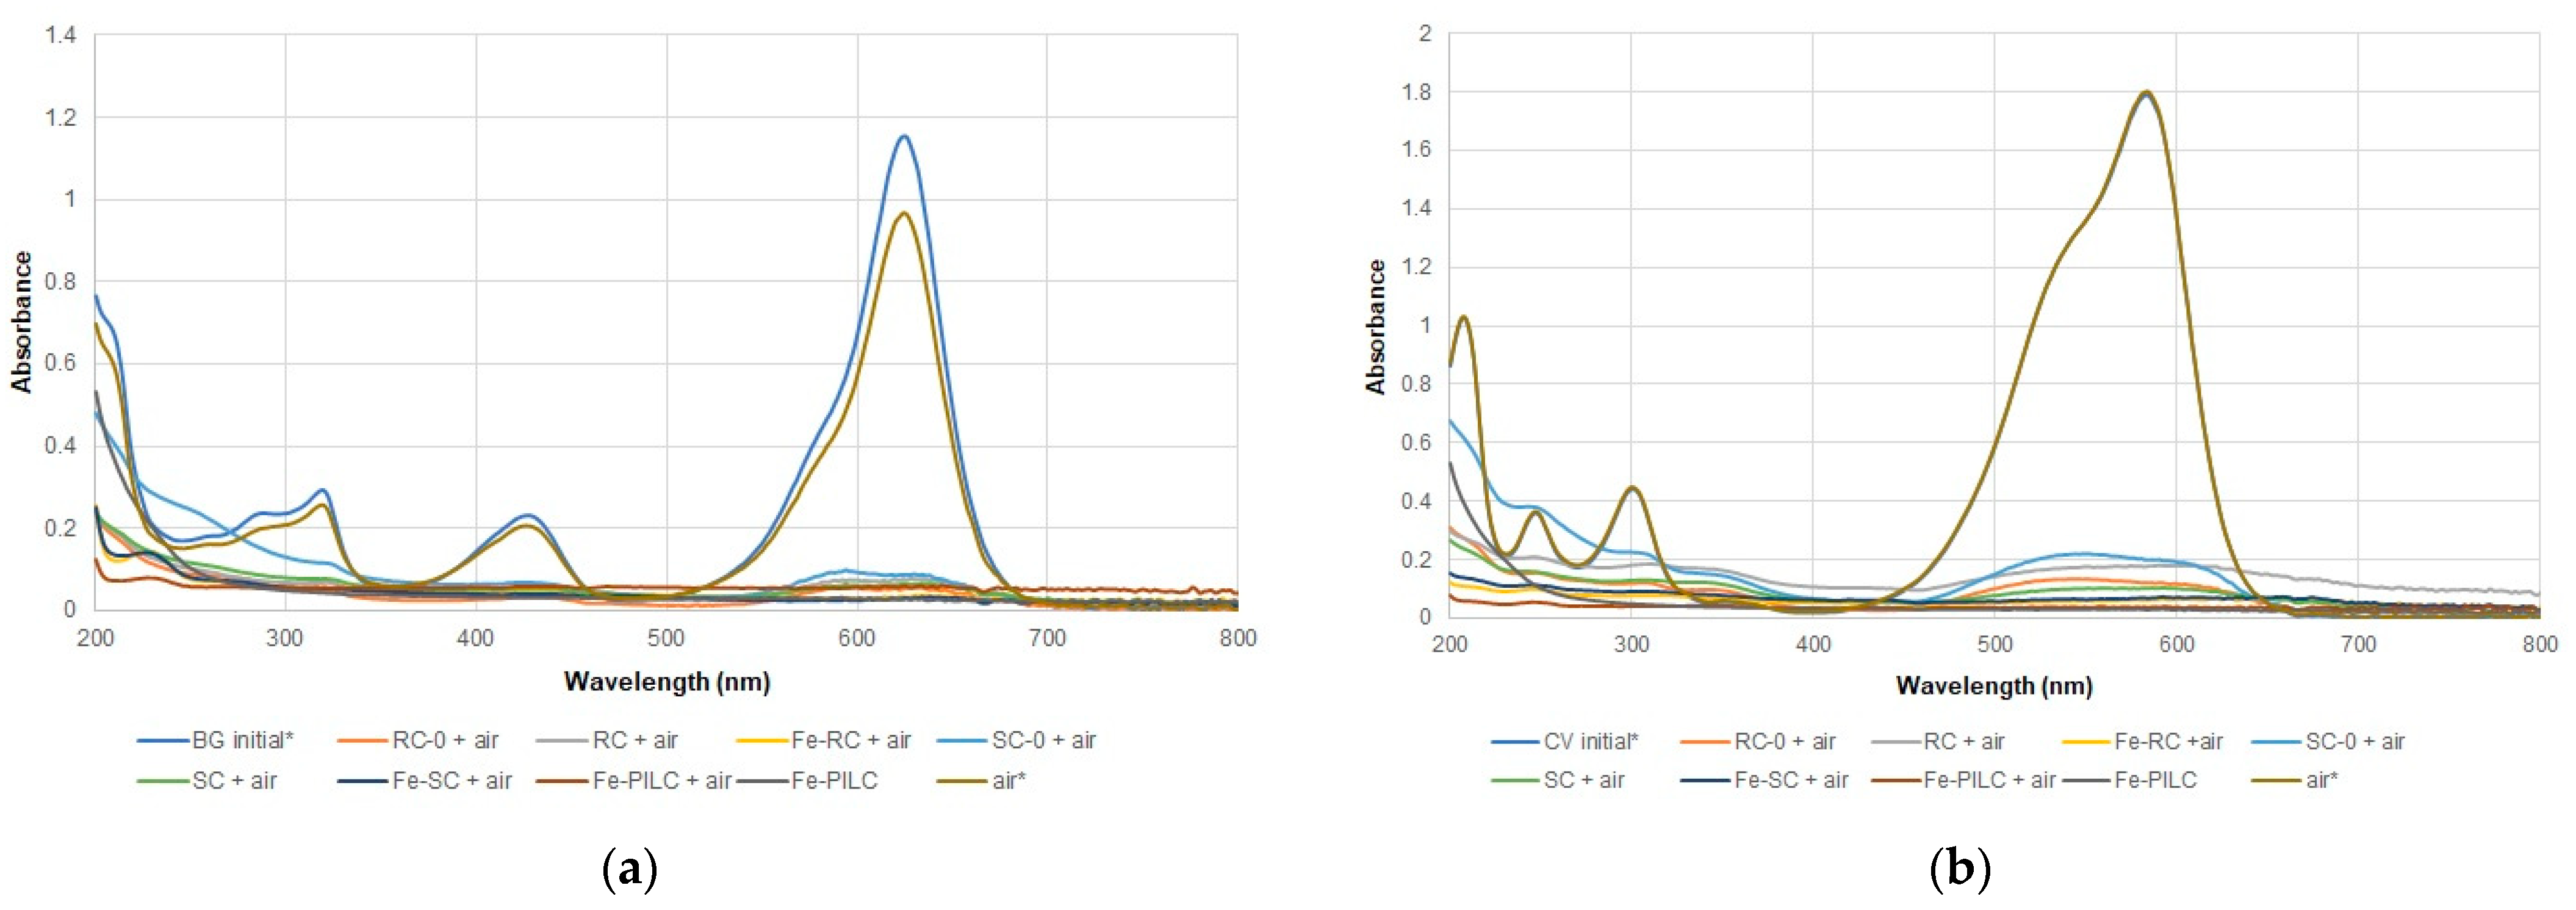
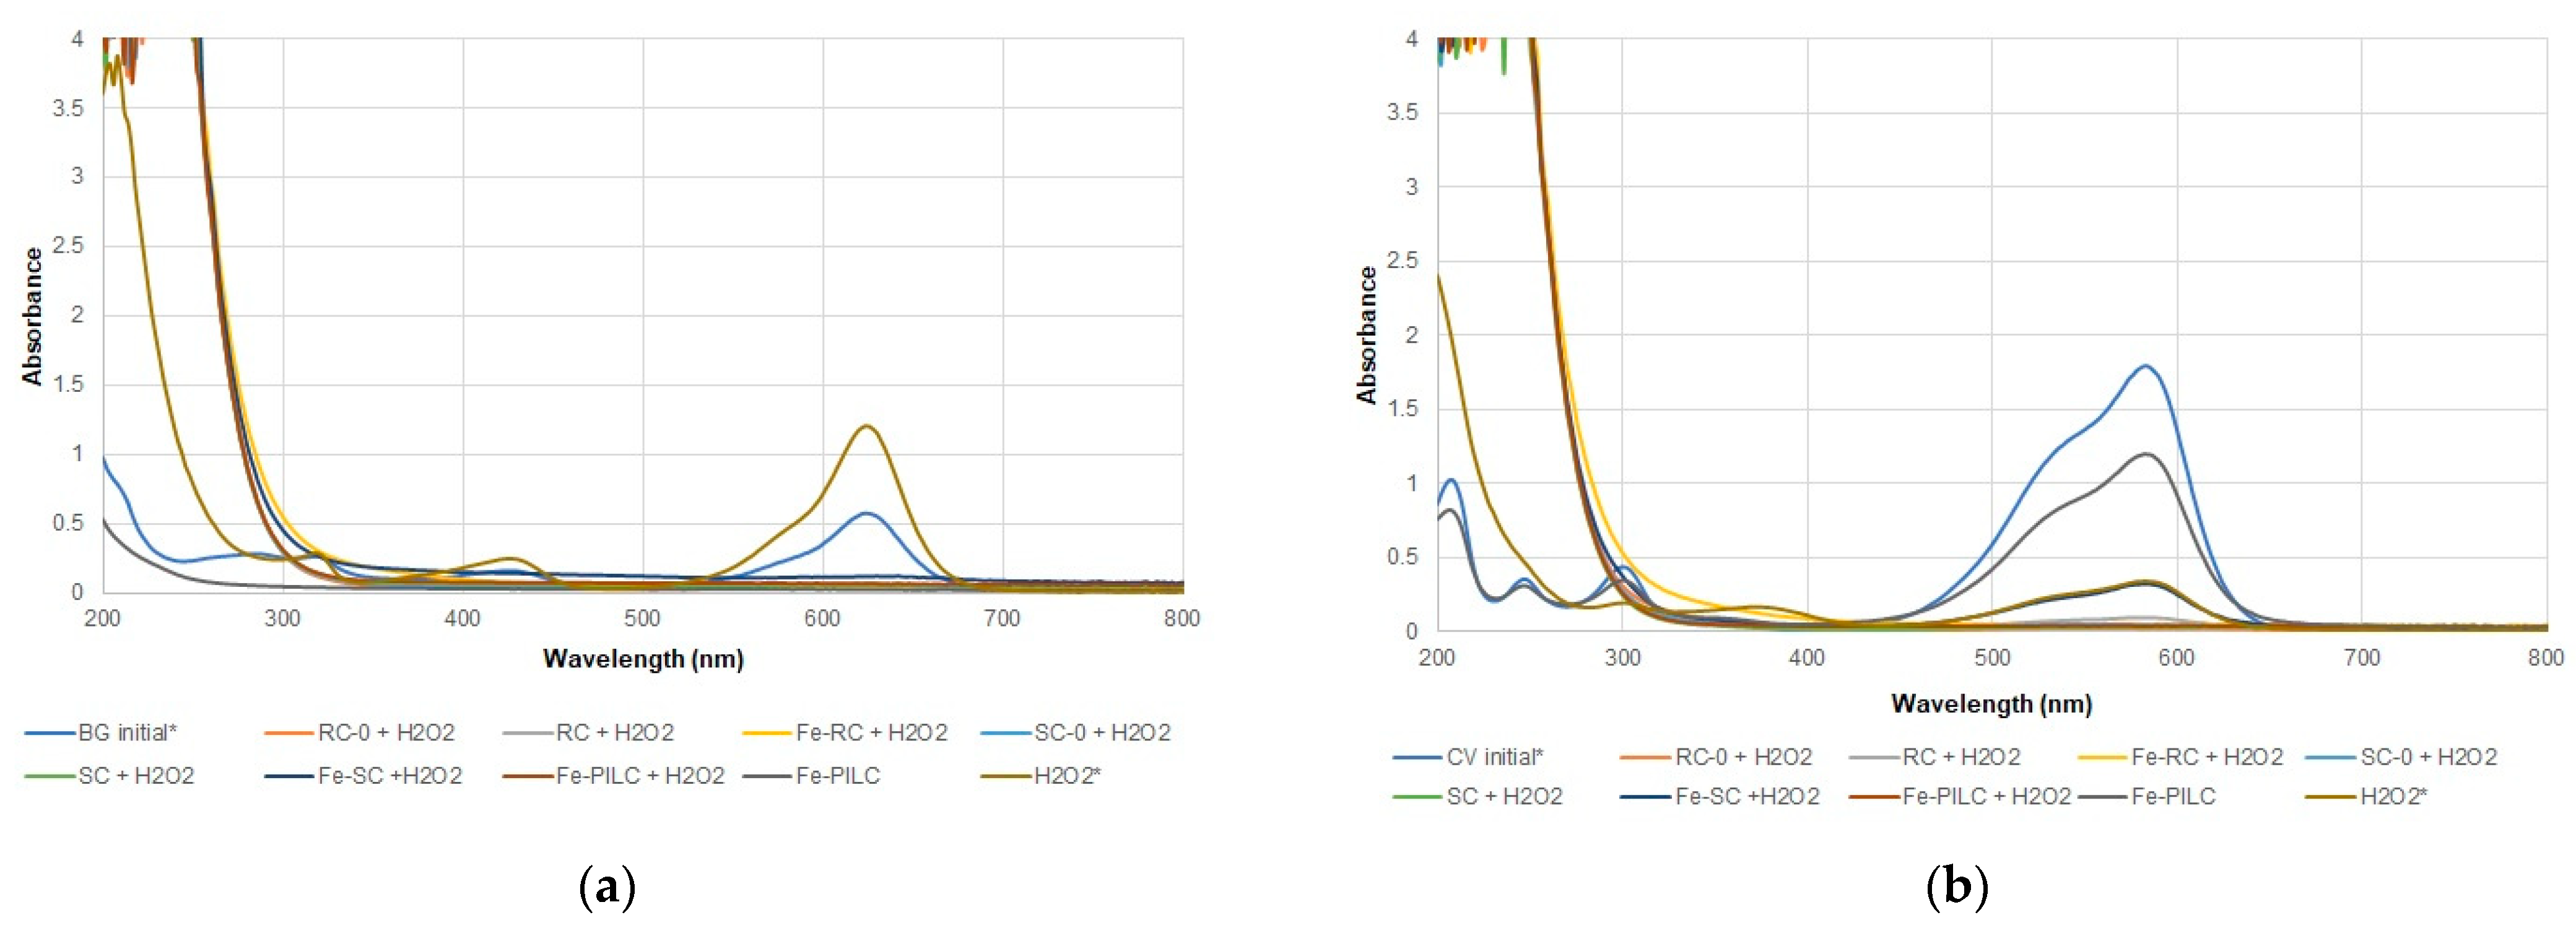
2.2. Catalytic Wet Air and Peroxide Oxidation

Natural bearing and iron-enriched clay samples were used for the removal of BG and CV as described in Section 3.2. The results obtained for CWAO are presented in Figure 5a for BG and Figure 5b for CV and Figure 6 for CWPO. In the case of BG, the UV-Vis spectra indicated that in the absence of the clay sample, with just air being present in the reaction system, only a slight decrease in the concentration of the dye was observed, corresponding to a 10 and 12.3% efficiency for E and ETOC, respectively (Table 2). For CV the same two spectra are superposed, as less than 1.5% removal was achieved. In the presence of only hydrogen peroxide both dyes are removed in a greater percentage, but the TOC efficiency values show that there is still a high amount of reaction intermediates present.
Adding the clay samples in the system considerably increased the process efficiency up to 99.9% for both dyes and oxidation agents. As efficiencies were calculated based on the dye concentration (initial and final), these values will not give a true measure of the oxidation process efficiency. Therefore, TOC efficiencies were also calculated (Table 2). These values are all lower, suggesting that although the dyes are not present in the system anymore (as indicated by the efficiency values), there are still organic molecules, reaction intermediates, that account for the carbon present in solution. The iron-enriched samples had lower TOC efficiencies, indicating that the presence of iron shifts the mechanism from adsorption to oxidation. This is also supported by the new peak that shows in the BG dye UV-Vis spectra (CWAO, Figure 5a), at around 250 nm, for all iron-enriched samples. When H2O2 was used as an oxidating agent, very intense peaks in the UV region were recorded (CWPO, Figure 6), most likely due to the presence of H2O2 itself and reaction intermediates. Between the two dyes used, CV is more difficult to destroy, with lower TOC efficiencies being recorded for all samples (Table 2).
Comparing the calculated efficiencies for natural bearing and iron-enriched samples, clear trends were identified, consistent with the separation (purification) and iron enriching procedures, and the processes were used as detailed below:
(1)
In the presence of either air or hydrogen peroxide, no significant differences were observed between the efficiencies calculated for BG and CV dyes and all tested clay samples.
(2)
TOC efficiencies exhibit very close values for BG in presence of air (CWAO), while for CV the following trendline was established: RC-0 < SC-0 < RC~SC < Fe-RC < Fe-SC < Fe-PILC.
(3)
In terms of TOC efficiency, the CWPO process shows similar trends for both dyes as follows: Fe-RC < Fe-SC < Fe-PILC < RC-0 < RC < SC-0~SC.
Overall, in the presence of air, E and ETOC efficiencies are extremely close, while in the presence of H2O2, iron-enriched samples show decreased ETOC efficiencies with up to about 30% (Fe-RC), indicating a different mechanism/process that is occurring.
The obtained results do not indicate that a synergistic effect is present as in other studies for similar systems [22,23].
RC samples, along with Fe-PILC samples, were also subjected to an adsorption vs. oxidation test performed at a higher dye concentration (250 mg/L). Calculated efficiency values are presented in Table 3. The same trend as for the 100 mg/L concentration (Table 2) was observed but at lower efficiencies for adsorption, except for RC-0 (BG and CV) and Fe-PILC (CV). In the case of CWPO process, efficiencies between 54.7 and 86.8% and 29.6 and 60.4% were calculated for E and ETOC, respectively. The highest efficiencies were recorded for the iron-enriched samples. Lower ETOC vs. E values are a clear indicator of oxidation taking place, with organic intermediates still present in the solution at the end of the reaction time. For all experiments lower efficiencies were recorded for CV dye, showing its higher stability towards oxidation as for the previous set of tests.

2.3. Iron Leakage

Iron content was measured at the end of the reaction (3 h) for both processes. For natural bearing samples, values were under the limit of detection (LOD = 0.023 ppm) of the ICP-OES instrument used. For Fe-RC and Fe-SC samples, concentrations between 0.587 and 4.280 ppm were measured, while for the Fe-PILC sample, concentrations between 0.054 and 0.111 ppm were determined, indicating a higher stability of the iron in the clay structure.

3. Materials and Methods

3.1. Materials

Raw clay sample was collected from a deposit located in Oraşul Nou, Satu Mare County, Romania and used in raw and treated forms (size-fractionated, iron impregnated, and Fe-pillared).
FeCl3⋅6H2O (Fisher Scientific, Hampton, NH, USA) was used as iron source for clay enrichment. NaOH (Fisher Chemicals) was used as a pillaring agent. AgNO3 (Fisher Scientific) 0.01 M solution was used to verify the washing process.
Brilliant Green, C27H34N2O4S, 482.63 g/mol, BG (Aldrich, St. Louis, MO, USA), λmax, BG = 625 nm, and Crystal Violet, C25H30N3Cl, 407.98 g/mol, CV (Acros Organics), λmax, CV = 584 nm, were used as model dye molecules for the oxidation processes. A stock solution of 1000 mg/L was used to prepare the desired concentration (100 and 250 mg/L) solutions. H2O2 30% (Fisher Scientific) and dried, filtered air were used as oxidation agents. All reagents were of analytical purity and used as received.

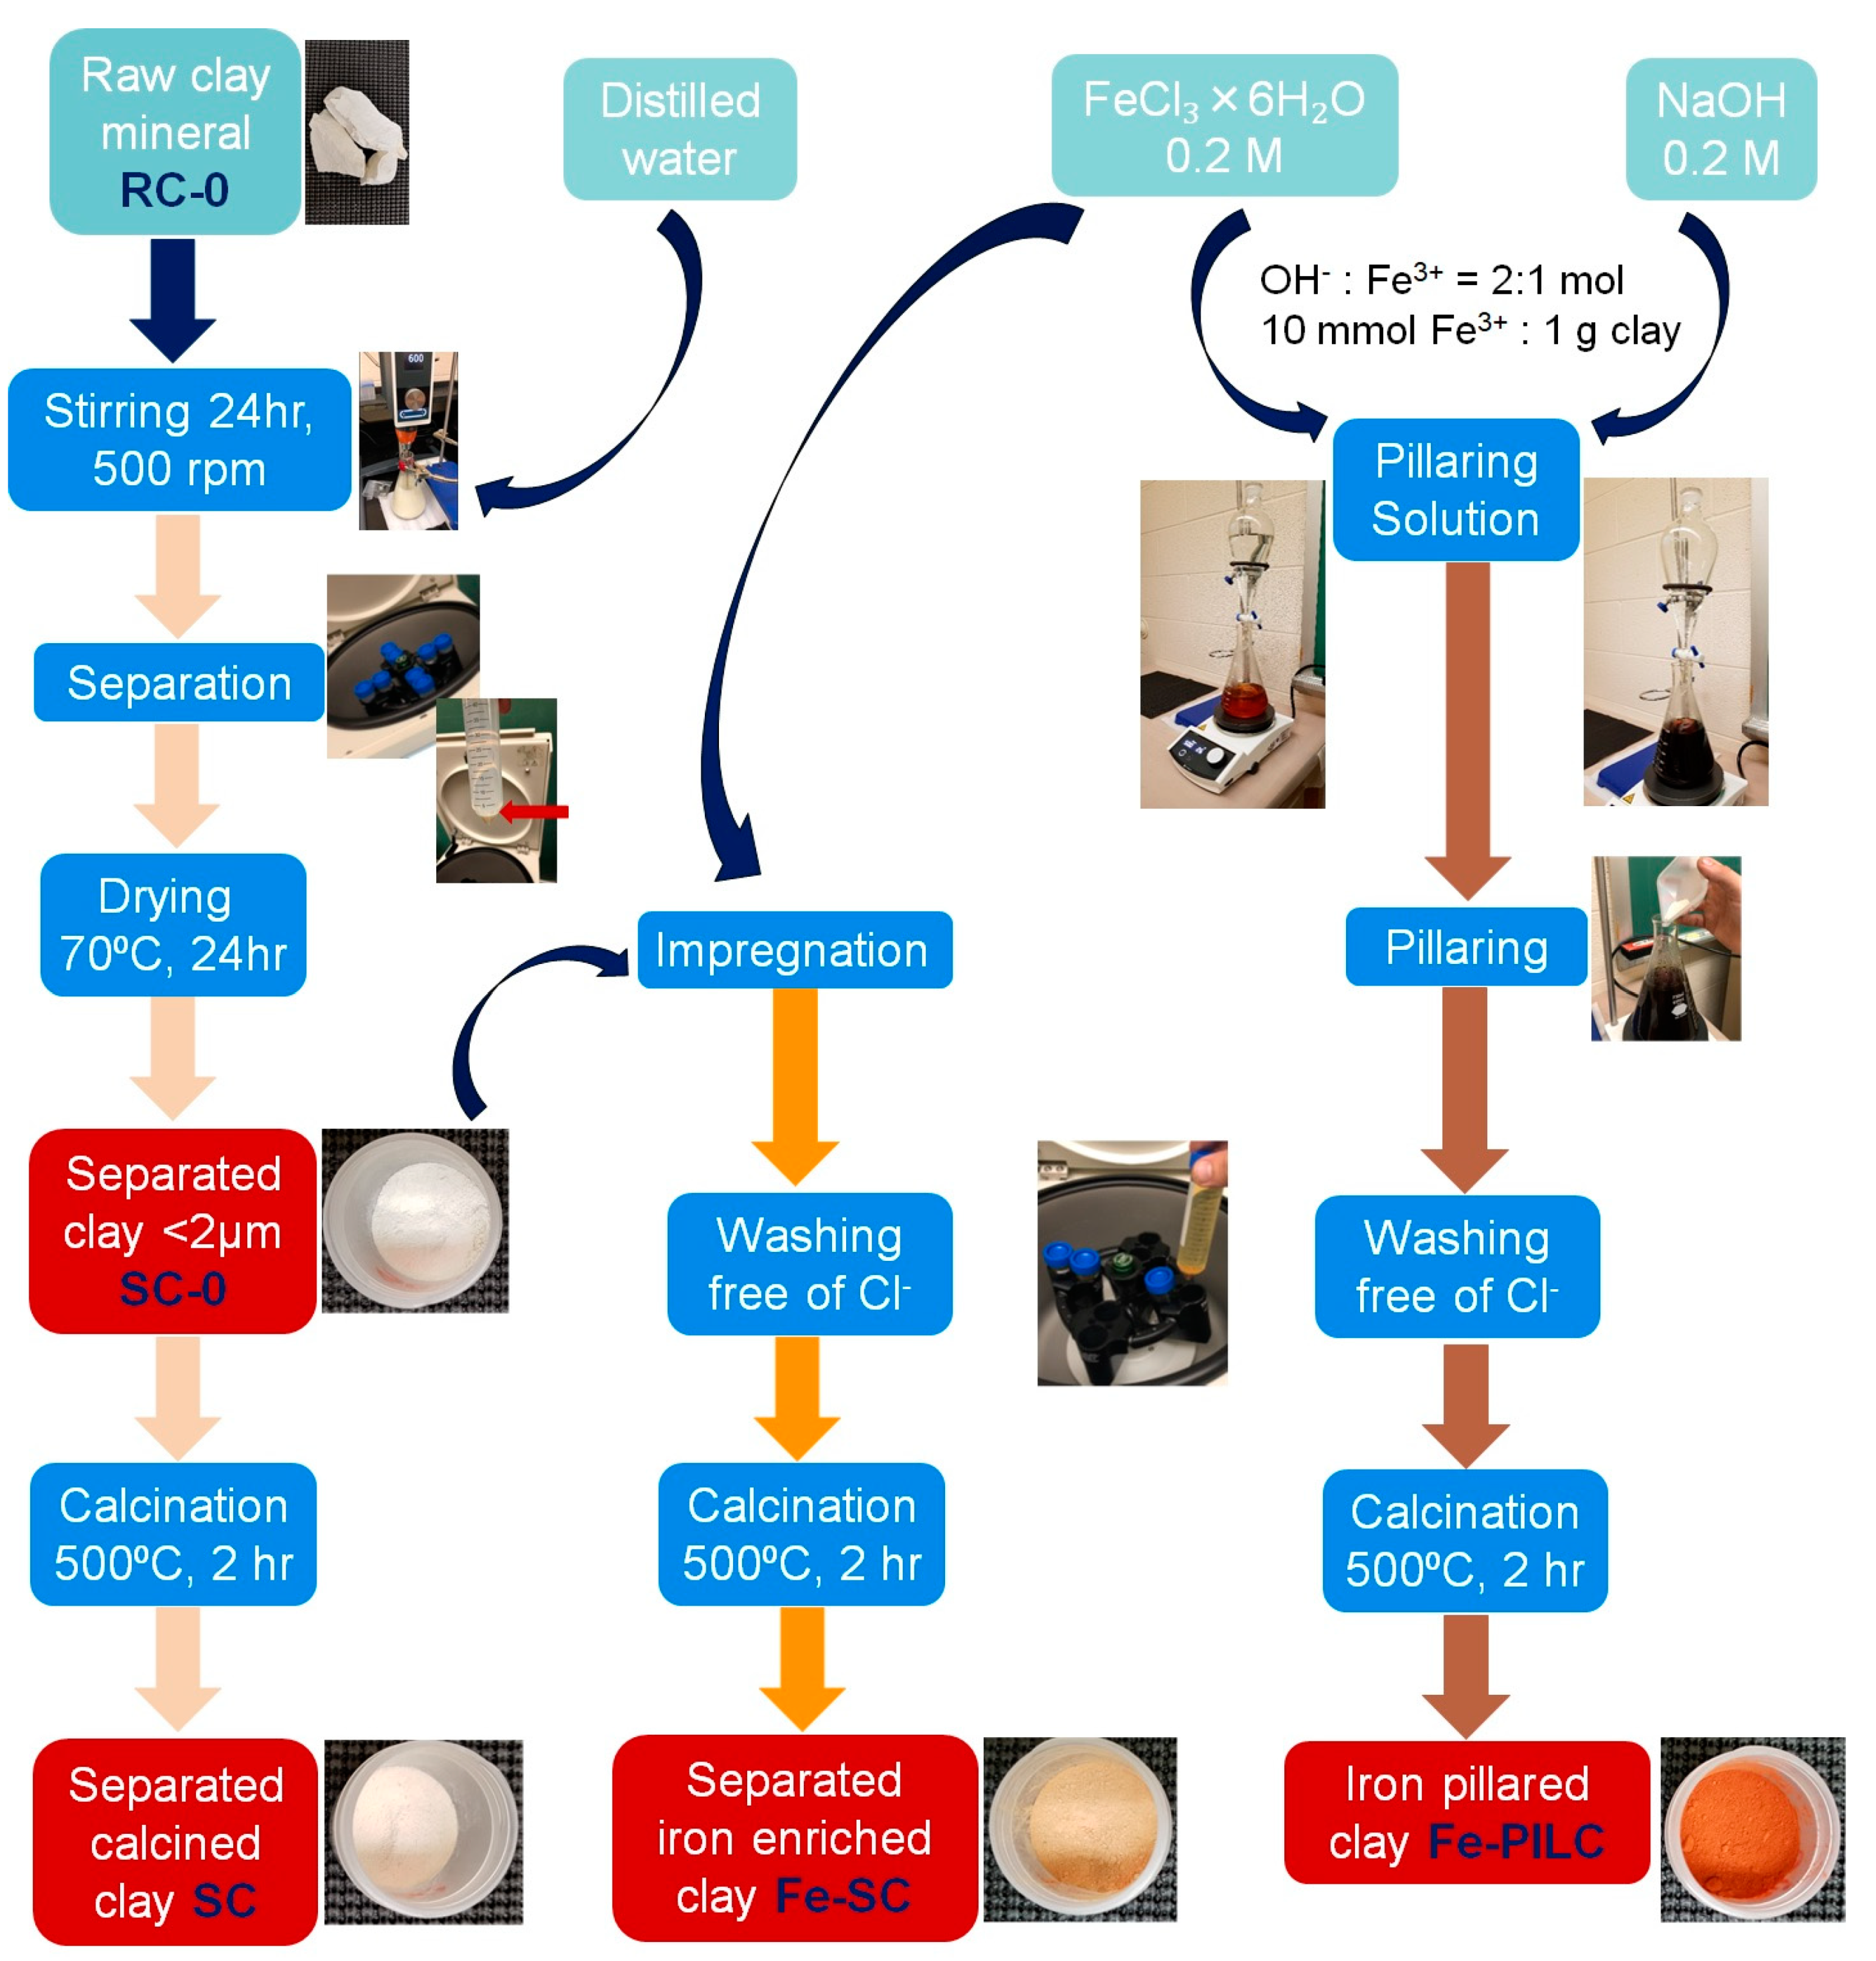
3.2. Clay Samples Preparation

The main steps involved in the clay samples preparation are synthesized in Figure 7.
Raw clay sample was first subjected to a grinding process, followed by a size separation using a 0.2 mm sieve to obtain the RC-0 sample. Clay fraction of <0.2 μm was obtained by producing a raw clay suspension (solid:liquid ratio = 1:20) under stirring for 24 h. The suspension was then separated by centrifugation at 600 rpm and the obtained supernatant was centrifuged again, this time at 4500 rpm. The obtained solid sample was dried at 70 °C for 24 h to get the SC-0 sample [24,25,26]. RC and SC samples were obtained by calcination of RC-0 and SC-0 samples, respectively, at 500 °C for 2 h with a heating rate of 3 °C/min.
Iron enriched clay samples were prepared using two techniques: impregnation and pillaring (powder method).
RC-0 and SC-0 samples were both subjected to impregnation, realized for 24 h under stirring at room temperature using a FeCl3⋅6H2O 0.2 M solution (10 mmol Fe3+/g clay). The solid was recovered by centrifugation at 4500 rpm, washed until Cl- free (AgNO3 0.01 M solution), dried at 70 °C for 24 h, and calcined at 500 °C for 2 h with a heating rate of 3 °C/min. Fe-RC and Fe-SC samples were thus obtained.
The preparation of Fe-pillared clay was carried out using the dry pillaring method (clay was added as solid to the pillaring solution) [27]. A 0.2 M NaOH solution was added dropwise into a 0.2 M FeCl3 solution at room temperature under vigorously stirring until the molar ratio of OH-/Fe3+ = 2 was reached. The pillaring solution thus created was continuously stirred at room temperature for another 24 h. SC-0 clay sample previously prepared was added into the pillaring solution to reach a Fe3+/clay ratio of 10 mmol/g. The obtained suspension was continuously stirred for another 24 h at room temperature. The solid was recovered by centrifugation at 4500 rpm and washed until Cl- free, dried at 70 °C, and finally calcined at 500 °C in the same conditions as the other samples [24,28]. The obtained sample is the Fe-PILC sample.
Seven clay samples were therefore prepared and will be tested in the catalytic wet oxidation of BG and CV as follows: raw clay (RC-0), calcined raw clay (RC), iron impregnated raw clay (Fe-RC), separated clay (SC-0), calcined separated clay (SC), iron impregnated separated clay (Fe-SC), and iron pillared clay (Fe-PILC).

3.3. Clay Samples Characterization

X-ray diffraction data were collected with a Rigaku-Americas Miniflex II Powder Diffractometer (Rigaku Americas Corporation, The Woodlands, TX, USA) using monochromated CuKα radiation. All diffractograms were recorded from 4–75° in 2θ. The analytic conditions were 30 kV, 15 mA, with a step size of 0.005° and a step time of 6 s. This resulted in a 25 h scan for each sample. All samples were prepared using back-loading cavity mounts.
Fourier Transform Infrared Spectroscopy (FTIR) analyses were performed on KBr pellets (2 mg sample in 200 mg KBr). Spectra were obtained using a JASCO 4100 FTIR spectrometer (JASCO Corporation, Tokyo, Japan), operating between 400–4000 cm−1 with 2 cm−1 resolution.
Scanning electron microscopy-energy dispersive X-ray spectroscopy (SEM-EDS) analyses were performed using a Thermo Scientific Prisma E SEM (Thermo Scientific, Waltham, MA, USA) equipped with a tungsten filament, a secondary electron detector, an ultra-sensitive, lens-mounted directional backscatter electron detector (DBS), and a ThermoScientific Pathfinder EDS UltraDry 60 M. Clay samples, as fine powders, were deposited on carbon tape and coated with a 4 nm gold-palladium layer.

3.4. Catalytic Wet Oxidation

Catalytic wet oxidation experiments were conducted using 0.5 g clay sample, 25 mL of 100 mg/L dye solution, at 25 ± 0.1 °C and 50 rpm in a precision shaking water bath, and ambient pressure. Air at 300 mL air/min (CWAO) or 0.5 mL H2O2 (CWPO) were used as oxidation agents. The oxidation conditions were maintained for 3 h. Experiments were also realized without a clay sample present (oxidating agent only) and without an oxidating agent (clay sample only).
The evolution of dye oxidation process was evaluated by means of efficiency (E and ETOC, %), calculated as dye concentration and total organic carbon (TOC) values, obtained for the initial (Ci) and final (Cf) solutions. Dye concentrations in solutions were determined using a UV-Vis, Genesys 50 spectrophotometer (Thermo Scientific, Waltham, MA, USA), a 2–10 mg/L calibration curve, and the maximum UV-Vis absorption wavelengths of the two dyes. Absorption spectra of reaction intermediates were collected in 200–1000 nm range (200–800 nm domain was used in figures to preserve the clarity of the images) using the same spectrophotometer. TOC analyses were performed using a Shimadzu Corporation TOC-L Analyzer (Shimadzu Scientific Instruments, Columbia, MD, USA). Prior to analyses, the solution was centrifuged for 20 min at 4500 rpm.
Iron concentration in solution at the end of the oxidation processes was measured using an inductively coupled plasma optical emission spectrometer (ICP-OES) Perkin Elmer Optical 2100DV (Perkin Elmer Inc., Waltham, MA, USA). Prior to analysis, samples were acidified with HNO3 1:1 solution and filtered using 0.45 μm PET syringe filters.

4. Conclusions

Several natural bearing and iron-enriched samples were prepared and characterized using XRD, FTIR, and SED-EDS. Results showed that iron is present in both natural and in increased quantities in the modified, iron-enriched, samples. CWAO and CWPO results indicated that there were no significant differences between the efficiencies obtained for natural bearing and iron-enriched samples. As the dye concentration increased to 250 mg/L slightly lower efficiencies were obtained for adsorption, while CWPO efficiencies decreased more, with up to about 40% in the case of Fe-RC (ETOC).
Further investigations will consider an in-depth X-ray study of the iron pillaring process as well as further investigation of the CWAO and CWPO processes for iron-enriched samples.

Author Contributions

S.A.M.—investigation (design of synthesis process; catalysts synthesis; design, execution, and data analysis of oxidation experiments; SEM-EDS analysis execution, analysis), manuscript writing (except FTIR and XRD), managed the study; D.L.H.III—catalysts synthesis; R.S.—FTIR analysis and writing; C.H.L.—XRD data analysis and writing; E.A.—XRD execution; and L.E.O.—FTIR execution. All authors have read and agreed to the published version of the manuscript.

Funding

This research received no external funding.

Acknowledgments

The authors would like to acknowledge NSF, SEM MRI Award (Number 1827176), which made possible the SEM-EDS analysis of the catalysts samples and to thank Nathan McElroy and graduate student Ann Fagbuyi, Madia Department of Chemistry, Biochemistry, Physics and Engineering, Indiana University of Pennsylvania, for their help with ICP-OES analyses.

Conflicts of Interest

The authors declare no conflict of interest.

References

  1. Mukherjee, S. The Science of Clays; Springer: Dordrecht, Germany, 2013. [Google Scholar]
  2. Kausar, A.; Iqbal, M.; Javed, A.; Aftab, K.; Nazli, Z.; Bhatti, H.N.; Nouren, S. Dyes adsorption using clay and modified clay: A review. J. Mol. Liq. 2018, 256, 395–407. [Google Scholar] [CrossRef]
  3. Ngulube, T.; Gumbo, J.R.; Masindi, V.; Maity, A. An update on synthetic dyes adsorption onto clay based minerals: A state-of-art review. J. Environ. Manag. 2017, 191, 35–57. [Google Scholar] [CrossRef] [PubMed]
  4. Garrido-Ramírez, E.G.; Theng, B.K.G.; Mora, M.L. Clays and oxide minerals as catalysts and nanocatalysts in Fenton-like reactions—A review. Appl. Clay Sci. 2010, 47, 182–192. [Google Scholar] [CrossRef]
  5. Perathoner, S.; Centi, G. Catalytic Wastewater Treatment Using Pillared Clays. In Pillared Clays and Related Catalysts; Gil, A., Korili, S., Trujillano, R., Vicente, M., Eds.; Springer: New York, NY, USA, 2010; pp. 167–200. [Google Scholar]
  6. Adeyemo, A.A.; Adeoye, I.O.; Bello, O.S. Adsorption of dyes using different types of clay: A review. Appl. Water Sci. 2017, 7, 543–568. [Google Scholar] [CrossRef] [Green Version]
  7. Shahadat, M.; Yasmin, M.; Kumar, S.; Ismail, S.; Ali, S.W.; Ahammad, S.Z. Clay-Based Adsorbents for the Analysis of Dye Pollutants. In Applied Water Science Volume 1: Fundamentals and Applications; Inamuddin, M.I.A., Boddula, R., Rangreez, T.A., Eds.; Scrivener Publishing LLC: Beverly, MA, USA, 2021; pp. 163–198. [Google Scholar]
  8. Kurian, M. Advanced oxidation processes and nanomaterials—A review. Clean. Eng. Technol. 2021, 2, 100090. [Google Scholar] [CrossRef]
  9. Baloyi, J.; Ntho, T.; Moma, J. Synthesis and application of pillared clay heterogeneous catalysts for wastewater treatment: A review. RSC Adv. 2018, 8, 5197–5211. [Google Scholar] [CrossRef] [Green Version]
  10. Ahmad, A.; Mohd-Setapar, S.H.; Chuong, C.S.; Khatoon, A.; Wani, W.A.; Kumar, R.; Rafatullah, M. Recent advances in new generation dye removal technologies: Novel search for approaches to reprocess wastewater. RSC Adv. 2015, 5, 30801–30818. [Google Scholar] [CrossRef]
  11. Javaid, R.; Qazi, U.Y. Catalytic Oxidation Process for the Degradation of Synthetic Dyes: An Overview. Int. J. Environ. Res. Public Health 2019, 16, 2066. [Google Scholar] [CrossRef] [Green Version]
  12. Teng, T.T.; Low, L.W. Removal of Dyes and Pigments from Industrial Effluents. In Advances in Water Treatment and Pollution Prevention; Sharma, S.K., Sanghi, R., Eds.; Springer Science + Business Media Dordrecht: Berlin, Germany, 2012; pp. 65–93. [Google Scholar]
  13. Azimi, S.C.; Shirini, F.; Pendashteh, A.R. Advanced Oxidation Process as a Green technology for Dyes Removal from Wastewater: A Review. Iran. J. Chem. Chem. Eng. 2021, 40, 1467–1489. [Google Scholar]
  14. Idrissi, M.; Miyah, Y.; Benjelloun, Y.; Chaouch, M. Degradation of crystal violet by heterogeneous Fenton-like reaction using Fe/Clay catalyst with H2O2. J. Mater. Environ. Sci. 2016, 7, 50–58. [Google Scholar]
  15. Maicaneanu, A.; Bedelean, H.; Burcă, S.; Stanca, M. Heavy metal ions removal from model wastewaters using Orasul Nou (Transilvania, Romania) bentonite sample. Studia Univ. Babes-Bolyai Chem. 2009, 54, 127–140. [Google Scholar]
  16. Govea, L.V.; Steinfink, H. Thermal Stability and Magnetic Properties of Fe-Polyoxocation Intercalated Montmorillonite. Chem. Mater. 1997, 9, 849–856. [Google Scholar] [CrossRef]
  17. Viani, A.; Gualtieri, A.F.; Artioli, G. The nature of disorder in montmorillonite by simulation of X-ray patterns. Am. Mineral. 2002, 87, 966–975. [Google Scholar] [CrossRef]
  18. Plesa Chicinas, R.; Bedelean, H.; Stefan, R.; Maicaneanu, A. Ability of a montmorillonitic clay to interact with cationic and anionic dyes in aqueous solutions. J. Mol. Struct. 2018, 1154, 187. [Google Scholar] [CrossRef]
  19. Madejová, J.; Komadel, P. Baseline studies of the clay minerals society source clays: Infrared methods. Clays Clay Miner. 2001, 49, 410–432. [Google Scholar] [CrossRef]
  20. Madejová, J. FTIR techniques in clay mineral studies. Vib. Spectrosc. 2003, 31, 1–10. [Google Scholar] [CrossRef]
  21. Hrachová, J.; Madejová, J.; Billik, P.; Komadel, P.; Fajnor, V.Š. Dry grinding of Ca and octadecyltrimethylammonium montmorillonite. J. Colloid Interface Sci. 2007, 316, 589–595. [Google Scholar] [CrossRef]
  22. Guimarães, G.; Teixeira, A.R.; Lucas, M.S.; Peres, J.A. Effect of Zr Impregnation on Clay-Based Materials for H2O2-Assisted PhotocatalyticWet Oxidation of Winery Wastewater. Water 2020, 12, 3387–3392. [Google Scholar] [CrossRef]
  23. Zhao, Y.; Kang, S.; Qin, L.; Wang, W.; Zhang, T.; Song, S.; Komarneni, S. Self-assembled gels of Fe-chitosan/montmorillonite nanosheets: Dye degradation by the synergistic effect of adsorption and photo-Fenton reaction. Chem. Eng. J. 2020, 379, 122322. [Google Scholar] [CrossRef]
  24. Plesa Chicinas, R.; Tanase, A.; Bedelean, H.; Maicaneanu, A. Characterization of Romanian Bentonitic Clays for the Removal of Dyes from Wastewater. Anal. Lett. 2016, 49, 2686. [Google Scholar] [CrossRef]
  25. Arroyo, L.J.; Li, H.; Teppen, B.J.; Boyd, S.A. A Simple Method for Partial Purification of Reference Clays. Clay Clay Miner. 2005, 53, 511–519. [Google Scholar] [CrossRef]
  26. Costanzo, P.M. Baseline studies of the clay minerals society source clays: Introduction. Clay Clay Miner. 2001, 49, 372–373. [Google Scholar] [CrossRef]
  27. Barrault, J.; Bouchoule, C.; Echachoui, K.; Frini-Srasra, N.; Trabelsi, M.; Bergaya, F. Catalytic wet peroxide oxidation (CWPO) of phenol over mixed (Al-Cu)-pillared clays. Appl. Catal. B Environ. 1998, 15, 269–274. [Google Scholar] [CrossRef]
  28. Gu, L.; Xu, J.; Lv, L.; Liu, B.; Zhang, H.; Yu, X.; Luo, Z. Dissolved organic nitrogen (DON) adsorption by using Al-pillared bentonite. Desalination 2011, 269, 206–213. [Google Scholar] [CrossRef]
Figure 1. Comparative XRD patterns of (a) RC-0 and SC-0; (b) RC-0, RC, and Fe-RC; (c) SC-0, SC, and Fe-SC clay samples. Legend: mnt = montmorillonite; crs = cristobalite.
Catalysts 12 00652 g001
Figure 2. FTIR spectra of (a) RC-0, RC, Fe-RC; (b) SC-0, SC, Fe-SC, and Fe-PILC clay samples.
Catalysts 12 00652 g002
Figure 3. SEM-EDS maps of the oxygen, aluminum, silicon, calcium, and iron in the RC-0 sample as powder (1000 × magnification).
Catalysts 12 00652 g003
Figure 4. SEM-EDS spectra of the SC-0, Fe-SC, and Fe-PILC clay samples.
Catalysts 12 00652 g004aCatalysts 12 00652 g004b
Figure 5. Absorption UV-Vis spectra changes at the end of CWAO process for BG (a) and CV (b)—100 mg/L initial concentration (* indicates a dilution coefficient of 10).
Catalysts 12 00652 g005
Figure 6. Absorption UV-Vis spectra changes at the end of CWPO process for BG (a) and CV (b)—100 mg/L initial concentration (* indicates a dilution coefficient of 10).
Catalysts 12 00652 g006
Figure 7. Flow diagram of the main steps involved in the synthesis of iron enriched clay samples.
Catalysts 12 00652 g007
Table 1. Average surface elemental composition of the clay samples obtained using SEM-EDS analysis (% values are averaged from five analyzed spots on the sample surface).
w% #NaKMgCaAlSiFeTiOC
RC-0<0.10.470.200.455.0524.70.74<0.149.416.7
RC-<0.10.210.475.6428.00.76<0.151.710.2
Fe-RC----5.1628.02.32-48.616.0
SC-0--0.380.748.1228.41.42-50.110.8
SC--0.280.947.7829.41.58-48.211.8
Fe-SC----7.1226.03.10-48.715.0
Fe-PILC----6.6822.915.1-45.110.2
# difference to 100% is represented by gold and palladium used for coating.
Table 2. Efficiency values for CWAO and CWPO process (100 mg/L dye concentration).
SampleOxidating AgentBrilliant GreenCrystal Violet
E, (%)ETOC, (%)E, (%)ETOC, (%)
RC-0Air98.896.399.753.1
H2O298.989.899.982.5
RCAir98.698.399.472.4
H2O298.895.399.991.4
Fe-RCAir99.098.199.980.8
H2O299.066.599.972.7
SC-0Air98.598.199.360.7
H2O298.996.099.987.9
SCAir98.798.999.871.4
H2O298.895.899.992.9
Fe-SCAir99.098.799.982.9
H2O298.478.498.679.0
Fe-PILCAir98.898.599.988.5
H2O298.987.999.989.5
-Air10.012.31.051.41
-H2O294.554.260.00.490
Fe-PILC-99.095.893.587.3
Table 3. Efficiency values for CWPO and adsorption on selected samples (250 mg/L dye concentration).
SampleProcessBrilliant GreenCrystal Violet
E, (%)ETOC, (%)E, (%)ETOC, (%)
RC-0Adsorption98.9-99.9-
CWPO64.859.786.857.0
RCAdsorption81.4-76.2-
CWPO54.747.074.048.0
Fe-RCAdsorption85.4-58.8-
CWPO86.529.683.460.4
Fe-PILCAdsorption99.5-71.1-
CWPO75.240.360.045.4
Publisher’s Note: MDPI stays neutral with regard to jurisdictional claims in published maps and institutional affiliations.

