Article

Modification of the Acidic and Textural Properties of HY Zeolite by AHFS Treatment and Its Coke Formation Performance in the Catalytic Cracking Reaction of N-Butene

1
State Key Laboratory of Heavy Oil Processing, China University of Petroleum (Beijing), Beijing 102249, China
2
Petrochemical Research Insititue of Petrochina, Beijing 102249, China
*
Author to whom correspondence should be addressed.
Catalysts 2022, 12(6), 640; https://doi.org/10.3390/catal12060640
Submission received: 5 May 2022 / Revised: 27 May 2022 / Accepted: 1 June 2022 / Published: 11 June 2022
(This article belongs to the Topic Catalysis: Homogeneous and Heterogeneous)

Abstract

:
Coke formation on n-butene cracking catalyst is the main reason for the reducing of its lifetime. To study the effects of acidity and textural properties on the coke formation process, a series of HY zeolite-type catalysts were prepared by ammonium hexafluorosilicate treatment (AHFS). NH3-TPD and Py-IR-TPD were used to systematically study the change law of zeolite acidity. It was found that with the increase of AHFS concentration, the acid density decreased, whereas the ratio of Brønsted acid to Lewis acid first increased and then decreased. Meanwhile, the percentage of Brønsted acid inside the supper cages increased and the strength of Brønsted acid increased with the degree of dealumination. Combined with in situ IR study on coke formation, the relationship between coking and acid site was revealed. It was found that the rate of coke formation on zeolites was affected by acid density, which is the rate of coke formation decreased with the decline of acid density. When the acid density remains at the same level, it was the acid strength that determined the coke formation rate—the stronger the acid strength, the faster the coke formation rate.

1. Introduction

Propene, as one of the most important chemicals, its downstream products such as polypropylene and acrylonitrile play a crucial role in industry and the economy [1,2,3,4]. With the increasing demand for propylene, how to further improve the yield and production efficiency of propylene has become a current research hotspot [5,6]. In recent years, several new techniques have been developed to produce propene, including catalytic cracking of heavy oil and light olefins, olefin disproportionation, naphtha catalytic cracking, propane dehydrogenation, methanol to olefins, etc. [7,8]. Among the above techniques, the catalytic cracking technique has drawn great attention because of its low reaction temperature, high propene yield, and controllable products distribution [9].
The key problem of butene catalytic cracking is the proper design of the catalyst. Zeolite is the most widely used type of catalyst. However, in the reaction process, its fast deactivation remains an urgent problem. Therefore, research on the catalyst deactivation mechanism of light olefins catalytic cracking and on developing new catalysts with higher performance and stability has drawn great interest from researchers [10,11,12,13]. Coking is the most important and common reason for catalyst deactivation [14]. With zeolites as the catalyst, during the reaction process, the formed coke may directly cover the acidic active sites of zeolites, and it will also cause the blockage of channels. In the end, the internal and external diffusion of the catalytic reaction is forced to stop, and the catalyst was deactivated.
Tang et al. [15] found that, after 50 h of reaction over ZSM-5 zeolite, the conversion was reduced from 85% to less than 60%. It was mainly caused by the coking on acidic sites. Wang et al. [16] also found the conversion on ZSM-5 reduced from 80% to 50% after 48 h of reaction. Hydrogen transfer and aromatization reactions were obvious on the strong acid sites on ZSM-5, and it helped the formation of coke [17]. Zhu et al. [18] claimed that during the butene cracking, the catalyst of HMCM-22 deactivated quickly in the first hour, and in this time, the distribution of the product varies a lot. The reaction condition can greatly influence the performance of MCM-22 zeolite. Liu et al. [19] introduced mesopores in microporous zeolites, which gifted the catalyst higher pore volume and better tolerance of coking. To some degree, it resolved the problem of diffusion and weak coke tolerance of microporous material.
Although a great amount of research has been conducted on the coking of zeolites, which focuses on the resistance of coke and analyzes the structure of coke and the influence of coke on acidic properties and activity of zeolites, the synergy effect of pore structure and acidic properties of Y zeolite on coke formation is still unclear. Study of this synergy effect is of great importance to guide the synthesis of catalysts with high resistance of coke.
Based on the above-mentioned problems, in this paper, four kinds of Y zeolite with different Si/Al ratios are synthesized by post-treatment of ammonium hexafluorosilicate (AHFS) [20,21,22]. XRD, NH3-TPD, Py-IR, and N2 adsorption–desorption were used to characterize their textural and acidic properties. In situ IR technology was used to study the coking process during 1-butene catalytic cracking on the four kinds of Y zeolite. Based on the analysis, the active sites for coke formation were clarified, and by associating the coking process and textural and acidic properties, the rate of coke formation was calculated and the structure–activity relationship between the textural properties and coke resistance was investigated. The synergy effect of multifactors affecting the coke formation on zeolite was revealed, which can be utilized to guide the post-treatment of catalysts.

2. Results and Discussion

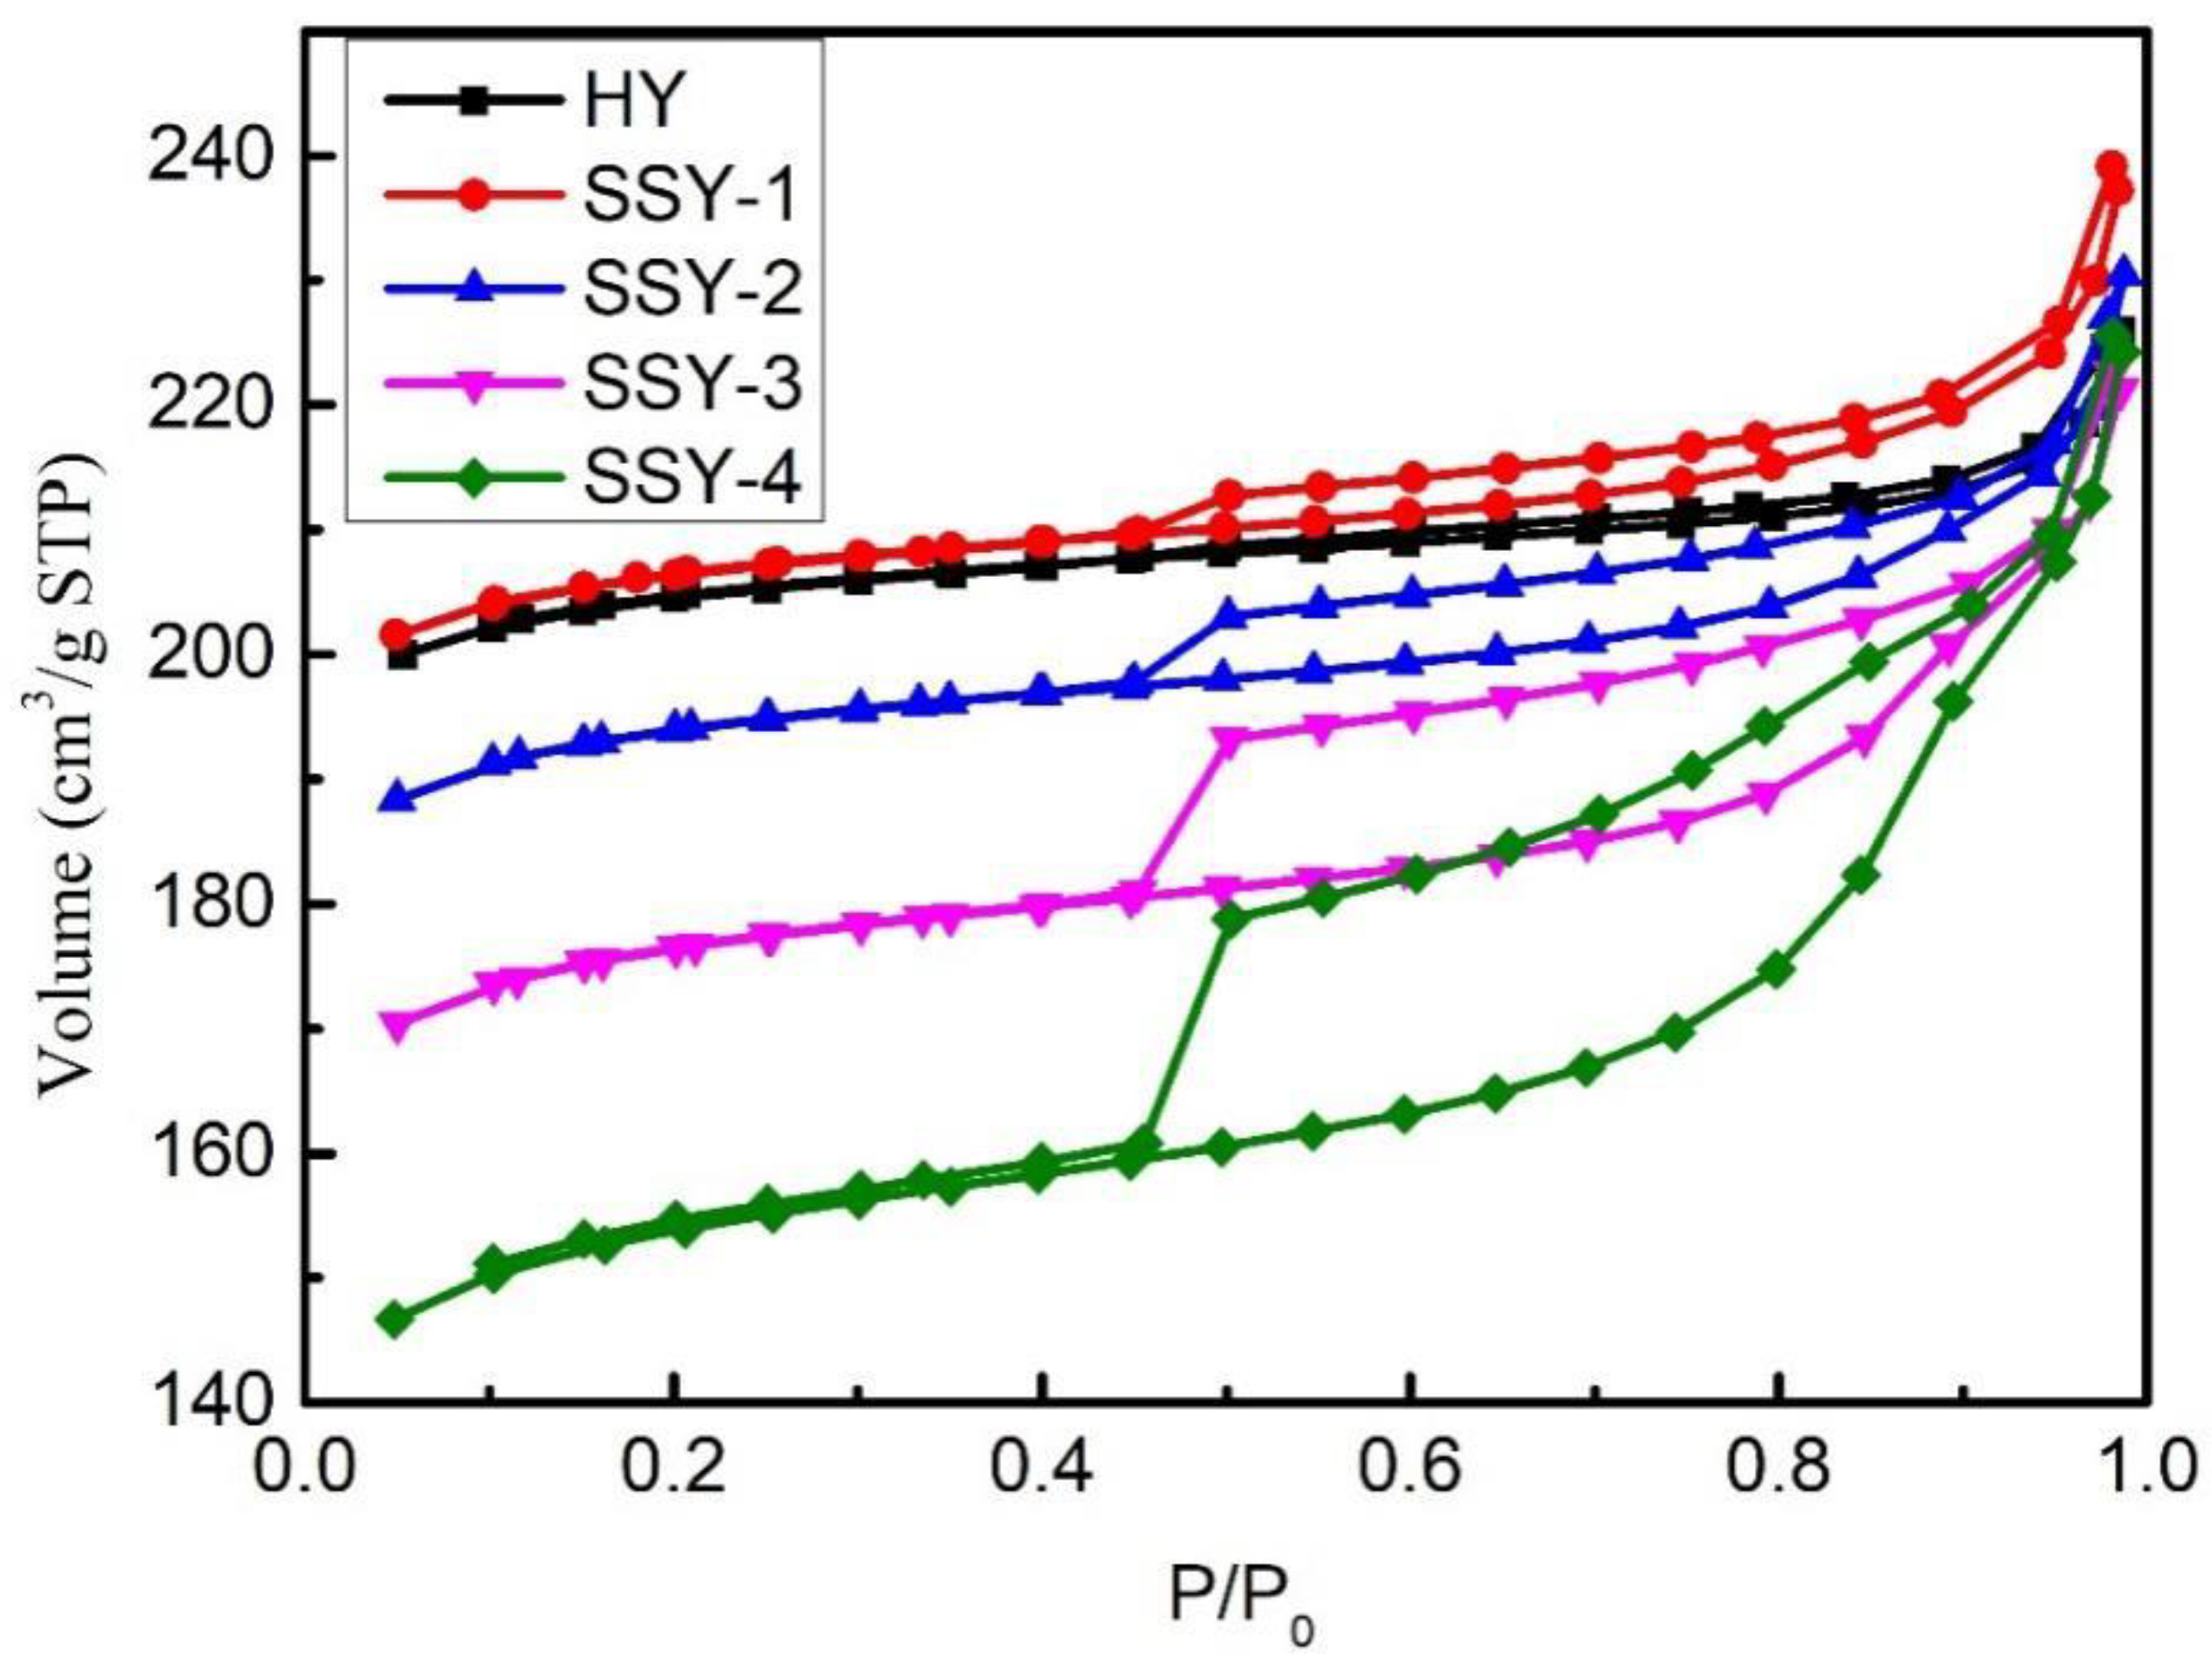
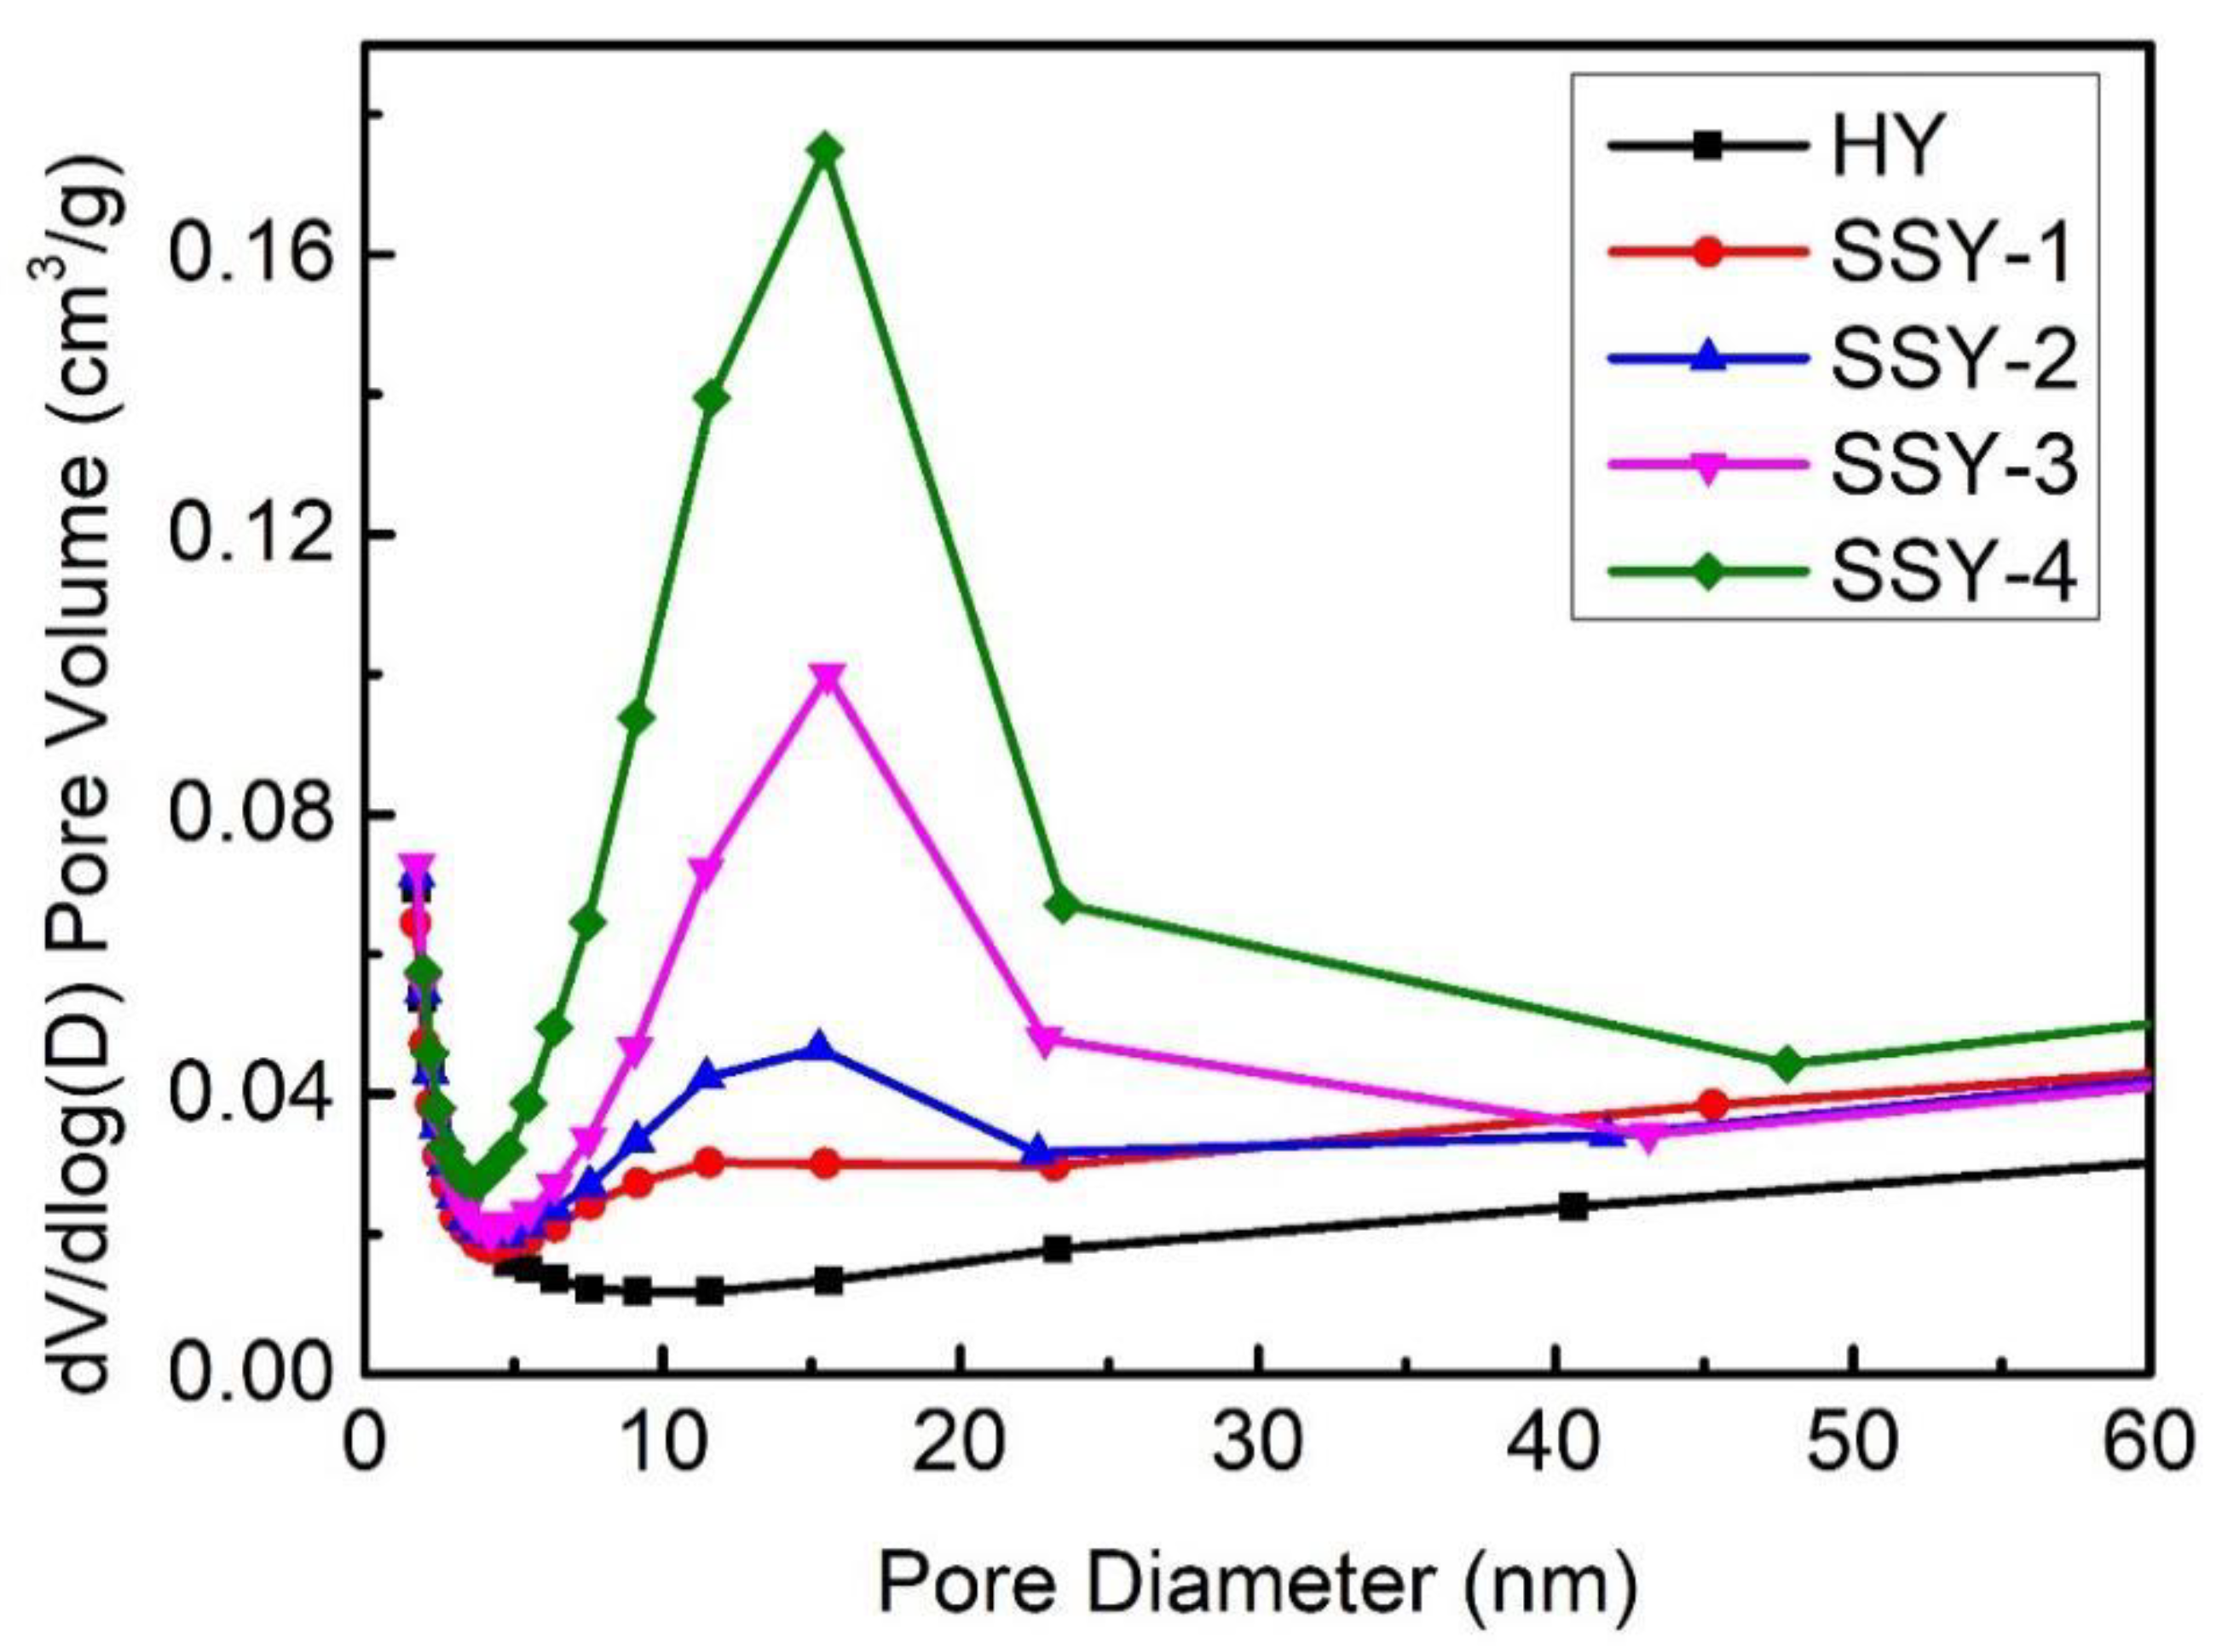
2.1. Influence of AHFS Treatment on Zeolite Structure

N2 adsorption–desorption isotherm and pore size distribution before and after AHFS treatment are shown in Figure 1 and Figure 2. It can be seen that when P/P0 is less than 0.85, the adsorption curve and desorption curve of HY were completely coincident. It is the typical character of type I isotherm, indicating the single regular pore structure of HY zeolite, and the channels are made up of micropores [23]. With the increase of concentration of AHFS during the treatment, the hysteresis loops in N2 adsorption–desorption isotherm of SSY-1, SSY-2, SSY-3, and SSY-4 are getting larger, showing the typical type IV isotherm [24]. This may be caused by the rate of dealumination increase with the concentration of AHFS; however, the rate of silicon migration to replenish aluminum vacancies is gradually slower than the rate of dealumination. Therefore, the volume of mesopores gradually increased, and the distribution of pore diameter of mesopores slightly broadened [25,26].
The textural properties of Y zeolites before and after AHFS treatment are shown in Table 1. The results indicate that with the increase of AHFS concentration, the specific surface area and pore volume of the modified Y zeolites first increased and then decreased. When the concentration of AHFS is at a low level, the HF and NH4F formed in the solution are able to dissolve the amorphous species and extra-framework species within zeolite channels. Thus, the specific surface area of zeolite will increase. During the AHFS treatment, dealumination and silicon replenishment of zeolite Y happen simultaneously. The newly formed hydroxyl holes will be filled by Si(OH)4 from the hydrolysis of AHFS, and finally, the total pore volume decreases with the increase of AHFS concentration [27]. When the concentration of AHFS is at a high level, the HF formed in the solution will dissolve both the extra-framework aluminum and framework aluminum. The dissolved framework aluminum may deposition in the zeolite channels as extra-framework aluminum; however, the silicon species formed from the hydrolysis of AHFS can hardly fill in the hydroxyl holes in time. Furthermore, at the specific temperature, the silicon species will be transformed into amorphous silica and will block the channels of zeolite, which will cause the decrease of specific surface area and pore volume [21].
The crystallographic properties are calculated according to [28], and the Si/Al ratios are calculated according to [29,30]; they are shown in Table 2. Taking the crystallinity of parent HY zeolite as 100%, as the concentration of AHFS increased, the crystallinity of modified zeolites first increased and then decreased. It implies that at low concentration, the rate of dealumination and silicon replenishment were at the same level, and the framework of zeolite can be well preserved. With the increase of AHFS concentration, the dealumination was faster than silicon replenishment, and more hydroxyl holes were created. Therefore, the framework of zeolite was destroyed, and the relative crystallinity decreased.
With the increase of AHFS concentration, the framework Si/Al ratio and global Si/Al ratio increased at the same time, while the extra-framework aluminum first increased and then decreased. The extra-framework aluminum of SSY-1 is 0. It implies that at low AHFS concentration, most of the dealumination was proceeding at the external surface of HY zeolite, and the extra-framework aluminum there was easy to be dealuminated. With the increase of AHFS concentration, the content of extra-framework aluminum of SSY-2 and SSY-3 went up to 3, indicating more and more dealumination took place inside the zeolite channels and the extra-framework aluminum left in the channels cannot be removed in time due to the diffusion limitation. As the concentration of AHFS further increased, the relatively low content of extra-framework aluminum on SSY-4 could be addressed by the collapse of channels in the high concentration of AHFS, and the removal of extra-framework aluminum has gotten rid of diffusion constraints in this situation.

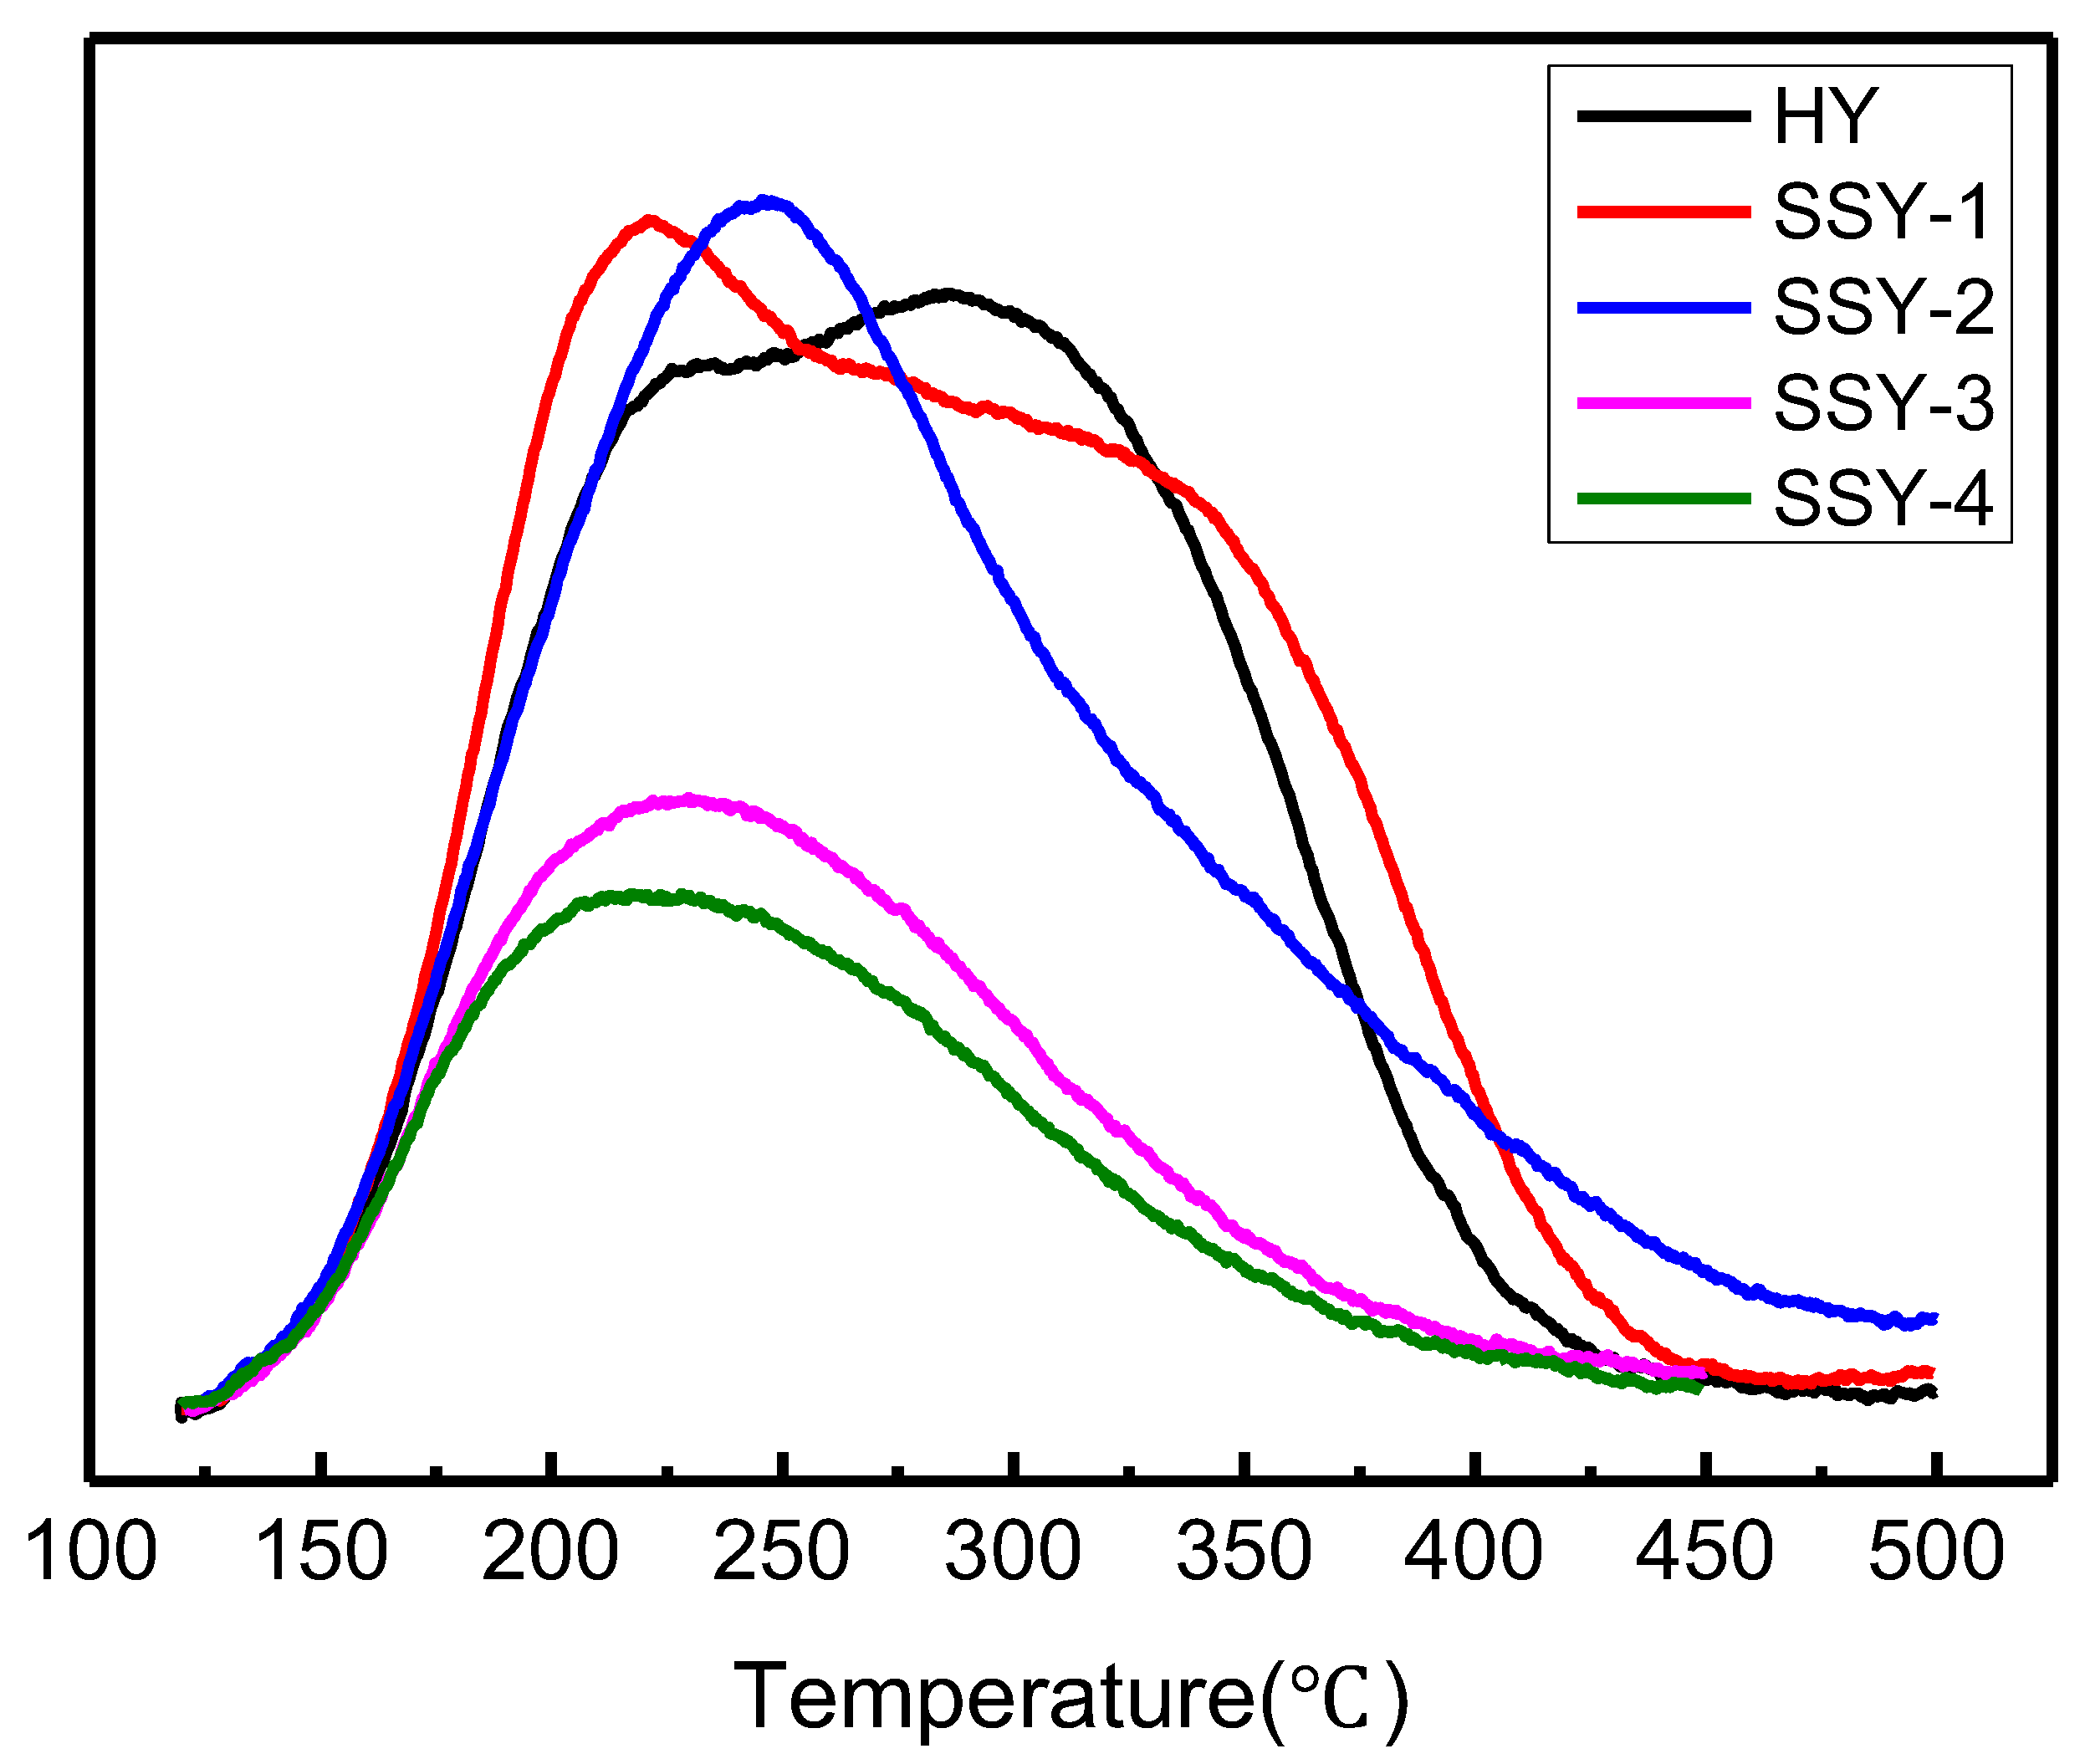
2.2. Acidic Properties of the Modified Zeolites

The NH3-TPD curve of Y zeolites before and after AHFS treatment is shown in Figure 3. From Figure 3, with the increase of concentration of AHFS, the peak area of modified Y zeolites declined gradually, and the peak presenting strong acid sites at 350 °C disappeared gradually, while the desorption peak for weak acid sites moved to low temperature. This indicates that, with the degree of dealumination increase, the acid amount and acid strength of modified Y zeolites declined gradually.

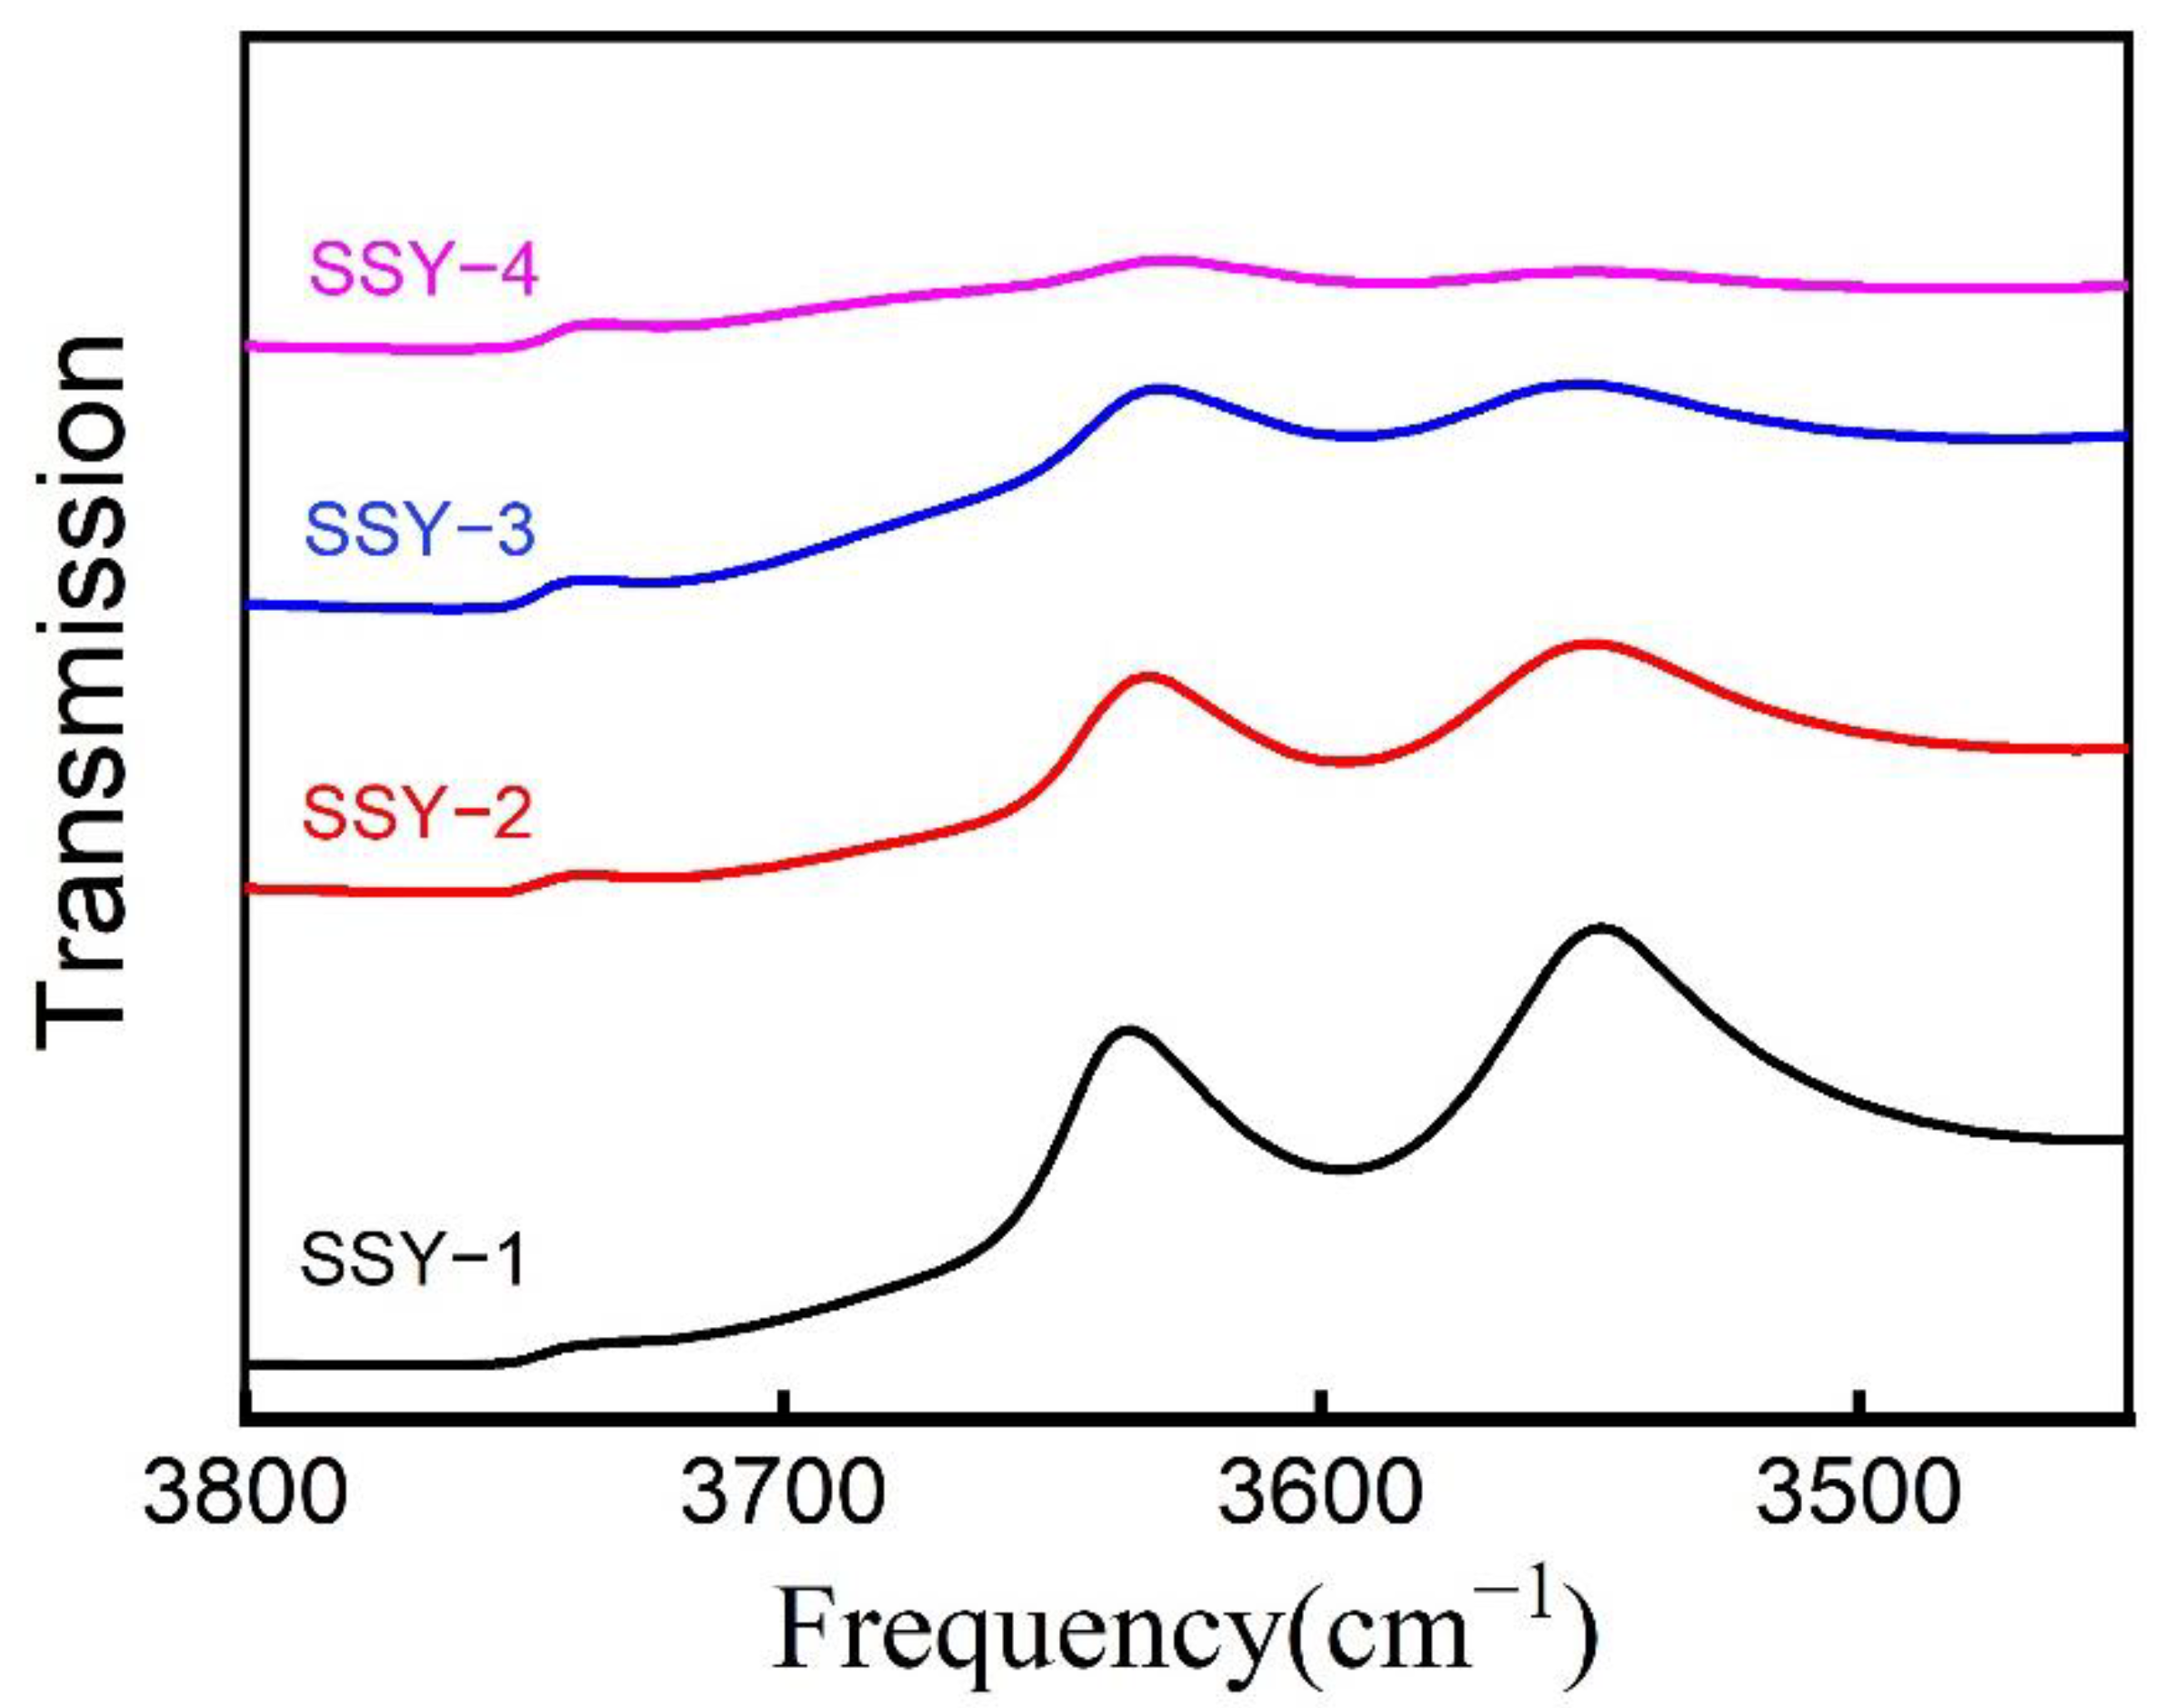
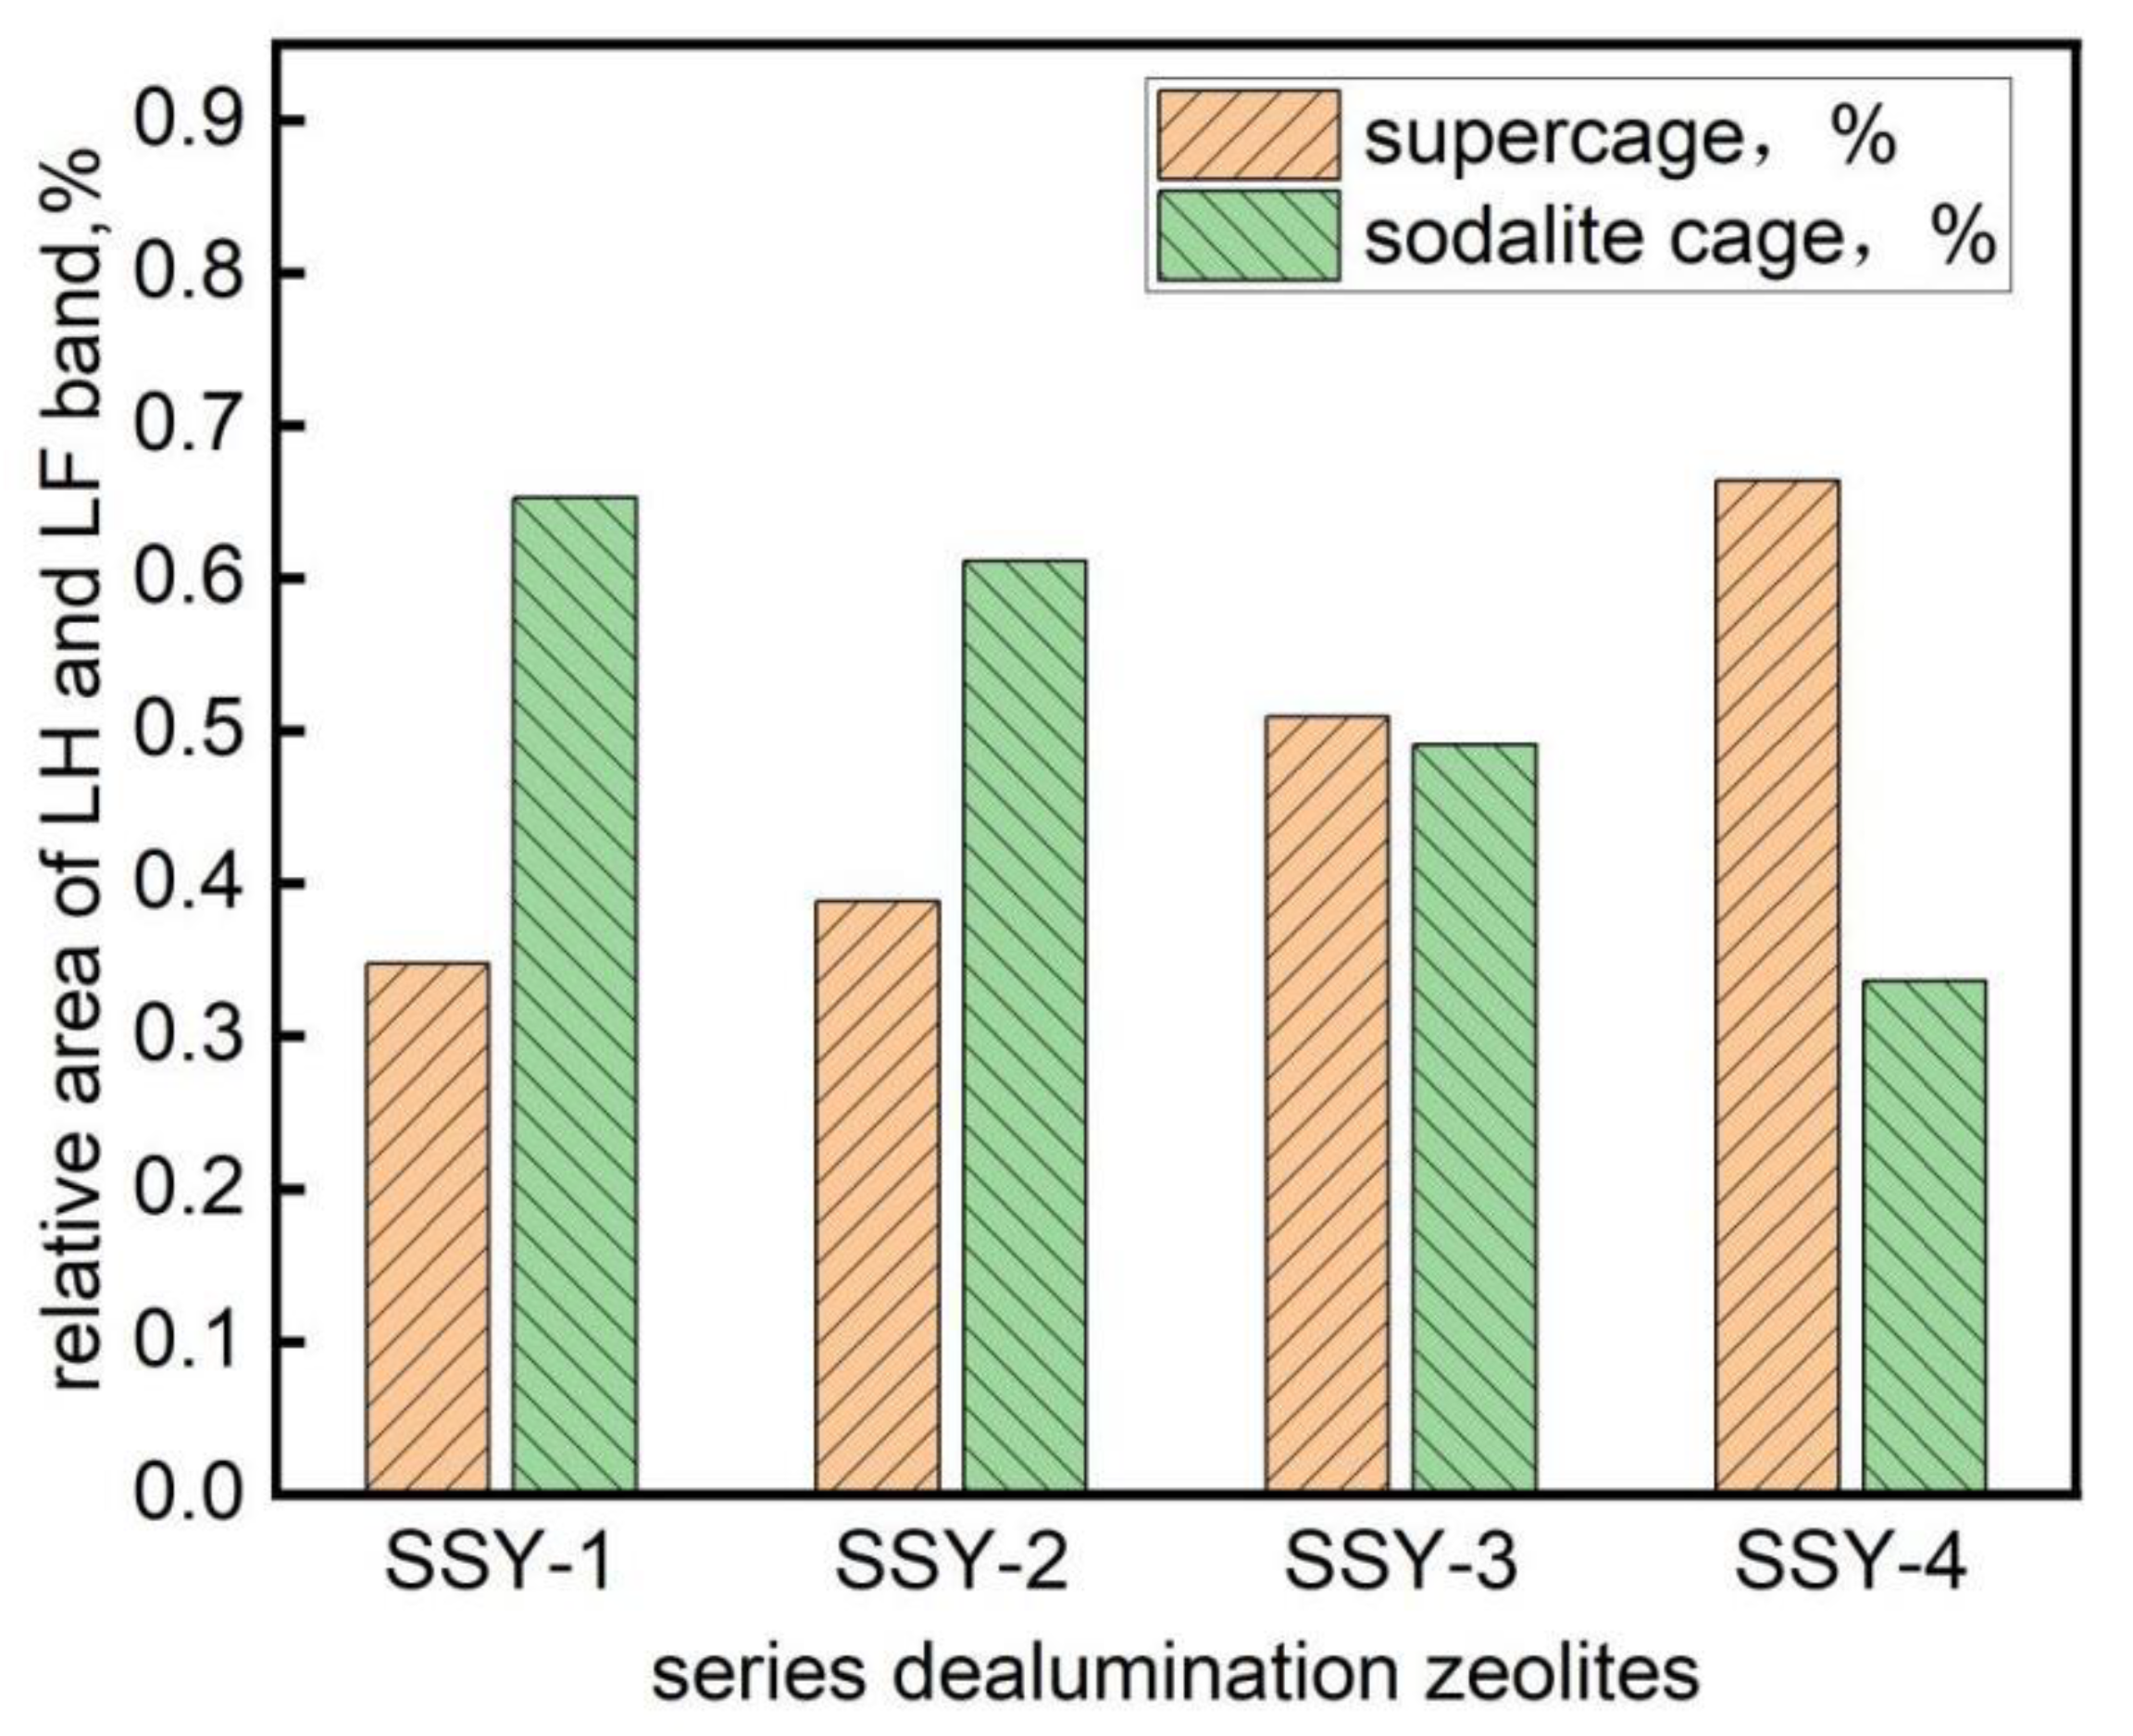
2.3. IR Spectra of the Hydroxy Groups

IR spectra of the hydroxy groups of modified Y zeolites are shown in Figure 4. The hydroxy groups of modified Y zeolites display three obvious stretching vibration peaks in the infrared region. The absorption peak at 3630 cm−1 is attributed to the hydroxy group in supper cages, and the absorption peak at 3550 cm−1 is attributed to the hydroxy group in SOD cages. The peak at 3740 cm−1 was regarded as Si-OH stretching vibration peak at silanol nests formed by dealumination of framework aluminum. Of note is that Si-OH was regraded inactive for n-butene cracking because of its weak acid strength [19]. Stretching vibration peak for extra-framework aluminum were barely detectable for any samples, which indicates it has been almost completely removed in AHFS treatment [15].
Whether the hydroxyl group can participate in the reaction is related to its position. The narrow channel of SOD cages has limited the access of hydroxyl group inside to reactant (even CO molecule is inaccessible to the hydroxyl group inside SOD cage); therefore, the catalysis activity of hydroxyl group inside SOD cages is limited [31]. The supper cages consist of 12-membered rings, and the pore diameter is about 0.74 nm, which means that most of the hydroxyl group inside is able to participate in catalysis reaction [32]. Through normalization of peak areas at 3630 cm−1 and 3550 cm−1, the relative content of hydroxyl groups inside SOD cages and supper cages can be obtained, as shown in Figure 5. It can be seen that as the degree of dealumination increases, the relative content of hydroxyl groups inside supper cages increased and that in SOD cages decreased, which indicates the SOD cages were opened in the process and became supper cages by connecting each other. In this case, though the acid amount decreased, the percentage of acid sites inside supper cages increased, and the accessibility of acid sites also increased.

2.4. Pyridine-IR Study of the Acid Properties

According to the Lambert–Beer law, the acid amount of AHFS modified Y zeolites through FT-IR is shown in Table 3 [29]. It can be seen that the acid amount from FT-IR characterization is identical to the results of NH3-TPD. As the degree of dealumination increases, the acid amount decreases [33]. The amount of Brønsted acid and Lewis acid is related to the framework and extra-framework aluminum, respectively. For modified Y zeolites, the ratio of Brønsted acid site to Lewis acid site in strong acid sites is much higher than it in weak acid sites, which indicates the extra-framework inside the channels exists as weak acid sites. With the increase of AHFS concentration, the ratio of Brønsted acid site to Lewis acid site of modified Y zeolites keeps decrease. SSY-1 possessed the highest B/L ratio, since at low concentration of AHFS, more framework aluminum can be preserved, and extra-framework aluminum can be removed efficiently. When the AHFS concentration is at a high level, the dealumination of framework aluminum increases, which results in the decrease of Brønsted acid amount and the decrease of B/L ratio. The Pyridine-IR spectra for ammonium hexafluorosilicate modified zeolites is available in support information Figure S5.
In this study, it is assumed desorbed probe molecules will not react or reabsorb with the surface of the catalyst according to [34]. The desorption rate of probe molecules from a specific type of acid site can be described by the Wigner–Polanyi equation:
N ( t ) = V m d θ dt = v n θ n exp [ E d R T ( t ) ]
where N(t) is the desorption rate; Vm is monolayer saturated adsorption amount; θ is the surface coverage; Vmdθ is amount of adsorption of pyridine; n is the reaction order; vn is a frequency factor; Ed is the desorption activation energy; R is ideal gas constant (8.314 J mol−1 K−1) and T is the absolute temperature; t is desorption time. Under our experimental conditions, the desorption rate of pyridine was determined with the following Wigner–Polanyi Equation (1), assuming that the desorption is irreversible and the desorbed pyridine does not react or readsorb as well as no heat and mass transfer limitations exist.
Taking the adsorption peak at 1540 cm−1 as the characteristic peak of pyridine adsorbed on Brønsted acid site, in the progress of temperature-programmed desorption, the curve of the adsorption amount of pyridine on the acid center as a function of the desorption time can be obtained by continuous integration of peak areas. Convert the time-referenced heating rate and the initial temperature to the corresponding desorption temperature, one can obtain the distribution curve of pyridine coverage on Brønsted acid centers as a function of desorption temperature, and then the slope of this curve can be used to calculate the pyridine desorption rate dσ/dt. Variation curves of pyridine adsorption capacity with desorption temperature on Brønsted acid site for different zeolites are shown in Figure 6.
Plot ln(−dσ/dT/σn) against T−1, and linearly fit the results, desorption activation energy of basic probe molecules on acid sites can be obtained by multiply the slope of the curve and ideal gas constant R, and the reaction order n of desorption reaction can be obtained by the plotting method. The coke formation rate, fitting curve, and linear equation of ammonium hexafluorosilicate modified zeolites are available in support information Figure S9 and Figure S10a–d, respectively
The result of fitting and calculation shows, in the reaction of temperature-programmed desorption of pyridine on Brønsted acid sites of zeolites, when the reaction order is 1, the linear correlation result is a negative correlation, and the absolute value of the linear correlation coefficient is the largest, and the fitting standard deviation is the smallest, which can be used to determine the first-order reaction of desorption reaction on SSY-1, SSY-2, and SSY-3. On SSY-4, the reaction order is 3. The R squared values obtained from the fitting process were shown in Table S5.
Using pyridine as probe molecule in TPD-IR reaction, two types of Brønsted acid sites on Y zeolites can be distinguished, since the molecular size of pyridine limited its access to the hydroxyl group inside SOD cages, and the acid sites inside supper cages are accessible. The linear fitting results show that, in supper cages, there are two values for the activation energy of pyridine desorption. Li et al. [35] obtained the same results and attributed it to the different states of absorbed pyridine inside the supper cages. The corresponding desorption activation energy of pyridine is shown in Table 4.
From the results of Ed in Table 4, the acid strength of four modified zeolites can be determined as follows: SSY-4 > SSY-3 > SSY-2 > SSY-1. As the degree of dealumination increases, the Brønsted acid density decreases, and the strength increases.

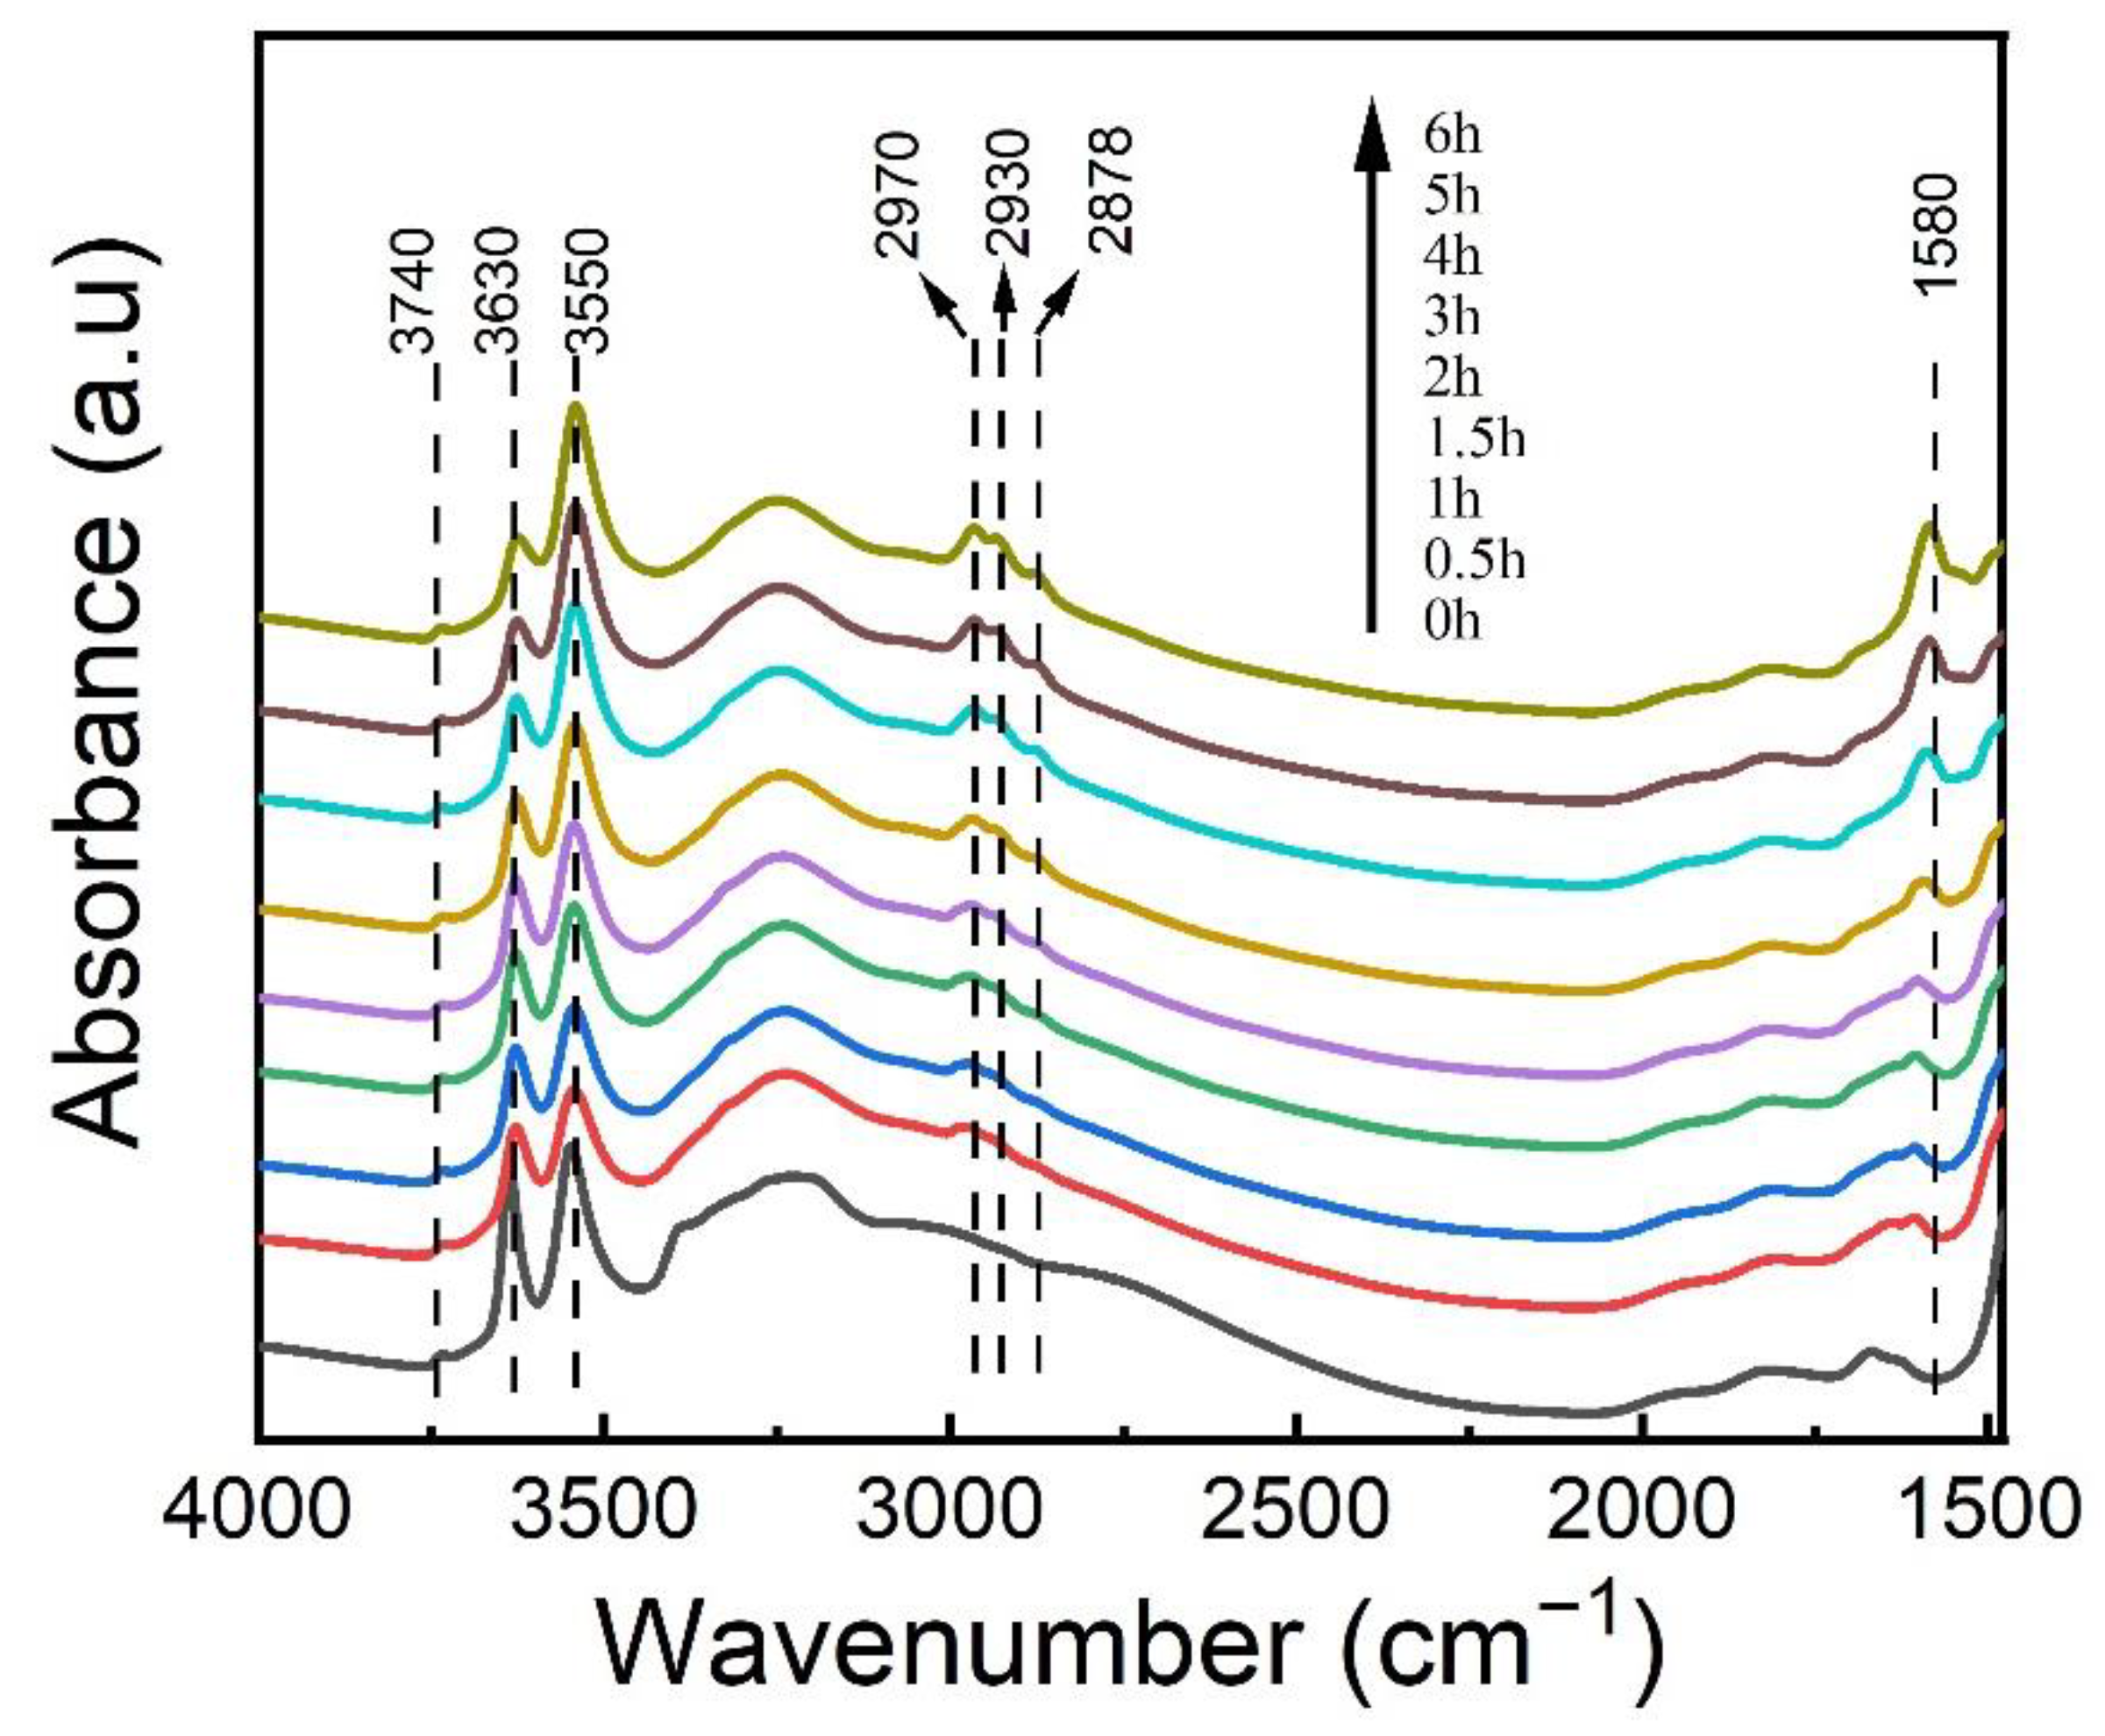
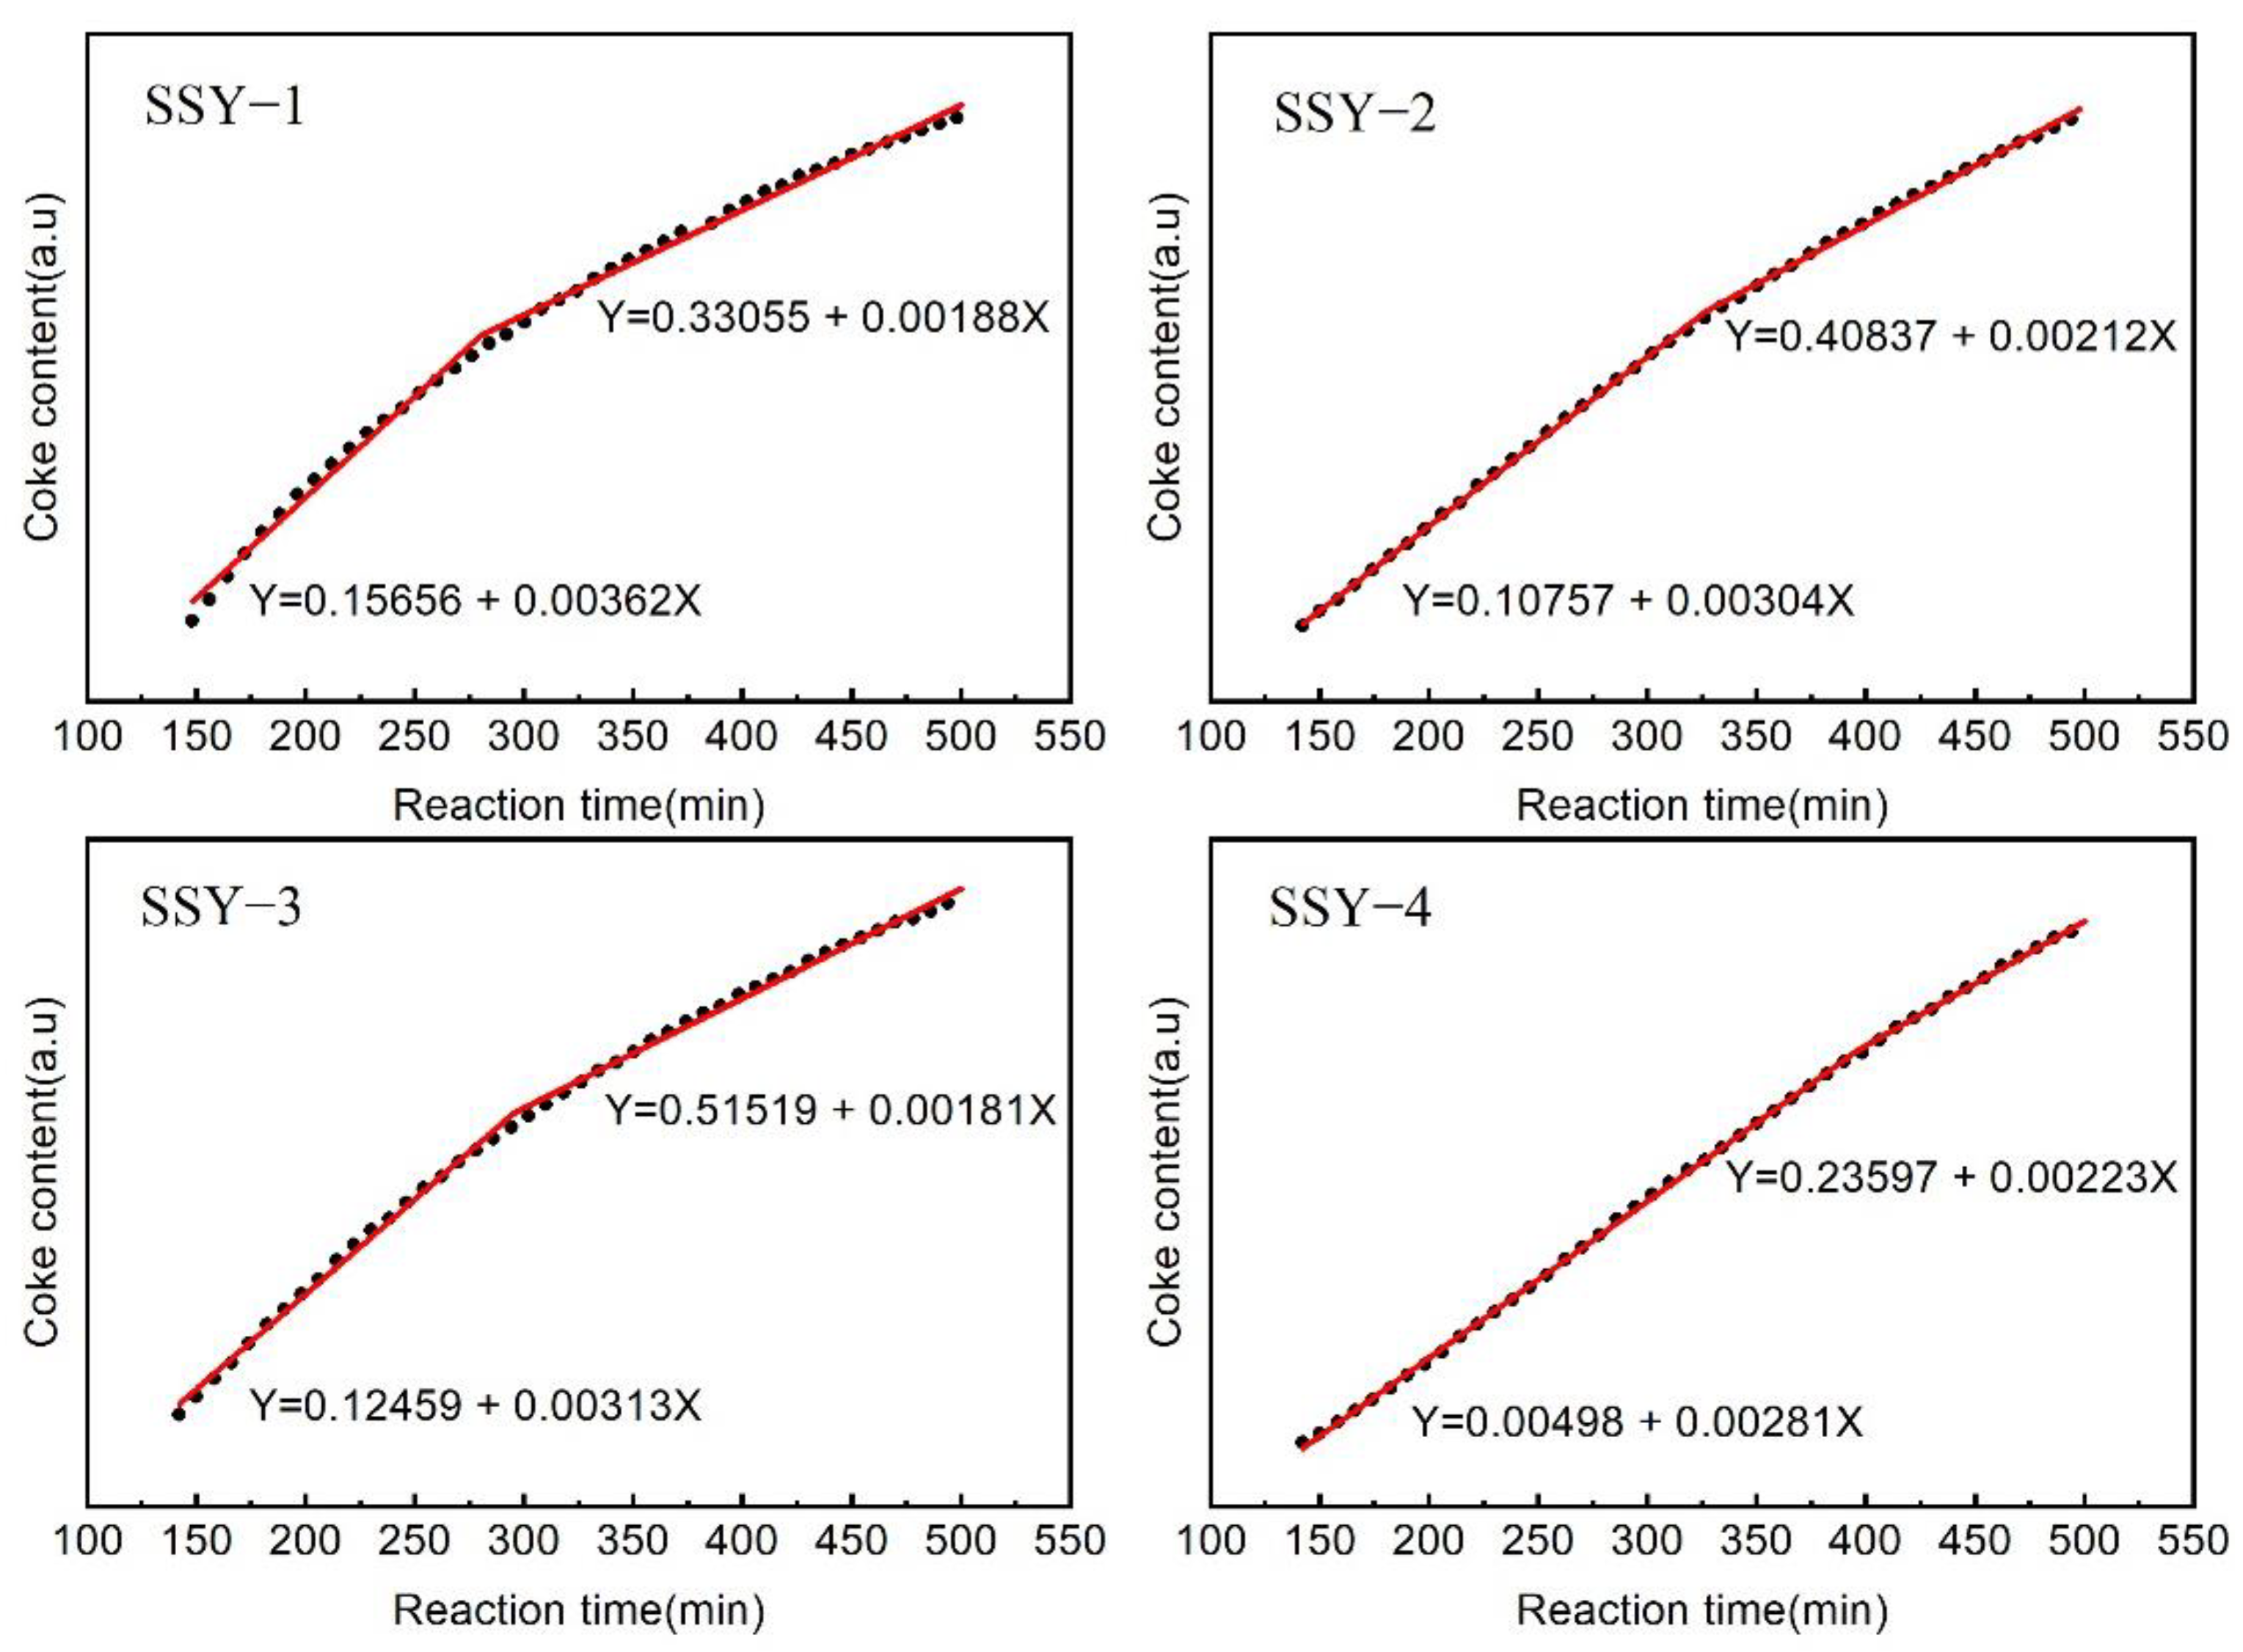
2.5. FT-IR Study of the Coke Formation

Karger et al. [36] performed in situ FT-IR technology studied the process of coke formation in ethylbenzene disproportionation and olefin conversion, and the reaction condition inside the in situ reactor cell is close to that in the microreactor. In this research, their method was used, and the effects of acidity and pore structure on coke formation on modified Y zeolites were studied in the process of butene catalytic cracking. Using in situ FTIR, the reaction under 400 °C was characterized, and the intensity change of adsorption peak of hydroxyl groups at 3630 cm−1 and 3550 cm−1 with time was determined to display the change of Brønsted acid amount on the surface of catalysts.
The pore size of SOD cage of Y zeolite is 0.26 nm, and the pore size of supper cage and hexagonal cage is 0.75 nm and 0.155 nm, respectively. However, the dynamic diameter of butene is 0.45 nm, which means it will not enter SOD cages and hexagonal cages, and the possible reaction place is inside supper cages. As shown in Figure 7, the area of peak at 3630 cm−1, which belongs to the hydroxyl group inside supper cage, declined sharply with the proceeds of reaction, indicating it was affected badly by coke [37]. While for the hydroxyl group inside SOD cage at 3550 cm−1, the peak area was almost not affected, because the pore size limited the entrance of butene. Obviously, from changes of reactive hydroxyl groups at different positions with reaction obtained from Figure 7, it can be regarded that hydroxyl groups inside supper cages are the active sites for butene cracking instead of those inside SOD cages.
In the beginning of the reaction, the stretching vibration peaks appear at 2970 cm−1, 2935 cm−1, and 2878 cm−1, indicating the adsorption of butene on zeolites. As the reaction proceeds, the stretching vibration peak appearing at 1602 cm−1 reveals the formation of aromatics [38,39], which could be addressed from cyclodehydrogenation of adsorbed butene. For a longer reaction time, the peak at 1602 cm−1 disappeared, and a new peak that appeared at 1580 cm−1 was regarded as the characteristic peak of coke species [40], indicating the coke was formed from condensation dehydrogenation of aromatics. This conclusion is in accordance with the work of Li et al. [41]. They proposed the mechanism of catalytic cracking of n-butene through experiment and theoretical analysis. First of all, butene dimerization to give C8, and C8 undergo direct cracking or isomerization; then, it will further react with C4 olefin and give C12 and other oligomers and aromatics and coke.

2.6. Effect of Acidity on the Nature of Coke

Sahoo S K et al. [42,43] proposed that the deactivation of catalyst will be accelerated with relatively high Brønsted acid density, and it is the acid density other than acid strength that determines the coke formation on zeolites. Boveri et al. [44] reported the treatment of parent zeolite with steam dealumination, acid dealumination, or silanization could raise the Si/Al ratio and significantly lower the rate of coke formation and prolong the lifetime of catalysts.
To further study the effects of acidity and textural properties of zeolites on coke formation, the peak at 1580 cm−1, which belongs to the C=C stretching in microcrystalline graphite structure, was taken as the characteristic peak of coke species [40]. Performing continuous integration of the peak area, the curve of coke deposition as a function of time can be obtained, in which the slope of this curve is the rate of coke formation. As shown in Figure 8, by comparing the rate of coke formation on four modified zeolites, one can find the general trend is that the coke formation slows down with the decrease of acid density at the beginning of the reaction, which is in accordance with former research [33]. However, this trend reversed on SSY-2 and SSY-3, on which the former catalyst has higher acid density but possesses a lower coke formation rate. This could be explained by the results of Py-IR characterization. Although the acid amount of SSY-2 is 7.65 × 10⁻⁴ mol/g, higher than that of SSY-3 with the value of 6.71 × 10⁻⁴ mol/g, the Brønsted acid strength of strong acid sites on SSY-2 is much weak than that on SSY-3, which can be proved by the value of adsorption activation energy with Ed = 11.6 KJ/mol on SSY-2 versus Ed = 15 KJ/mol on SSY-3. In the initial stage of the reaction, the coke formation mainly happens on strong acid sites. Therefore, the rate of coke formation on SSY-3 is higher than that on SSY-2.
In general, coke formation on zeolites is influenced by acid density, which means the decrease of acid density will slow down the rate of coke formation. However, through in-situ FT-IR technology, a counterexample was found. It can be concluded that acid strength determines the carbon deposition rate when the acid density is basically the same, and the stronger the acid strength is the faster the coke formation is. Therefore, when modification is performed on zeolite-type catalysts to enhance the resistance of coke, apart from reducing the acid density, it is necessary to consider the effect of the modification process on the acid strength.

3. Experimental

3.1. Materials

NaY zeolite (NanKai Catalyst Company, Tianjin, China), ammonium hexafluorosilicate (98%, Aladdin Shanghai, Shanghai, China), n-butene (99.9%, Beijing ZG Special Gases Science & Technology Co., Ltd., Beijing, China), Ar (99.9%, Beijing ZG Special Gases Science & Technology Co., Ltd.), and ammonium chloride (99.5%, Sigma-Aldrich, Saint Louis, MO, USA).

3.2. Dealumination

HY zeolite was prepared from commercial sodium Y (NaY) zeolite with Si/Al atom ratio 2.6 provided by the catalyst plant of Nankai University (containing approximately 12 wt % Na). HY zeolite was prepared by threefold ion exchange of the NaY zeolite at 85 °C for 1 h in suspensions of 15 wt % aqueous solution of NH4NO3 (6.7 mL/g of zeolite), the molar concentration of NH4NO3 is 1 mol/L. The resulting solid was filtered and repeatedly washed three times with distilled water. The solid was dried at 120 °C for 10–15 h and calcined in a muffle furnace under 300 °C for 2 h to decompose the NH4+ ions; in that way, Na content was reduced to less than 0.15 wt % [45].
Further chemical treatments with ammonium hexafluorosilicate (AHFS) were performed to the HY zeolite. Typically, a suspension of 10 g HY zeolite in 100 mL of 0.8 M ammonium acetate solution (pH = 6.7) was heated under stirring at 90 °C, and then 20 mL AFHS solution was added dropwise under stirring. The suspension was then stirred vigorously for 3 h at 90 °C. In the end, the zeolite was recovered by filtration and repeatedly washed 3 times with boiling water. The solid was dried for 10–15 h at 120 °C and calcined at 500 °C for 4 h [46,47,48].
The amount of AHFS was varied and the mole ratio of AHFS-to-aluminum content of HY zeolite was varied between 0.2 to 0.5. Samples were denoted as SSY-n, where “1–4” corresponds to the mole ratio of AHFS-to-aluminum content of HY zeolite “0.2–0.5”.

3.3. Physicochemical Characterization

A Rigaku ZSX 100 e X-ray fluorescence (XRF) spectrometer was used for the measurement of the bulk chemical composition of the zeolites. X-ray photoelectron spectroscopy (XPS) measurements were performed on ESCALAB 250 (VG) using Al Ka (hm = 1486.6 eV) radiation. Binding energies were referred to the C 1s at 285.0 eV.
X-ray diffraction patterns of the zeolites were obtained using a Bruker AXS D8 Advance X-ray diffractometer with monochromatized Cu Ka radiation (40 kV, 40 mA). Before the XRD measurements, the zeolite powder was dried at 393 K for 2 h in an oven and then kept in a closed vessel containing supersaturated aqueous CaCl2 solution for 16 h to stabilize the moisture content of the zeolite. The relative crystallinity was estimated by comparing the peak intensities of the treated samples with that of the parent sample according to SH/T 0340–92. The total integrated intensities of the eight peaks assigned to the (331), (511), (440), (533), (642), (822), (555), and (664) reflections were calculated for the comparison. The scan range is from 15 to 35, and the scan rate was 2/min with a step width of 0.02. The unit cell parameters of the parent HY and AHFS dealumination zeolites were analyzed from the diffraction data using the Le Bail method [49].
The aluminum content of the framework was determined using the relationship between the unit cell size and the number of aluminum atoms in the unit cell [50]. For this purpose, the scan range is from 5 to 60, and the scan rate was 1/min with a step width of 0.02. The unit cell parameters of the parent HY and the AHFS dealumination zeolites (a0) were determined from the position of the (555) reflection, using pure silicon (99.999 wt.%) as the internal standard for angle calibration (2θ = 28.443) according to SH/T 0339–92. The scan range is from 28 to 32, and the scan rate was 0.05/min with a step width of 0.02. The framework Si/Al ratios of all the Y-type zeolites involved in this work were obtained from the a0 by Eq from [51], a0 taken in nm.
Si / Al = 2.5935 a 0 a 0 2.4212
Nitrogen physisorption measurements were performed at liquid-nitrogen temperature with a Micromeritics ASAP 2020 apparatus. Prior to the measurements, all samples were vacuum-degassed at 623 K for 5 h. The total surface area was determined by the BET method. The micropore and external surface areas as well as the micropore volume were calculated using the t-plot method. The pore size distribution profile and the mesopore volume were obtained using the BJH method with the N2 desorption isotherm.

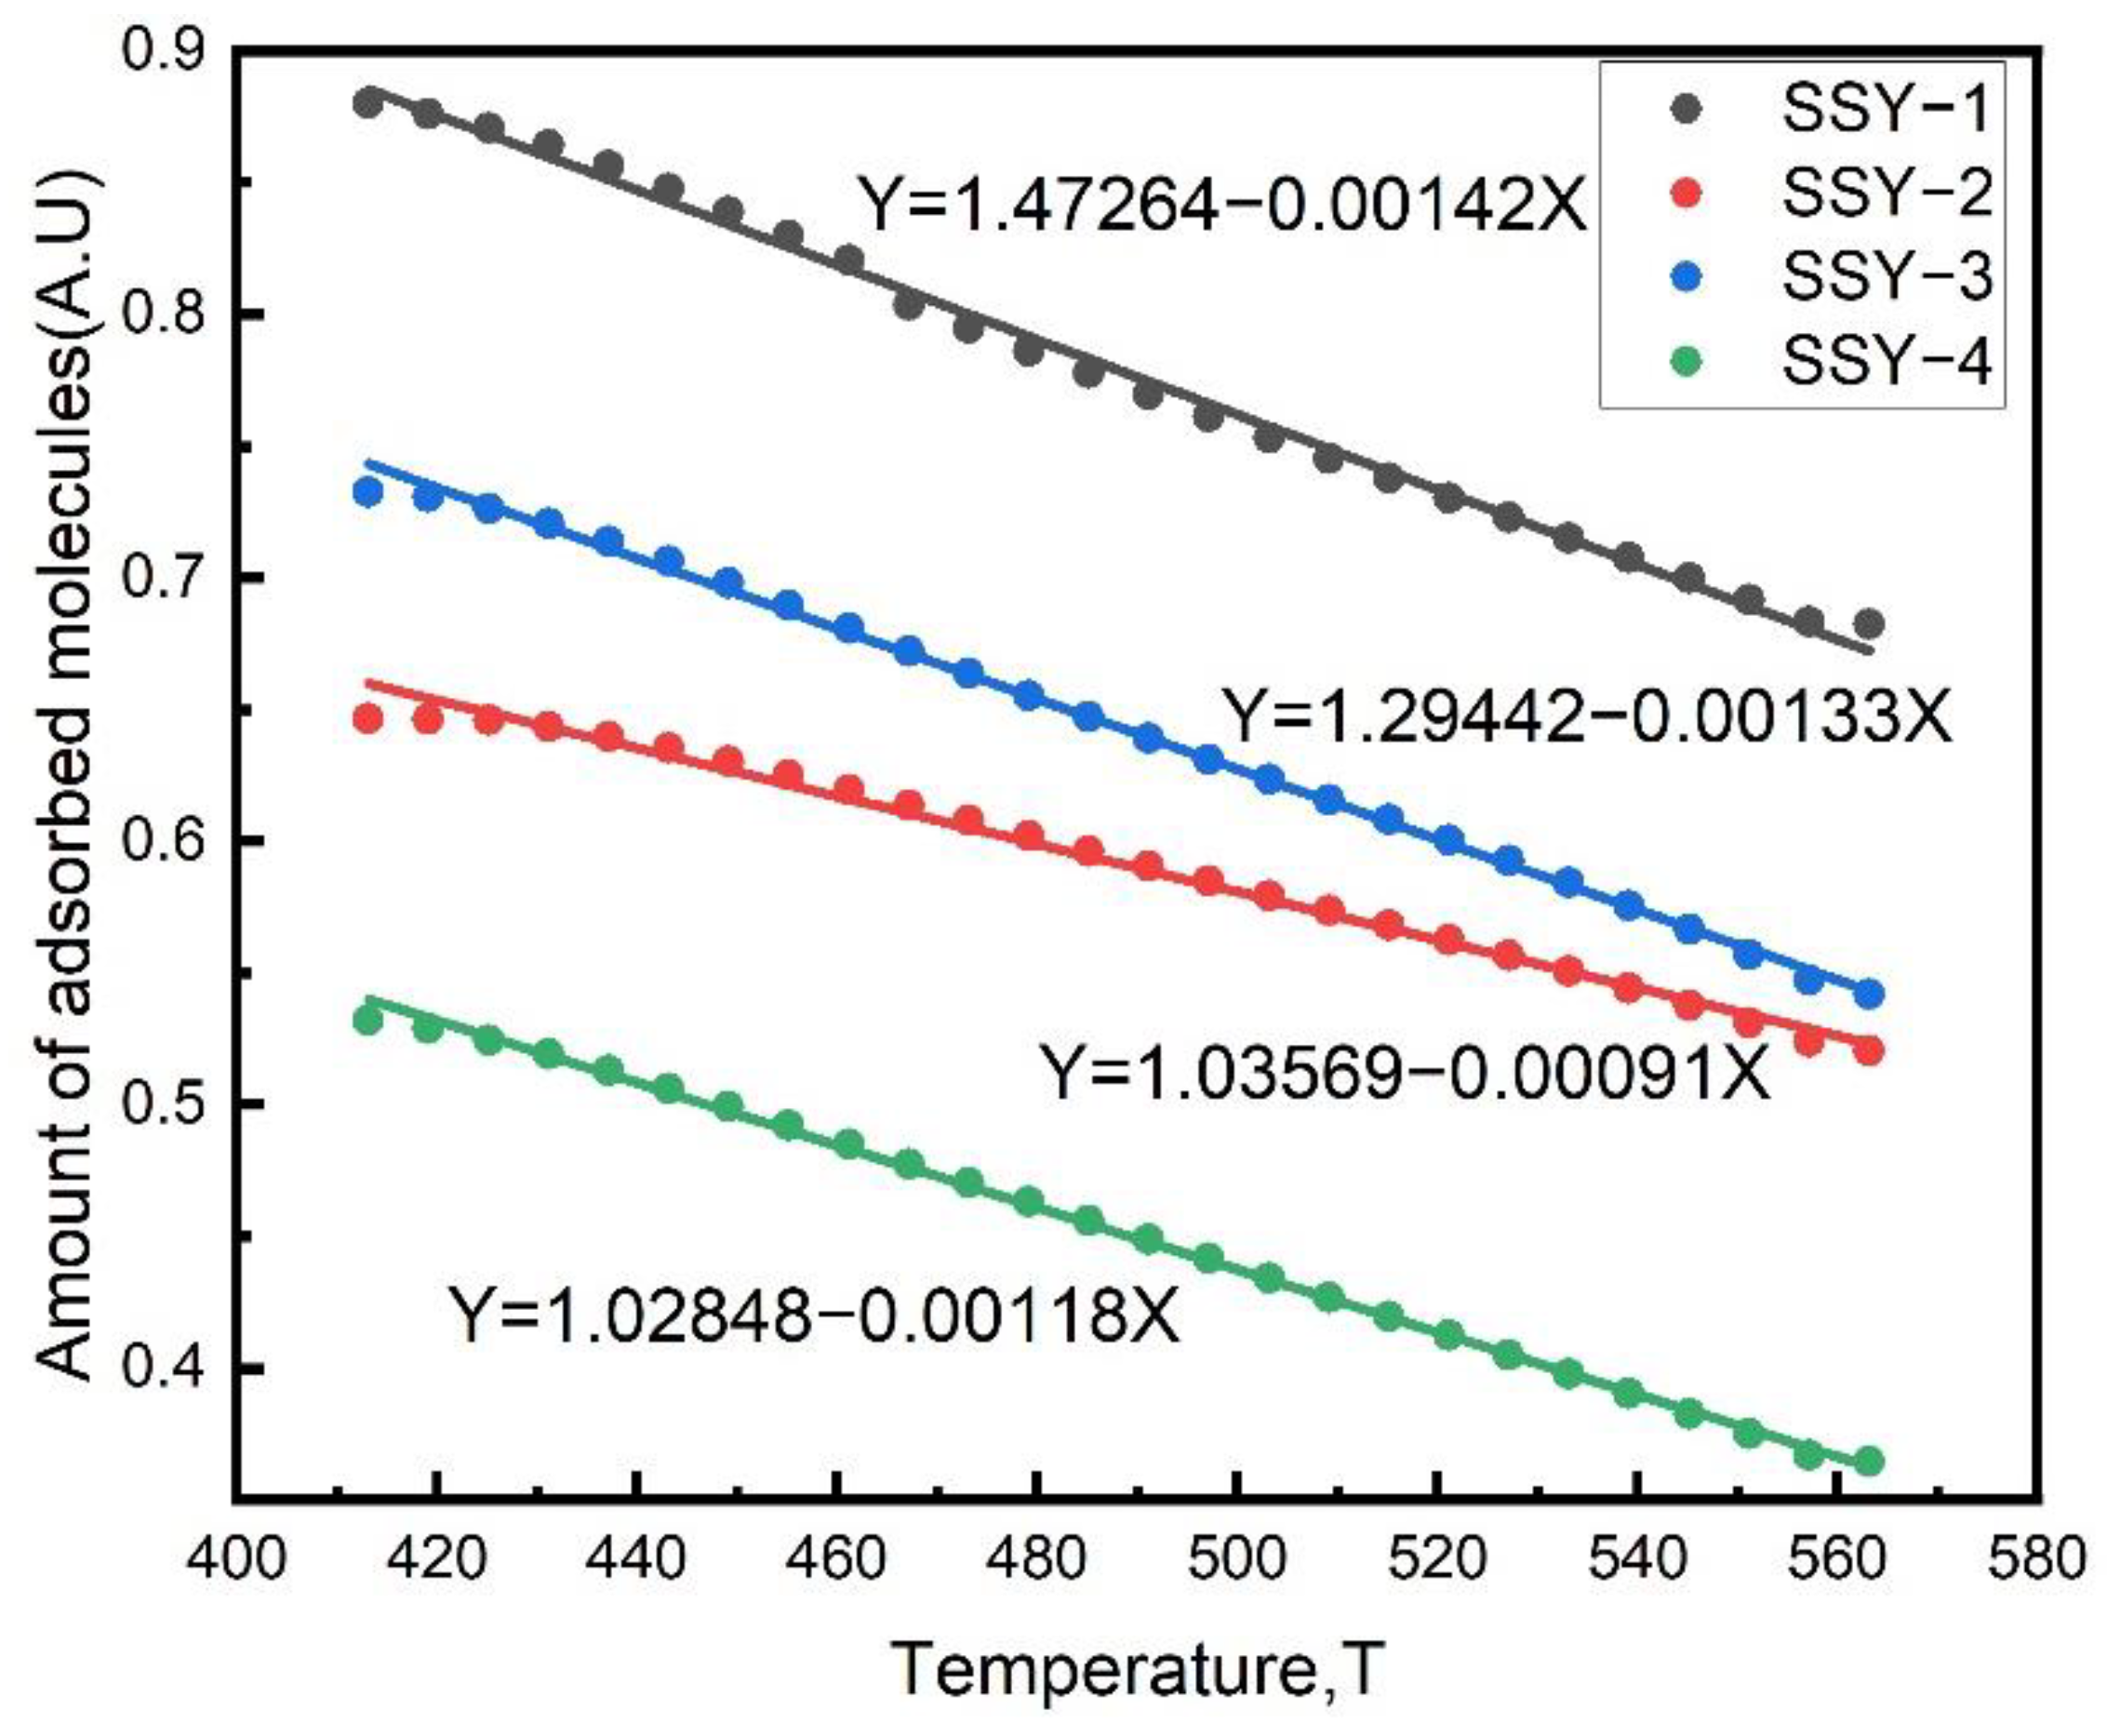
3.4. Acidity Measurements

For all samples, the IR spectra were recorded on a Bruker 70 V spectrometer with a resolution of 4 cm−1. Zeolite powders were pressed in self-supported zeolite disks (10–15 mg/cm2), placed into an in situ IR cell, heated at 1 K/min to 673 K under vacuum, and kept at 673 K for 2 h. The spectra were recorded after cooling to room temperature [52]. IR spectra of the hydroxyl region (3000–4000 cm−1) were recorded. The pyridine adsorption was carried out at room temperature for 2 h and then heat up to 673 K at a rate of 3 K/min under vacuum to eliminate pyridine. IR spectrum was recorded synchronously from 373 K to 673 K over 100 min with one scan per minute.

3.5. In Situ FTIR Reaction

The in situ FTIR reactions were carried out at 623 K. A gas mixture of butene/He (with molar ratio5%:95%) was used in the FTIR reaction.
Before the experiments run, the zeolite disks were heated at 673 K under vacuum for 60 min. After cooling to room temperature, the background of the sample IR spectrum was recorded. The mixture gas was introduced to in situ IR cell at 350 °C with a speed of 2 mL/min. IR spectrum was recorded synchronously over 600 min with one scan per 2 min at a spectral resolution of 4 cm−1.

4. Conclusions

In this article, AHFS treatment was performed on HY zeolite to raise the Si/Al ratio. The effect of dealumination on textural properties and acidity was studied, and its effect on coke formation on Y zeolites in butene cracking was further explored.
The results show: (1) AHFS treatment could be used to perform dealumination on HY zeolite and effectively adjust the acidity. With the increase of AHFS concentration, the degree of dealumination increases, which leads to the decrease of acid density and the change of B/L acid ratio. The Brønsted acid inside supper cages increased and the utilization of total Brønsted acid also increased. (2) The rate of coke formation is influenced by acid density. With the decrease of acid density, the rate of coke deposition is decreasing. However, when the acid density is close, it was the acid strength that determines the rate of coke formation, which means the stronger the acid strength is the faster the coke formation is. (3) With the increase of dealumination degree, the most probable distribution peak of mesoporous pore size of the zeolites broadened, and the mesoporous pore volume further increases, which improves the diffusion property of the zeolites and greatly enhances the resistance to coke deposition.

Supplementary Materials

The following supporting information can be downloaded at: https://www.mdpi.com/article/10.3390/catal12060640/s1, Figure S1: Nitrogen adsorption–desorption isotherms of the modified and parent zeolites; Figure S2: Pore size distributions of the modified and parent zeolites; Figure S3: TPD spectra of parent HY and ammonium hexafluorosilicate modified zeolites; Figure S4: IR spectra of the ammonium hexafluorosilicate modified zeolites hydroxy groups; Figure S5: Intensity of the ammonium hexafluorosilicate modified zeolites HF and LF bands; Figure S6: The ammonium hexafluorosilicate modified zeolites linearly fitting curve of pyridine coverage in Brønsted; Figure S7: The ammonium hexafluorosilicate modified zeolites hydroxyl groups characterization during the coke formation reaction; Figure S8: Coke formation rate of ammonium hexafluorosilicate modified zeolites; Figure S9. (a) The fitting curve and linear equation of SSY-1. (b) The fitting curve and linear equation of SSY-2. (c) The fitting curve and linear equation of SSY-3. (d) The fitting curve and linear equation of SSY-4.; Figure S10. (a) The fitting curve and linear equation of SSY-1. (b) The fitting curve and linear equation of SSY-2. (c) The fitting curve and linear equation of SSY-3. (d) The fitting curve and linear equation of SSY-4.; Table S1: Textural properties of the modified and parent zeolites; Table S2: The structural properties of the modified and parent zeolites; Table S3: Acidic properties of ammonium hexafluorosilicate modified zeolites; Table S4: The ammonium hexafluorosilicate modified zeolites Ed value obtained from the slope of the best-fitting curve; Table S5. The R-squared value calculation of ammonium hexafluorosilicate modified zeolites with pyridine desorption reaction order 1, 2 and 3 respectively. A calculation method of the desorption rate of pyridine. A calculation method of extra-framework Al concentration of per unit cell. A calculation method of B acid sites concentration [28,29,30,34].

Author Contributions

Conceptualization, X.L.; methodology, X.L. and C.W.; software, X.L. and L.Z.; validation, L.Z., C.X. and J.G.; formal analysis, X.L.; investigation, X.L. and C.W.; resources, X.L.; data curation, X.L.; writing—original draft preparation, X.L.; writing—review and editing, C.W.; visualization, C.W.; supervision, L.Z.; project administration, C.X.; funding acquisition, J.G. and L.Z. All authors have read and agreed to the published version of the manuscript.

Funding

This research was funded by the [National Natural Science Foundation of China] grant number [21838011, 22021004] and [National Key Research and Development Program of China] grant number [2020YFA0210900].

Data Availability Statement

The data presented in this study are available on request from the corresponding author. The data are not publicly available due to them containing information that could compromise research participant privacy/consent.

Acknowledgments

The authors would like to thank National Natural Science Foundation of China and National Key Research and Development Program of China for financial support.

Conflicts of Interest

The authors declare no conflict of interest.

References

  1. Fukudome, K.; Suzuki, T. Highly Selective Oxidative Dehydrogenation of Propane to Propylene over VOx–SiO2 Catalysts. Catal. Surv. Asia 2015, 19, 172–187. [Google Scholar] [CrossRef]
  2. Agency, I.E. The future of petrochemicals. 2018. Available online: https://www.iea.org/reports/the-future-of-petrochemicals (accessed on 29 April 2022).
  3. Sheng, J.; Yan, B.; Lu, W.-D.; Qiu, B.; Gao, X.-Q.; Wang, D.; Lu, A.-H. Oxidative dehydrogenation of light alkanes to olefins on metal-free catalysts. Chem. Soc. Rev. 2021, 50, 1438–1468. [Google Scholar] [CrossRef] [PubMed]
  4. Gao, X.; Xu, W.; Li, X.; Cen, J.; Xu, Y.; Lin, L.; Yao, S. Non-oxidative dehydrogenation of propane to propene over Pt-Sn/Al2O3 catalysts: Identification of the nature of active site. Chem. Eng. J. 2022, 443, 136393. [Google Scholar] [CrossRef]
  5. Kogan, S.B.; Herskowitz, M. Selective propane dehydrogenation to propylene on novel bimetallic catalysts. Catal. Commun. 2001, 2, 179–185. [Google Scholar] [CrossRef]
  6. Del Campo, P.; Martínez, C.; Corma, A. Activation and conversion of alkanes in the confined space of zeolite-type materials. Chem. Soc. Rev. 2021, 50, 8511–8595. [Google Scholar] [CrossRef]
  7. Li, Z.; Shi, W.; Wang, X.; Jiang, F. Deep Catalytic Cracking Process for Light-Olefins Production. In Fluid Catalytic Cracking III; American Chemical Society: Washington, DC, USA, 1994; Volume 571, pp. 33–42. [Google Scholar]
  8. Eschenbacher, A.; Varghese, R.J.; Delikonstantis, E.; Mynko, O.; Goodarzi, F.; Enemark-Rasmussen, K.; Oenema, J.; Abbas-Abadi, M.S.; Stefanidis, G.D.; Van Geem, K.M. Highly selective conversion of mixed polyolefins to valuable base chemicals using phosphorus-modified and steam-treated mesoporous HZSM-5 zeolite with minimal carbon footprint. Appl. Catal. B Environ. 2022, 309, 121251. [Google Scholar]
  9. Zhu, X.; Liu, S.; Song, Y.; Xu, L. Catalytic cracking of C4 alkenes to propene and ethene: Influences of zeolites pore structures and Si/Al2 ratios. Appl. Catal. A Gen. 2005, 288, 134–142. [Google Scholar] [CrossRef]
  10. Chen, S.; Manos, G. Study of Coke and Coke Precursors During Catalytic Cracking of n-Hexane and 1-Hexene over Ultrastable Y Zeolite. Catal. Lett. 2004, 96, 195–200. [Google Scholar] [CrossRef]
  11. Groten, W.A.; Wojciechowski, B.W.; Hunter, B.K. On the relationship between coke formation chemistry and catalyst deactivation. J. Catal. 1992, 138, 343–350. [Google Scholar] [CrossRef]
  12. Quintana-Solórzano, R.; Thybaut, J.W.; Marin, G.B. Catalytic cracking and coking of (cyclo)alkane/1-octene mixtures on an equilibrium catalyst. Appl. Catal. A Gen. 2006, 314, 184–199. [Google Scholar] [CrossRef]
  13. Shi, Z.C.; Arora, S.S.; Trahan, D.W.; Hickman, D.; Bhan, A. Methanol to hydrocarbons conversion: Why dienes and monoenes contribute differently to catalyst deactivation? Chem. Eng. J. 2022, 437, 12. [Google Scholar] [CrossRef]
  14. Wang, B.; Gong, X.; Zhang, Z.; Zhu, Q.; He, W. Modelling and understanding deposit formation of hydrocarbon fuels from the coke characteristics. Fuel 2022, 319, 123745. [Google Scholar] [CrossRef]
  15. Zhao, G.; Teng, J.; Xie, Z.; Jin, W.; Yang, W.; Chen, Q.; Tang, Y. Effect of phosphorus on HZSM-5 catalyst for C4-olefin cracking reactions to produce propylene. J. Catal. 2007, 248, 29–37. [Google Scholar] [CrossRef]
  16. Zhang, R.; Wang, Z. Catalytic cracking of 1-butene to propylene by Ag modified HZSM-5. Chin. J. Chem. Eng. 2015, 23, 1131–1137. [Google Scholar] [CrossRef]
  17. Lin, L.; Qiu, C.; Zhuo, Z.; Zhang, D.; Zhao, S.; Wu, H.; Liu, Y.; He, M. Acid strength controlled reaction pathways for the catalytic cracking of 1-butene to propene over ZSM-5. J. Catal. 2014, 309, 136–145. [Google Scholar] [CrossRef]
  18. Zhu, X.; Liu, S.; Song, Y.; Xie, S.; Xu, L. Catalytic cracking of 1-butene to propene and ethene on MCM-22 zeolite. Appl. Catal. A Gen. 2005, 290, 191–199. [Google Scholar] [CrossRef]
  19. Liu, B.; Xie, K.; Oh, S.C.; Sun, D.; Fang, Y.; Xi, H. Direct synthesis of hierarchical USY zeolite for retardation of catalyst deactivation. Chem. Eng. Sci. 2016, 153, 374–381. [Google Scholar] [CrossRef]
  20. Cañizares, P.; Carrero, A. Dealumination of ferrierite by ammonium hexafluorosilicate treatment: Characterization and testing in the skeletal isomerization of n-butene. Appl. Catal. A Gen. 2003, 248, 227–237. [Google Scholar] [CrossRef]
  21. Wang, Q.L.; Torrealba, M.; Giannetto, G.; Guisnet, M.; Perot, G.; Cahoreau, M.; Caisso, J. Dealumination of Y zeolite with ammonium hexafluorosilicate: A SIMS-XPS study of the aluminum distribution. Zeolites 1990, 10, 703–706. [Google Scholar] [CrossRef]
  22. Shertukde, P.V.; Hall, W.K.; Marcelin, G. Effect of dealumination of the structure and acidity of H-Y zeolites. Catal. Today 1992, 15, 491–502. [Google Scholar] [CrossRef]
  23. Rouquerol, F.; Rouquerol, J.; Sing, K. Adsorption by Powders and Porous Solids; Academic Press: San Diego, CA, USA, 1999. [Google Scholar]
  24. Gautier, M.; Muller, F.; Le Forestier, L.; Beny, J.M.; Guegan, R. NH4-smectite: Characterization, hydration properties and hydro mechanical behaviour. Appl. Clay Sci. 2010, 49, 247–254. [Google Scholar] [CrossRef] [Green Version]
  25. Qin, Z.; Shen, B.; Yu, Z.; Deng, F.; Zhao, L.; Zhou, S.; Yuan, D.; Gao, X.; Wang, B.; Zhao, H.; et al. A defect-based strategy for the preparation of mesoporous zeolite Y for high-performance catalytic cracking. J. Catal. 2013, 298, 102–111. [Google Scholar] [CrossRef]
  26. Zhang, Z.; Wang, Q.; Chen, H.; Zhang, X. Hydroconversion of waste cooking oil into green biofuel over hierarchical USY-supported NiMo catalyst: A comparative study of desilication and dealumination. Catalysts 2017, 7, 281. [Google Scholar] [CrossRef] [Green Version]
  27. Matharu, A.P.; Gladden, L.F.; Carr, S.W. Characterization and catalytic properties of dealuminated zeolite-Y: A comparison of ammonium hexafluorosilicate and hydrothermal treatments. Stud. Surf. Sci. Catal. 1995, 94, 147–154. [Google Scholar]
  28. Gola, A.; Rebours, B.; Milazzo, E.; Lynch, J.; Benazzi, E.; Lacombe, S.; Delevoye, L.; Fernandez, C. Effect of leaching agent in the dealumination of stabilized Y zeolites. Microporous Mesoporous Mater. 2000, 40, 73–83. [Google Scholar] [CrossRef]
  29. Pu, X.; Liu, N.-w.; Shi, L. Acid properties and catalysis of USY zeolite with different extra-framework aluminum concentration. Microporous Mesoporous Mater. 2015, 201, 17–23. [Google Scholar] [CrossRef]
  30. Katada, N.; Miyamoto, T.; Begum, H.A.; Naito, N.; Niwa, M.; Matsumoto, A.; Tsutsumi, K. Strong Acidity of MFI-Type Ferrisilicate Determined by Temperature-Programmed Desorption of Ammonia. J. Phys. Chem. B 2000, 104, 5511–5518. [Google Scholar] [CrossRef]
  31. Montanari, T.; Finocchio, E.; Busca, G. Infrared Spectroscopy of Heterogeneous Catalysts: Acidity and Accessibility of Acid Sites of Faujasite-Type Solid Acids. J. Phys. Chem. C 2011, 115, 937–943. [Google Scholar] [CrossRef]
  32. Corma, A.; Fornes, V.; Rey, F. Quinoline as a probe molecule for determination of external Broensted and Lewis acidity in zeolites. Zeolites 1993, 13, 56–59. [Google Scholar] [CrossRef]
  33. Corma, A.; Melo, F.V.; Rawlence, D.J. Effect of the nonuniform dealumination on the acidity and catalytic activity of faujasite. Zeolites 1990, 10, 690–694. [Google Scholar] [CrossRef]
  34. King, D.A. Thermal desorption from metal surfaces. Review. Surf. Sci. 1975, 47, 384–402. [Google Scholar] [CrossRef]
  35. Quanzhi, L.; Ruiming, Z.; Zhiyuan, X. Studies on the Surface Acidity of HY Zeolite by Combined IR and TPD. Stud. Surf. Sci. Catal. 1986, 28, 487–494. [Google Scholar]
  36. Karge, H.G.; Nießen, W.; Bludau, H. In-situ FTIR measurements of diffusion in coking zeolite catalysts. Appl. Catal. A Gen. 1996, 146, 339–349. [Google Scholar] [CrossRef]
  37. Caeiro, G.; Lopes, J.M.; Magnoux, P.; Ayrault, P.; Ribeiro, F.R. A FT-IR study of deactivation phenomena during methylcyclohexane transformation on H-USY zeolites: Nitrogen poisoning, coke formation, and acidity-activity correlations. J. Catal. 2007, 249, 234–243. [Google Scholar] [CrossRef]
  38. Wang, B.; Zhang, Y.; Guo, G.S. In situ FTIR study of methanol to hydrocarbons conversion process on HZSM-5 zeolite. Adv. Mater. Res. 2011, 236–238, 958–963. [Google Scholar] [CrossRef]
  39. Mosqueda-Jimenez, B.I.; Jentys, A.; Seshan, K.; Lercher, J.A. On the surface reactions during NO reduction with propene and propane on Ni-exchanged mordenite. Appl. Catal. B-Environ. 2003, 46, 189–202. [Google Scholar] [CrossRef]
  40. Delara, E.C.; Kahn, R.; Seloudoux, R. Effect of an electric-field on a methane molecule. 1. infrared-analysis of methane (CH4-CD4) adsorbed in NaA zeolite in the temperature-range 150-20-K. J. Chem. Phys. 1985, 83, 2646–2652. [Google Scholar] [CrossRef]
  41. Li, L.; Gao, J.; Xu, C.; Meng, X. Reaction behaviors and mechanisms of catalytic pyrolysis of C4 hydrocarbons. Chem. Eng. J. 2006, 116, 155–161. [Google Scholar] [CrossRef]
  42. Kim, Y.H.; Lee, K.H.; Lee, J.S. The effect of pre-coking and regeneration on the activity and stability of Zn/ZSM-5 in aromatization of 2-methyl-2-butene. Catal. Today 2011, 178, 72–78. [Google Scholar] [CrossRef]
  43. Sahoo, S.K.; Viswanadham, N.; Ray, N.; Gupta, J.K.; Singh, I.D. Studies on acidity, activity and coke deactivation of ZSM-5 during n-heptane aromatization. Appl. Catal. A: Gen. 2001, 205, 1–10. [Google Scholar] [CrossRef]
  44. Boveri, M.; Márquez-Álvarez, C.; Laborde, M.Á.; Sastre, E. Steam and acid dealumination of mordenite: Characterization and influence on the catalytic performance in linear alkylbenzene synthesis. Catal. Today 2006, 114, 217–225. [Google Scholar] [CrossRef]
  45. Agudelo, J.L.; Mezari, B.; Hensen, E.J.M.; Giraldo, S.A.; Hoyos, L.J. On the effect of EDTA treatment on the acidic properties of USY zeolite and its performance in vacuum gas oil hydrocracking. Appl. Catal. A Gen. 2014, 488, 219–230. [Google Scholar] [CrossRef]
  46. Garralon, G.; Fornes, V.; Corma, A. Faujasites dealuminated with ammonium hexafluorosilicate: Variables affecting the method of preparation. Zeolites 1988, 8, 268–272. [Google Scholar] [CrossRef]
  47. Kuehne, M.A.; Babitz, S.M.; Kung, H.H.; Miller, J.T. Effect of framework Al content on HY acidity and cracking activity. Appl. Catal. A 1998, 166, 293–299. [Google Scholar] [CrossRef]
  48. Lonyi, F.; Lunsford, J.H. The development of strong acidity in hexafluorosilicate-modified Y-type zeolites. J. Catal. 1992, 136, 566–577. [Google Scholar] [CrossRef]
  49. Le Bail, A.; Duroy, H.; Fourquet, J.L. The ab-initio structure determination of lithium antimony tungstate (LiSbWO6) by x-ray powder diffraction. Mater. Res. Bull. 1988, 23, 447–452. [Google Scholar] [CrossRef]
  50. Sohn, J.R.; DeCanio, S.J.; Lunsford, J.H.; O’Donnell, D.J. Determination of framework aluminum content in dealuminated Y-type zeolites: A comparison based on unit cell size and wavenumber of IR bands. Zeolites 1986, 6, 225–227. [Google Scholar] [CrossRef]
  51. Breck, D.W. Zeolite Molecular Sieves: Structure, Chemistry and Use; Interscience-Wiley: New York, NY, USA, 1974; 771p. [Google Scholar]
  52. Cherkasov, N.; Vazhnova, T.; Lukyanov, D.B. Quantitative infra-red studies of Brønsted acid sites in zeolites: Case study of the zeolite mordenite. Vib. Spectrosc. 2016, 83, 170–179. [Google Scholar] [CrossRef]
Figure 1. Nitrogen adsorption–desorption isotherms of the modified and parent zeolites.
Catalysts 12 00640 g001
Figure 2. Pore size distributions of the modified and parent zeolites.
Catalysts 12 00640 g002
Figure 3. TPD spectra of parent HY and ammonium hexafluorosilicate modified zeolites.
Catalysts 12 00640 g003
Figure 4. IR spectra of the ammonium hexafluorosilicate modified zeolites hydroxy groups.
Catalysts 12 00640 g004
Figure 5. Intensity of the ammonium hexafluorosilicate modified zeolites HF and LF bands. HF: the high frequency band at 3630 cm−1. LF: the low frequency band at 3550 cm−1.
Catalysts 12 00640 g005
Figure 6. The ammonium hexafluorosilicate modified zeolites linearly fitting curve of pyridine coverage in Brønsted.
Catalysts 12 00640 g006
Figure 7. The ammonium hexafluorosilicate modified zeolites hydroxyl groups characterization during the coke formation reaction.
Catalysts 12 00640 g007
Figure 8. Coke formation rate of ammonium hexafluorosilicate modified zeolites.
Catalysts 12 00640 g008
Table 1. Textural properties of the modified and parent zeolites.
SampleSmicro aSext bVmicro cVmeso d
m2/gm2/gcm3/gcm3/g
HY605460.300.04
SSY-1608490.300.06
SSY-2566520.280.07
SSY-3504600.250.10
SSY-4420740.210.14
a t-plot micropore area. b t-plot external surface. c t-plot micropore volume. d Mesopore volume (Vtotal–Vmicro), Vtotal is total pore volume test at p/p0 = 0.99.
Table 2. The structural properties of the modified and parent zeolites.
Samplea0 (Å)Crystallinity%Framework
Si/Al Ratio
Global
Si/Al Ratio
Total
Al
Framework Al aExtra-Framework
Al b
B Acid Sites
(×10−4 mol/g)
HY24.6411003.0212.5505448643
SSY-124.582151.83.6603.7204141037
SSY-224.536162.54.3253.9053936332
SSY-324.492147.35.1454.5353531328
SSY-424.467126.25.7555.4953028125
a Framework Al was obtained by X-ray diffraction (XRD) method. b Extra-framework was obtained from Equation S8 in supporting information.
Table 3. Acidic properties of ammonium hexafluorosilicate modified zeolites.
SampleAcid TypeTotal Acid Sites
(10−4 mol/g)
B/L RatioStrong Acid Sites
(10−4 mol/g)
Weak Acid Sites
(10−4 mol/g)
SSY-1Brønsted acid8.7162.2146.761.95
Lewis acid0.140.030.11
SSY-2Brønsted acid7.2518.135.371.88
Lewis acid0.400.150.25
SSY-3Brønsted acid6.4020.645.151.25
Lewis acid0.310.050.25
SSY-4Brønsted acid5.27173.611.66
Lewis acid0.310.140.17
Table 4. The ammonium hexafluorosilicate modified zeolites Ed value obtained from the slope of the best-fitting curve.
ZeoliteEd Strong (KJ/mol)Ed Weak (KJ/mol)
SSY-111.54.9
SSY-211.65.7
SSY-3158.2
SSY-420.410.9
Publisher’s Note: MDPI stays neutral with regard to jurisdictional claims in published maps and institutional affiliations.

