Article

Synthesis, Characterization, and Photocatalytic Investigation of CuFe2O4 for the Degradation of Dyes under Visible Light

by
Thayane Portela Oliveira
1,
Samuel Filgueiras Rodrigues
1,*,
Gleison Neres Marques
1,
Rayssa Cristina Viana Costa
2,
Charlyanne Gabriela Garçone Lopes
2,
Clodualdo Aranas, Jr.
3,
Alex Rojas
1,
José Hilton Gomes Rangel
2 and
Marcelo Moizinho Oliveira
1
1
Graduate Program in Materials Engineering, Federal Institute of Education, Science and Technology of Maranhão, São Luís 65075-441, Brazil
2
Graduate Program in Chemistry, Federal Institute of Education, Science and Technology of Maranhão, São Luís 65075-441, Brazil
3
Department of Mechanical Engineering, University of New Brunswick, Fredericton, NB E3B 5A3, Canada
*
Author to whom correspondence should be addressed.
Catalysts 2022, 12(6), 623; https://doi.org/10.3390/catal12060623
Submission received: 23 December 2021 / Revised: 30 May 2022 / Accepted: 4 June 2022 / Published: 6 June 2022
(This article belongs to the Special Issue Application of Photocatalysts in Environmental Chemistry)

Abstract

:
The CuFe2O4 photocatalysts were synthesized by the solution combustion synthesis method, followed by heat treatment at a temperature range of 400 to 1100 °C. Later, they were characterized for application in the photodegradation of synthetic dyes under visible radiation. The X-ray diffraction results showed the presence of cubic and tetragonal phases of CuFe2O4 and secondary phases of Fe2O3 and CuO, at low temperatures. The infrared spectrum profile confirms the formation of the phases pointed out in the XRD. For most specimens, the scanning electron microscopy examination revealed a morphology similar to porous flakes and a quasi-spherical shape. On the other hand, samples heat-treated at 1100 °C displayed a plate-like morphology. The specimens’ band gap ranged from 1.49 to 1.58 eV, indicating that the material is a semiconductor. Regarding the photocatalytic efficiency, the 400 °C heat-treated samples showed better activity when the visible irradiation was used over the green malachite and rhodamine B dyes. The solution degradation rates on the first and former dyes were 56.60% and 84.30%, respectively.

1. Introduction

Wastewater from industrial processes is considered too be a potential source of contamination to the environment due to its organic pollutants. Dyes are considered the main agents that cause this pollution due to their large-scale use in the cellulose, chemical, petrochemical, and dyeing industries [1,2]. Because they are potentially toxic and difficult to be degraded, dyes are considered as potential threats to human health and the ecosystem [3]. To solve these problems, photocatalysis presents itself as an essential mechanism for the degradation of organic pollutants, especially for those in wastewater [4]. Since this process involves a semiconductor that uses O2 from the atmosphere, it can therefore be considered as a green oxidizer [5].
When photocatalysts absorb visible or ultraviolet radiation, and the energy is greater than or equal to their bandgap, it promotes a jump of their electrons located in the valence band to the conduction band, leaving a space, also known as holes. Thus, electron–hole pairs are formed and are responsible for the direct decomposition of organic pollutants and the generation of reactive radicals that also contribute to degradation [6,7]. Materials that have surface hydroxyls present high adsorption, since the adsorption behavior can be influenced by natural surface defects such as hydroxyls and oxygen vacancies [8].
As for the use of visible light irradiation, there is a growing number of works that have employed this type of energy source in photocatalysis. This is due to the technique being less harmful and more sustainable compared to UV light. Guo et al. [9] produced a composite of CaWO4/Bi2WO6 with a bandgap of 2.84 eV. In their work, an effective photocatalytic activity under visible light irradiation in the degradation of rhodamine B (RhB) and 4-nitrophenol (4-NP) was possible due to the narrow spacing between bands and an effective separation of the electron–hole pairs. Later, they prepared an α-Fe2O3/Bi2WO6 composite with a high adsorption capacity and photocatalytic activity of acid red G and rhodamine B dyes by using visible light because its structure also presented adequate separation of the electron–hole pairs from the conduction band of the α-Fe2O3 to the conduction band of Bi2WO6 [10]. Shi et al. [11] found that irradiation with visible light could provide a higher rate of degradation and oxidation of atrazine through the Fenton process of Fe3S4. This is possible because the visible light promotes a higher ratio of Fe(II) and Fe(III) on the surface of Fe3S4 as well as on the redox effect of iron.
Iron-based semiconductor oxides have been shown to be promising materials for photocatalytic and photoelectrocatalytic applications, mainly in the areas of environmental remediation and the generation of solar fuel [12]. In the study conducted by Sun et al. [13], it was found that the Fe3O4/H2O2 system could remove allochlore by the Fenton process, which can be accelerated by AA through the redox cycle of iron on the surface of Fe3O4. Sun et al. [14] demonstrated that amorphous zero-valent iron (ZVI) has a high inactivation rate as well as good effectiveness in removing Escherichia coli bacteria from the aqueous medium because of more reactive oxygen species, mainly OH, which are produced by iron hydrolysis. Thus, materials that are composed of iron are considered as promising in water treatment due to the production of more reactive oxygen species. Hu et al. [15] produced zero valent iron oxalate with oxalic acid dihydrate with a high Cr(VI) removal rate over a wide pH range by the action of a higher conductivity of protons generated by the incorporation of oxalic acid. Therefore, they found that the transfer of protons is a significant factor in the reactivity of iron to remove heavy metal ions. In the investigation by Xu et al. [16], the adsorption process and the photochemical performance of oxalic acid on the ferrihydrite surface was evaluated, and it was found that in the presence of visible light and dissolved oxygen, there was an efficient production of OH due to the reaction of Fe(II) and O2/•OOH, generated by the photolysis of Fe(II) and O2/•OOH, which provides an increase in the photochemical activity.
One of these compounds, ferrite, exhibits relevant magnetic, electrical, corrosion, and optical properties. Thermal and chemical stability in aqueous systems makes them suitable for several technological applications [17,18]. Copper ferrite (CuFe2O4), for example, is a semiconductor with an inverse spinel-type structure, and unlike other ferrites, it can present cubic and tetragonal structure phases. The last is stable at room temperature, whereas the cubic occurs at a temperature of 623 K [19]. The type of structure depends on the distribution of ions between the tetrahedral and octahedral sites. Among the other characteristics, copper ferrite has high thermal and photochemical stability, low cost, and low toxicity, with a narrow band spacing of around 1.5 eV [20,21]. Due to these characteristics, it can be a potential material for application in photocatalytic reactions using visible or solar light for the photodegradation of organic compounds and dyes in wastewater, mainly due to its narrow bandgap and magnetic behavior, which allows for its recovery after reaction [22]. Tasca et al. [23] conducted research on CuFe2O4, and found that the calcination temperature and chemical synthesis used to produce ferrite significantly influenced the distribution of cations in the spinel structure and properties of the crystal. The copper ferrite structure has also resulted from the synthesis and temperature method to the obtention of the phases [24,25].
Nowadays, to produce CuFe2O4, several methods have been considered. The most utilized ones are the solid-state reaction [23], co-precipitation [26], sol–gel [27], solvothermal [28], hydrothermal [29], and combustion [30]. It is worth highlighting the last method, synthesis combustion, which is a fast process, effective, and has a low cost for preparing several materials, mainly nanomaterials and catalysts [31]. Based on the thermodynamic concepts applied to propellants and explosives, synthesis combustion consists of a reaction in an aqueous solution that contains stoichiometric quantities of the precursors and a fuel [32,33]. The ratio between the oxidizer and reducer must be equal to 1 [34]. As reducers, organic fuels such as citric acid, glycine, and urea are generally used. Normally, these substances possess low decomposition temperature, in addition to low cost and easy accessibility [35,36]. The combustion reaction in solution occurs at high temperature, and the wide evolution of gases during the process provides a fine and porous morphology for the material as well as a high surface area and controlled composition [37]. Thus, combustion synthesis can be used in the production of nanomaterials with desirable characteristics to be used in photocatalysis.
In a previous study published by the research group, solution combustion synthesis was used to synthesize zinc ferrite (ZnFe2O4) with a band gap ranging between 1.74 and 1.92 eV, being used in the photocatalysis process under the irradiation of visible light to degrade synthetic dyes [38]. In order to evaluate the photocatalytic performance of a ferrite with a narrower band gap than ZnFe2O4, in the present study, CuFe2O4-based photocatalysts were prepared by the combustion reaction in solution using urea as the fuel at a temperature of 400 °C and the obtained ferrite reported here was inferior to that reported in the literature. Furthermore, results based on the structural and morphological change of the heat-treated samples over a wide temperature range from 400 to 1100 °C were discussed in parallel with their photocatalytic performance. Subsequently, the characterization of the powders produced was carried out using techniques such as X-ray diffraction (XRD), Fourier transform infrared spectroscopy (FTIR), scanning electron microscopy with electron emission by a field emission gun (SEM-FEG), transmission electron microscopy (TEM) and high-resolution transmission (HR-TEM), Brunauer–Emmett–Teller (BET), and diffuse UV–Vis reflectance spectroscopy (DRS). In the photocatalytic tests, malachite green and rhodamine B dyes were used as a reference to evaluate the photodegradation activity of the samples using visible light.

2. Materials and Methods

2.1. Preparation of Copper Ferrites

For the synthesis of CuFe2O4, 0.0209 mol of copper nitrate trihydrate [Cu(NO3)2·3H2O, 98%, Synth], 0.0417 mol of iron nitrate nonahydrate [Fe(NO3)3·9H2O, 99%, Sigma-Aldrich], and 0.139 mol of urea [CO(NH2)2, PA, Synth] were solubilized using 20 mL of deionized water in a porcelain capsule.
The solution was constantly stirred and heated to 70 °C until the formation of a gel. Then, the capsule was taken to a muffle oven at 400 °C for 10 min. After this process, the materials were de-agglomerated in an agate mortar and subjected to additional heat treatment at temperatures from 400 to 1100 °C for two hours, according to the flowchart shown in Figure 1.

2.2. Characterization

The X-ray diffraction (XRD) analysis was performed using a Shimadzu diffractometer (XRD 6000) with monochromatic copper Kα radiation (λ = 1.5406 Å) and operating at 40 kV and 30 mA, a step of 0.09°, counting time 0.14 s, and scanning angle ranging from 20 to 80°.
From the XRD data, the average crystal size of the CuFe2O4 samples was calculated using the Scherrer Equation (1).
D = 0.9 λ β cos θ
where D is the average diameter of the crystallites (nm); the Scherrer constant (0.9) when considering the spherical shape; λ is the wavelength of the X-ray radiation (nm); β is the width at half height (FWHM) of the peak with the highest intensity of diffraction in radians; and θ is the angle of the Bragg diffraction in degrees.
The infrared spectra were obtained by a Bruker spectrophotometer, model Equinox 55, in the region of 400 to 4000 cm−1. The scanning electron microscopy images with a field emission gun (SEM-FEG) were generated using an Inspect scanning electron microscope, model S50-FEI, with a 20 kV incident electron beam. Transmission electron microscopy (TEM) and high resolution transmission (HR-TEM) images were obtained using a FEI TECNAI F20 microscope (The Netherlands) operating at 200 kV.
The specific surface area and pore size distribution of each sample was obtained by the Brunauer—Emmett—Teller (BET) measurements through the Quanta chrome NOVA 2200 e equipment.
The optical properties were verified by UV–Vis diffuse reflectance spectroscopy (DRS) using a Cary 5 G spectrophotometer (Varian, Inc., Palo Alto, CA, USA) with a wavelength in the range of 200 to 800 nm and programmed to operate in diffuse reflectance mode.
The gap energy (Eg) of the samples was determined by using the UV–Vis spectra according to the Tauc equation.
( α h v ) = A ( h v E g ) n
where α represents the absorption coefficient; hv is the photon energy; A is the proportionality constant; Eg is the optical band gap and assuming n = 1/2 for direct allowed transition, n = 2 for indirect allowed transition. For copper ferrite, the electronic transition is directly allowed [39,40].

2.3. Photocatalytic Test

The photocatalytic activity of the CuFe2O4 samples was analyzed by discoloration solutions of the green malachite (Isofar) and rhodamine B (Isofar) dyes. Visible light irradiation was used from three complete spiral fluorescent lamps from the Taschibra brand at 25 W each.
The concentration of dyes in the solution was 20 ppm for the green malachite and 5 ppm for the rhodamine B. In the experiments, the photocatalyst amount was 0.02 g for 100 mL of the green malachite solution and 50 mL of rhodamine B. They were subjected to constant stirring in the dark for 30 min in a photocatalytic box to balance the adsorption/desorption. Subsequently, the solution was exposed to visible light irradiation for 1 h, and aliquots were removed at 10 min intervals, then centrifuged for 20 min at 300 rpm.
The discoloration process of the dye containing solutions was monitored by reading the highest peak intensity by utilizing a lambda XLS spectrophotometer from Perkin Elmer, at 617 nm for green malachite and 554 nm for rhodamine B. The photodegradation efficiency in the photocatalytic experiments was estimated by applying Equation (3).
D e g r a d a t i o n = ( 1 C C i ) × 100
where C and Ci are the initial and final absorbance of the solution, respectively.
The experimental data were used to determine the velocity constants and the half-life times to obtain the kinetic information of the photocatalytic tests with the CuFe2O4 samples. As the photocatalysis processes belong to the pseudo-first-order reactions, Equation (4) was used to calculate the velocity constants [30]:
ln C t C 0 = k t
where C0 is the initial concentration; Ct is the concentration over time; k is the velocity constant; and t represent the irradiation time. The speed constants were stipulated through the linearization of the obtained graph.
With the speed constant data, the half-life was calculated using Equation (5).
t 1 / 2 = ln 2 k
To analyze the photocatalysis mechanism, experiments were performed by employing sequesters of reactive species in the dye solution. Here, 0.0589 mL of tert-butyl alcohol (Neon, 99%) was used to confiscate -OH, 0.067 g of benzoquinone (Dynamic, 98%) to capture O2−, 0.1061 g of silver nitrate (METALMS, 63.5%) to eliminate e, and ammonium oxalate (Neon, 99%) to remove the h+ species [41].

3. Results and Discussion

3.1. XRD Analysis

The XRD patterns of the CuFe2O4 samples obtained from the combustion reaction method and heat-treated at different temperatures are shown in Figure 2. The diffraction peaks of the copper ferrite samples treated at 400, 500, and 600 °C correspond to the spinel cubic structure CuFe2O4 (JCPDS 077-0010) and specific Fe2O3 secondary phase peaks (JCPDS 089-0599). In samples treated at 700 and 800 °C, characteristic peaks related to the spinel of the CuFe2O4 tetragonal structure (JCPDS 034-0425) and the Fe2O3 phase (PDF 089-0599) could be observed. The patterns of the samples at 900 and 1000 °C indicate that the material presents a single phase with the diffraction peaks referring to the CuFe2O4 tetragonal spinel (PDF 034-0425). It is also observed that, as the temperature of the heat treatment is increased, the secondary phase disappears. The 1100 °C treated sample comprises the phases of CuFe2O4 (JCPDS 034-0425) with a tetragonal structure and CuO (JCPDS 089-2529). In short, what was observed is that the temperatures that the heat treatment employed considerably influenced the phase transition of the copper ferrite. As the temperature increased, the peaks became more evident, indicating that the compound’s crystallinity increased and the presence of metal oxide impurities significantly decreased [42].
Figure 3 shows the average crystallite size values of all samples. The results varied between 8.2 and 49.8 nm and agreed with those reported in the literature [42,43]. According to the table, it can be observed that when the heat treatment temperature increased, the average size of the crystals also increased. This medium indicates that the dimensions of the crystals were strongly dependent on the heat treatment temperature [40,44].

3.2. FTIR Analysis

Ferrites can be considered as crystals linked with their close neighbors either by ionic and covalent forces or by van der Waals bonds. In ferrites, their metal ions are located in two distinct subnets, which correspond to the tetrahedral (sites A) and octahedral (sites B) positions. This configuration is due to the geometric configuration of the closest neighbors to oxygen [45]. Thus, the two absorption bands representing the formation of ferrites were around 400 to 1000 cm−1 and correspond to the metal–oxygen bond located at the tetrahedral and octahedral sites [46].
The Fourier transformation infrared spectra of the CuFe2O4 samples calcined at 400 to 1100 °C are depicted in Figure 4. The two characteristic absorption bands can be seen at 630–580 and 480–400 cm−1. For the band that corresponds to the tetrahedral position, the values were 594, 586, 564, 597, 609, 609, 622, and 603 cm−1, respectively, which were verified in all of the analyzed samples. For the band that corresponded to the octahedral position, the observed values were 496, 469, 465, 426, 439, 438, 426, and 425 cm−1, respectively.
The variation in the absorption band position in the tetrahedral and octahedral sites occurred due to the different values referring to the length of the Fe(Cu)–O bond [47]. Patil et al. [33] also observed the displacement of the absorption band in the spinel-type ferrite according to the cation and phase transformation redistribution. The band at 1352 cm−1 can be related to NO3 vibration, referring to the residual nitrate groups of the metal nitrates [48].
The absorption band around 3400 cm−1 corresponded to the way of stretching of the H2O molecules and OH groups. At approximately 1600 cm−1, the band corresponded to the flexion of the H2O molecules [49].

3.3. SEM-FEG Analysis

The SEM-FEG images for the CuFe2O4 samples are displayed in Figure 5. Through the micrographs of the copper ferrite samples, heat-treated at 400 to 1000 °C, agglomerates composed of several almost spherical particles in the form of flakes were observed. The porous structure of the material is mainly related to the combustion synthesis in solution [50]. As the temperature increased, the particles increased and tended to clump together, as evidenced in the images. This behavior is related to the growth of the grains and attributed to the heat treatment [51]. However, at 1100 °C calcined for 3 h (Figure 5A–H), the morphology changed to plate shape, indicating a phase transformation, as displayed by the XRD results (see Figure 1).

3.4. TEM (HRTEM) Analysis

The TEM image of the sample calcined at 400 and 1000 °C is shown in Figure 6A,C, respectively. It can be seen that the nanoparticles had an almost spherical shape, as shown by the SEM images. As shown in Figure 6B,C the material had different sets of lattice fringes that, according to the interplanar spacings, corresponded to the planes (311), (111), (310), and (440) of ferrite and hematite [52].

3.5. BET Analysis

The surface area and the pore size distribution of the samples calcined at 400 and 1100 °C can be seen in Figure 7A,B, and it can be seen that the samples presented a type IV isotherm that corresponded to mesopores [53]. In Figure 6B, the pore size distribution is shown, using the BJH method in the analysis. The surface area, pore diameter, and pore volume are shown in Table 1. The sample calcined at 400 °C had a surface area of 184.400 m2/g, while that of 1100 °C was 3.989 m2/g. This area difference can be attributed to less pore formation at higher temperatures as a result of the rapid conversion rate of oxides in the synthesized material [54].

3.6. DRS Analysis

Figure 8 presents the graphs to estimate the bandgap energies and the UV–Vis spectra of the CuFe2O4 samples. The obtained values for the gap energy were around 1.49 to 1.58 eV. Different parameters can affect the band gap such as crystallite size, lattice parameter, and the presence of impurities as well as an increase in the calcination temperature as it caused an increase in the particle size and a decrease in the lattice parameters of the structure [55]. A similar behavior to the band gap was reported in the study on porous TiO2 airgels [56]. Thus, the light absorption occurred at wavelengths greater than 600 nm, indicating that the powders could effectively absorb light in the visible spectra. Absorption in the visible region may be associated with the transition of electrons from the O-2p level (valence band) to the Fe-3d level (conduction band). Thus, ferrites are activated by visible light radiation [57,58]. The found gap energy values for the samples were lower than the reported ones in the literature obtained by combustion in solution, which is equivalent to 1.90–2.15 eV [49,51]. Table 2 shows the comparison of the gap values and copper ferrite efficiency obtained in this study with others produced in different studies using the same synthesis technique and irradiation source (more on these discussions are presented below).

3.7. Photocatalytic Tests

The susceptibility of copper ferrite to visible light in the photocatalysis process was analyzed with the malachite green and rhodamine B dyes. The absorbance spectra of the malachite green solution with the photocatalyst and photolysis are shown in Figure 9.
The adsorption of the dye by the photocatalysts was evaluated during the adsorption/desorption equilibrium time without visible irradiation. The adsorption and the photocatalytic activity were detected due to the peak reduction in the dye absorption over time. The photocatalytic performance of the samples was reduced as the heat treatment temperature increased.
The efficiency and reaction kinetics graphs are displayed in Figure 10 and show the results of the photocatalysis tests.
The corresponding values to the kinetic constant, half-life, and the percentage of discoloration of the solution with the green malachite dye are shown in Table 3. Here, the photocatalytic behavior of the CuFe2O4 photocatalysts can be well verified.
The kinetic constant of the photocatalyst calcined at 400 °C was 1.4 × 10⁻² min−1 and the half-life was 0.49 min, while for the highest temperature of 1100 °C, it was 0.42 × 10⁻² min−1 and 1.65 min. A higher temperature of the employed heat treatment led to the constant kinetic decreasing and the half-life increasing. The same behavior can be observed when related to the solution’s discoloration percentage, which was 56.60% for 400 °C and 20.53% for 1100 °C. Thus, the order of efficiency of the photocatalysts was 400 > 500 > 600 > 700 > 800 > 900 > 1000 > 1100 °C.
According to the data, the 400 °C sample had a higher photocatalytic performance, which may be associated with the smaller size of the crystallite. The growth of the crystals during heat treatment led to more significant sizes, decreasing the number of active sites on the surface, causing the reduction in the photocatalytic activity in the material [59]. Secondary phases should also be considered as a factor that can influence the photocatalytic activity of the samples such as CuO and Fe2O3. The presence of Fe2O3 decreased the recombination of the charge carriers and improved the photocatalytic activity. When comparing the α-Fe2O3 and CuO phases, copper oxide had a smaller bandgap and could be excited by lower energy [58,59,60].
In the photocatalytic degradation experiments with rhodamine B, the same conditions applied to the green malachite were used. Figure 11 shows the changes in the UV–Vis spectrum at the highest absorbance peak (550 nm) of the dye over time in solution with the photocatalyst and photolysis.
The photocatalysts promoted the adsorption of rhodamine B, although less than that of the test with green malachite. All samples showed the degradation capacity of the dyes. With the increase in the irradiation time, the absorption peaks corresponding to the dye reduced progressively and decreased with time [61,62].
Figure 12 shows the photodegradation efficiency of the samples and the kinetics graph of the reaction of the tests when using visible light as a source of irradiation. Table 4 shows the values of the kinetic constants, half-life, and percentage of degradation of the dye in the solution of the photocatalysts.
The rhodamine B solution degradation rate was 84.30% for the 400 °C sample, with a kinetic constant of 2.3 × 10⁻² min−1 and a half-life of 0.30 min. For the thermally treated photocatalyst at 1100 °C, the rate reached about 7.98%, the constant about 0.13 × 10⁻² min−1, and the half time was 5.33 min. It was verified that the photocatalytic performance also decreased as the heat treatment temperature increased.
Therefore, the 400 °C sample showed greater photocatalytic efficiency than the other CuFe2O4 samples treated at higher temperatures in the two photocatalytic degradation experiments. As for the dyes, green malachite was more adsorbed by the photocatalysts than by rhodamine B. However, the degradation of the solution with rhodamine B dye was more remarkable than with green malachite when using the calcined photocatalyst at 400 °C; the kinetic constant was 1.4 × 10⁻² and 2.3 × 10⁻² min−1 for green malachite and rhodamine B, respectively. This difference can be related to the molecular structure of the organic dyes.

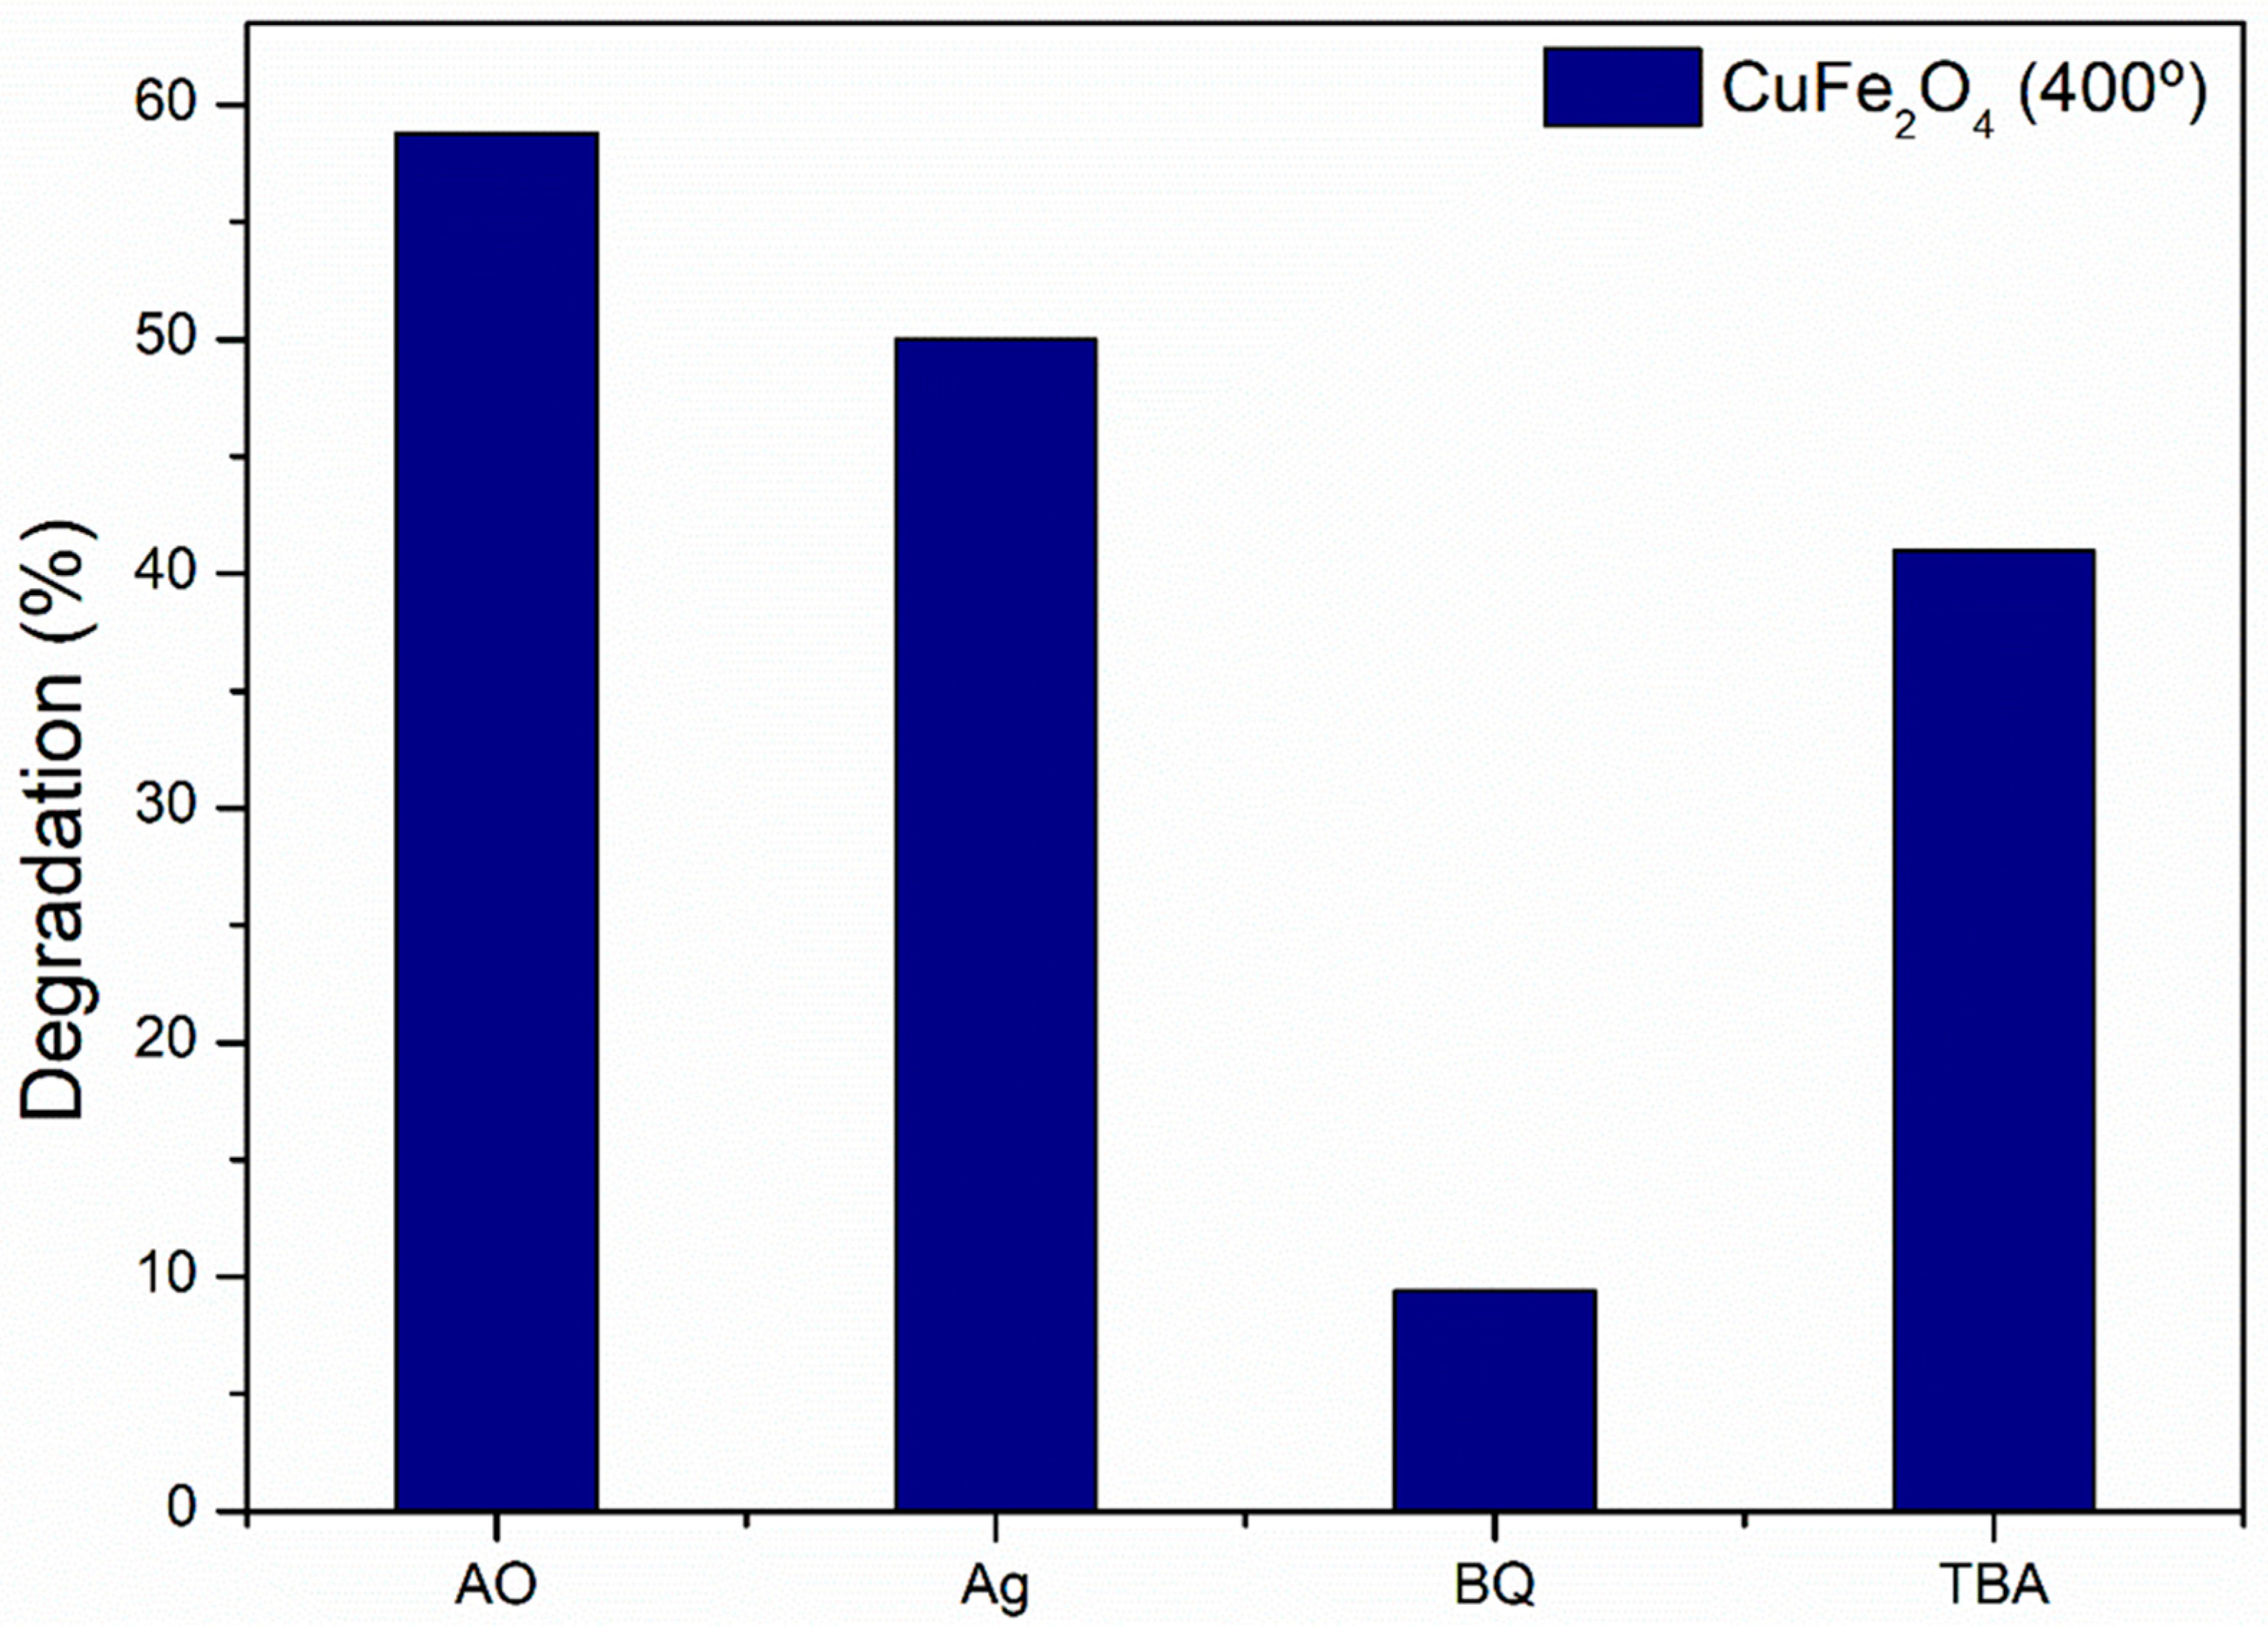
3.8. Photocatalytic Mechanism of CuFe2O4

To indicate the reaction mechanism, photocatalytic tests were carried out with the use of hijacker reactive species. The 400 °C sample was used in the experiments due to its significant photocatalytic performance when compared to the other heat-treated samples and the green malachite dye was employed. Figure 13 shows the obtained results. It can be seen that when adding BQ (benzoquinone) and TBA (tert-butyl alcohol) to the photocatalytic test, the degradation of green malachite by CuFe2O4 presented a reduction. This points out that the reactive species that predominate in the photodegradation reaction are superoxide (O2−) and hydroxyl (•OH) while the other hole (h+) and electron (e) species have less influence on the process.
The photocatalytic degradation mechanism of rhodamine B and green malachite dyes are shown in Figure 14. The photocatalysis process starts when the solution with the dye and the photocatalyst is exposed to a light irradiation source, in the case of visible light. With the irradiation, the electrons in the semiconductor are excited and move from the valence band (VB) to the conduction band (CB), generating holes in the BV. The electrons and holes are responsible for the active species formation, which are fundamental in photodegradation. The electrons present in CB can react with the oxygen adsorbed in the environment and provide superoxide, while the holes in the VB with the water produce hydroxyl. These formed species are highly reactive and in contact with the dye molecules lead to the degradation of these dyes [63]. The following equations can represent the degradation process.
CuFe 2 O 4 + h v   e + h + ,
CuFe2O4 (e) + O2 → O2,
CuFe2O4 (h+) + H2O → •OH,
Rhodamine B/Malachite green dye + O2/•OH = Discoloration,

4. Conclusions

The combustion reaction in the solution method was used to synthesize the CuFe2O4 photocatalysts that were heat-treated at 400 to 1100 °C and later used in photocatalysis. Based on the experimental results, the following conclusions can be drawn:
1.
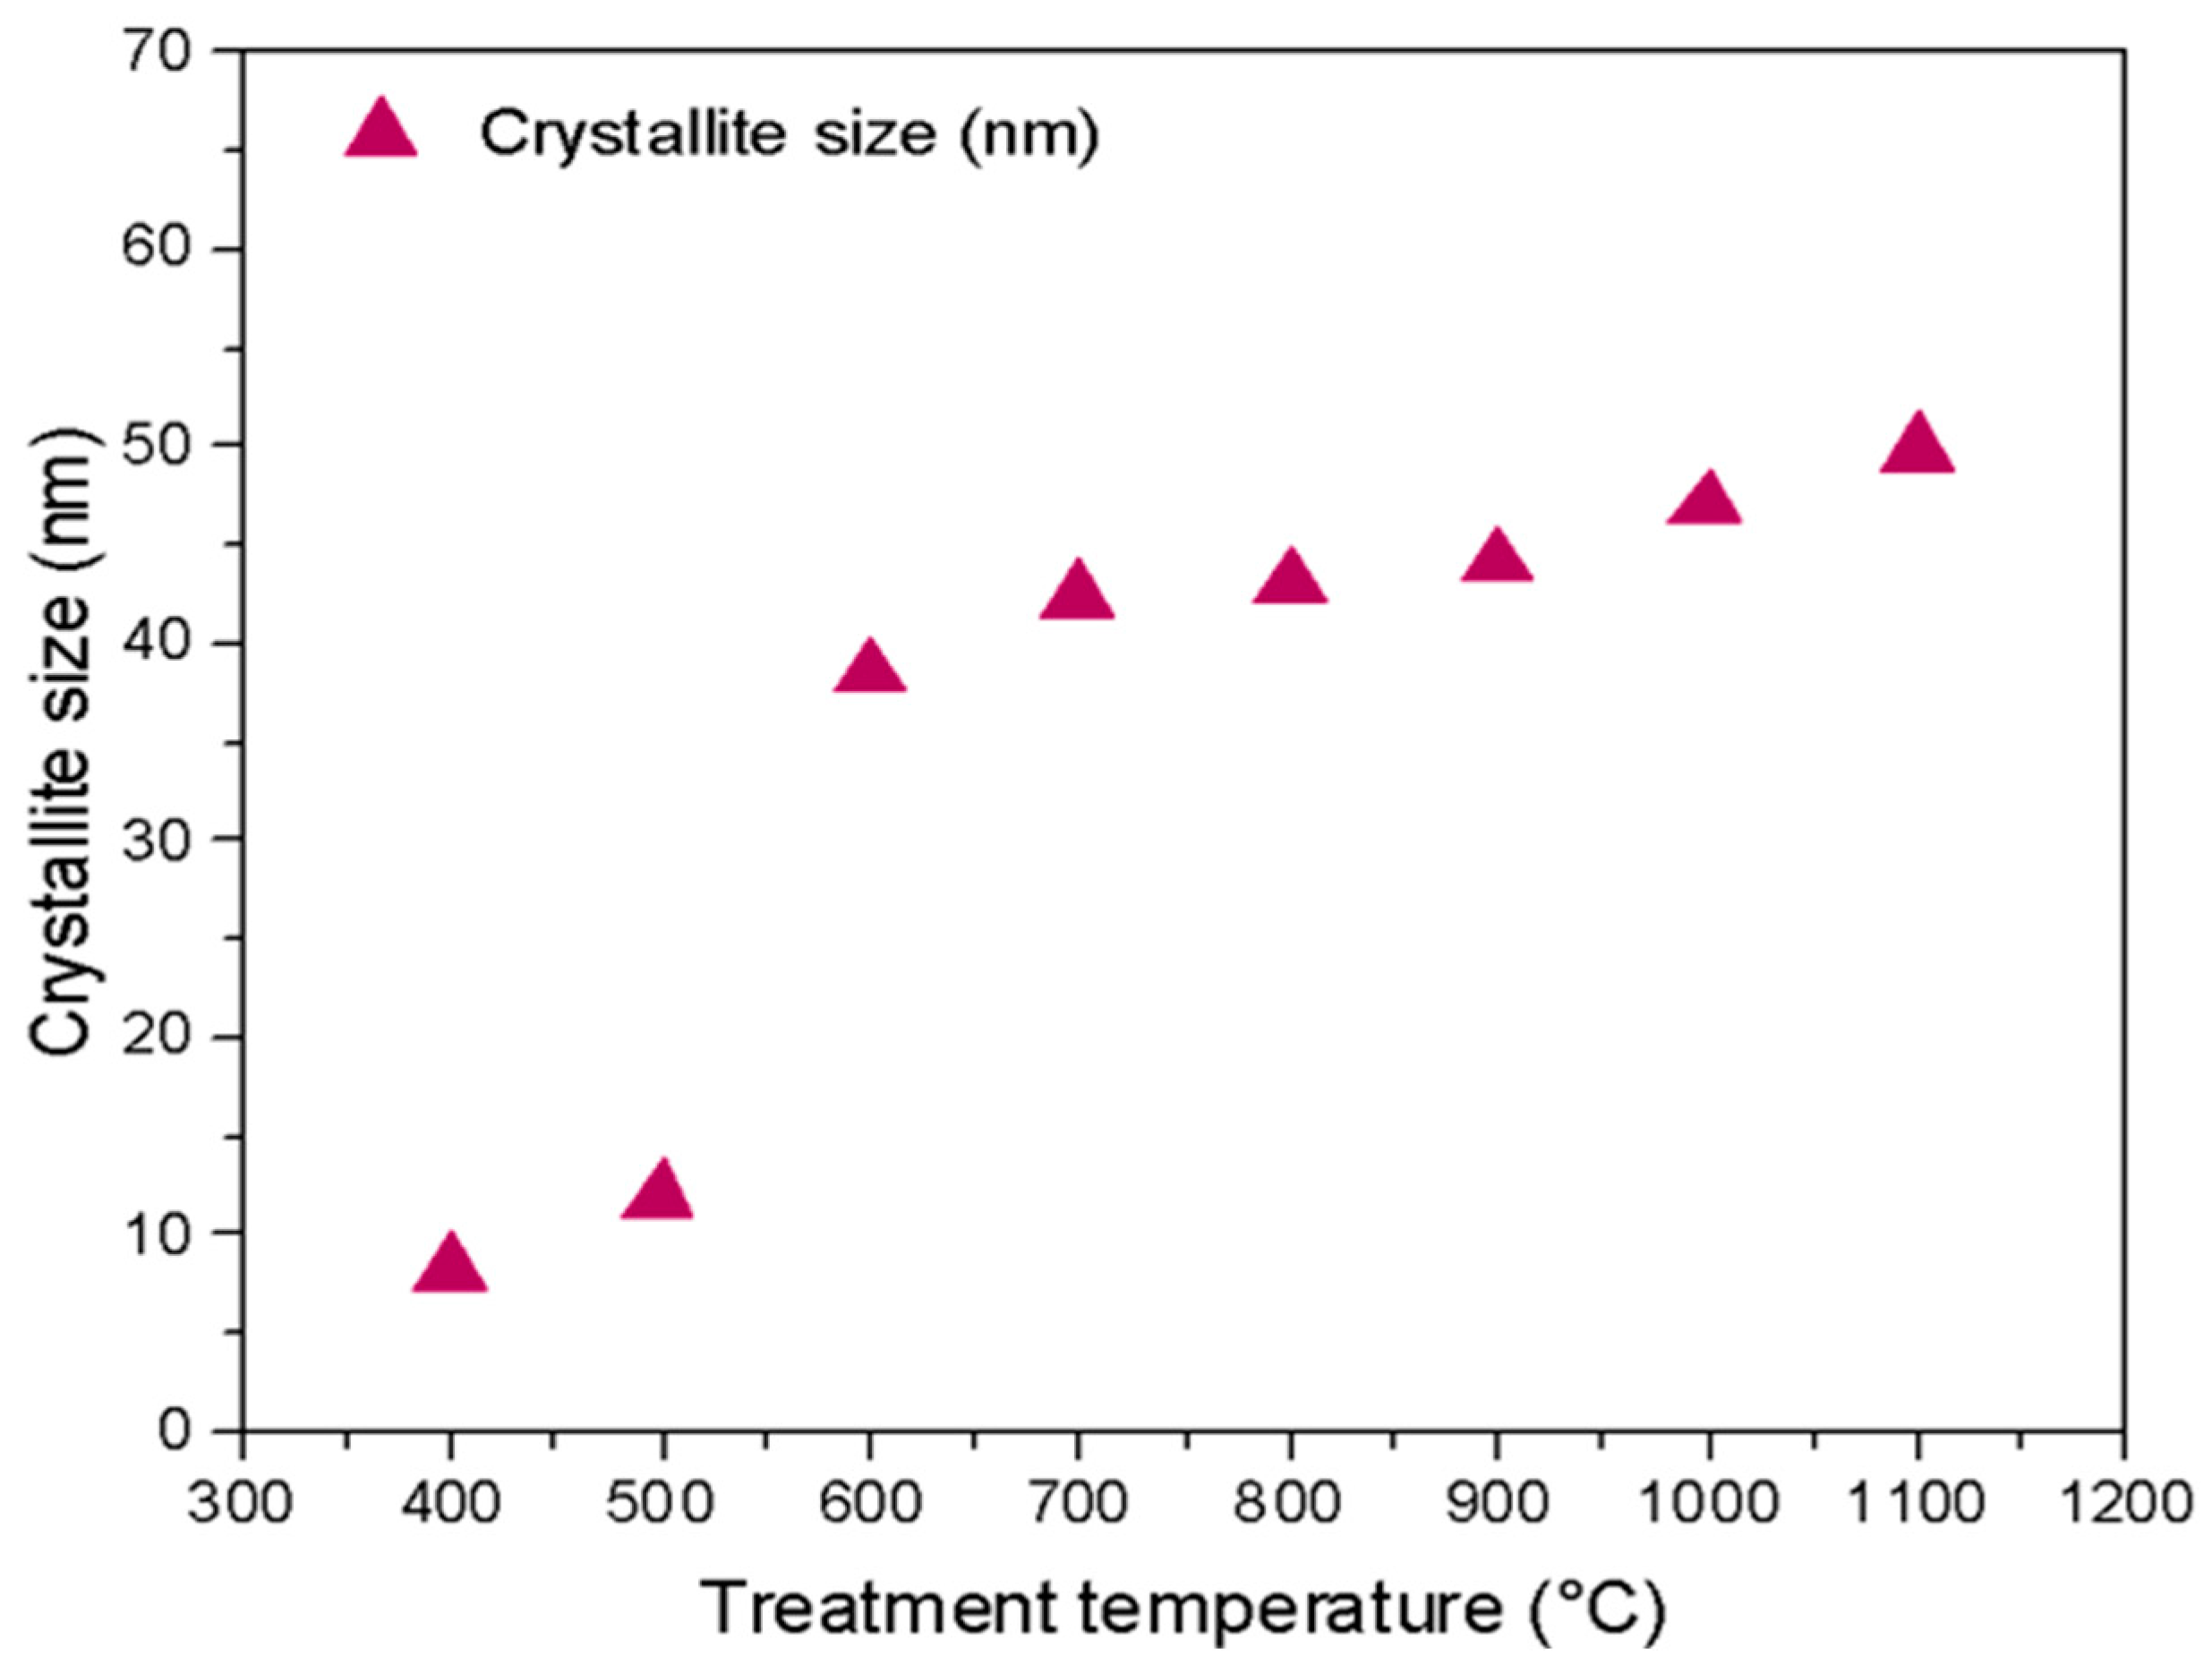
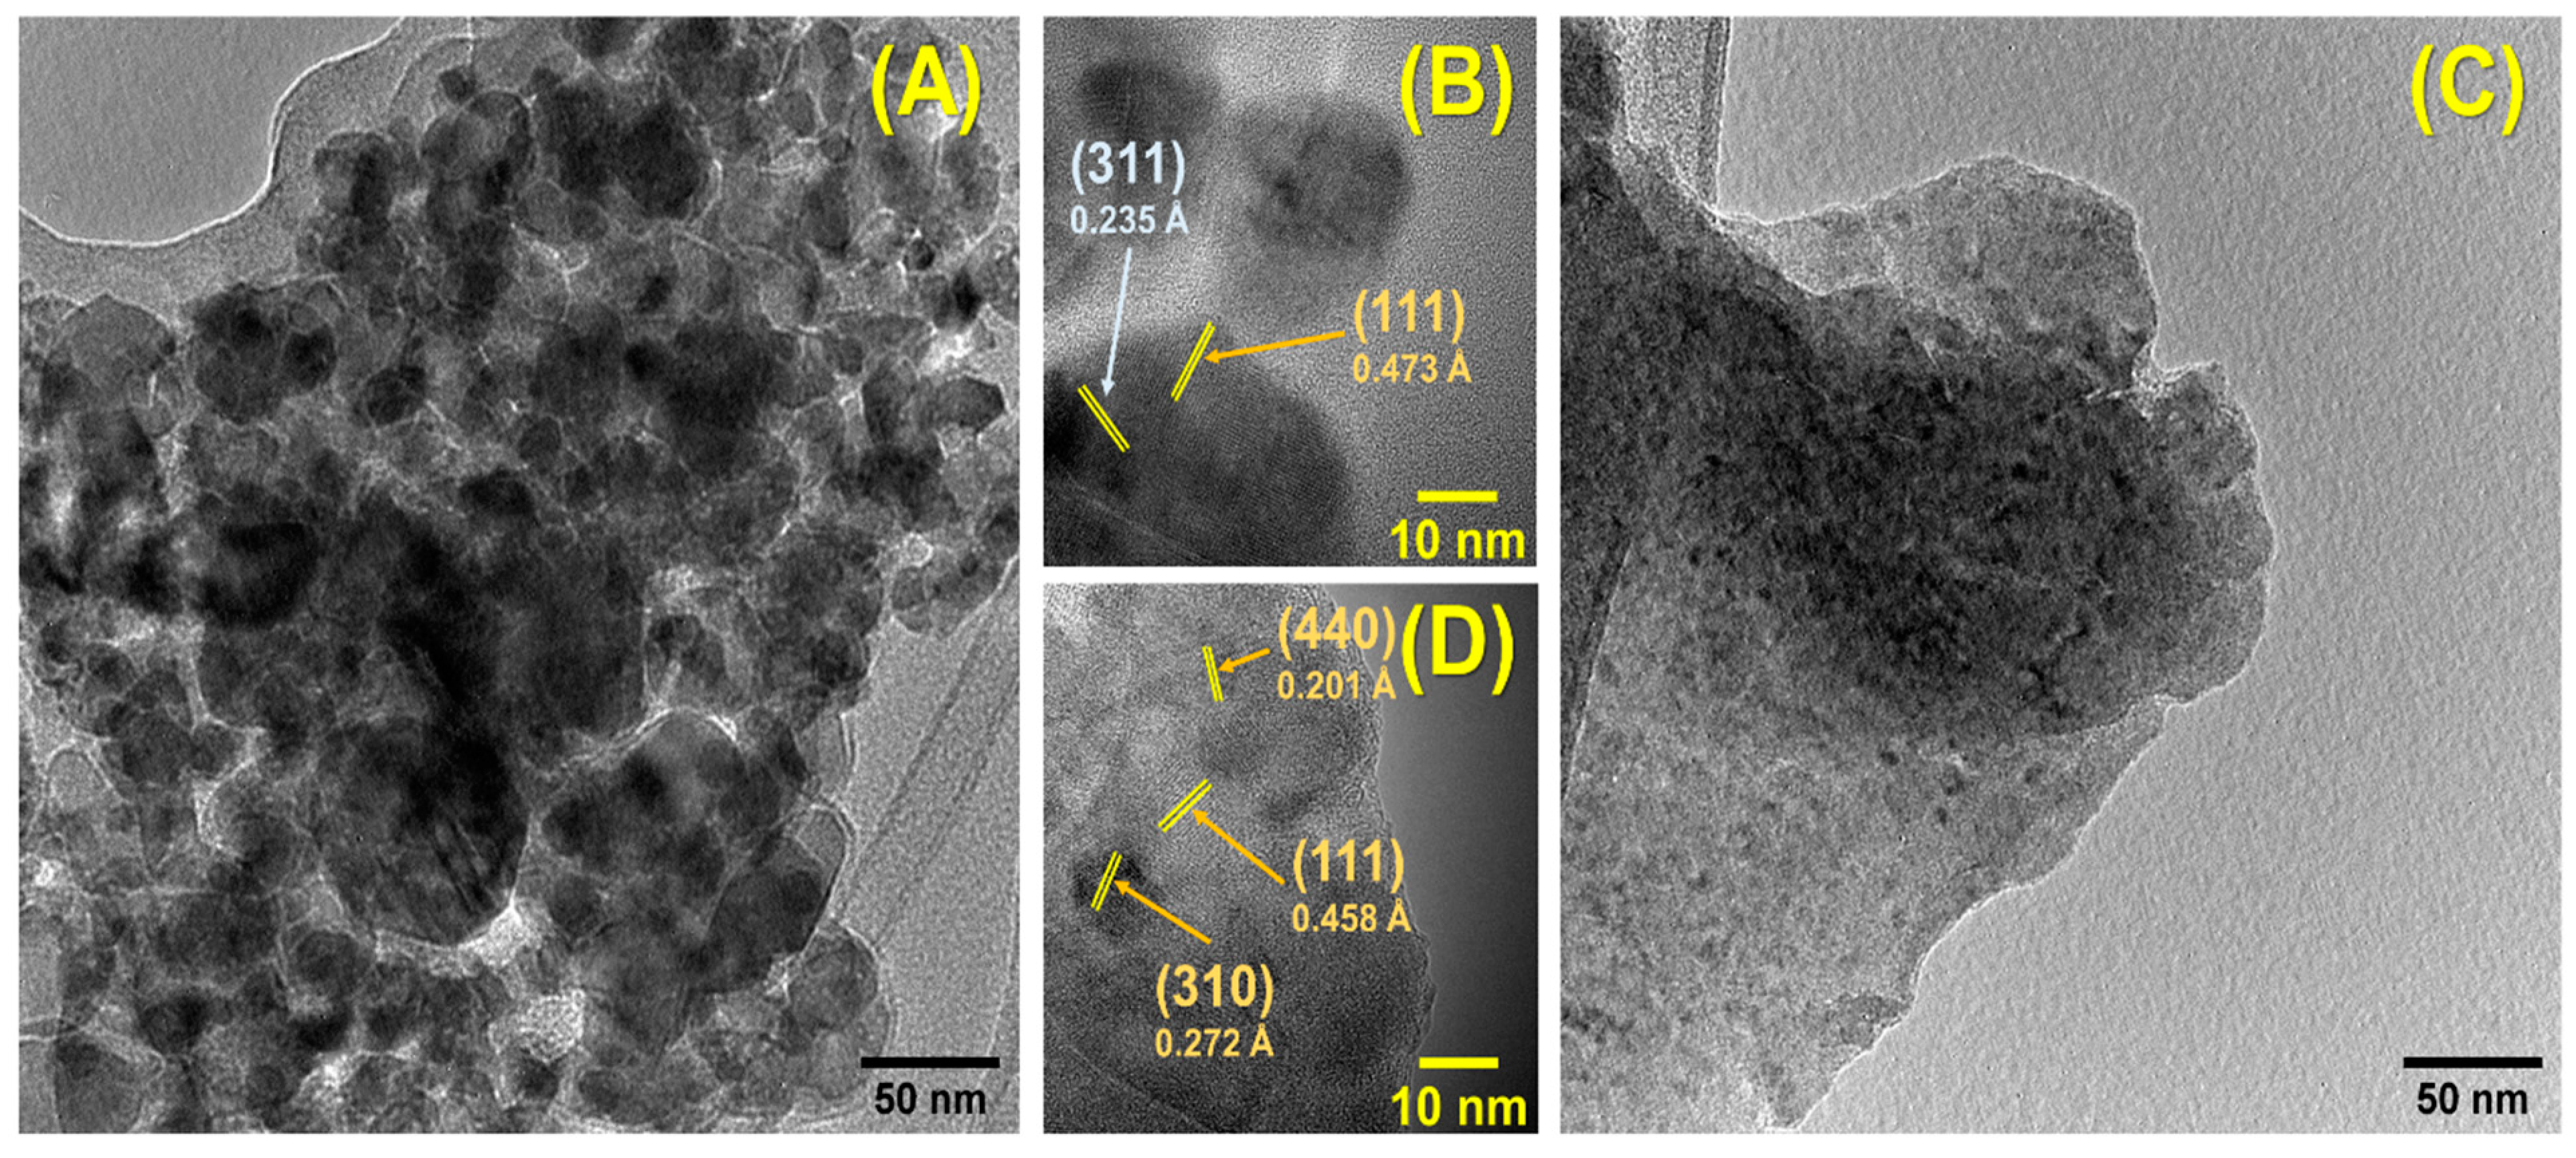
The calcined samples at 400 to 600 °C showed a cubic structure and a secondary phase of Fe2O3. From 700 to 1100 °C, they presented a tetragonal structure; in specimens treated at 700 and 800 °C, the Fe2O3 phase was still present but disappeared at 900 °C. The CuFe2O4 photocatalysts had crystal sizes around 8.2 to 49.8 nm. The SEM micrographs showed nearly spherical particles in the form of porous flakes and high agglomeration. The TEM images (HRTEM) also indicate the formation of spherical particles and lattice fringes corresponding to the (311), (111), (310), and (440) planes.
2.
The infrared spectra confirmed the presence of ferrites with absorption bands in the range of 400 to 1100 cm−1 that correspond to the metal–oxygen bond in the tetrahedral and octahedral sites. The BET analysis revealed the surface area and pore size distribution of the samples, in which that at 400°C had a smaller surface area compared to that at 1100 °C. The optical responses of the CuFe2O4 samples showed their absorption in the visible spectrum, with energy gap values ranging from 1.49 to 1.58 eV.
3.
Photocatalysts were used in the photocatalytic tests with visible light irradiation using synthetic green malachite and rhodamine B dyes. The samples showed adsorption in the photocatalysis experiments. The dye solution’s degradation rate was 56.60% and 84.30% for the CuFe2O4 photocatalyst treated at 400 °C using green malachite and rhodamine B, respectively.
4.
The results show that the 400 °C sample had a higher photocatalytic efficiency than those heat-treated at higher temperatures for both dyes. This may be associated with the secondary phase Fe2O3 and the smaller size of the crystallites.

Author Contributions

T.P.O., G.N.M., R.C.V.C. and C.G.G.L. analyzed and interpreted the data regarding the X-ray tests and the visible light experiments. J.H.G.R., C.A.J., S.F.R. and M.M.O. conceptualized and validated the data. T.P.O., A.R., G.N.M. and C.G.G.L. performed the experiments. A.R., C.A.J., S.F.R. and M.M.O. were major contributors in writing the manuscript. All authors have read and agreed to the published version of the manuscript.

Funding

This research was funded by Research and Support Foundation of Maranhão (FAPEMA) Capes, CNPq as well as the Natural Sciences and Engineering Research Council of Canada (NSERC).

Data Availability Statement

The datasets used and/or analyzed during the current study are available from the corresponding author on reasonable request.

Acknowledgments

The authors would like to thank IFMA, FAPEMA, and CAPES for financial support, the UFC’s Analytical Physics Center for the analysis of FEG-SEM and EDS, and to the Interdisciplinary Laboratory of Electrochemistry and Ceramics (LIEC) of the Federal University of São Carlos-UFSCar for the FTIR and DRS analyses.

Conflicts of Interest

The authors declare no conflict of interest.

References

  1. Ng, K.H.; Yuan, L.S.; Cheng, C.K.; Chen, K.; Fang, C. TiO2 and ZnO photocatalytic treatment of palm oil mill effluent (POME) and feasibility of renewable energy generation: A short review. J. Clean. Prod. 2019, 233, 209–225. [Google Scholar] [CrossRef]
  2. Ismail, M.; Akhtar, K.; Khan, M.I.; Kamal, T.; Khan, M.A.; Asiri, A.M.; Seo, J.; Khan, S.B. Pollution, toxicity and carcinogenicity of organic dyes and their catalytic bio-remediation. Curr. Pharm. Des. 2019, 25, 3645–3663. [Google Scholar] [CrossRef] [PubMed]
  3. Sharma, A.; Batoo, K.M.; Raslan, E.H.; Adil, S.F.; Kumar, G. Structural and magnetic study of Mn0.5Zn0.5CuxFe2−xO4 nanoferrites synthesized via solution combustion method. Vacuum 2018, 157, 422–427. [Google Scholar] [CrossRef]
  4. Malato, S.; Fernandez-Ibañez, P.; Maldonado, M.I.; Blanco, J.; Gernjak, W. Decontamination and disinfection of water by solar photocatalysis: Recent overview and trends. Catal. Today 2009, 147, 1–59. [Google Scholar] [CrossRef]
  5. Li, H.; Ai, Z.; Zhang, L. Surface structure-dependent photocatalytic O2 activation for pollutant removal with bismuth oxyhal-ides. Chem. Commun. 2020, 56, 15282–15296. [Google Scholar] [CrossRef] [PubMed]
  6. Casbeer, E.; Sharma, V.; Li, X.-Z. Synthesis and photocatalytic activity of ferrites under visible light: A review. Sep. Purif. Technol. 2012, 87, 1–14. [Google Scholar] [CrossRef]
  7. Pardeshi, S.K.; Pawar, R.Y. SrFe2O4 complex oxide an effective and environmentally benign catalyst for selective oxidation of styrene. J. Mol. Catal. A Chem. 2011, 334, 35–43. [Google Scholar] [CrossRef]
  8. Zhan, G.; Li, J.; Hu, Y.; Zhao, S.; Cao, S.; Jia, F.; Zhang, L. The surface hydroxyl and oxygen vacancy dependent Cr(vi) adsorption performance of BiOCl. Environ. Sci. Nano 2020, 7, 1454–1463. [Google Scholar] [CrossRef]
  9. Guo, Y.; Zhang, G.; Gan, H.; Zhang, Y. Micro/nano-structured CaWO4/Bi2WO6 composite: Synthesis, characterization and photocatalytic properties for degradation of organic contaminants. Dalton Trans. 2012, 41, 12697–12703. [Google Scholar] [CrossRef] [PubMed]
  10. Guo, Y.; Zhang, G.; Liu, J.; Zhang, Y. Hierarchically structured α-Fe2O3/Bi2WO6 composite for photocatalytic degradation of organic contaminants under visible light irradiation. RSC Adv. 2013, 3, 2963–2970. [Google Scholar] [CrossRef]
  11. Shi, Y.; Wang, X.; Liu, X.; Ling, C.; Shen, W.; Zhang, L. Visible light promoted Fe3S4 Fenton oxidation of atrazine. Appl. Catal. B Environ. 2020, 277, 119229. [Google Scholar] [CrossRef]
  12. Mishra, M.; Chun, D.-M. α-Fe2O3 as a photocatalytic material: A review. Appl. Catal. A Gen. 2015, 498, 126–141. [Google Scholar] [CrossRef]
  13. Sun, H.; Xie, G.; He, D.; Zhang, L. Ascorbic acid promoted magnetite Fenton degradation of alachlor: Mechanistic insights and kinetic modeling. Appl. Catal. B Environ. 2020, 267, 118383. [Google Scholar] [CrossRef]
  14. Sun, H.; Wang, J.; Jiang, Y.; Shen, W.; Jia, F.; Wang, S.; Liao, X.; Zhang, L. Rapid Aerobic Inactivation and Facile Removal of Escherichia coli with Amorphous Zero-Valent Iron Microspheres: Indispensable Roles of Reactive Oxygen Species and Iron Corrosion Products. Environ. Sci. Technol. 2019, 53, 3707–3717. [Google Scholar] [CrossRef]
  15. Hu, Y.; Zhan, G.; Peng, X.; Liu, X.; Ai, Z.; Jia, F.; Cao, S.; Quan, F.; Shen, W.; Zhang, L. Enhanced Cr(VI) removal of zero-valent iron with high proton conductive FeC2O4·2H2O shell. Chem. Eng. J. 2020, 389, 124414. [Google Scholar] [CrossRef]
  16. Xu, T.; Zhu, R.; Shang, H.; Xia, Y.; Liu, X.; Zhang, L. Photochemical behavior of ferrihydrite-oxalate system: Interfacial reaction mechanism and charge transfer process. Water Res. 2019, 159, 10–19. [Google Scholar] [CrossRef] [PubMed]
  17. Tolani, S.C.; Golhar, A.R.; Rewatkar, K.G. A review of morphological, structural behaviour and technological applications of ferrites. AIP Conf. Proc. 2019, 2104, 030032. [Google Scholar] [CrossRef]
  18. Jacobo, S.E.; Bercoff, P.G. Structural and electromagnetic properties of yttrium-substituted Ni–Zn ferrites. Ceram. Int. 2016, 42, 7664–7668. [Google Scholar] [CrossRef]
  19. Lakhani, V.; Pathak, T.; Vasoya, N.; Modi, K. Structural parameters and X-ray Debye temperature determination study on copper-ferrite-aluminates. Solid State Sci. 2011, 13, 539–547. [Google Scholar] [CrossRef]
  20. Verma, K.; Kumar, A.; Varshney, D.; Verma, K.; Kumar, A.; Varshney, D. Effect of Zn and Mg doping on structural, dielectric and magnetic properties of tetragonal CuFe2O4. Curr. Appl. Phys. 2013, 13, 467–473. [Google Scholar] [CrossRef]
  21. Manikandan, M.; Manimuthu, P.; Venkateswaran, C. Structural and magnetic properties of MgFe2O4 ceramic. AIP Conf. Proc. 2014, 1576, 194–196. [Google Scholar] [CrossRef]
  22. Zhao, Y.; Lin, C.; Bi, H.; Liu, Y.; Yan, Q. Magnetically separable CuFe2O4/AgBr composite photocatalysts: Preparation, characterization, photocatalytic activity and photocatalytic mechanism under visible light. Appl. Surf. Sci. 2017, 392, 701–707. [Google Scholar] [CrossRef]
  23. Tasca, J.E.; Quincoces, C.E.; Lavat, A.; Alvarez, A.M.; González, M.G. Preparation and characterization of CuFe2O4 bulk catalysts. Ceram. Int. 2011, 37, 803–812. [Google Scholar] [CrossRef]
  24. Köferstein, R.; Walther, T.; Hesse, D.; Ebbinghaus, S.G. Crystallite-growth, phase transition, magnetic properties, and sintering behaviour of nano-CuFe2O4 powders prepared by a combustion-like process. J. Solid State Chem. 2014, 213, 57–64. [Google Scholar] [CrossRef] [Green Version]
  25. Nedkov, I.; Vandenberghe, R.; Marinova, T.; Thailhades, P.; Merodiiska, T.; Avramova, I. Magnetic structure and collective Jahn–Teller distortions in nanostructured particles of CuFe2O4. Appl. Surf. Sci. 2006, 253, 2589–2596. [Google Scholar] [CrossRef]
  26. Rani, B.J.; Saravanakumar, B.; Ravi, G.; Ganesh, V.; Ravichandran, S.; Yuvakkumar, R. Structural, optical and magnetic properties of CuFe2O4 nanoparticles. J. Mater. Sci. Mater. Electron. 2018, 29, 1975–1984. [Google Scholar] [CrossRef]
  27. Chen, Z.; Wang, L.; Xu, H.; Wen, Q. Efficient heterogeneous activation of peroxymonosulfate by modified CuFe2O4 for degradation of tetrabromobisphenol A. Chem. Eng. J. 2020, 389, 124345. [Google Scholar] [CrossRef]
  28. Fotukian, S.M.; Barati, A.; Soleymani, M.; Alizadeh, A.M. Solvothermal synthesis of CuFe2O4 and Fe3O4 nanoparticles with high heating efficiency for magnetic hyperthermia application. J. Alloys Compd. 2020, 816, 152548. [Google Scholar] [CrossRef]
  29. Otari, S.V.; Patel, S.K.S.; Kim, S.-Y.; Haw, J.R.; Kalia, V.C.; Kim, I.-W.; Lee, J.-K. Copper Ferrite Magnetic Nanoparticles for the Immobilization of Enzyme. Indian J. Microbiol. 2019, 59, 105–108. [Google Scholar] [CrossRef] [PubMed]
  30. Kar, M.K.A.; Fazaeli, R.; Manteghi, F.; Ghahari, M. Structural, Optical, and Isothermic Studies of CuFe2O4 and Zn-Doped CuFe2O4 Nanoferrite as a Magnetic Catalyst for Photocatalytic Degradation of Direct Red 264 Under Visible Light Irradiation. Environ. Prog. Sustain. Energy 2019, 38, 13109. [Google Scholar] [CrossRef]
  31. Aruna, S.T.; Mukasyan, A.S. Combustion synthesis and nanomaterials. Curr. Opin. Solid State Mater. Sci. 2008, 12, 44–50. [Google Scholar] [CrossRef]
  32. Manukyan, K.V.; Cross, A.; Roslyakov, S.; Rouvimov, S.; Rogachev, A.S.; Wolf, E.E.; Mukasyan, A.S. Solution combustion synthesis of Nanocrystalline metallic materials: Mechanistic studies. J. Phys. Chem. C 2013, 117, 24417–24427. [Google Scholar] [CrossRef]
  33. Patil, R.; Delekar, S.; Mane, D.; Hankare, P. Synthesis, structural and magnetic properties of different metal ion substituted nanocrystalline zinc ferrite. Results Phys. 2013, 3, 129–133. [Google Scholar] [CrossRef] [Green Version]
  34. Jain, S.; Adiga, K.; Verneker, V.P. A new approach to thermochemical calculations of condensed fuel-oxidizer mixtures. Combust. Flame 1981, 40, 71–79. [Google Scholar] [CrossRef]
  35. Wen, W.; Wu, J.-M. Nanomaterials via solution combustion synthesis: A step nearer to controllability. RSC Adv. 2014, 4, 58090–58100. [Google Scholar] [CrossRef]
  36. Pourgolmohammad, B.; Masoudpanah, S.; Aboutalebi, M. Effects of the fuel type and fuel content on the specific surface area and magnetic properties of solution combusted CoFe2O4 nanoparticles. Ceram. Int. 2017, 43, 8262–8268. [Google Scholar] [CrossRef]
  37. Rajeshwar, K.; De Tacconi, N.R. Solution combustion synthesis of oxide semiconductors for solar energy conversion and environmental remediation. Chem. Soc. Rev. 2009, 38, 1984–1998. [Google Scholar] [CrossRef]
  38. Oliveira, T.P.; Marques, G.N.; Castro, M.A.M.; Costa, R.C.V.; Rangel, J.H.G.; Rodrigues, S.F.; dos Santos, C.C.; Oliveira, M.M. Synthesis and photocatalytic investigation of ZnFe2O4 in the degradation of organic dyes under visible light. J. Mater. Res. Technol. 2020, 9, 15001–15015. [Google Scholar] [CrossRef]
  39. Vosoughifar, M. Preparation and application of copper ferrite nanoparticles for degradation of methyl orange. J. Mater. Sci. Mater. Electron. 2016, 27, 10449–10453. [Google Scholar] [CrossRef]
  40. Manikandan, V.; Vanitha, A.; Kumar, E.R.; Chandrasekaran, J. Effect of in substitution on structural, dielectric and magnetic properties of CuFe2O4 nanoparticles. J. Magn. Magn. Mater. 2017, 432, 477–483. [Google Scholar] [CrossRef]
  41. Trench, A.B.; Machado, T.R.; Gouveia, A.F.; Assis, M.; da Trindade, L.G.; Santos, C.; Perrin, A.; Perrin, C.; Oliva, M.; Andrés, J.; et al. Connecting structural, optical, and electronic properties and photocatalytic activity of Ag3PO4: Mo complemented by DFT calculations. Appl. Catal. B Environ. 2018, 238, 198–211. [Google Scholar] [CrossRef]
  42. Li, X.; Dong, P.; Liu, C.; Yu, X.; Zhao, J.; Sun, S.; Liu, J.; Zhang, Y. The impact of the crystal structure and morphology on the electrochemical performance for CuFe2O4 in sodium ion batteries. Ceram. Int. 2018, 44, 18471–18477. [Google Scholar] [CrossRef]
  43. Selima, S.; Khairy, M.; Mousa, M. Comparative studies on the impact of synthesis methods on structural, optical, magnetic and catalytic properties of CuFe2O4. Ceram. Int. 2019, 45, 6535–6540. [Google Scholar] [CrossRef]
  44. Kongkaew, T.; Sakurai, K. Low-temperature Synthesis of Cubic Phase CuFe2O4 Powder. Chem. Lett. 2017, 46, 1493–1496. [Google Scholar] [CrossRef] [Green Version]
  45. Selvan, R.K.; Augustin, C.; Berchmans, L.; Saraswathi, R. Combustion synthesis of CuFe2O4. Mater. Res. Bull. 2003, 38, 41–54. [Google Scholar] [CrossRef]
  46. Jiao, H.; Jiao, G.; Wang, J. Preparation and Magnetic Properties of CuFe2O4 Nanoparticles. Synth. React. Inorg. Met. Nano-Metal Chem. 2013, 43, 131–134. [Google Scholar] [CrossRef]
  47. Chatterjee, B.K.; Bhattacharjee, K.; Dey, A.; Ghosh, C.K.; Chattopadhyay, K.K. Influence of spherical assembly of copper ferrite nanoparticles on magnetic properties: Orientation of magnetic easy axis. Dalton Trans. 2014, 43, 7930–7944. [Google Scholar] [CrossRef]
  48. Prasad, B.D.; Nagabhushan, B.; Nagabhushana, H.; Rudraswamy, B.; Jnaneshwara, D.; Shivakumara, C.; Shivaprakash, N.; Chakradar, R.; Prakash, A.G. Electrical Properties of Nano Zinc Ferrites Prepared by Solution Combustion and Hydrothermal Methods. Mater. Sci. Forum 2012, 710, 721–726. [Google Scholar] [CrossRef]
  49. Huang, Z.; Yin, G.; Liao, X.; Yao, Y.; Kang, Y. Preparation and magnetic properties of Cu-ferrite nanorods and nanowires. J. Colloid Interface Sci. 2008, 317, 530–535. [Google Scholar] [CrossRef]
  50. Shetty, K.; Renuka, L.; Nagaswarupa, H.; Nagabhushana, H.; Anantharaju, K.; Rangappa, D.; Prashantha, S.; Ashwini, K. A comparative study on CuFe2O4, ZnFe2O4 and NiFe2O4: Morphology, Impedance and Photocatalytic studies. Mater. Today Proc. 2017, 4, 11806–11815. [Google Scholar] [CrossRef]
  51. Kombaiah, K.; Vijaya, J.J.; Kennedy, L.J.; Bououdina, M.; Al-Najar, B. Conventional and microwave combustion synthesis of optomagnetic CuFe2O4 nanoparticles for hyperthermia studies. J. Phys. Chem. Solids 2018, 115, 162–171. [Google Scholar] [CrossRef]
  52. Liu, X.; Zhou, J.; Liu, D.; Li, L.; Liu, W.; Liu, S.; Feng, C. Construction of Z-scheme CuFe2O4/MnO2 photocatalyst and activating peroxymonosulfate for phenol degradation: Synergistic effect, degradation pathways, and mechanism. Environ. Res. 2021, 200, 111736. [Google Scholar] [CrossRef]
  53. Sing, K.S.W. Reporting physisorption data for gas/solid systems with special reference to the determination of surface area and porosity (Recommendations 1984). Pure Appl. Chem. 1985, 57, 603–619. [Google Scholar] [CrossRef]
  54. Masunga, N.; Mamba, B.B.; Getahun, Y.W.; El-Gendy, A.A.; Kefeni, K.K. Synthesis of single-phase superparamagnetic copper ferrite nanoparticles using an optimized coprecipitation method. Mater. Sci. Eng. B 2021, 272, 115368. [Google Scholar] [CrossRef]
  55. Joshi, S.; Kumar, M.; Chhoker, S.; Srivastava, G.; Jewariya, M.; Singh, V. Structural, magnetic, dielectric and optical properties of nickel ferrite nanoparticles synthesized by co-precipitation method. J. Mol. Struct. 2014, 1076, 55–62. [Google Scholar] [CrossRef]
  56. Doneliene, J.; Fataraite-Urboniene, E.; Rudzikas, M.; Pakalka, S.; Danchova, N.; Ulbikas, J. Effect of Precursor Nature and Sol-Gel Synthesis Conditions on TiO2 Aerogel’s Structure. Molecules 2021, 26, 5090. [Google Scholar] [CrossRef] [PubMed]
  57. Patil, S.; Naik, H.B.; Nagaraju, G.; Viswanath, R.; Rashmi, S.; Kumar, M.V. Sugarcane juice mediated eco-friendly synthesis of visible light active zinc ferrite nanoparticles: Application to degradation of mixed dyes and antibacterial activities. Mater. Chem. Phys. 2018, 212, 351–362. [Google Scholar] [CrossRef]
  58. Surendra, B. Green engineered synthesis of Ag-doped CuFe2O4: Characterization, cyclic voltammetry and photocatalytic studies. J. Sci. Adv. Mater. Devices 2018, 3, 44–50. [Google Scholar] [CrossRef]
  59. Sun, Y.; Wang, W.; Zhang, L.; Sun, S.; Gao, E. Magnetic ZnFe2O4 octahedra: Synthesis and visible light induced photocatalytic activities. Mater. Lett. 2013, 98, 124–127. [Google Scholar] [CrossRef]
  60. Hung, P.-H.; Vequizo, J.J.M.; Wu, R.-A.; Yamakata, A.; Tseng, W.J. Effect of CuFe2O4 ferrite on photocatalysis and carrier dynamics of electrospun α-Fe2O3 nanofibers by time-resolved transient absorption spectroscopy. Ceram. Int. 2019, 45, 15676–15680. [Google Scholar] [CrossRef]
  61. Cao, Z.; Zuo, C.; Wu, H. One step for synthesis of magnetic CuFe2O4 composites as photo-fenton catalyst for degradation organics. Mater. Chem. Phys. 2019, 237, 121842. [Google Scholar] [CrossRef]
  62. Li, D.; Qin, Q.; Duan, X.; Yang, J.; Guo, W.; Zheng, W. General One-pot template-free hydrothermal method to metal oxide hollow spheres and their photocatalytic activities and lithium storage properties. ACS Appl. Mater. Interfaces 2013, 5, 9095–9100. [Google Scholar] [CrossRef] [PubMed]
  63. Zhang, E.; Wang, L.; Zhang, B.; Xie, Y.; Wang, G. Enhanced photocatalytic performance of polyvinylidene fluoride membrane by doped CuFe2O4 nanocrystals for water treatment. J. Sol-Gel Sci. Technol. 2020, 93, 452–461. [Google Scholar] [CrossRef]
Figure 1. A flowchart of copper ferrite solution combustion synthesis.
Catalysts 12 00623 g001
Figure 2. The CuFe2O4 XRD standards: (a) 400, (b) 500, (c) 600, (d) 700, (e) 800, (f) 900, (g) 1000, and (h) 1100 °C.
Catalysts 12 00623 g002
Figure 3. The crystallite size of CuFe2O4 heat-treated at different temperatures.
Catalysts 12 00623 g003
Figure 4. The FTIR spectra of CuFe2O4: (a) 400, (b) 500, (c) 600, (d) 700, (e) 800, (f) 900, (g) 1000 and (h) 1100 °C.
Catalysts 12 00623 g004
Figure 5. The micrographs of CuFe2O4: (A) 400, (B) 500, (C) 600, (D) 700, (E) 800, (F) 900, (G) 1000, and (H) 1100 °C.
Catalysts 12 00623 g005
Figure 6. The TEM image of CuFe2O4 samples: (A) 400, (C) 1000, (B,D) HRTEM image with d-space values.
Catalysts 12 00623 g006
Figure 7. The adsorption–desorption isotherm (insertion—BJH pore size distribution) of the CuFe2O4 samples calcined to: (A) 400 °C and (B) 1100 °C.
Catalysts 12 00623 g007
Figure 8. The UV–Vis spectra and energies of the optical band gap of the heat-treated CuFe2O4 samples: (A) 400 °C, (B) 1100 °C, (C) optical band gap energies of CuFe2O4 as a function of calcination temperature.
Catalysts 12 00623 g008
Figure 9. The absorption spectra of the malachite green solution using CuFe2O4 at: (A) 400 °C, (B) 1100 °C, and (C) photolysis.
Catalysts 12 00623 g009
Figure 10. The photocatalytic degradation of green malachite under visible irradiation. (A) Photocatalytic efficiency curve. (B) Graph of lnC0/Ct versus irradiation time for the decomposition of the green malachite for CuFe2O4 samples.
Catalysts 12 00623 g010
Figure 11. The absorption spectra of the rhodamine B solution using CuFe2O4 at: (A) 400 °C, (B) 1100 °C, and (C) photolysis.
Catalysts 12 00623 g011
Figure 12. The photocatalytic degradation of the rhodamine B solution under visible irradiation. (A) Photocatalytic efficiency curve. (B) Graph of lnC0/Ct versus irradiation time for rhodamine B decomposition for the CuFe2O4 samples.
Catalysts 12 00623 g012
Figure 13. The mechanism of the reaction with the CuFe2O4 sample at 400 °C under visible irradiation being Ag—silver nitrate, AO—ammonium oxalate, BQ—benzoquinone, and TBA—tert-butyl alcohol.
Catalysts 12 00623 g013
Figure 14. The reaction mechanism of the decolorization of dyes over CuFe2O4.
Catalysts 12 00623 g014
Table 1. The adsorption–desorption data of the CuFe2O4 samples.
Treatment Temperature of CuFe2O4 Sample (°C)Surface Area (m2/g)Pore Volume (cm3/g)Pore Diameter (nm)
400184.4000.2912.184
500128.2840.1592.181
60036.8590.1459.262
70017.5400.12816.821
8006.4580.0192.183
9005.5620.0572.160
10004.9700.0102.417
11003.9890.0062.141
Table 2. A comparison of the CuFe2O4 obtained in the work with others reported in the literature with the same conditions.
MaterialSynthesis MethodAbsorptionBand Gap (eV)Light SourceDegradation (%)DyeRef.
CuFe2O4Combustionvisible1.96–1.84Sun light83%Malachite green[53]
1.9Xenon arc lamp94.5%Malachite green[50]
1.49–1.58LED56.6–20.53%Malachite greenThis work
Table 3. The experimental photocatalytic data of the green malachite discoloration solution in the CuFe2O4 heat-treated samples.
Temperature (°C)k × 10−2/min−1 t 1 / 2   ( min ) Discoloration (%)
4001.400.4956.60
5000.980.7043.16
6000.800.8639.08
7000.641.0831.59
8000.551.2629.42
9000.541.2827.52
10000.421.6520.94
11000.421.6520.53
Table 4. Thee experimental photocatalytic data of the decolorization of the rhodamine B solution from the heat-treated CuFe2O4 samples.
Temperature (°C)k × 10−2/min−1 t 1 / 2   ( min ) Discoloration (%)
4002.300.3084.30
5000.551.2628.97
6000.461.5025.67
7000.401.7324.07
8000.174.0711.02
9000.144.958.23
10000.144.958.20
11000.135.337.98
Publisher’s Note: MDPI stays neutral with regard to jurisdictional claims in published maps and institutional affiliations.

