Article

Improve the Midpoint Voltage and Structural Stability of Li-Rich Manganese-Based Cathode Material by Increasing the Nickel Content

1
School of Resources, Environment and Materials, Guangxi University, Nanning 530004, China
2
South Manganse Group Limited, Nanning 530029, China
*
Author to whom correspondence should be addressed.
Catalysts 2022, 12(6), 584; https://doi.org/10.3390/catal12060584
Submission received: 11 April 2022 / Revised: 10 May 2022 / Accepted: 17 May 2022 / Published: 26 May 2022

Abstract

:
Lithium-rich manganese is a promising new-generation cathode material for lithium-ion batteries. However, it has the common problems of serious discharge capacity decline, poor rate performance, and faster midpoint voltage decay. In this experiment, a sol-gel method was used to synthesize a high-nickel, lithium-rich layered oxide (1 − x)Li1.2Mn0.54Co0.13Ni0.13O2 − xLiNiO2 (x = 0, 1.0, 2.0, 3.0 and 4.0) that was characterized by XRD, SEM, XPS, TEM, and charge-discharge performance tests. The research results show that increasing Ni content can improve the stability of the material structure and enhance the electrochemical performance of the cathode material. When the LiNiO2 is 0.3, the electrochemical performance is better, the capacity retention rate is 100.3% after 60 cycles at a current density of 0.2 C, and the capacity retention rate for 100 cycles at 0.5 C is 99.0%.

1. Introduction

The development of high-capacity, high-density cathode materials is currently the focus of lithium-ion battery research. Among the numerous lithium battery cathode materials, the actual capacity of the lithium-rich manganese-based oxide xLi2MnO3(1 − x)LiMO2, 0 < x < 1, (M = Mn, Co, Ni, Mn1/2Ni1/2, Mn1/3Co1/3Ni1/3) can reach 250 mAh g1, which can meet the demand for high specific capacity [1,2,3]. However, there are many technical issues that need to be overcome before this material is commercially available, including the large first-lap coulomb loss, poor electrochemical performance, and severe median voltage decay [4,5].
To resolve these issues, many researchers have used doping to increase the properties of Li-rich manganese-based cathode materials such as Mg2+ [6], Mo6+ [7], Ti4+ [8], and Zn2+ [9]. Although the original ions in the material lattice are replaced by these doping ions, the performance of the cathode material will be improved. However, most of these doping ions are not electrochemically active, so the cathode material’s specific capacity will be reduced as a result of the doping.
In lithium battery material, the d-orbital electrons in the transition metal ions directly participate in electrochemical reactions. These electrons are more easily lost when the electronegativity of the transition metal ion is reduced, leading to a lower operating voltage [10]. As a result, the qualities and number of d-orbital electrons the participate in electrochemical reactions will have a direct impact on the electrode materials’ electrochemical properties. Ni ions are known to exhibit higher electronegativity than Mn ions under the same conditions, and therefore, adding Ni to the lithium batteries cathode material can improve the average voltage [11]. At the same time, Ni-O bonds possess higher covalent characteristics, which helps to electrochemically stabilize the ordered layered structure and prevent the transition metal ions from rearranging [12]. Previously, Lim [13] investigated the structural and electrochemical properties of the materials by synthesizing xLi2MnO3 − yLi[Ni1/3Co1/3M1/3]O2 − zLiNiO2 systems with various compositions. However, he did not elaborate on the reasons for the improvement of the electrochemical properties of the materials after adding LiNiO2 components. Unlike the above experiments, only one variable was controlled in this experiment. High-nickel lithium-rich layered oxides (1 − x) Li1.2Mn0.54Co0.13Ni0.13O2 − xLiNiO2 (x = 0, 1.0, 2.0, 3.0 and 4.0) were synthesized in the form of doped LiNiO2 in order to investigate the effect of nickel elements on the electrochemical and physical properties of the cathode materials.

2. Results and Discussion

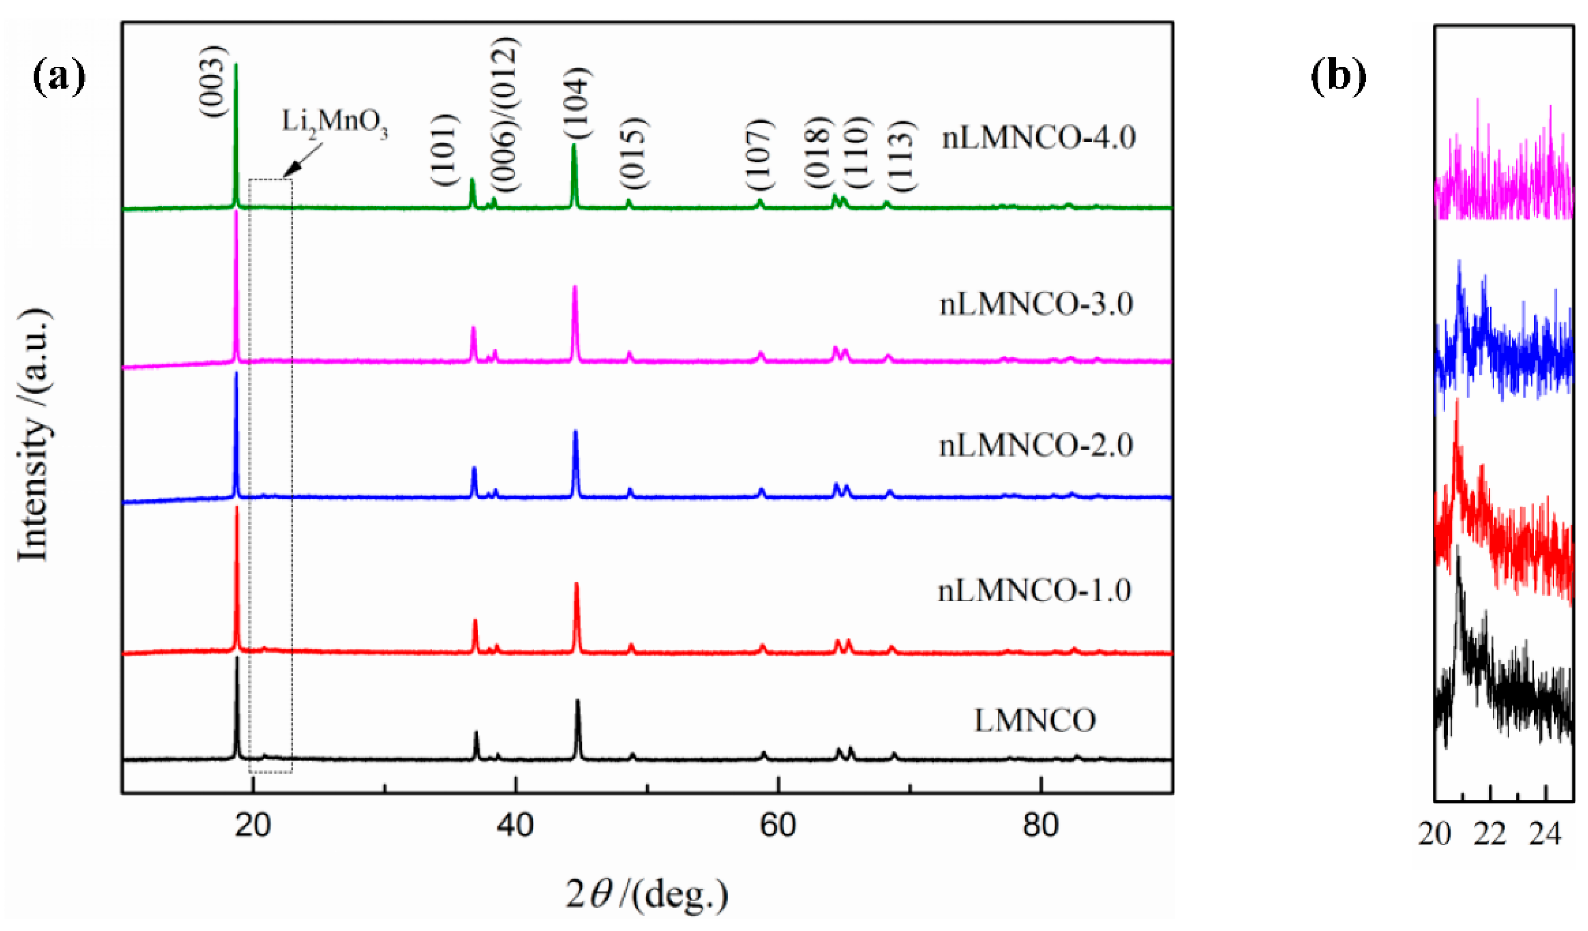
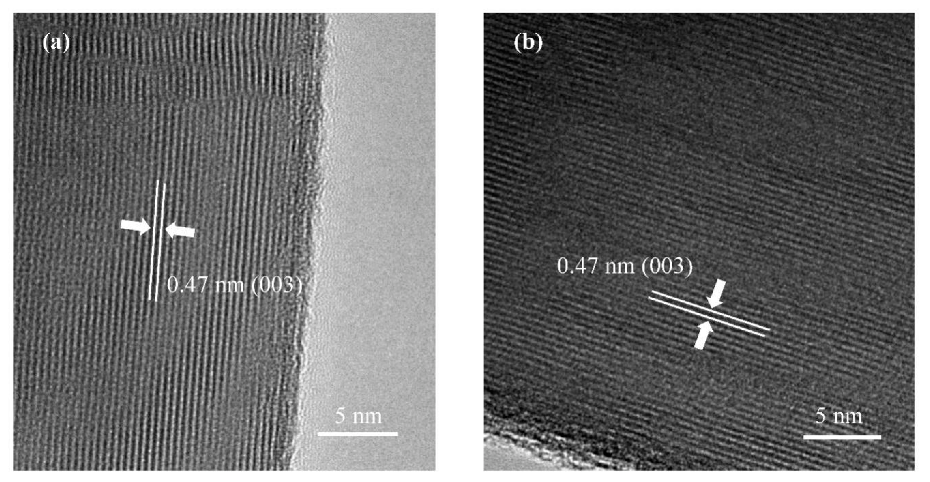
2.1. Structural Analysis

As shown in Figure 1, the main peaks of all samples are highly matched to the phase of a-NaFeO2 (R3m space group), which has a hexagonal crystal structure. Several weak peaks appear in the range of 2θ = 20–25°. Referring to the standard card (JCPDS:81-1953), those weak peaks indicate the existence of a Li2MnO3-like layered structure [14,15]. Figure 1b indicates that when the amount of LiNiO2 doped increases, the superlattice diffraction peaks in the 2θ = 20–25° region become weaker, which is caused by the decrease of Li2MnO3 group in the material due to LiNiO2 incorporation. When the LiNiO2 is 0.4, the superlattice diffraction peaks in the range of 2θ = 20–25° basically disappear.
Table 1 shows the lattice parameters and characteristic peak intensity ratios of all samples calculated by JADE software (JADE6.0, MDI, Livemore, CA, USA). I(003)/I(104) is an important index to measure the mixing degree of Li+/Ni2+. When the ratio is less than 1.2, it demonstrates that the level of Li+/Ni2+ cation mixing in the sample material is significant [16]. Table 1 shows that the samples I(003) and I(104) are both more than 1.4, indicating that the Li+/Ni2+ cation mixing degree is low in all five samples. The I(003)/I(104) values of the modified nLMnCo-1.0, nLMnCo-2.0, nLMnCo-3.0, and nLMNCo-4.0 samples were higher than the pristine. Although I(003)/I(104) can qualitatively analyze the concentration of cationic point defects, a higher I(003)/I(104) does not directly indicate that the modified sample material has lower Li+/Ni2+ cation mixing, due to the fact that a smaller preferred orientation also has a larger effect on the I(003)/I(104) ratio, while a small preferred orientation is always present in Ni-rich NMCs [17].

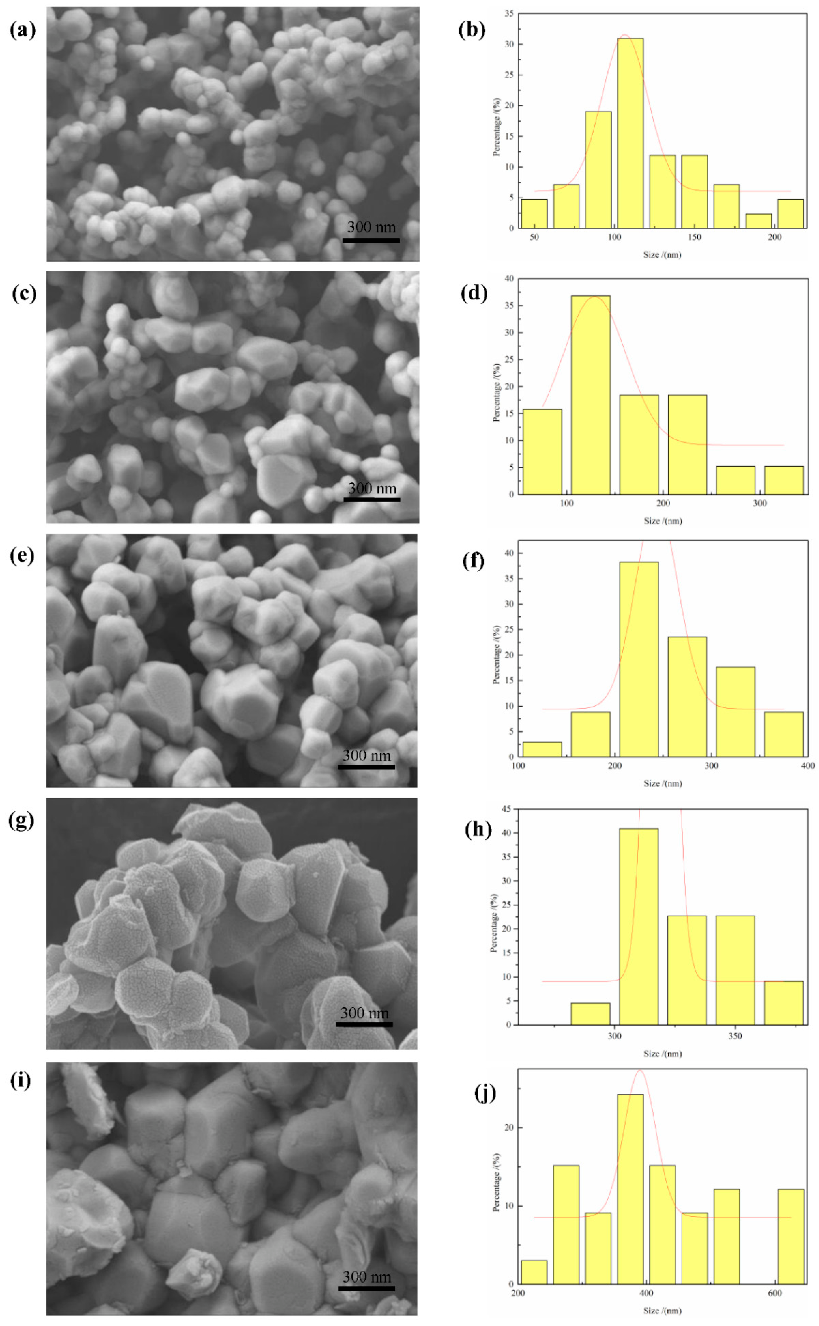
2.2. Morphology Analysis

The electrochemical performance of a material is intimately connected to its particle size and surface shape. Figure 2 are the microscopic topography and histogram of particle size distribution of the five sample materials: LMNCO, nLMNCO-1.0, nLMNCO-2.0, nLMNCO-3.0, and nLMNCO-4.0. It can be seen that the sample particles prepared by sol-gel method have irregular polygonal structure. The particles of the LMNCO are small and nonuniform in size. With increasing LiNiO2, the particles gradually increase in size and tend to be uniform. When the LiNiO2 is 0.3, the sample particles possess uniform particle size and good particle morphology. When the LiNiO2 is 0.4, the material particles become not only coarse but also agglomerate, which means the active material in the center of the particle is not fully utilized; in turn, the Li+ ion de-intercalation distance will increase.
The samples LMNCO and NLMNCO-3.0 were imaged using transmission electron microscopy (TEM) in Figure 3. The figure shows that all of the sample particles have an excellent layered structure. The main structure of all samples has a lattice fringe spacing of 0.47 nm, which points to the layered structure’s (003) plane (R-3M).

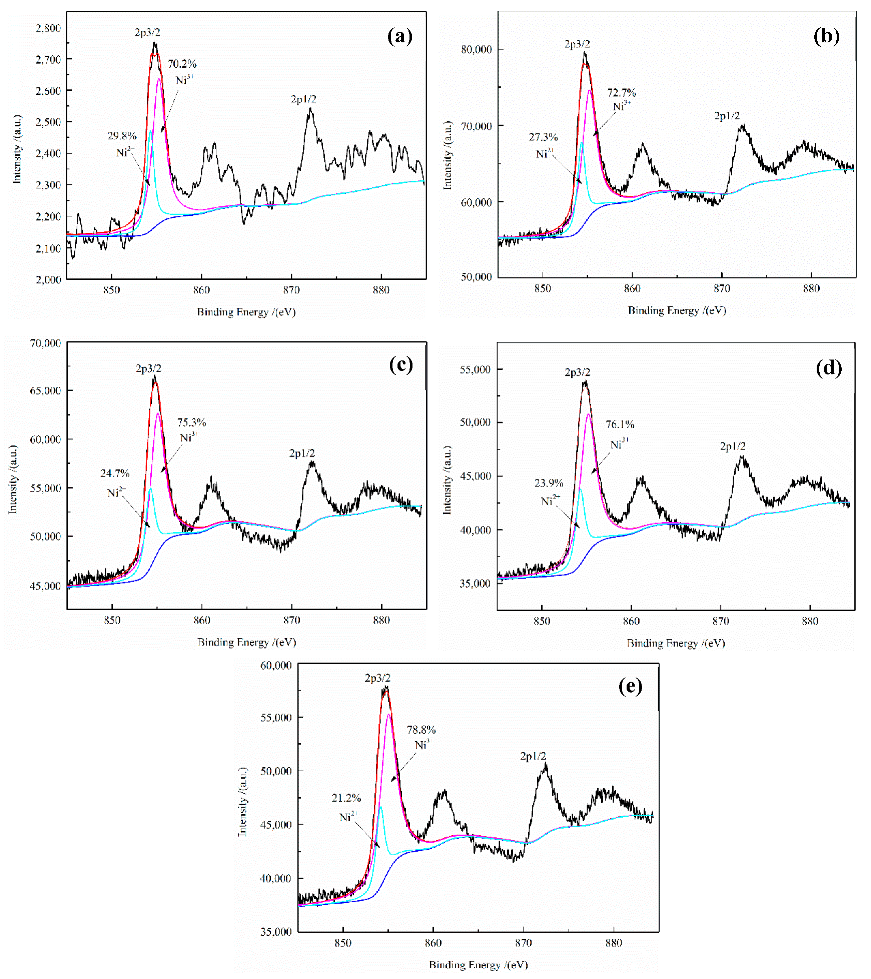
2.3. Surface Chemical Valence Analysis

In order to investigate in depth the changes in the chemical states of various transition metal elements in the cathode materials, the chemical valence states of the transition metals in the five sample materials were tested by X-ray photoelectron spectroscopy (XPS) in this experiment. The X-ray photoelectron spectroscopy (XPS) data for Co and Mn transition metals in the five cathode materials, LMNCO, nLMNCO-1.0, nLMNCO-2.0, nLMNCO-3.0, and nLMNCO-4.0, are shown in Figure 4. As shown in Figure 4a, the Mn2p3/2 binding energy of all five samples is consistent with the peak of standard Mn4+, which is theoretically located near 642.6 eV [18]. The consistent binding energy peak positions indicate that the valence states of Mn ions in the samples are all +4 valence, and the doping of LiNiO2 has basically no effect on the chemistry valence of Mn ions in the cathode material. Figure 4b shows that the binding energy of Co2p3/2 for all five samples is consistent with the peak of standard Co3+, which is theoretically located near 779.8 eV [19]. The consistent binding energy peak position of Co3+ in all samples indicates that the valence state of Co ions in the samples is +3 valence and the doping of LiNiO2 has basically no effect on the chemistry valence state of Co ions in the cathode material.
X-ray photoelectron spectroscopy (XPS) data for Ni in five sample materials, LMNCO, NLMnco-1.0, NLMnCo-2.0, NLMnCo-3.0, and NLMNCo-4.0, are shown in Figure 5, fitted by XPSPEAK software (XPSPEAK4.1, Raymond Kwok, Hong Kong, China). After data fitting, Ni contains two valence states, +2 and +3, and their bond energies correspond to 854.0 eV and 855.4 eV, respectively [20]. It can be seen that the Ni valence state of the LMNCO sample contains more Ni2+ and less Ni3+, while the Ni valence state of the samples doped with LiNiO2 contains less Ni2+ and more Ni3+. The modified sample has less Ni2+, and its Li+/Ni2+ cation mixing value is also lower than the pristine. As a result, LiNiO2 doping is thought to boost the sample’s battery cycle performance and rate capacity.

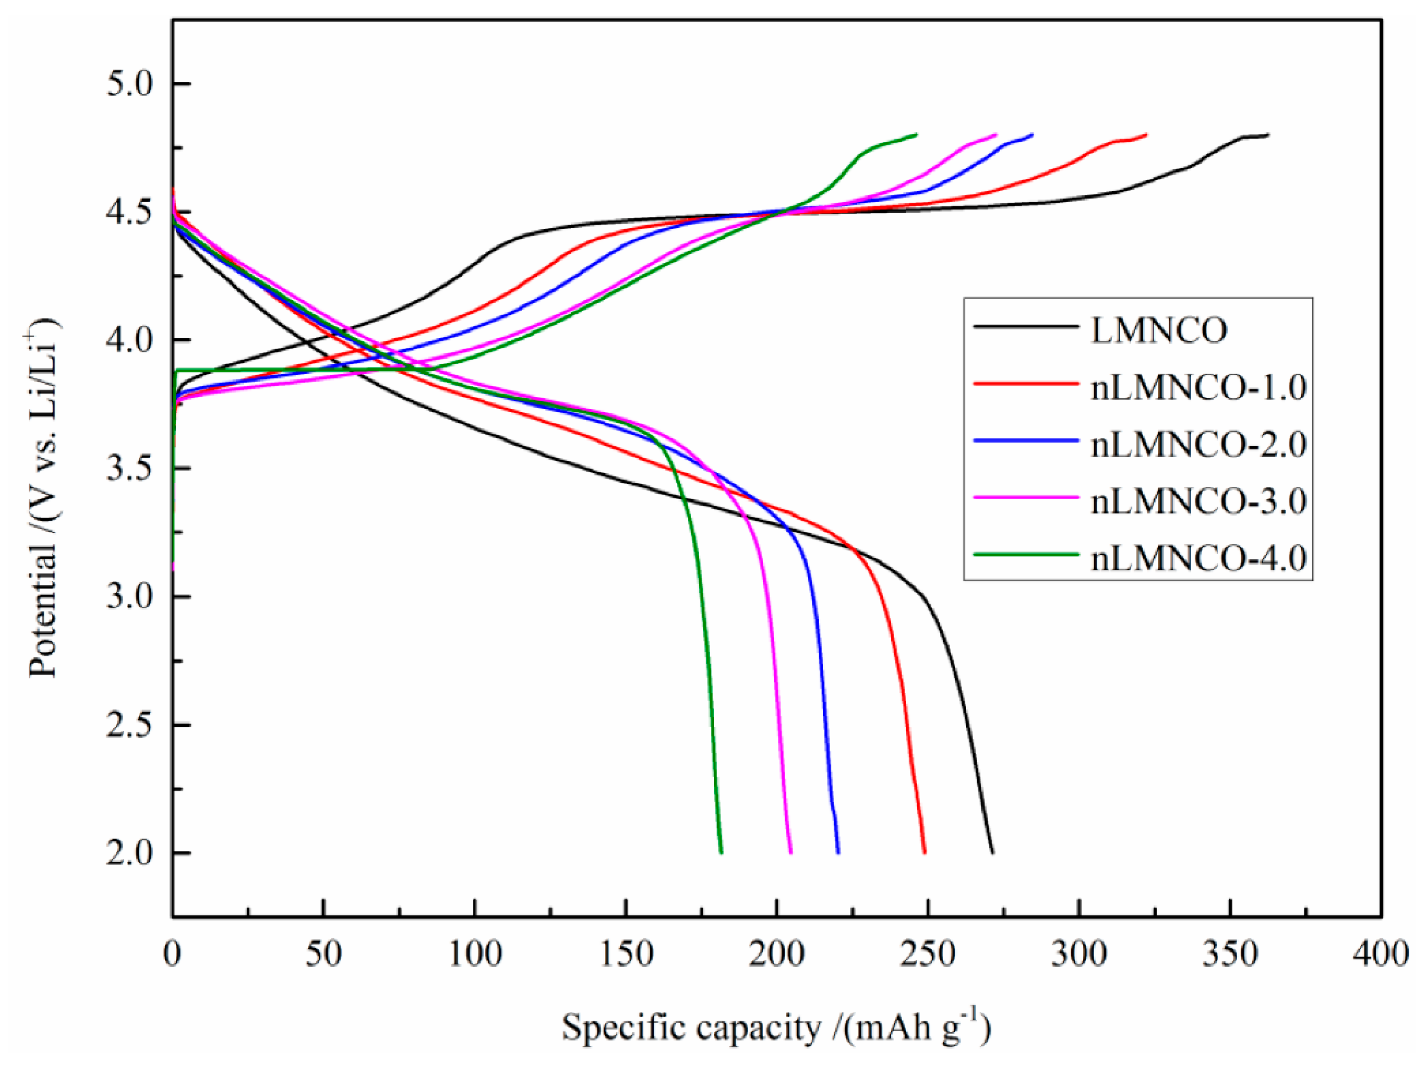
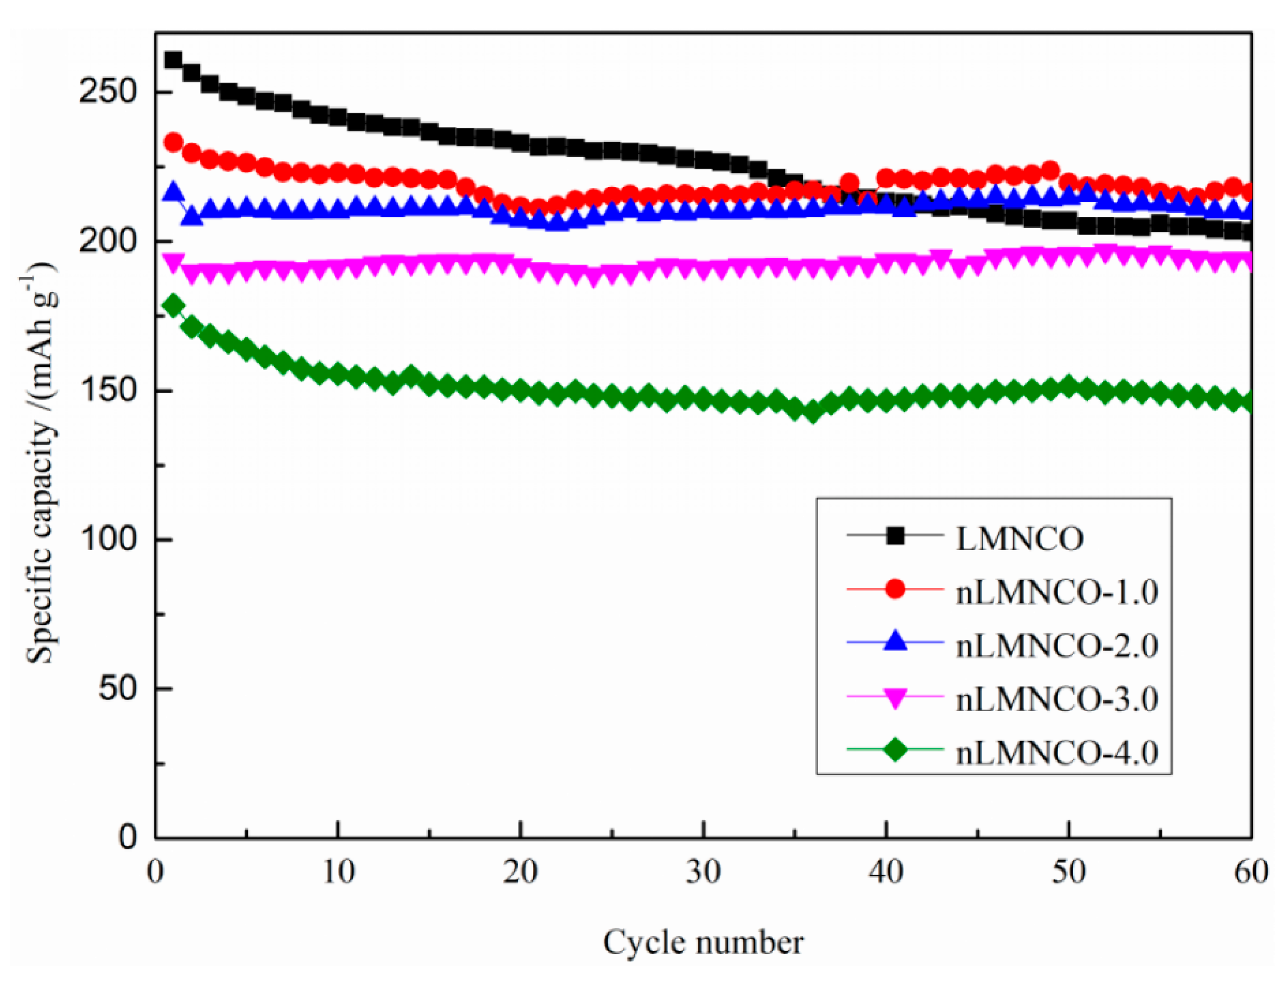
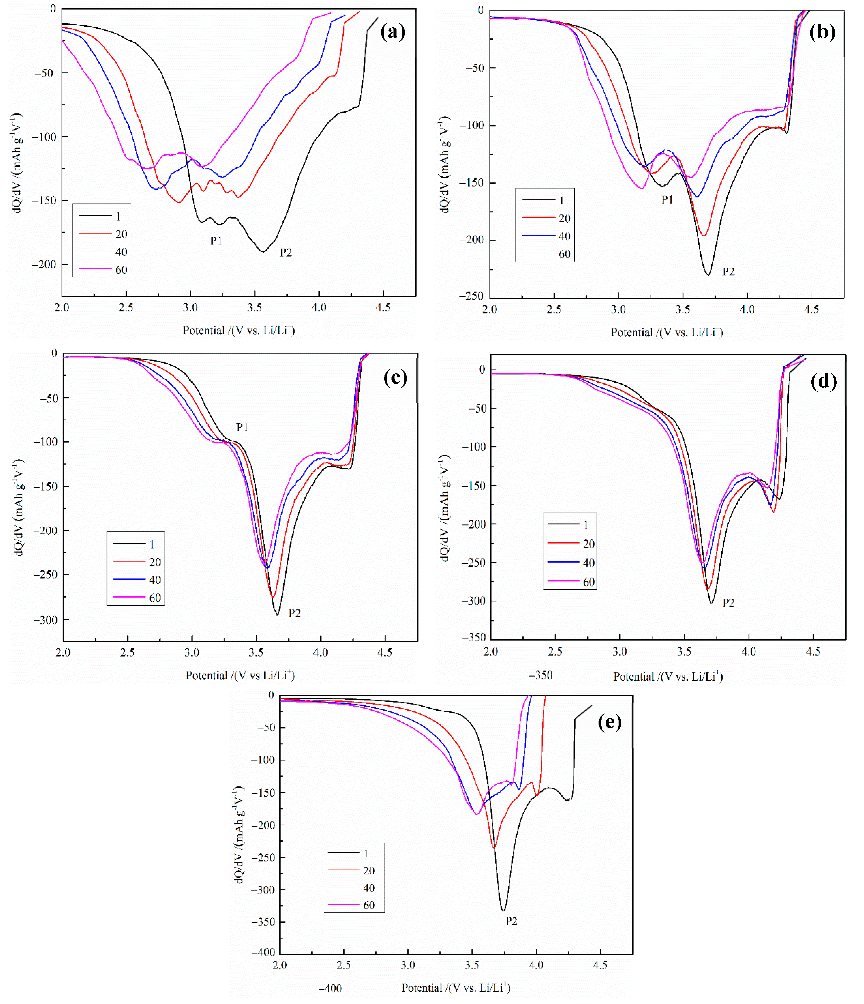
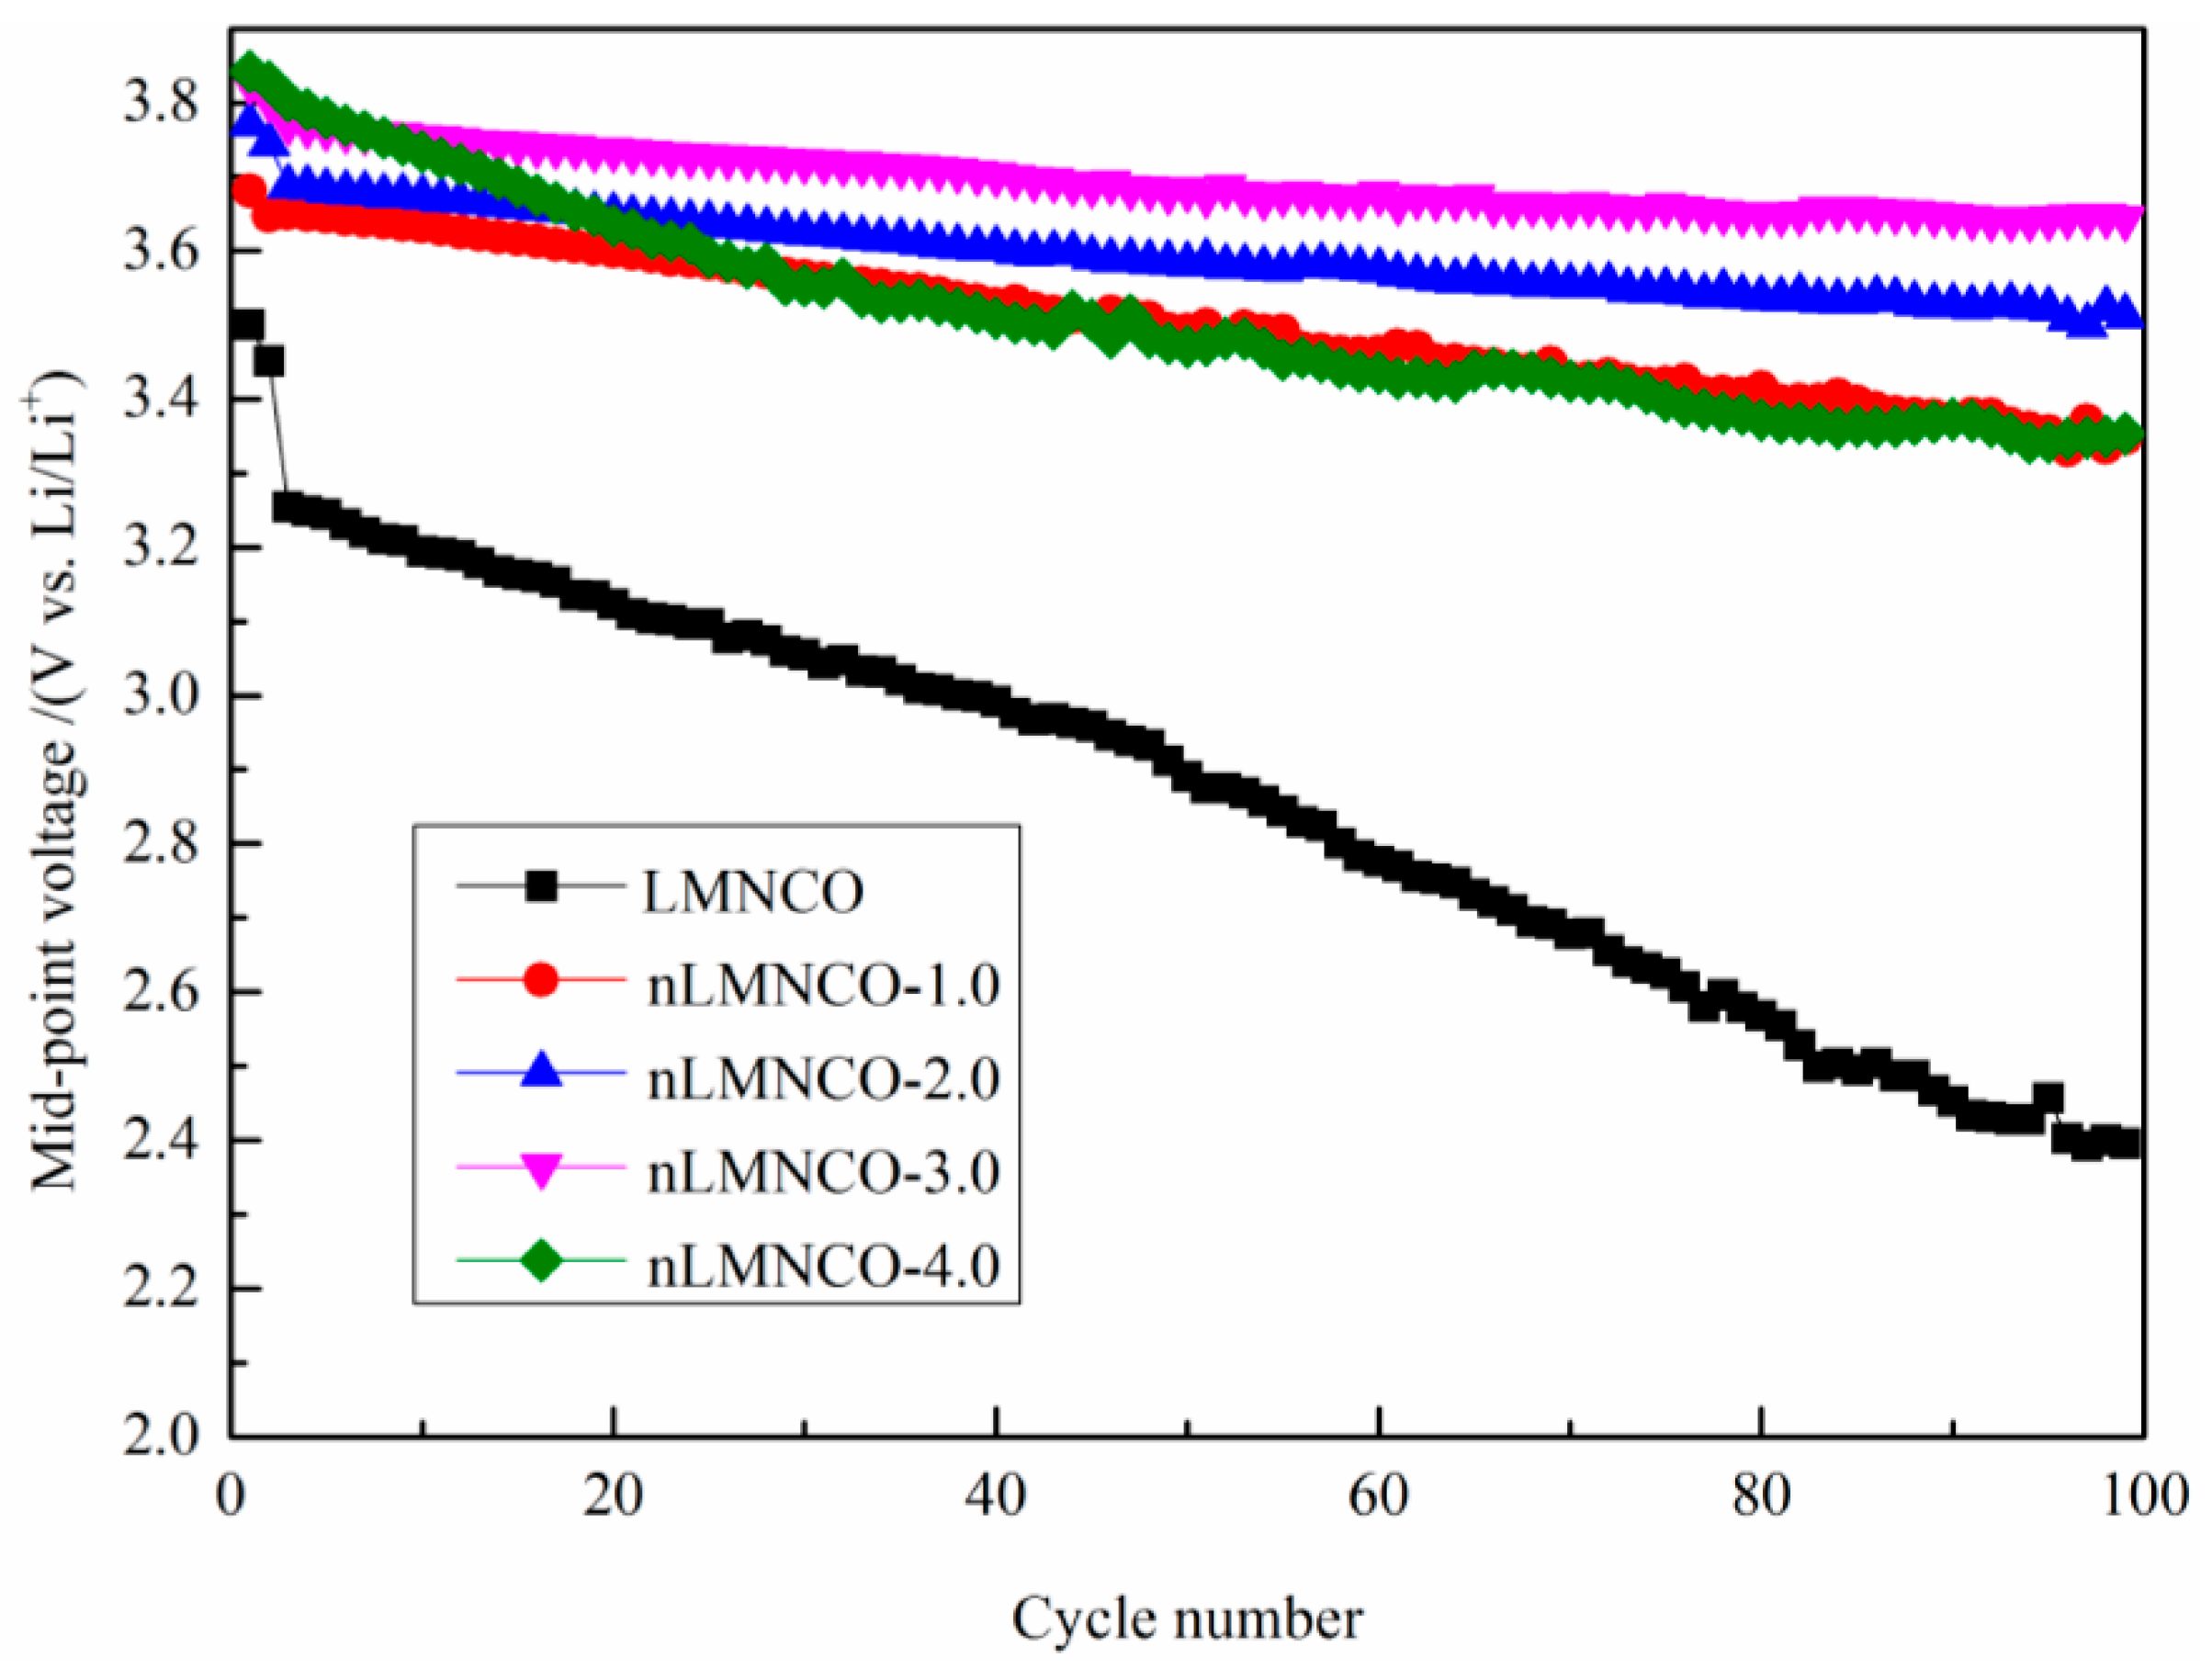
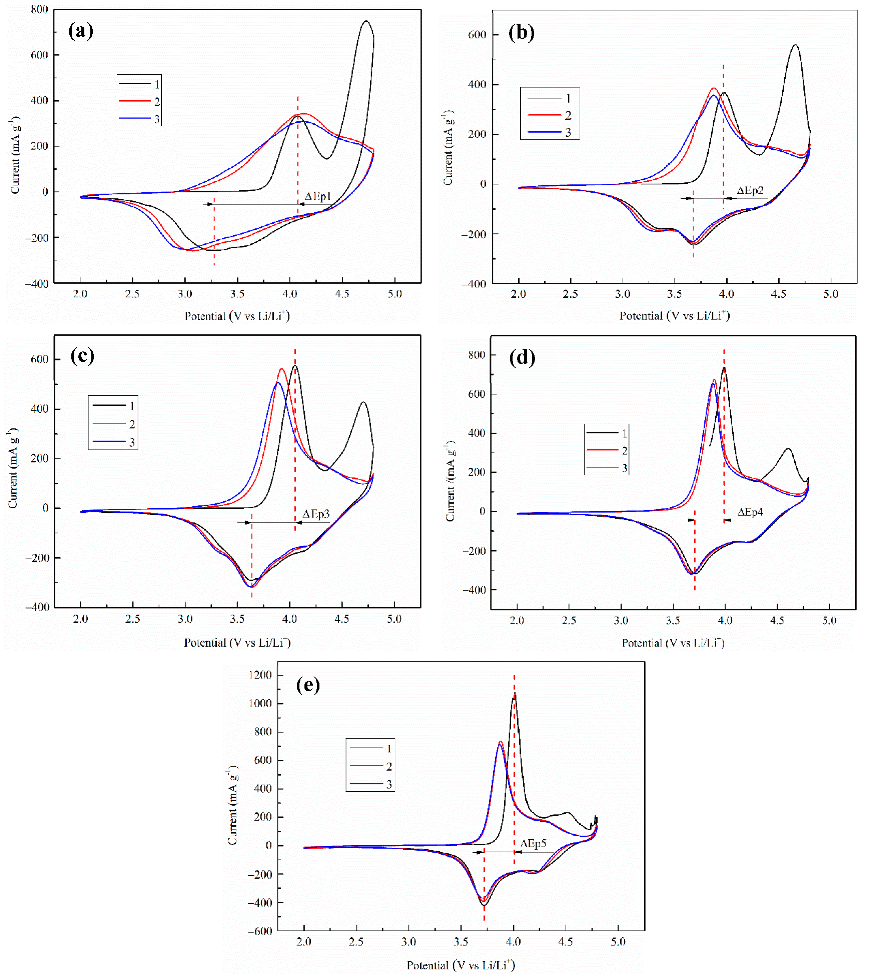
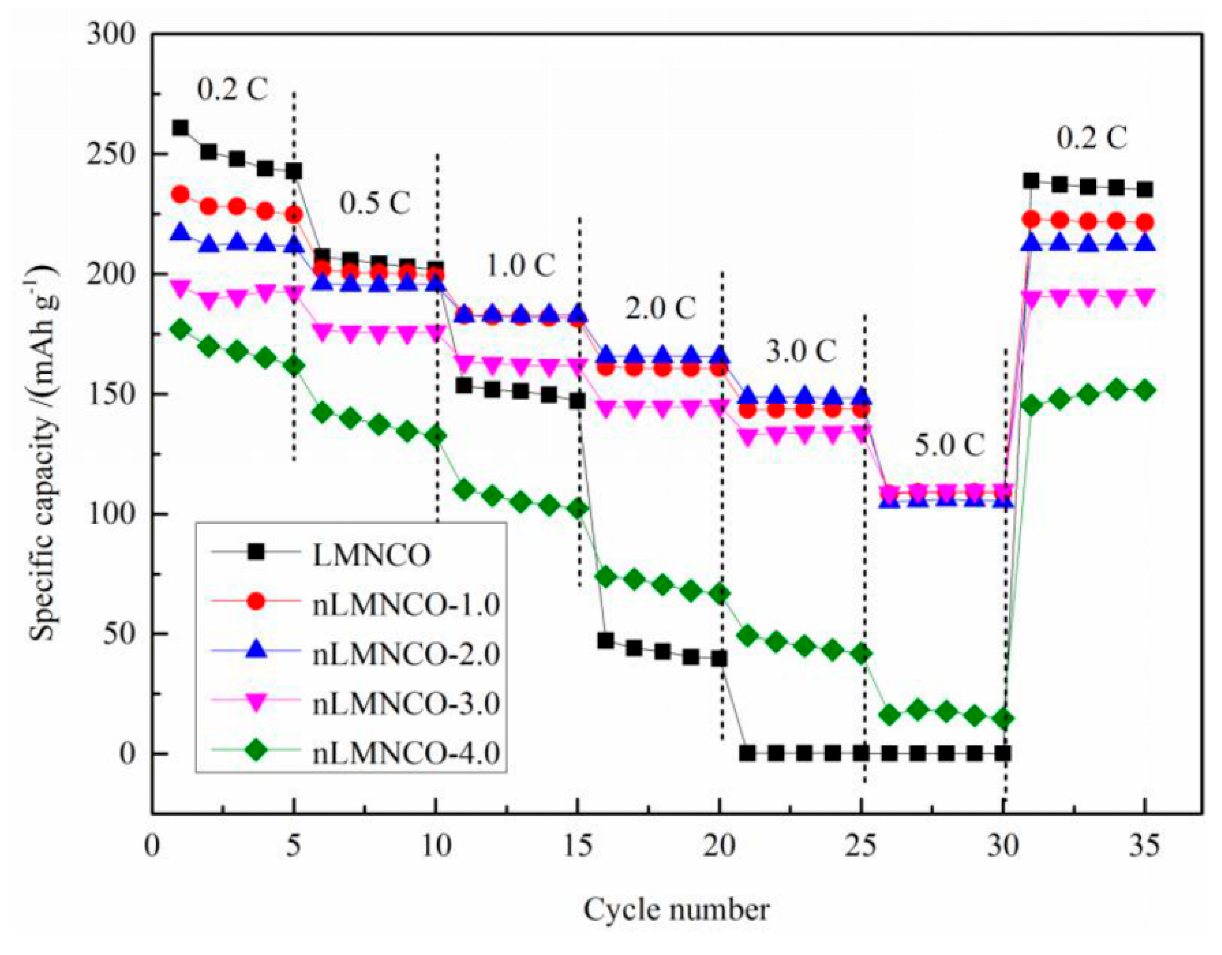
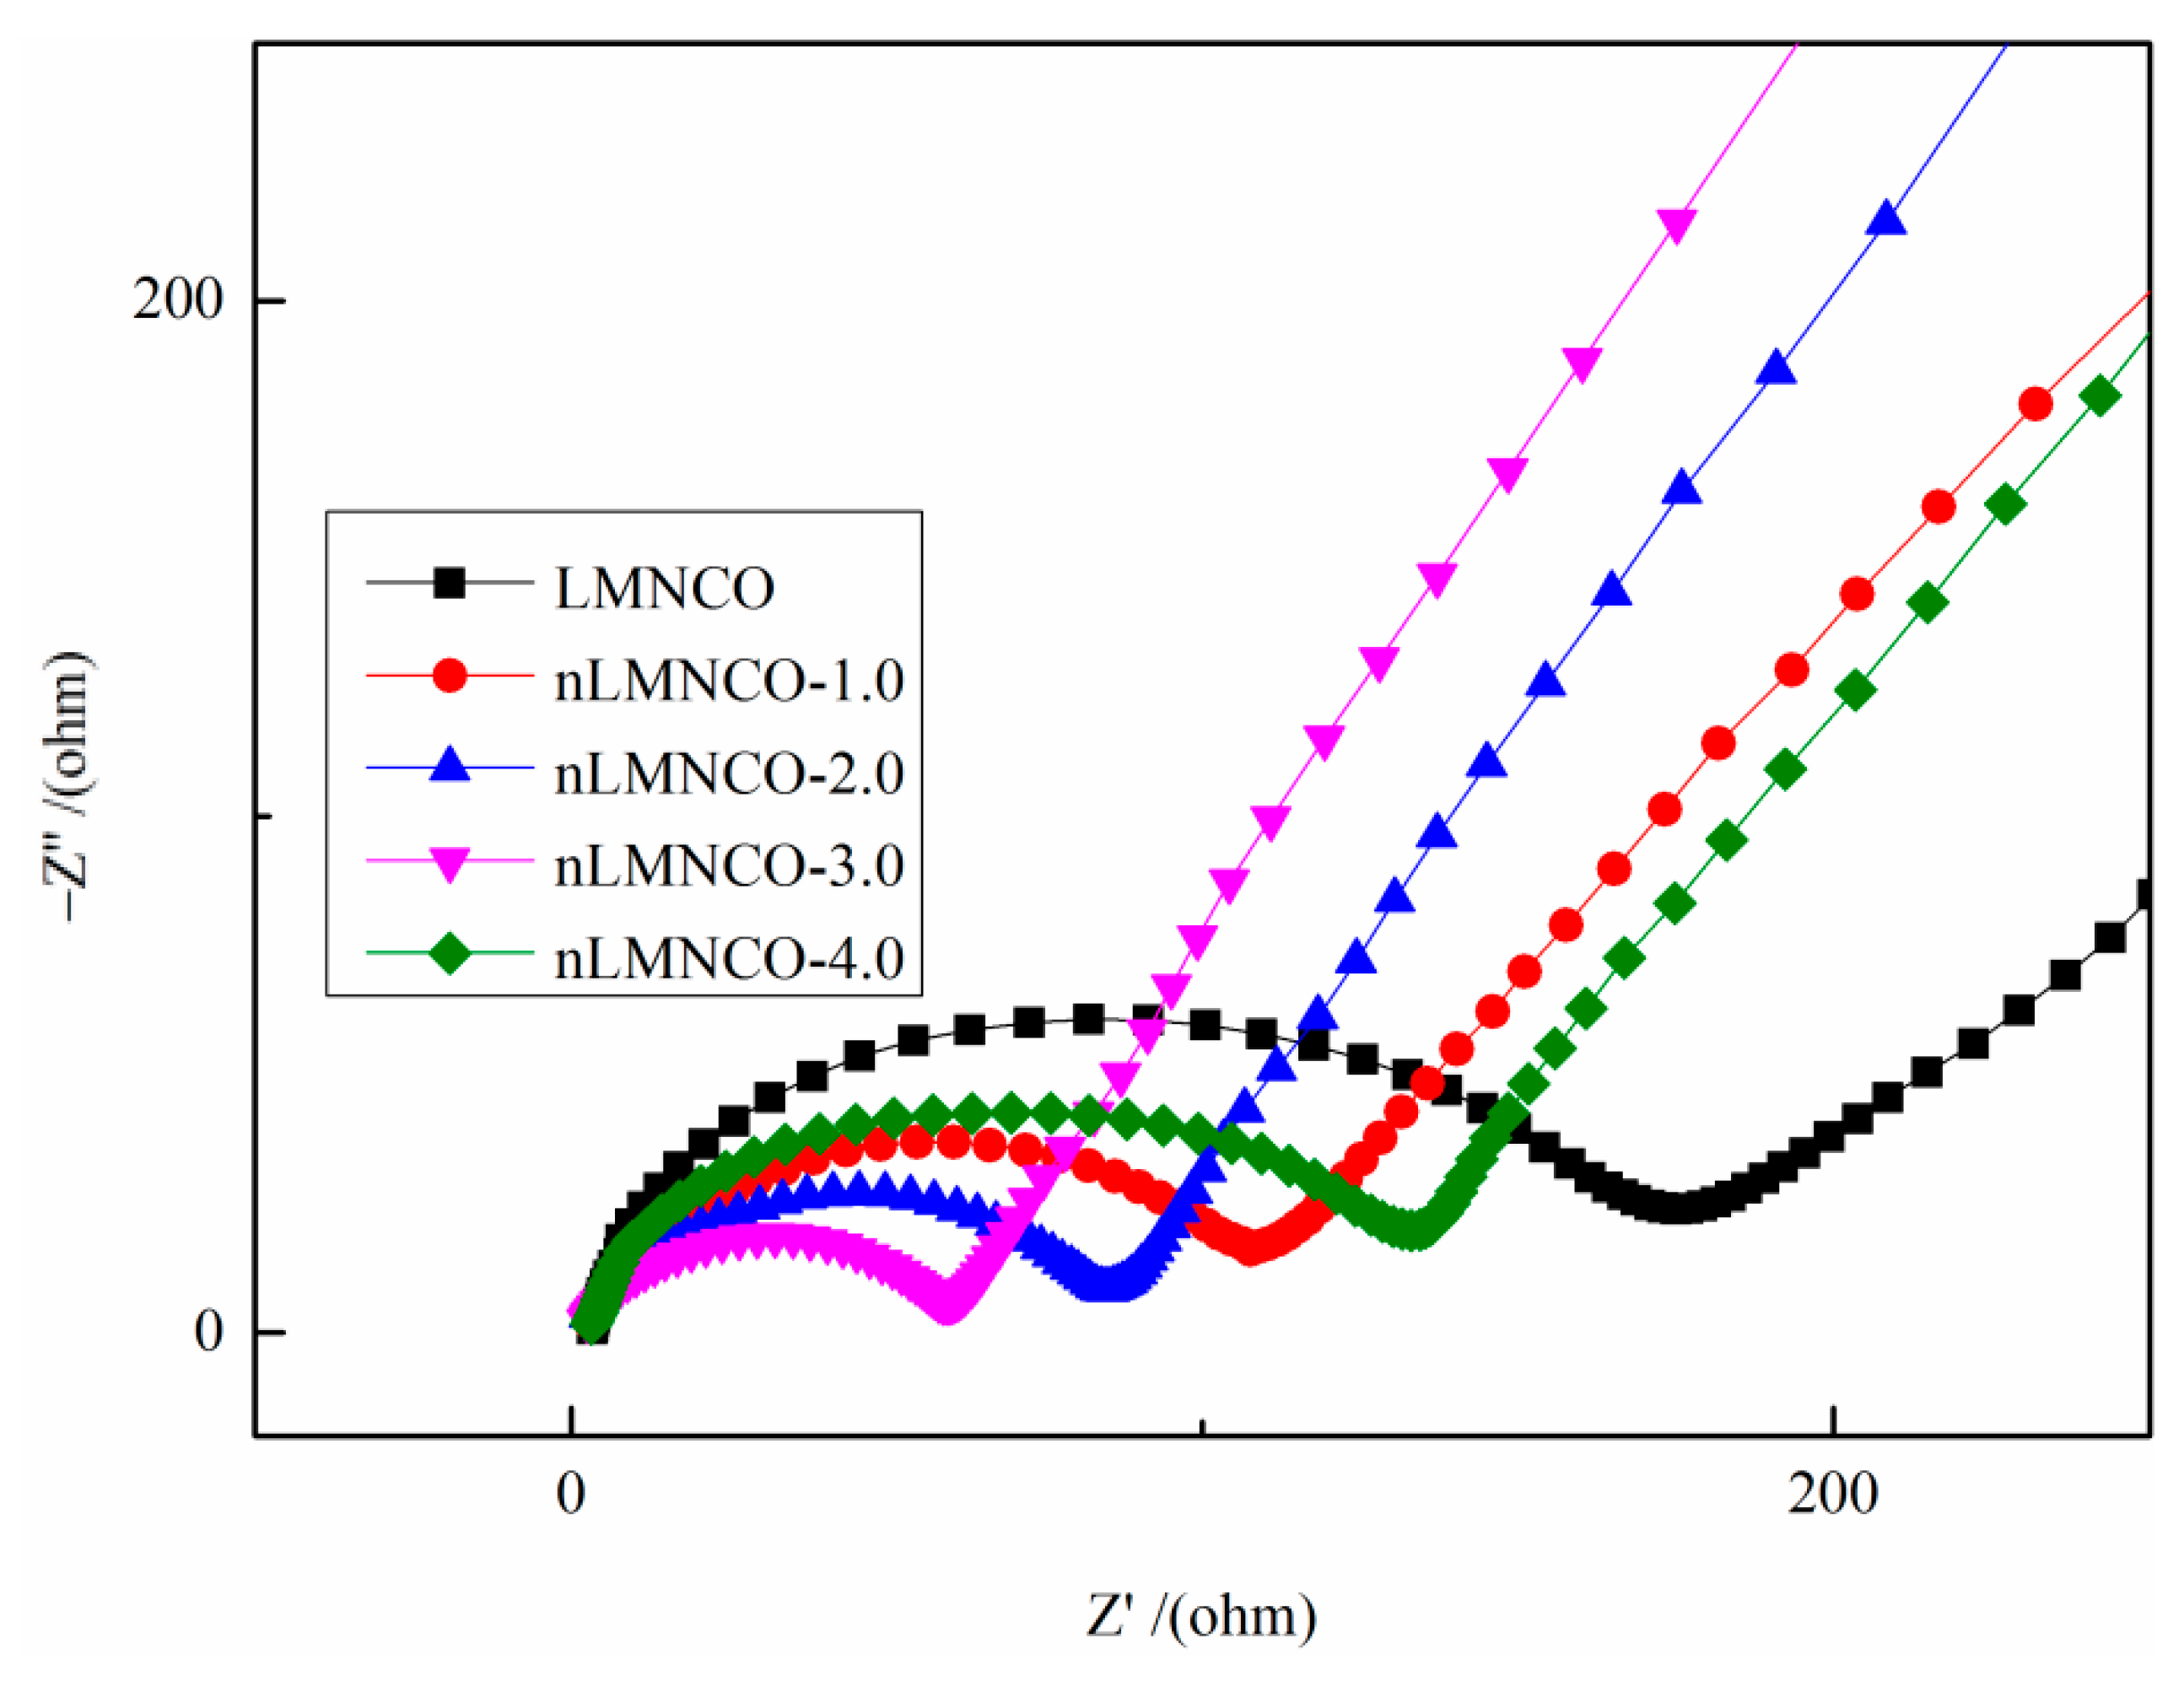
2.4. Electrochemical Performance Test

The first cycle curves of the cathode materials are displayed in Figure 6. Except for nlMNCO-4.0, all samples have two separate voltage ranges. The first voltage range is from open circuit voltage to 4.45 V cutoff, and the charging curve in this range increases slowly in an oblique manner with the increase of voltage. The second voltage range is above 4.45 V, where the charging curve contains a long voltage platform.
The first cycle curves of the modified samples have the following alterations, as illustrated in Figure 6:
  • In the first voltage range, the charge capacity of the samples increases as LiNiO2 levels rise;
  • The addition of LiNiO2 makes the voltage plateau of the sample 4.45 V shorter;
  • The specific capacity of the samples decreases as LiNiO2 concentration rises.
Table 2 summarizes the first-cycle specific capacity performance of the five samples to better understand the variations in the first charge-discharge curves of cathode materials before and after modification. For ease of understanding, the chemical formula of the cathode material (1 − x)Li1.2Mn0.54Co0.13Ni0.13O2 − xLiNiO2 can be rewritten as (1 − x)Li2MnO3 − (1 − x)Li[Mn1/3Co1/3Ni1/3]O2 − xLiNiO2. The electrochemical reactions in different voltage regions correspond to the activation of different components in the material. The charging capacity of the first voltage region is the contribution of transition metal ion oxidation to the LiMO2 component [21], and the LiMO2 component corresponds to the Li[Ni1/3Co1/3MN1/3]O2 + LiNiO2 part of the chemical formula. The Li2MnO3 composition in the material affects the charge capacity in the second voltage region and is accompanied by the irreversible desorption of Li2O from the Li2MnO3 composition [22]. The LMNCO sample has the highest content of Li2MnO3 components, so the LMNCO sample has the highest charging capacity in the second voltage region. With the increase in LiNiO2, the content of the Li2MnO3 component in the samples gradually decreases, and the charging capacity of the samples in the second voltage region gradually weaken. The initial charge capacities of the five samples, LMNCO, nLMNCO-1.0, nLMNCO-2.0, nLMNCO-3.0, and nLMNCO-4.0 are 362.5, 322.2, 291.5, 272.4 and 244.3 mAh g−1, respectively, and the initial discharge capacities are 271.4, 248.9, 223.0, 204.8, and 184.9 mAh g−1, respectively. The charge/discharge specific capacity of the samples decrease after doping with LiNiO2, which is related to the content of the Li2MnO3 component. Li2MnO3 is activated to extend the voltage plateau of 4.45 V [23] and increase the overall charge/discharge capacity of the sample. The initial irreversible capacity losses of the five samples, LMNCO, nLMNCO-1.0, nLMNCO-2.0, nLMNCO-3.0, and nLMNCO-4.0, were 91.1, 73.3, 68.5, 67.6, and 59.4 mAh g−1, respectively. The first irreversible capacity loss of the samples was mainly caused by changes in the crystal structure, such as the precipitation of oxygen and the rearranging of transition metal ions.
Figure 7 displays the cycle performance of all samples at 0.2 C (50 mA g−1). LMNCO, nLMNCO-1.0, nLMNCO-2.0, nLMNCO-3.0, and nLMNCO-4.0 had initial cycle discharge capacities of 260.8, 233.1, 215.9, 193.5, and 178.6 mAh g−1, respectively. The LMNCO sample’s discharge capacity deteriorated to 196.0 mAh g−1 after 60 cycles. The cycle performance curve shows that adding LiNiO2 to the material can improve the material’s cycle stability. The discharge specific capacity of the nLMNCO-1.0, nLMNCO-2.0, nLMNCO-3.0, and nLMNCO-4.0 samples after 60 cycles are 215.2, 209.7, 194.0 and 146.3 mAh g−1, respectively. The test results showed that doping with LiNiO2 could improve the cycling performance of the material. After 60 weeks of cycling, the nLMNCO-1.0 sample had the highest specific capacity, and the nLMNCO-3.0 sample had the strongest cycling stability.
The test current was increased from 0.2 C to 0.5 C to investigate the cycling performance of all samples at greater current densities. The cycle performance curves of the five samples are shown in Figure 8a. Figure 8b–e displays the discharge curves of the five samples at the different cycles to illustrate the decline of discharge capacity. After doping with LiNiO2, the sample material still retains good cycle stability with a higher current density. The capacity retention rates of nLMNCO-1.0, nLMNCO-2.0, nLMNCO-3.0, after 100 cycles are 93.9%, 97.6% and 99.0%, respectively. However, the capacity retention rate of the LMNCO sample material is only 75.1%. The reason the cycling stability of the samples improved after incorporating LiNiO2 is that under the same oxidizing environment, nickel ions have higher electronegativity and ionization energy than manganese ions, and at higher valence oxidation states, the Ni-O band exhibits high covalent characteristics. Therefore, an appropriate increase in Ni content in the lithium battery cathode material can improve the cycling stability of the sample material. A comprehensive comparison of the four modified samples showed that the nLMNCO-2.0 sample had the highest specific capacity after 100 weeks of cycling, and the nLMNCO-3.0 sample still maintained the best cycling stability.
The dQ/dV curves of the five samples are shown in Figure 9 related to analyzing the structural evolution of the sample materials throughout cycling. The reduction peaks of P2 in the figure correspond to the reduction reactions of Ni+4/Ni+3, Ni+3/Ni+2, and Co+4/Co+3 [24], and as the coefficient x increases, the intensity of the P2 reduction peak increases, indicating that the Ni+4/Ni+3, Ni+3/Ni+2, and Co+4/Co+3 transition metal ion pairs involved in the reduction reaction increase. The P1 peak represents the Mn+4/Mn+3 reduction reaction in the cathode material [25], and careful observation of the P1 reduction peaks of the five samples shows that with the increase of coefficient x, the peak of the P1 reduction peak weakens; additionally, when the LiNiO2 doping amount x = 4, the peak disappears in the dQ/dV curve. This is because the incorporation of LiNiO2 will reduce the content of Li2MnO3 components in the material, thus reducing the Mn+4/Mn+3 transition metal ion pairs participating in the reaction. In general, the smaller reduction peak offset represents a strong electrochemical stability. Observing the change in the reduction peak of all samples, it can be seen that the reduction peak offset of the LMNCO sample is larger than all the others after 60 cycles and that the reduction peak of P1 is shifted to about 2.6 V, indicating that the structure of the sample is gradually transformed into the spinel phase. After adding LiNiO2, the offsets of reduction peaks were reduced in four samples: nLMNCO-1.0, nLMNCO-2.0, nLMNCO-3.0, and nLMNCO-4.0, indicating that doping Ni ion can stabilize the layered structure of the cathode material and prevent transition metal ions from rearranging.
The midpoint voltage of Li-rich manganese-based cathode materials will continue to drop during cycling, resulting in a decrease in energy output, which is the main obstacle to their widespread application. Figure 10 shows the midpoint voltages of all samples. The median voltage of the LMNCO sample decreased from 3.25 V to 2.39 V in 100 cycles, and the voltage drop was 0.86 V. The voltage drop of the samples decreases greatly once LiNiO2 is incorporated, as can be shown in Figure 9. During 100 cycles, the midpoint voltage of the nLMNCO-1.0 sample decreased from 3.65 V to 3.35 V, the midpoint voltage of the nLMNCO-2.0 sample decreased from 3.69 V to 3.51 V, the midpoint voltage of the nLMNCO-3.0 sample decreased from 3.77 V to 3.64 V, and the midpoint voltage of the nLMNCO-4.0 sample decreased from 3.80 V to 3.35 V. The increase in the midpoint voltage and the decrease in the voltage drop of the samples after doping with LiNiO2 can be explained as follows:
(1) The lower the electronegativity of the transition metal ions, the easier it is to lose d orbital electrons, resulting in lower insertion and extraction voltages [11]. Under the same oxidizing environment, nickel ions have higher electronegativity than manganese ions and cobalt ions, so doping with Ni can improve the average voltage of cathode materials;
(2) Ni incorporation can improve the structural stability of the cathode material.
The CV test curves for the first three cycles of all samples are shown in Figure 11. There are two obvious oxidation peaks in the CV curve of the first coil, which are consistent with the two voltage ranges of the charge curve of the first cycle. The low potential reduction peak represents the oxidation of the transition metal pairs in LiMO2 components [26]. The intensity of this peak grows in proportion to the rise in Ni concentration, indicating that Ni2+/Ni3+, Ni3+/Ni4+, and Co3+/Co4+ transition metal ion pairs contribute more capacity. The high potential oxidation peak represents the activation of the Li2MnO3 component [27]. The peak at 3.7 V corresponds to the reduction reactions of Ni+4/+3/+2 and Co+4/+3 in the layered structure, while the peak at 3.2 V relates to the reduction reactions of Mn+4/+3 [28,29]. With increasing coefficient x, the reduction peak at low potential becomes less and less obvious and a stronger peak is not better. This is because the reduction peak potential is below 3.5 V, making it is easy to reduce the voltage platform of the lithium-rich material, so more capacity contribution of this part is not better. The voltage differential (Ep) between the oxidation and reduction peaks can be utilized to demonstrate Li-rich manganese-based materials’ electrochemical reversibility [20]. The ΔEp values of five sample materials, LMNCO, nLMNCO-1.0, nLMNCO-2.0, nLMNCO-3.0, and nLMNCO-4.0, are 0.753, 0.293, 0.420, 0.269, and 0.292 V, respectively. The lower the Ep value, the better the electrochemical reversibility. The electrochemical reversibility of the sample material appears to improve with the addition of LiNiO2, which is consistent with the sample’s improved cycling performance.
Figure 12 presents the rate performance curves of the five samples. The average discharge capacities of all samples at the five rates are summarized in Table 3. The discharge capacity of the LMNCO sample is almost zero at the higher current densities of 3.0 C and 5.0 C. Compared with the LMNCO sample material, LiNiO2 can greatly improve the sample’s discharge performance at high current density. Among the samples, the nLMNCO-3.0 has the most significant improvement in discharge performance at higher current density.
In order to investigate the effect of LiNiO2 doping on the multiplicative performance of cathode materials, five sample materials, LMNCO, nLMNCO-1.0, nLMNCO-2.0, nLMNCO-3.0, and nLMNCO-4.0, were next tested for AC impedance. The frequency range tested was 0.01 HZ-100 KHZ with an amplitude of 5 mV. Before the AC impedance test, all samples were charged and discharged three times at low current density to generate a full SEI layer on the material surface. Figure 13 shows the Nyquist plots for the five samples. The semicircle in the high frequency zone and the oblique line in the low frequency region make up the impedance maps of all samples. The migration impedance of the lithium ions inside the electrolyte is represented by the intercept between the semicircle in the high frequency zone and the real axis of impedance, and the acquired value is often very tiny, indicated by Rs. The charge transfer impedance, Rct, is represented by the semicircle in the high frequency zone; the Warburg impedance, Zw, is reflected by the diffusion of Li+ in the solid-phase active material in the cathode material and is shown by the oblique line in the low-frequency region [1]. The inset in Figure 12 shows the equivalent circuit diagram [30]. Based on the AC impedance map, the impedance value of the sample material and the lithium-ion diffusion coefficient can be obtained after the equivalent circuit is fitted and the equation calculation. The diffusion coefficient of lithium ion can be calculated as follows [31]:
D L i = R 2 T 2 2 A 2 n 4 F 4 C 2 σ 2
R is the ideal gas constant (8.314 J·K−1·mol−1), T is the absolute temperature (298 K), F is the Faraday constant (96,500 C·mol−1), A is the surface area of the electrode, C represents the concentration of Li+ in the anode material, and σ represents the Warburg factor, which has the following relationship with Z′:
Z = σ ω 1 / 2
The impedance values and lithium-ion diffusion coefficients of the sample materials are shown in Table 4. The calculation of the diffusion coefficient of lithium ions by Equations (1) and (2) shows that the doped LiNiO2 improves the diffusion ability of lithium ions in the cathode material and accelerates the diffusion rate of Li+ in the native material. In addition, the impedance value of the sample material decreases significantly with the doping of LiNiO2, which is mainly caused by the fact that the doping with LiNiO2 increases the particle size of the sample material. On the one hand, the increased particle size will make the surface of the material in contact with the electrolyte smaller, thus weakening the occurrence of side reactions between the electrode material and the electrolyte, which will lower the impedance value of the sample material, thus increasing the charge transfer rate on the electrode surface and accelerating the diffusion rate of Li+ on the material surface. On the other hand, increasing particle size will the increase of diffusion path of Li ions, which may affect the rate performance of the sample material. In the interval of x = 0–0.3, the decrease of impedance and the increasing Li-ion diffusion coefficient of the sample material will suppress the effect on the rate performance of the sample material due to the increase of particle size, thus improving the rate performance of the material. At x = 0.4, the material particles not only become coarser but also agglomerate. Although the impedance and lithium-ion diffusion coefficient of sample nLMNCO-4.0 are still better than those of the original material, the larger particles and the agglomeration will further increase the Li ion de-embedding distance and make the active material in the center of the particles underutilized, thus leading to the degradation of the sample’s rate performance.

3. Experimental

3.1. Material Synthesis

The cathode materials were synthesized by sol-gel method. In detail, the stoichiometric amounts of CH3COOLi ·2H2O (analytical purity, 99.0%), Ni(CH3COO)2·4H2O (analytical purity, 99.0%), Co (CHCOO)2·4H2O (analytical purity, 99.0%), and Mn(CHCOO)2·4H2O (analytical purity, 99.0%) were dissolved in 60 mL of deionized water. Then, using the metering ratio nC6H8O7: n(Li + Ni + Co + Mn) = 1:1, a given amount of citric acid was weighed and then dissolved in 30 mL of deionized water. The two solutions were then stirred well, and ammonia was used to adjust the pH of the solution to between 8–9. The mixed solution was then stirred and heated to 95 °C for several hours until the gel evaporated to dry. After that, the wet gel was vacuum dried for 12 h at 120 °C. The dried product was next sintered for 5 h in air at 450 °C, then calcined for 12 h at 900 °C to produce Li1.2Mn0.54Co0.13Ni0.13O2 (x = 0), Li1.18Mn0.486Co0.117Ni0.217O2 (x = 1), Li1.16Mn0.432Co0.104Ni0.304O2 (x = 2), Li1.14Mn0.378Co0.091Ni0.391O2 (x = 3), Li1.2Mn0.324Co0.078Ni0.478O2 (x = 4), hereinafter referred to as LMNCO, nLMNCO-1.0, nLMNCO-2.0, nLMNCO-3.0, and nLMNCO-4.0.

3.2. Measurements

The crystal structure of the materials was analyzed by X-ray diffractometer (XRD, SMARTLAB 3KW, Rigaku, Tokyo, Japan) with a Cu Kα radiation source. The scanning rate was 5° per minute, and the range of 2θ was 10–90°. The materials’ morphology was examined using a field emission scanning electron microscope (FE-SEM, SU8220, Hitachi, Tokyo, Japan). Transmission electron microscopy was used to examine the materials’ microstructure (TEM). X-ray photoelectron spectroscopy (XPS, ESCALAB 250Xl+, Thermo Scientific, MA, USA) was used to examine the surface composition and chemical valence states of surface elements.

3.3. Electrochemical Test

The positive electrode materials, carbon black (Super-P) and polyvinylidene fluoride (PVDF), were combined and agitated in N-methylpyrrolidone to make a slurry in an 8:1:1 mass ratio. The slurry was applied to aluminum foil and dried in a drying oven at 120 °C for 12 h. The dried aluminum foil was pressed to a thickness of 20 nm using a roller press, and then the foil was cut to obtain circular electrode sheets with a radius of 7 mm and a mass of about 3 mg per sheet. In a glove box full of AR, a CR2032 coin cell battery was assembled. The anode was lithium metal, and the electrolyte was LiPF6 dissolved in ethylene carbonate/dimethyl carbonate/ethyl methyl carbonate at a concentration of 1 mol/L. (volume ratio 1:1:1). Battery Testing System produced by NEWARE (Shenzhen, China) was used to conduct electrochemical performance testing. The CHI700E series electrochemical workstation produced by Shanghai Huachen (Shanghai, China) was used to test and analyze the impedance (EIS) of the battery. The test frequency of battery impedance was 0.01–100 Hz, and the test amplitude was 5 mV.

4. Conclusions

A simple sol-gel method is used to synthesis the LiNiO2-doped lithium-rich layered oxides (1 − x)Li1.2Mn0.54Co0.13Ni0.13O2 − xLiNiO2. Incorporating LiNiO2 into Li-rich cathode materials can clearly enhance the electrochemical properties. On the one hand, the incorporation of LiNiO2 can reduce the cation mixing degree of Li+/Ni2+, thereby reducing the impact on the capacity and structural stability of the electrode materials caused by ion mixing. On the other hand, Ni-O bonds with strong covalent bond properties can reinforce the lattice structure, speed up the Li+ diffusion rate in cathode materials, and prevent the layered structure’s irreversible phase transition. The nLNMCO-1.0 and nLNMCO-2.0 samples each exhibit the highest discharge specific capacity at different current densities, but the nLMNCO-3.0 sample performs best in terms of cycling stability, rate performance, and other electrochemical properties. At 0.5 C for 100 cycles, the capacity loss of nLMNCO-3.0 is only 0.4 mAh g−1. The experimental method is simple and straightforward to implement, and it could pave the way for the future development of high-energy-density lithium-ion batteries.

Author Contributions

Conceptualization, H.W.; methodology, H.W.; software, H.W.; validation, H.W.; formal analysis, H.W.; investigation, H.W.; resources, F.Z.; data curation, H.W.; writing—original draft preparation, H.W.; writing—review and editing, F.Z.; funding acquisition, H.Z. and X.M. All authors have read and agreed to the published version of the manuscript.

Funding

This research was funded by Guangxi Innovation-Driven Development Special Fund Project, Grant No. Guike AA17204100-7, the Natural Science Foundation of Guangxi Province, China (Grant Nos. 2018GXNSFAA138186, 2014GXNSFAA118025, 2013GXNSFBA019019), the National Natural Science Foundation of China (Grant No. 11364003), the Systematic Research Project of Key Laboratory of Processing for Non-ferrous Metal and Featured Materials of Guangxi Province, China (Grant No. GKN13-051-02), Open Fund of Ministry-Province Jointly-Constructed Cultivation Base for State Key Laboratory of Processing for Non-ferrous Metal and Featured Materials, Guangxi province, China (Grant No. GXKFJ12-01).

Data Availability Statement

Not applicable.

Acknowledgments

The experimental equipment of this project is supported by Guangxi University-Citic Dameng Joint Research Institute of Comprehensive Utilization of Manganese Resources and Advanced Material Technology.

Conflicts of Interest

The authors declare no conflict of interest.

References

  1. Ming, L.; Zhang, B.; Cao, Y.; Zhang, J.F.; Wang, C.H.; Wang, X.W.; Li, H. Effect of Nb and F co-doping on Li1.2Mn0.54Co0.13Ni0.13O2 cathode material for high-performance lithium-ion batteries. Front. Chem. 2018, 6, 76. [Google Scholar] [CrossRef] [PubMed] [Green Version]
  2. Zhou, L.; Liu, J.; Huang, L.; Jiang, N.; Zheng, Q.; Lin, D. Sn-doped Li1.2Mn0.54Co0.13Ni0.13O2 cathode materials for lithium-ion batteries with enhanced electrochemical performance. J. Solid State Electrochem. 2017, 21, 3467–3477. [Google Scholar] [CrossRef]
  3. Nation, L.; Wu, Y.; James, C.; Qi, Y.; Powell, B.R.; Sheldon, B.W. Si-doped high-energy Li1.2Mn0.54Co0.13Ni0.13O2 cathode with improved capacity for lithium-ion batteries. J. Mater. Res. 2018, 33, 4182–4191. [Google Scholar] [CrossRef]
  4. Deng, B.; Lin, Z.; Chen, Y.; He, W.; Wang, J.; Xie, Q.; Wang, L.; Peng, D.-L. Preparation of porous Li1.2Mn0.54Co0.13Ni0.13O2 micro-cubes for high-capacity lithium-ion batteries. J. Alloys Compd. 2020, 834, 155152. [Google Scholar] [CrossRef]
  5. Leifer, N.; Penki, T.; Nanda, R.; Grinblat, J.; Luski, S.; Aurbach, D.; Goobes, G. Linking structure to performance of Li1.2Mn0.54Co0.13Ni0.13O2 (Li and Mn rich NMC) cathode materials synthesized by different methods. Phys. Chem. Chem. Phys. 2020, 22, 9098–9109. [Google Scholar] [CrossRef] [PubMed]
  6. Lou, M.; Fan, S.S.; Yu, H.T.; Xie, Y.; Zhang, Q.; Zhu, Y.R.; Yi, T.F.; Tian, G.H. Mg-doped Li1.2Mn0.54Co0.13Ni0.13O2 nano flakes with improved electrochemical performance for lithium-ion battery application. J. Alloys Compd. 2018, 739, 607–615. [Google Scholar] [CrossRef]
  7. Susai, F.A.; Kovacheva, D.; Chakraborty, A.; Kravchuk, T.; Ravikumar, R.; Talianker, M.; Grinblat, J.; Burstein, L.; Kauffmann, Y.; Major, D.T.; et al. Improveing performance of LiNi0.8Co0.1Mn0.1O2 cahode materials for lithium-ion batteries by doping with molybdenum-ions: Theoretical and experiental studies. ACS Appl. Energy Mater. 2019, 2, 4521–4534. [Google Scholar] [CrossRef]
  8. Su, X.; Wang, X.; Chen, H.; Yu, Z.; Qi, J.; Tao, S.; Chu, W.; Song, L. Enhanced electrochemical performance of Ti-doping Li1.15Ni0.47Sb0.38O2 as lithium-excess cathode for lithium-ion batteries. Chin. J. Chem. 2017, 35, 1853–1860. [Google Scholar] [CrossRef]
  9. Wei, X.; Yang, P.; Li, H.; Wang, S.; Xing, Y.; Liu, X.; Zhang, S. Synthesis and properties of mesoporous Zn-doped Li1.2Mn0.54Co0.13Ni0.13O2 as cathode materials by a MOFs-assisted solvothermal method. RSC Adv. 2017, 7, 35055–35059. [Google Scholar] [CrossRef] [Green Version]
  10. Shi, J.L.; Xiao, D.D.; Ge, M.; Yu, X.; Chu, Y.; Huang, X.; Zhang, X.-D.; Yin, Y.-X.; Yang, X.-Q.; Guo, Y.-G.; et al. High-Capacity Cathode Material with High Voltage for Li-Ion Batteries. Adv. Mater. 2020, 30, 1705575. [Google Scholar] [CrossRef]
  11. Zhang, K.; Zhang, L.; Liu, J.; Wu, X.; Zhou, C.; Yan, W.; Zhou, C.; Fu, L.; Wu, Y. Hollow microspherical layered xLi2MnO3·(1-x)LiNiO2(x=0.3–0.7) as cathode material for lithium-ion batteries. J. Alloys Compd. 2019, 790, 1034–1042. [Google Scholar] [CrossRef]
  12. Sun, Y.K.; Chen, Z.; Noh, H.J.; Lee, D.J.; Jung, H.G.; Ren, Y.; Wang, S.; Yoon, C.S.; Myung, S.-T.; Amine, K. Nanostructured high-energy cathode materials for advanced lithium batteries. Nat. Mater. 2012, 11, 942–947. [Google Scholar] [CrossRef] [PubMed]
  13. Lim, J.H.; Bang, H.; Lee, K.S.; Amine, K.; Sun, Y.K. Electrochemical characterization of Li2MnO3-Li[Ni1/3Co1/3Mn1/3]O2-LiNiO2 cathode synthesized via co-precipitation for Lithium secondary batteries. J. Power Sources 2009, 189, 571–575. [Google Scholar] [CrossRef]
  14. Zhang, Y.; Zhu, T.; Lin, L.; Yuan, M.; Li, H.; Sun, G.; Ma, S. Hierarchical Li1.2Mn0.54Co0.13Ni0.13O2 hollow spherical as cathode material for Li-ion battery. J. Nanopart. Res. 2017, 19, 373. [Google Scholar] [CrossRef]
  15. Zhou, Y.; Yan, W.; Li, S.; Mei, J.; Liu, G. Irregular micro-sized Li1.2Mn0.54Co0.13Ni0.13O2 particles as cathode material with a high volumetric capacity for Li-ion batteries. J. Alloys Compd. 2017, 695, 2951–2958. [Google Scholar] [CrossRef]
  16. Yang, F.; Lin, S.Z.; Guo, Z.M.; Shao, Y.R.; Zhang, B.; Zhang, X.D.; Zhang, X.D.; Yan, S.H.; Volinsky, A.A. Suppressed voltage decay and improved electrochemical performance by coating LiAl5O8 on the surface of Li1.2Mn0.54Ni0.13Co0.13O2. J. Alloys Compd. 2019, 15, 1034–1043. [Google Scholar] [CrossRef]
  17. Orlova, E.D.; Savina, A.A.; Abakumov, S.A.; Morozov, A.V.; Abakumov, A.M. Comprehensive Study of Li+/Ni2+ Disorder in Ni-Rich NMCs Cathodes for Li-Ion Batteries. Symmetry 2021, 13, 1628. [Google Scholar] [CrossRef]
  18. Chong, S.K.; Wu, Y.F.; Chen, Y.Z.; Shu, C.Y.; Liu, Y.N. A strategy of constructing spherical core-shell structure of Li1.2Ni0.2Mn0.6O2@ Li1.2Ni0.4Mn0.4O2 cathode material for high-performance lithium-ion batteries. J. Power Sources 2017, 356, 153–162. [Google Scholar] [CrossRef]
  19. Zhang, N.; Sun, Y.; Zhao, L.; Wu, J.; Dai, C.; Li, Y.; Wang, X.; Ding, F. Improving the electrochemical performance of lithium-rich cathode materials Li1.2Mn0.54Co0.13Ni0.13O2 by a method of tungsten doping. Ionics 2019, 25, 5239–5247. [Google Scholar] [CrossRef]
  20. Meng, F.B.; Wang, Z.X.; Li, X.H.; Deng, Y.G. Modification on improving the structural stabilities and cyclic properties of Li1.2Mn0.54Ni0.13Co0.13O2 cathode materials with CePO4. Ionics 2020, 26, 2117–2127. [Google Scholar] [CrossRef]
  21. Li, H.L.; Jian, Z.X.; Yang, P.H.; Li, J.J.; Xing, Y.L.; Zhang, S.C. Niobium doping of Li1.2Mn0.54Ni0.13Co0.13O2 cathode materials with enhanced structural stability and electrochemical performance. Ceram. Int. 2020, 46, 23773–23779. [Google Scholar] [CrossRef]
  22. Fu, X.Y.; Wang, J.Q.; Zhang, L.L.; Li, T.; Liu, J.; Yang, X.L. Enhanced electrochemical performance of Li1.2Mn0.54Ni0.13Co0.13O2 prepared by using activated carbon as template and carbon source. Ionics 2020, 26, 4423–4431. [Google Scholar] [CrossRef]
  23. Johnson, C.S.; Li, N.C.; Lefie, C.; Vaughey, J.T.; Thackeray, M.M. Synthesis, characterization and electrochemistry of lithium battery electrodes: xLi2MnO3·(1-x)LiMn0.33Ni0.33Co0.33O2(0≤x≤0.7). Chem. Mater. 2008, 20, 6095–6106. [Google Scholar] [CrossRef]
  24. Yu, Z.X.; Shang, S.L.; Gordin, M.L.; Mousharraf, A.; Liu, Z.K.; Wang, D. Ti-substituted Li[Li0.26Mn0.6TixNi0.07Co0.07]O2 layered cathode material with improved structural stability and suppressed voltage fading. J. Mater. Chem. A 2015, 3, 17376–17384. [Google Scholar] [CrossRef]
  25. Niu, B.B.; Li, J.L.; Liu, Y.Y.; Li, Z.Y.; Yang, Z. Re-understanding the function mechanism of surface coating: Modified Li-rich layered Li1.2Mn0.54Ni0.13Co0.13O2 cathodes with YF3 for high performance lithium-ions batteries. Ceram. Int. 2019, 45, 12484–12494. [Google Scholar] [CrossRef]
  26. Vivekanantha, M.; Senthil, C.; Kesavan, T.; Sasidharan, M. Reactive template synthesis of Li1.2Mn0.54Ni0.13Co0.13O2 nanorod cathode for Li-ion batteries: Influence of temperature over structural and electrochemical properties. Electrochim. Acta 2019, 317, 398–407. [Google Scholar] [CrossRef]
  27. Du, Z.L.; Peng, W.J.; Wang, Z.X.; Guo, H.J.; Hu, Q.Y.; Li, X.H. Improving the electrochemical performance of Li-rich Li1.2Mn0.54Ni0.13Co0.13O2 cathode material by LiF coating. Ionics 2018, 24, 3717–3724. [Google Scholar] [CrossRef]
  28. Yang, S.Q.; Wang, P.B.; Wei, H.X.; Tang, L.B.; Zhang, X.H. Li4V2Mn(PO4)4-stablized Li[Li0.2Mn0.54Ni0.13Co0.13]O2 cathode materials for lithium ion batteries. Nano Energy 2019, 63, 103889. [Google Scholar] [CrossRef]
  29. Mu, K.C.; Cao, Y.B.; Hu, G.R.; Du, K.; Yang, H.; Gan, Z.G.; Peng, Z.D. Enhanced electrochemical performance of Li-rich cathode Li1.2Mn0.54Ni0.13Co0.13O2 by surface modification with WO3 for lithium ion batteries. Electrochim. Acta 2018, 273, 88–97. [Google Scholar] [CrossRef]
  30. Zhu, Q.P.; Wang, X.; Fan, J.C.; Xu, Q.J.; Min, Y.L. MnO2 nanowires as precursor synthesis of lithium-rich cathode material with enhanced electrochemical performances. Ionics 2019, 25, 2477–2485. [Google Scholar] [CrossRef]
  31. Xu, C.S.; Yu, H.T.; Guo, C.F.; Xie, Y.; Ren, N.; Yi, T.F.; Zhang, G.X. Surface modification of Li1.2Mn0.54Ni0.13Co0.13O2 via an ionic conductive LiV3O8 as a cathode material for Li-ion batteries. Ionics 2019, 25, 4567–4576. [Google Scholar] [CrossRef]
Figure 1. (a) Full XRD patterns of cathode materials and (b) local magnified XRD patterns at 20–25°.
Catalysts 12 00584 g001
Figure 2. Surface morphologies of (a) LMNCO, (c) nLMNCO-1.0, (e) nLMNCO-2.0, (g) nLMNCO-3.0, and (i) nLMNCO-4.0 cathode materials and histograms of particle size distribution of (b) LMNCO, (d) nLMNCO-1.0, (f) nLMNCO-2.0, (h) nLMNCO-3.0, and (j) nLMNCO-4.0 cathode mateirals.
Catalysts 12 00584 g002
Figure 3. TEM images of the (a) LMNCO and (b) nLMNCO-3.0 samples.
Catalysts 12 00584 g003
Figure 4. (a) Mn2p and (b) Co2p XPS patterns of cathode materials.
Catalysts 12 00584 g004
Figure 5. Ni2p XPS patterns of (a) LMNCO, (b) nLMNCO-1.0, (c) nLMNCO-2.0, (d) nLMNCO-3.0, and (e) nLMNCO-4.0 cathode materials.
Catalysts 12 00584 g005
Figure 6. The initial charge/discharge profile of cathode materials at 0.1 C (1 C = 250 mA g−1).
Catalysts 12 00584 g006
Figure 7. Cycling performance of cathode materials at 0.2 C.
Catalysts 12 00584 g007
Figure 8. Performance of the LMNCO, nLMNCO-1.0, nLMNCO-2.0, nLMNCO-3.0, and nLMNCO-4.0 cathode materials at 0.5 C: (a) long cycle performance and (bf) discharge capacity curves with different turn numbers.
Catalysts 12 00584 g008
Figure 9. The dQ/dV curves of (a) LMNCO, (b) nLMNCO-1.0, (c) nLMNCO-2.0, (d) nLMNCO-3.0, and (e) nLMNCO-4.0 cathode mateirals.
Catalysts 12 00584 g009
Figure 10. The median discharge voltage of cathode materials at 0.5 C.
Catalysts 12 00584 g010
Figure 11. CV curves of (a) LMNCO, (b) nLMNCO-1.0, (c) nLMNCO-2.0, (d) nLMNCO-3.0 and (e) nLMNCO-4.0 cathode materials.
Catalysts 12 00584 g011
Figure 12. Rate performance of cathode materials.
Catalysts 12 00584 g012
Figure 13. Nyquist spectra of the cathode materials.
Catalysts 12 00584 g013
Table 1. Refined lattice parameters and ratio of characteristic peak intensities of cathode materials.
Samplesa/(Å)c/(Å)I(003)/I(104)
LMNCO2.848814.18261.4841
nLMNCO-1.02.851114.19231.8194
nLMNCO-2.02.854214.19541.7663
nLMNCO-3.02.857814.21431.8680
nLMNCO-4.02.861914.22762.0199
Table 2. The charge-discharge capacity performance of the cathode material in the initial cycle.
SamplesCharge Capacity below 4.45 V
/(mAh g−1)
Charge Capacity above 4.45 V
/(mAh g−1)
The Charging Capacity/(mAh g−1)The Discharging Capacity/(mAh g−1)Irreversible Capacity Loss
/(mAh g−1)
LMNCO127.9216.7362.5271.491.1
nLMNCO-1.0143.0179.0322.2248.973.3
nLMNCO-2.0172.0119.5291.5223.068.5
nLMNCO-3.0187.385.1272.4204.867.6
nLMNCO-4.0192.551.8244.3184.959.4
Table 3. Summary of discharge capacities at each rate of current density of the cathode materials.
Samples0.2 C
(mAh g−1)
0.5 C
(mAh g−1)
1.0 C
(mAh g−1)
2.0 C
(mAh g−1)
3.0 C
(mAh g−1)
5.0 C
(mAh g−1)
LMNCO249.9204.4150.642.80.20.1
nLMNCO-1.0228.1200.4182.1160.9143.6108.8
nLMNCO-2.0212.8195.6182.8165.6148.6105.5
nLMNCO-3.0190.7175.9162.4144.7133.3111.2
nLMNCO-4.0167.9137.3105.870.445.216.6
Table 4. Impedance parameter and diffusion coefficients of cathode materials.
SamplesRsRctDLi(cm2·s−1)
LMNCO3.455192.507.75 × 10−16
nLMNCO-1.03.117112.234.63 × 10−14
nLMNCO-2.02.89490.181.51 × 10−13
nLMNCO-3.02.64564.082.92 × 10−13
nLMNCO-4.03.216137.528.36 × 10−14
Publisher’s Note: MDPI stays neutral with regard to jurisdictional claims in published maps and institutional affiliations.

