Article

Non-Covalent Functionalization of Graphene Oxide-Supported 2-Picolyamine-Based Zinc(II) Complexes as Novel Electrocatalysts for Hydrogen Production

1
Department of Chemistry, College of Science, Taif University, P.O. Box 11099, Taif 21944, Saudi Arabia
2
Department of Physics, College of Science, Taif University, P.O. Box 11099, Taif 21944, Saudi Arabia
3
Department of Chemistry, Faculty of Science, Kafrelsheikh University, Kafr El-Sheikh 33516, Egypt
4
Academy of Scientific and Innovative Research (AcSIR), Ghaziabad 201002, Uttar Pradesh, India
5
Advanced Materials Group, Materials Sciences and Technology Division, CSIR-North East Institute of Science and Technology, Jorhat 785006, Assam, India
6
Department of Chemistry and Molecular Biology, Atmospheric Science, University of Gothenburg, 412 96 Gothenburg, Sweden
*
Authors to whom correspondence should be addressed.
Current address: Physics Research Institute, Spectroscopy Department, National Research Centre, El Behooth St., Dokki, Cairo 12622, Egypt.
Catalysts 2022, 12(4), 389; https://doi.org/10.3390/catal12040389
Submission received: 6 February 2022 / Revised: 12 March 2022 / Accepted: 15 March 2022 / Published: 31 March 2022
(This article belongs to the Topic Catalysis: Homogeneous and Heterogeneous)

Abstract

:
Three mononuclear 2-picolylamine-containing zinc(III) complexes viz [(2-PA)2ZnCl]2(ZnCl4)] (Zn1), [(2-PA)2Zn(H2O)](NO3)2] (Zn2) and [Zn(2-PA)2(OH)]NO3] (Zn3) were synthesized and fully characterized. Spectral and X-ray structural characteristics showed that the Zn1 complex has a square-pyramidal coordination environment around a zinc(II) core. The hydroxide complex Zn3 was non-covalently functionalized with few layers of graphene oxide (GO) sheets, formed by exfoliation of GO in water. The resulting Zn3/GO hybrid material was characterized by FT-IR, TGA-DSC, SEM-EDX and X-ray powder diffraction. The way of interaction of Zn3 with GO has been established through density functional theory (DFT) calculations. Both experimental and theoretical findings indicate that, on the surface of GO, the complex Zn3 forms a complete double-sided adsorption layer. Zn3 and its hybrid form Zn3/GO have been individually investigated as electrocatalysts for the hydrogen evolution reaction. The hybrid heterogenized form Zn3/GO was supported on glassy carbon (GC) with variable loading densities of Zn3 (0.2, 0.4 and 0.8 mg cm−2) to form electrodes. These electrodes have been tested as molecular electrocatalysts for the hydrogen evolution reaction (HER) using linear sweep voltammetry (LSV) and electrochemical impedance spectroscopy (EIS) in 0.1 M KOH. Results showed that both GC-Zn3 and GC-Zn3/GO catalysts for the HER are highly active, and with increase of the catalyst’s loading density, this catalytic activity enhances. The high catalytic activity of HER with a low onset potential of −140 mV vs. RHE and a high exchange current density of 0.22 mA cm−2 is achieved with the highest loading density of Zn3 (0.8 mg cm−2). To achieve a current density of 10 mA cm−2, an overpotential of 240 mV was needed.

1. Introduction

Production of hydrogen (H2) gas, a flexible energy carrier with favorable features and a high-energy-density fuel [1,2,3], has become important because of increased global energy demand [4]. The most economical and leading technology for direct production of hydrogen is the steam reformation of natural gas, since natural gas is abundant, non-precious and contains the highest content of H2 among all fossil fuels [5]. This industrial process, however, requires high energy input and emits CO2 gas as a by-product, causing global warming and leading to a rise in the natural acidity of rainwater [6,7,8]. Therefore, an environmentally friendly and efficient approach to generate H2 from sources other than fossil fuels is necessary and highly desirable.
Water electrolysis is an economical and promising technology for sustainable generation of H2 with less influence on the greenhouse effect [1,2,3]. Electrochemical water splitting consists of two half-cell reactions, namely hydrogen evolution reaction (HER) and an oxygen evolution reaction (OER), but the most challenging task of these two half-cell reactions is the development of the catalyst as it controls the performance of energy conversion devices [9]. The platinum (Pt) and Pt group metals are well recognized as the most powerful catalysts capable of catalyzing the HER and force to derive significant currents near to thermodynamic potential. However, these Pt group metals are rare and the cost of these catalysts is high [10]. Researchers of all over the world have been attempting to develop a stable, highly effective, non-precious and earth-abundant catalyst for the half-cell evolution reaction, HER [9,11,12,13,14,15,16,17,18,19,20,21,22,23]. Carbon based materials [24], non-metal [25], and metal-supported metal nanoparticles [26,27,28] have been shown to function as superior, inexpensive alternatives for the HER electrocatalysts.
Transition-metal complexes is another class of molecular electrocatalysts that are extremely stable materials well suited for storing energy in chemical bonds and generating power through hydrogen generation and oxidation [29,30]. Coordination chemists face a significant problem in developing and synthesizing transition metal complexes capable of catalyzing the reduction of protons (H+) to H2 at low overpotentials [31]. In this context, we assessed the first-row transition metal-based complexes as efficient molecular electrocatalysts for HER [32,33,34,35]. To the best of our knowledge, none of these metal-complex electrocatalysts have been evaluated for HER in non-aqueous solutions. On the other hand, concerning aqueous solutions, the literature revealed a limited number of publications on electrochemical hydrogen generation on metal-complex electrocatalysts [36,37,38,39,40,41,42]. Given the importance of this topic, this number of studies is deemed minimal.
The present research is based on the synthesis of a series of zinc(II) complexes derived from ligand 2-picolyamine, namely [(2-PA)2ZnCl]2(ZnCl4)] (Zn1), [(2-PA)2Zn(H2O)](NO3)2] (Zn2) and [Zn(2-PA)2(OH)]NO3] (Zn3). A few-layer graphene oxide (GO) was non-covalently functionalized with Zn3, forming the hybrid heterogenized material Zn3/GO, which can be used to change electrodes with the goal of producing cathodes with high catalytic activity for the HER from water. In order to determine the HER behavior of the studied Zn(II) complex Zn3 and its functionalized hybrid Zn3/GO catalysts, various electrochemical techniques have been used. The best catalyst was also evaluated for stability and long-term durability using cyclic voltammetry (repetitive cycling up to 5000 cycles) and chronoamperometry measurements.

2. Experimental

2.1. General Methods and Instrumentations

Reagents, such as 2-picolylamine (PA), zinc(II) chloride and zinc nitrate hexahydrate, were purchased from Sigma (Darmstadt, Germany) and used directly without further purification. GO was prepared by natural graphite oxidation, following the modified Hammer method [43]. The zinc(II) complexes were synthesized, characterized and immobilized on the surface of GO as fully reported in Section S1 (Supporting Information). In the range of 400–4000 cm−1, the IR spectra from the zinc(II) complexes were acquired using an Alpha-Attenuated FT-IR Spectrophotometer (Perkin-Elmer Series II CHNS/O Analyzer 2400, Perkin-Elmer, Waltham, MA, USA). Thermal analysis measurements were recorded in nitrogen atmosphere with a Shimadzu TGA-DTA 60H analyzer [44]. The XRD diffraction patterns were obtained using a 40 kV and 40 mA powered D8 Advance (Bruker, Billerica, MA, USA) X-Ray diffractometer with Cu Kα (λ = 1.54056 Å). The crystallographic data of the zinc(II) complex Zn1 were obtained using Mo-Ka radiation on a Bruker AXS Smart CCD diffractometer (Supporting Information, S1.4). Lorentz corrections of polarization and absorption were performed by SAINT and SADABS software [45,46]. The structures were solved by direct or Patterson methods using SHELXS-2013 [47] to find the position of heavy atoms.

2.2. Calculations from DFT

The geometry optimizations of zinc(II) complexes Zn1 and Zn3 were carried out using Gaussian G09 [48]. For the calculations, density functional theory (DFT) was applied using B3LYP/6–311++G(d,p) level theory. The formation energy (E + BSSE) was determined by Equation (1) for both Zn1/GO and Zn3/GO composites:
EZn1 or Zn3/GO = EZn1 or Zn3/GO − EZn1 or Zn3 − EGO + ΔEBSSE
where EGO is the absolute energy of GO and EZn1 or EZn3 is the energy of zinc(II) complexes Zn1 or Zn3. The vibrational frequencies were performed on the optimized structures to ensure the stability of the individual and complex structures.

2.3. Electrochemical Measurements

The electrochemical setup and techniques employed to assess the HER catalytic activity of the newly synthesized Zn3 and Zn3/GO cathodes are fully described in Section S2 (Supplementary Materials).

3. Results and Discussion

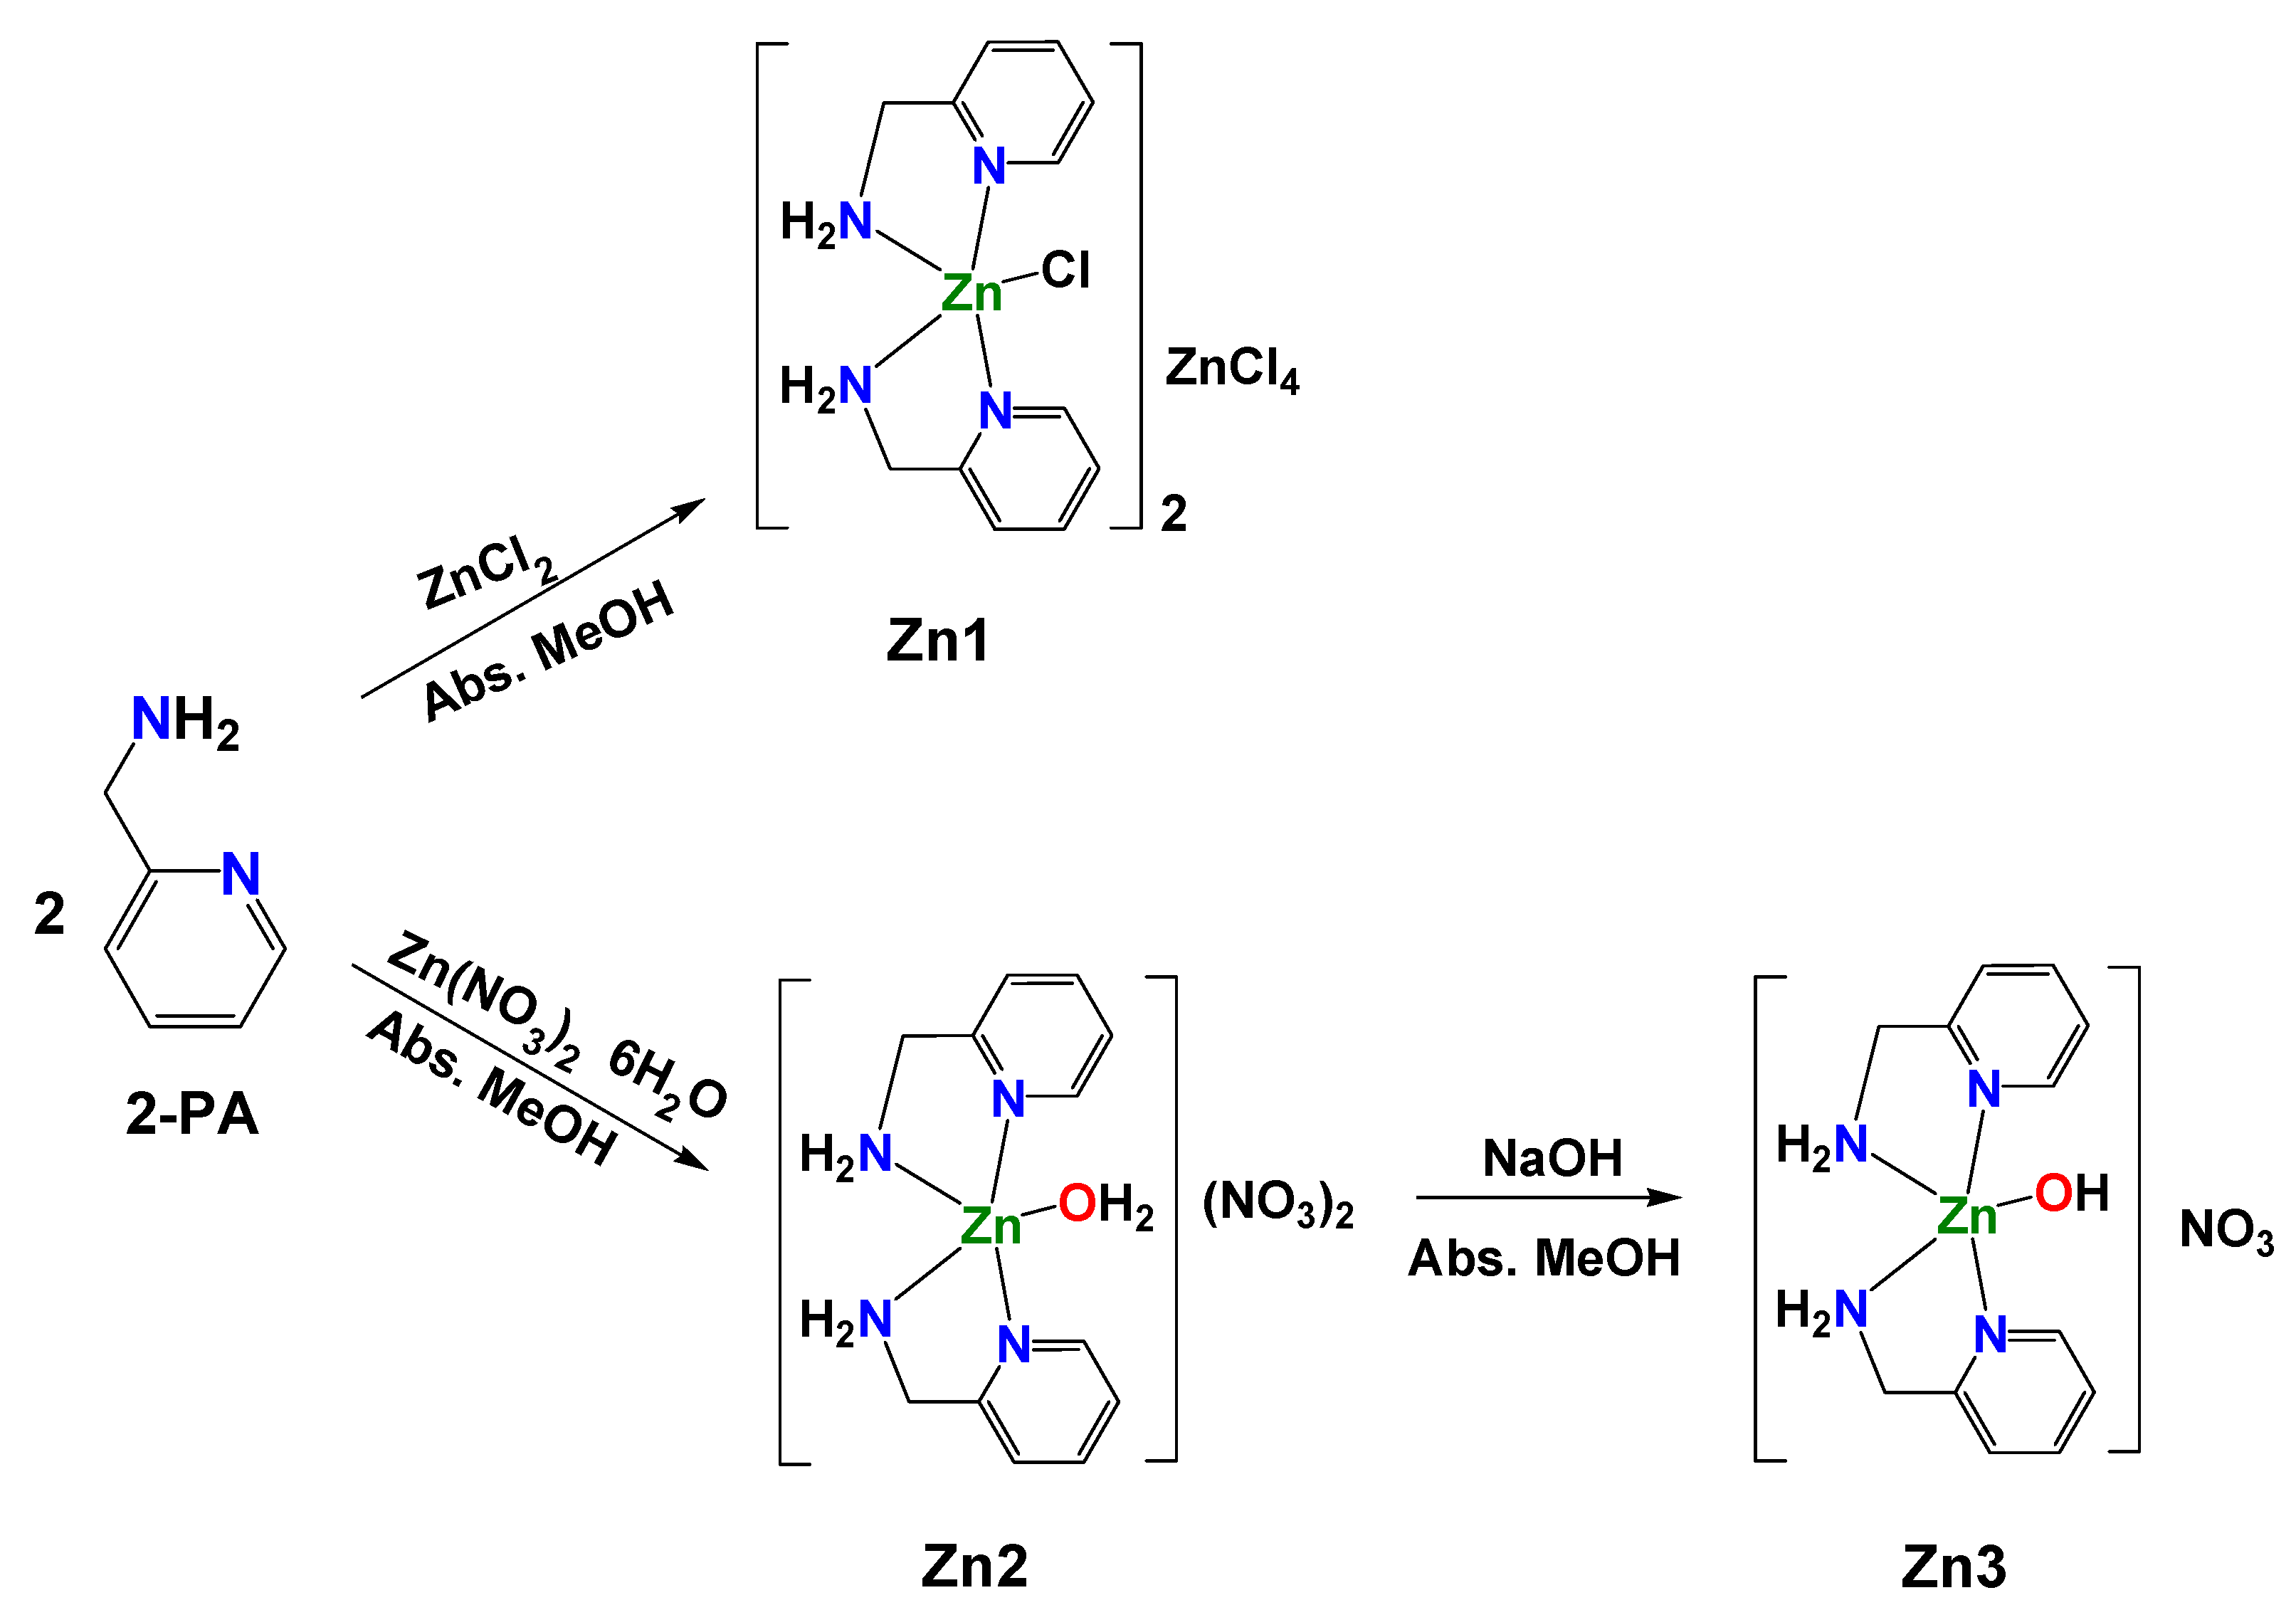
3.1. Characterization of Zinc(II) Complexes and Zn3/GO Hybrid Material

The results of the chemical analysis showed that the obtained zinc(II) complexes [(2-PA)2ZnCl]2(ZnCl4) (Zn1) and [(2-PA)2Zn(H2O)](NO3)2 (Zn2) and [(2-PA) Zn(OH)]NO3 (Zn3) were composed of stoichiometries of 1:2 (zinc: ligand) ratios (Scheme 1). These complexes have molar conductance values in the range of 90–110 Ohm1 cm2 mol1, confirming their ionic characteristics.

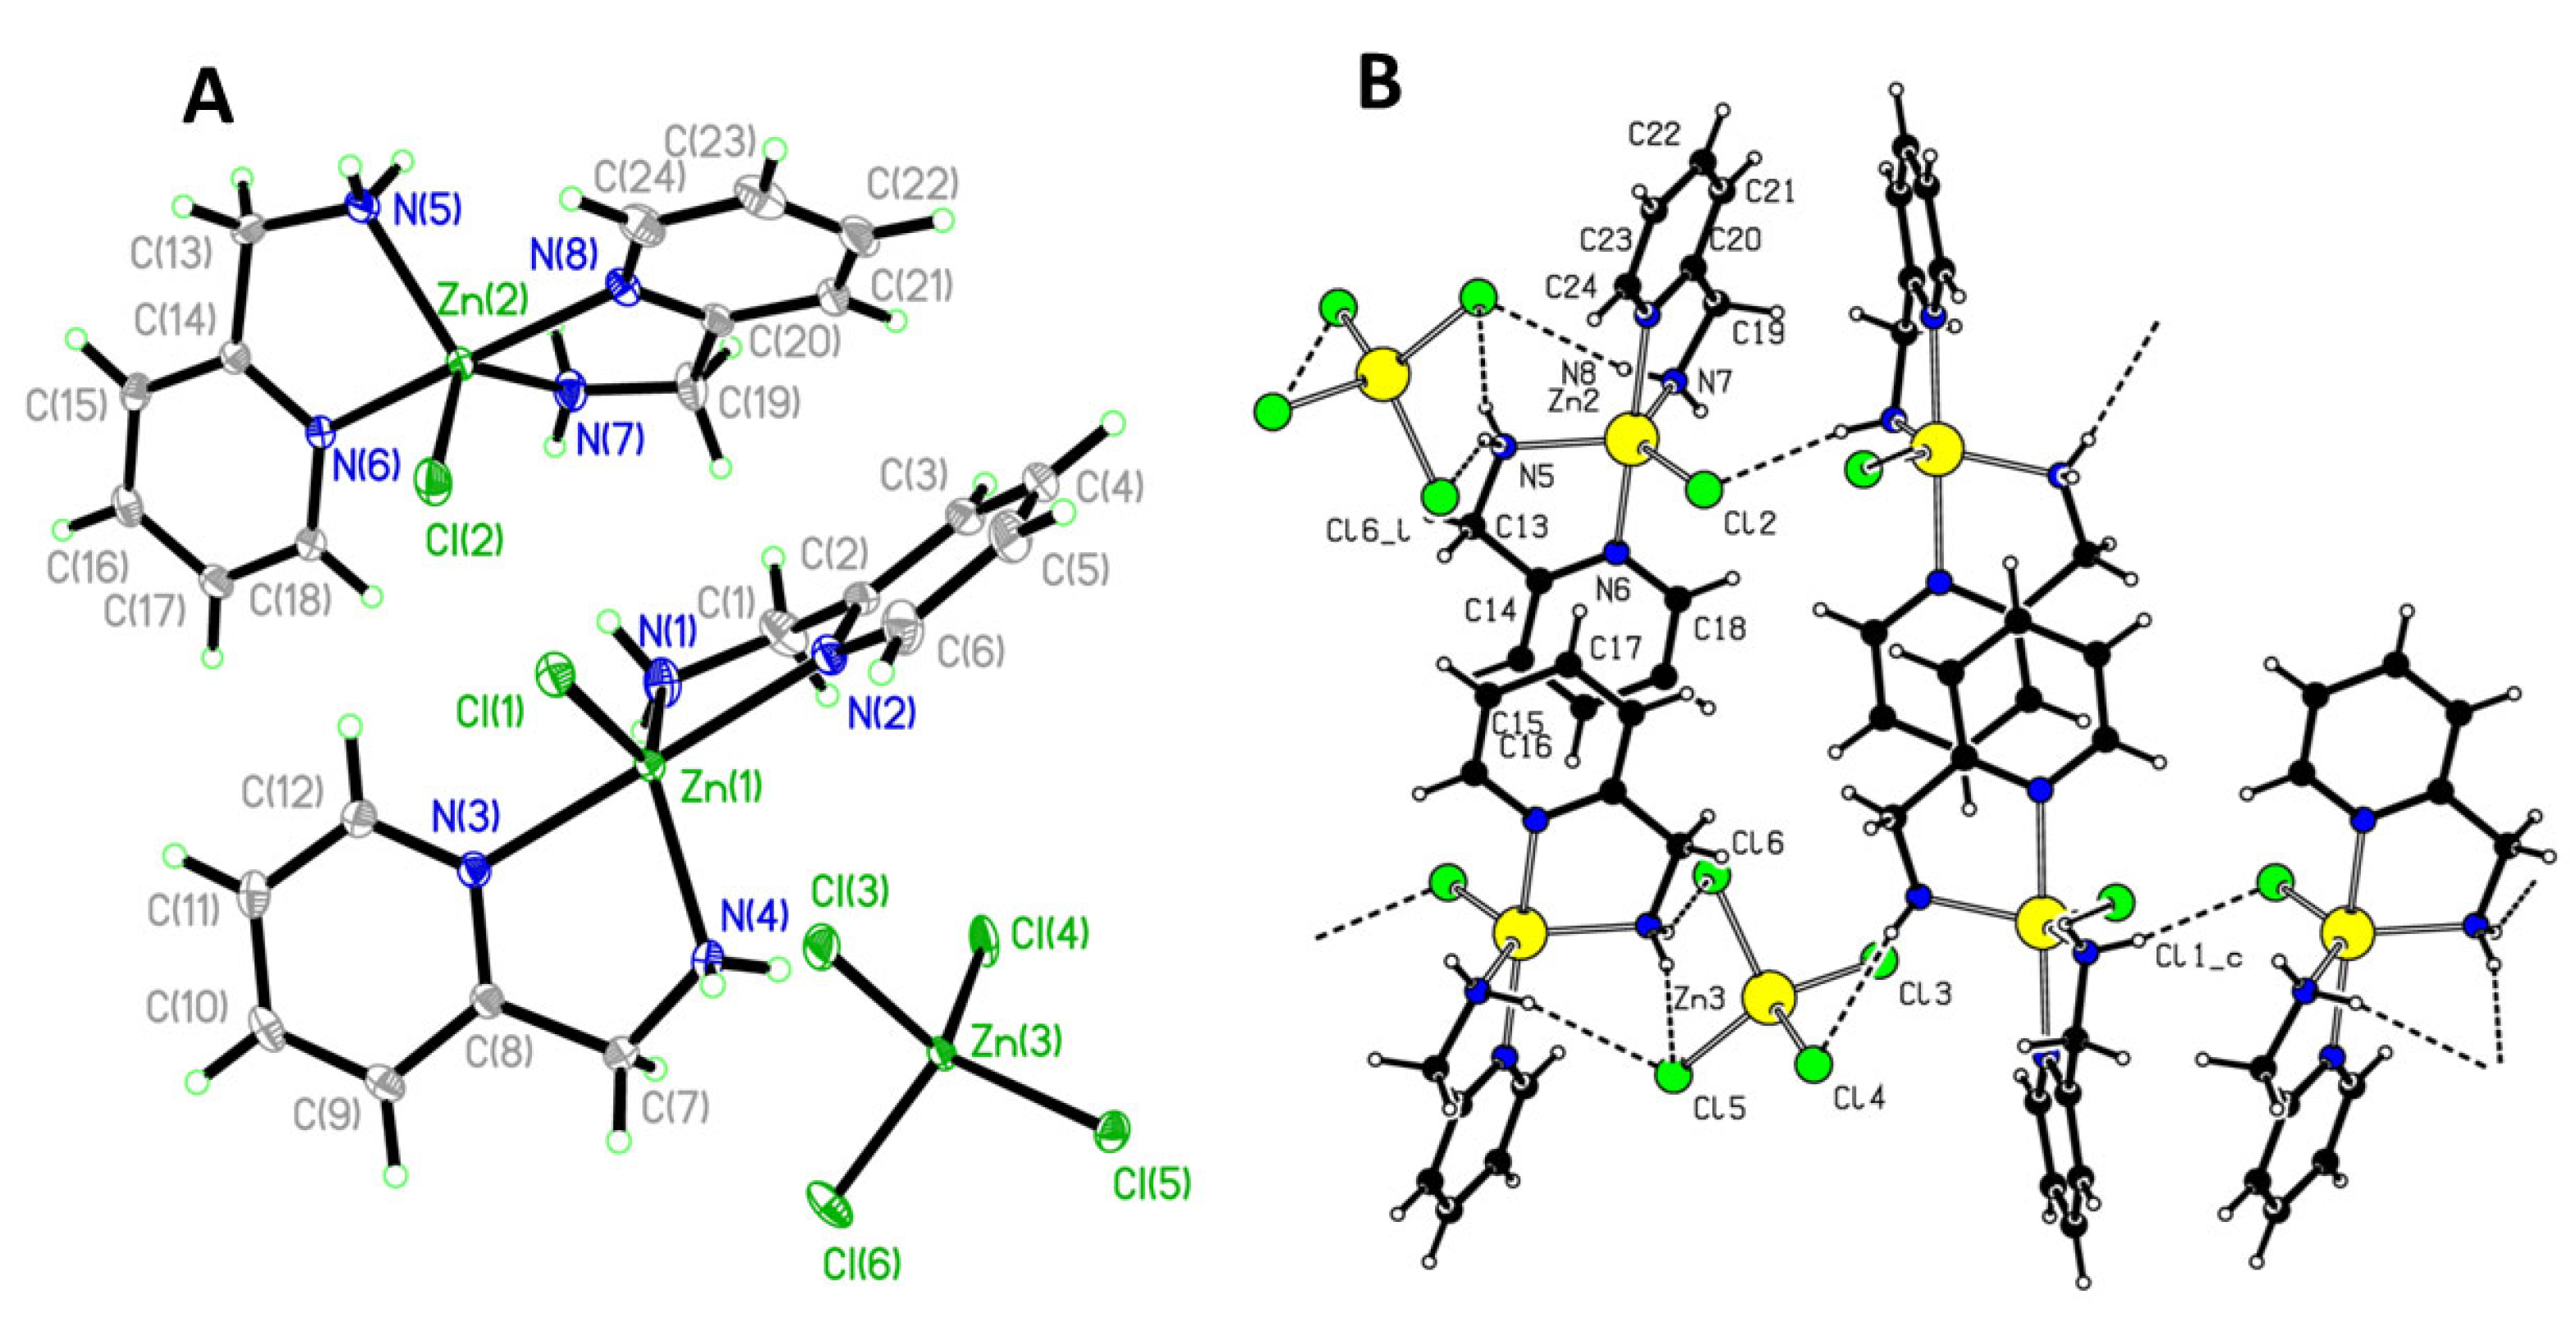
3.1.1. X-ray Crystallographic Determination

The reaction of the ligand 2-PA with ZnCl2 in methanol results in the formation of the ionic complex [(2-PA)2ZnCl]2(ZnCl4) (Zn1). Its structure has been elucidated by IR and 1H NMR measurements. Figure 1A displays the molecular structure with 50% probability thermal ellipsoids. In Table 1, selected bond lengths and bond angles around the centers of zinc(II) are shown. The complex consists of two distinct pseudo-square pyramidal [(2-PA)2ZnCl]+ cations and one tetrahedral [ZnCl4]2− anion in a mixed stereochemistry. There are two pyridyl nitrogen atoms N(2) and N(3) and two primary amine nitrogen atoms N(1) and N(4) in the equatorial positions in the coordination polyhedron of zinc(1) ion in the cation part, as well as chloride anion Cl(1) in the apical position.
For the second zinc(2) atom, a similar coordination behavior was observed. The equatorial lengths of the bonds Zn-NPy {Zn(1)-NPy [N(2), N(3)] and Zn(2)-NPy [N(6), N(8)] are approximately 2.1542 Å and the equatorial lengths of the bonds Zn-NH2 {Zn(1)-NH2 [N(1), N(4)] and Zn(1)-NH2 [N(5) and N(7)] are approximately 2.0860 Å. The distances of the two chloride atoms to both Zn(1) and Zn(2) are 2.2955(4) and 2.3156(4) Å, respectively, taking into account the four nearest donor functions, resulting in a distorted square pyramidal ZnN4Cl with angles of 107.37 and 105.15o for N-Zn(1)-N and N-Zn(2)-N. These are in line with the literature data of compounds of square pyramidal zinc [49,50]. There are four chloride atoms [Cl(3), Cl(4), Cl(5), Cl(6)] in the four coordinate tetrahedral anion of the Zn(3)2+ ion with an average bond duration of 2.275 Å. The Cl-Zn(3)-Cl average bond angle is 109.42°. Hydrogen bonding interactions with chloride atoms are strong in the N-H bonds (Table 2 and Figure 1B). Consequently, in the crystalline state, the zinc(II) complex Zn1 is stabilized by various hydrogen bond patterns.

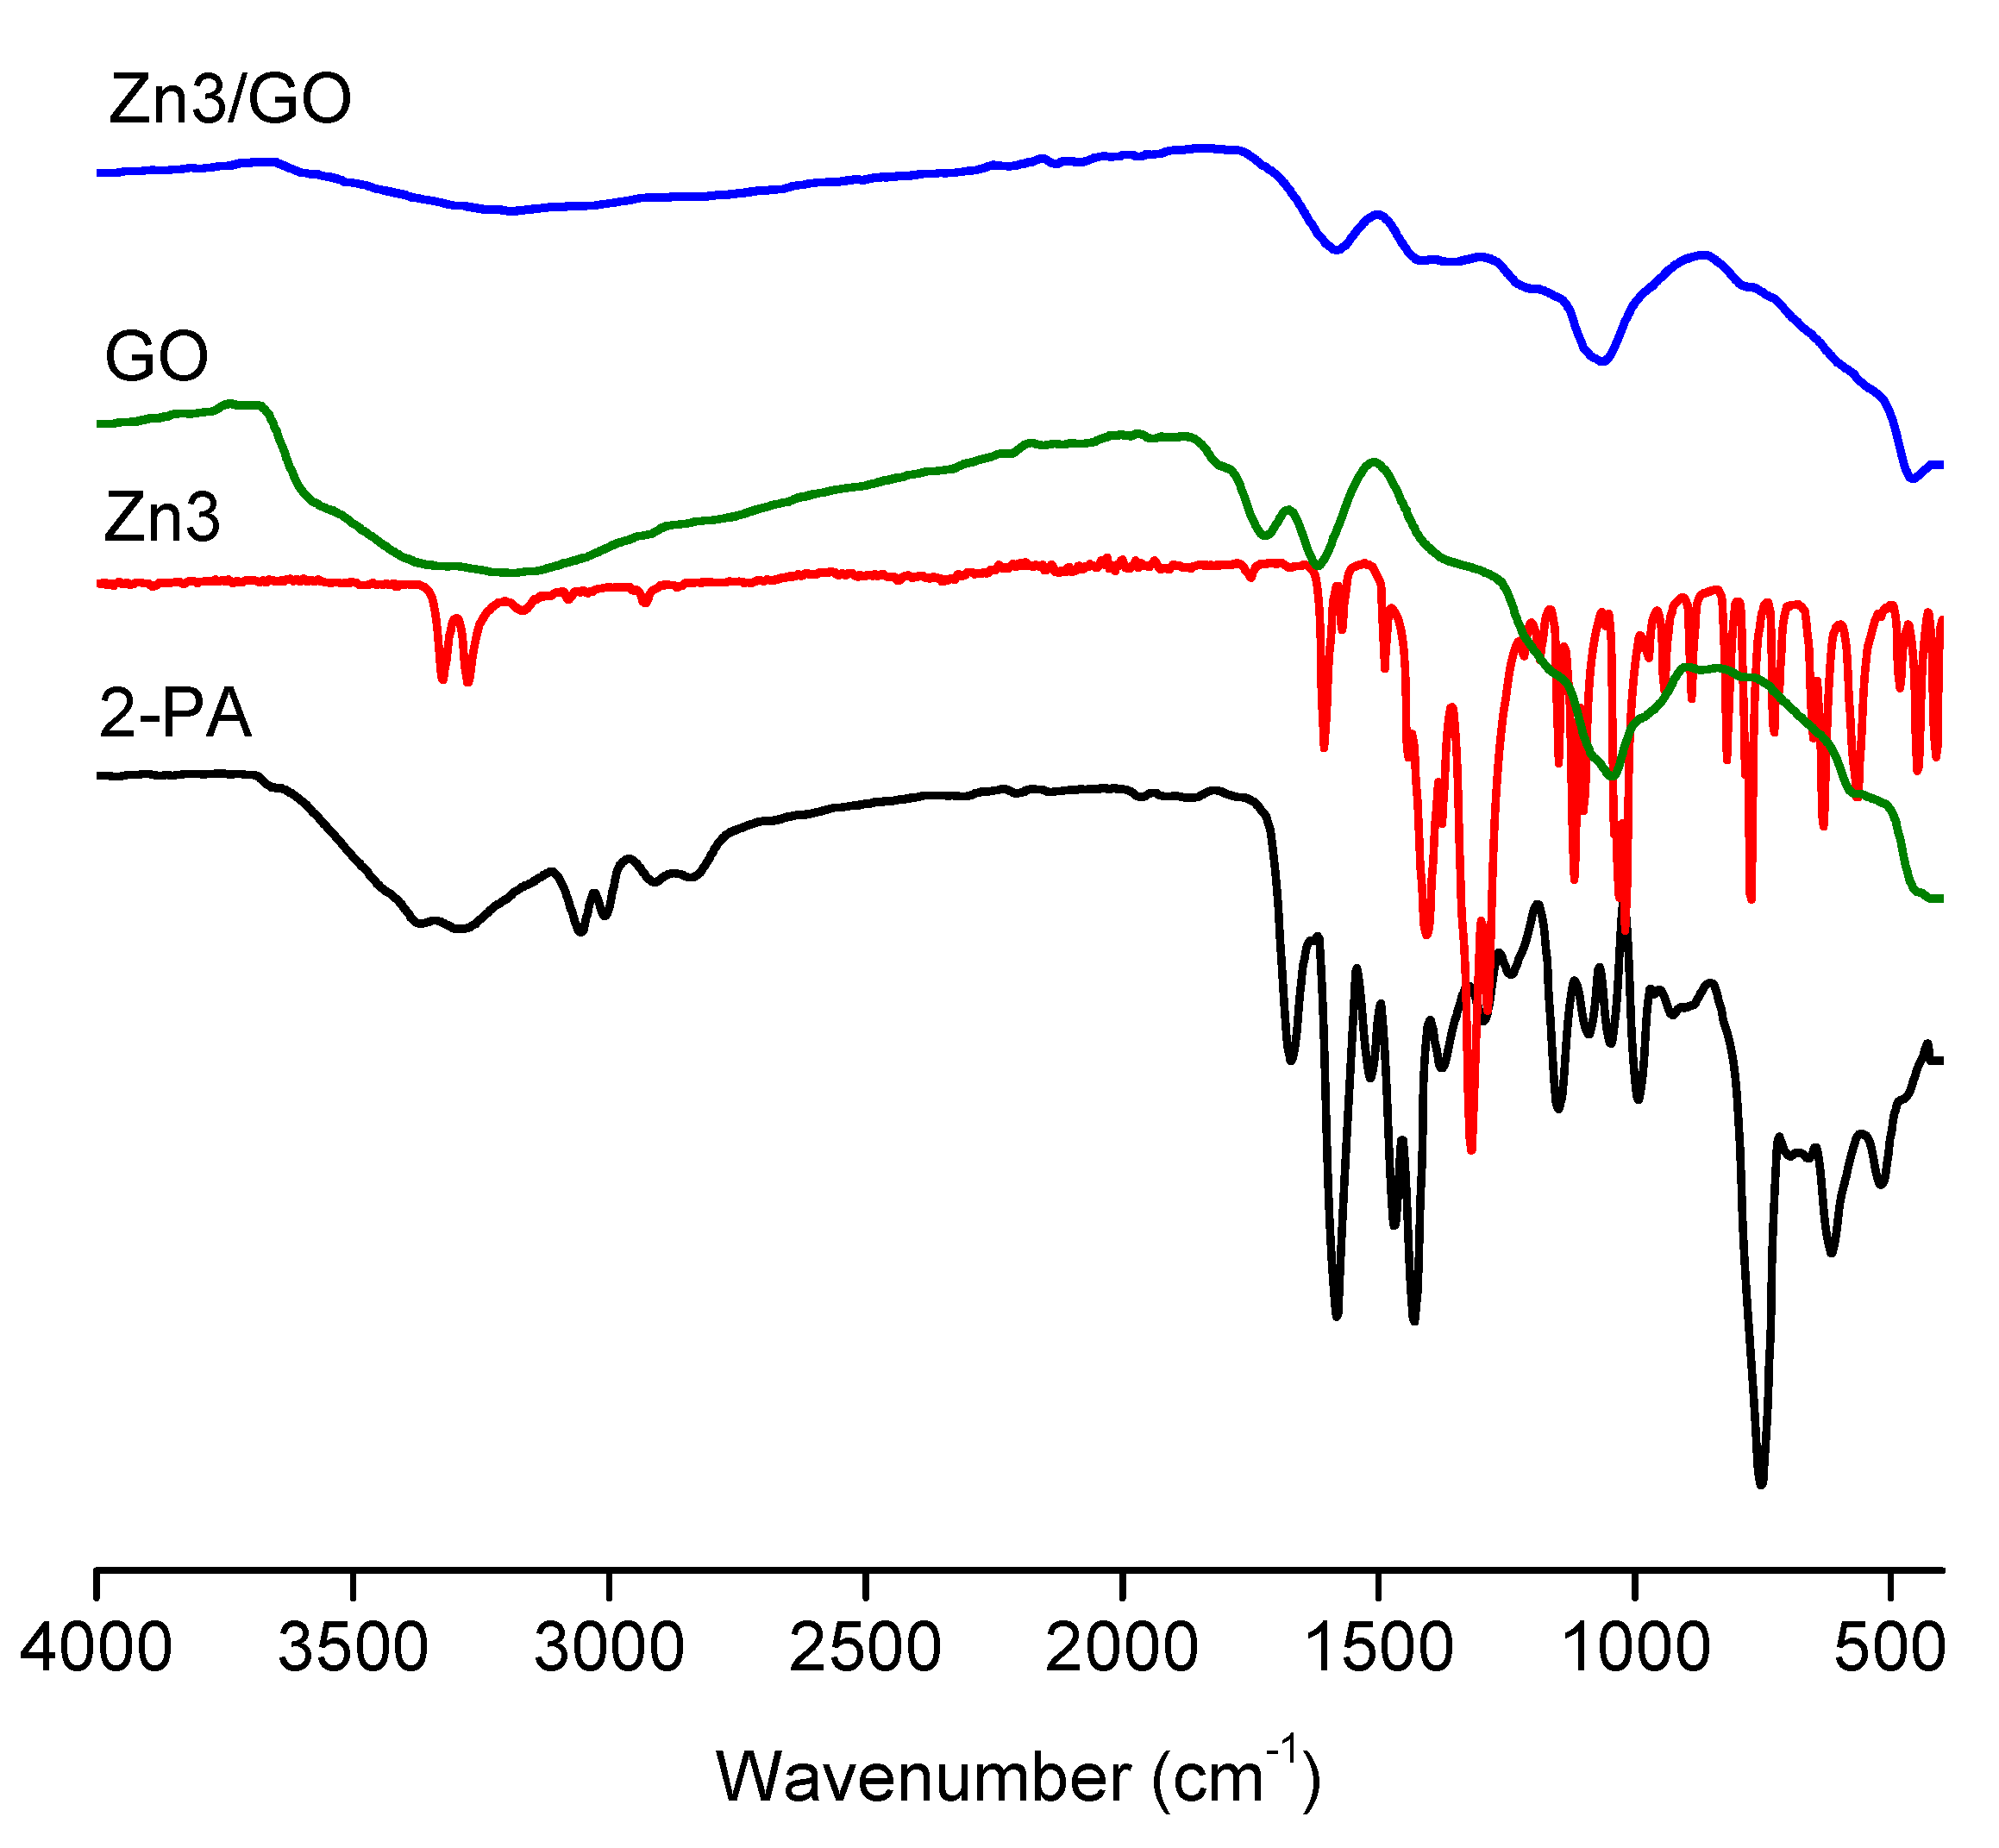
3.1.2. FT-IR Spectra

The FT-IR spectra of the ligand 2-PA, pristine GO, Zn3 and Zn3/GO are depicted in Figure 2. The observed vibration bands at 3006, 1626 and 690 cm−1 are assigned to v (N-H), v (C=N) and δ (pyridine ring), respectively. Upon complexation to zinc(II) ion, the bands of v (NH) and δ (pyridine ring) of the ligand 2-PA show upward shifts of ≈ 21–63 and ≈ 5–20 cm−1, respectively. In comparison, the bands assignable to v (C=N) and the breathing of the pyridine ring indicate downward changes of 20 and 18–34 cm−1, respectively. The new absorption bands in between 420 and 435 cm−1 further confirmed the development of these zinc(II) complexes. These bands are not seen in the free ligand, due to v (Zn-N) [51].
The Zn3 complex displayed a very intense absorption band at 1378 cm−1, indicating the ionic character of the NO3 anion (Figure 1) [52]. Moreover, a very wide absorption band in the range of 3320 to 3350 cm−1 is noticed due to coordinated water molecules. In the case of the complex Zn3, the coordinated hydroxide is characterized by a broad absorption band stretching from 3537 to 3588 cm−1 [53]. The IR spectra for the pristine GO, Zn3 and the hybrid composite Zn3/GO are shown in Figure 2. The stretching v (O-H) and bending δ (O-H) vibration bands observed at 3450 and 1630 cm−1, respectively are due to the adsorbed water. The band at 1082 cm−1 is assigned to the epoxide groups v (C-O) and hydroxyl groups v (C-OH). The contribution of IR absorption due to zinc complex molecules is barely detectable because of the content of the zinc(II) complex Zn3 in the hybrid, which is not so high. In particular due to v (C = C) vibrations in the aromatic system, the absorption at 1390–1530 cm−1 contributes slightly to the already existing hydroxyl absorption of GO in the same spectral area.

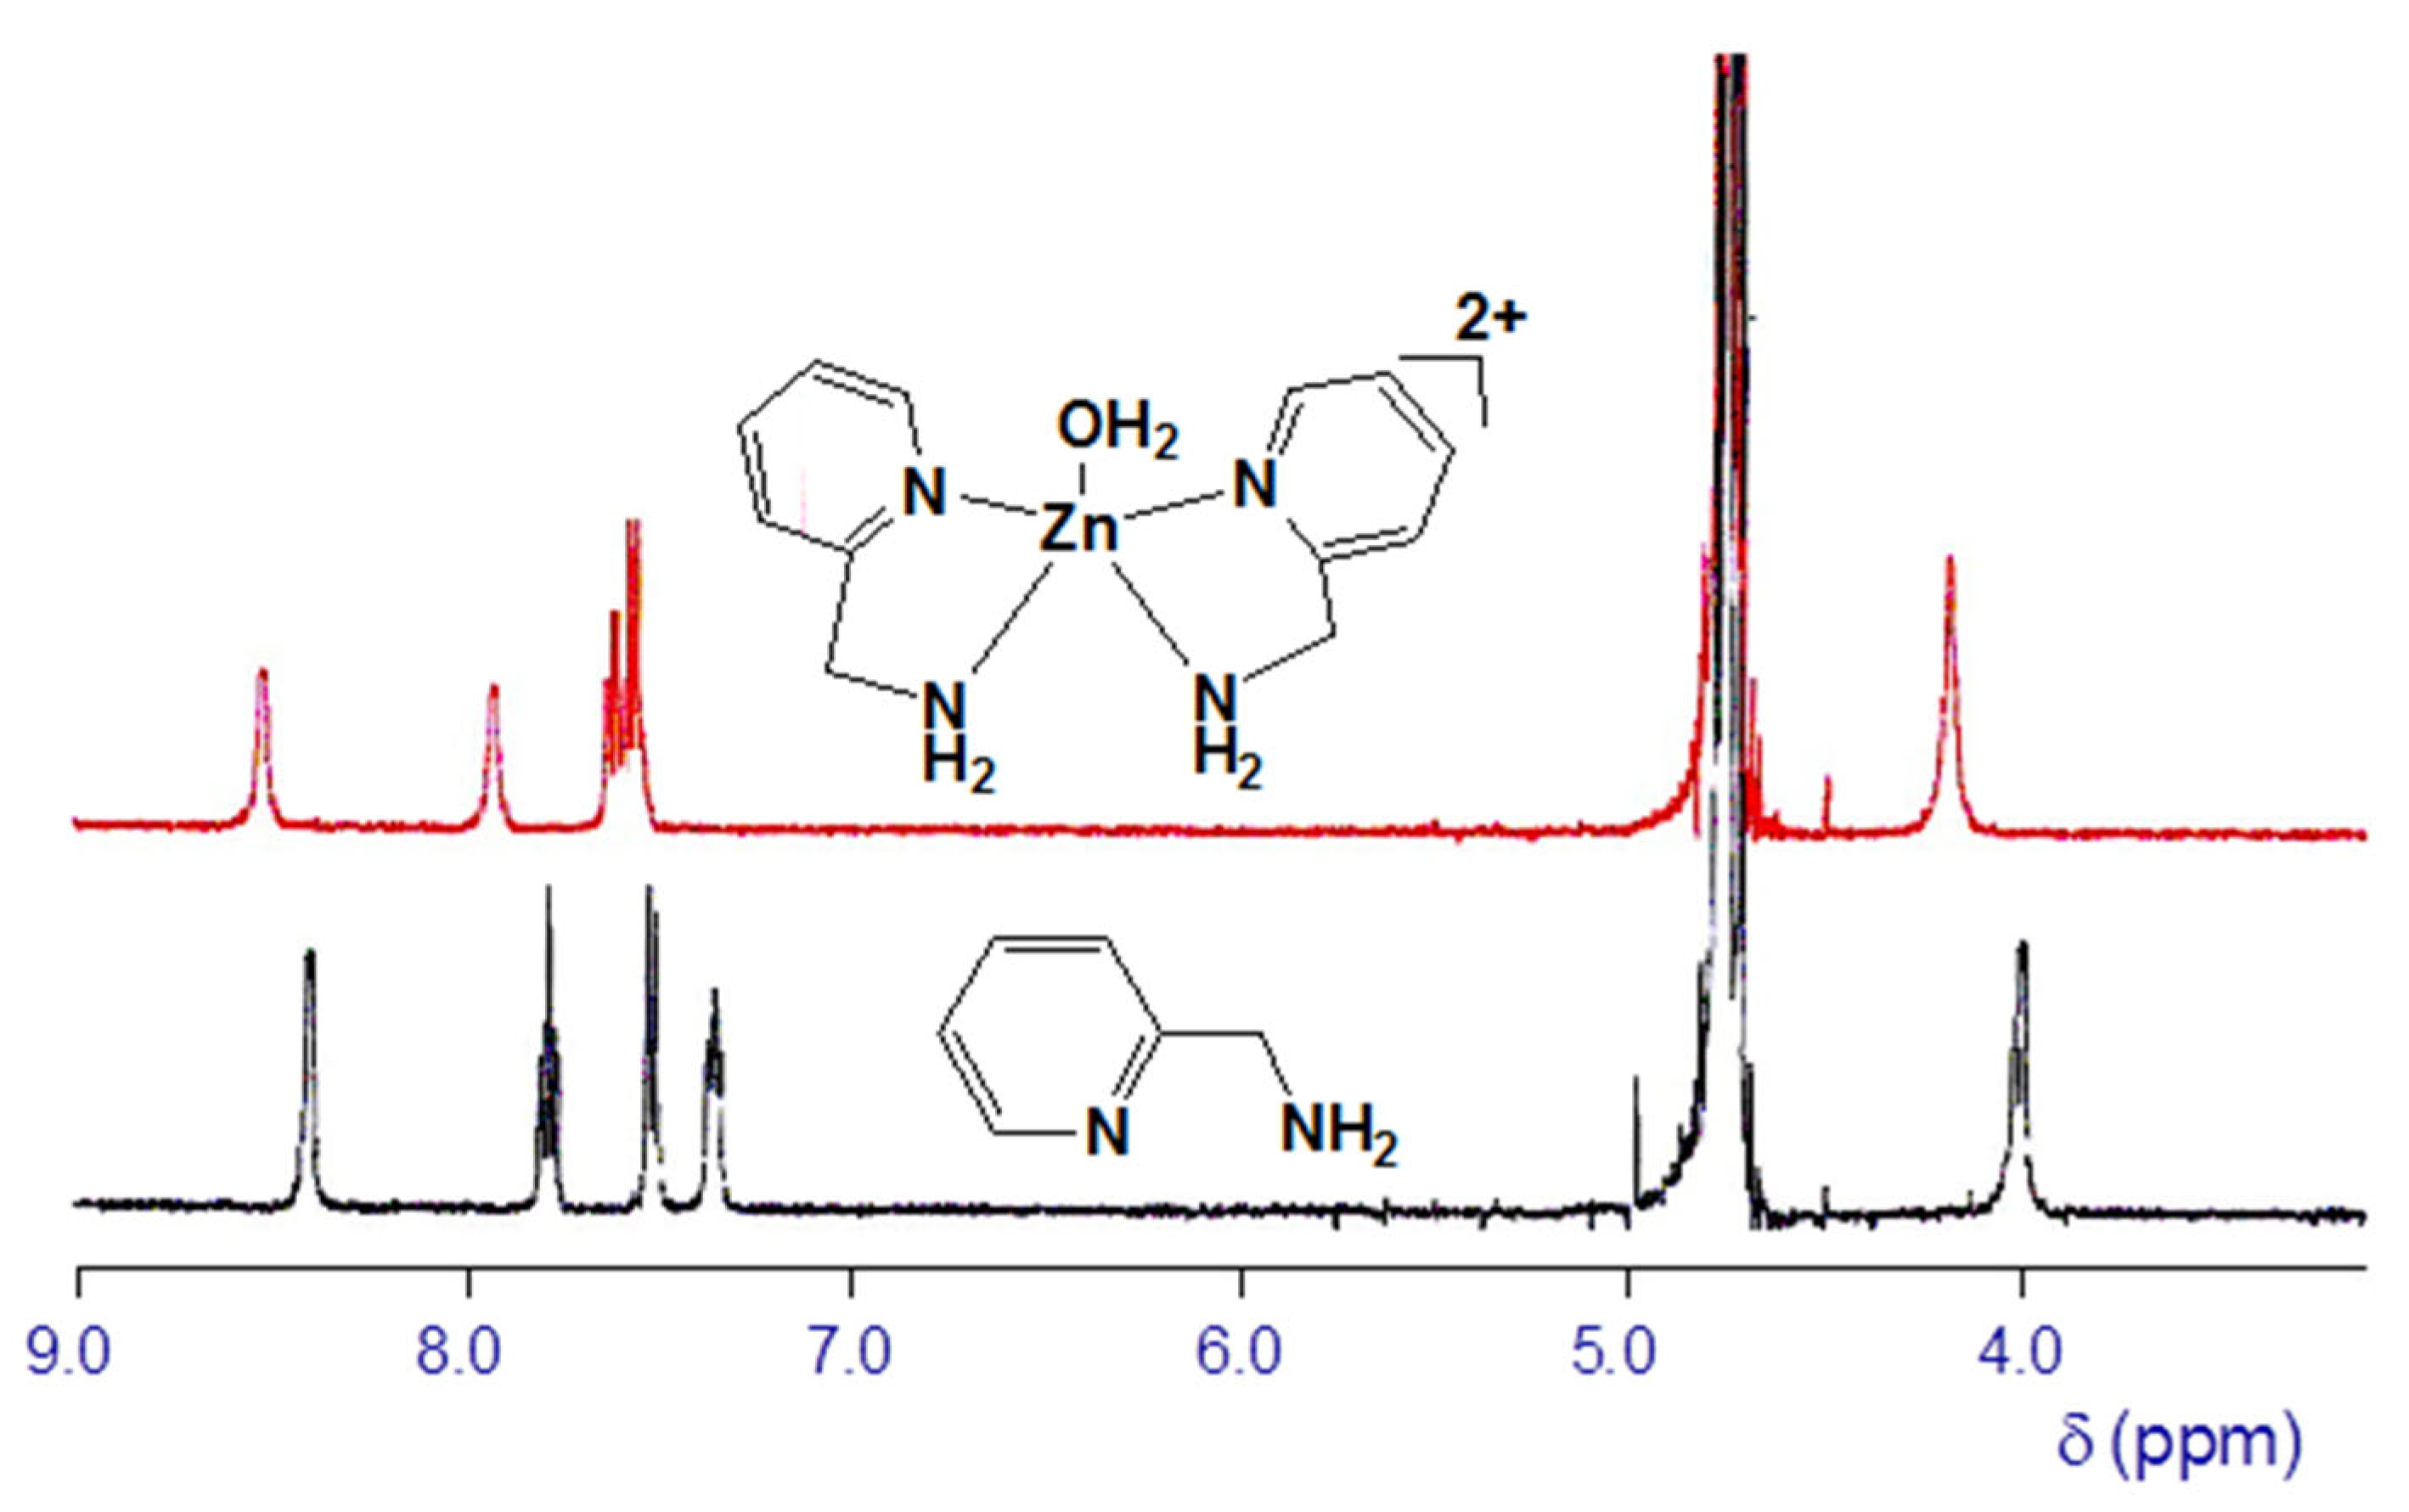
3.1.3. H NMR Spectra

Zinc(II) complex (Zn1) stoichiometry was calculated using 1H-NMR spectroscopy by monitoring the chemical shifts of the pyridine proton and the methylene proton of the zinc(II) complexes formed in D2O. As a representative example, Figure 3 shows the 1H-NMR spectra of the ligand 2-PA and its zinc(II) complex Zn2. The expansion and downfield shifts of the pyridine and methylene protons of the formed zinc(II) complex Zn2 species at a molar ratio of 1:2 ([Zn2+]:[2-PA]) were observed when stoichiometric amounts of zinc(II) ions were added.

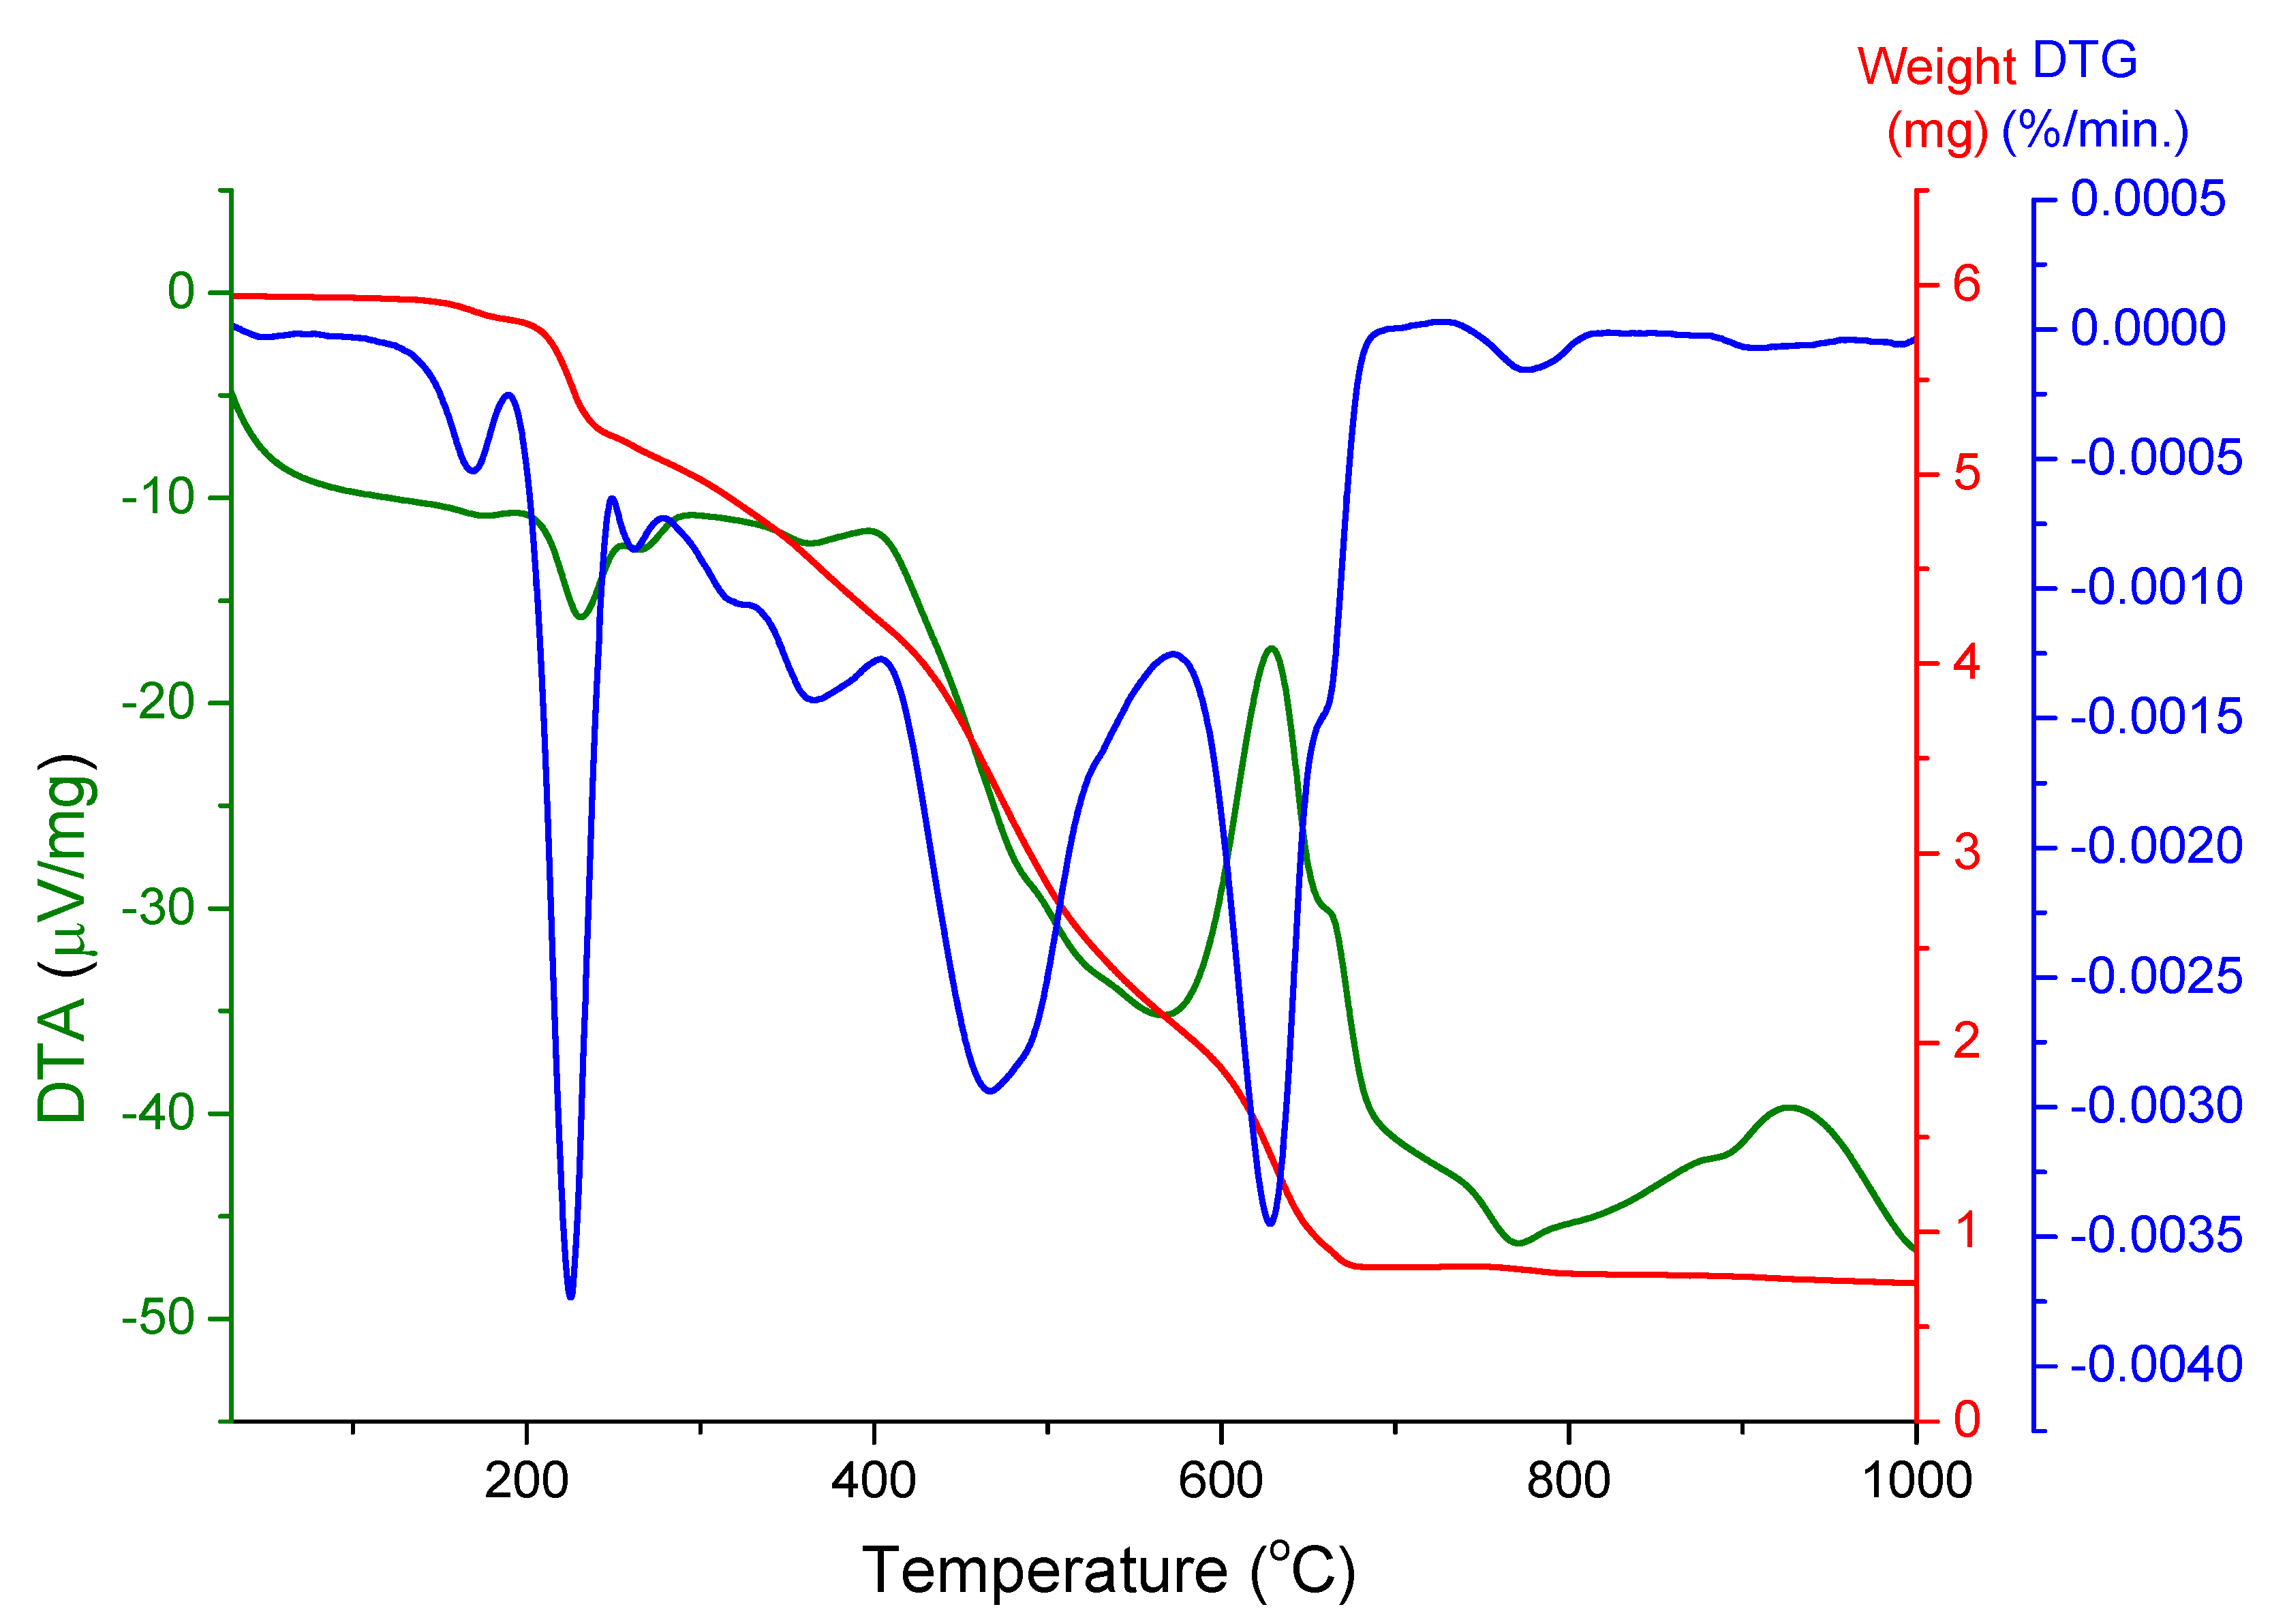
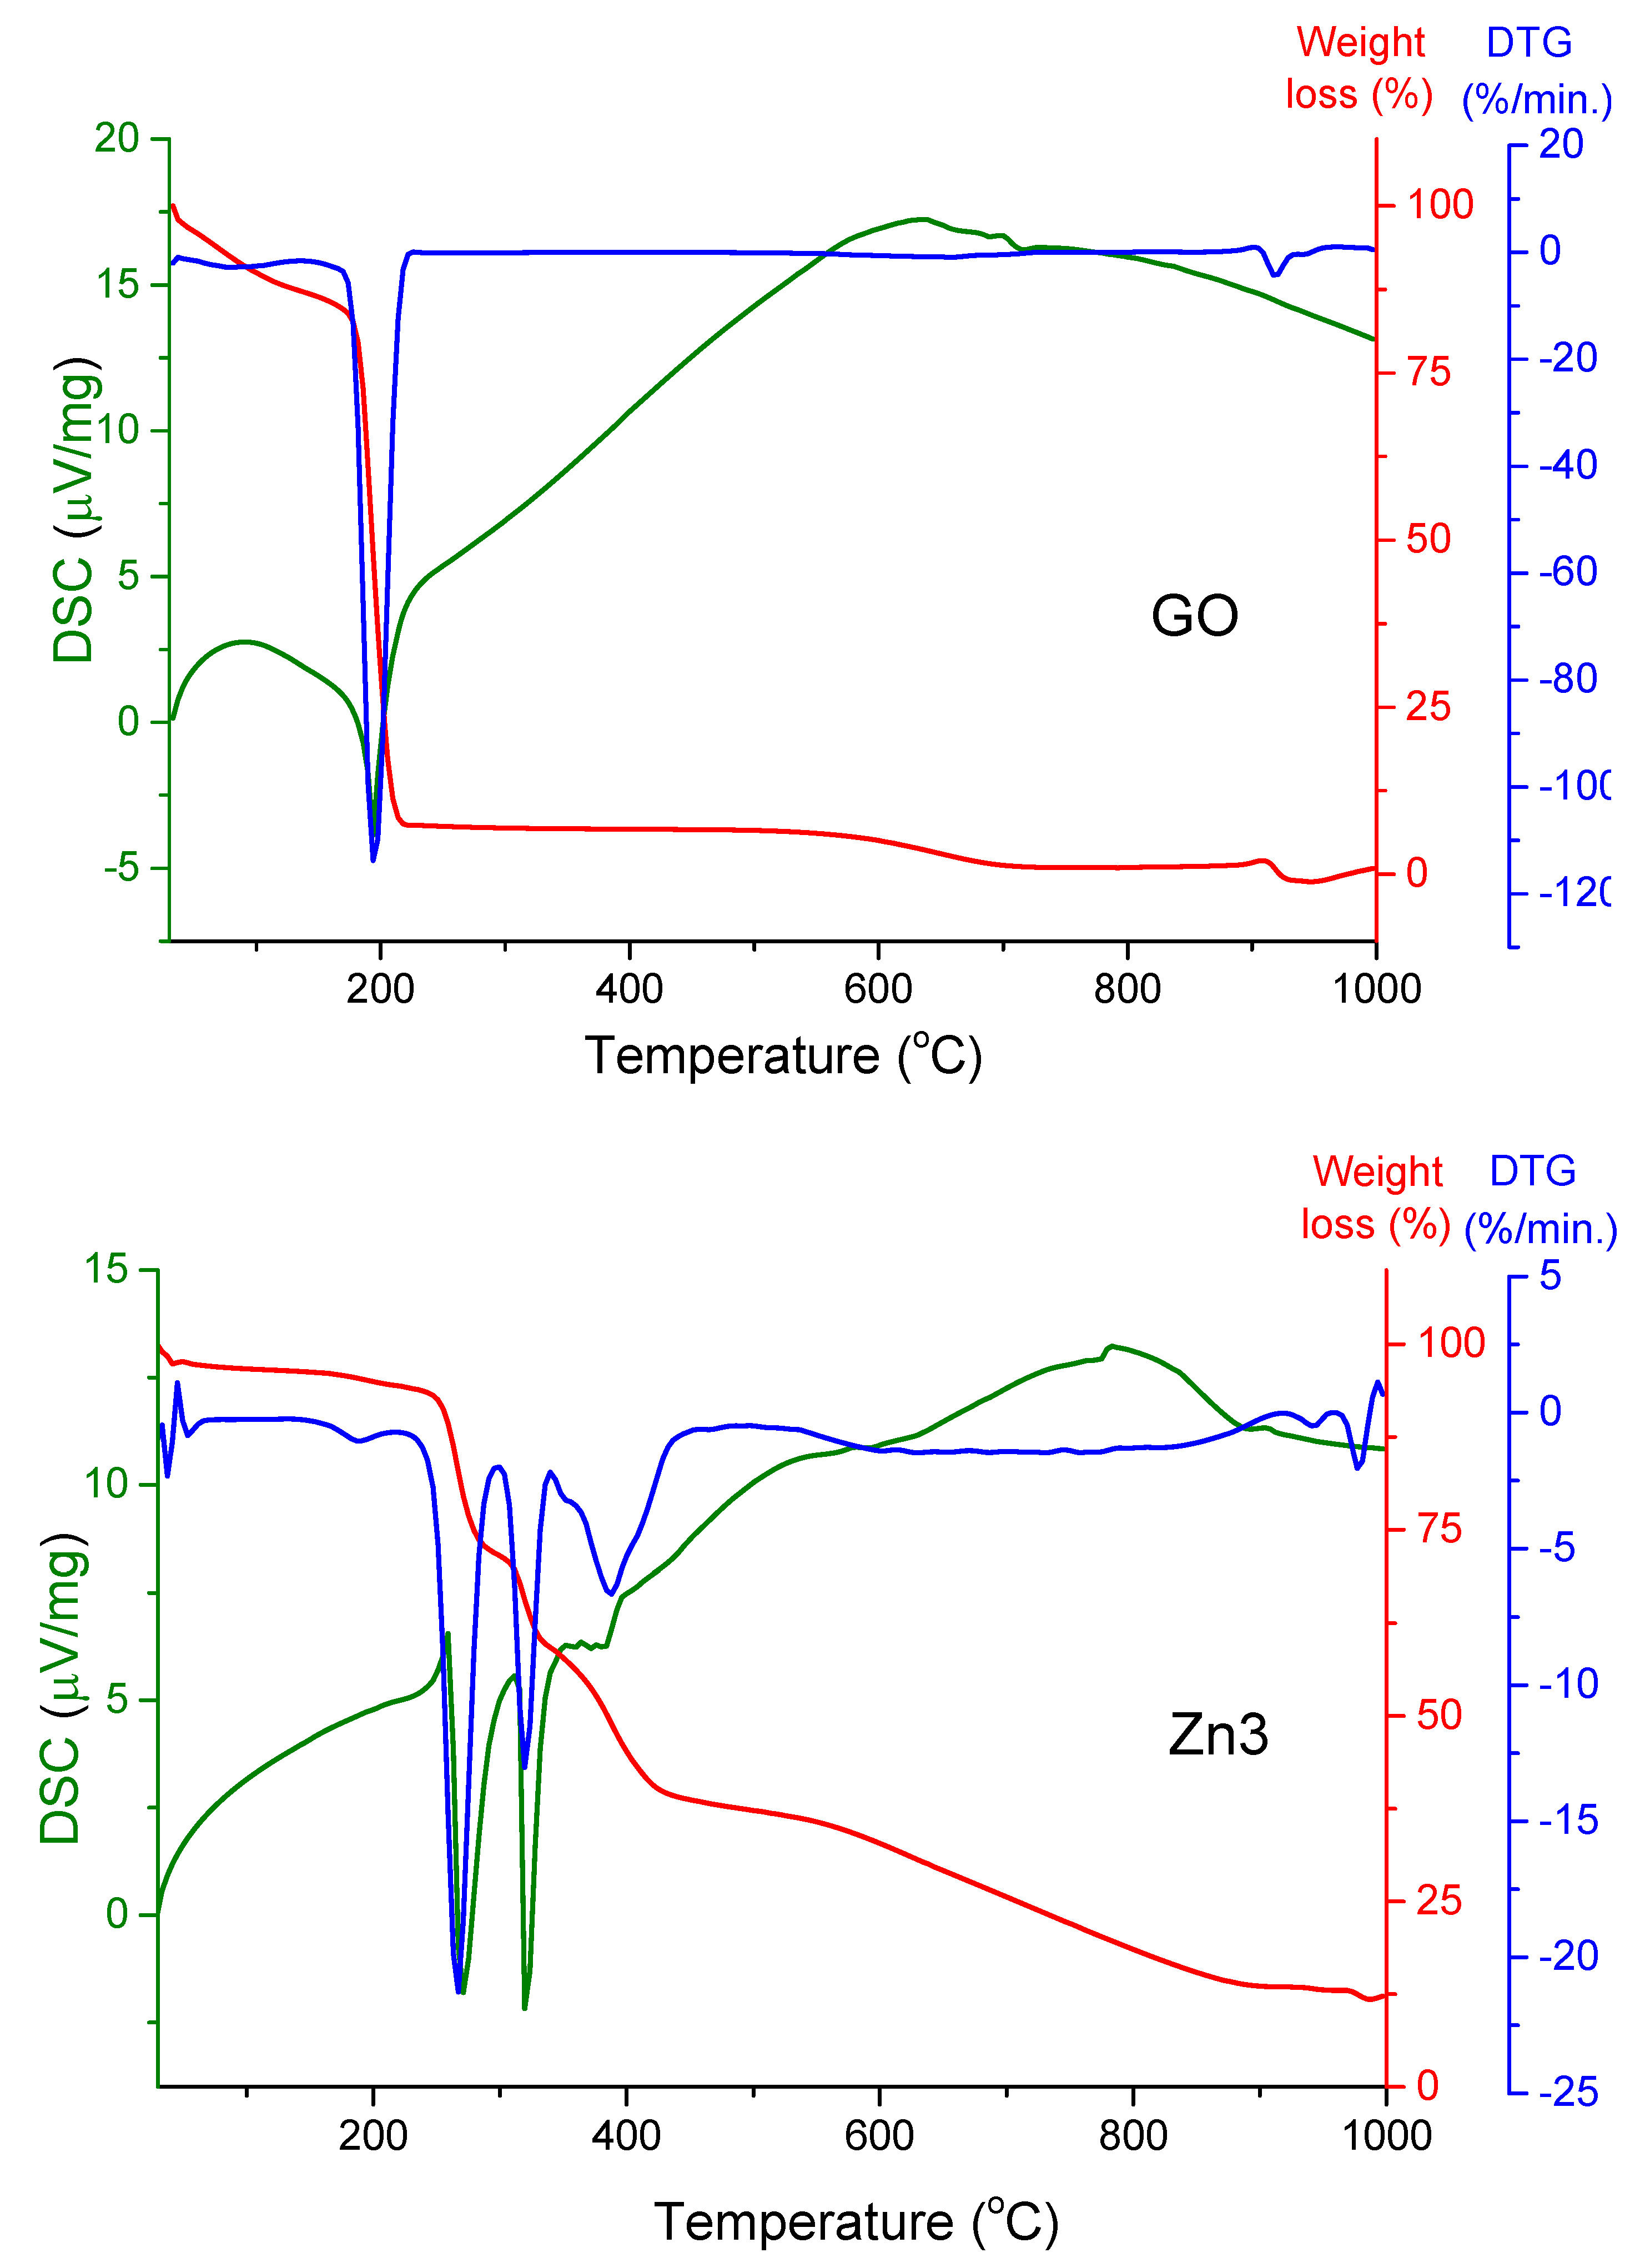
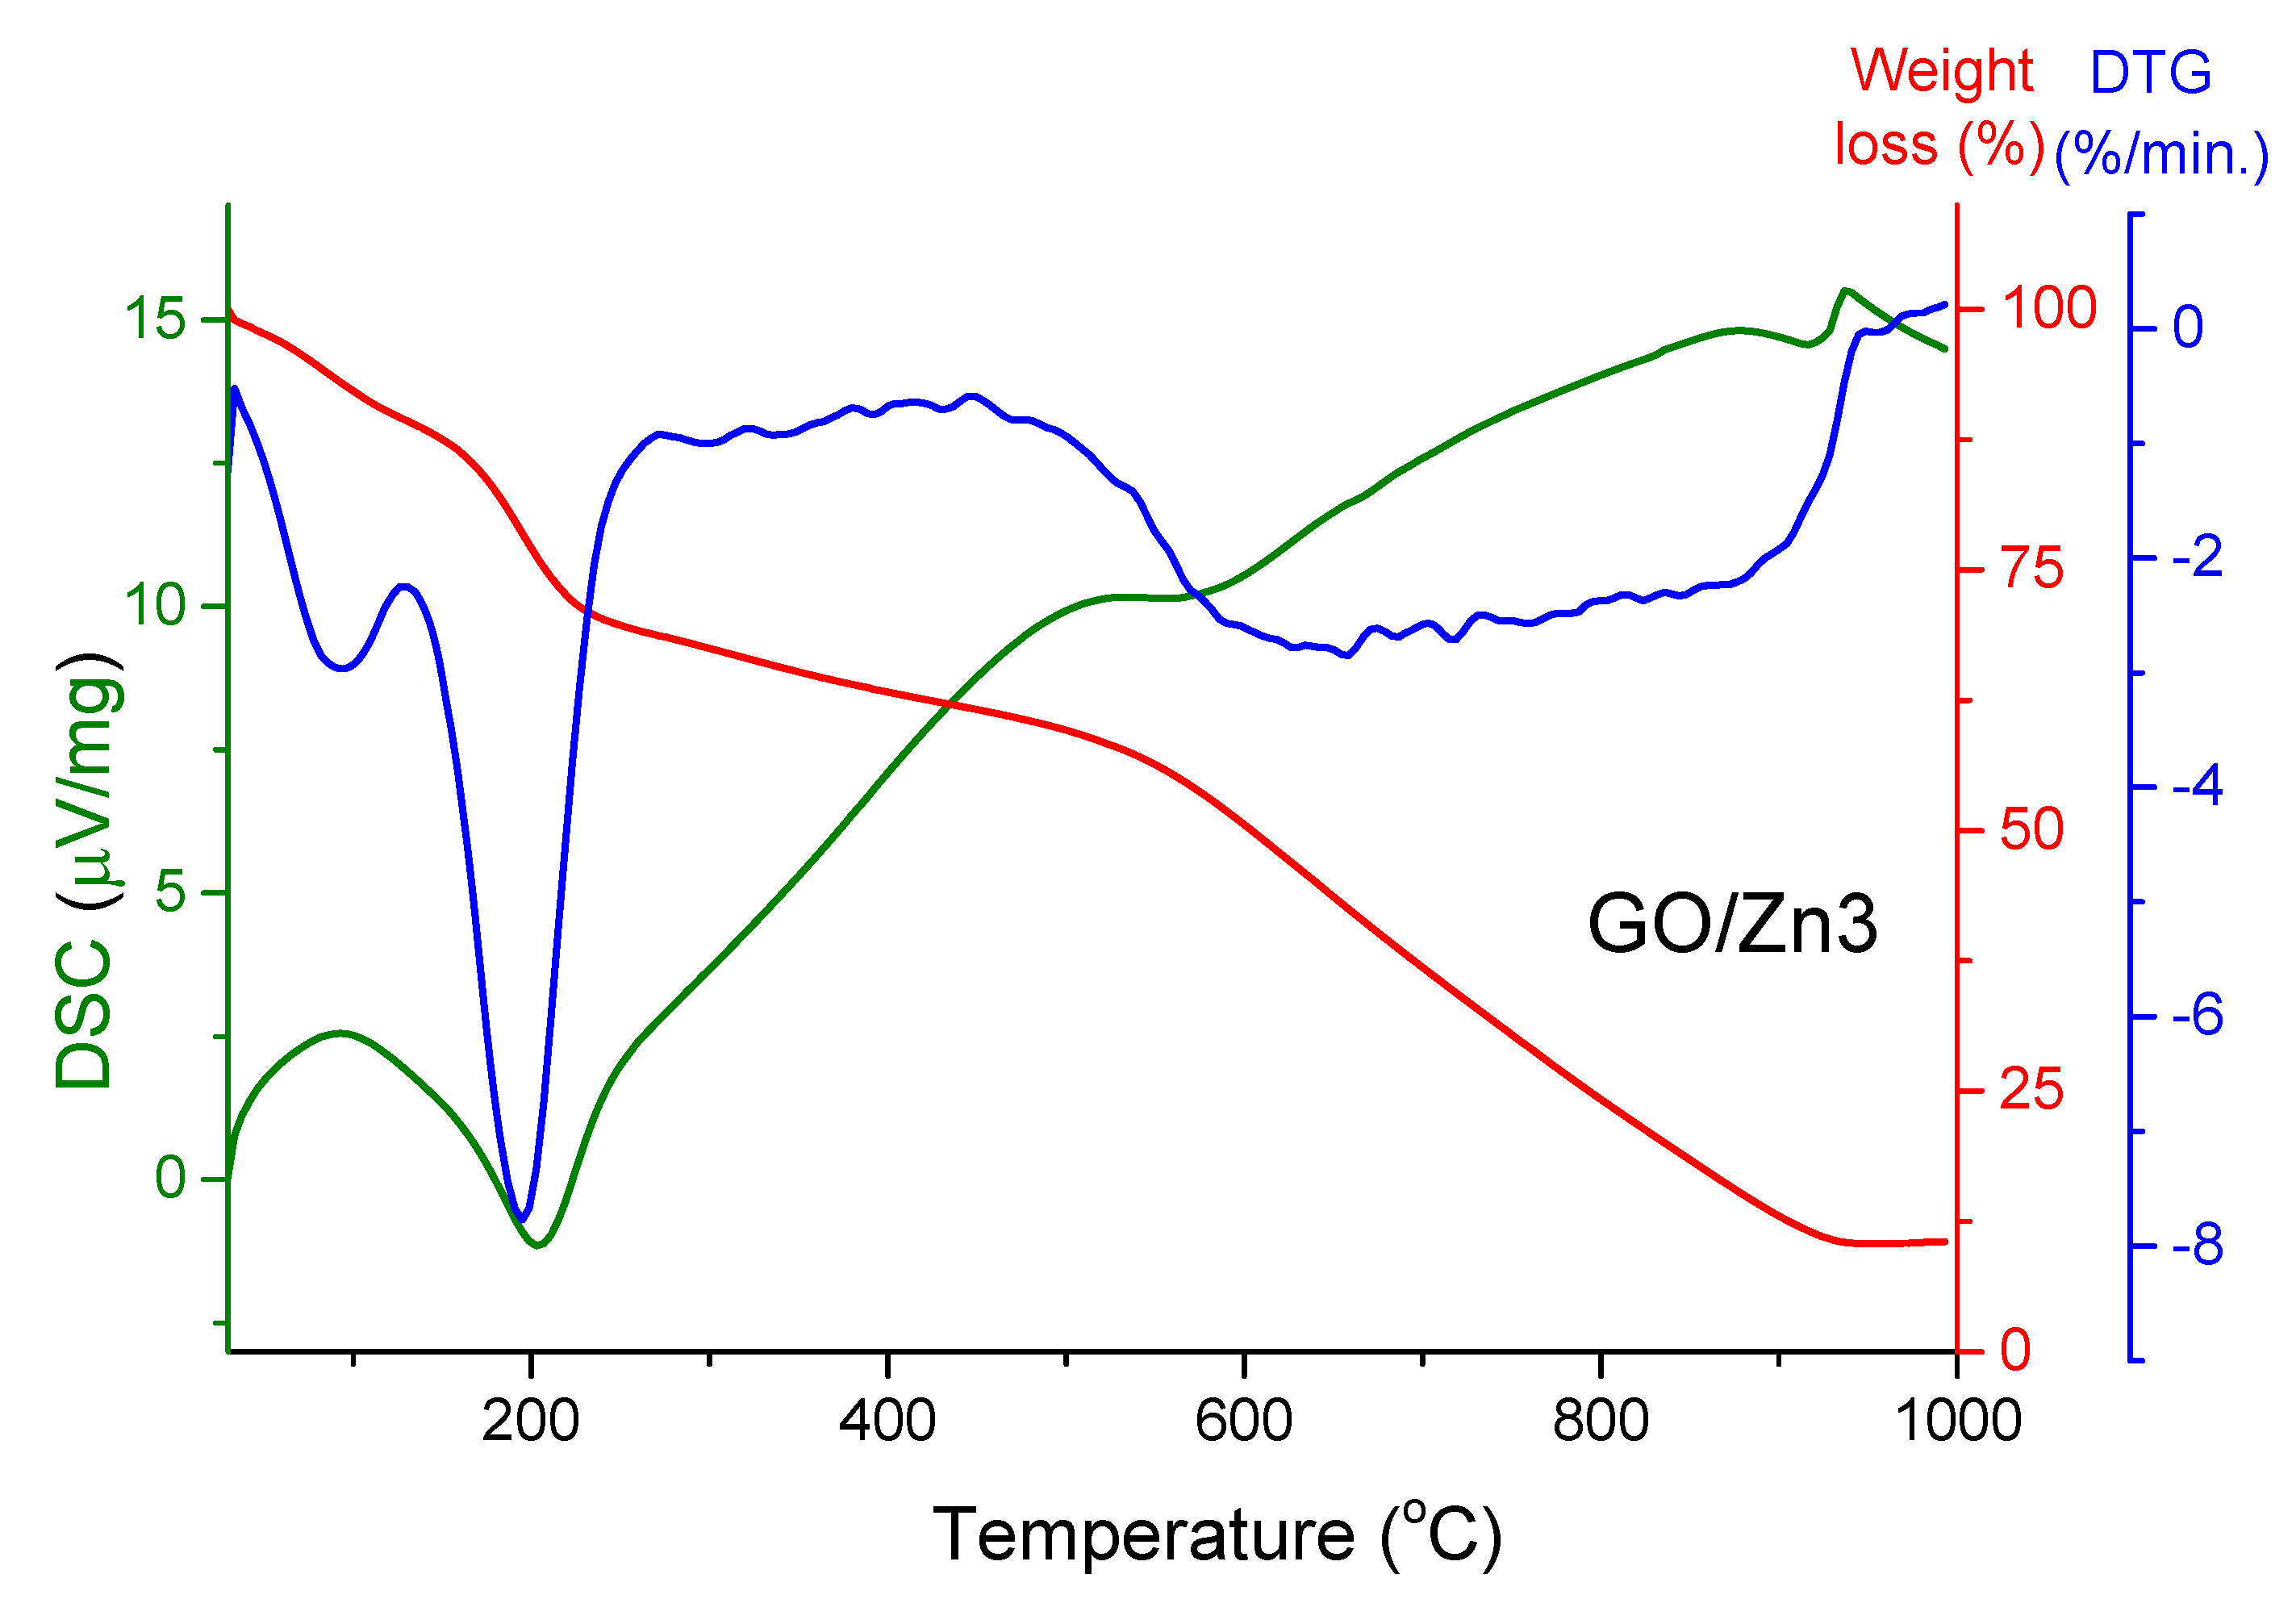
3.1.4. Thermal Analyses

The thermal decomposition of the zinc(II) complex Zn1 displayed several weight loss steps. Figure 4 represents TGA-DTG-DTA thermograms of Zn1. The first two weight losses in the ranges of 220–320 and 225–390 °C were accompanied by two endothermic peaks at 245 and 276 °C, respectively, attributing to the removal of the coordinated chloride ligands. In the temperature range of 485 to 590 °C, the organic component of the complex loses 45% of its weight. A final degradation step with an endothermic peak was observed at 660 °C, assigning to the remaining organic moiety yielding ZnO as the final product.
A rough estimate of the inclusion of zinc(II)-bound hydroxo complex Zn3 in the functionalized GO sample was evidenced from TGA-DSC analysis of Zn3/GO. Figure 5 displays the TGA-DTG-DSC thermograms of GO, Zn3 and Zn3/GO. A well demonstrated non-difference between GO samples before and after functionalization was observed in the range of 100–200 °C. This specifies the non-covalent functionalization of GO with the Zn3, in which the carboxyl groups (COOH) remain deprotonated to form anionic carboxylate species [54]. The additional, most important temperature range at about 200–500 °C corresponds to the combustion of the main carbonaceous fraction, including the attached ligand moieties. The approximate contribution from the weight difference at 350 °C for GO before and after functionalization of the 2-picoly moieties (without Zn, which remains in the ash) is around 4% for the hybrid material collected.

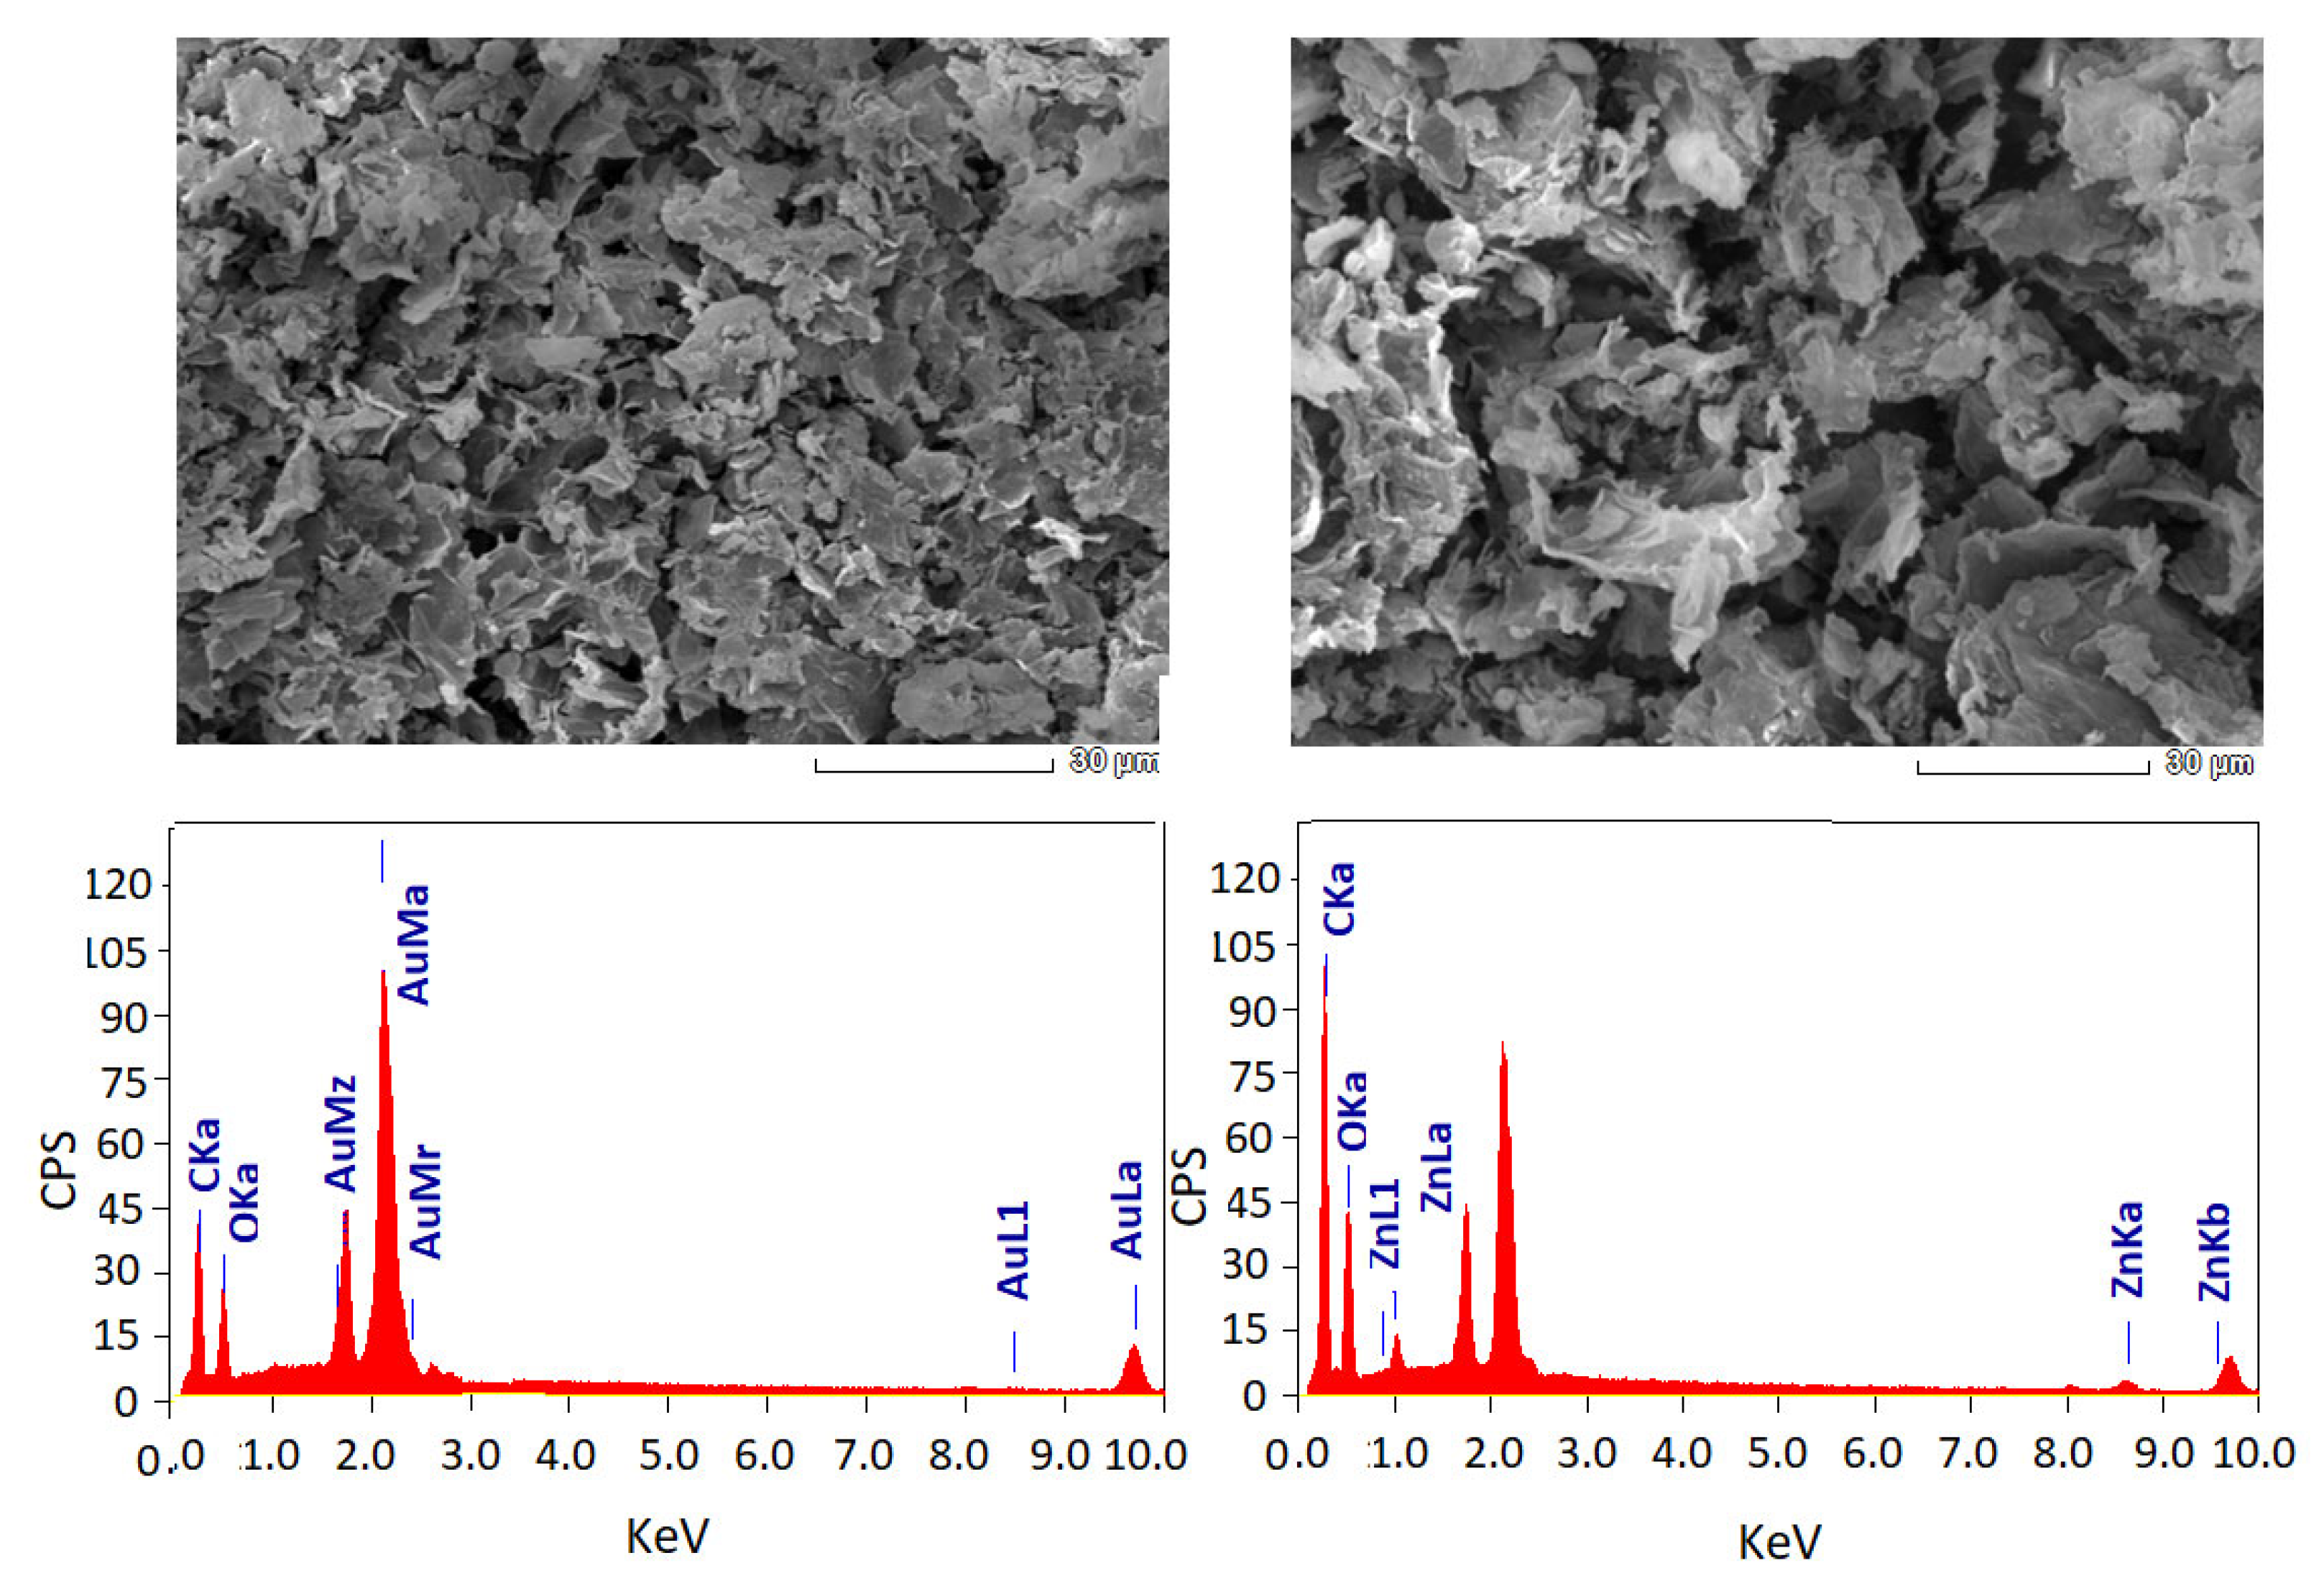
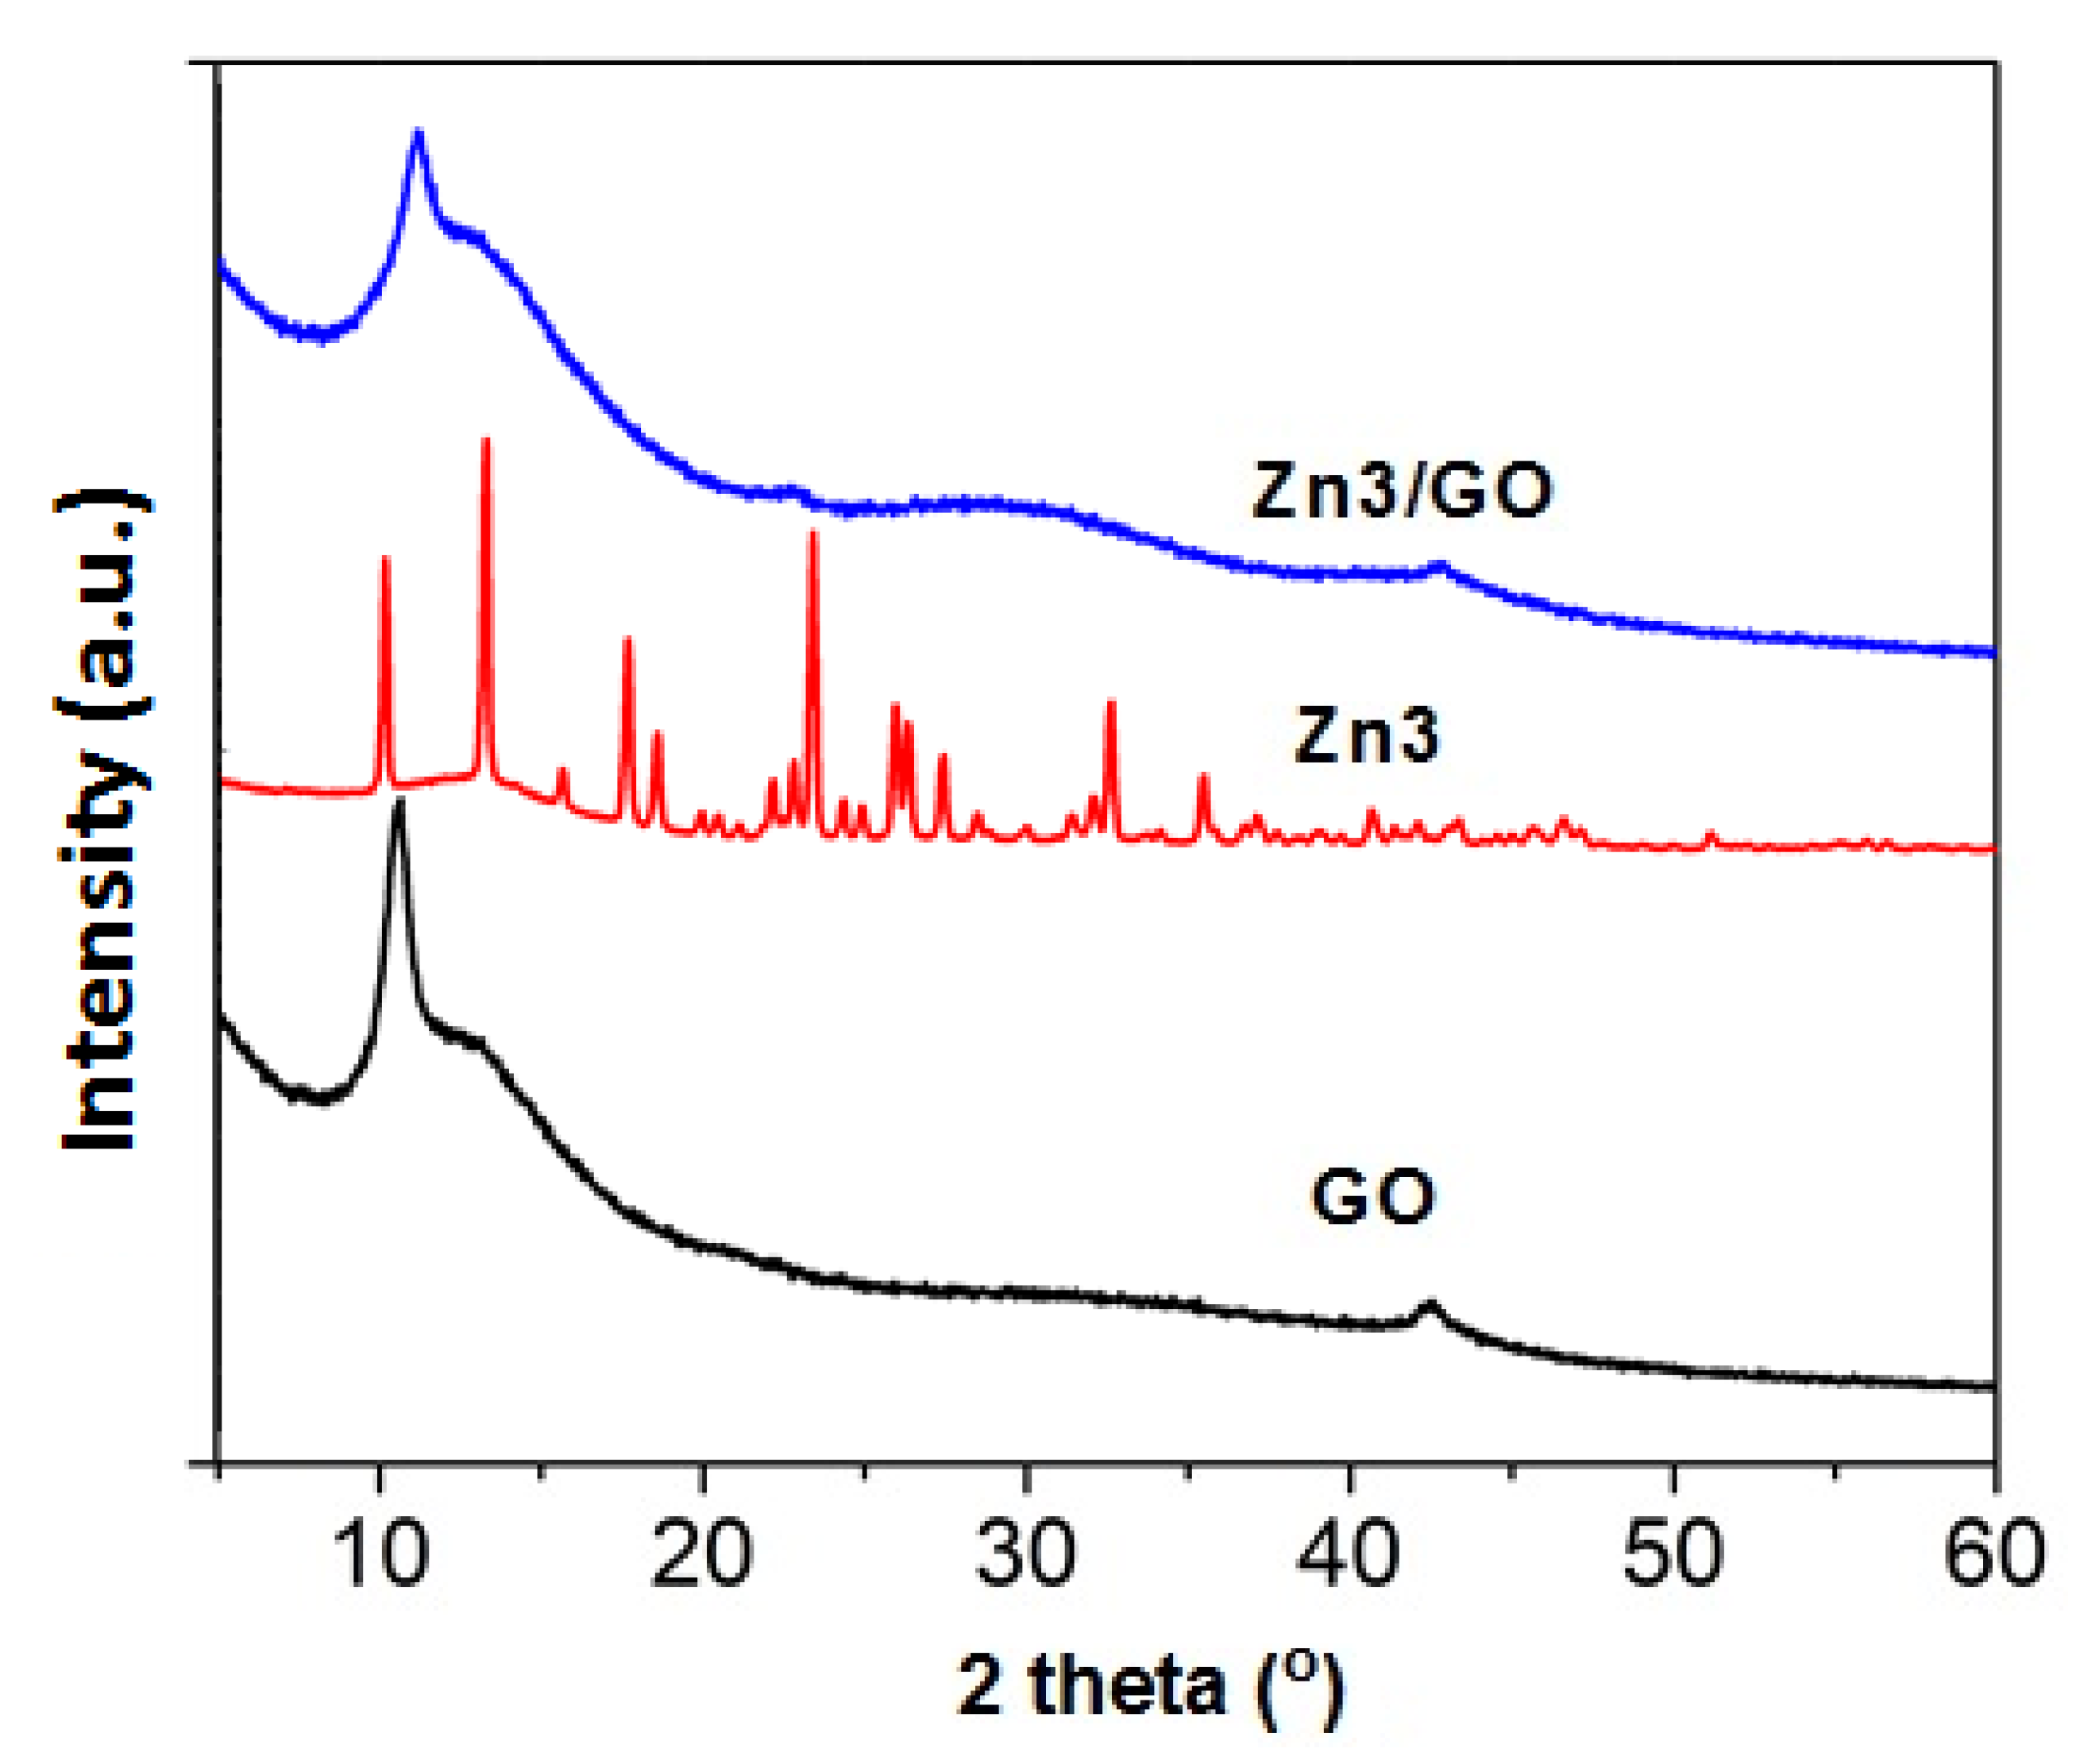
3.1.5. SEM-EDX and X-ray Powder Diffraction
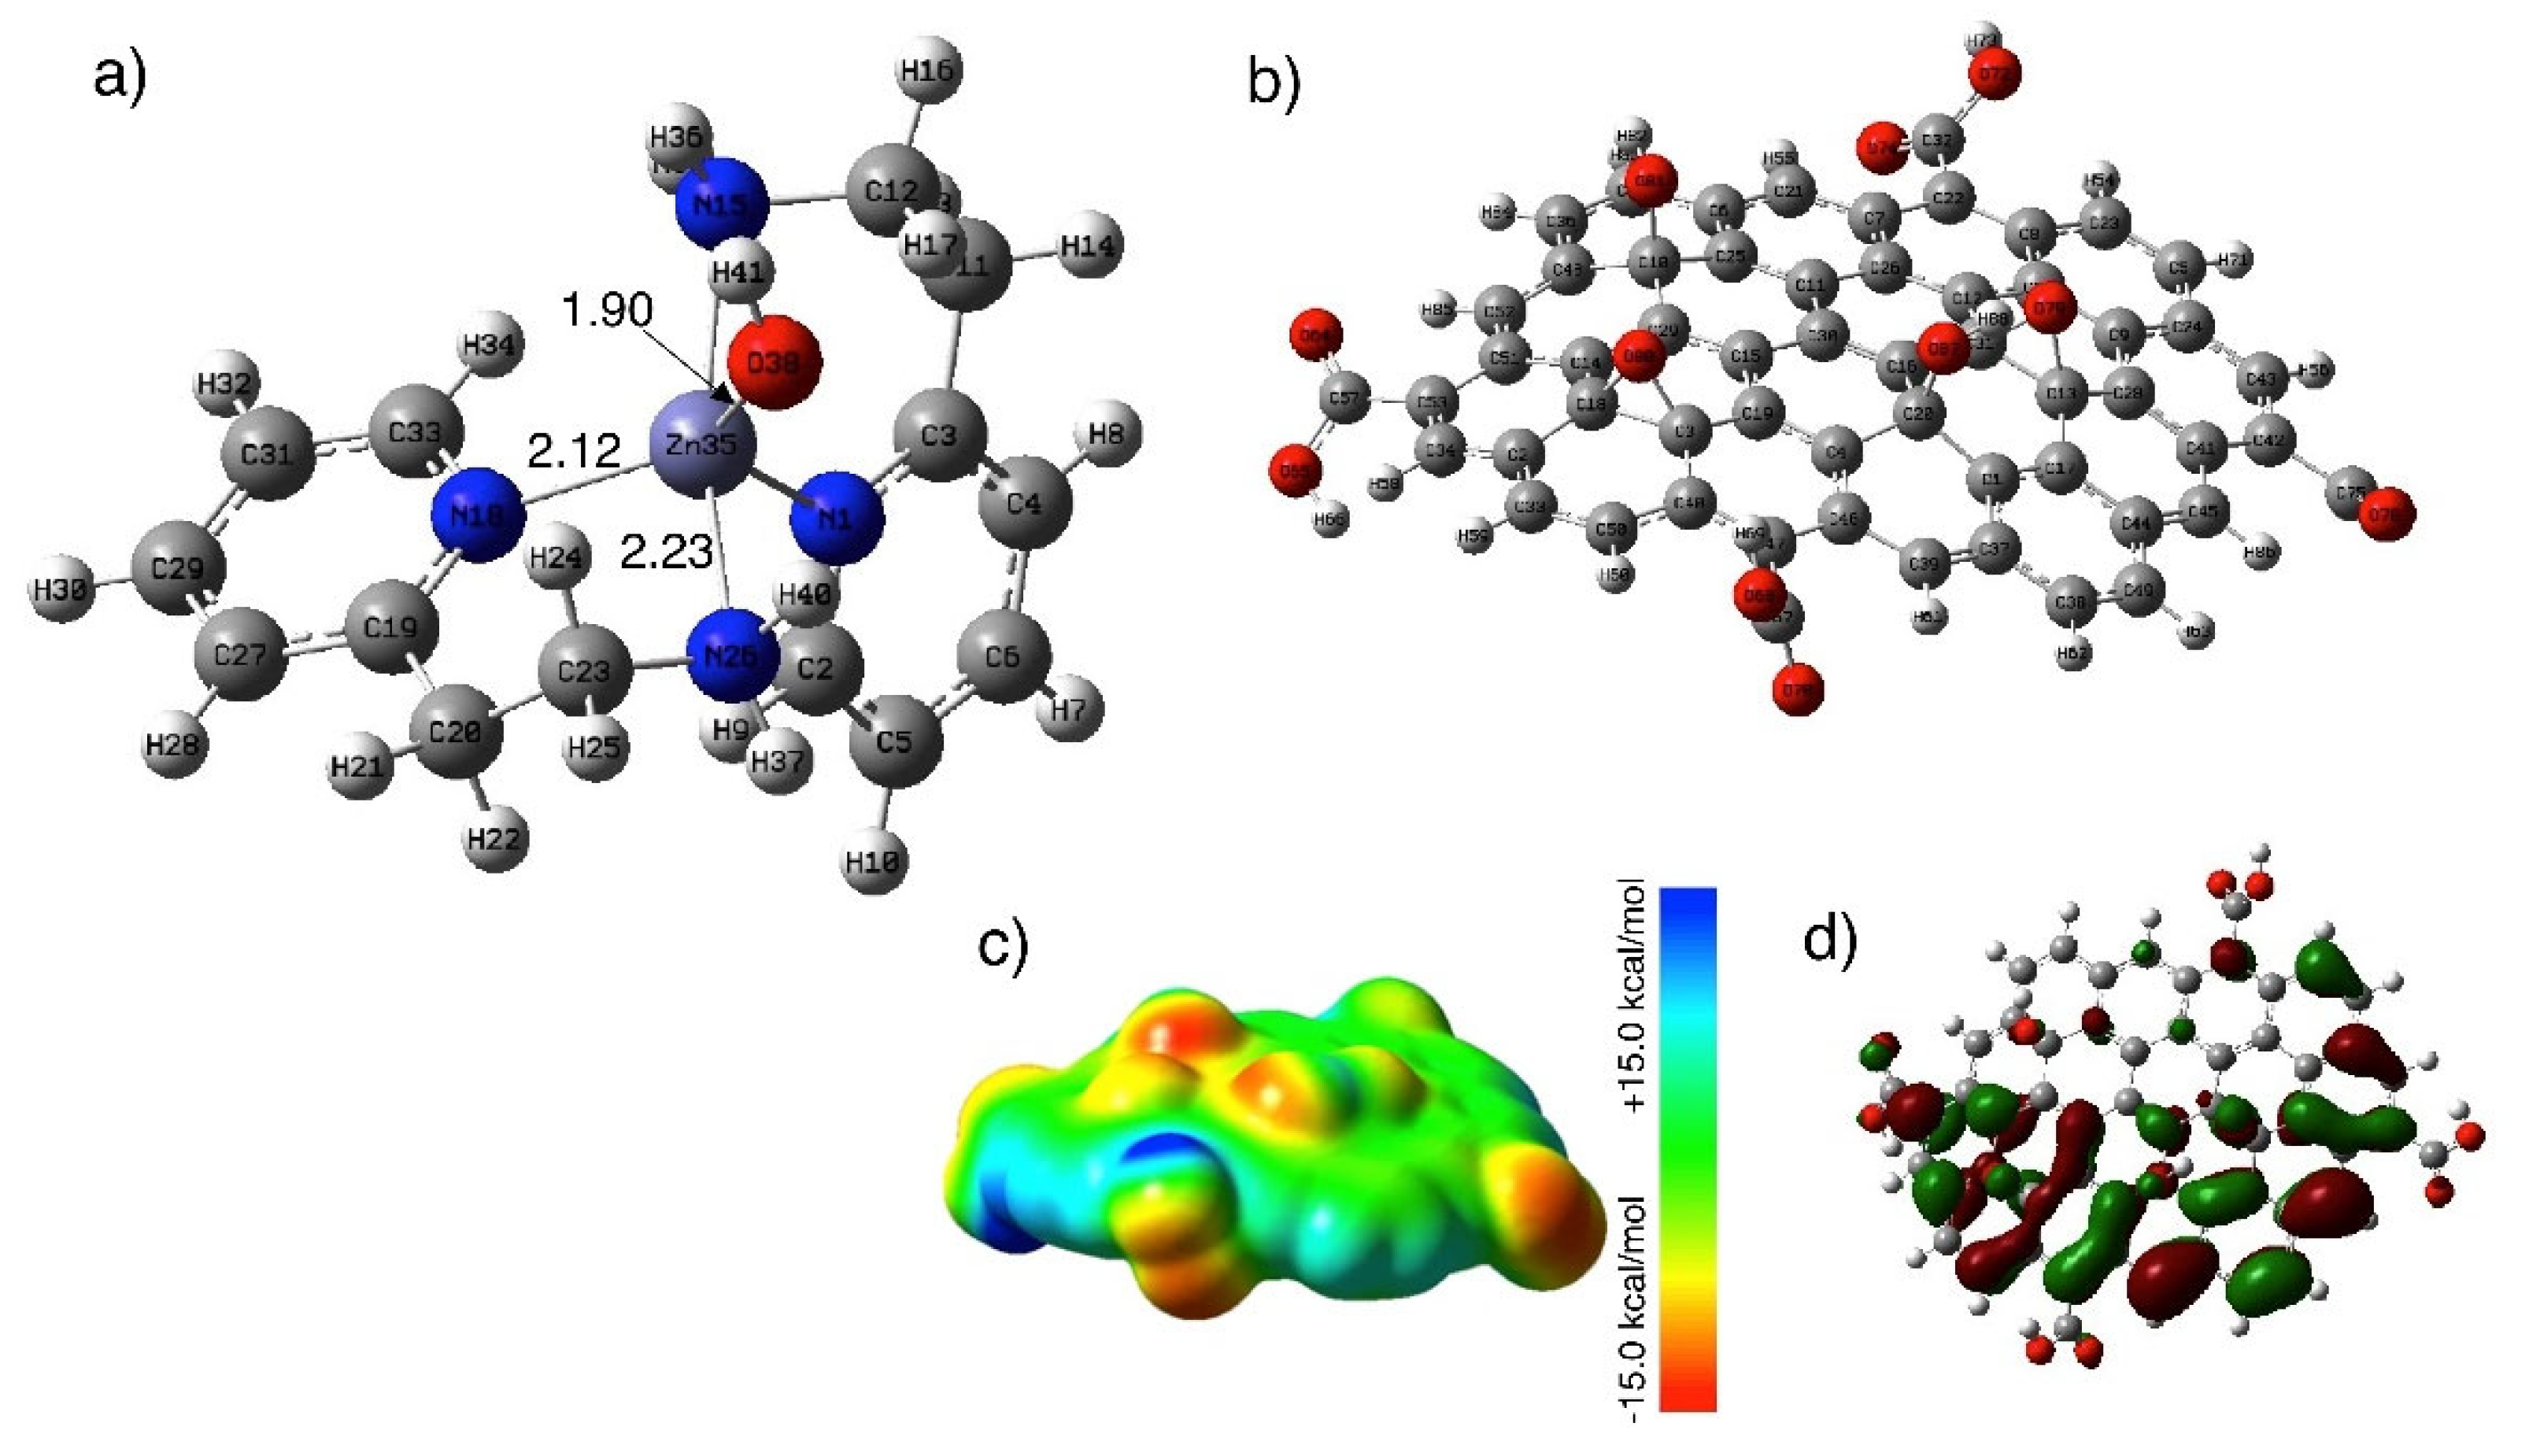
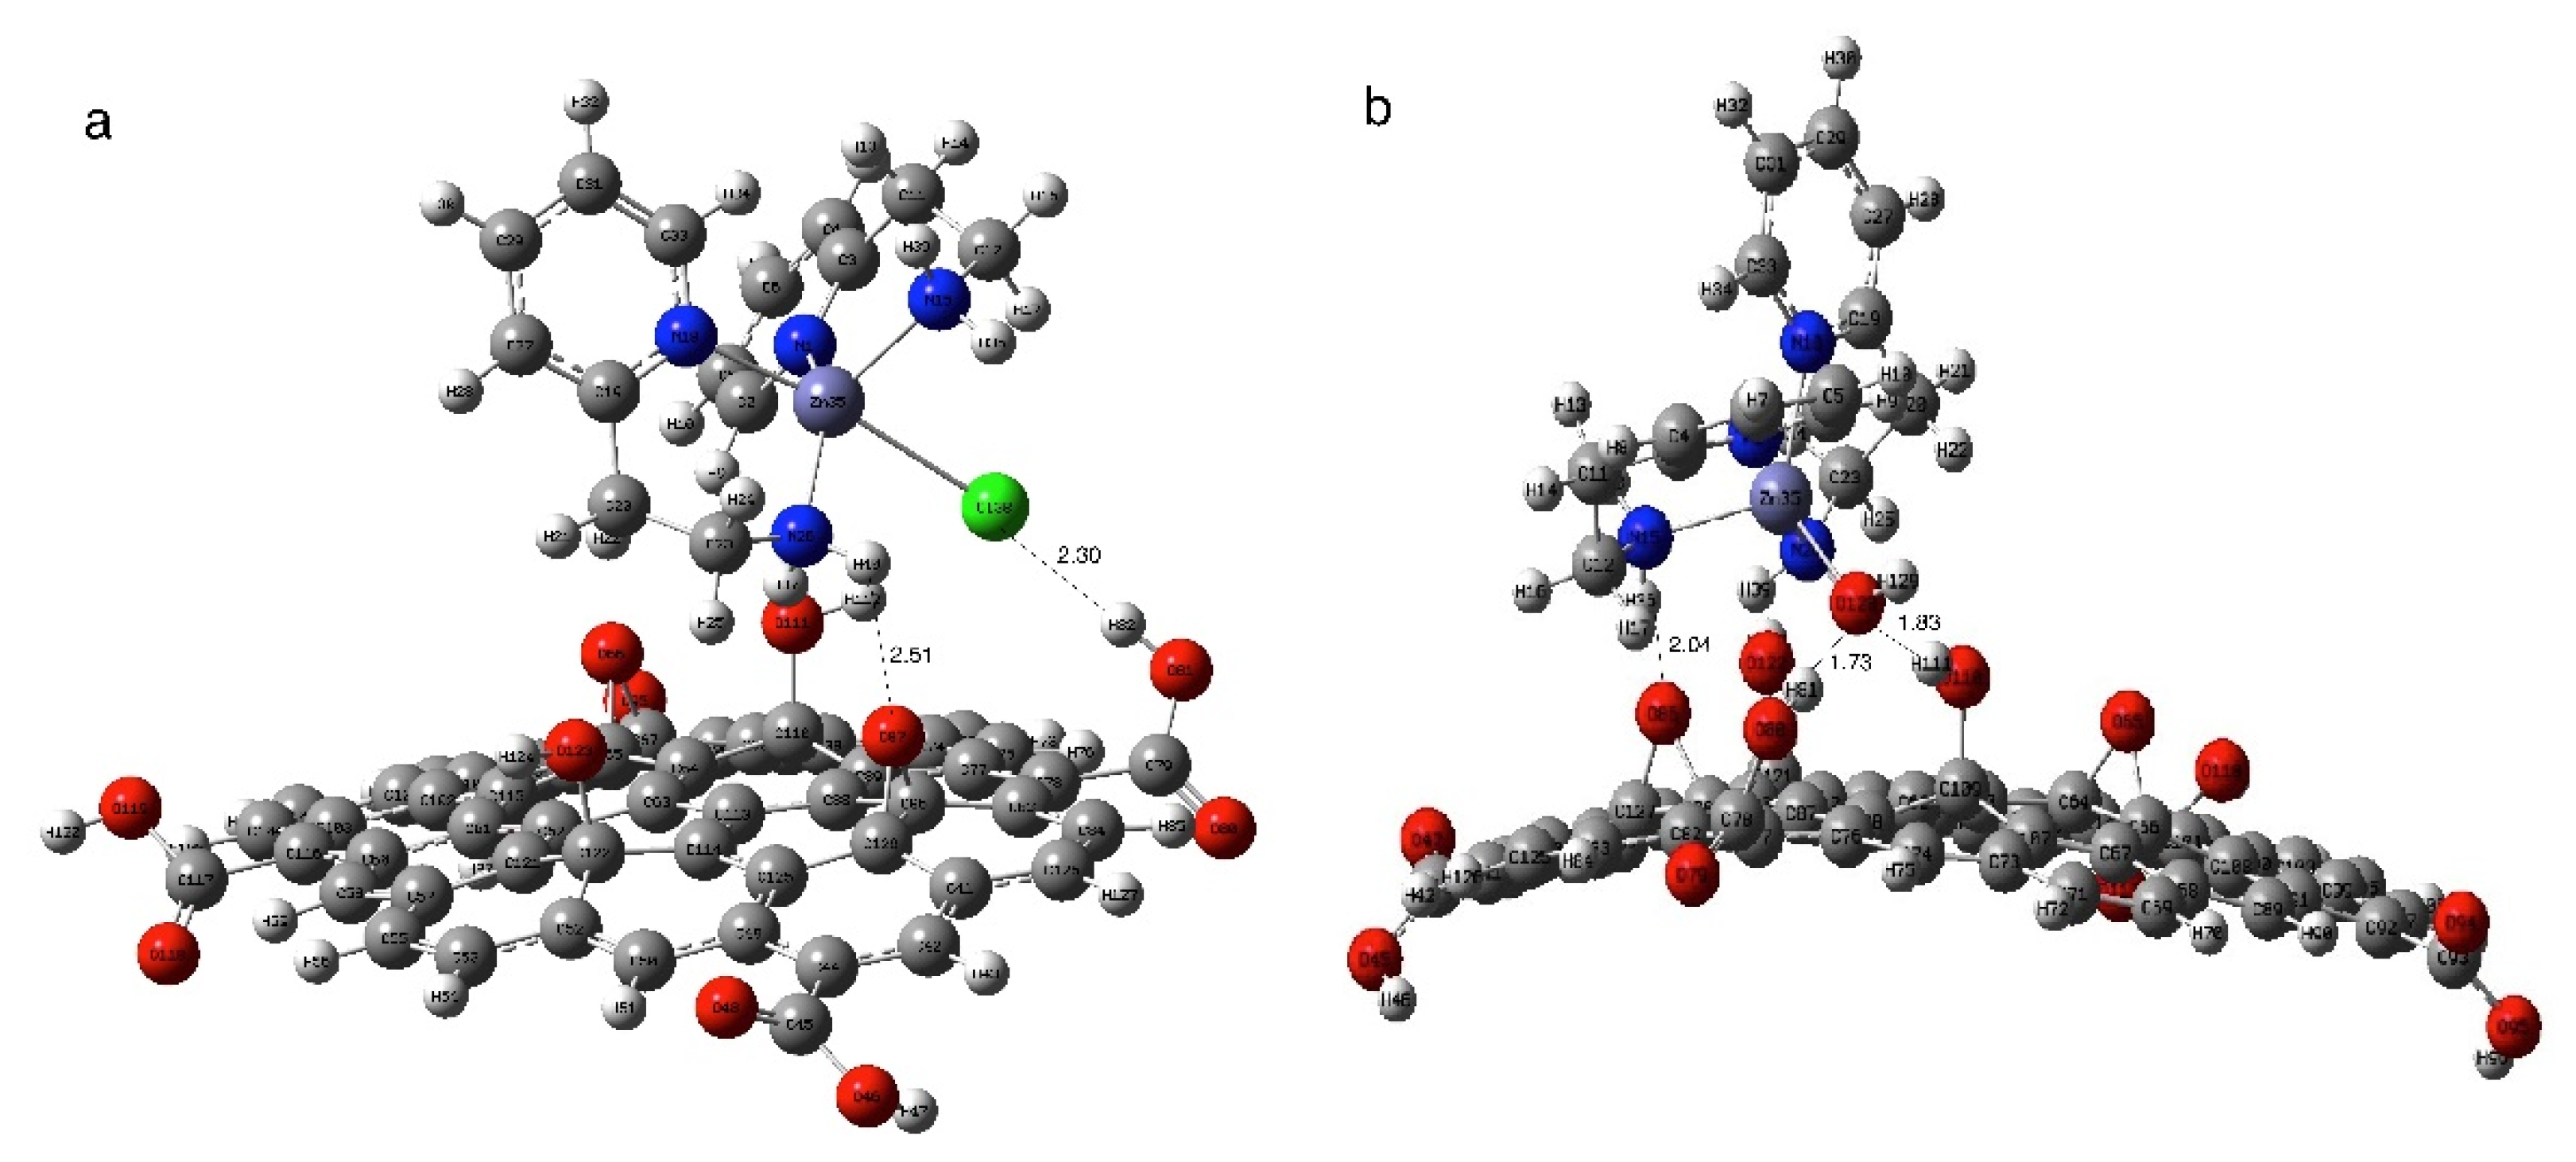
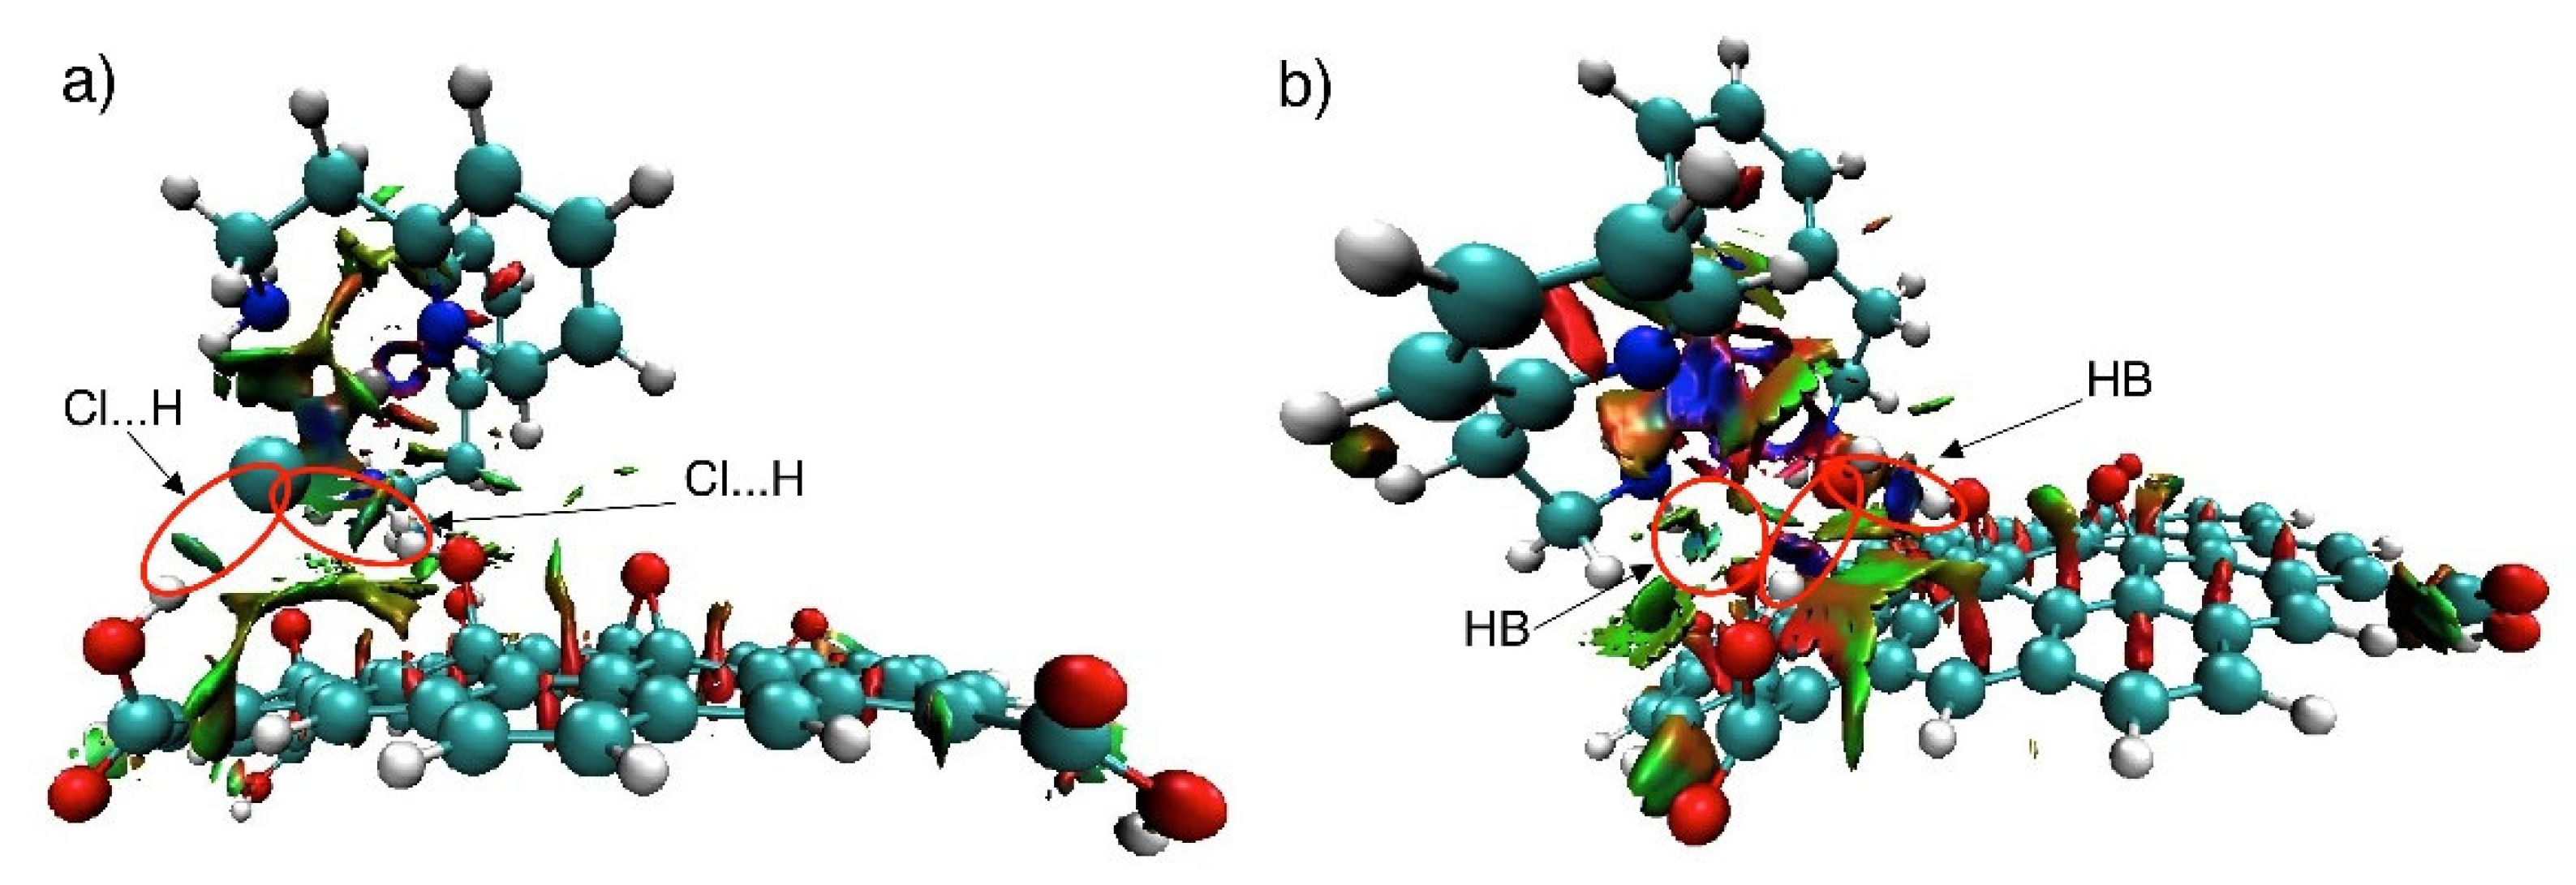
The morphological SEM characterization of GO after functionalization with Zn3 (Figure 6) shows that the hybrid material Zn3/GO exhibits numerous folds and crinkles. A similar effect of functionalization on SEM morphology was also observed with porphyrin tetraazamacrocyclic complexes elsewhere [55].
The structure of the functionalized hybrid material Zn3/GO was also examined using X-ray powder diffraction (XRD) (Figure 7). The immobilization of Zn3 on GO does not affect its phase structure, but the peak strength has decreased slightly. This is due to lower loading of the complex to the GO support structure.

3.2. DFT Studies

DFT calculations were performed using the B3LYP/6–311++G(d,p) level of theory to provide further insight into the electronic structure of the nanocomposite [(2-PA)2Zn(H2O)](NO3)2/GO. First, the molecular structure of Zn3 was optimized and compared to the geometrical structure of Zn1. Figure 8 shows the optimized structures of both Zn3 and GO. The Zn35…N26 and Zn35…N18 in Zn3 were 2.23 and 2.12 Å compared to 2.21 and 2.07 Å in Zn1, respectively. The bond length of Zn35…O36H41 is 1.90 Å, which is shorter than that of Zn1···Cl1 in Zn1, which has been attributed to the higher electron density in the OH group.
A total of 110 carbon atoms and various oxygen surface groups, such as two epoxy groups, two hydroxy groups and four terminal carboxylic groups, were simulated on the GO sheet. The selected GO sheet has been widely used for the adsorption of organic and inorganic surface molecules [56,57]. The optimized GO structure along with the measured MESP map is shown in Figure 8b. The MESP demonstrates the existence of nucleophilic sites that could be potential atoms for binding to the Zn3 complex of zinc(II), while the measured GO HOMO orbitals display the contribution of the epoxy and hydroxyl groups to the surface binding group. The optimized structures of Zn1/GO and Zn3/GO are shown in Figure 9. Data of Zn1/GO show that the complex is stabilized by various hydrogen bonds such as Cl38... H82-O81 (2.30 Å), O87... H41-N26 (2.51 Å), with a bond angle of 175 and 165°, respectively. The formed hydrogen bonds’ lengths in Zn3/GO were shorter than Zn1/GO, for example, O128…H111-O118 (1.83 Å), O128…H81-O88 (1.73 Å) and O85…H36-N15 (2.04 Å), with bond angles of 179, 165 and 171° respectively. The adsorption energies calculated for Zn1/GO and Zn3/GO were −9.2 and −14.3 kcal/mol, respectively, confirming the high stability and exothermic adsorption of Zn3/GO. In addition, the high exothermic adsorption energy of Zn3/GO was confirmed by the calculated ΔH = −6.4 kcal/mol compared to Zn1/GO (ΔH = −1.2 kcal/mol).
We investigated the non-covalent interaction (NCI), which largely depends on surface electron density, to investigate the existence of molecular interactions for Zn1/GO and Zn3/GO structure stabilizations. The 3D isosurface plot visualizes the strength of the noncovalent interactions, where strong NCI such as hydrogen bonding is indicated by the blue region, the green region indicates the weak NCI and the repulsion forces are indicated by the red region (Figure 10). In Zn1/GO, the isosurface plot shows the presence of green surface between Cl atom and the H atom for weak HB. On the other hand, the blue region between the O atom of the OH group on the complex and the surface OH groups on the GO surface is illustrated by the Zn3/GO isosurface, which suggests the development of strong HB interactions. This finding is confirmed by the short lengths of HB bonds in Zn3/GO rather than Zn1/GO.
Table 3 displays the calculated HOMO and LUMO orbital energies of GO, Zn1/GO and Zn3/GO as well as the corresponding energy gap. The determined HOMO and LUMO energies show that both HOMO and LUMO orbitals are stabilized by the immobilization of Zn(II) complexes on the GO surface and the GO energy gap is reduced. Important charge transfer from the Zn(II) complex to the GO surface occurs during its immobilization on the GO surface.

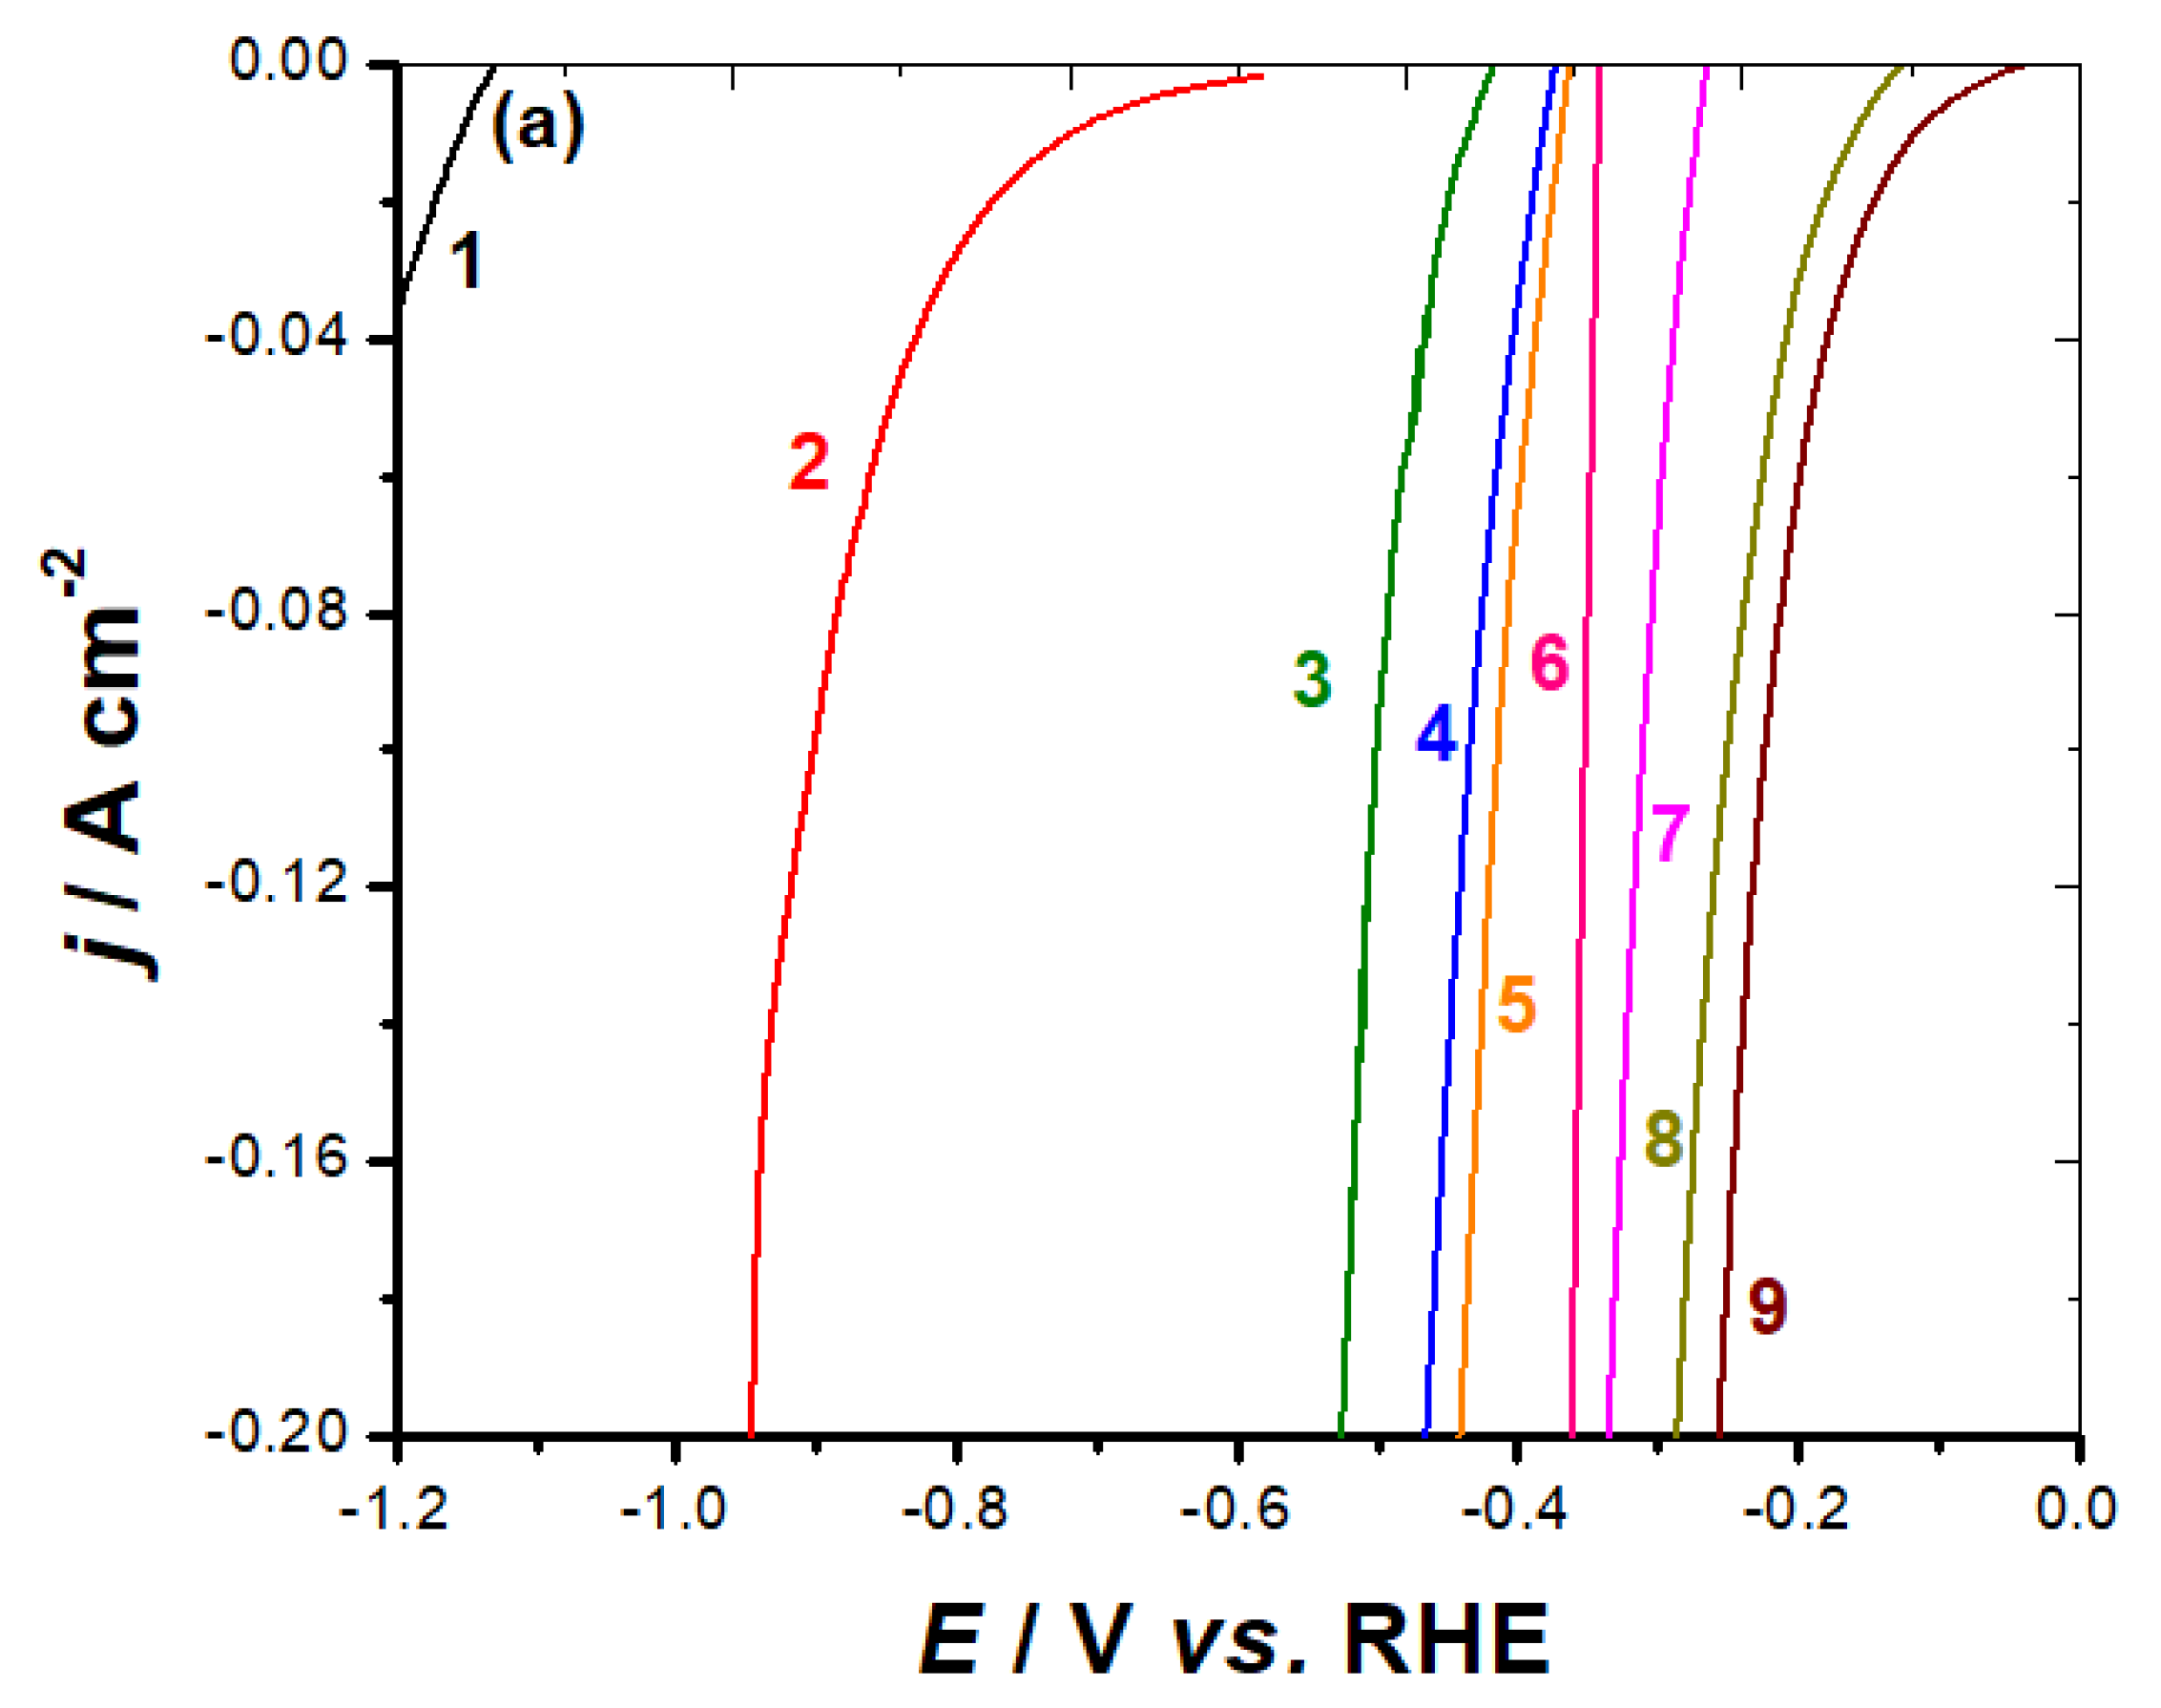
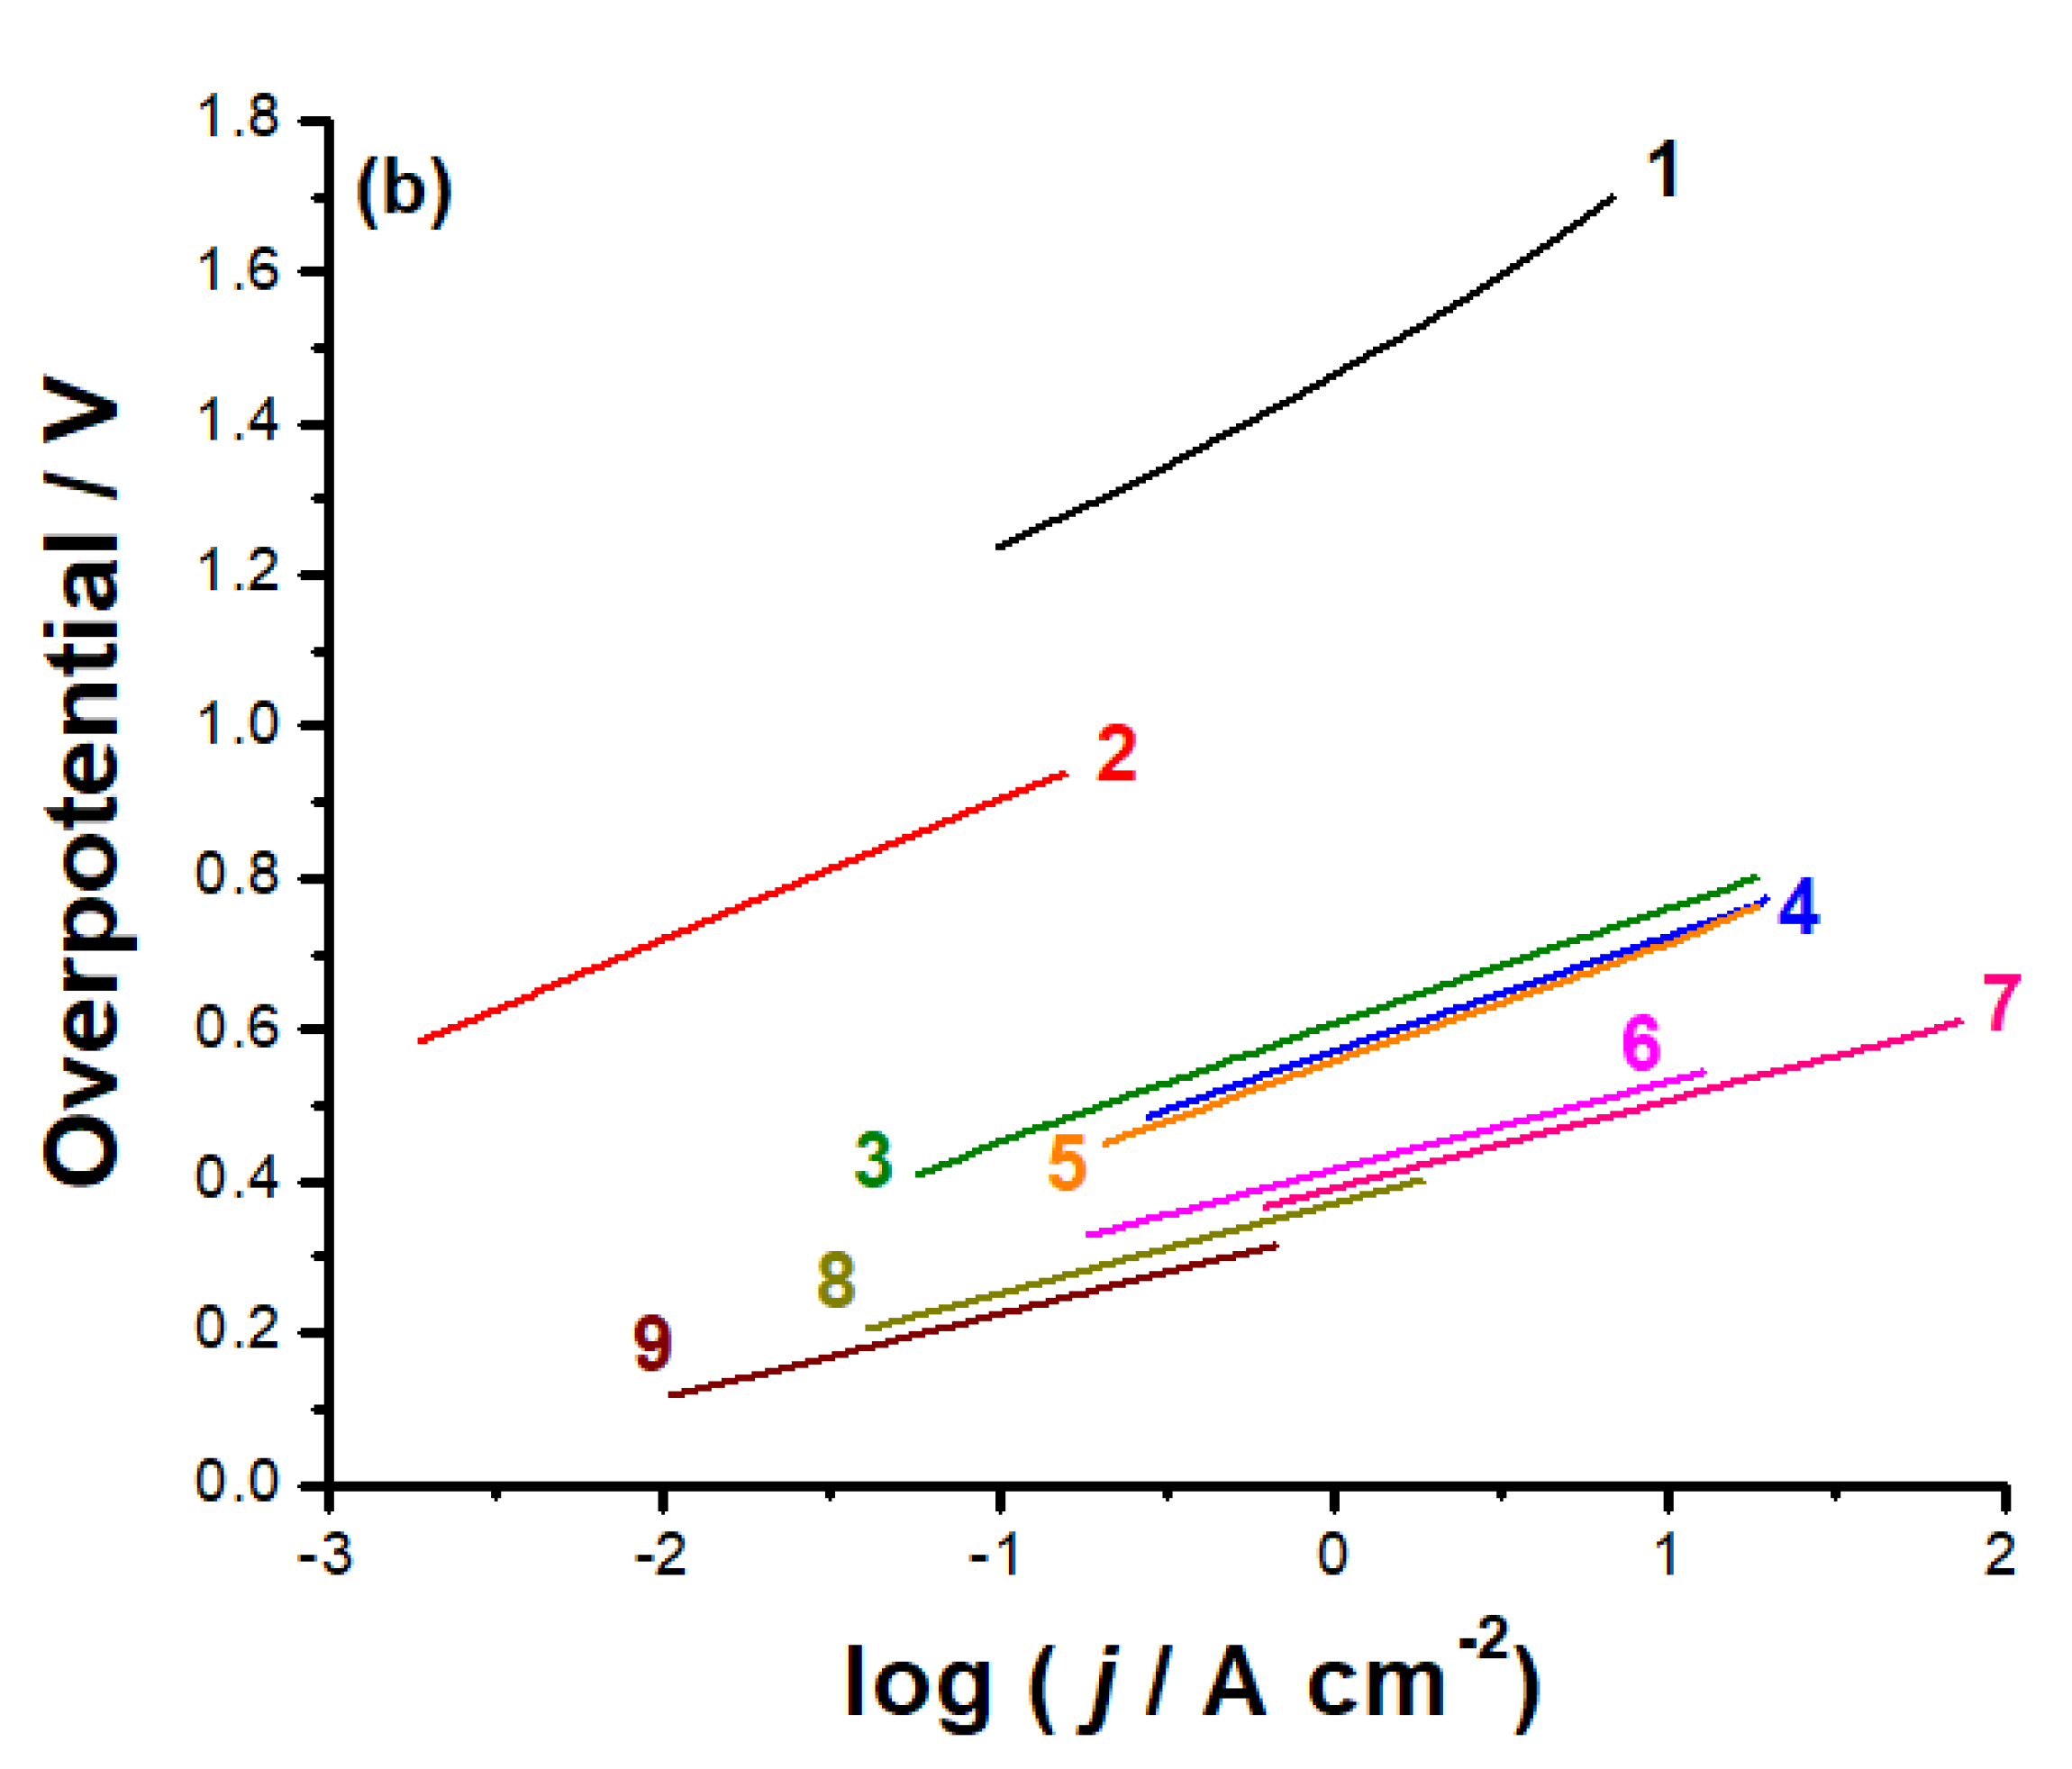
3.3. HER Electrocatalytic Studies

Figure 11a shows the cathodic polarization curves constructed for unsupported (Zn3) and GO-supported Zn3 (Zn3/GO) electrodes with various loading densities (ca. 0.2–0.8 mg cm−2).
Measurements were conducted at room temperature in deaerated the aqueous solution of KOH (0.1M). The potential of the working electrode is cathodically polarized, starting from the respective corrosion potential up to a cathodic potential value of −1.0 V vs. RHE at a potential scan rate of 5.0 mV s−1. The accompanying Tafel plots were created to acquire additional insight into the electrocatalytic behavior of the investigated catalysts, Figure 11b. The electrochemical kinetic parameters of the HER derived from the Tafel plots are depicted in Table 4.
These parameters include the HER’s onset potential (EHER), cathodic Tafel slope (βc), exchange current density (jo) and the overpotential required to create a current density of 10 mA cm2, η10. For proper evaluation and comparison of catalyst electrocatalytic activity, the latter parameter, namely η10, is normative [58]. The electrochemical active surface area (EASA) of each tested catalyst is determined from the impedance measurements, and is used to calculate all catalytic currents, as reported elsewhere [59].
The HER electrocatalytic activity of the investigated catalysts is first evaluated and compared using their EHER value, the potential at which proton reduction is initiated to generate H2 and beyond which H2 is profusely evolved corresponding to increased cathodic current. This potential is therefore considered as a crucial electrochemical kinetic characteristic that evaluates the catalyst’s HER catalytic performance because any change in its location on the polarization curve causes a considerable change in the numerical value of jo, which impacts HER catalytic activity. In the literature, an electrocatalyst with a low EHER value is described as an efficient HER electrocatalyst because it generates large volumes of H2 with higher jo values at low overpotentials [59,60,61,62,63,64].
When compared to a bare GC electrode (Figure 11a, curve 1), the GC-Zn3 electrodes showed significant current improvements at lower EHER values, which continued to decrease, corresponding to improved HER kinetics, after supporting Zn3 on GO. These findings show that the supportive material (GO) has a catalytic effect in boosting the HER. With increasing loading density of Zn3, the EHER value drifts towards the anodic (active) direction. These findings suggest that as the loading density of the investigated complex increases, hydrogen generation is favored at low overpotential values, especially when immobilized on GO.
The electrochemical kinetic parameter symbolized as η10, the overpotential value acquired by an electrocatalyst to deliver a current density value of 10 mA cm–2, is important to compare and assess the catalytic efficacy of electrocatalysts [50]. From Table 4, it is clear that, like EHER, the value of η10 drops as the catalyst’s loading density increases, regardless of whether the supporting material GO is present or not. In the presence of GO, the η10 value for any investigated loading density decreases much further. These findings affirm the efficient production of hydrogen at lower overpotentials when the electrocatalyst loading density is increased, especially when the electrocatalyst is supported on GO.
Increased Zn3’s loading density and its immobilization on GO resulted in a significant rise in the exchange current density (jo) value, signifying higher catalytic activity. This is obvious from the values of jo depicted in Table 4, where, for instance, the value of jo rose from 0.1 mA cm−2 for a loading density of 0.2 mg cm2 to 0.19 and 0.26 mA cm−2 for loading density values of 0.4 and 0.8 mg cm2, respectively. The value of jo increased further to 0.28, 0.45 and 0.77 mA cm2 for the same loading density values, namely 0.2, 0.4 and 0.8 mg cm2, when Zn3 catalyst was supported on the GO.
Table S1 (Supporting Information) revealed that, based on its calculated HER electrochemical kinetic parameters (EHER, jo, βc, and η10), the HER catalytic performance of the best catalyst reported here, namely GC-Zn3 (0.8 mg cm2)/GO, outperformed the most active HER molecular electrocatalysts reported in the literature.

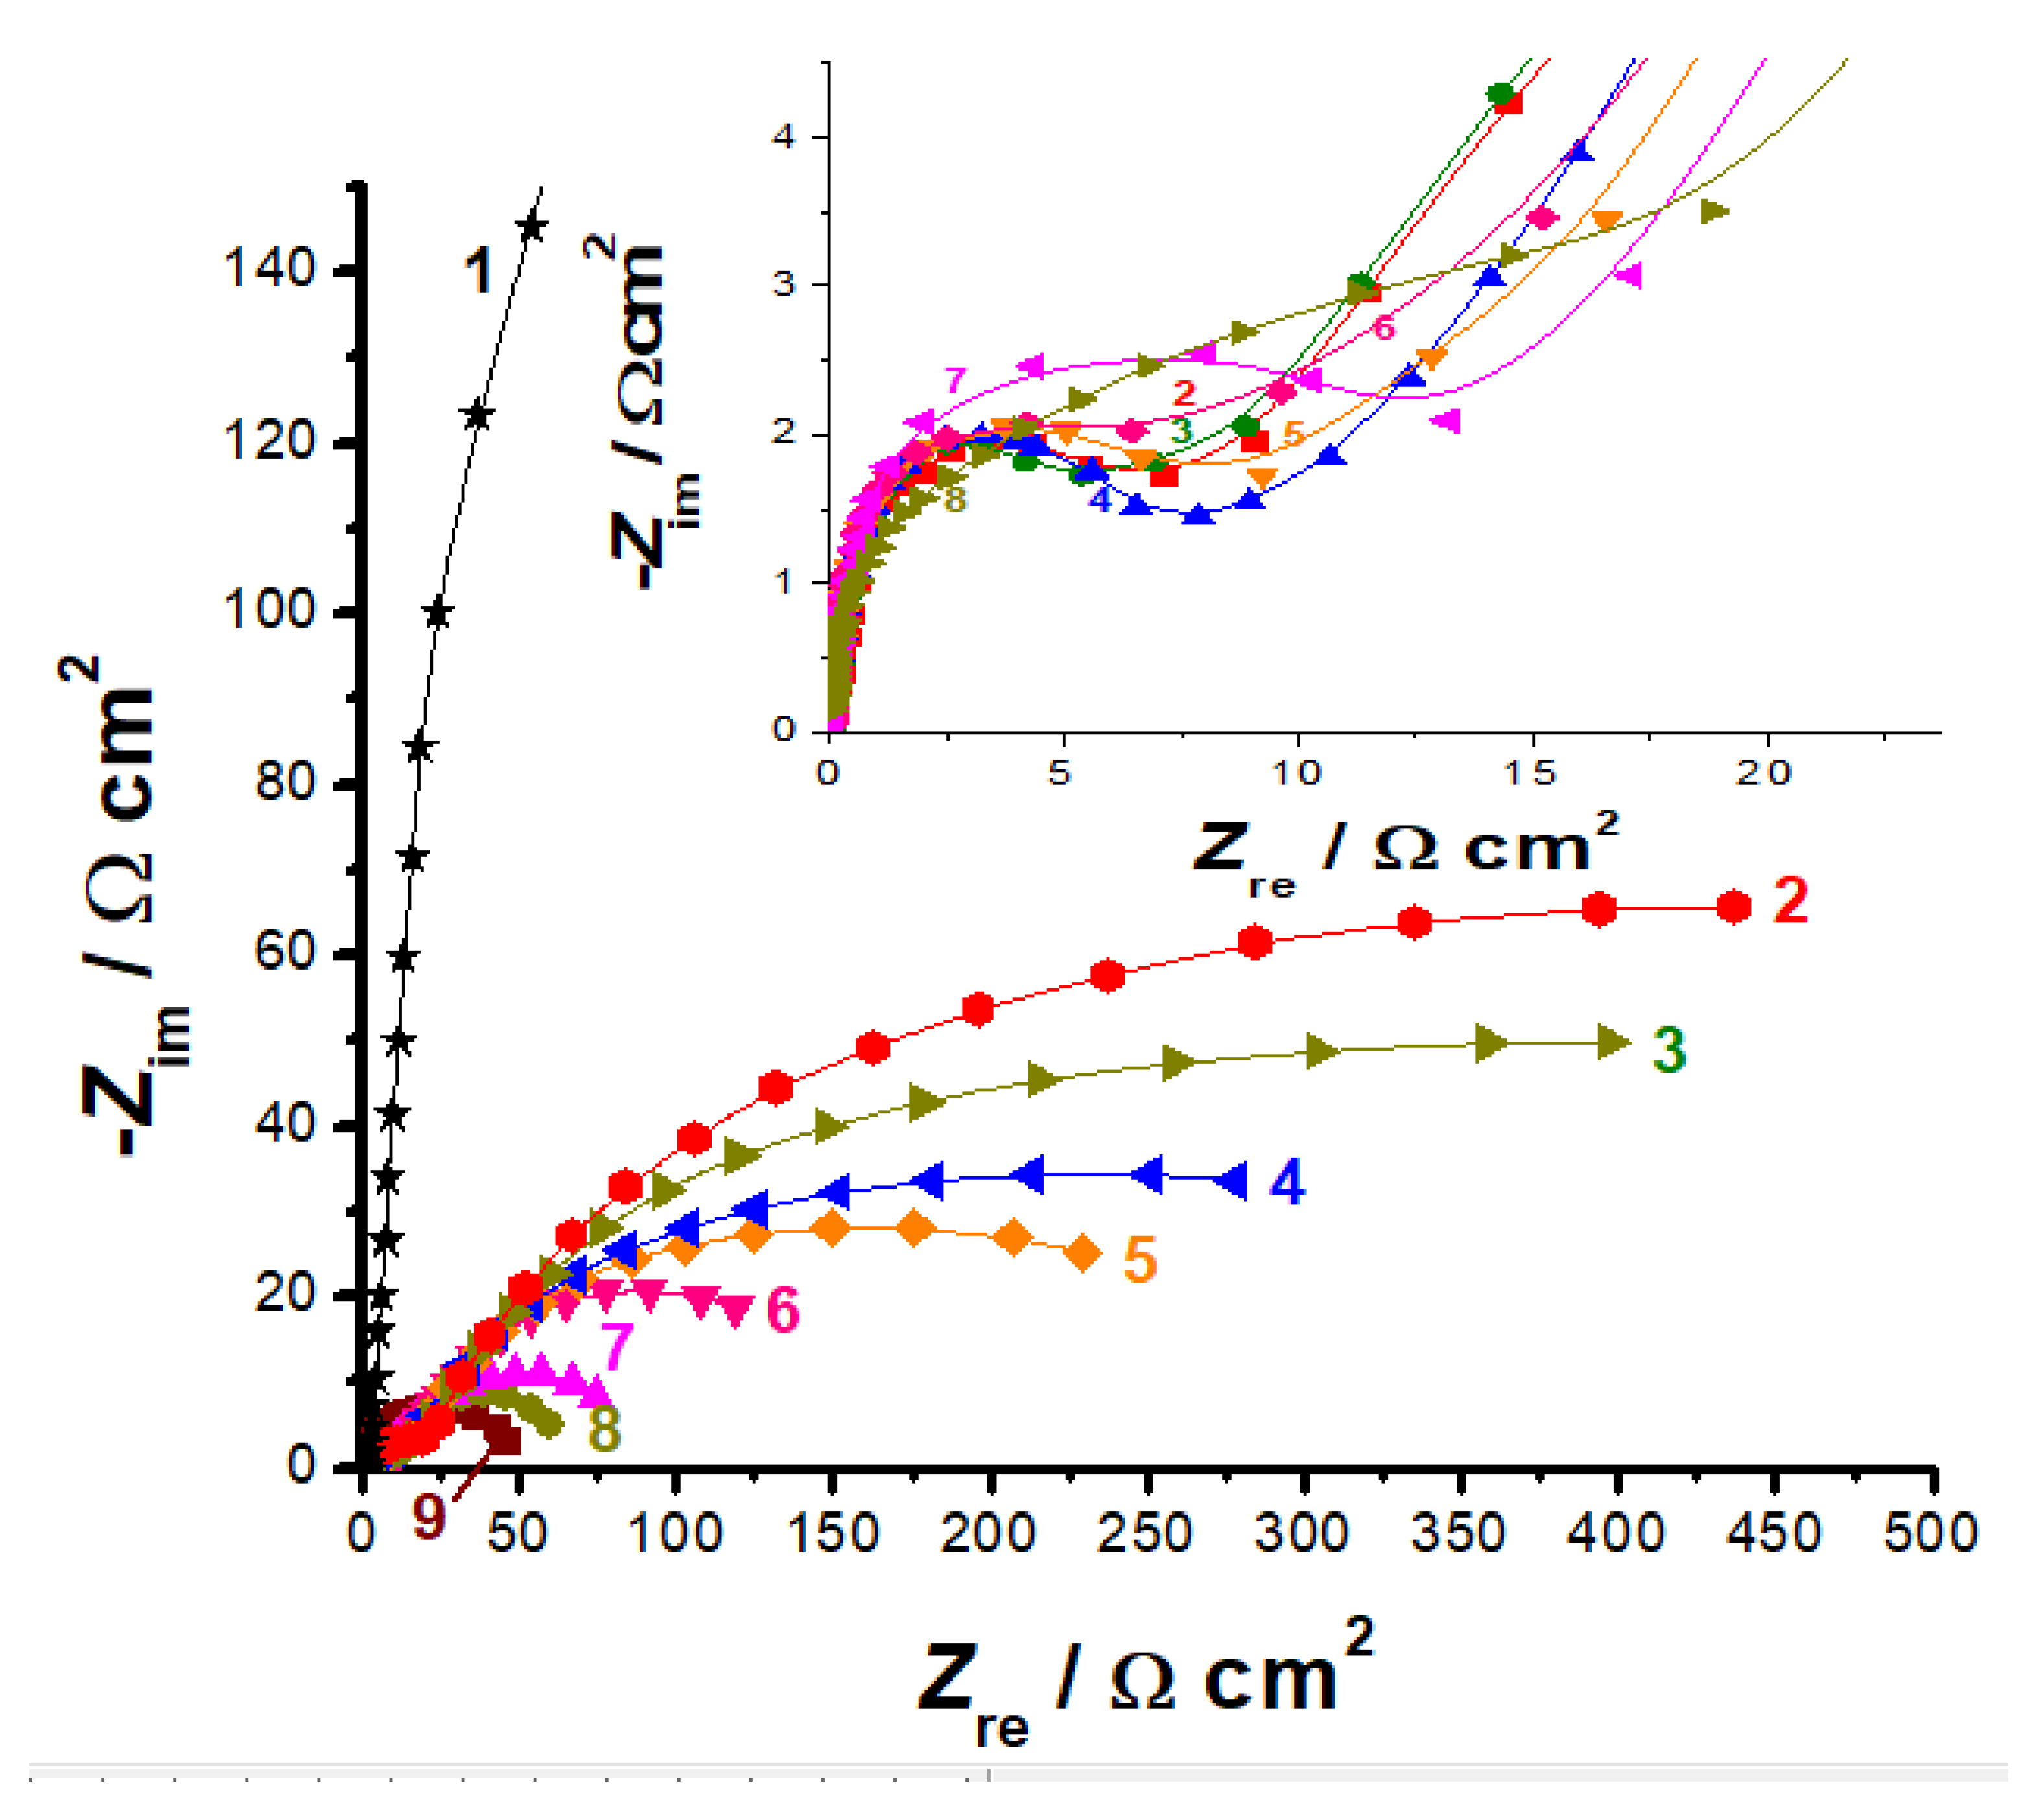
3.3.1. Impedance Measurements

EIS measurements were also conducted for all tested catalysts at an overpotential value of 500 mV, as shown in Figure 12.
The goal is to further elucidate the investigated catalyst’s HER performance and obtain a better understanding of the HER kinetics and surface phenomena [65,66]. For all of the examined catalysts, except for the bare GC and Pt/C electrodes which exhibit a single capacitive loop (Figure S1, Supporting Information), whatever the loading density value and irrespective of the presence or absence of the supporting material (GO), the impedance plots are characterized by two semicircles: A very small semicircle at high frequencies and a great semicircle at low frequency values. The small semicircle was hidden beneath the large semicircle in the complex-plane impedance plots shown in Figure 12, but can be clearly seen in the inset of Figure 12.
The semicircle’s diameter shrinks as the charge transfer process speeds up. The size of the large semicircle fluctuates depending on how much Zn3 is loaded onto the GC. The large semicircle’s size is also found to be affected by the presence of the supporting material (GO). The high frequency semicircle, on the other hand, represents the contact between the GC and the electrocatalyst layer and is not affected by the Zn3 complex’s loading density values (as seen in the inset of Figure 12) [67].
In the Supplementary Information, Figure S2, the equivalent circuits used to mimic the HER kinetics on the examined cathodes are presented and discussed. Table 5 depicts the various impedance parameters obtained from fitting the experimental impedance data.
Table 5 does not contain the impedance parameters for the first semicircle (the small one at the high frequency vales), as it is independent of the catalyst’s loading density. This suggests that this semicircle has a minor impact on the overall HER kinetics. According to Table 5, when the GC was loaded with the catalyst, the charge-transfer resistance (Rct, the diameter of the large semicircle) decreased dramatically, and this drop in Rct increased as the loading catalyst’s density increased. In the presence of GO, Rct values are always smaller. A low Rct value indicates high catalytic performance towards the HER, because it allows for rapid electron transport during the course of the HER.
In comparison to the bare GC electrode (Table 5), the GC-Zn3 cathodes’ extraordinarily large capacitance values, which enhanced with increase in the catalyst’s loading density and further increased upon immobilization Zn3 on GO, can be attributed to a huge electrochemical active surface area (EASA), which is directly related to the kinetics of the HER over different electrocatalysts [68,69]. For EASA measurements, there are a variety of methodologies reported in the literature. Calculating the roughness factor (Rf) from EIS data, using Equation (2), or more accurately from estimated double layer capacitance values, is one method of estimation [68,69]. For the calculation of Rf, the values of Q (designated here as Qmeasured) rather than C were employed, because the former offers more information regarding surface inhomogeneity and roughness, Equation (2) [70,71,72,73]:
Qmeasured = Rct1(C × Rct)n
In addition, the parameter n (n = 1 and C = 20 μF cm−2 for a typical flat surface [68,69]), which is also related to surface roughness, is included in Equation (2). This gives Qcalculated a value of 20 Sn−1 cm−2). The values of Rf were then calculated through Equation (3) [68,69]:
Rf = Qmeasured/Qcalculated
Table 6 shows, for any investigated catalyst at any loading density, that as the applied voltage is made more cathodic, Rf increases since H2 evolves profusely and can incorporate in the crystal lattice of the tested cathode. As a result, voids and defects may form, resulting in increased surface roughness [74,75,76,77]. The values of Rf dramatically rose when these complexes were supported on GO. Because electrocatalysts with higher Cdl values have a slew of more attackable active surface sites, these results validate the catalytic influence of increasing Zn3 loading density as well as supporting it on GO. As a result, charge transfer is more efficient, and catalytic efficiency is improved. Similarly, the value of EASA rises as the loading density of the catalyst rises in all circumstances. In the presence of GO, the EASA value is always higher at any tested loading density.
Tafel slope is a well-known property for comparing and evaluating the performance of electrocatalysts. It can also be utilized to determine the rate-determining step and forecast the HER reaction pathway. In alkaline solutions, either the Volmer–Heyrovsky or Volmer–Tafel mechanisms are used to control the HER [78,79].
Volmer step:
H2O + e + S* ↔ Hads + OH
Hads + H2O + e ↔ H2 + OH + S*
Tafel step:
2Hads ↔ H2 + S* + S*
where S* denotes an active hydrogen-adsorption site. The Tafel slope, in practice, shows the overpotential increment required to generate a tenfold increase in current density. As a result, a small Tafel slope value indicates a rapid increase in electrocatalytic current density at lower overpotential values, implying increased catalytic activity [78].
The Tafel lines of the three studied GC-loaded Zn3 catalysts, namely GC-Zn3 (0.2 mg cm−2), GC-Zn3 (0.4 mg cm−2) and GC-Zn3 (0.8 mg cm−2), are virtually parallel (see Figure 10b), with Tafel slopes ranging from 154 to 156 mV dec−1. These findings suggest the Tafel slope value is unaffected by the catalyst’s loading density. According to these results, the catalyst layer produces an underappreciated internal resistance. The high Tafel slopes imply that the Volmer–Heyrovsky reaction, with the Volmer step as the rate determining step, governs the HER kinetics [78,79].
The three GO-supported Zn3 catalysts exhibited parallel Tafel lines as well, but with lower βc values (117–119 mV dec1). These βc values approached those recorded here for the commercial Pt/C (113 mV dec−1), implying that the HER on the surfaces of such GO-supported Zn3 is controlled by a Volmer mechanism [79]. This apparent drop in the values of βc, caused by increasing the catalyst’s loading on the GO, indicates that the HER is accelerated, as decreasing Tafel slope values normally imply profusion in the HER catalytic active sites [78]. The catalytic impact of GO as a support on the HER kinetics is supported by these findings.

3.3.2. Faradaic Efficiency Measurements

Another crucial measure to consider when evaluating catalytic activity is the HER’s faradaic efficiency (FE). As indicated in the Supplementary Information, Section 3, the volume of H2 measured by gas chromatography after 1 h of controlled potential electrolysis is divided by its theoretical (estimated) volume to provide FE values (Table 6).
It follows from Table 6 that the investigated catalysts’ FE values increase with increase in loading density. At any loading density value, the FE value is found to enhance upon supporting the catalyst on GO. The highest FE value (98.9%) is recorded for the GC-Zn3 (0.8 mg cm2)/GO catalyst, which is very close to that measured for the commercial Pt/C (99.5%). The remaining charge could be dissipated (wasted) in side reactions such as dissolved oxygen reduction. Despite the deaeration of the solution and the sealing of the cell, dissolved oxygen is likely to stay in the solution. Because a rod of graphite was utilized as a counter electrode instead of Pt, metal cation reduction and metal deposition were ruled out.

3.3.3. Origin of Catalytic Activity

The results show that the supporting material GO has a substantial catalytic effect on the HER kinetics. One of the key reasons for the Zn3/GO having such high HER catalytic activity is the strong interactions between the GO and the loaded metal complex, as indicated by DFT simulations (revisit Section 3.2). Such strong interaction enables a more efficient charge transfer from GO to Zn3, thus the HER kinetics is improved. Another key factor contributing to the examined Zn3 cathodes’ excellent HER catalytic activity is their high EASA values, which are especially high when Zn3 is supported on GO (revisit Table 5). The supporting metal complex should diffuse evenly throughout the large surface area of GO, exposing more catalytically active sites for water molecule reduction and efficient generation of H2.
The unique structure of the zinc(II) complex Zn3 with its low oxidation state and ionic hydroxide ligand in the axial position played a major role in its high catalytic activity and promoting the electrocatalysis for H2 production [80]. Based on the obtained results and the validation from pH increase after electrolysis, a catalytic cycle presented in Scheme 2 is suggested for the production of H2 by Zn3. First, there is production of the species [Zn(2-PA)2] by two electron reduction of [Zn(2-PA)2]2+, followed by the formation of the high reactive intermediate [Zn(2-PA)2(H)]+ via the addition of a proton. Second, further reduction of the species [Zn(2-PA)2(H)]+ gives H2, forming the species [Zn(2-PA)2]2+ again for another catalytic cycle [81].

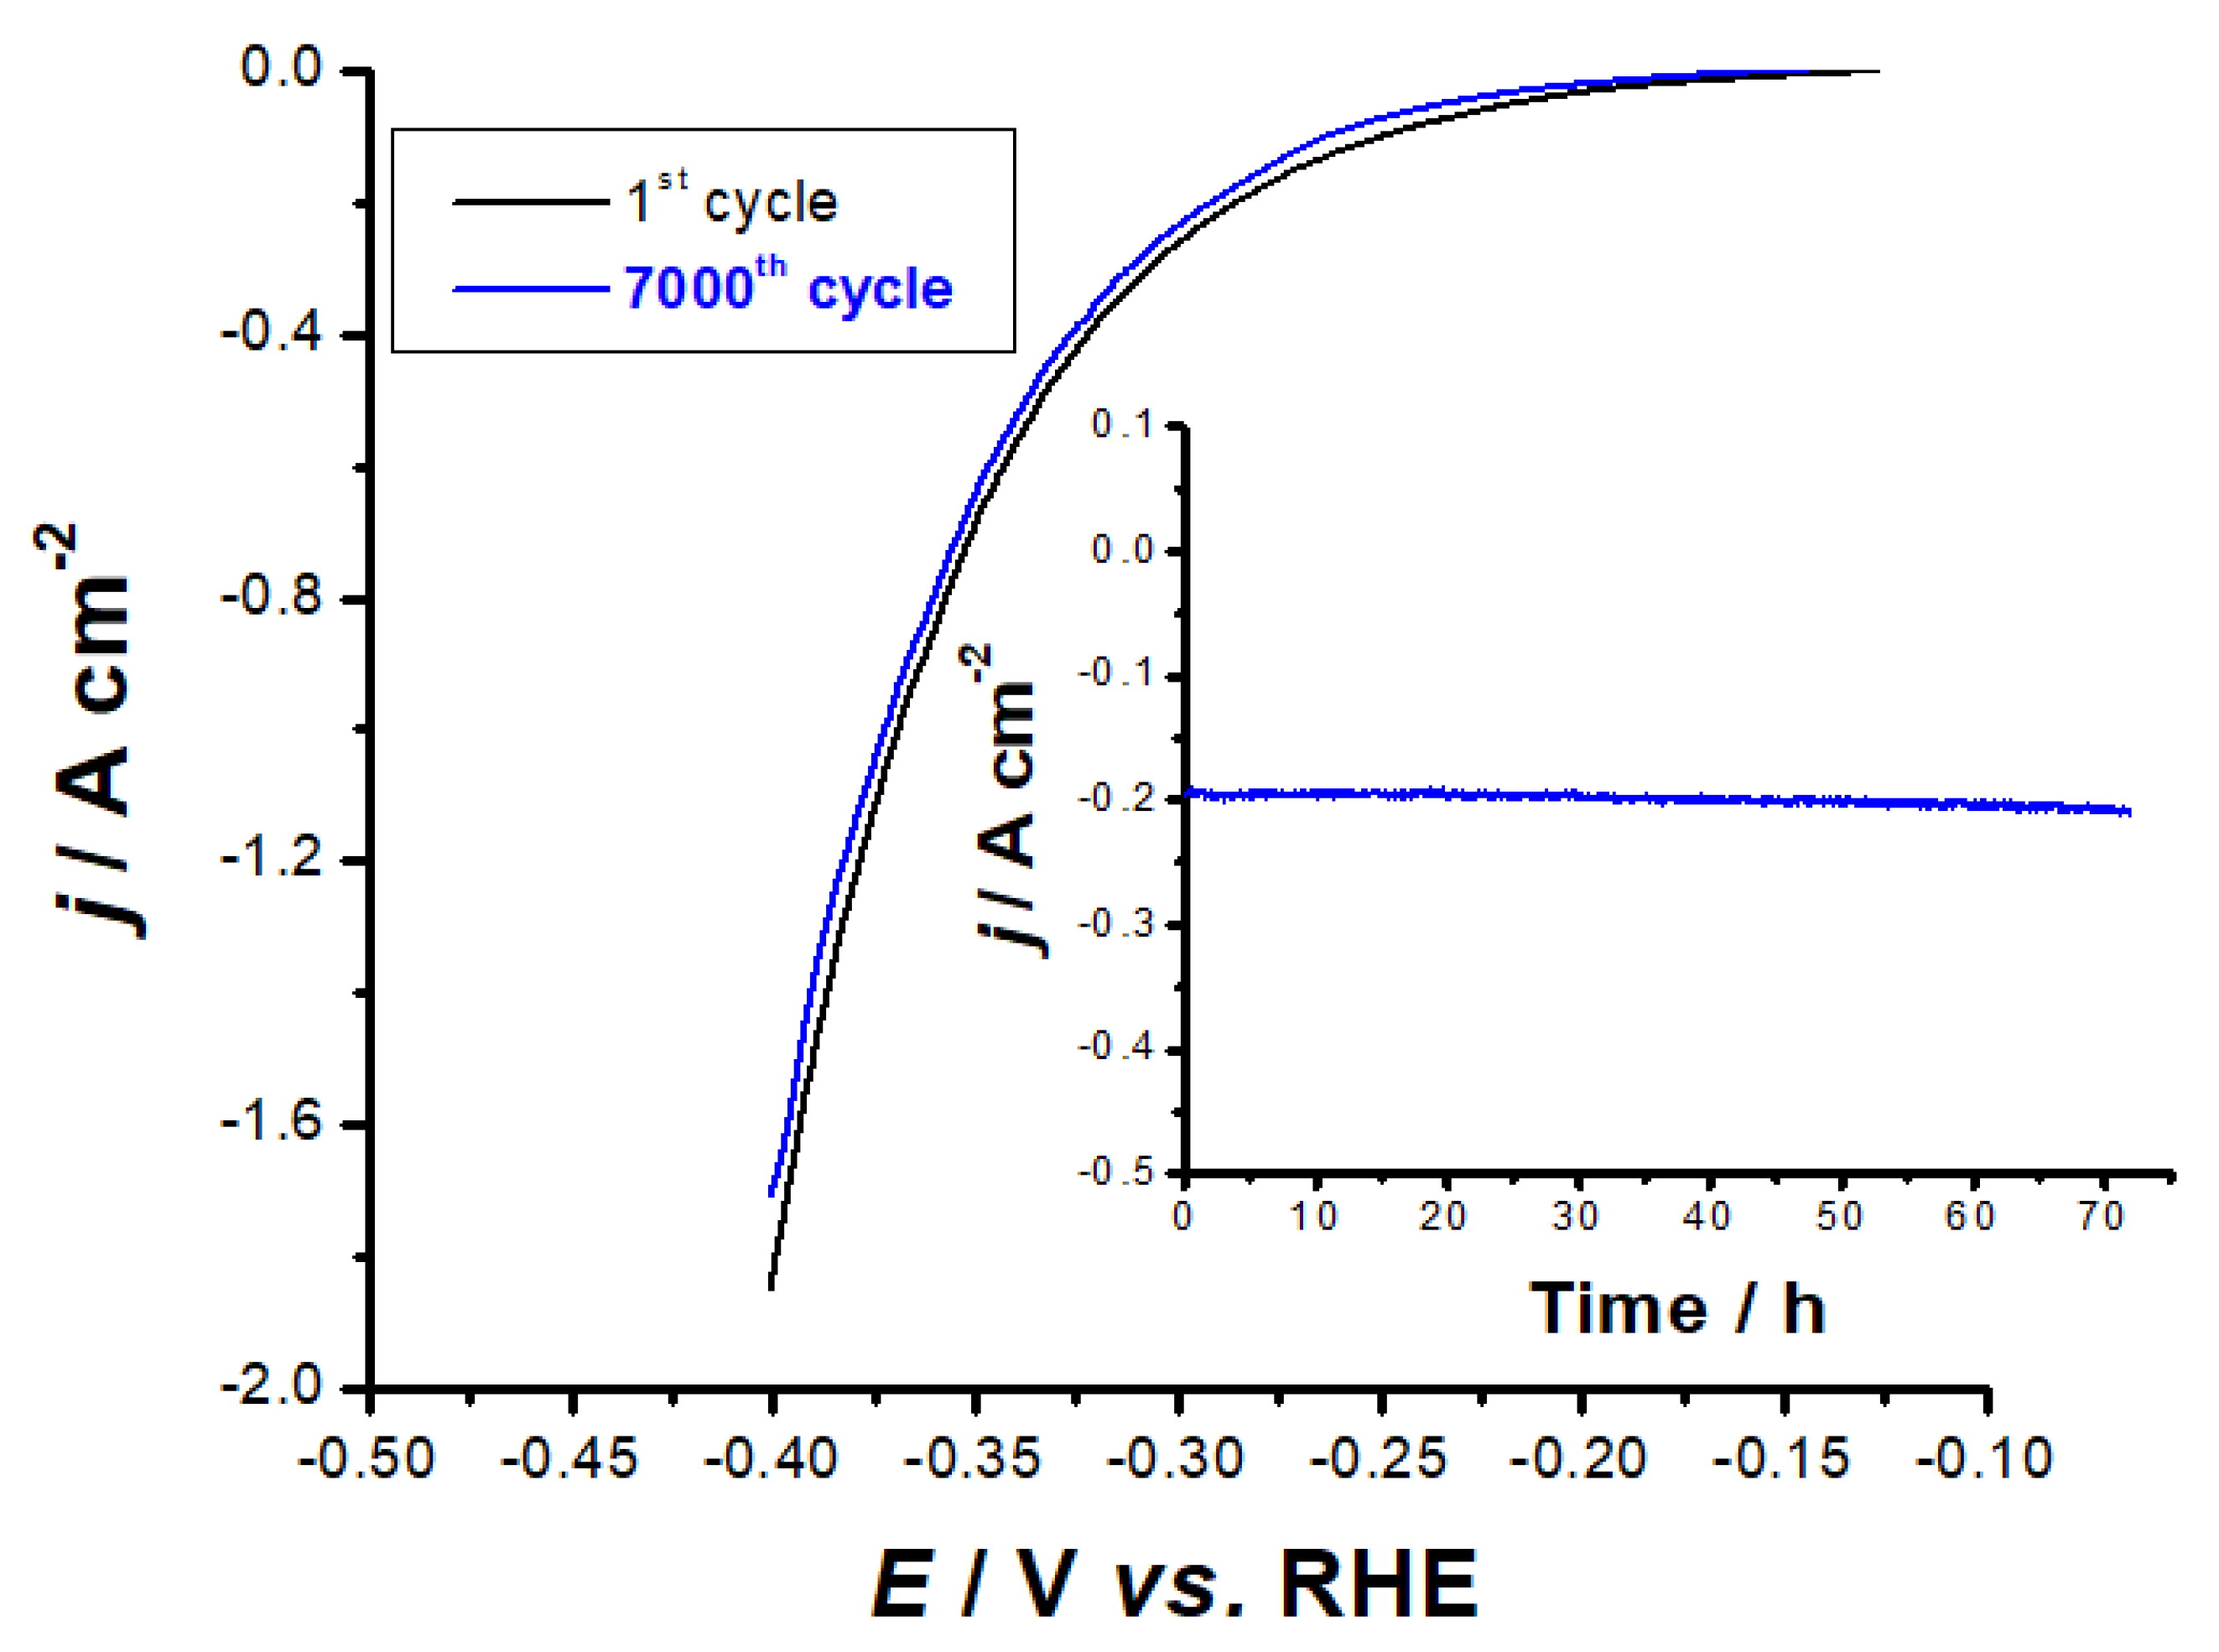
3.3.4. Catalyst Stability and Durability

A continuous potential cycling (7000 cycles) was applied to the best catalyst GC-Zn3 (0.8 mg cm−2)/KOH interface to assess its stability and long-term durability, Figure 13.
The catalyst displayed the outstanding stability in these solutions, as evidenced by the apparent low loss of current. Moreover, the Tafel slope remained almost constant (121 mV dec−1) after the last loop, indicating that the HER mechanism is unaffected by the catalyst’s cycling. More evidence for catalyst stability can be seen in the chronoamperometry measurements (inset of Figure 13) where the current remains constant throughout the operation.

4. Conclusions

A series of zinc(II) complexes, namely [PA)2ZnCl]2(ZnCl4)] (Zn1), [(PA)2Zn(H2O)](NO3)2] (Zn2) and [Zn(PA)2(OH)]NO3] (Zn3), have been synthesized and fully characterized. Grafting of Zn3 on the surface of GO via non-covalent interaction afforded the stable Zn3/GO as a heterogeneous electrocatalyst for efficient H2 generation. Zn3 and Zn3/GO-modified glassy carbon (GC) surfaces with different loading densities (0.2, 0.4 and 0.8 mg cm−2) were examined as electrocatalysts for the efficient generation of H2 in an alkaline electrolyte (0.1 M KOH). Several electrochemical methods were employed to investigate the electrocatalytic activity of these materials towards the hydrogen evolution reaction (HER) in this solution. The HER electrocatalytic activity of the GC-Zn3 catalysts was high, and it increased as the loading density of the catalyst was increased. When Zn3 was supported on GO at any tested loading density, the HER activity of the GC-Zn3 catalyst was demonstrated to increase. For instance, the electrocatalyst with the highest loading density, namely GC-Zn3 (0.8 mg cm−2), displayed a considerable HER catalytic activity with a low onset potential (EHER) of −102 mV vs. RHE, a high exchange current density (jo) of 0.26 mA cm−2 and a Tafel slope (βc) of −155 mV dec−1. In addition, this electrocatalyst generated a current density of 10 mA cm−2 at a 205 mV overpotential (η10). Upon immobilizing such catalyst on GO, GC-Zn3 (0.8 mg cm−2), the HER catalytic activity significantly increased, recording HER electrochemical kinetic parameters of EHER = −25 mV vs. RHE, jo = 0.77 mA cm−2, βc = −118 mV dec−1 and η10 = 122 mV, approaching those measured for the commercial Pt/C under the same operating conditions (−10 mV vs. RHE, 0.88 mA cm2, 113 mV dec1 and 110 mV to yield a current density of 10 mA cm2). Simulations using density functional theory (DFT) demonstrated a substantial contact between Zn3 and the supporting material (GO) via non-covalent interactions, validating the catalytic role of GO in catalyzing Zn3’s HER. The best electrocatalyst’s long-term durability was assessed using electrochemical techniques, which revealed its promising electrocatalytic stability.

Supplementary Materials

The following supporting information can be downloaded at: https://www.mdpi.com/article/10.3390/catal12040389/s1, S1: Syntheses; Table S1: Crystal data, data collections and structure refinement of zinc(II) complex Zn1; S2: Electrochemical measurements; Figure S1: Complex-plane EIS plots for the bare GCE electrode (a) and Pt/C (b). Measurements were conducted in 0.1 M KOH at 500 mV at room temperature; Figure S2: Equivalent circuits used to fit the experimental impedance data; Table S2: Comparison of HER catalytic activity of our synthesized Zn3 and Zn3/GO electrocatalysts with the highly efficient electrocatalysts reported in the literature [81,82,83,84,85,86,87,88,89].

Author Contributions

Conceptualization, M.A.A. and A.B.; methodology, G.A.M.M., A.A.S. and M.M.I.; writing—original draft preparation, M.A.A., H.S.E.-S. and M.R.D.; writing—review and editing, J.B. and M.A.A.; project administration, M.A.A. and M.M.I.; funding acquisition, M.A.A. All authors have read and agreed to the published version of the manuscript.

Funding

Deputyship for Research & Innovation, Ministry of Education in Saudi Arabia: 1-441-118.

Data Availability Statement

The data presented in this study are available on request from the corresponding author.

Conflicts of Interest

The authors declare no conflict of interest.

References

  1. Badwal, S.P.S.; Giddey, S.S.; Munnings, C.; Bhatt, A.I.; Hollenkamp, A.F. Emerging electrochemical energy conversion and storage technologies. Front. Chem. 2014, 2, 79–106. [Google Scholar] [CrossRef] [PubMed] [Green Version]
  2. Morales-Guio, C.G.; Stern, L.-A.; Hu, X. Nanostructured hydrotreating catalysts for electrochemical hydrogen evolution. Chem. Soc. Rev. 2014, 43, 6555–6569. [Google Scholar] [CrossRef] [PubMed] [Green Version]
  3. Chen, X.; Wang, D.; Wang, Z.; Zhou, P.; Wu, Z.; Jiang, F. Molybdenum phosphide: A new highly efficient catalyst for the electrochemical hydrogen evolution reaction. Chem. Commun. 2014, 50, 11683–11685. [Google Scholar] [CrossRef] [PubMed]
  4. Hinnemann, B.; Moses, P.G.; Bonde, J.; Jørgensen, K.P.; Nielsen, J.H.; Horch, S.; Chorkendorff, I.; Nørskov, J.K. Biomimetic Hydrogen Evolution:  MoS2 Nanoparticles as Catalyst for Hydrogen Evolution. J. Am. Chem. Soc. 2005, 127, 5308–5309. [Google Scholar] [CrossRef]
  5. Steinberg, M.; Cheng, H.C. Modern and prospective technologies for hydrogen production from fossil fuels. Int. J. Hydrog. Energy 1989, 14, 797–820. [Google Scholar] [CrossRef]
  6. Turner, J.A. Sustainable hydrogen production. Science 2004, 305, 972–974. [Google Scholar] [CrossRef]
  7. Bhavsar, S.; Najera, M.; Solunke, R.; Veser, G. Chemical looping: To combustion and beyond. Catal. Today 2014, 228, 96–105. [Google Scholar] [CrossRef]
  8. Yan, W.; Hoekman, S.K. Production of CO2-free hydrogen from methane dissociation: A review. Env. Prog. Sustain. Energy 2014, 33, 213–219. [Google Scholar] [CrossRef]
  9. Roger, I.; Shipman, M.A.; Symes, M.D. Earth-abundant catalysts for electrochemical and photoelectrochemical water splitting. Nat. Rev. Chem. 2017, 1, 0003. [Google Scholar] [CrossRef]
  10. Gordon, R.B.; Bertram, M.; Graedel, T.E. Metal Stocks and Sustainability. Proc. Natl. Acad. Sci. USA 2006, 103, 1209–1214. [Google Scholar] [CrossRef] [Green Version]
  11. Zhang, R.; Wei, H.; Si, W.; Ou, G.; Zhao, C.; Song, M.; Zhang, C.; Wu, H. Enhanced Electrocatalytic Activity for Water Splitting on NiO/Ni/Carbon Fiber Paper. Materials 2017, 10, 15. [Google Scholar] [CrossRef] [PubMed]
  12. Tian, J.; Liu, Q.; Asiri, A.M.; Sun, X. Self-Supported nanoporous cobalt phosphide nanowire arrays: An efficient 3D hydrogen-evolving cathode over the wide range of pH 0–14. J. Am. Chem. Soc. 2014, 136, 7587–7590. [Google Scholar] [CrossRef] [PubMed]
  13. Gupta, S.; Patel, N.; Miotello, A.; Kothari, D.C. Cobalt-Boride: An efficient and robust electrocatalyst for Hydrogen Evolution Reaction. J. Power Sources 2015, 279, 620–625. [Google Scholar] [CrossRef]
  14. Zhang, S.; Zhang, X.; Rui, Y.; Wang, R.; Li, X. Recent advances in non-precious metal electrocatalysts for pH-universal hydrogen evolution reaction. Green Energy Environ. 2021, 6, 458–478. [Google Scholar]
  15. Shen, Y.; Ren, X.; Qi, X.; Zhou, J.; Huang, Z.; Zhong, J. MoS2 nanosheet loaded with TiO2 nanoparticles: An efficient electrocatalyst for hydrogen evolution reaction. J. Electrochem. Soc. 2016, 163, H1087–H1090. [Google Scholar] [CrossRef]
  16. Callejas, F.J.; McEnaney, J.M.; Read, C.G.; Crompton, J.C.; Biacchi, A.J.; Popczun, E.J.; Gordon, T.R.; Lewis, N.S.; Schaak, R.E. Electrocatalytic and Photocatalytic Hydrogen Production from Acidic and Neutral-pH Aqueous Solutions Using Iron Phosphide Nanoparticles. ACS Nano 2014, 8, 11101–11107. [Google Scholar] [CrossRef]
  17. Wang, X.; Kolenko, Y.V.; Liu, L. Direct solvothermal phosphorization of nickel foam to fabricate integrated Ni2P-nanorods/Ni electrodes for efficient electrocatalytic hydrogen evolution. Chem. Commun. 2015, 51, 6738–6741. [Google Scholar] [CrossRef]
  18. Solmaz, R. Electrochemical preparation and characterization of C/Ni–NiIr composite electrodes as novel cathode materials for alkaline water electrolysis. Int. J. Hydrog. Energy 2013, 38, 2251–2256. [Google Scholar] [CrossRef]
  19. Yüksel, H.; Özbay, A.; Solmaz, R.; Kahraman, M. Fabrication and characterization of three-dimensional silver nanodomes: Application for alkaline water electrolysis. Int. J. Hydrog. Energy 2017, 42, 2476–2484. [Google Scholar] [CrossRef]
  20. Solmaz, R.; Salcı, A.; Yüksel, H.; Doğrubaş, M.; Kardaş, G. Preparation and characterization of Pd-modified Raney-type NiZn coatings and their application for alkaline water electrolysis. Int. J. Hydrog. Energy 2017, 42, 2464–2475. [Google Scholar] [CrossRef]
  21. Solmaz, R.; Kardaş, G. Fabrication and characterization of NiCoZn–M (M: Ag, Pd and Pt) electrocatalysts as cathode materials for electrochemical hydrogen production. Int. J. Hydrog. Energy 2011, 36, 12079–12087. [Google Scholar] [CrossRef]
  22. Döner, A.; Solmaz, R.; Kardaş, G. Enhancement of hydrogen evolution at cobalt–zinc deposited graphite electrode in alkaline solution. Int. J. Hydrog. Energy 2011, 36, 7391–7397. [Google Scholar] [CrossRef]
  23. Solmaz, R.; Döner, A.; Kardaş, G. Preparation, characterization and application of alkaline leached CuNiZn ternary coatings for long-term electrolysis in alkaline solution. Int. J. Hydrog. Energy 2010, 35, 10045–10049. [Google Scholar] [CrossRef]
  24. Zhou, W.; Jia, J.; Lu, J.; Yang, L.; Hou, D.; Li, G.; Chen, S. Recent developments of carbon-based electrocatalysts for hydrogen evolution reaction. Nano Energy 2016, 28, 29–43. [Google Scholar] [CrossRef]
  25. Liu, X.; Dai, L. Carbon-based metal-free catalysts. Nat. Rev. Mater. 2016, 1, 16064. [Google Scholar] [CrossRef]
  26. Amin, M.A.; Fadlallah, S.A.; Alosaimi, G.S. In Situ Aqueous Synthesis of Silver Nanoparticles Supported on Titanium as Active Electrocatalyst for the Hydrogen Evolution Reaction. Int. J. Hydrog. Energy 2014, 39, 19519–19540. [Google Scholar] [CrossRef]
  27. Amin, M.A.; Fadlallah, S.A.; Alosaimi, G.S. Activation of Titanium for Synthesis of Supported and Unsupported Metallic Nanoparticles. J. Electrochem. Soc. 2014, 161, D672–D680. [Google Scholar] [CrossRef]
  28. Zhang, X.; Li, Y.-A.; Huang, Y.; Mu, H.; Gu, X.; Li, F.; Wang, Z.; Li, J. Impacts of Metal–Support Interaction on Hydrogen Evolution Reaction of Cobalt-Nitride-Carbide Catalyst. Front. Chem. 2022, 9, 2296–2646. [Google Scholar] [CrossRef]
  29. DuBois, D.L. Development of Molecular Electrocatalysts for Energy Storage. Inorg. Chem. 2014, 53, 3935–3960. [Google Scholar] [CrossRef]
  30. Shaw, W.J.; Helm, M.L.; DuBois, D.L. A modular, energy-based approach to the development of nickel containing molecular electrocatalysts for hydrogen production and oxidation. Biochim. Biophys. Acta 2013, 1827, 1123–1139. [Google Scholar] [CrossRef] [Green Version]
  31. Razavet, M.; Artero, V.; Fontecave, M. Proton Electroreduction Catalyzed by Cobaloximes:  Functional Models for Hydrogenases. Inorg. Chem. 2005, 44, 4786–4795. [Google Scholar] [CrossRef] [PubMed]
  32. Artero, V.; Fontecave, M. Some general principles for designing electrocatalysts with hydrogenase activity. Coord. Chem. Rev. 2005, 249, 1518–1535. [Google Scholar] [CrossRef]
  33. Baffent, C.; Artero, V.; Fontecave, M. Cobaloximes as Functional Models for Hydrogenases. 2. Proton Electroreduction Catalyzed by Difluoroborylbis(dimethylglyoximato )cobalt(II) Complexes in Organic Media. Inorg. Chem. 2007, 46, 1817–1824. [Google Scholar] [CrossRef]
  34. Hu, X.; Cossairt, B.; Brunschwig, B.; Lewis, N.; Peters, J.C. Electrocatalytic hydrogen evolution by cobalt difluoroboryl-diglyoximate complexes. Chem. Commun. 2005, 7, 4723–4725. [Google Scholar] [CrossRef] [PubMed] [Green Version]
  35. Hu, X.; Brunschwig, B.; Peters, J.C. Electrocatalytic hydrogen evolution at low overpotentials by cobalt macrocyclic glyoxime and tetraimine complexes. J. Am. Chem. Soc. 2007, 129, 8988–8998. [Google Scholar] [CrossRef] [PubMed] [Green Version]
  36. Zee, D.Z.; Chantarojsiri, T.; Long, J.R.; Chang, C.J. Metal–Polypyridyl Catalysts for Electro- and Photochemical Reduction of Water to Hydrogen. Acc. Chem. Res. 2015, 48, 2027–2036. [Google Scholar] [CrossRef] [PubMed] [Green Version]
  37. Canales, C.; Varas-Concha, F.; Mallouk, T.E.; Ramírez, G. Enhanced electrocatalytic hydrogen evolution reaction: Supramolecular assemblies of metalloporphyrins on glassy carbon electrodes. Appl. Catal. B Environ. 2016, 188, 169–176. [Google Scholar] [CrossRef] [Green Version]
  38. Wang, C.; Yang, H.; Du, J.; Zhan, S. Effect of metal centers of complexes bearing bipyridine ligand for electrochemical-and photochemical-driven hydrogen evolution. Appl. Organomet. Chem. 2022, 36, e6453. [Google Scholar] [CrossRef]
  39. Drosou, M.; Kamatsos, F.; Mitsopoulou, C.A. Recent advances in the mechanisms of the hydrogen evolution reaction by non-innocent sulfur-coordinating metal complexes. Inorg. Chem. Front. 2020, 7, 37. [Google Scholar] [CrossRef] [Green Version]
  40. Bulushev, D.A. Progress in Catalytic Hydrogen Production from Formic Acid over Supported Metal Complexes. Energies 2021, 14, 1334. [Google Scholar] [CrossRef]
  41. Niu, Z.; Yang, L.; Xiao, Y.; Xue, M.; Zhou, J.; Zhang, L.; Zhang, J.; Wilkinson, D.P.; Ni, C. Novel Dithiolene Nickel Complex Catalysts for Electrochemical Hydrogen Evolution Reaction for Hydrogen Production in Nonaqueous and Aqueous Solutions. Electrocatalysis 2022. [Google Scholar] [CrossRef]
  42. Sengupta, S.; Khan, S.; Mongal, B.N.; Lewis, W.; Fleck, M.; Chattopadhyay, S.K.; Naskar, S. Electrocatalytic hydrogen production and carbon dioxide conversion by earth abundant transition metal complexes of the Schiff base ligand: (E)-1-((2-dimethylamino)-propylimino)methyl)naphthalene-2-ol. Polyhedron 2020, 191, 114798. [Google Scholar] [CrossRef]
  43. Zaaba, N.I.; Foo, K.L.; Hashim, U.; Tan, S.J.; Liu, W.-W.; Voon, C.H. Synthesis of Graphene Oxide using Modified Hummers Method: Solvent Influence. Procedia Eng. 2017, 184, 469–477. [Google Scholar] [CrossRef]
  44. Mersal, G.A.M.; Hessien, M.M.; Abou Taleb, M.F.; Al-Juaid, S.S.; Ibrahim, M.M. Solid–Liquid Phase Structural Studies of Bis(2-Picolyl)Amine-Based Zinc(II) Complexes as Functional Hydrolase Models: The Detoxification of Fenitrothion. J. Inorg. Organomet. Polym. Mater. 2022, 32, 94–111. [Google Scholar] [CrossRef]
  45. SAINT, V6.02; Bruker AXS: Madison, WI, USA, 1999.
  46. Sheldrick, G.M. SADABS, Area-Detector Absorption Correction; University of Göttingen: Göttingen, Germany, 1996. [Google Scholar]
  47. Sheldrick, G.M. SHELXL; University of Göttingen: Göttingen, Germany, 2013. [Google Scholar]
  48. Frisch, M.J.; Trucks, G.W.; Schlegel, H.B.; Scuseria, G.E.; Robb, M.; Cheeseman, J.R.; Scalmani, G.; Barone, V.; Mennucci, B.; Petersson, G.A. Gaussian 09, Revision A.02; Gaussion Inc.: Wallingford, CT, USA, 2009. [Google Scholar]
  49. Selvaganapathi, P.; Thirumaran, S.; Ciattini, S. Structural variations in zinc (II) complexes with N, N-di (4-fluorobenzyl) dithiocarbamate and imines: New precursor for zinc sulfide nanoparticles. Polyhedron 2018, 149, 54–65. [Google Scholar] [CrossRef]
  50. Nisa, M.; Sirajuddin, M.; Ali, S.; Tahir, M.N.; Iqbal, M. Synthesis, characterization crystal structures and DNA binding studies of zinc complexes with oxygen and nitrogen donor ligands. Polyhedron 2019, 177, 114273. [Google Scholar] [CrossRef]
  51. Karlin, K.D. Metalloenzymes, structural motifs, and inorganic models. Science 1993, 261, 701. [Google Scholar] [CrossRef]
  52. Parkin, G. Synthetic Analogues Relevant to the Structure and Function of Zinc Enzymes. Chem. Rev. 2004, 104, 699–768. [Google Scholar] [CrossRef]
  53. Nakamoto, K. Infrared and Raman Spectra of Inorganic and Coordination Compounds: Part A: Theory and Applications in Inorganic Chemistry, Sixth Edition; Wiley: New York, NY, USA, 2008. [Google Scholar]
  54. Mittal, A.; Kumari, S.; Yadav, D.; Sharma, S.K. A new copper complex on graphene oxide: A heterogeneous catalyst for N-arylation and C-H activation. Appl. Organometal. Chem. 2019, 34, e5362. [Google Scholar] [CrossRef]
  55. Huang, D.; Lu, J.; Li, S.; Luo, Y.; Zhao, C.; Hu, B.; Wang, M.; Shen, Y. Fabrication of cobalt porphyrin—Electrochemically reduced graphene oxide hybrid films forelectrocatalytic hydrogen evolution in aqueous solution. Langmuir 2014, 30, 6990–6998. [Google Scholar] [CrossRef]
  56. Tabari, L.; Farmanzadeh, D. Yttrium doped graphene oxide as a new adsorbent for H2O, CO, and ethylene molecules: Dispersion-corrected DFT calculations. Appl. Surf. Sci. 2020, 500, 144029. [Google Scholar] [CrossRef]
  57. Mersal, G.A.; Yahia, I.; El-Sheshtawy, H.S. Tuning optical and electronic properties of graphene oxide by surface adsorption of molecular halogens (X2 = I2, Br2, Cl2, and F2) for light harvesting. Comput. Theor. Chem. 2021, 1204, 113379. [Google Scholar] [CrossRef]
  58. Benck, J.D.; Chen, Z.; Kuritzky, L.Y.; Forman, A.J.; Jaramillo, T.F. Amorphous molybdenum sulfide catalysts for electrochemical hydrogen production: Insights into the origin of their catalytic activity. ACS Catal. 2012, 2, 1916–1923. [Google Scholar] [CrossRef]
  59. Amin, M.A.; El-Bagoury, N.; Mahmoud, M.H.H.; Hessien, M.M.; Abd El-Rehim, S.S.; Wysocka, J.; Ryl, J. Catalytic impact of alloyed Al on the corrosion behavior of Co50Ni23Ga26Al1.0 magnetic shape memory alloy and catalysis applications for efficient electrochemical H2 generation. RSC Adv. 2017, 7, 3635–3649. [Google Scholar] [CrossRef] [Green Version]
  60. Edison, T.N.J.I.; Atchudan, R.; Karthik, N.; Lee, Y.R. Green synthesized N-doped graphitic carbon sheets coated carbon cloth as efficient metal free electrocatalyst for hydrogen evolution reaction. Int. J. Hydrog. Energy 2017, 42, 14390–14399. [Google Scholar] [CrossRef]
  61. Wang, H.; Cao, Y.; Zou, G.; Yi, Q.; Guo, J.; Gao, L. High-performance hydrogen evolution electrocatalyst derived from Ni3C nanoparticles embedded in a porous carbon network. ACS Appl. Mater. Interfaces 2017, 9, 60–64. [Google Scholar] [CrossRef]
  62. Amin, M.A.; Ahmed, E.M.; Mostafa, N.Y.; Alotibi, M.M.; Darabdhara, G.; Das, M.R.; Wysocka, J.; Ryl, J.; Abd El-Rehim, S.S. Aluminum titania nanoparticle composites as nonprecious catalysts for efficient electrochemical generation of H2. ACS Appl. Mater. Interfaces 2016, 8, 23655–23667. [Google Scholar] [CrossRef]
  63. Amin, M.A.; Fadlallah, S.A.; Alosaimi, G.S.; Kandemirli, F.; Saracoglu, M.; Szunerits, S.; Boukherroub, R. Cathodic activation of titanium-supported gold nanoparticles: An efficient and stable electrocatalyst for the hydrogen evolution reaction. Int. J. Hydrog. Energy 2016, 41, 6326–6341. [Google Scholar] [CrossRef]
  64. Darabdhara, G.; Amin, M.A.; Mersal, G.A.M.; Ahmed, E.M.; Das, M.R.; Zakaria, M.B.; Malgras, V.; Alshehri, S.M.; Yamauchi, Y.; Szunerits, S.; et al. Reduced graphene oxide nanosheets decorated with Au, Pd and Au–Pd bimetallic nanoparticles as highly efficient catalysts for electrochemical hydrogen generation. J. Mater. Chem. A 2015, 3, 20254–20266. [Google Scholar] [CrossRef]
  65. Badawy, W.A.; Nady, H.; Negem, M. Cathodic hydrogen evolution in acidic solutions using electrodeposited nano-crystalline Ni–Co cathodes. Int. J. Hydrog. Energy 2014, 39, 10824–10832. [Google Scholar] [CrossRef]
  66. Murthy, A.P.; Theerthagiri, J.; Madhavan, J.; Murugan, K. Highly active MoS2/carbon electrocatalysts for the hydrogen evolution reaction–insight into the effect of the internal resistance and roughness factor on the Tafel slope. Phys. Chem. Chem. Phys. 2017, 19, 1988–1998. [Google Scholar] [CrossRef] [PubMed]
  67. Liu, J.; Watanabe, H.; Fuji, M.; Takahashi, M. Electrocatalytic evolution of hydrogen on porous alumina/gelcast-derived nano-carbon network composite electrode. Electrochem. Commun. 2009, 11, 107–110. [Google Scholar] [CrossRef]
  68. Losiewicz, B.; Budniok, A.; Rowinski, E.; Lagiewka, E.; Lasia, A. The structure, morphology and electrochemical impedance study of the hydrogen evolution reaction on the modified nickel electrodes. Int. J. Hydrog. Energy 2004, 29, 145–157. [Google Scholar] [CrossRef]
  69. González-Buch, C.; Herraiz-Cardona, I.; Ortega, E.M.; García-Antón, J.; Pérez-Herranz, V. Development of Ni-Mo, Ni-W and Ni-Co Macroporous Materials for Hydrogen Evolution Reaction. Chem. Eng. Trans. 2013, 32, 865–870. [Google Scholar]
  70. Wu, X.; Ma, H.; Chen, S.; Xu, Z.; Sui, A.J. General Equivalent Circuits for Faradaic Electrode Processes under Electrochemical Reaction Control. Electrochem. Soc. 1999, 146, 1847–1853. [Google Scholar]
  71. Ma, H.; Chen, S.; Yin, B.; Zhao, S.; Liu, X. Impedance spectroscopic study of corrosion inhibition of copper by surfactants in the acidic solutions. Corros. Sci. 2003, 45, 867–882. [Google Scholar]
  72. Stoynov, Z.B.; Grafov, B.M.; Savova-Stoynova, B.; Elkin, V.V. Electrochemical Impedance; Nanka: Moscow, Russia, 1991. [Google Scholar]
  73. Growcock, F.B.; Jasinski, R.J. Time-Resolved Impedance Spectroscopy of Mild Steel in Concentrated Hydrochloric Acid. J. Electrochem. Soc. 1989, 136, 2310–2314. [Google Scholar] [CrossRef]
  74. Monev, M. Hydrogenation and cracking of nickel coatings electrodeposited in the presence of brighteners. Bulg. Chem. Commun. 2016, 48, 73–77. [Google Scholar]
  75. Soares, D.M.; Teschke, O.; Torriani, I. Hydride effect on the kinetics of the hydrogen evolution reaction on nickel cathodes in alkaline media. J. Electrochem. Soc. 1992, 139, 98–105. [Google Scholar] [CrossRef] [Green Version]
  76. Hall, D.S.; Bock, C.; MacDougalla, B.R. The electrochemistry of metallic nickel: Oxides, hydroxides, hydrides and alkaline hydrogen evolution. J. Electrochem. Soc. 2013, 160, F235–F243. [Google Scholar] [CrossRef] [Green Version]
  77. Vrubel, H.; Moehl, T.; Gratzel, M.; Hu, X. Revealing and accelerating slow electron transport in amorphous molybdenum sulphide particles for hydrogen evolution reaction. Chem. Commun. 2013, 49, 8985–8987. [Google Scholar] [CrossRef] [PubMed] [Green Version]
  78. Lu, Q.; Hutchings, G.; Yu, W.; Zhou, Y.; Forest, R.; Tao, R.; Rosen, J.; Yonemoto, B.; Cao, Z.; Zheng, H.; et al. Highly porous non-precious bimetallic electrocatalysts for efficient hydrogen evolution. Nat. Commun. 2015, 6, 6567–6574. [Google Scholar] [CrossRef] [PubMed] [Green Version]
  79. Durst, J.; Siebel, A.; Simon, C.; Hasché, F.; Herranz, J.; Gasteiger, H.A. New insights into the electrochemical hydrogen oxidation and evolution reaction mechanism. Energy Environ. Sci. 2014, 7, 2255–2260. [Google Scholar] [CrossRef] [Green Version]
  80. Singh, W.M.; Baine, T.; Kudo, S.; Tian, S.; Ma, X.A.N.; Zhou, H.; DeYonker, N.J.; Pham, T.C.; Bollinger, J.C.; Baker, D.L.; et al. Electrocatalytic and photocatalytic hydrogen production in aqueous solution by a molecular cobalt complex. Angew. Chem. Int. Ed. 2012, 51, 5941–5944. [Google Scholar] [CrossRef]
  81. Amin, M.A.; Ibrahim, M.M.; Gobouri, A.A.; Mersal, G.A.M.; Mostafa, N.Y.; Altalhi, T.; Al-Juaid, S. A newly synthesized single crystal zinc complex as molecular electrocatalyst for efficient hydrogen generation from neutral aqueous solutions. Int. J. Hydrog. Energy 2017, 42, 25980–25995. [Google Scholar] [CrossRef]
  82. Hu, C.; Dai, L. Multifunctional carbon-based metal-free electrocatalysts for simultaneous oxygen reduction, oxygen evolution, and hydrogen evolution. Adv. Mater. 2017, 29, 1604942. [Google Scholar] [CrossRef]
  83. Ge, J.M.; Zhang, B.; Lv, L.B.; Wang, H.H.; Ye, T.N.; Wei, X.; Su, J.; Wang, K.X.; Lin, X.H.; Chen, J.S. Constructing Holey Graphene Monoliths via Supramolecular Assembly: Enriching Nitrogen Heteroatoms up to the Theoretical Limit for Hydrogen Evolution Reaction. Nano Energy 2015, 15, 567–575. [Google Scholar] [CrossRef]
  84. Zheng, Y.; Jiao, Y.; Li, L.H.; Xing, T.; Chen, Y.; Jaroniec, M.; Qiao, S.Z. Toward design of synergistically active carbon-based catalysts for electrocatalytic hydrogen evolution. ACS. Nano. 2014, 8, 5290–5296. [Google Scholar] [CrossRef] [Green Version]
  85. Zhang, J.T.; Qu, L.T.; Shi, G.Q.; Liu, J.Y.; Chen, J.F.; Dai, L.M. N,P-Codoped Carbon Networks as Efficient Metal-free Bifunctional Catalysts for Oxygen Reduction and Hydrogen Evolution Reactions. Angew. Chem. Int. Ed. 2016, 55, 2230–2234. [Google Scholar] [CrossRef]
  86. Lai, J.P.; Li, S.P.; Wu, F.X.; Saqib, M.; Luque, R.; Xu, G.B. Unprecedented Metal-free 3D Porous Carbonaceous Electrodes for Full Water Splitting. Energy Environ. Sci. 2016, 9, 1210–1214. [Google Scholar] [CrossRef]
  87. Zheng, Y.; Jiao, Y.; Zhu, Y.; Li, L.H.; Han, Y.; Chen, Y.; Du, A.; Jaroniec, M.; Qiao, S.Z. Hydrogen Evolution by a Metal-free Electrocatalyst. Nat. Commun. 2014, 5, 3783. [Google Scholar] [CrossRef] [PubMed] [Green Version]
  88. Shinde, S.S.; Sami, A.; Lee, J.H. Electrocatalytic Hydrogen Evolution Using Graphitic Carbon Nitride Coupled with Nanoporous Graphene co-doped by S and Se. J. Mater. Chem. A 2015, 3, 12810–12819. [Google Scholar] [CrossRef]
  89. Shinde, S.S.; Sami, A.; Lee, J.H. Nitrogen- and Phosphorus-Doped Nanoporous Graphene/Graphitic Carbon Nitride Hybrids as Efficient Electrocatalysts for Hydrogen Evolution. Chem. Cat. Chem. 2015, 7, 3873–3880. [Google Scholar] [CrossRef]
Scheme 1. The structure of the ligand 2-picolylamine (2-PA) and its zinc(II) complexes.
Catalysts 12 00389 sch001
Figure 1. (A) Solid presentation of single crystal X-ray structure of [(2-PA)2ZnCl]2(ZnCl4) Zn1, showing the labeling scheme of non-hydrogen atom; (B) Projection along c axis, describing the geometry in the ribbons which are formed from Zn1. Inter and intra hydrogen bonding displayed.
Catalysts 12 00389 g001
Figure 2. FT–IR spectra of the ligand 2–PA, GO, Zn3 and Zn3/GO.
Catalysts 12 00389 g002
Figure 3. 1H NMR spectra of the ligand 2-PA and its zinc(II) complex Zn2.
Catalysts 12 00389 g003
Figure 4. TGA-DTG–DTA curves of [(PA)2ZnCl]2(ZnCl4) (Zn1).
Catalysts 12 00389 g004
Figure 5. TGA– DTG– DSC thermograms of GO, Zn3, and Zn3/GO.
Catalysts 12 00389 g005aCatalysts 12 00389 g005b
Figure 6. SEM images with EDX for (Left) pristine GO, in comparison with (Right) Zn3/GO.
Catalysts 12 00389 g006
Figure 7. XRD patterns of GO, Zn3 and Zn3/GO.
Catalysts 12 00389 g007
Figure 8. (a) optimized structure of Zn3, (b) optimized structure of GO, (c) the MESP map and (d) the HOMO orbitals of GO nanosheet calculated at B3LYP/6– 311++G(d,p) level of theory.
Catalysts 12 00389 g008
Figure 9. The optimized structure of (a) Zn1/GO and (b) Zn3/GO structures in the gas phase.
Catalysts 12 00389 g009
Figure 10. Three-dimensional isosurface plot of (a) Zn1/GO and (b) Zn3/GO, the reduced density.
Catalysts 12 00389 g010
Figure 11. Cathodic polarization curves (a) and their corresponding Tafel plots (b) recorded for the investigated Zn3 of various loading densities (unsupported and supported on GO) in a comparison with the supporting material (GO). Measurements were conducted in 0.1 M KOH aqueous solution at a scan rate of 5 mV s1 at room temperature. (1) Bare GC electrode; (2) GC− GO; (3) GC− Zn3 (0.2 mg cm2); (4) GC− Zn3 (0.4 mg cm2); (5) GC− Zn3 (0.8 mg cm2); (6) GC− Zn3 (0.2 mg cm−2)/GO; (7) GC− Zn3 (0.4 mg cm−2)/GO; (8) GC− Zn3 (0.8 mg cm−2)/GO; (9) Pt/C.
Catalysts 12 00389 g011aCatalysts 12 00389 g011b
Figure 12. Complex-plane impedance plots recorded for the investigated Zn3 of various loading densities (unsupported and supported on GO) in a comparison with the supporting material (GO). Measurements were conducted in 0.1 M KOH aqueous solution at an overpotential value of 500 mV at room temperature. (1) Bare GC electrode; (2) GC− GO; (3) GC− Zn3 (0.2 mg cm2); (4) GC− Zn3 (0.4 mg cm−2); (5) GC− Zn3 (0.8 mg cm−2); (6) GC− Zn3 (0.2 mg cm−2)/GO; (7) GC− Zn3 (0.4 mg cm−2)/GO; (8) GC− Zn3 (0.8 mg cm−2)/GO; (9) Pt/C. Inset—the high frequency region to clarify the presence of the small semicircle.
Catalysts 12 00389 g012
Scheme 2. A proposed catalytic mechanism for proton reduction by Zn3.
Catalysts 12 00389 sch002
Figure 13. Long-term stability test recorded for the best performing electrocatalyst, namely GC− MnC (0.8 mg cm−2) in 0.1 M KOH solution at room temperature for the HER. LSV measurements were conducted at a scan rate of 50 mV s−1. Inset—chronoamperometry measurements performed on the catalyst at a constant applied potential of −0.4 V vs. RHE.
Catalysts 12 00389 g013
Table 1. Selected bond lengths (Å), angles (o) and hydrogen bond geometry of Zn1.
Bond Lengths [Å] and Bond Angles [o]:
Zn1-N12.0716 (12)N4-Zn1-N1119.87 (6)N4-Zn1-N2102.83 (4)
Zn1-N22.1644 (11)N1-Zn1-N279.04 (4)N4-Zn1-N379.17 (4)
Zn1-N32.2059 (11)N1-Zn1-N392.31 (4)N2-Zn1-N3170.98 (4)
Zn1-N42.0699 (12)N4-Zn1-Cl1111.28 (4)N1-Zn1-Cl1128.64 (4)
Zn2-N52.0828 (12)N2-Zn1-Cl194.55 (3)N3-Zn1-Cl192.86 (3)
Zn2-N62.1133 (11)N5-Zn2-N680.79 (4)N5-Zn2-N7111.59 (5)
Zn2-N72.1198 (13)N6-Zn2-N791.29 (5)N5-Zn2-N899.69 (4)
Zn2-N82.1332 (11)N6-Zn2-N8169.14 (4)N7-Zn2-N878.41 (5)
Zn1-Cl12.2955 (4)N5-Zn2-Cl2117.96 (4)N6-Zn2-Cl297.35 (3)
Zn2-Cl22.3156 (4)N7-Zn2-Cl2130.44 (4)N8-Zn2-Cl292.01 (3)
Zn3-Cl32.2869 (4)Cl4-Zn3-Cl5110.631 (15)Cl4-Zn3-Cl6109.127 (16)
Zn3-Cl42.2595 (4)Cl5-Zn3-Cl6109.362 (17)Cl4-Zn3-Cl3109.759 (19)
Zn3-Cl52.0828 (12)N4-Zn1-N1119.87 (6)N4-Zn1-N2102.83 (4)
Zn3-Cl62.2782 (4)N1-Zn1-N279.04 (4)N4-Zn1-N379.17 (4)
Cl5-Zn3-Cl3113.850 (17)Cl6-Zn3-Cl3103.832 (16)
Table 2. Hydrogen bond distances (Å) and angles (°) of Zn1.
Donor-HAcceptor-HDonor-AcceptorAngle
N1-H1C...Cl20.88 (2)2.42 (2)3.2834 (15)169.2 (19)
N1-H1D...Cl10.83 (2)2.80 (2)3.3904 (13)129.6 (19)
N4-H4A...Cl30.95 (2)2.94 (2)3.8286 (15)156.9 (17)
N4-H4B...Cl40.80 (2)2.61 (2)3.2479 (13)137.6 (19)
N5-H5A...Cl50.85 (2)2.57 (2)3.3925 (13)160.8 (19)
N5-H5B...Cl60.85 (2)2.53 (2)3.2911 (14)150.7 (18)
N7-H7D...Cl50.95 (2)2.63 (3)3.4963 (15)152.0 (19)
N7-H7E...Cl10.81 (2)2.89 (2)3.3917 (15)122.7 (18)
Table 3. Calculated HOMO energy (eV), LUMO energy (eV), energy gap energy (eV) and charges on GO calculated by Hirshfeld and Mullikan methods.
EHOMO
(eV)
ELUMO
(eV)
Eg
(eV)
Charge on GO
HirshfeldMullikan
GO−5.51−3.771.7400
Zn1/GO−7.12−5.491.63−0.97−0.87
Zn3/GO−7.10−5.501.60−1.2−1.6
Table 4. Mean value (standard deviation) of the HER electrochemical kinetic parameters estimated for the investigated catalysts.
Tested CathodeEHER/mV (RHE)βc/mV dec1jo/mA cm2η10/mV
bare GC electrode ----254 (6)6.3 (0.15) × 104----
GC-GO595 (10)185 (4.2)1.1 (0.03) × 10−3730 (9)
GC-Zn3 (0.2 mg cm−2)139 (2.2)156 (2.8)10.2 (0.25) × 10−2265 (4.8)
GC-Zn3 (0.4 mg cm−2)112 (1.6)154 (2.7)18.8 (0.3) × 10−2216 (3.4)
GC-Zn3 (0.8 mg cm−2)102 (1.4)155 (2.5)25.7 (0.4) × 10−2205 (3.2)
GC-Zn3 (0.2 mg cm−2)/GO85 (1.3)119 (1.8)28 (0.5) × 10−2180 (2.5)
GC-Zn3 (0.4 mg cm−2)/GO44 (0.7)117 (2.1)45 (0.7) × 102136 (2.3)
GC-Zn3 (0.8 mg cm−2)/GO25 (0.4)118 (2.2)77 (1.3) × 10−2122 (1.9)
Pt/C10 (0.2)113 (1.2)88 (1.2) × 10−2110 (1.4)
Table 5. Mean value (standard deviation) of the impedance parameters recorded for the investigated GC-loaded Zn3 catalysts (unsupported and supported on GO) in a comparison with bare GC electrode. Measurements were conducted in an aqueous deaerated KOH solution (0.1 M).
CatalystQ2
Sn (ω1 cm−2)
R2 or Rct
Ω cm2
n2C2
µF cm−2
Rf *EASA **
(cm2)
bare GC electrode122.68 (1.5)2792 (20)0.88106 (1.9)6.13 (0.1)0.43 (0.01)
GC-Zn3 (0.2 mg cm−2)3554 (39)88 (1.2)0.893078 (35)177.7 (2.8)12.4 (0.17)
GC-Zn3 (0.4 mg cm−2)4155 (40)65 (0.11)0.883476 (35)207.8 (2.8)14.5 (0.18)
GC-Zn3 (0.8 mg cm−2)4686 (39)47 (0.8)0.873738 (38)234.3 (2.8)16.4 (0.22)
GC-Zn3 (0.2 mg cm−2)/GO6567 (48)32 (0.6)0.865094 (49)328.3 (3.5)23.0 (0.28)
GC-Zn3 (0.4 mg cm−2)/GO8130 (65)22 (0.5)0.866143 (49)406.5 (4.2)28.5 (0.33)
GC-Zn3 (0.8 mg cm−2)/GO10,622 (55)12 (0.2)0.857385 (62)531.1 (5.9)37.2 (0.45)
* Rf = Qmeasured/Qcalculated, where Qcalculated = 20 Sn1 cm2). ** EASA (cm2) = Rf × A, A is the geometric surface area = π r2 = (3.14) (0.15)2 ~ 0.07 cm2, where 0.15 is the radius of the GCE in cm. Rf = 1.0 for the smooth, as-polished GC electrode; hence, its EASA value equals 0.07 cm2.
Table 6. Mean value (standard deviation) of VH2 (measured and calculated) obtained after 1 h of a controlled galvanostatic electrolysis (CGE) *, together with the Faradaic Efficiency values, FE (%), for the studied catalysts.
Tested CatalaystH2 Measured by GC
(H2/μmol h−1)
Calculated H2 Based on the Charge Passed during ElectrolysisFE (%)
Charge passed/CH2/μmol h−1
GC-Zn3 (0.2 mg cm2)12.1 (0.15)2.98 (0.05)15.4 (0.2)78.6 (1.2)
GC-Zn3 (0.4 mg cm−2)17.0 (0.2)3.8 (0.06)19.7 (0.22)86.2 (1.1)
GC-Zn3 (0.8 mg cm−2)21.4 (0.24)4.5 (0.08)23.3 (0.25)91.8 (1.3)
GC-Zn3 (0.2 mg cm−2)/GO22.3 (0.28)4.8 (0.06)24.9 (0.3)89.7 (1.2)
GC-Zn3 (0.4 mg cm−2)/GO26.9 (0.35)5.4 (0.08)28.0 (0.3)96.2 (1.4)
GC-Zn3 (0.8 mg cm−2) /GO31.3 (0.41)6.1 (0.1)31.6 (0.4)98.9 (1.5)
Pt/C32.7 (0.35)6.38 (0.1)33.1 (0.36)99.5 (1.4)
* CGE: The catalyst is held at a current density of −10 mA cm−2 for 1 h in 1.0 M KOH solution at 25 °C.
Publisher’s Note: MDPI stays neutral with regard to jurisdictional claims in published maps and institutional affiliations.

