Article

Biosynthesized Bimetallic (ZnOSnO2) Nanoparticles for Photocatalytic Degradation of Organic Dyes and Pharmaceutical Pollutants

by
Louisah M. Mahlaule-Glory
,
Sarah Mathobela
and
Nomso C. Hintsho-Mbita
*
Department of Chemistry, University of Limpopo, Sovenga, Polokwane 0727, South Africa
*
Author to whom correspondence should be addressed.
Catalysts 2022, 12(3), 334; https://doi.org/10.3390/catal12030334
Submission received: 1 December 2021 / Revised: 27 December 2021 / Accepted: 29 December 2021 / Published: 16 March 2022
(This article belongs to the Special Issue Nanomaterials for Photocatalysis and Piezo-Photocatalysis)

Abstract

:
The quest for eco-friendly synthetic routes that can be used for the development of multifunctional materials, in particular for water treatment, has reinforced the use of plant extracts as replacement solvents. In this study, bimetallic ZnOSnO2 nanoparticles of different ratios were synthesized using the Sutherlandia frutescens (S. frutescens) plant and tested for the degradation of methylene blue dye and the antibiotics sulfisoxazole and sulfamethoxazole. From the analysis, FTIR confirmed the formation of bimetallic nanoparticles in all ratios within the fingerprint region. SEM revealed homogenous and heterostructures of tubular and spherical structures, with the size distribution ranging from 5–60 nm, respectively. XRD confirmed the formation and the crystallinity of the bimetallic nanoparticles, UV-Vis confirmed the optical properties of the materials and the bandgap values were found between 3.08 and 3.3 eV. From the surface area analysis, type III isotherm and mesoporous structures were confirmed. The photocatalytic activity of these ratios was investigated against MB dye and the antibiotics SSX and SMX. The highest degradation of 88% for MB was obtained using the 50:50 loading ratio at 150 min with a fast kinetic rate of 0.0008 min−1. Furthermore, the holes were the species found to be responsible for the degradation of MB. The SSX and SMX antibiotics exhibited a 66% and 70% degradation, respectively. From this analysis, it can be noted that it is possible to synthesize environmentally safe materials that can be used to degrade various pollutants in our water streams.

1. Introduction

Pollutants, such as organic dyes and antibiotics, tend to produce water pollution when accumulated from sources such as manufacturing, industrial and hospital effluents. These pollutants generate wastewater by releasing large amounts of toxins into various water bodies [1,2,3,4,5]. They are carcinogenic, hazardous and pathogenic, which poses a health threat to life within the ecosystem and the environment. When humans come in contact with these pollutants, even at smaller concentrations, they can lead to illnesses such as brain damage, kidney failure, cancer, skin irritation and many more [4,6].
Dyes are organic pollutants produced from industries such as textile, cosmetics, electronics, food and furniture so to change colors [7]. Organic dyes are complexed with aromatic structures, which makes them difficult to degrade and which can also be resistant to other water treatment strategies [8]. These industries also release large amounts of toxins into the natural channels or streams, which contributes to a higher pollution rate into the ecosystem [8,9].
Pharmaceutical antibiotic compounds such as sulfisoxazole (SSX) and sulfamethoxazole (SMX) (Figure 1) are designed for physiological response in humans, animals and plants [10,11,12]. Thus, they are prescribed by medical practitioners for daily usage to improve the quality of life due to their antibiotic, antibacterial, antiepileptic, anti-inflammatory and blood lipid regulator biological properties [13,14]. However, as they cannot be completely metabolized by humans, they emerge as ubiquitous pollutants. Furthermore, a large consumption of these drugs leads to pseudo-persistent, continuous emissions and ecological hazards, which are caused by characteristics such as polarity, optical activity and semi-volatility, leading to water pollution. Moreover, due to their natural lipophilic tendency and improper discharge, they tend to easily accumulate and become detected within the surface of various water bodies [15], thus raising a serious health risk concern within the ecosystem.
Currently, these pollutants are treated by conventional methods such as adsorption, decomposition, reverse osmosis, ion exchange, electrochemical and many others [16]. The physical and biological methods have displayed limitations such as time consumption, high cost, the generation of secondary pollutants and high energy requirements [16], whereas the biological methods tend to be affected by environmental factors [17,18]. Due to these limitations, researchers have continued their need to use the advanced oxidation processes such as photocatalytic degradation for water treatment [19]. This method is known to be simple, cost-effective and produces products that are eco-friendly [20]. Furthermore, the organic dyes are stable under light and can be easily oxidized, thus making them vulnerable to this technique. Moreover, since the traditional water treatment methods have failed to remediate antibiotics found in water and its metabolites [14], the photocatalytic process is recommended, since it has the potential to oxidize toxic or poisonous substances by using their strong oxidizing radicals [13].
For the photocatalysis process to be a success, suitable catalysts are required, such as titanium dioxide (TiO2), nickel oxide (NiO), zinc oxide (ZnO), etc. Even though semiconductors have been reported to possess properties such as higher surface-to-volume area, and physical, optical and many other properties [20,21,22], they have also been shown to have some drawbacks such as a broad bandgap, which limits the absorption ability, and a fast recombination rate, which reduces the efficiency of the photocatalytic process [23]. Reports have indicated that coupling semiconductors can improve photocatalytic degradation by hindering the recombination rate, which also reduces the bandgap [24,25,26]. Moreover, they can also improve the chemical properties of these semiconductors, which tends to increase the charge separation of photogenerated electron–hole pairs by generally increasing the photocatalytic efficiency [27,28,29]. Another limitation has also been the usage of toxic solvents during the synthesis of these materials; hence, researchers in the last decade have geared towards the use of green materials such as plant extracts. Plant extracts, due to the phytochemicals they consist of, such as flavanols and tannins, have been shown to have the ability to act as reducing and stabilizing agents during the synthesis of nanoparticles.
In this study, we focus on the biosynthesis of a bimetallic material (ZnO/SnO2) at different ratios using the S. frutescens plant extract and testing these materials for the degradation of methylene blue dye and the antibiotics sulfisoxazole (SSX) and sulfamethoxazole (SMX). For the first time, a bimetallic green material will be used for the degradation of the antibiotics SSX and SMX in water.

2. Results and Discussion

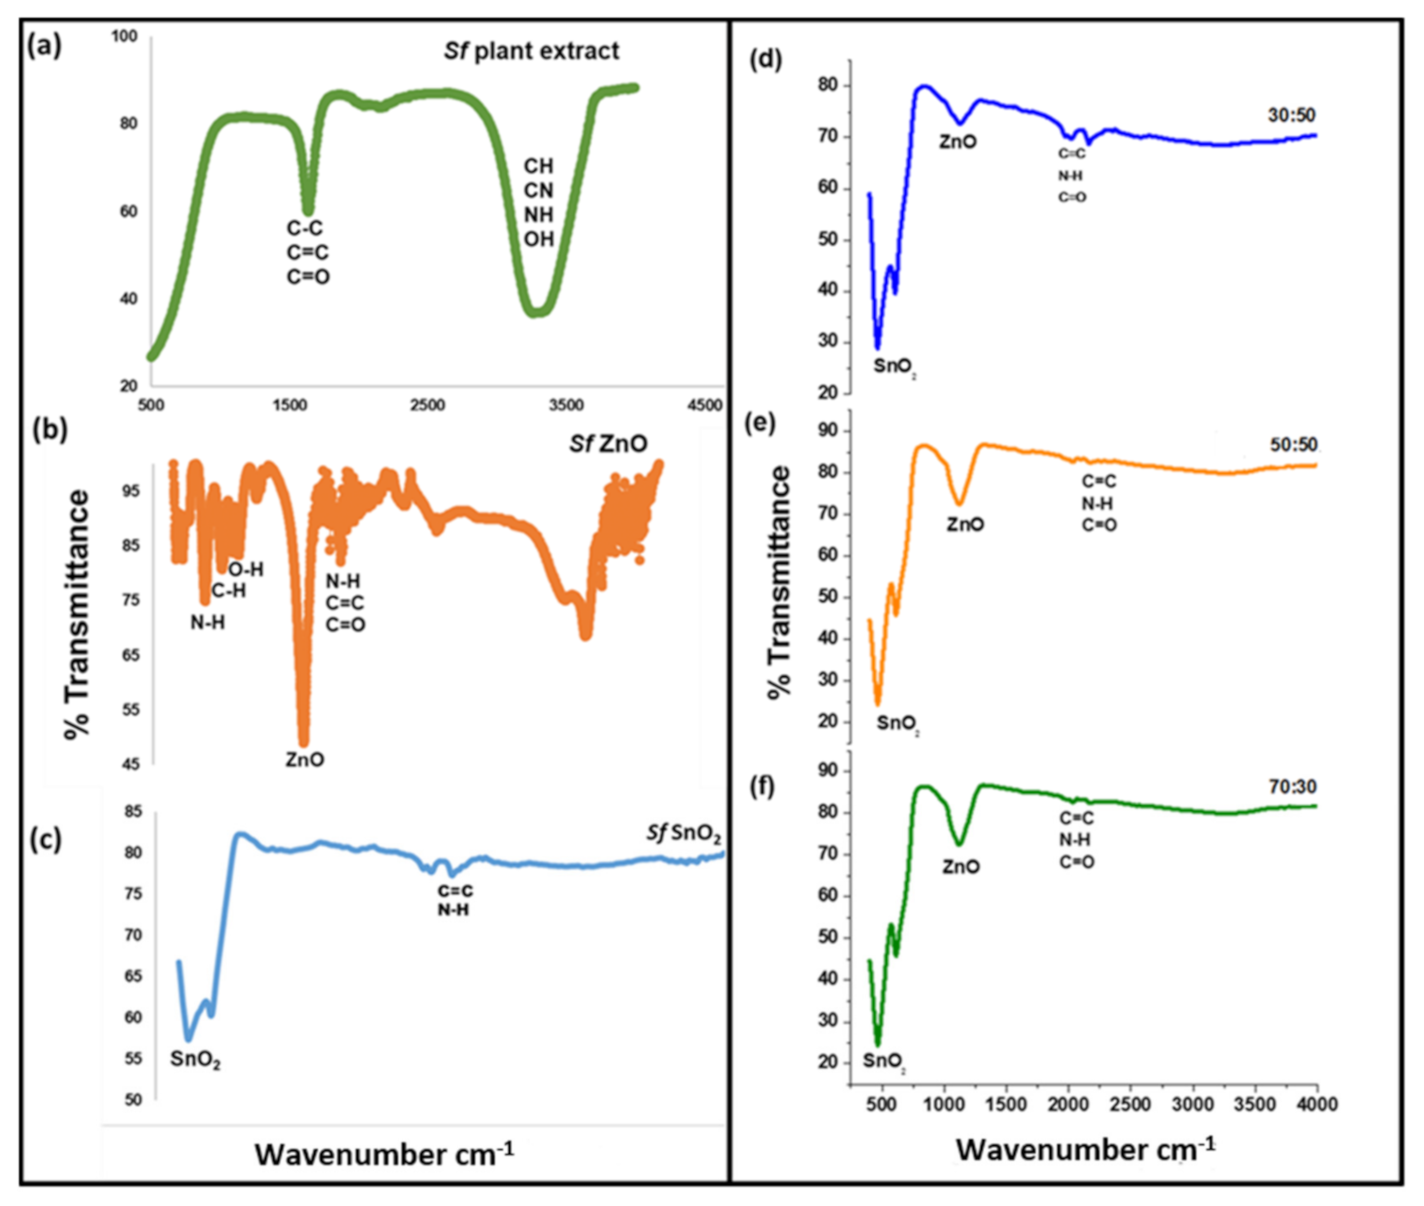
2.1. FTIR Analysis of the Bimetallic Sf ZnOSnO2 Nanomaterials at Various Loadings

The results displayed in Figure 1 were analyzed using FTIR spectroscopy to confirm the formation and functional groups identification of these loaded materials.
From Figure 2, six nanomaterials were analyzed, namely the Sf plant extract, Sf ZnO, Sf SnO2 and the bimetallic Sf ZnOSnO2 nanoparticles at 30:70, 50:50 and 70:30 loadings. The Sf plant extract exhibited absorption peaks from 1500 to 3600 cm−1. These functional groups have been briefly discussed from the previous work by Mahlaule Glory et al. [6], emanating from phytochemicals such as glycosides, phenols, etc. The FTIR analysis of the metal oxides, as displayed in Figure 2b,c, displayed a sharp peak at 1500 cm−1, observed from the ZnO spectrum representing the Zn and the O bond, which confirmed the formation of ZnO. The additional peaks displayed between 500 and 3600 cm−1 are peaks representing the phytochemicals extracted from the Sf plant extract. These results agree with reports where metal oxides were found within the fingerprint region below 1500 cm−1 [30,31]. We have also observed a broad absorption band in Figure 2c at 500 cm−1, representing the bond between Sn and O with a minimum deposition of the plant extract. This confirms the formation of SnO2 nanoparticles within the fingerprint region [32]. Furthermore, the bimetallic Sf ZnOSnO2 nanoparticles represented in Figure 2d–f also showed the presence of phytochemicals at 2000 cm−1, represented by the functional groups of C=C, C=O and N-H. These functional groups represent phytochemicals such as canavanine, GABA, flavanol, phenols and glycosides, as shown previously [33,34,35]. The ZnO and SnO2 peaks were also observed at 1300 and 500 cm−1, respectively, on the bimetallic ratios, which confirm the formation of the bimetallic nanoparticles.

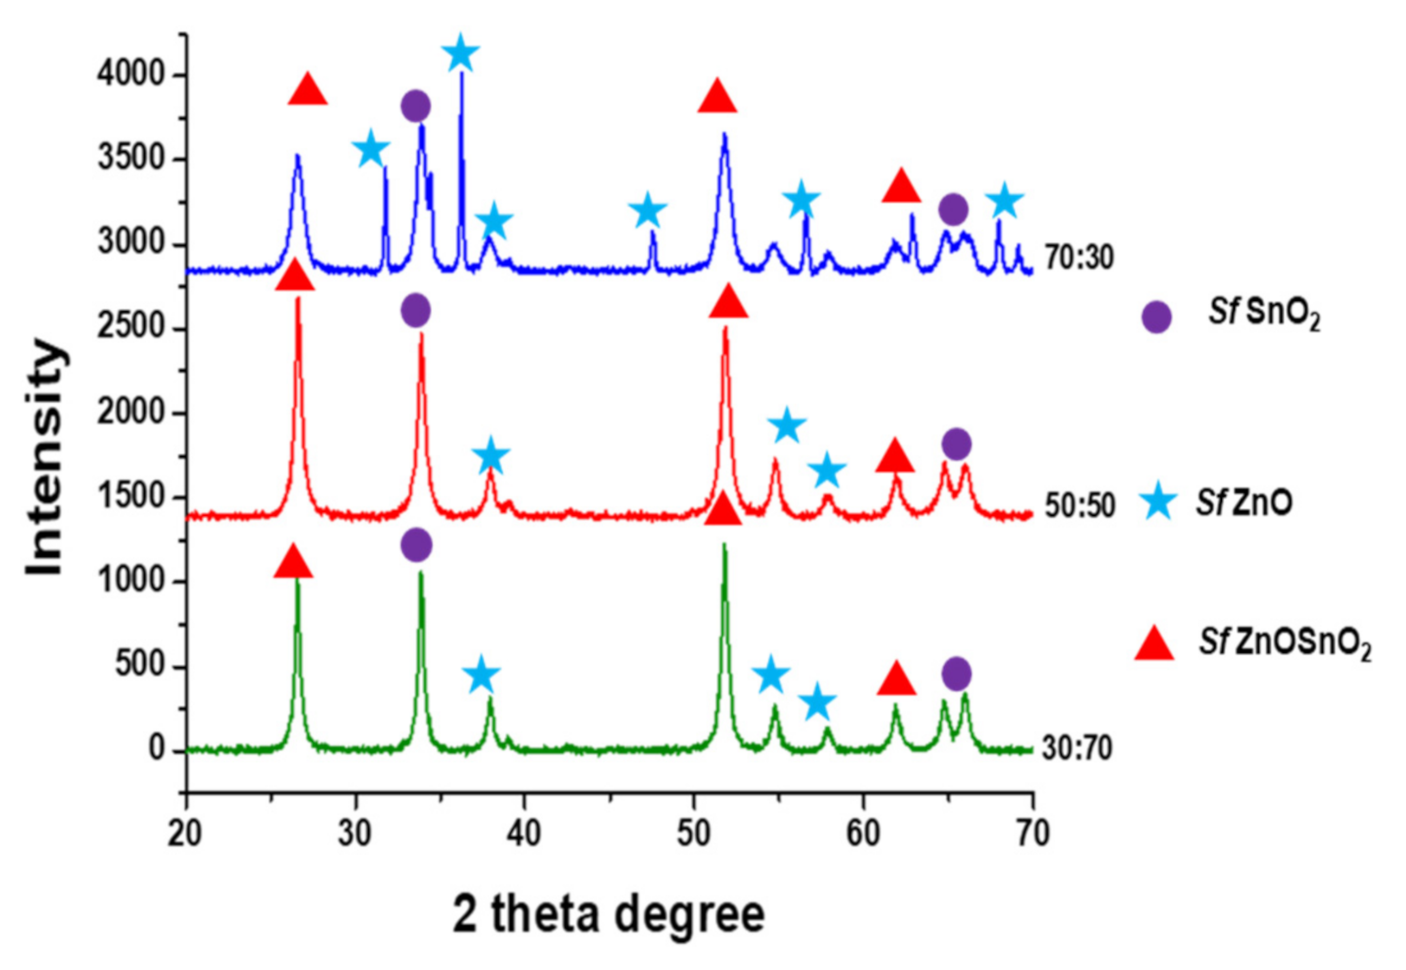
2.2. XRD Analysis of the Bimetallic Sf ZnOSnO2 Nanomaterials at Various Loadings

For the phase identification, the crystallite size and the crystallinity of the material, XRD was conducted. From Figure S1, two spectrums of Sf ZnO and Sf SnO2 are presented. The peaks obtained from the Sf ZnO spectrum in Figure S1 displays the XRD patterns appearing at 2θ values, which are indexed to 36.13°, 38.97°, 42.30°, 45.39°, 52.51°, 55.23° and 67.94°, correlating to the diffraction planes of (110), (002), (101), (010), (102), (401) and (200), which confirmed the formation of Sf ZnO. The diffraction patterns from the SnO2 spectrum were displayed as 26.57°, 33.86°, 37.94°, 38.69°, 52.62°, 51.75°, 57.80°, 62.57°, 64.71°, 65.94°, 71.24°, 78.60°, 81.09° and 84.15°, which confirms the diffraction planes of (110), (101), (200), (111), (211), (220), (002), (301), (202), (320), (321), (400), (222) and (330) [36]. The observed diffraction planes correlate with several reports confirming SnO2 formation, and also indicating the material to have a tetragonal rutile structure [37]. In both the materials, the peaks were highly crystalline with sharp peaks and no impurities detected. Furthermore, the average particle sizes of both materials were calculated, using the Debye–Scherrer equation, to be 13.30 and 8.00 nm, respectively. These small sizes, in particular for SnO2, are due to quantum confinement and could assist in a better degradation activity for the dyes and the antibiotics [38].
The results exhibited in Figure 3 represent the three bimetallic materials. In all the displayed spectra, we observe three diffraction peaks which are attributed to (220), (422) and (440) located at 2θ degree of 28°, 52° and 63°. These indicate the formation of the bimetallic Sf ZnOSnO2 nanoparticles and are also represented by the red triangle as indicated in Figure 2. These results were also confirmed by reports from [26,34], where these peaks confirmed the formation of bimetallic ZnOSnO2 nanoparticles. Moreover, diffraction peaks representing ZnO and SnO2 are also observed. We observe that the dominant diffraction peaks on the 30:70 ratios are from Sf SnO2, namely (101), (200), (221), (220) and (002), which indicates the higher presence of Sf SnO2. For the 50:50 loading, we can observe that the diffraction planes of ZnO and SnO2 are in harmony, which confirms the equal molar concentration contribution of the two metal oxides [39,40]. The 70:30 ratio had more phases from Sf ZnO, as indicated by the (100), (002), (010), (200), (112) and (201) diffraction peaks, which could also indicate the percentage loading caused by the molar ratio of ZnO. To further understand these materials, morphological analysis was also conducted, as represented in Section 3.3.

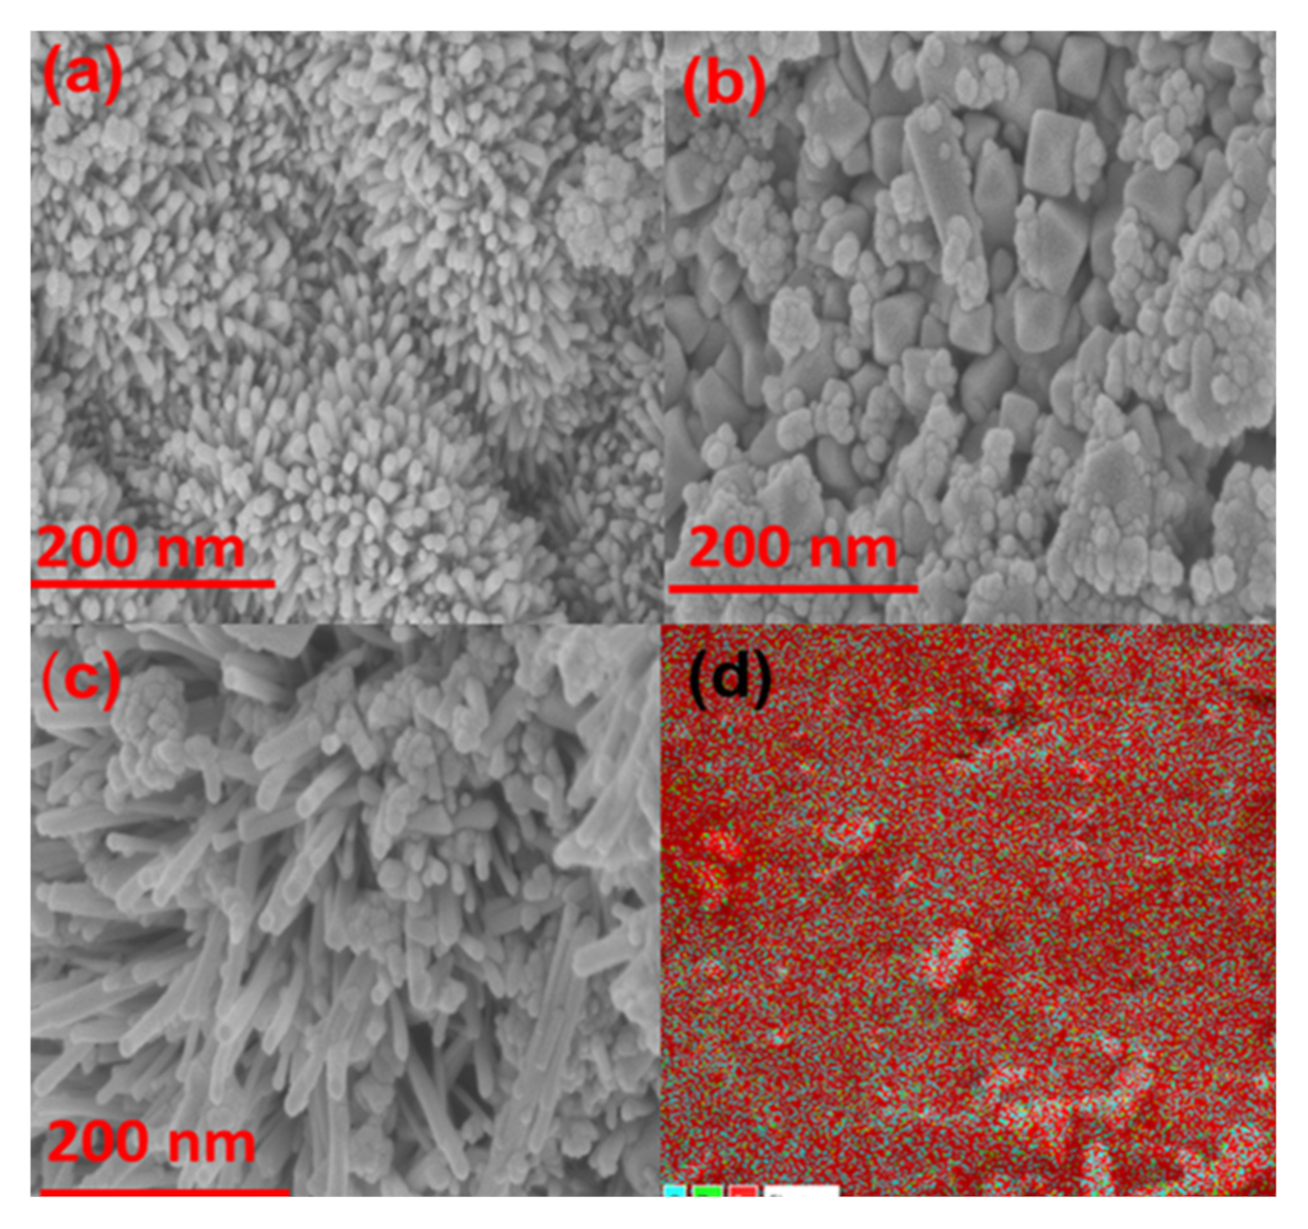
2.3. Morphological Analysis Using SEM Microscopy

The bimetallic Sf ZnOSnO2 nanomaterial at various loadings using SEM is shown in Figure 4.
From Figure 4, we can observe that the morphological structures of all the bimetallic nanoparticles are displayed as 3D heterostructures which consist of spheres and rods. This could be due to the properties exhibited by assembling two of the various catalysts into one nano unit [41]. The spheres are located at the top and bottom of the structures while the rods appear the middle. In Figure 4a, the tubular structures of the 30:70 ratio are dominant rather than the spherical structures, which confirms that the SnO2 nanoparticles are dominating. It is also observed that the 50:50 ratio, represented by Figure 4b, shows the visible heterostructures of spheres and tubes. This could be due to the equal amount of loading of the metal oxides. The 70:30 ratio presented by Figure 4c displays that both shapes are clear and distinct while the spherical shapes are more visible, which can confirm the dominance of ZnO. All these structures indicate that the reaction was physical, since we can observe the physical change from the 30:70 to the 70:30 ratios. The results confirm that the bimetallic nanoparticles were formed, where the spheres represent ZnO and the tubular structures represent the SnO2 nanoparticles [42,43]. These morphological structures were further confirmed through TEM analysis (Figure S2), and the nanostructures particle size were found to be in the range of 5–60 nm. The mapping analysis of the 30:70 ratio is presented in Figure 4d. We also observe that the material was evenly spread, where the red color represents Sn from the SnO2, followed by the presence of O, which is from both the metal oxides, and the minimum presentation of Zn from ZnO is also observed. To further understand the material, the porosity and surface area of our materials were further evaluated using the BET analysis.

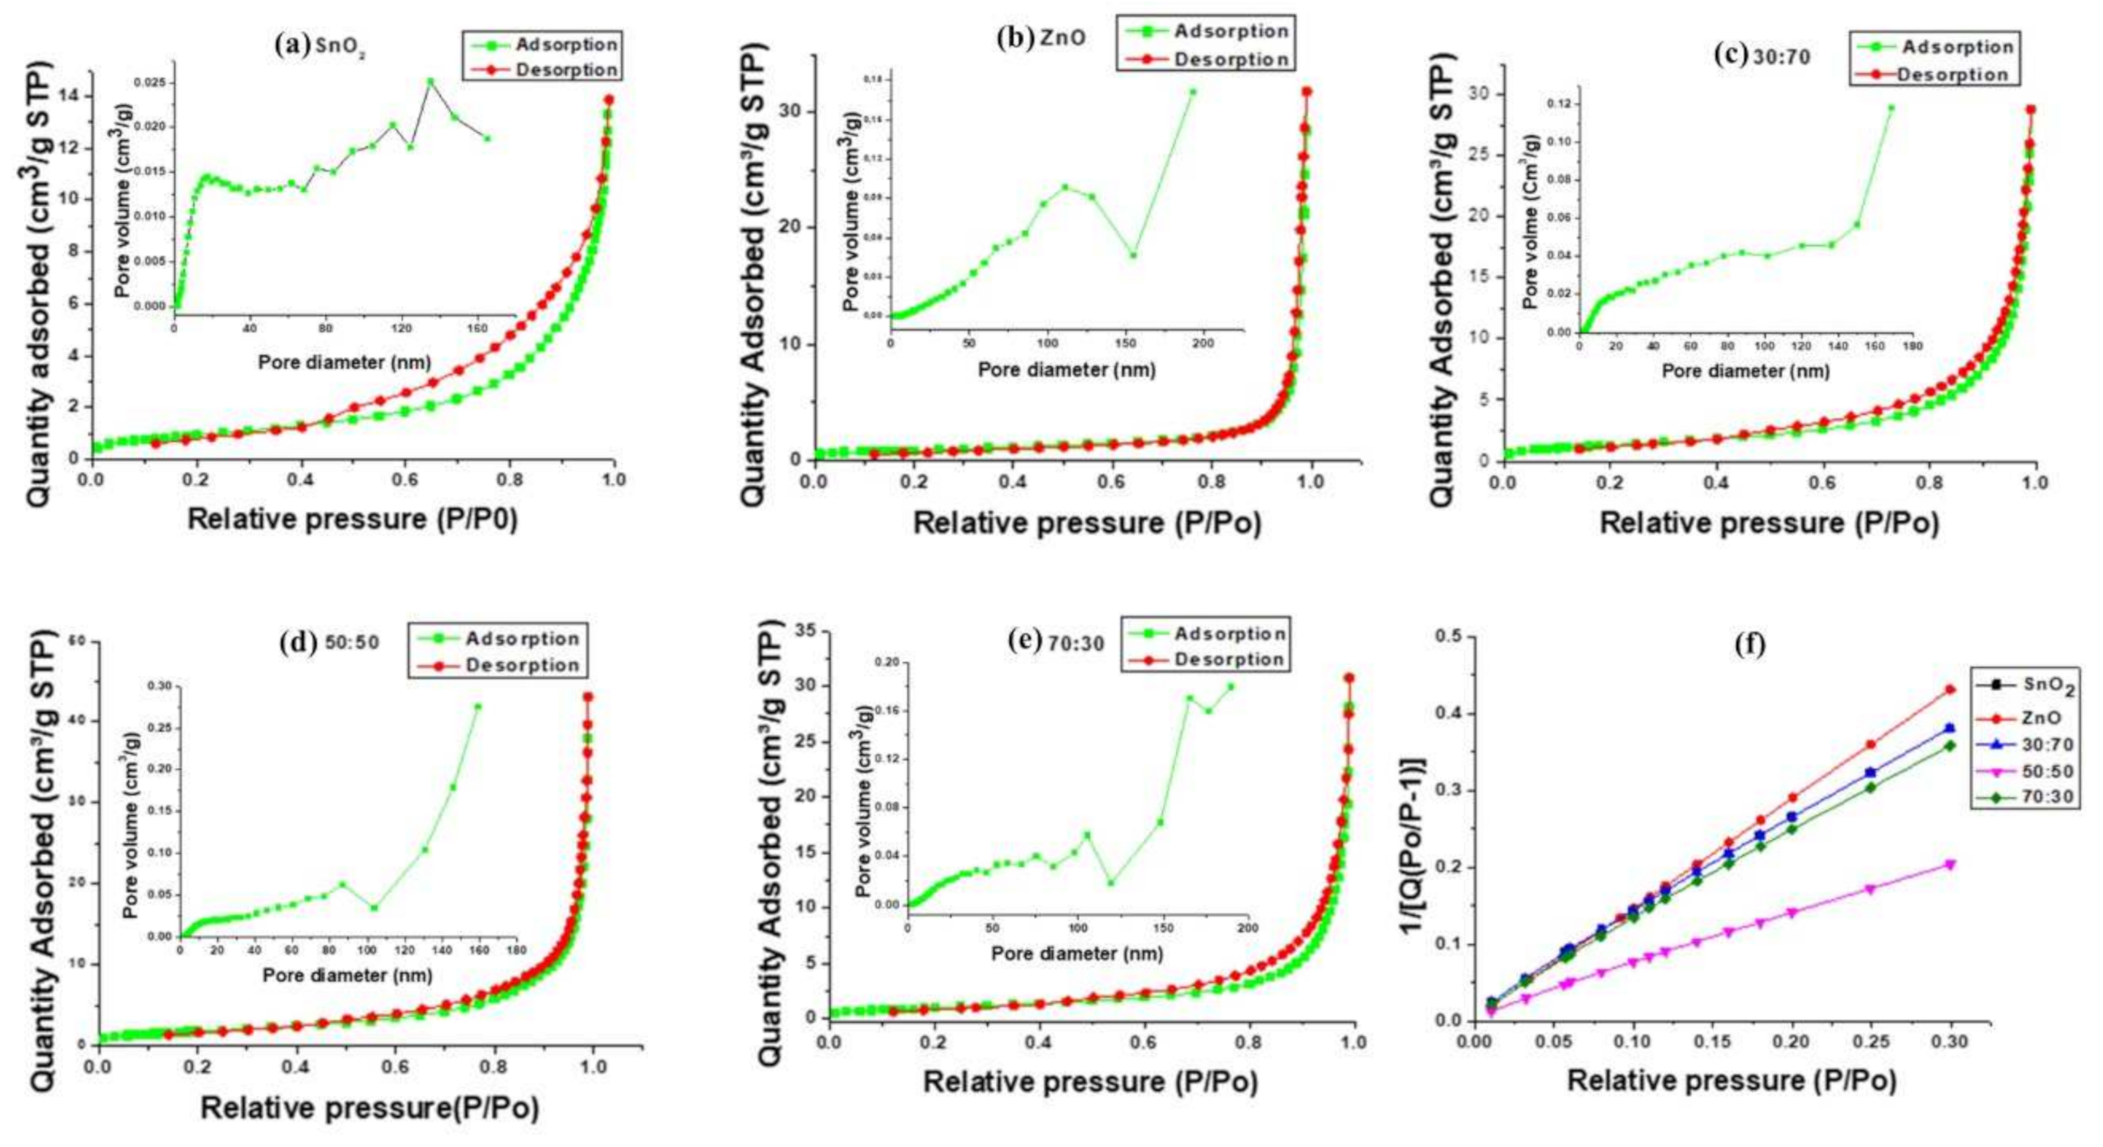
2.4. BET Surface Area Measurements of the Bimetallic Nanoparticles

The N2 adsorption–desorption isotherms, specific surface areas and pore size distributions of the as-synthesized nanoparticles are displayed in Figure 5. The BET isotherms of the SnO2, ZnO, 30:70, 50:50 and 70:30 bimetallic nanoparticles all exhibit a type III curve with the mesoporous structure and show no microporosity. The highest pore volume (0.30 cm3/g) was noted in the 50:50 bimetallic ratio, followed by the 70:30 (0.20 cm3/g), ZnO (0.18 cm3/g), 30:70 (0.12 cm3/g) and SnO2 (0.025 cm3/g). This indicates that the 50:50 material should be able to adsorb more than the rest of the materials based on the pore volume, this is also indicated in Figure 5f as the material has the lowest linear pressure ratio. Upon checking the surface area in Table 1, the 50:50 ratio also exhibited the highest surface amongst the other materials, which might assist in the photocatalytic activity of the material due to the expected higher number of active sites. For the 70:30 ratio, however, the surface area decreased again. When comparing these results with previously published work, the surface area obtained in this study was low, which could possibly be caused by the phytochemicals present in the materials and the synthesis method used. To obtain more information on these materials, they were tested for their photocatalytic activity against the dyes and antibiotics.

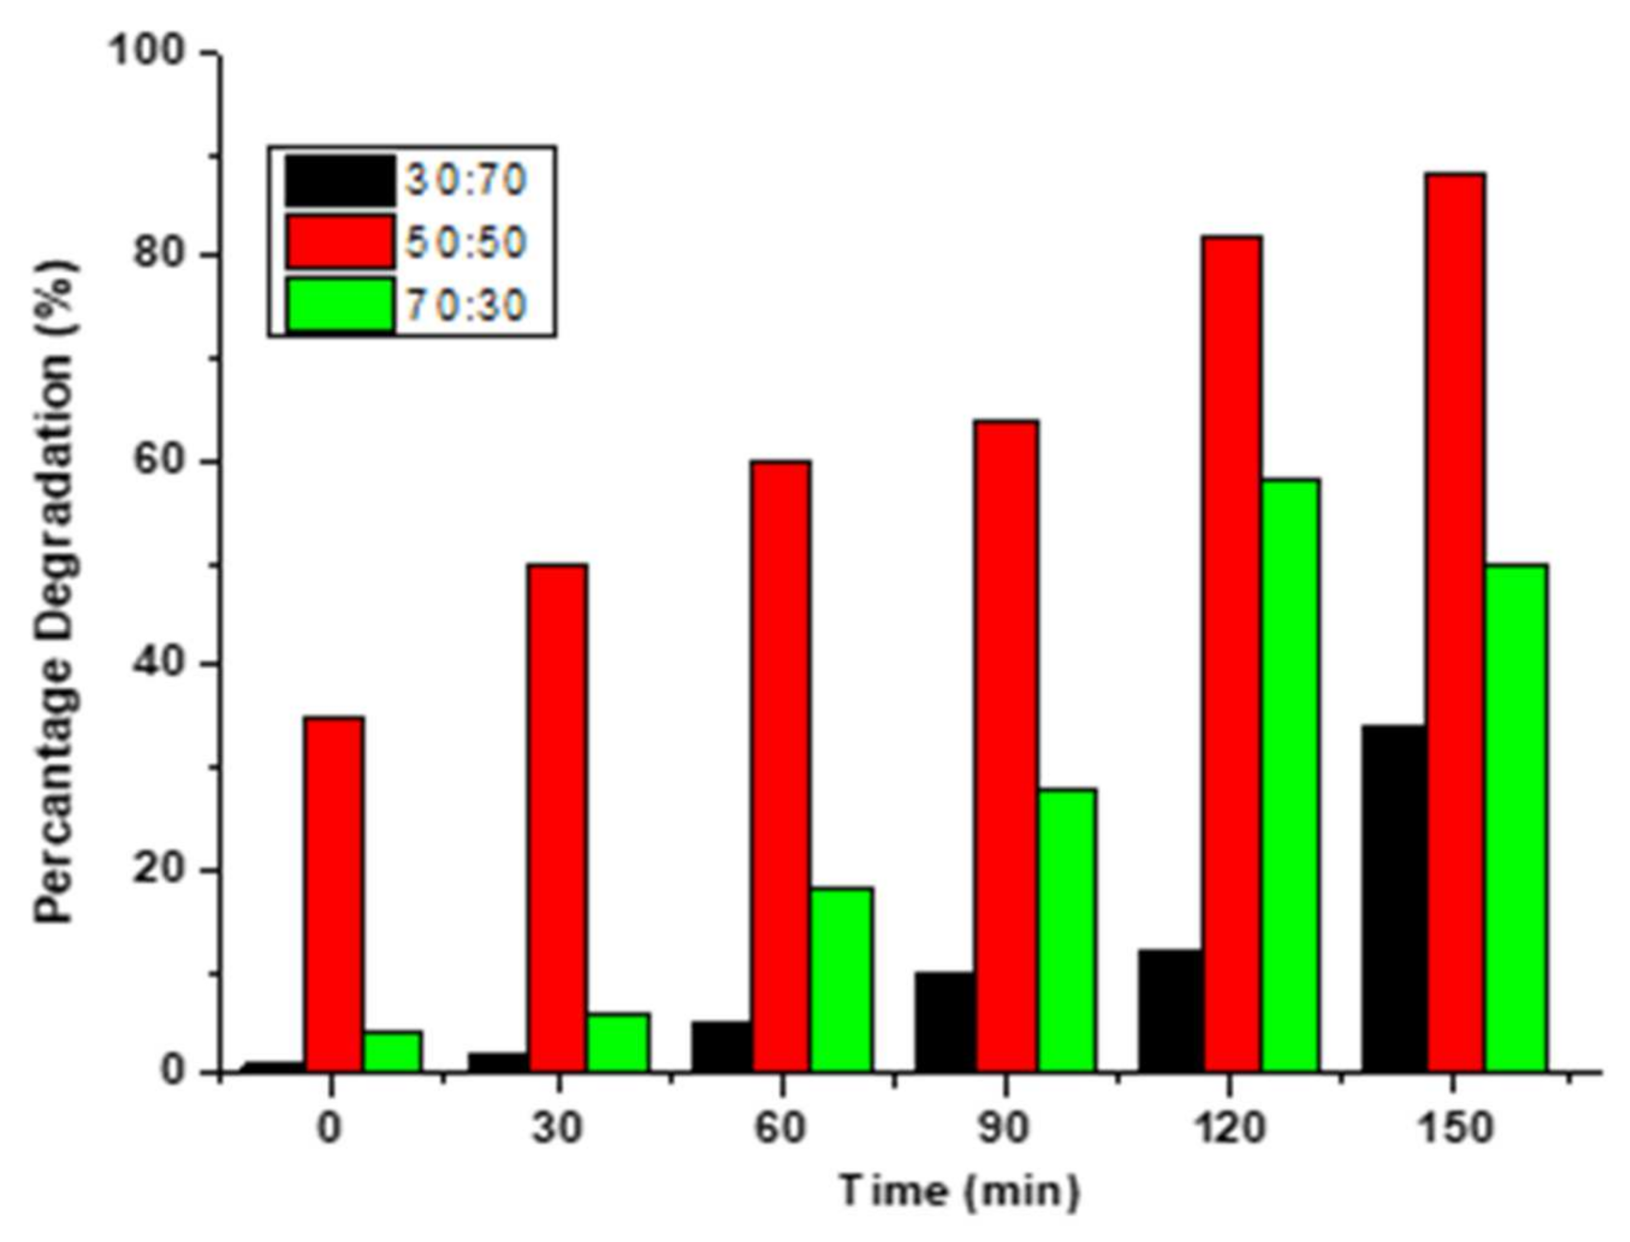
2.5. Photocatalytic Degradation of the Loaded Materials against MB

The photocatalytic activity of the synthesized bimetallic materials at various loadings was investigated using MB as a model pollutant.
Figure 6 exhibits the photocatalytic degradation of the three bimetallic ratios of the 30:70, 50:50 and 70:30 against the MB dye for 150 min with respect to time. During the adsorption–desorption process, some form of adsorption was noted for all the ratios, in particular the 50:50 ratio, as 34% of the dye was adsorbed. This could be caused by the high presence of ZnO in these two ratios, which was more dominant than in the 30:70. Furthermore, ZnO is also known to have a higher absorption efficiency. It can also be observed that when the light was introduced after 30 min, the 30:70 ratio started the degradation slowly and reached a plateau at 150 min, with the highest degradation of 34.76%. This could be because SnO2 is known to possess a larger bandgap than ZnO [44]. The higher molar ratio of SnO2 might have decreased the photocatalytic activity of the 30:70 ratio. The 50:50 ratio increased the degradation removal of dye when the irradiation time was also increased, until it reached the highest removal of 88% at 150 min. The images showing the degradation taken from the 50:50 experiments are presented in Figure S3. From this analysis, it could be noted that a higher degradation efficiency was achieved with the 50:50 material compared to the other two materials. This could be because, at equal amounts of loading, the level of composing material permits the surface to allow more active sites that increase the degradation activity [41]. Moreover, according to Sehar et al. [24], the disoriented shapes such as tubes and rods tend to increase the surface area, which can produce more active sites within the catalyst. Furthermore, the spheres could have assisted by trapping more light from the light source and allowing more activity, as the active site would degrade the dye. The 70:30 ratio indicated that the material reached saturation at 120 min, with the highest degradation of 58%.
For stability and reusability studies, the 50:50 ratio, which had the highest degradation, was used and three cycles were investigated. According to the results, it appears as though the 50:50 bimetallic could only be reused once. The degradation efficiency decreased from 88% to less than 40% upon increasing the cycles by more than half, thus revealing the low stability of the material. This suggests that the materials could not be recycled and that the results do not agree with several reports where bimetallic nanoparticles were suitable for recyclability [43]. To further understand the degradation species, the effect of the reactive species or radicals responsible for the degradation of the MB were investigated.

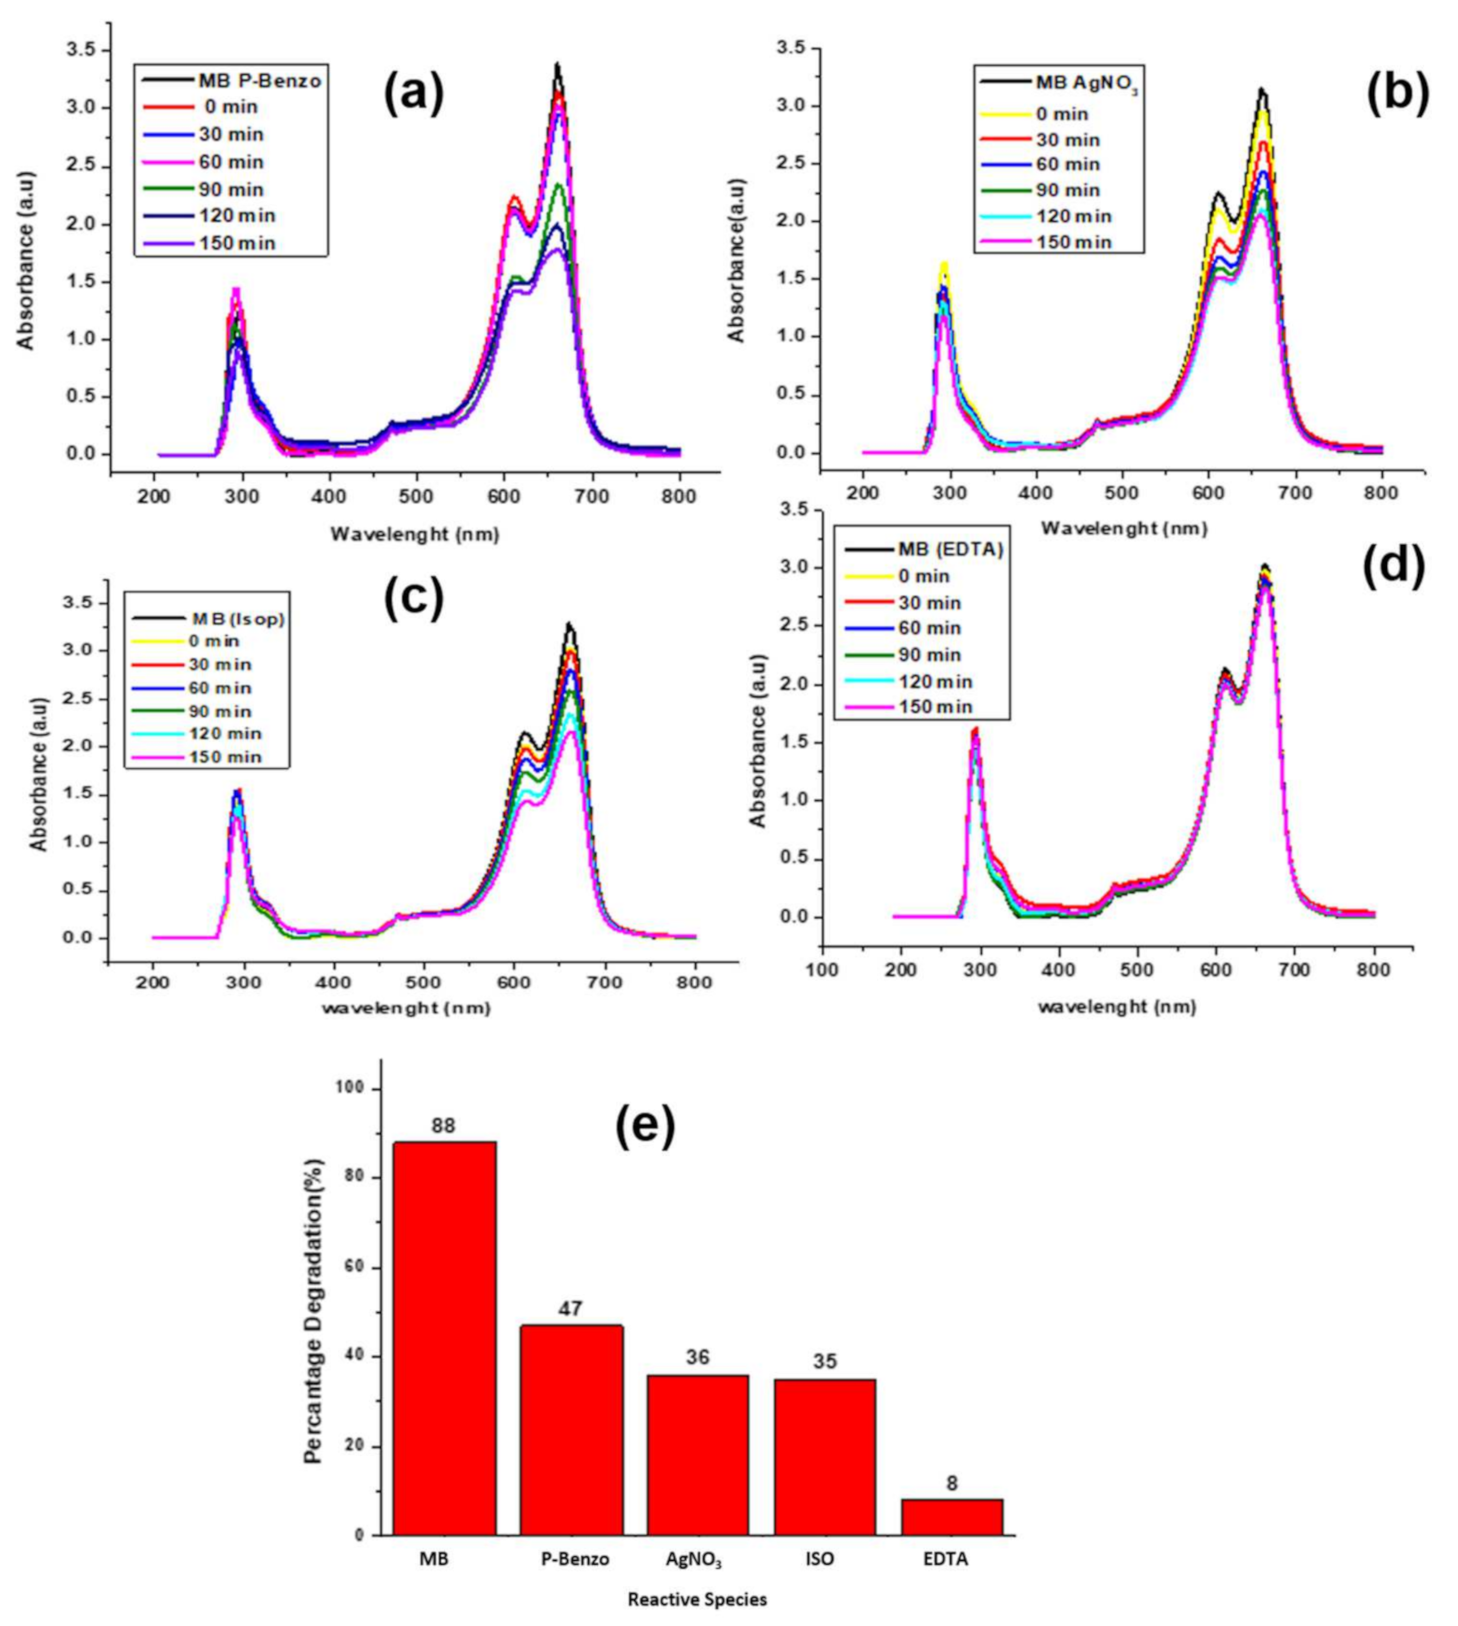
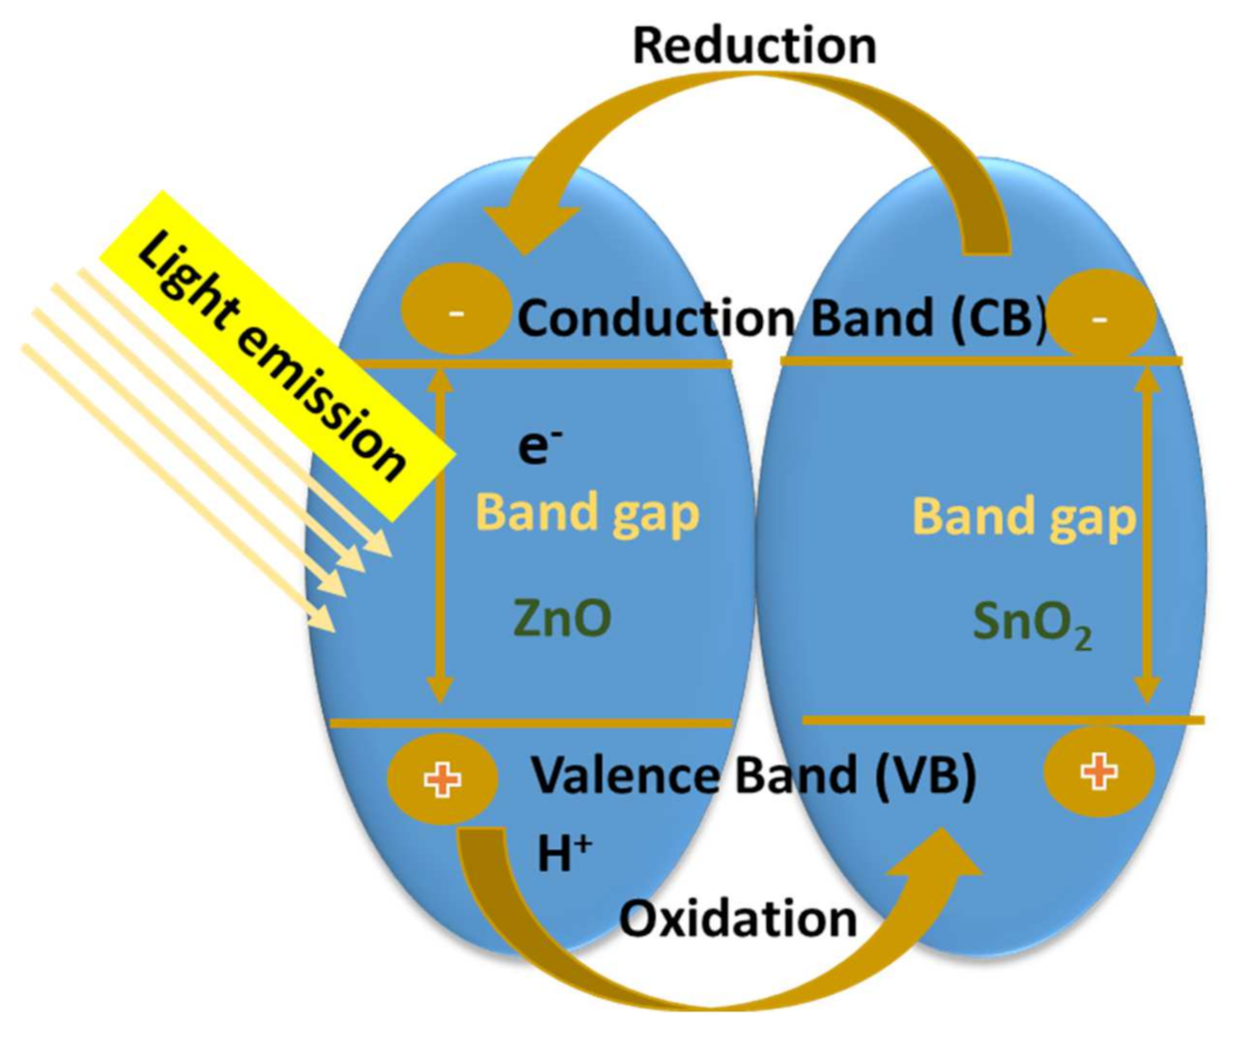
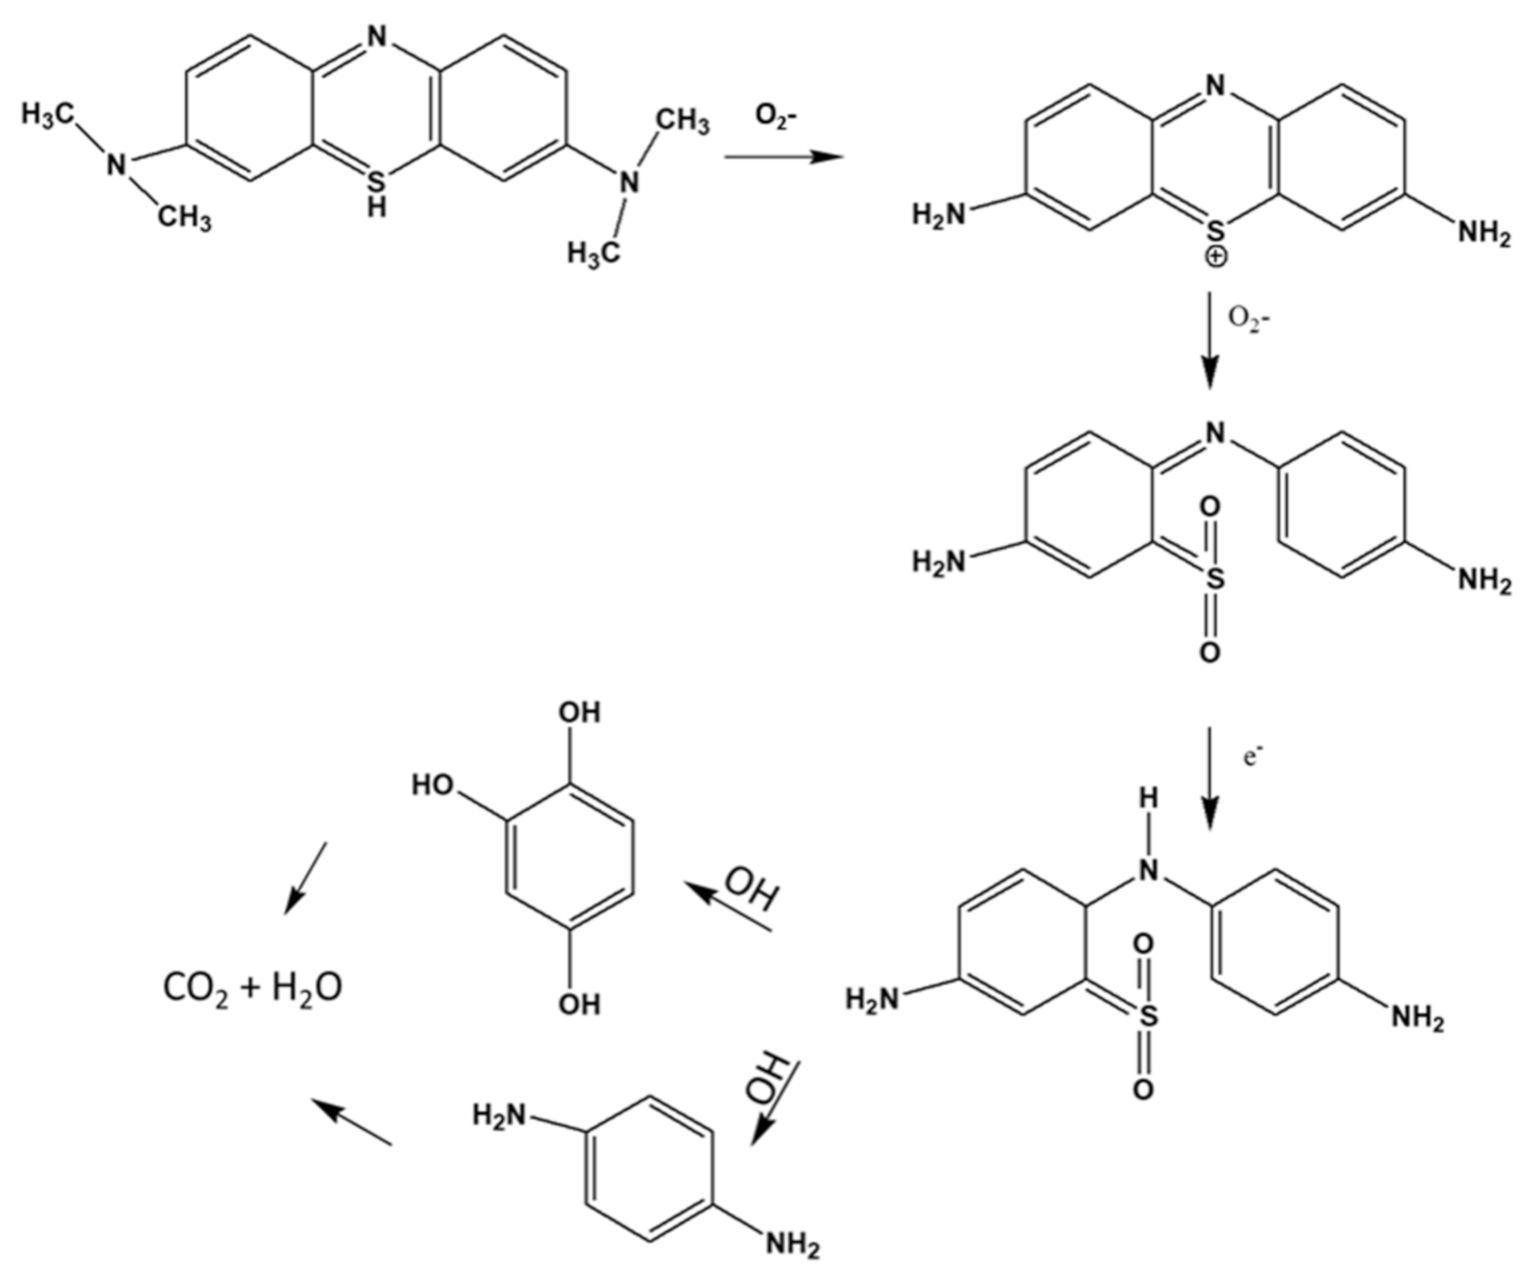
2.6. Effect of Trapping Species and Degradation Mechanism

In photocatalysis, it is important to note which radicals are responsible for the degradation of the pollutants. In this study, the effect of quenchers, such as b-benzoquinone (O2), silver nitrate (e), EDTA (h+) and isopropanol (OH), were added on the MB to examine the effect of scavengers on MB degradation. In Figure 7, it can be noted that there was an effect upon adding the quenchers on the MB solution. A degradation of 47%, 36%, 35% and 8% in the presence of O2, e, OH, and h+, respectively, was noted. This analysis shows that the holes played a major role in the degradation of MB. To process how the degradation occurs, the mechanism of degradation is explained in Figure 8 and a possible schematic is given as Scheme 1.
The mechanism of photocatalytic degradation of bimetallic nanoparticles is explained as follows. When the light is released from the light source to the solution, it gets emitted to the surface of the material. The electrons start to excite from the surface and create an electron–hole pair (h+) on the valence band (VB) [32]. The electrons migrate from SnO2 to ZnO until they form a Fermi level and until the two levels reach equilibrium [35]. The energy photon gets consumed by the SnO2, in which the bandgap is higher. The excited h+ from the VB produces hydroxyl (OH) radicals when reacting with H2O and, simultaneously, the superoxide (O2−) radicals are produced by the reduction of O2 and the electrons (e) from the conductive band (CB) [36]. These highly reactive radicals then start attacking the MB to decompose it while producing the less harmful products of CO2, H2O and minerals [37,38,39,40,41]. Comparing our study with previously published work (Table 2), it can be noted that mostly spherical nanoparticles were formed. The star (*) denotes the abbreviations for the various pollutants. The material with the smallest particle size of 3 nm was the most potent, with a degradation of 87% and 73% in 10 min. Though looking at the table, there is no real specific pattern. It is also important to note though that, for that particular material, the pollutants concentration was also the weakest with 2 ppm. Comparing our results with previously published bimetallics, it is important to note that our materials were highly comparable, in particular the 50:50 ratio material.

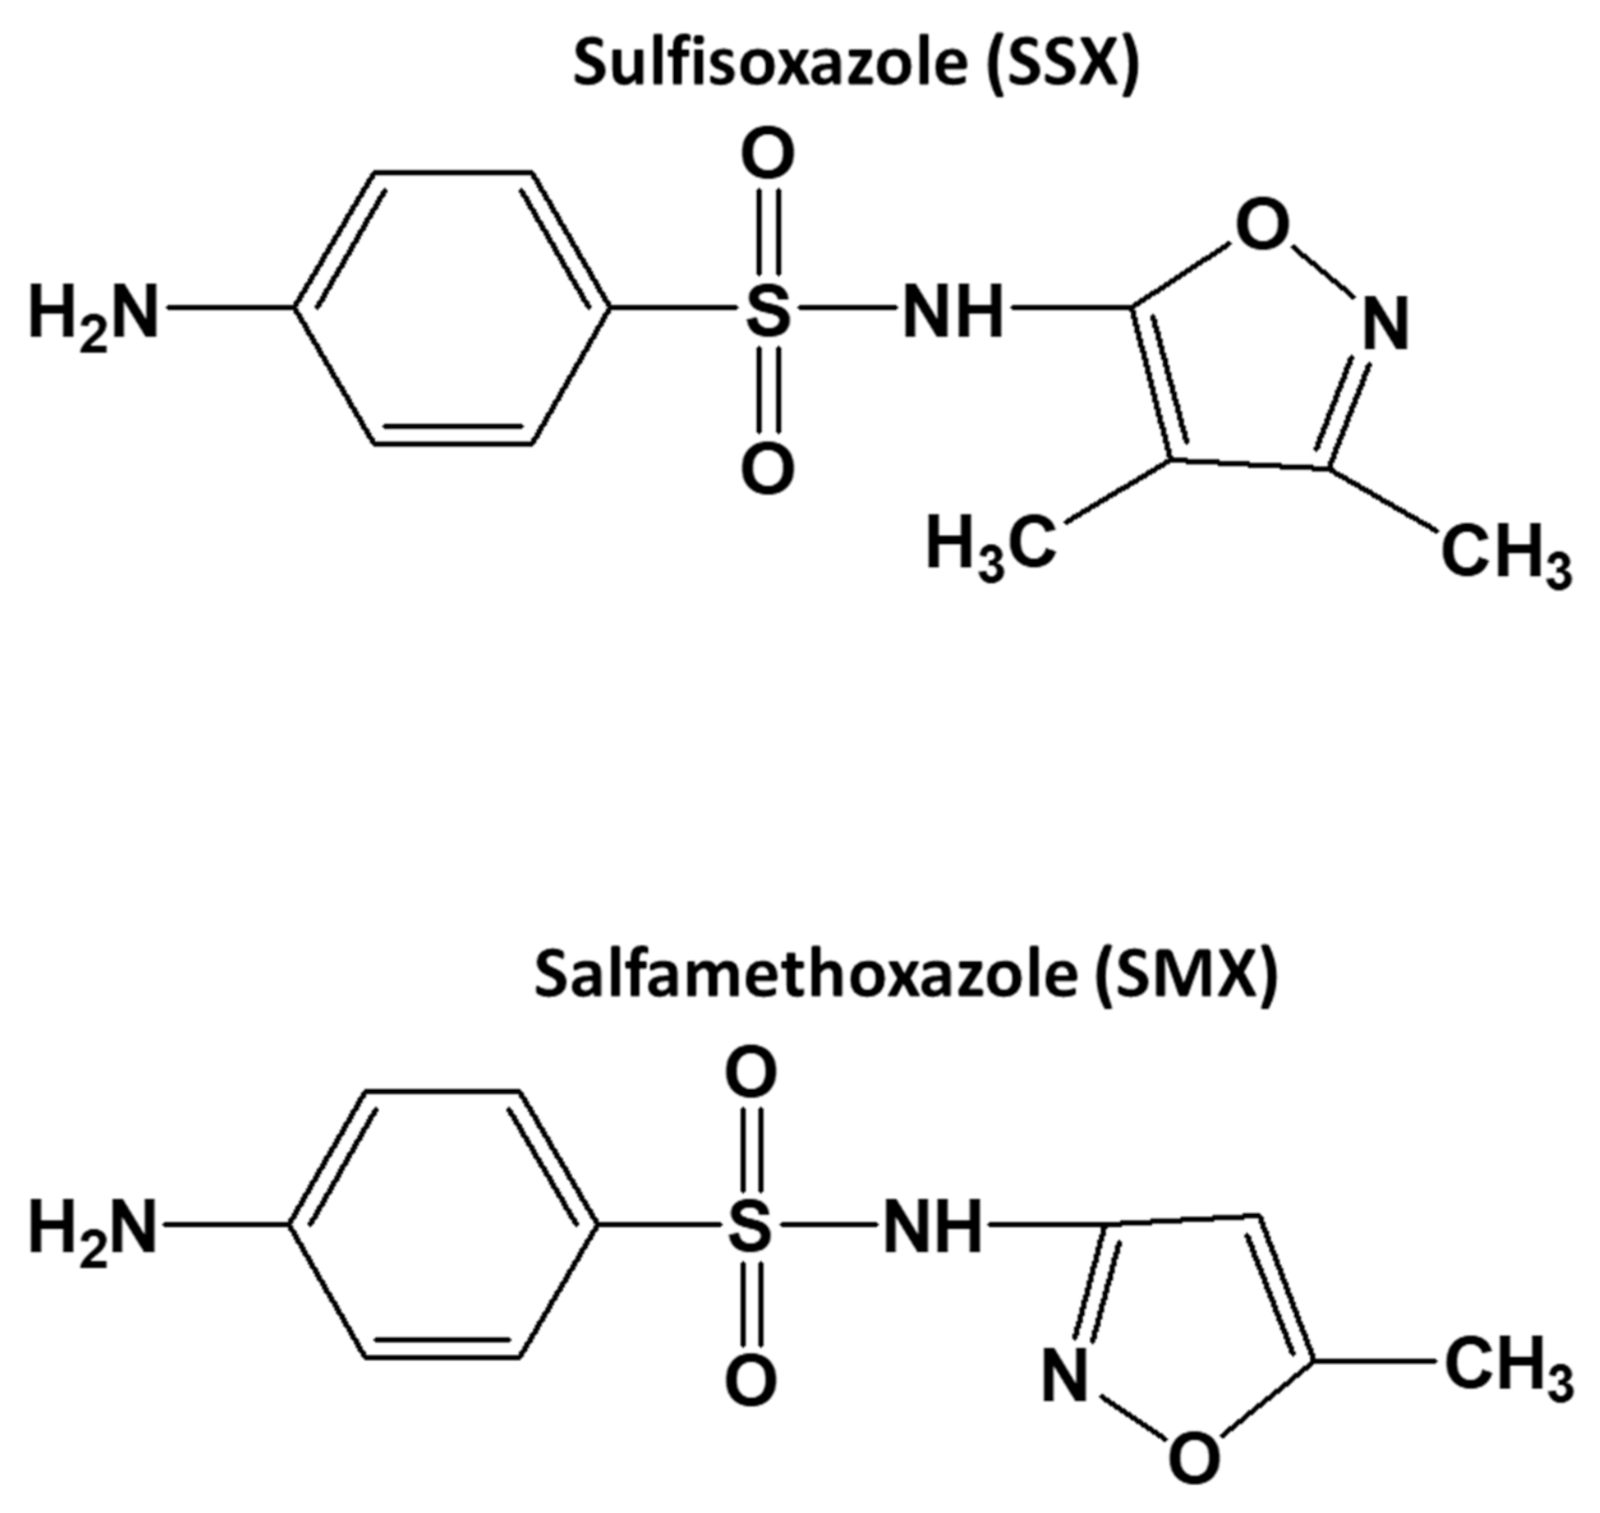
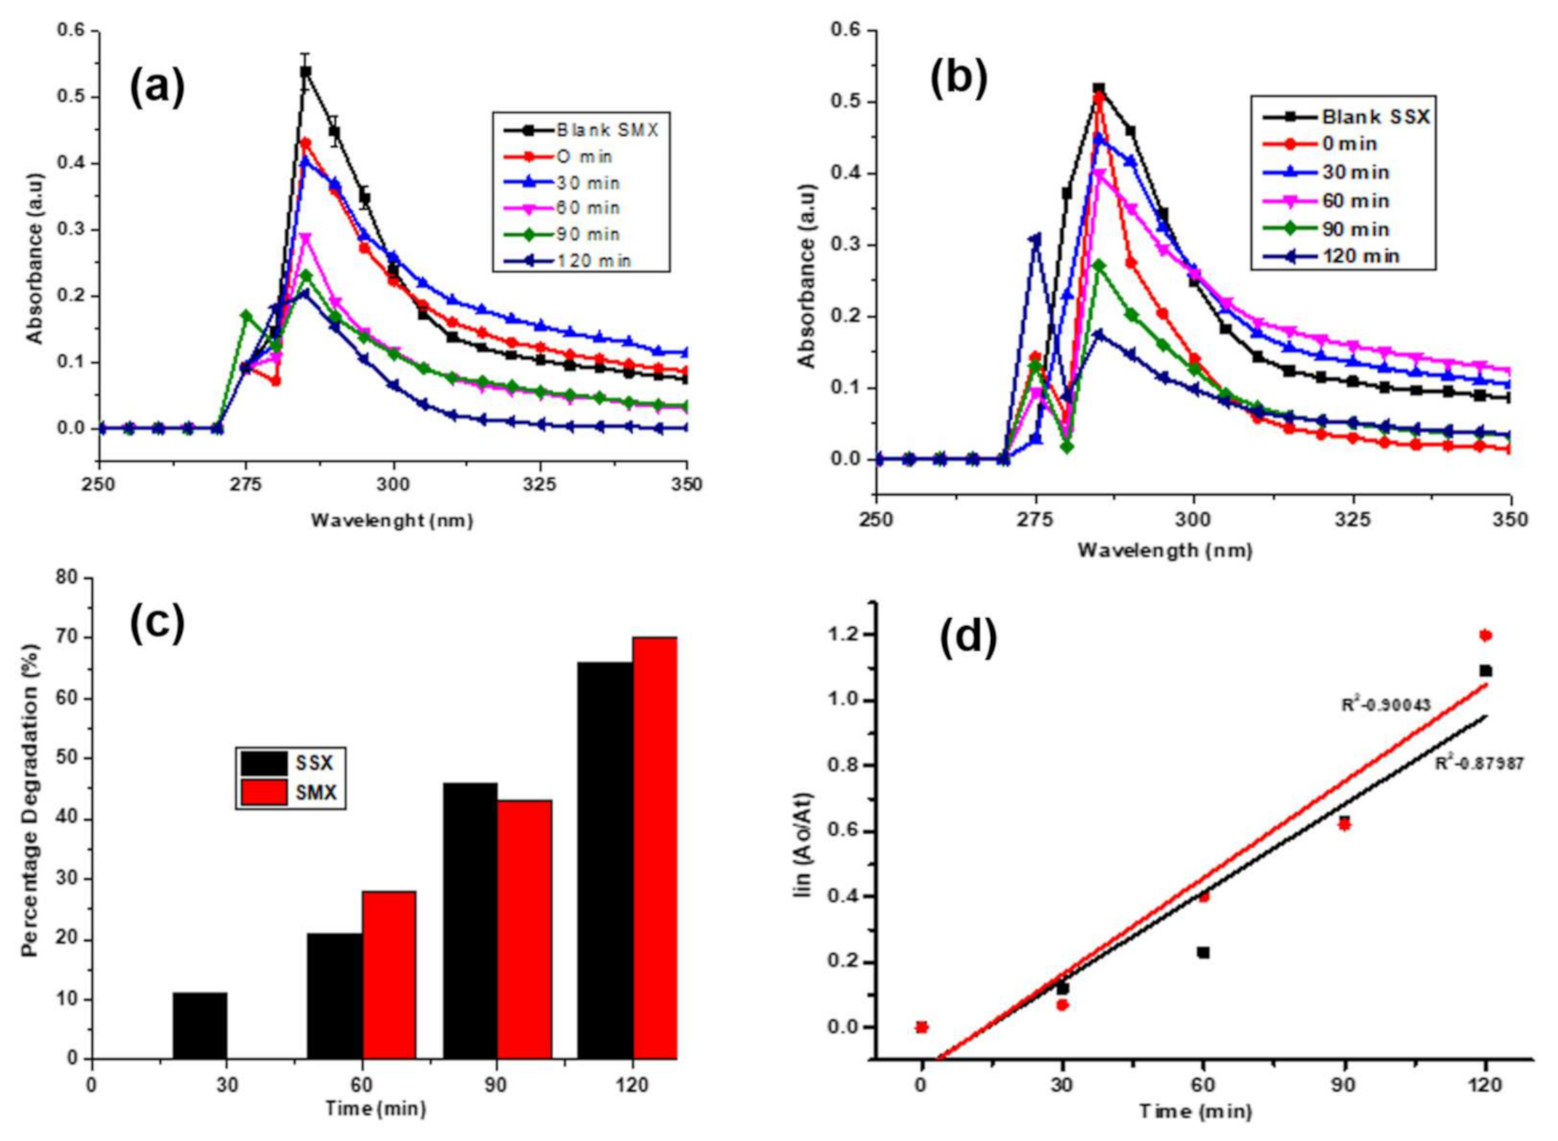
2.7. Photocatalytic Degradation of the Bimetallic Nanoparticles against SMX and SSX

The presence of antibiotics such as sulfonamides (SSX and SMX) in our water streams has led to a high bioaccumulation of these pollutants, since they are hard to remove and degrade [46,47,48]. These pharmaceuticals, when they surpass permissible levels, tend to be toxic; hence, there is need to degrade them from the system using bimetallic nanoparticles such as ZnOSnO2 nanoparticles. In this study, 50:50 ZnOSnO2 materials were used for the degradation of SSX and SMX (Figure 9a,b). A time study was conducted and, upon degradation, 66% and 70% (Figure 9c) of these pollutants were degraded after 120 min. Upon testing the kinetics (Figure 9d), none of these could fit into first order; however, SMX had a better fit of R2-0.90 compared to SSX of 0.87. From this analysis, it can be safely noted that the synthesized materials can be used for the degradation of various antibiotics, even though more studies still need to be conducted.

3. Experimental

3.1. Materials and Reagents

Sutherlandia frutescens (Sf) tea was purchased from a local store in Mankweng, Polokwane, RSA. Methylene blue (MB), sodium hydroxide (NaOH) pellets, zinc nitrate hexahydrate [Zn(NO)3. 6H2O], tin (II) chloride hydrate (SnCl2), hydrochloric acid (HCl) (37%) were all purchased from Protea Labs, South Africa. Sulfimethoxazole (SMX) was purchased from Sigma-Aldrich, RSA. Sulfisoxazole (SSX) was given by Dr. T. Leboho from the Chemistry Department, University of Limpopo, RSA.

3.2. Methodologies

3.2.1. Extraction

The S. frutescens plant extract was prepared using the tea infusion method [19]. Briefly, 500 mL of the deionized water was poured directly into a 1 L Erlenmeyer flask. The flask was heated to a boil. Thereafter, 10 g of S. frutescens was weighed and poured into the boiling water. The mixture was boiled for 15 min and the solution was left to cool for 24 h. The solution was then filtered using 70 cm diameter filter paper. The extract was kept in the refrigerator at 4 °C and used for further reaction analysis.

3.2.2. Bimetallic Synthesis

The bimetallic nanoparticles were synthesized by adding a ratio of 50:50 for both the zinc and tin salt, where 2.002 g of Zn(NO3)2 was added with 2.098 g of SnCl2 to 50 mL of Sf extract. The mixture was heated to boil for an hour, then dried in an oven at 80 °C for 24 h. The product was washed, filtered then calcined at 700 °C for 2 h. The collected product was crushed and further used for characterization. Other ratios (30:70 and 70:30) were also synthesized following the same procedure.

3.3. Characterization

The functional groups of the materials were analyzed using FTIR Bruker Alpha Platinum-ATR (BRUKER UK LIMITED, Coventry, UK) in a scan range of 500–4000 cm−1. XRD (D8, Bruker Advanced, Bruker AXS GmbH, Karlsruhe, Germany) in a scan range of 15–75 2 Theta was used to determine the crystallite size, crystallinity and phase identification of the synthesized materials. For optical analysis and for monitoring the degradation of the dye and antibiotics, UV-Vis was conducted at wavelengths specific to the pollutants, 665 (MB) and 285 nm (SSX and SMX), respectively. Brunauer–Emmet–Teller (BET, Micromeritics TRISTAR 3000 analyser, Micromeritics U.K. Ltd., Tewkesbury, UK) was used to determine the surface area and the pore size of the material. Scanning electron microscopy (SEM) (Hitachi X 650, Krefeld, Germany) coupled with energy dispersive X-ray diffraction spectroscopy (EDS) was used to analyze the morphology and elemental composition of the materials.

3.4. Photocatalytic

The effect of the nanophotocatalysts was demonstrated by the photodegradation of MB under the 300 W lamp light source. Following and modifying the methods reported by Munyai et al. [18], a 20 mg mL−1 concentration of MB dye pollutant was prepared and a 60 mg of the dosage was added in a 250 mL solution in a 500 mL beaker. Prior to UV irradiation, the solution containing the nanophotocatalysts was stirred continuously for about an hour in the dark to reach an adsorption–desorption equilibrium so that the degradation efficiency could be influenced by photodegradation. After reaching the equilibrium, the system was subjected to UV irradiation using a 300 W light source. The distance between the light source and solution surface was kept constant at about 5 cm throughout the photocatalytic experiments. The samples were irradiated for 30 min and =analysis for the degree of degradation was taken at 15 min intervals. To calculate the % degradation for each experiment, the formula denoted as Equation (1) was used.
(%) Degradation = (Ao − At/A0) × 100
where A0 is the initial absorbance and At is the final absorbance. The photocatalytic reaction was calculated using this formula:
In (Ao/At) = kt
where Ao is the initial absorbance, At is the final absorbance, k is the degradation kinetic of the photocatalyst and t is the irradiation time.
Similarly, with the organic dyes, the pharmaceutical pollutants SSX and SMX were degraded following the same method as above. However, the operating parameters were different and were recorded as follows: natural pH, 60 mg dosage, 10 ppm concentration, time duration of 120 min and a 300 W lamp was used. The decaying and the degradation of the pollutant was recorded at 285 nm.

3.5. Reusability and Trapping Studies

Reusability studies were conducted for 4 cycles under the same conditions as the actual degradation run. For each run, the sample was filtered after the degradation, washed and dried and reused. Moreover, the trapping of active species experiments was conducted using p-benzoquinone (0.1 M), propan-2-ol (0.1 M), silver nitrate (0.1 M) and EDTA (0.1 M) to evaluate the effect of O2, OH radicals, e and h+, respectively. For these experiments, the blank did not contain any of these trappers; then, for the trapping studies, 2 mL of 0.1 M of the scavengers as noted were added on the MB solution.

4. Conclusions

The three bimetallic ratios were successfully synthesized using the Sf plant extract under the green synthesis route. The formation and the morphological analysis of these materials were confirmed by FTIR, XRD, SEM, BET and EDS. Two heterostructures of spherical and tubular structures were obtained and confirmed from all the synthesized bimetallic ratios. The particle size distribution of the bimetallic ratios of 30:70, 50:50 and 70:30 was in agreement with the XRD analysis. Amongst all the ratios, 50:50 gave the best MB dye degradation of 88% at 150 min. The reusability study for the best ratio (50:50) done for three cycles showed that the material could only be reused once. Furthermore, holes were found to be the species responsible for the degradation of MB. Lastly, these materials were also potent against antibiotics, in particular against SMX. Thus, it can be concluded that environmentally safe materials can be used for the degradation of various pollutants.

Supplementary Materials

The following are available online at https://www.mdpi.com/article/10.3390/catal12030334/s1, Figure S1: XRD analysis of Sf ZnO and XRD analysis of Sf SnO2 nanoparticles; Figure S2: (a–f): Morphological analysis of the bimetallic nanoparticles at different resolutions, where (a) 30:70, (c) 50:50 and (e) 70:30 loadings at 100 nm whereas (b), (d) and (f) is at 50 nm, (g) particle size distribution; Figure S3: The images that exhibit the photocatalytic degradation of MB at different time intervals from 0–150 min.

Author Contributions

In this article, L.M.M.-G. performed experiments, analyzed and wrote the article, S.M. performed the photocatalytic degradation of antibiotic experiments and N.C.H.-M. wrote, analyzed, corrected, edited and oversaw the article. All authors have read and agreed to the published version of the manuscript.

Funding

This work has been Funded by the DSI NRF CoE—Centre of Excellence in Strong Materials and the THUTHUKA grant (UID: TTK-117999).

Data Availability Statement

The data generated from this study will be made available upon request.

Acknowledgments

We would like to send an appreciation to the University of Limpopo (Research Office) for funding (niche area—Mahlaule Glory) in this project, and also the DSI/NRF Centre of Excellence in Strong Materials, South Africa. Lastly, the Department of Chemistry in the School of Physical and Mineral Science, and under the Faculty of Science and Agriculture, for their continued support and research facilities.

Conflicts of Interest

The authors declare no conflict of interest.

References

  1. Xu, L.; Du, L.-S.; Wang, C.; Xu, W. Nanofiltration coupled with electrolytic oxidation in treating simulated dye wastewater. J. Memb. Sci. 2012, 409, 329–334. [Google Scholar] [CrossRef]
  2. Al-Hamdi, A.M.; Rinner, U.; Sillanpää, M. Tin dioxide as a photocatalyst for water treatment: A review. Process Saf. Environ. Prot. 2017, 107, 190–205. [Google Scholar] [CrossRef]
  3. Jyoti, K.; Singh, A. Green synthesis of nanostructured silver particles and their catalytic application in dye degradation. J. Genet. Eng. Biotechnol. 2016, 14, 311–317. [Google Scholar] [CrossRef] [PubMed] [Green Version]
  4. Lu, F.; Astruc, D. Nanomaterials for removal of toxic elements from water. Coord. Chem. Rev. 2018, 356, 147–164. [Google Scholar] [CrossRef]
  5. Ong, C.B.; Ng, L.Y.; Mohammad, A.W. A review of ZnO nanoparticles as solar photocatalysts: Synthesis, mechanisms and applications. Renew. Sustain. Energy Rev. 2018, 81, 536–551. [Google Scholar] [CrossRef]
  6. Mahlaule-Glory, L.M.; Mbita, Z.; Mathipa, M.M.; Tetana, Z.N.; Hintsho-Mbita, N.C. Biological therapeutics of AgO nanoparticles against pathogenic bacteria and A549 lung cancer cells. Mater. Res. Express 2019, 6, 105402. [Google Scholar] [CrossRef]
  7. Bilińska, L.; Blus, K.; Gmurek, M.; Ledakowicz, S. Coupling of electrocoagulation and ozone treatment for textile wastewater reuse. Chem. Eng. J. 2019, 358, 992–1001. [Google Scholar] [CrossRef]
  8. Honarmand, M.; Golmohammadi, M.; Naeimi, A. Biosynthesis of tin oxide (SnO2) nanoparticles using jujube fruit for photocatalytic degradation of organic dyes. Adv. Powder Technol. 2019, 30, 1551–1557. [Google Scholar] [CrossRef]
  9. Davar, F.; Majedi, A.; Mirzaei, A. Green synthesis of ZnO nanoparticles and its application in the degradation of some dyes. J. Am. Ceram. Soc. 2015, 98, 1739–1746. [Google Scholar] [CrossRef]
  10. Bhuyan, T.; Mishra, K.; Khanuja, M.; Prasad, R.; Varma, A. Biosynthesis of zinc oxide nanoparticles from Azadirachta indica for antibacterial and photocatalytic applications. Mater. Sci. Semicond. Process. 2015, 32, 55–61. [Google Scholar] [CrossRef]
  11. Rana, N.; Chand, S.; Gathania, A.K. Green synthesis of zinc oxide nano-sized spherical particles using Terminalia chebula fruits extract for their photocatalytic applications. Int. Nano Lett. 2016, 6, 91–98. [Google Scholar] [CrossRef] [Green Version]
  12. Xiang, Y.; Wu, H.; Li, L.; Ren, M.; Qie, H.; Lin, A. A review of distribution and risk of pharmaceuticals and personal care products in the aquatic environment in China. Ecotoxicol. Environ. Saf. 2021, 213, 112044. [Google Scholar] [CrossRef] [PubMed]
  13. Wang, A.; Chen, Y.; Zheng, Z.; Wang, H.; Li, X.; Yang, Z.; Qiu, R.; Yan, K. In situ N-doped carbon-coated mulberry-like cobalt manganese oxide boosting for visible light driving photocatalytic degradation of pharmaceutical pollutants. Chem. Eng. J. 2021, 411, 128497. [Google Scholar] [CrossRef]
  14. Wang, W.; Tian, J.; Zhu, Z.; Zhu, C.; Liu, B.; Hu, C. Insight into quinolones and sulfonamides degradation, intermediate product identification and decomposition pathways with the assistance of Bi2MoO6/Bi2WO6/MWCNTs photocatalyst. Process Saf. Environ. Prot. 2021, 147, 527–546. [Google Scholar] [CrossRef]
  15. Jahdi, M.; Mishra, S.B.; Nxumalo, E.N.; Mhlanga, S.D.; Mishra, A.K. Smart pathways for the photocatalytic degradation of sulfamethoxazole drug using F-Pd co-doped TiO2 nanocomposites. Appl. Catal. B Environ. 2020, 267, 118716. [Google Scholar] [CrossRef]
  16. Zahid, M.; Ahmad, H.; Drioli, E.; Rehan, Z.A.; Rashid, A.; Akram, S.; Khalid, T. Role of polymeric nanocomposite membranes for the removal of textile dyes from wastewater. In Aquananotechnology; Micro and Nano Technologies, Applications of nanomaterials for water purification; Elsevier: Amsterdam, The Netherlands, 2021; pp. 91–103. [Google Scholar] [CrossRef]
  17. Wu, S.; Yan, P.; Yang, W.; Zhou, J.; Wang, H.; Che, L.; Zhu, P. ZnCl2 enabled synthesis of activated carbons from ion-exchange resin for efficient removal of Cu2+ ions from water via capacitive deionization. Chemosphere 2021, 264, 128557. [Google Scholar] [CrossRef]
  18. Munyai, S.; Mahlaule-Glory, M.; Hintsho-Mbita, N.C. Green synthesis of Zinc Sulphide (ZnS) nanostructures using S. Frutescence plant extract for photocatalytic degradation of dyes and antibiotics. Mater. Res. Express 2022, 9, 015001. [Google Scholar] [CrossRef]
  19. Munyai, S.; Tetana, Z.N.; Mathipa, M.M.; Ntsendwana, B.N.; Hintsho-Mbita, N.C. Green synthesis of Cadmium Sulphide nanoparticles for the photodegradation of Malachite green dye, Sulfisoxazole and removal of bacteria. Optik 2021, 247, 167851. [Google Scholar] [CrossRef]
  20. Mallikarjunaswamy, C.; Ranganatha, V.L.; Ramu, R.; Nagaraju, G. Facile microwave-assisted green synthesis of ZnO nanoparticles: Application to photodegradation, antibacterial and antioxidant. J. Mater. Sci. Mater. Electron. 2020, 31, 1004–1021. [Google Scholar] [CrossRef]
  21. Munyai, S.; Hintsho-Mbita, N.C. Green derived metal sulphides as photocatalysts for waste water treatment. A review. Curr. Res. Green Sustain. Chem. 2021, 4, 100163. [Google Scholar] [CrossRef]
  22. Somorjai, G.A.; Park, J.Y. Colloid Science of Metal Nanoparticle Catalysts in 2D and 3D Structures. Challenges of Nucleation, Growth, Composition, Particle Shape, Size Control and Their Influence on Activity and Selectivity. Top. Catal. 2008, 49, 126–135. [Google Scholar] [CrossRef]
  23. Hamrouni, A.; Moussa, N.; Parrino, F.; Di Paola, A.; Houas, A.; Palmisano, L. Sol–gel synthesis and photocatalytic activity of ZnO–SnO2 nanocomposites. J. Mol. Catal. A Chem. 2014, 390, 133–141. [Google Scholar] [CrossRef] [Green Version]
  24. Sehar, S.; Naz, I.; Perveen, I.; Ahmed, S. Superior dye degradation using SnO2-ZnO hybrid heterostructure catalysts. Korean J. Chem. Eng. 2019, 36, 56–62. [Google Scholar] [CrossRef]
  25. Lamba, R.; Umar, A.; Mehta, S.K.; Kumar Kansal, S. Well-crystalline porous ZnO-SnO2 nanosheets: An effective visible-light driven photocatalyst and highly sensitive smart sensor material. Talanta. 2015, 131, 490–498. [Google Scholar] [CrossRef]
  26. Borhade, A.V.; Baste, Y.R. Study of photocatalytic asset of the ZnSnO3 synthesized by green chemistry. Arab. J. Chem. 2017, 10, S404–S411. [Google Scholar] [CrossRef] [Green Version]
  27. Rashad, M.M.; Ismail, A.A.; Kandil, A.T.; Osama, I.; Ibrahim, I.A. Photocatalytic decomposition of dyes using ZnO doped SnO2 nanoparticles prepared by solvothermal method. Arab. J. Chem. 2014, 7, 71–77. [Google Scholar] [CrossRef] [Green Version]
  28. Giusti, G.; Consonni, V.; Puyoo, E.; Bellet, D. High performance ZnO-SnO2:F nanocomposite transparent electrodes for energy applications. ACS Appl. Mater. Interfaces 2014, 6, 14096–14107. [Google Scholar] [CrossRef]
  29. Mahmoud, S.A.; Fouad, O.A. Synthesis and application of zinc/tin oxide nanostructures in photocatalysis and dye sensitized solar cells. Sol. Energy Mater. Sol. Cells 2015, 136, 38–43. [Google Scholar] [CrossRef]
  30. Rathnasamy, R.; Thangasamy, P.; Thangamuthu, R.; Sampath, S.; Alagan, V. Green synthesis of ZnO nanoparticles using Carica papaya leaf extracts for photocatalytic and photovoltaic applications. J. Mater. Sci. Mater. Electron. 2017, 28, 10374–10381. [Google Scholar] [CrossRef]
  31. Murali, S.; Kumar, S.; Koh, J.; Seena, S.; Singh, P.; Ramalho, A.; Sobral, A.J.F.N.; Mututu, V.; Sunitha, A.K.; Thomas, R.; et al. Bio-based chitosan/gelatin/Ag@ZnO bionanocomposites: Synthesis and mechanical and antibacterial properties. Cellulose 2019, 14, 3752–3763. [Google Scholar] [CrossRef]
  32. Singh, A.K.; Pal, P.; Gupta, V.; Yadav, T.P.; Gupta, V.; Singh, S.P. Green synthesis, characterization and antimicrobial activity of zinc oxide quantum dots using Eclipta alba. Mater. Chem. Phys. 2018, 203, 40–48. [Google Scholar] [CrossRef]
  33. Zare, M.; Namratha, K.; Thakur, M.S.; Byrappa, K. Biocompatibility assessment and photocatalytic activity of bio-hydrothermal synthesis of ZnO nanoparticles by Thymus vulgaris leaf extract. Mater. Res. Bull. 2019, 109, 49–59. [Google Scholar] [CrossRef]
  34. Santhoshkumar, P.; Prasanna, K.; Jo, Y.N.; Kang, S.H.; Joe, Y.C.; Lee, C.W. Synthesis of highly crystalline octahedron 3D-Zn2 SnO4 as an advanced high-performance anode material for lithium ion batteries. Appl. Surf. Sci. 2018, 449, 514–520. [Google Scholar] [CrossRef]
  35. Mao, W.; Li, Z.; Bao, K.; Zhang, K.; Wang, W.; Li, B. Nanowire-based zinc-doped tin oxide microtubes for enhanced solar energy utilization efficiency. Ceram. Int. 2017, 43, 6822–6830. [Google Scholar] [CrossRef]
  36. Raja, A.; Ashokkumar, S.; Marthandam, R.P.; Jayachandiran, J.; Khatiwada, C.P.; Kaviyarasu, K.; Raman, R.G.; Swaminathan, M. Eco-friendly preparation of zinc oxide nanoparticles using Tabernaemontana divaricata and its photocatalytic and antimicrobial activity. J. Photochem. Photobiol. B Biol. 2018, 181, 53–58. [Google Scholar] [CrossRef]
  37. Ramesh, M.; Anbuvannan, M.; Viruthagiri, G. Green synthesis of ZnO nanoparticles using Solanum nigrum leaf extract and their antibacterial activity. Spectrochim. Acta-Part A Mol. Biomol. Spectrosc. 2015, 136, 864–870. [Google Scholar] [CrossRef] [PubMed]
  38. Mahlaule-Glory, L.M.; Mbita, Z.; Ntsendwana, B.; Mathipa, M.M.; Mketo, N.; Hintsho-Mbita, N.C. ZnO nanoparticles via Sutherlandia frutescens plant extract: Physical and biological properties. Mater. Res. Express 2019, 6, 085006. [Google Scholar] [CrossRef]
  39. Mahdavi, R.; Talesh, S.S.A. Sol-gel synthesis, structural and enhanced photocatalytic performance of Al doped ZnO nanoparticles. Adv. Powder Technol. 2017, 28, 1418–1425. [Google Scholar] [CrossRef]
  40. Makofane, A.; Motaung, D.E.; Hintsho-Mbita, N.C. Photocatalytic degradation of methylene blue and sulfisoxazole from water using biosynthesized zinc ferrite nanoparticles. Ceram. Int. 2021, 47, 22615–22626. [Google Scholar] [CrossRef]
  41. Fuku, X.; Matinise, N.; Masikini, M.; Kasinathan, K.; Maaza, M. An electrochemically active green synthesized polycrystalline NiO/MgO catalyst: Use in photo-catalytic applications. Mater. Res. Bull. 2018, 97, 457–465. [Google Scholar] [CrossRef] [Green Version]
  42. Kumar, C.R.R.; Betageri, V.S.; Nagaraju, G.; Pujar, G.H.; Onkarappa, H.S.; Latha, M.S. One-pot green synthesis of ZnO-CuO nanocomposite and their enhanced photocatalytic and antibacterial activity. Adv. Nat. Sci. Nanosci. Nanotechnol. 2020, 11, 015009. [Google Scholar] [CrossRef]
  43. Manjari, G.; Saran, S.; Radhakrishanan, S.; Rameshkumar, P.; Pandikumar, A.; Devipriya, S.P. Facile green synthesis of Ag–Cu decorated ZnO nanocomposite for effective removal of toxic organic compounds and an efficient detection of nitrite ions. J. Environ. Manag. 2020, 262, 110282. [Google Scholar] [CrossRef]
  44. Sorbiun, M.; Mehr, E.S.; Ramazani, A.; Fardood, S.T. Biosynthesis of Ag, ZnO and bimetallic Ag/ZnO alloy nanoparticles by aqueous extract of oak fruit hull (Jaft) and investigation of photocatalytic activity of ZnO and bimetallic Ag/ZnO for degradation of basic violet 3 dye. J. Mater. Sci. Mater. Electron. 2018, 29, 2806–2814. [Google Scholar] [CrossRef]
  45. Ebrahimzadeh, M.A.; Mortazavi-Derazkola, S.; Zazouli, M.A. Eco-friendly green synthesis of novel magnetic Fe3O4/SiO2/ZnO-Pr6O11 nanocomposites for photocatalytic degradation of organic pollutant. J. Rare Earths 2020, 38, 13–20. [Google Scholar] [CrossRef]
  46. Kututsova, A.; Dontsova, T.; Kwapinski, W. Application of TiO2-Based Photocatalysts to Antibiotics Degradation: Cases of Sulfamethoxazole, Trimethoprim and Ciprofloxacin. Catalysts 2021, 11, 728. [Google Scholar] [CrossRef]
  47. Teye, G.K.; Huang, j.; Li, J.; Li, K.; Chen, K.; Darkwah, W.K. Photocatalytic Degradation of Sulfamethoxazole, Nitenpyram and Tetracycline by Composites of Core Shell g-C3N4@ZnO, and ZnO Defects in Aqueous Phase. Nanomaterials 2021, 11, 2609. [Google Scholar] [CrossRef] [PubMed]
  48. Fagiee, M.A. Plant-Mediated Biosynthesis and Photocatalysis Activities of Zinc Oxide Nanoparticles: A Prospect towards Dyes Mineralization. Curr. Pharm. Des. 2021, 2021, 6629180. [Google Scholar] [CrossRef]
Figure 1. Molecular structures of SSX and SMX.
Catalysts 12 00334 g001
Figure 2. FTIR analysis of (a) Sf plant extract, (b) Sf ZnO, (c) Sf SnO2, bimetallic nanoparticles at different loadings of (d) 30:70, (e) 50:50 and (f) 70:30.
Catalysts 12 00334 g002
Figure 3. XRD analysis of the bimetallic nanoparticles at various loadings.
Catalysts 12 00334 g003
Figure 4. The SEM analysis of the bimetallic Sf ZnOSnO2 nanomaterial at (a) 30:70, (b) 50:50, (c) 70:30 ratios and (d) the mapping analysis.
Catalysts 12 00334 g004
Figure 5. The adsorption–desorption isotherm, the pore size plot and the surface area plot of the materials of (a) SnO2, (b) ZnO, (c) 30:70, (d) 50:50 (e) 70:30 and (f) Linear plot relative to pressure of surface area.
Catalysts 12 00334 g005
Figure 6. Photocatalytic degradation of MB dye.
Catalysts 12 00334 g006
Figure 7. Quenching of active species using (a) p-benzo, (b) silver nitrate, (c) isopropanol, (d) EDTA and (e) percentage degradation in the presence of reactive species.
Catalysts 12 00334 g007
Figure 8. Mechanism of degradation for ZnOSnO2.
Catalysts 12 00334 g008
Scheme 1. Degradation pathway of MB.
Catalysts 12 00334 sch001
Figure 9. (a,b) Absorbance plots of SSX and SMX, respectively, (c) percentage degradation of the antibiotics and 9 (d) kinetic plots of SSX and SMX.
Catalysts 12 00334 g009
Table 1. The average surface area, pore volume and the pore size of the materials.
SampleSurface Area (m2/g)Pore Volume (mL/g)Pore Size (nm)
SnO23.490810.0216.3856
ZnO3.048710.0454.412
30%4.892910.0525.09645
50%6.664610.0630.8147
70%3.699810.0434.5985
Table 2. Comparison of previously published green derived materials for dye degradation.
PrecursorPlantShapeSize (nm)Poll *Conc% RemovalTime (min)Refs
NiO/MgOPurica granatumSphere3 nmMB
MO
2 ppm87
73
10[41]
ZnO-CuOCalotropis giganteanSpheres10–40 nmMB5 ppm98105[42]
Ag-Cu ZnOAcacia caesiaSphere-RB
CR
10 mM9957[43]
Ag/ZnOOakSphere19 nmBV3100 µM94120[44]
Fe3O4/SiO2/ZnOFructoseQuasi-sphere38 nmCR3 ppm8580[45]
ZnO-SnO2Sutherlendia
Frutescens
Sphers5–60 nmMB20 ppm88120This
Study
* MB = methylene blue; * MO = methylene orange; * BV3 = basic violet 3; * CR = Congo red; * RB = rhodamine blue.
Publisher’s Note: MDPI stays neutral with regard to jurisdictional claims in published maps and institutional affiliations.

