Article

Insights into a New Formation Mechanism of Robust Cu/SiO2 Catalysts for Low-Temperature Dimethyl Oxalate Hydrogenation Induced by a Chelating Ligand of EDTA

1
College of Chemical Engineering, Fuzhou University, Fuzhou 350116, China
2
Key Laboratory of Coal to Ethylene Glycol and Its Related Technology, Fujian Institute of Research on the Structure of Matter, Chinese Academy of Sciences, Fuzhou 350002, China
3
Henan High-Tech Industrial Company Limited, Zhengzhou 450002, China
4
Key Laboratory of Jiangxi Province for Environment and Energy Catalysis, College of Chemistry, Nanchang University, Nanchang 330031, China
5
University of Chinese Academy of Sciences, Beijing 100049, China
6
College of Chemistry, Fuzhou University, Fuzhou 350108, China
*
Author to whom correspondence should be addressed.
Catalysts 2022, 12(3), 320; https://doi.org/10.3390/catal12030320
Submission received: 16 February 2022 / Revised: 8 March 2022 / Accepted: 9 March 2022 / Published: 11 March 2022

Abstract

:
The Cu/SiO2 catalyst has been widely used in dimethyl oxalate (DMO) hydrogenation due to its low cost and high efficiency. However, the reaction temperature of DMO hydrogenation is higher than the Hüttig temperature of Cu, and the smaller Cu particles are easier to agglomerate. Therefore, there is much interest in constructing a catalyst with a small particle size and strong stability. In the present work, the effect of introducing EDTA on Cu/SiO2 catalysts is systematically investigated. It not only was beneficial to form smaller copper nanoparticles (CuNPs) but also to enhance the stability of Cu species by introducing a suitable amount of EDTA. Furthermore, the surface Cu species were more evenly dispersed, and the number of active sites was increased with the introduction of EDTA; subsequently, the synergistic effect between Cu+ and Cu0 was enhanced. The best performance of 0.08E-Cu/SiO2 had been achieved in the DMO hydrogenation to ethylene glycol (EG), and the DMO conversion and EG selectivity reached 99.9% and 97.7%, respectively. Above all, the 0.08E-Cu/SiO2 catalyst exhibited a high level of stability during the 1200 h life test at 180 °C.

Graphical Abstract

1. Introduction

Ethylene glycol (EG) is an important organic chemical raw material, which is widely used in the production of antifreeze, polyester fiber, explosives, lubricants, plasticizers, surfactants and so on [1]. The majority of its consumption is in the field of polyester fiber [2,3,4]. The traditional route of ethylene glycol production is the petroleum route, which is subject to large fluctuations in oil prices and high energy consumption, so other emerging routes have appeared [5]. The technology of coal to ethylene glycol with coal (or natural gas) as the raw material has attracted great attention because of its advantages including short process, low cost and abundant raw material sources. Generally speaking, the technology of coal to ethylene glycol is to convert coal to syngas; then the oxalic ester obtained through carbonylation of CO is used to synthesize ethylene glycol by catalytic hydrogenation of the oxalic ester [4]. The hydrogenation of dimethyl oxalate (DMO) to ethylene glycol is a key step in this technology.
The Cu/SiO2 catalyst has been widely studied for the hydrogenation of ester due to its low cost and high activity [6,7,8,9,10]. It is also a common catalyst for hydrogenation of DMO to EG [11,12]. The Cu/SiO2 catalyst shows high activity in the DMO catalytic hydrogenation. Unfortunately, it has the disadvantages of poor stability and a short lifetime, which severely limits its practical application. Hence, more recent research mainly focuses on further improving catalytic hydrogenation performance, enhancing stability and prolonging service life. It should be mentioned that for the Cu/SiO2 catalyst the size and dispersion of copper particles as well as the synergistic mechanism of Cu+ and Cu0 determine the performance of the Cu/SiO2 catalyst. Yin et al. [13] reported that the introduction of nickel was in favor of increasing copper dispersion. Zhu et al. [14] studied the influence of copper particle size and distribution on catalyst performance by means of different preparation methods. Toupance et al. [15] revealed in detail the influence of different preparation conditions and thermal pretreatment on the copper particle size of the Cu/SiO2 catalyst. Chen et al. [16] explored the effect of different ammonia evaporation temperatures on the Cu/SiO2 catalyst and proposed that the best catalytic activity of the catalyst was owing to the synergy between Cu0 and Cu+. It was generally believed that the copper particles with a smaller size and higher dispersion are more conducive to improving the activity of catalysts. However, the smaller Cu particles are easier to agglomerate in the reaction process on account of the Hüttig temperature of Cu, which is lower than the reaction temperature of DMO hydrogenation, leading to poor stability and short life of the catalyst. [17] How to improve the stability of the surface Cu0 species is the key to building a long-lived, copper-based catalyst. In our previous work [12,18,19], the dextrin, β-cyclodextrin and mannitol were introduced into the Cu/SiO2 catalyst successfully by the ammonia evaporation (AE) method to improve the performance of the Cu/SiO2 catalyst, but the optimal DMO hydrogenation temperature was still higher than 190 °C. If the optimum hydrogenation temperature could be further reduced, it would be more beneficial to improve the surface Cu0 species stability and prolong the catalyst life.
Ethylenediaminetetraacetic acid (EDTA) is a strong chelating agent, which can form stable, water-soluble complexes with alkali metals, rare earth metals and transition metals [20]. According to [16,17,18,19], EDTA as a promoter has been introduced into catalysts for the hydrodesulfurization reaction and has produced an outstanding promotion effect. Based on the formation mechanism of copper phyllosilicate [21], the absence of bridging ligand in EDTA is not conducive to the formation of copper phyllosilicate. Surprisingly, our research found that the Cu0 species were distributed more evenly and became more stable with the moderate introduction of EDTA during the catalyst preparation. The catalytic performance of the Cu/SiO2 catalyst with EDTA was significantly improved and could promote long-term stability in lower DMO hydrogenation temperature.

2. Results

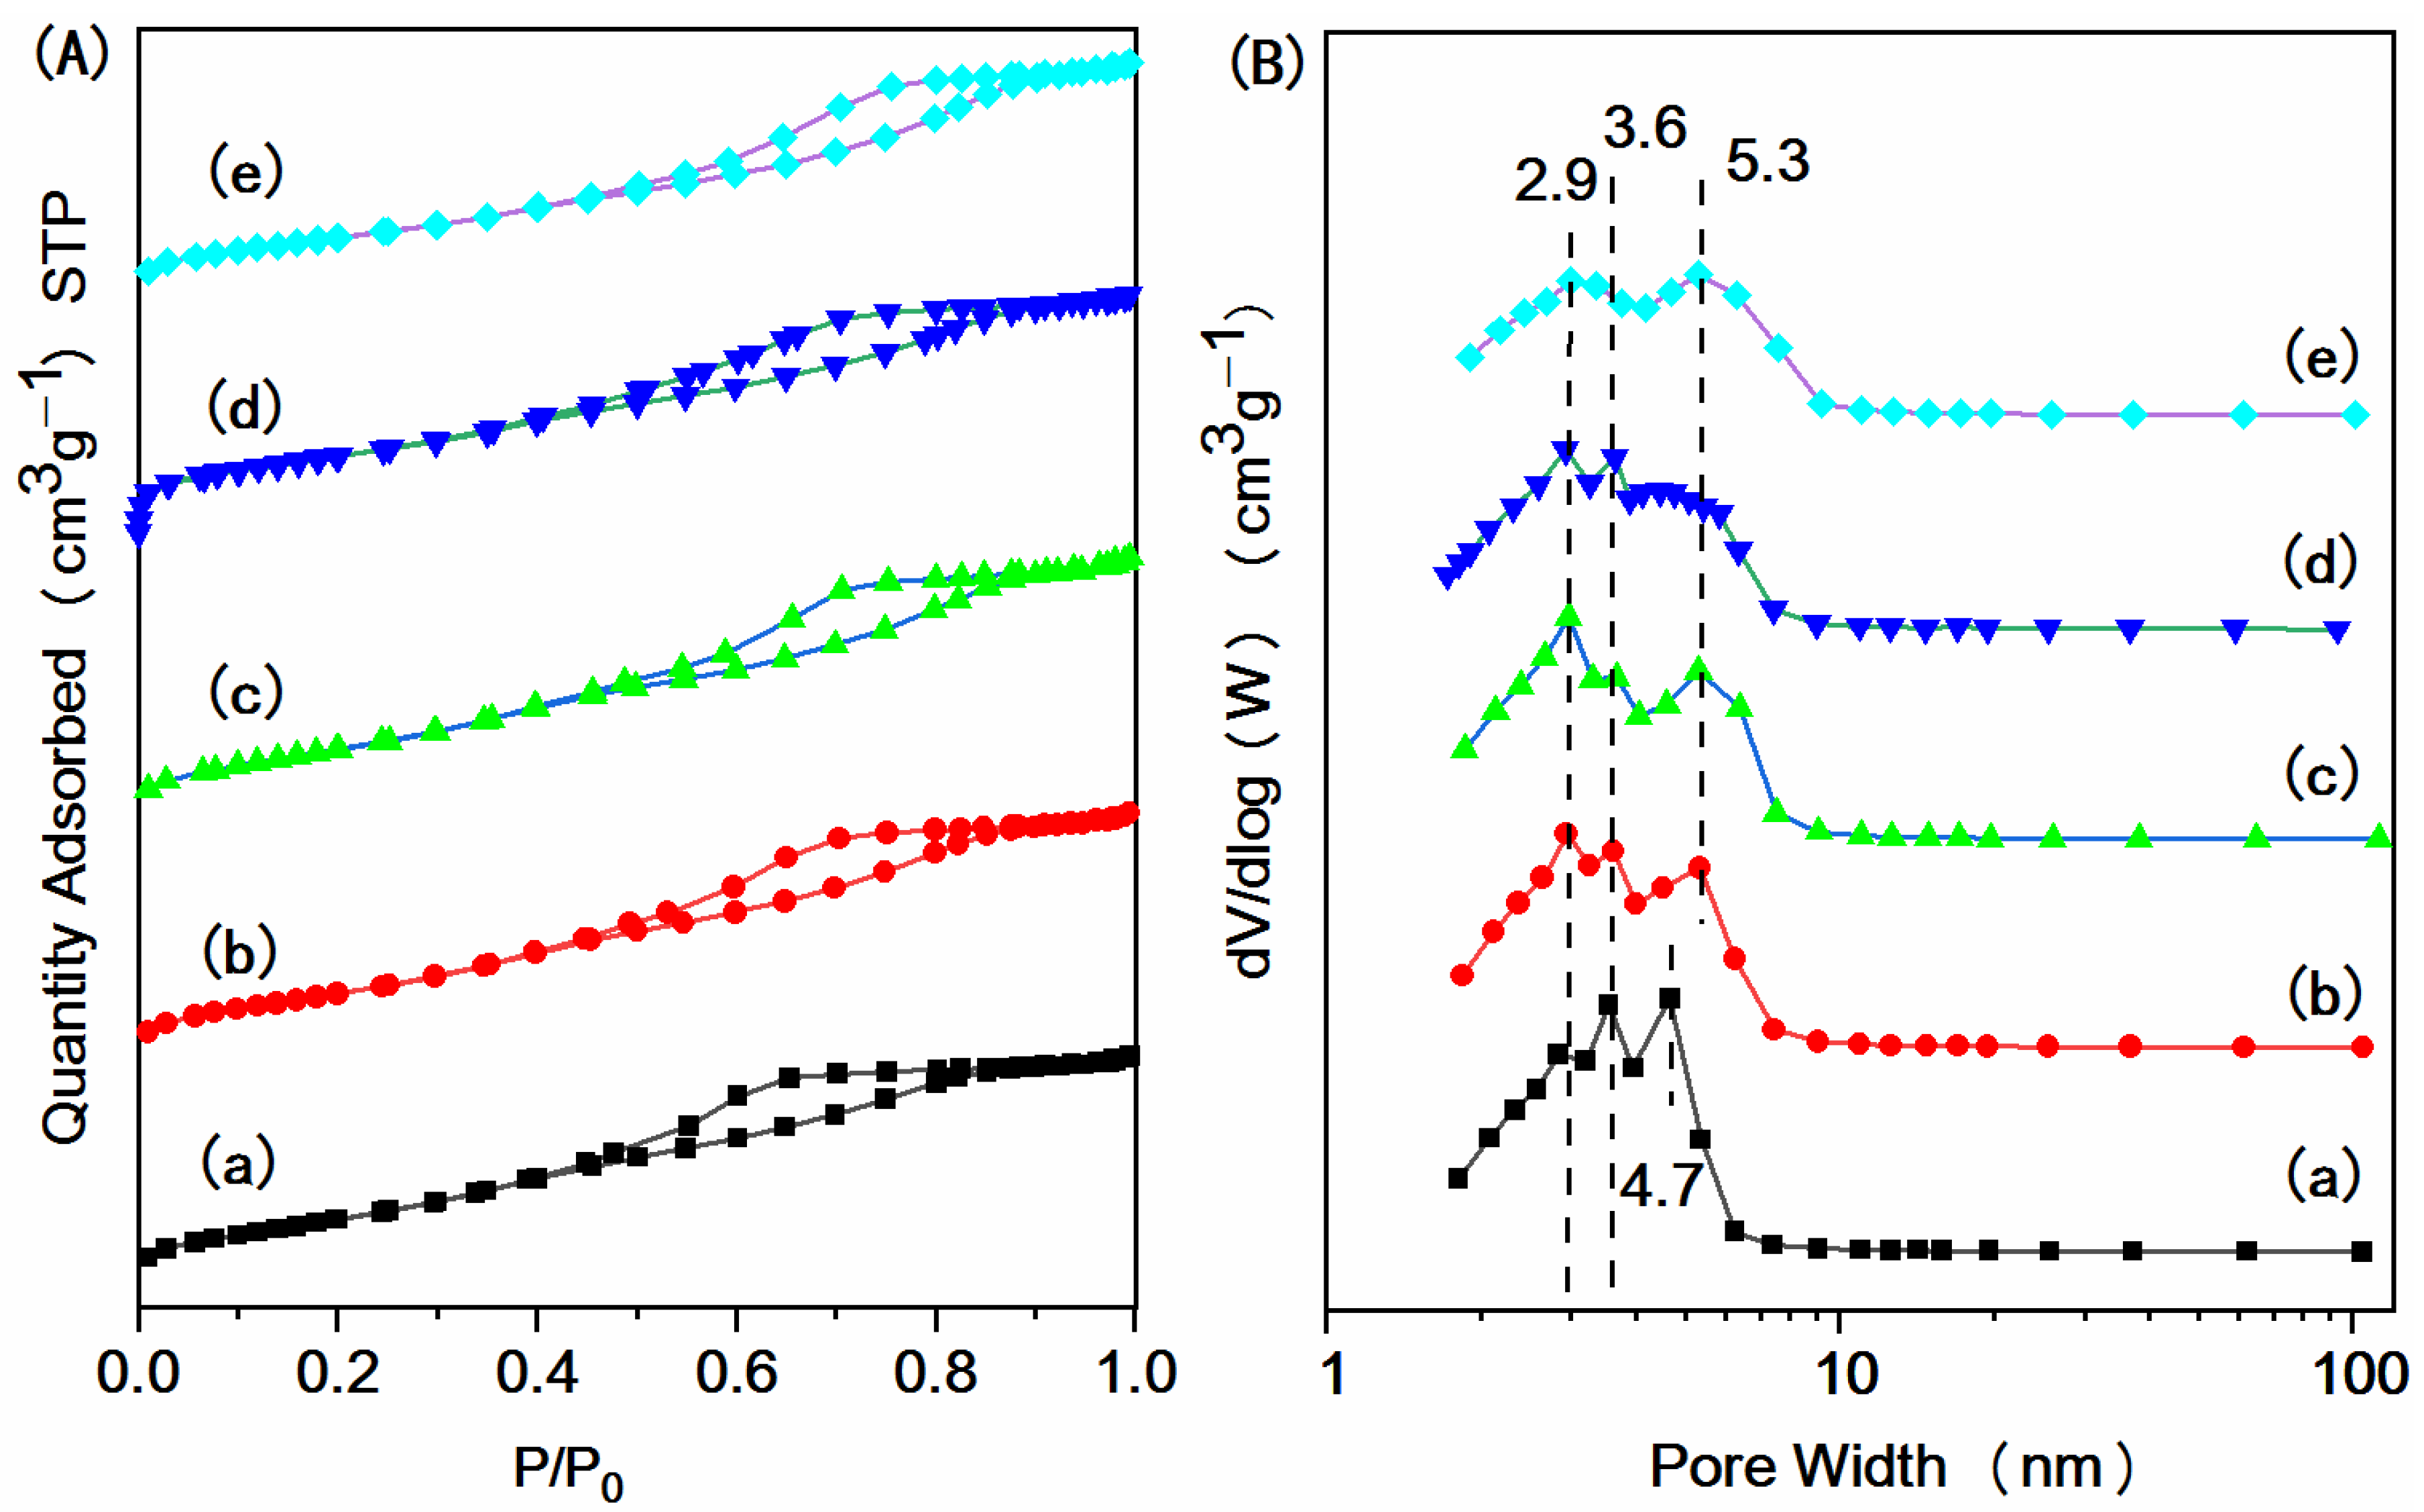
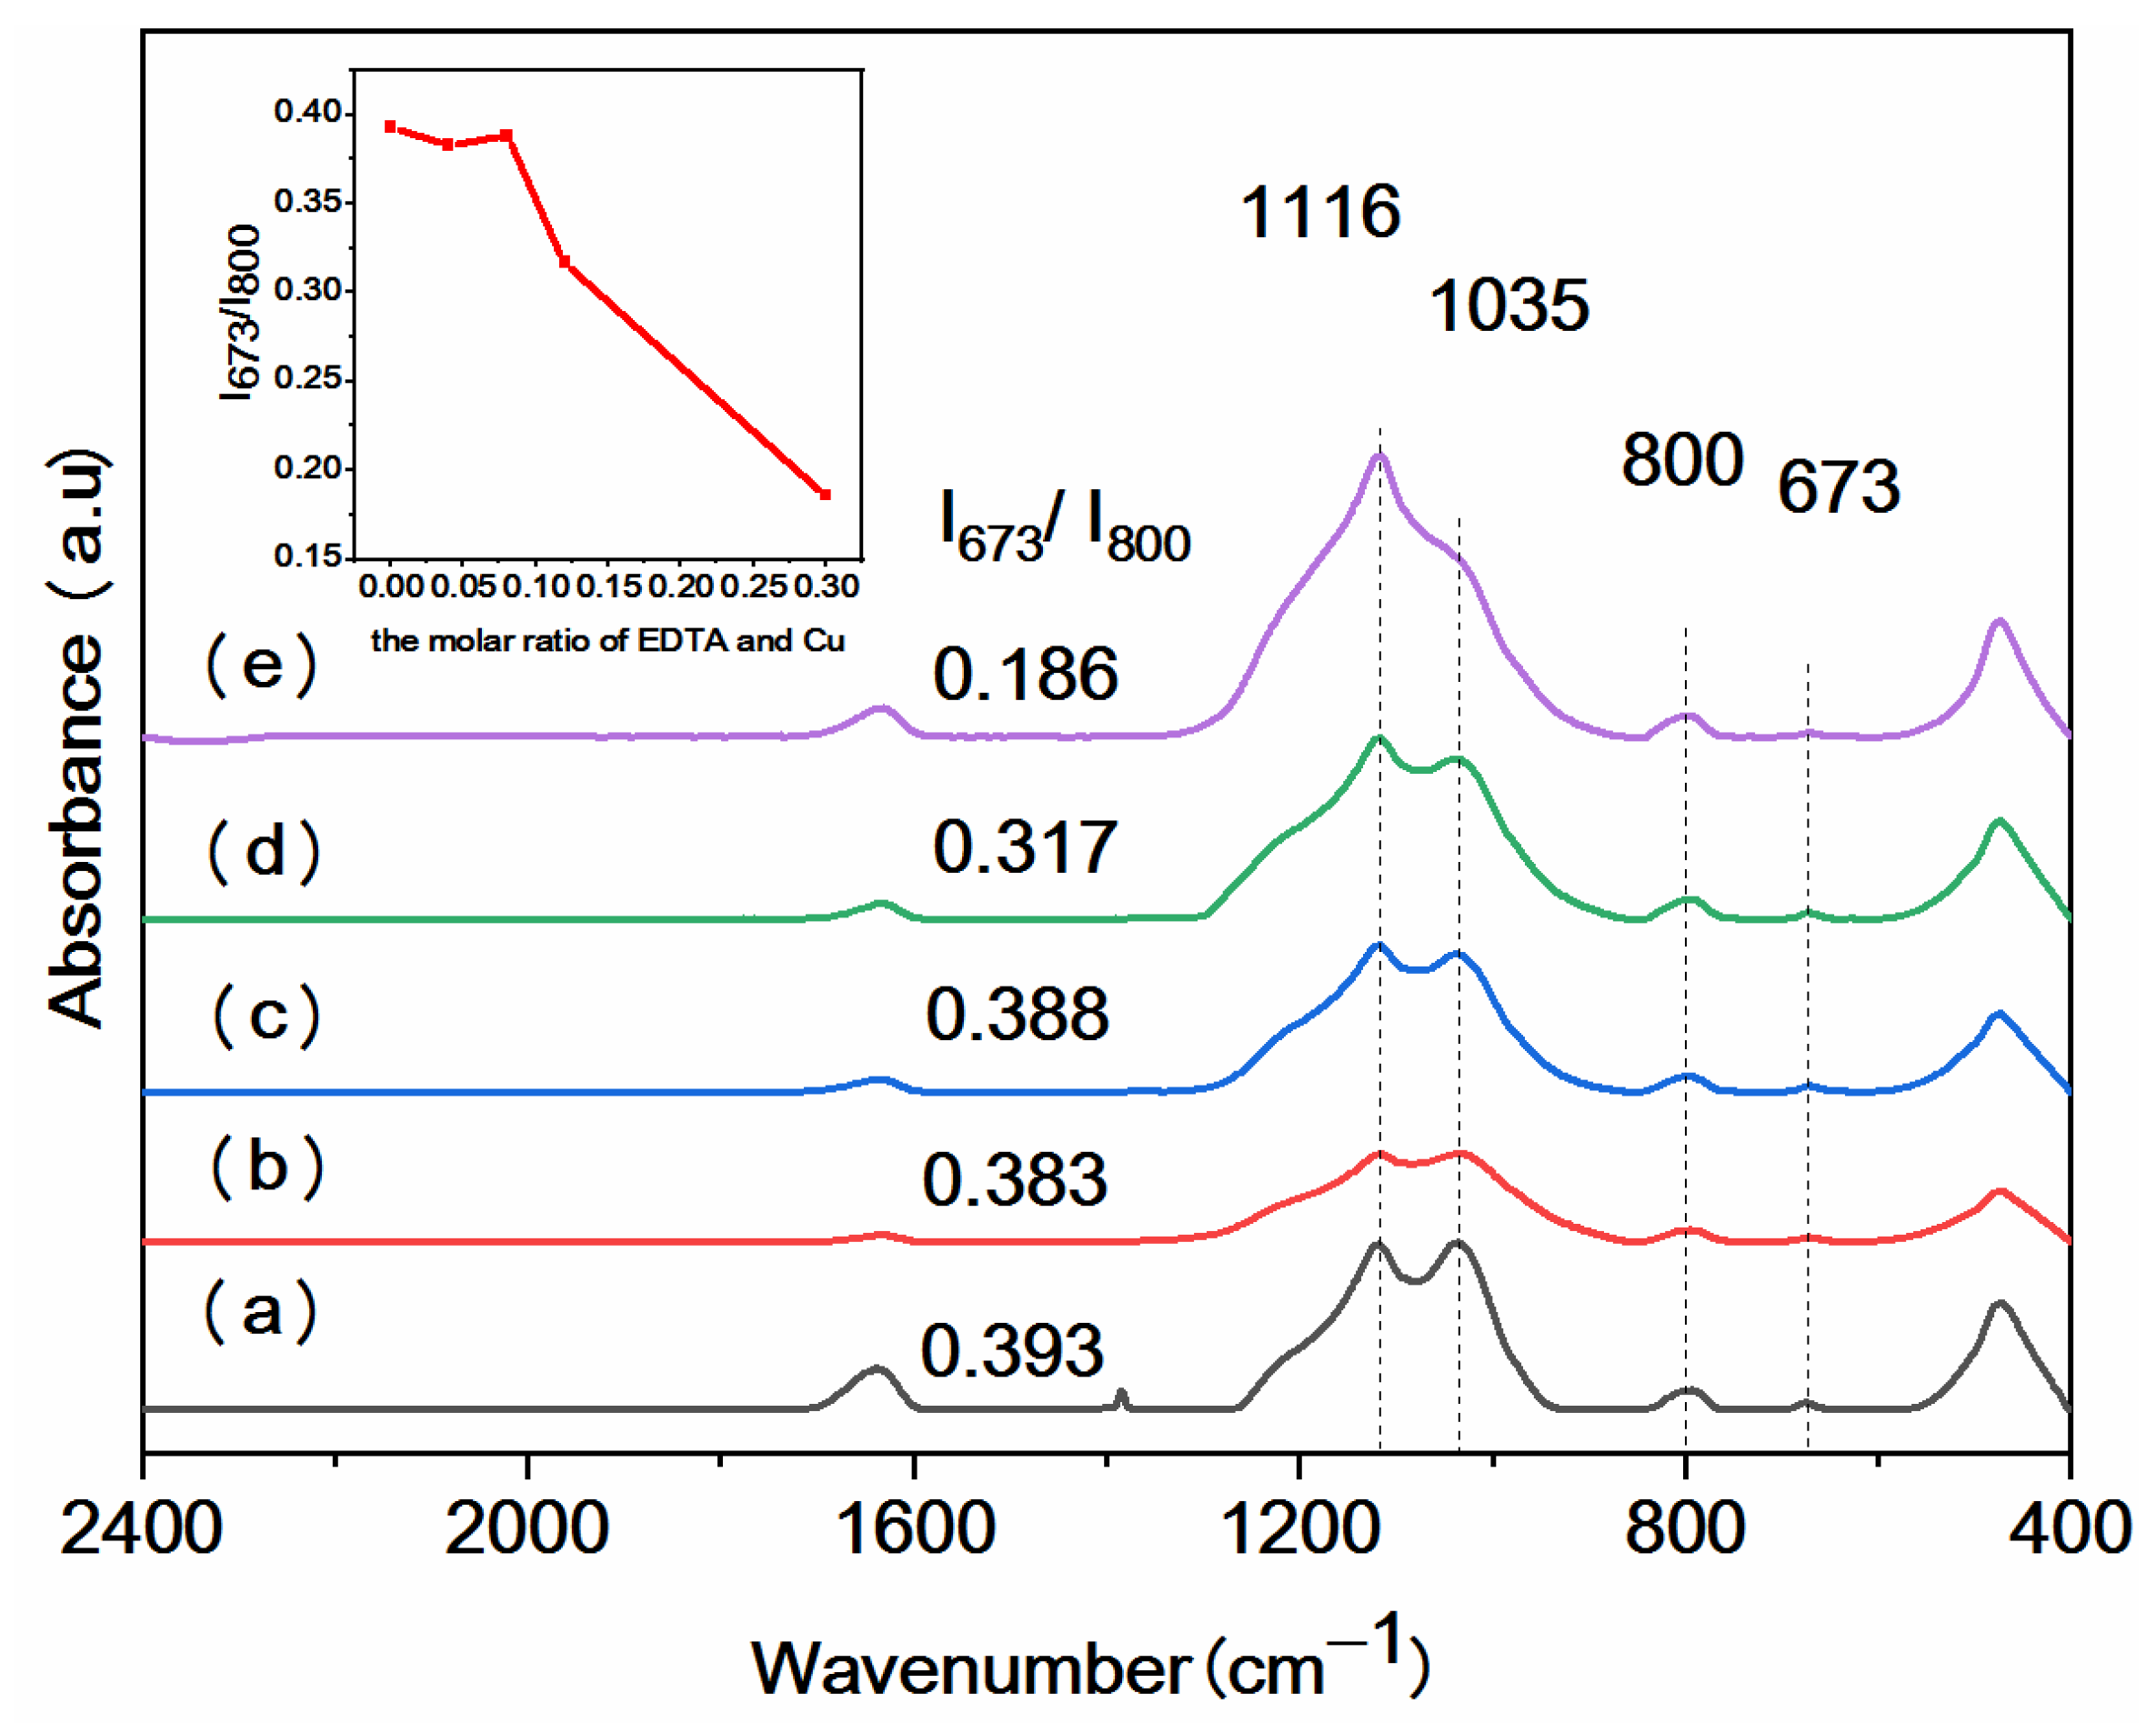
2.1. Structure and Physicochemical Properties of Catalysts

The results of N2 adsorption–desorption and N2O for all catalyst samples are summarized in Table 1 and Figure 1. The N2 isotherms of all samples exhibited Langmuir type IV isotherms. It was observed that the introduction of EDTA affected the specific surface area of the catalysts. Briefly, the BET surface area increased gradually firstly with the increase of the amount of EDTA, whereas further increasing the introduction of EDTA resulted in a gradual decline in BET surface area. This trend brought about a maximal BET surface area of 429 m2 g−1 as the ratio of EDTA/Cu was 0.08. On the other hand, the pore volume was influenced slightly with the introduction of EDTA. The pore size distribution curves showed that the pore size of the pure Cu/SiO2 samples was ca. 3–5 nm and that of xE-Cu/SiO2 samples was basically 3–5.3 nm. As a whole, the pore size distributions of samples were not affected by the introduction of EDTA. The results of N2O titration indicated that the surface area of active copper (SCu) increased firstly and then decreased with the increase of EDTA dosage and reached the maximum (12.8 m2 g−1) as EDTA/Cu = 0.08, which indicated that the appropriate amount of EDTA was beneficial to improve the surface area of active copper.
The results of ICP (Table 1) showed that the Cu loading in catalysts decreased significantly once the ratio of EDTA/Cu was above 0.08 because the excessive EDTA took away a large amount of copper through chelation. It should be pointed out that the C loading (Table 1) for all the dried samples was below the minimum detection line according to the elemental analysis results, that is, there was little EDTA in the dried samples, indicating that EDTA had been eliminated from the samples by means of filtration and washing.

2.2. Evolution of Crystalline Phase and Morphology

It could be observed by the TEM images (Figure 2) of the reduced samples that the size of copper crystallites on the surface of the samples with EDTA was between 3.5 and 4.3 nm, which was smaller than that on the surface of the Cu/SiO2 sample without EDTA (4.7 nm). The characterization results showed that the introduction of EDTA inhibited the agglomeration of copper species.
The XRD patterns of the calcined and reduced samples are shown in Figure 3, in which the feature at 2θ of around 22° was identified as amorphous silica [16,22]. For calcined samples (Figure 3A), the weak diffraction peaks at 2θ = 31.5°, 36°, 57.5°, and 63.5° were attributed to copper phyllosilicate [21,23]. The XRD patterns of the reduced samples showed that all samples had a strong diffraction peak at 2θ = 37.1°, which was assigned to Cu2O. The diffraction peak at 2θ = 43.3° belonged to Cu0 (111) [24,25]. However, the diffraction peak of Cu0 was not observed as EDTA/Cu ≥ 0.08, suggesting that the Cu0 nanoparticles might be small enough and well dispersed on the surface of samples [26]. The Scherrer equation was used to calculate the average particle size of Cu2O and Cu0, and the results (Table 1) showed that the average particle size of Cu2O and Cu0 was reduced on the surface of samples with the introduction of EDTA, which was consistent with TEM statistics. It is worth noting that the average particle size obtained from the TEM results included Cu2O and Cu0. The characterization results demonstrated that the introduction of EDTA was helpful for reducing the size of the CuNPs and making them disperse evenly.
Chen et al. [16] reported that the strong reduction peak at ca. 247 °C originated from the reduction of copper phyllosilicate, Cu-O-Si species, to Cu+ and highly dispersed CuO to Cu0. As shown in the TPR profiles (Figure 4), only one strong reduction peak appeared around 205 °C for all catalyst samples, which should be attributed to the collective contribution of the reduction of copper phyllosilicate, highly dispersed CuO and Cu-O-Si species. It is worth noting that the shoulder peak at ca. 195 °C became weak gradually and that the peak shape was more symmetrical with the increase of EDTA introduction, which suggested that the dispersion of copper species had been improved [27].
Figure 5 shows the Fourier transform infrared spectra (FT-IR) of calcined samples. The δOH deformation vibration peak at 673 cm−1 and the νSiO asymmetric stretching vibration peak at 1035 cm−1 indicate the presence of copper phyllosilicate [15], coinciding with the results obtained by XRD. The relative content of copper phyllosilicate could be qualitatively evaluated using the ratio I673/I800, in which I673 represents the intensity of the δOH band of copper phyllosilicate at 673 cm−1, and I800 represents the intensity of the symmetric νSiO band of amorphous silica at 800 cm−1 [16,21]. Figure 5 shows that the decline of I673/I800 ratio for the calcined samples was not obvious until EDTA/Cu > 0.08. This suggests that the formation of copper phyllosilicate would be inhibited with the introduction of EDTA, but this inhibition could be limited to a small magnitude by controlling the amount of EDTA.

2.3. Chemical States of Surface Species

The chemical environment of Cu species on the surface of catalyst samples could be elucidated by XPS analysis. As shown in Figure 6, the Cu 2p3/2 XPS spectra of the calcined samples showed a characteristic satellite peak at ca. 945.0 eV, while the reduced samples basically did not appear the satellite peak. Thus, it is believed that the oxidation state of copper was +2 in all the calcined samples [19]. Typically, the photoelectron peaks at ca. 936.0 eV and 933.5 eV have been attributed to copper phyllosilicate and CuO or well-dispersed Cu2+ species, respectively [16,28].
After reduction, the Cu2p3/2 XPS spectra of the samples only showed a photoelectron peak at ca. 932.9 eV without the corresponding satellite peak, which indicated that the Cu2+ was reduced to Cu+ and (or) Cu0 [29,30]. In order to identify further Cu+ and Cu0, the XAES analysis was carried out, and the results are illustrated in Figure 7. After deconvolution, the relevant data are listed in Table 2. In general, the peaks at ca. 913.0 eV and 916.0 eV are attributed to Cu+ and Cu0, respectively [16]. Moreover, the Auger parameter of Cu+ was ca. 1845.8 eV, and that of Cu0 was ca. 1844.1 eV, but the Auger parameter of Cu+ should be ca. 1849.0 eV. The smaller Cu+ Auger parameter was the result of the strong interaction between Cu+ and SiO2 [16,19]. Another interesting finding was that the Cu+/(Cu+ + Cu0) ratio had little change with the increase of EDTA introduction.

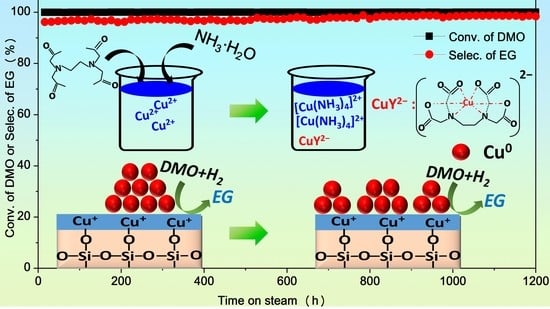
2.4. Catalytic Activity and Stability

The DMO hydrogenation reaction was used to test the performance of a series of samples, and Table 3 shows the results of xE-Cu/SiO2 samples. It was observed that the DMO conversion and EG selectivity first increased with the increase of EDTA introduction, then decreased when the ratio of EDTA/Cu was higher than 0.08 under 2 MPa at 160 °C; at last, the DMO conversion of 60.9% could be obtained over the 0.08E-Cu/SiO2 sample. In addition, the TOF of the 0.08E-Cu/SiO2 sample was 15.95 h−1, which was much higher than that of the pure Cu/SiO2 sample (8.62 h−1). The evaluation results of the 0.08E-Cu/SiO2 sample at different reaction temperatures show that the optimum reaction temperature was 180 °C, in which the DMO conversion was 99.99% and the EG selectivity was 97.70%. Of note, the conversion of the 0.3E-Cu/SiO2 sample was lower than that of the pure Cu/SiO2 sample, while the TOF value was higher than that of the pure Cu/SiO2 sample, at 160°C. The conversion of the 0.3E-Cu/SiO2 sample was higher than that of the pure Cu/SiO2 sample at 180 °C. In general, the activity of the 0.3E-Cu/SiO2 sample was higher than that of the pure Cu/SiO2 sample.
It is also worth noting that, as shown in Figure 8, the performance of the 0.08E-Cu/SiO2 sample was stable during the 1200 h of time on stream. Neither DMO conversion nor EG selectivity decreased significantly; namely, their average values kept constant at 99.9% and 98.3%, respectively. It was evident that the lifetime of 0.08E-Cu/ SiO2 catalyst was much longer than the lifetime of the pure Cu/SiO2 catalyst prepared by the same method [12,31,32].

3. Discussion

3.1. Interaction between EDTA and Silica Sol

EDTA (H4Y) is not only a strong chelating agent but also a hexabasic weak acid [33], and only the Y4− ions produced by hydrolysis are an effective form of chelation, so it could chelate with Cu2+ ions to form CuY2− ions. Moreover, the chelate ability of Cu2+ ions with EDTA is stronger than that with NH3 under the same conditions [21,34]. Thus, the concentration of Cu(NH3)42+ ions decreased with the introduction of EDTA, while the concentration of CuY2− ions increased in the precursor solution.
The elemental analysis results of the dried xE-Cu/SiO2 samples showed that the content of C in all samples was below the minimum detection limit (C ≤ 0.3%), which could be considered that there was no EDTA in the dried samples. In this work, it was also found that the filtrate of the sample without EDTA was colorless, while the filtrates of samples with EDTA were blue, and the color changed from blue to dark blue with the increase of the amount of EDTA. Dark blue was identified as the color of CuY2− ions. Moreover, on the basis of the ICP results, it could be confirmed that EDTA was able to reduce the Cu loading of the xE-Cu/SiO2 catalysts. It could be speculated that the CuY2− ions were hard to adsorb by the SiO groups on the surface of silica sol, because the SiO groups and CuY2− ions in the solution had the same charge under alkaline conditions. Therefore, the CuY2− ions would be removed from the surface of the catalyst via filtration and washing, resulting in the reduction of catalysts’ actual Cu loading when the theoretical Cu loading was the same during preparation.
In brief, EDTA could not interact directly with the silica sol but coordinated with Cu2+ ions to form CuY2− ions; certainly, CuY2− ions were incapable of grafting to the surface of the silica sol owning to the same charge. Consequently, most CuY2− ions were eliminated from the catalyst precursors during washing and filtration, leading to the decrease of the actual Cu loading of the samples.

3.2. Effect of EDTA on Surface Copper Species of the Catalysts

In the calcined samples, the presence of copper phyllosilicate was detected by XRD, and confirmed by the results of the FT-IR and the Cu2p3/2 XPS. In addition, the presence of CuO was also confirmed by the Cu2p3/2 XPS spectra of calcined samples. A characteristic satellite peak at ca. 945.0 eV also showed that the oxidation state of copper was +2 in all the calcined samples. For the reduced samples, it could be known that there were Cu+-O-Si, Cu2O and Cu0 on the surface, according to the results of XRD, Cu2p3/2 XPS and XAES.
Wang et al. [35] pointed out that the evaporation of ammonia pushed the balance of reaction (1) moving rightward, thus promoting the formation of copper phyllosilicate. Cu(OH)2(H2O)4 was an important intermediate during the formation of copper phyllosilicate [21]. The chelation between Cu2+ ions and EDTA would decrease the concentration of Cu(NH3)42+ ions in the solution, which went against the rightward progress of reaction (1). In this way, the amount of copper phyllosilicate would be decreased.
Cu(NH3)42+ + 6H2O→Cu(OH)2(H2O)4 + 2NH4+ + 2NH3
However, not all the Cu(NH3)42+ could be formed into Cu(OH)2(H2O)4, so the concentration of Cu(NH3)42+ ions decreased slightly when EDTA was introduced in small amounts, which had little effect on the formation of Cu(OH)2(H2O)4. Namely, there were only a handful of Cu2+ ions that were chelated by EDTA, as the EDTA/Cu was lower than 0.08; thus, the downward trend of the copper phyllosilicate formation amount was barely obvious for the calcinated samples. Furthermore, for the calcinated samples, there was a serious decline trend of copper phyllosilicate with the ratio of EDTA/Cu above 0.08; that was because the amount of Cu(NH3)42+ ions in the solution was greatly reduced as the introduction amount of EDTA continuously increased. Thus, the effect on the formation of copper phyllosilicate became more and more serious.
In addition, Wang et al. [35] also proposed that the slow dissolution rate of silica was conducive to polymerization of Cu(OH)2(H2O)4 to form copper hydroxide. Moreover, the low pH value went against the dissolution of silica [21]. A pH meter was used to measure the pH value of copper ammonia solutions. The results (Table S1) showed the introduction of EDTA reduced the pH of the copper ammonia solutions. Thus, the slow dissolution rate of silica promoted the formation of more copper hydroxide. Then the copper hydroxide would be translated into well-dispersed CuO particles after calcination. In contrast, it was prone to good dispersion of the Cu(NH3)42+ ions that were absorbed in the accumulation channels with the Cu(NH3)42+ ions concentration decreasing; then it would also form well-dispersed CuO particles after calcination. The BET surface of the samples with suitable EDTA were higher, which was favorable to form well-dispersed CuO particles with a smaller size. According to literature [12,16,36], the well-dispersed CuO particles would be reduced to Cu0 species. The XRD results showed that Cu0 nanoparticles on the surface of the reduced catalysts still maintained good dispersion, which indicated that the uniform dispersion of surface Cu0 species was conducive to inhibition of Oswald Ripening and the stability of Cu0 species on the surface of the catalysts could be enhanced with the introduction of EDTA.
In brief, the strong chelation between EDTA and Cu2+ reduced the concentration of Cu(NH3)42+ ions in the solution, which was responsible for affecting the formation of the surface Cu species. Fortunately, the appropriate introduction amount of EDTA had little effect on the formation of copper phyllosilicate, and it was beneficial to form more well-dispersed CuO particles.

3.3. Structure–Performance Relationship

The main factors affecting the activity of Cu/SiO2 catalysts include the number of active sites, the synergy between Cu+ and Cu0 and the size and dispersion of active species. Gong et al. [37] believed that the Cu0 was the main active site in the hydrogenation reaction, while the Cu+ mainly promoted the further transformation of methyl glycolate and ethylene glycol. When Cu0/(Cu+ + Cu0) was 0.33, the highest hydrogenation activity was obtained. Ma et al. [38] found that esters (methyl acetate, ethyl acetate, dimethyl oxalate) could oxidize Cu0 of the reduced Cu/SiO2 catalyst to Cu+, and the obtained Cu+ could be reduced back to Cu0 by H2 under reaction conditions. Cu0 and Cu+ were in a dynamic cycle during ester hydrogenation. When the Cu+/Cu0 ratio reaches equilibrium in the dynamic redox cycle, the Cu+ active center would not affect the catalytic equilibrium. However, before the equilibrium of Cu+/Cu0 ratio, the change of the amount of Cu+ would affect the amount of C=O absorbed and the balance of the redox cycle, and the catalytic balance would be affected, ultimately. The synergistic effect of the two enabled the catalyst to have high catalytic performance under mild conditions. Wang et al. [39] synthesized a Cu@CeO2 catalyst by the sol-gel method and suggested that the close relative position of Cu+ and Cu0 in the catalyst might be the main reason for the enhancement of synergistic effect.
In this work, the evolution of the structure–performance relationship with the introduction of EDTA is shown in Figure 9. It was found that it could provide more Cu0 sites with the introduction of EDTA; meanwhile, the Cu0 nanoparticle accumulation layer number was reduced, and the size of Cu0 nanoparticle particles became smaller. Therefore, there were more Cu0 sites that were in a close relative position to Cu+ sites on the surface of catalysts, and it also could inhibit the aggregation of Cu0 nanoparticles. Ultimately, the stability of Cu0 active sites and the synergistic effect between Cu0 and Cu+ sites were enhanced, which improved the catalytic hydrogenation performance and stability of the catalysts. Compared with pure Cu/SiO2 sample, the 0.3E-Cu/SiO2 sample had lower DMO conversion and higher TOF value, which showed that the synergistic effect between Cu+ sites and Cu0 sites had a greater effect on the activity than the number of active sites, as the number of active sites decreased in a certain range.

4. Experimental

4.1. Catalyst Preparation

The catalysts with different EDTA contents employing the ammonia-evaporation method were prepared according to our previous work [12,19,40]. A certain amount of EDTA and 10.6 g of Cu (NO3)2·3H2O as well as 6 g of urea were dissolved in deionized water under stirring until the EDTA was completely dissolved, then 24 mL of 25~28 wt% ammonia aqueous solution was added to the mixed solution. After 10 min, we added 21.0 g of 40 wt% silica sol under stirring at room temperature. The suspension was subsequently heated to 80 °C and kept at this temperature for 1 h under sealed conditions. After that, the seals were removed for the evaporation of ammonia until pH 6–7. The filter cakes obtained by means of filtration and washing were dried at 120 °C for 24 h and calcined at 450 °C for 5 h in an air atmosphere. Hereinafter, the calcined catalysts were named as xE-Cu/SiO2, where x was the molar ratio of EDTA and Cu.

4.2. Catalyst Characterization

The N2 adsorption and desorption experiment (BET) was carried out at −196 °C by temperature-programmed physical adsorption apparatus Micromeritics ASAP 2020. The adsorption–desorption isotherms of samples were measured, and the specific surface area of samples was calculated by the BET equation. The mesopore volume (Vp), pore size (Dp) and pore size distribution of samples were obtained by the BJH method.
The actual copper loading of samples was measured by the inductively coupled plasma optical emission spectrometer (ICP-OES), and the instrument model was Jobin Yvon Ultima2. The contents of C, H and N elements in the samples were measured by the element analyzer (EA), whose model was Vario EL-Cube.
The N2O pulse titration was used to measure the surface area and dispersion of active copper in samples. Its principle was to reduce the samples with H2 first, then oxidize all Cu0 in samples to Cu+ with N2O, which subsequently reduced Cu+ with H2 pulse; finally, we calculated the amount of Cu by measuring the amount of hydrogen consumption. The N2O titration equation was 2Cu (s) + N2O → N2 + Cu2O (s), and the atomic density of copper was calculated as 1.46 × 10¹⁹ copper atoms per m2.
The H2-temperature-programmed reduction (H2-TPR) was performed on a Micrometrics Autochem II 2920 instrument. All samples taken were about 30 mg (20–40 mesh) and pretreated for 2 h at 120 °C in an argon flow atmosphere to remove moisture and impurities and then cooled to 50 °C. After that, the Ar flow was converted into 10% H2–90% Ar, and the temperature was raised to 800 °C at a rate of 10 °C min−1. The consumption of H2 was measured by the TCD detector and MS signal.
The X-ray powder diffraction (XRD) was carried out on the Rigaku Miniflex 600 bench powder X-ray diffractometer with Cu target. The scanning range was 2θ = 10°~80°, and the scanning speed was 2.7° min−1. The Fourier transform infrared (FT-IR) measurements were performed using a Bruker Vertex 70 FT-IR. The measurement wavenumber range was from 4000 cm−1 to 400 cm−1 with a spectral resolution of 4 cm−1. The transmission electron microscopy (TEM) images were obtained on a Tecnai F20 instrument at an acceleration voltage of 200 kV. The X-ray photoelectron spectroscopy (XPS) and the Auger electron spectroscopy (XAES) were obtained on the ESCALAB 250Xi with Al Kα X-ray radiation (Hν = 1486.6 eV). The binding energy (BE) values were corrected using 103.7 eV as a reference for Si2p binding energy (BE).

4.3. Catalytic Reaction

The catalytic hydrogenation of DMO was carried out in a stainless steel continuous-flow fixed-bed reactor. The bottom of the reaction tube was filled with high-temperature resistant quartz cotton, and then 1 g of the calcined catalyst (20–40 mesh) was loaded. The remaining space of the reaction tube was filled with quartz sand, and the quartz cotton was used to separate the catalysts from the quartz sand. Before the reaction, the catalysts were prereduced for 5 h at 300 °C under 2 MPa by H2 atmosphere with the flow of 100 mL min−1. The temperature of the catalyst bed was monitored by a thermocouple inserted into the reaction tube. DMO (99%) was dissolved in methanol to prepare a feedstock solution with a mass concentration of 0.1 g mL−1. The weight liquid hour space velocity of DMO (WLHSVDMO) was 1.0 h−1, and the ratio of H2/DMO was 100 (mol/mol). The products were condensed by the condenser and stored in the product tank. The products were taken every 1 h and analyzed by gas chromatography (GC-7820A) with a flame ionization detector.

5. Conclusions

Based on the above findings, the following conclusions could be summarized: (1) The chelation of EDTA and Cu2+ ions affected the formation of Cu species by changing the concentration of Cu(NH3)42+ ions. (2) The Cu surface area and dispersion were improved with the introduction of suitable EDTA in the preparation process. (3) There were more Cu0 sites that were in a close relative position to Cu+ sites on the surface of catalysts; thereby, the stability of Cu0 active sites and the synergistic effect between Cu0 and Cu+ would be enhanced. (4) In the end, the catalytic hydrogenation performance and stability were improved greatly with the introduction of EDTA, and the optimum reaction temperature of DMO hydrogenation was further reduced.
For 0.08E-Cu/SiO2 sample, more Cu0 active sites were highly dispersed on the sample surface with a larger specific surface area, and the proportion of Cu+ was appropriate. These factors together enhanced the synergistic effect between Cu+ sites and Cu0 sites, and finally made the 0.08E-Cu/SiO2 sample have the optimal catalytic performance. The DMO conversion and EG selectivity were 99.9% and 97.7% at 180 °C, respectively. Its catalytic performance also showed high stability without obvious decline or deactivation during the 1200 h life test at 180 °C.

Supplementary Materials

The following supporting information can be downloaded at: https://www.mdpi.com/article/10.3390/catal12030320/s1, Table S1: The pH value of copper ammonia solutions with different introduction amount of EDTA.

Author Contributions

Investigation, T.L.; Writing—Original Draft, T.L.; Visualization, T.L., C.C., L.H., J.Y. and P.Z.; Validation, T.L.; Formal analysis, T.L.; Writing—Reviewing and Editing, L.L. and R.Y.; Supervision, L.L.; Conceptualization, L.L.; Project administration, Y.Q.; Resources, Y.Q., J.C. and Y.Y.; Funding acquisition, Y.Y. All authors have read and agreed to the published version of the manuscript.

Funding

This work was supported by National Key R&D Program of China (2018YFA0704500); the Strategic Priority Research Program of the Chinese Academy of Sciences (XDA21020800); the National Natural Science Foundation of China (22102186) and the Science Foundation of Fujian Province (2019J05156, 2019H0053).

Data Availability Statement

Data sharing is not applicable.

Conflicts of Interest

The authors declare no conflict of interest.

References

  1. Ye, R.P.; Lin, L.; Wang, L.C.; Ding, D.; Zhou, Z.F.; Pan, P.B.; Xu, Z.H.; Liu, J.; Adidharma, H.; Radosz, M.; et al. Perspectives on the active sites and catalyst design for the hydrogenation of dimethyl oxalate. ACS Catal. 2020, 10, 4465–4490. [Google Scholar] [CrossRef]
  2. Li, D.; Wang, H. Market and technology progress of syngas to ethylene glycol. Mod. Chem. Ind. 2017, 37, 5. [Google Scholar]
  3. Lv, J.; Ma, X.; Wang, Y.; Zhao, Y. High-performance copper-based catalysts for ethylene glycol and ethanol synthesis via ester hydrogenation reactions. Sci. Sin. Chim. 2020, 50, 183–191. [Google Scholar] [CrossRef]
  4. Wang, Z.Q.; Xu, Z.N.; Peng, S.Y.; Zhou, Z.F.; Pan, P.B.; Lin, L.; Qin, Y.Y.; Guo, G.C.; Yao, Y.G. New catalysts for coal to ethylene glycol. Chin. J. Chem. 2017, 35, 759–768. [Google Scholar] [CrossRef] [Green Version]
  5. Yang, Q.; Yang, Q.C.; Xu, S.M.; Zhu, S.; Zhang, D.W. Technoeconomic and environmental analysis of ethylene glycol production from coal and natural gas compared with oil-based production. J. Clean. Prod. 2020, 273, 123120. [Google Scholar] [CrossRef]
  6. Ye, R.P.; Wang, X.Y.; Price, C.A.H.; Liu, X.Y.; Yang, Q.H.; Jaroniec, M.; Liu, J. Engineering of yolk/core-shell structured nanoreactors for thermal hydrogenations. Small 2021, 17, e1906250. [Google Scholar] [CrossRef] [PubMed]
  7. Tian, J.X.; Chen, W.; Wu, P.; Zhu, Z.R.; Li, X.H. Cu-Mg-Zr/SiO2 catalyst for the selective hydrogenation of ethylene carbonate to methanol and ethylene glycol. Catal. Sci. Technol. 2018, 8, 2624–2635. [Google Scholar] [CrossRef]
  8. Vandescheur, F.T.; Staal, L.H. Effects of zinc addition to silica supported copper catalysts for the hydrogenolysis of esters. Appl. Catal. A Gen. 1994, 108, 63–83. [Google Scholar] [CrossRef]
  9. Ye, C.; Guo, C.; Sun, C.; Zhang, Y. Effect of Mn doping on the activity and stability of Cu–SiO2 catalysts for the hydrogenation of methyl acetate to ethanol. RSC Adv. 2016, 6, 113796–113802. [Google Scholar] [CrossRef]
  10. Ye, R.P.; Lin, L.; Li, Q.H.; Zhou, Z.F.; Wang, T.T.; Russell, C.K.; Adidharma, H.; Xu, Z.H.; Yao, Y.G.; Fan, M.H. Recent progress in improving the stability of copper-based catalysts for hydrogenation of carbon-oxygen bonds. Catal. Sci. Technol. 2018, 8, 3428–3449. [Google Scholar] [CrossRef]
  11. Yin, A.; Guo, X.; Dai, W.-L.; Li, H.; Fan, K. Highly active and selective copper-containing HMS catalyst in the hydrogenation of dimethyl oxalate to ethylene glycol. Appl. Catal. A Gen. 2008, 349, 91–99. [Google Scholar] [CrossRef]
  12. Chen, C.C.; Lin, L.; Ye, R.P.; Sun, M.L.; Yang, J.X.; Li, F.; Yao, Y.G. Mannitol as a novel dopant for Cu/SiO2: A low-cost, environmental and highly stable catalyst for dimethyl oxalate hydrogenation without hydrogen prereduction. J. Catal. 2020, 389, 421–431. [Google Scholar] [CrossRef]
  13. Yin, A.; Wen, C.; Guo, X.; Dai, W.-L.; Fan, K. Influence of Ni species on the structural evolution of Cu/SiO2 catalyst for the chemoselective hydrogenation of dimethyl oxalate. J. Catal. 2011, 280, 77–88. [Google Scholar] [CrossRef]
  14. Zhu, Y.-Y.; Wang, S.-R.; Zhu, L.-J.; Ge, X.-L.; Li, X.-B.; Luo, Z.-Y. The influence of copper particle dispersion in Cu/SiO2 catalysts on the hydrogenation synthesis of ethylene glycol. Catal. Lett. 2010, 135, 275–281. [Google Scholar] [CrossRef]
  15. Toupance, T.; Kermarec, M.; Louis, C. Metal particle size in silica-supported copper catalysts. Influence of the conditions of preparation and of thermal pretreatments. J. Phys. Chem. B 2000, 104, 965–972. [Google Scholar] [CrossRef]
  16. Chen, L.F.; Guo, P.J.; Qiao, M.H.; Yan, S.R.; Li, H.X.; Shen, W.; Xu, H.L.; Fan, K.N. Cu/SiO2 catalysts prepared by the ammonia-evaporation method: Texture, structure, and catalytic performance in hydrogenation of dimethyl oxalate to ethylene glycol. J. Catal. 2008, 257, 172–180. [Google Scholar] [CrossRef]
  17. Oguchi, H.; Kanai, H.; Utani, K.; Matsumura, Y.; Imamura, S. Cu2O as active species in the steam reforming of methanol by CuO/ZrO2 catalysts. Appl. Catal. A Gen. 2005, 293, 64–70. [Google Scholar] [CrossRef]
  18. Ye, R.-P.; Lin, L.; Liu, C.-Q.; Chen, C.-C.; Yao, Y.-G. One-pot synthesis of cyclodextrin-doped Cu-SiO2 catalysts for efficient hydrogenation of dimethyl oxalate to ethylene glycol. ChemCatChem 2017, 9, 4587–4597. [Google Scholar] [CrossRef]
  19. Ye, R.-P.; Lin, L.; Yang, J.-X.; Sun, M.-L.; Li, F.; Li, B.; Yao, Y.-G. A new low-cost and effective method for enhancing the catalytic performance of CuSiO2 catalysts for the synthesis of ethylene glycol via the vapor-phase hydrogenation of dimethyl oxalate by coating the catalysts with dextrin. J. Catal. 2017, 350, 122–132. [Google Scholar] [CrossRef]
  20. Ryczkowski, J. IR studies of EDTA alkaline salts interaction with the surface of inorganic oxides. Appl. Surf. Sci. 2005, 252, 813–822. [Google Scholar] [CrossRef]
  21. Toupance, T.; Kermarec, M.; Lambert, J.F.; Louis, C. Conditions of formation of copper phyllosilicates in silica-supported copper catalysts prepared by selective adsorption. J. Phys. Chem. B 2002, 106, 2277–2286. [Google Scholar] [CrossRef]
  22. Ye, R.P.; Liao, L.; Reina, T.R.; Liu, J.X.; Chevella, D.; Jin, Y.G.; Fan, M.H.; Liu, J. Engineering Ni/SiO2 catalysts for enhanced CO2 methanation. Fuel 2021, 285, 119151. [Google Scholar] [CrossRef]
  23. He, Z.; Lin, H.; He, P.; Yuan, Y. Effect of boric oxide doping on the stability and activity of a Cu-SiO2 catalyst for vapor-phase hydrogenation of dimethyl oxalate to ethylene glycol. J. Catal. 2011, 277, 54–63. [Google Scholar] [CrossRef]
  24. Chen, C.C.; Lin, L.; Ye, R.P.; Huang, L.; Zhu, L.B.; Huang, Y.Y.; Qin, Y.Y.; Yao, Y.G. Construction of Cu-Ce composite oxides by simultaneous ammonia evaporation method to enhance catalytic performance of Ce-Cu/SiO2 catalysts for dimethyl oxalate hydrogenation. Fuel 2021, 290, 120083. [Google Scholar] [CrossRef]
  25. Zhang, S.; Liu, Q.; Fan, G.; Li, F. Highly-dispersed copper-based catalysts from Cu-Zn-Al layered double hydroxide precursor for gas-phase hydrogenation of dimethyl oxalate to ethylene glycol. Catal. Lett. 2012, 142, 1121–1127. [Google Scholar] [CrossRef]
  26. Yin, A.; Wen, C.; Dai, W.-L.; Fan, K. Surface modification of HMS material with silica sol leading to a remarkable enhanced catalytic performance of Cu/SiO2. Appl. Surf. Sci. 2011, 257, 5844–5849. [Google Scholar] [CrossRef]
  27. Carniti, P.; Gervasini, A.; Modica, V.H.; Ravasio, N. Catalytic selective reduction of NO with ethylene over a series of copper catalysts on amorphous silicas. Appl. Catal. B Environ. 2000, 28, 175–185. [Google Scholar] [CrossRef]
  28. Van Der Grift, C.J.G.; Elberse, P.A.; Mulder, A.; Geus, J.W. Preparation of silica-supported copper-catalysts by means of depostion precipitation. Appl. Catal. 1990, 59, 275–289. [Google Scholar] [CrossRef]
  29. Huang, Y.; Ariga, H.; Zheng, X.; Duan, X.; Takakusagi, S.; Asakura, K.; Yuan, Y. Silver-modulated SiO2-supported copper catalysts for selective hydrogenation of dimethyl oxalate to ethylene glycol. J. Catal. 2013, 307, 74–83. [Google Scholar] [CrossRef]
  30. Han, L.; Zhang, L.; Zhao, G.; Chen, Y.; Zhang, Q.; Chai, R.; Liu, Y.; Lu, Y. Copper-fiber-structured Pd-Au-CuOx: Preparation and catalytic performance in the vapor-phase hydrogenation of dimethyl oxalate to ethylene glycol. ChemCatChem 2016, 8, 1065–1073. [Google Scholar] [CrossRef]
  31. Yue, H.; Zhao, Y.; Zhao, L.; Lv, J.; Wang, S.; Gong, J.; Ma, X. Hydrogenation of dimethyl oxalate to ethylene glycol on a Cu/SiO2/cordierite monolithic catalyst: Enhanced internal mass transfer and stability. AIChE J. 2012, 58, 2798–2809. [Google Scholar] [CrossRef]
  32. Wang, M.; Yao, D.; Li, A.; Yang, Y.; Lv, J.; Huang, S.; Wang, Y.; Ma, X. Enhanced selectivity and stability of Cu/SiO2 catalysts for dimethyl oxalate hydrogenation to ethylene glycol by using silane coupling agents for surface modification. Ind. Eng. Chem. Res. 2020, 59, 9414–9422. [Google Scholar] [CrossRef]
  33. Zaitoun, M.A.; Lin, C.T. Chelating behavior between metal ions and EDTA in sol-gel matrix. J. Phys. Chem. B 1997, 101, 1857–1860. [Google Scholar] [CrossRef]
  34. Chang, W.; Peng-ran, G.U.O.; Hang-ting, C.; Yong-hong, S.H.U. Evaluation of bioavailability of heavy metals in soils and sediments. Rock Miner. Anal. 2009, 28, 108–112. [Google Scholar]
  35. Wang, Y.; Yang, W.; Yao, D.; Wang, S.; Xu, Y.; Zhao, Y.; Ma, X. Effect of surface hydroxyl group of ultra-small silica on the chemical states of copper catalyst for dimethyl oxalate hydrogenation. Catal. Today 2020, 350, 127–135. [Google Scholar] [CrossRef]
  36. Marchi, A.J.; Fierro, J.L.G.; Santamaria, J.; Monzon, A. Dehydrogenation of isopropylic alcohol on a Cu/SiO2 catalyst: A study of the activity evolution and reactivation of the catalyst. Appl. Catal. A Gen. 1996, 142, 375–386. [Google Scholar] [CrossRef]
  37. Gong, J.L.; Yue, H.R.; Zhao, Y.J.; Zhao, S.; Zhao, L.; Lv, J.; Wang, S.P.; Ma, X.B. Synthesis of ethanol via syngas on Cu/SiO2 catalysts with balanced Cu0-Cu+ sites. J. Am. Chem. Soc. 2012, 134, 13922–13925. [Google Scholar] [CrossRef]
  38. Ma, X.G.; Yang, Z.Q.; Liu, X.B.; Tan, X.Z.; Ge, Q.J. Dynamic redox cycle of Cu0 and Cu+ over Cu/SiO2 catalyst in ester hydrogenation. RSC Adv. 2015, 5, 37581–37584. [Google Scholar] [CrossRef]
  39. Wang, Y.; Zhao, Y.; Lv, J.; Ma, X. Facile synthesis of Cu@CeO2 and its catalytic behavior for the hydrogenation of methyl acetate to ethanol. ChemCatChem 2017, 9, 2085–2090. [Google Scholar] [CrossRef]
  40. Ashok, J.; Kathiraser, Y.; Ang, M.L.; Kawi, S. Ni and/or Ni-Cu alloys supported over SiO2 catalysts synthesized via phyllosilicate structures for steam reforming of biomass tar reaction. Catal. Sci. Technol. 2015, 5, 4398–4409. [Google Scholar] [CrossRef]
Figure 1. N2 adsorption–desorption isotherms (A) and pore size distribution curves calculated by BJH equation in desorption branch (B) of the calcined xE-Cu/SiO2 samples. (a) Cu/SiO2, (b) 0.04E-Cu/SiO2, (c) 0.08E-Cu/SiO2, (d) 0.12E-Cu/SiO2, (e) 0.3E-Cu/SiO2.
Catalysts 12 00320 g001
Figure 2. TEM images of reduced samples: (A) Cu/SiO2, (B) 0.04E-Cu/SiO2, (C) 0.08E-Cu/SiO2, (D) 0.12E-Cu/SiO2, (E) 0.3E-Cu/SiO2.
Catalysts 12 00320 g002
Figure 3. XRD patterns of (A) the calcined catalysts and (B) the reduced catalysts xE-Cu/SiO2. (a) Cu/SiO2, (b) 0.04E-Cu/SiO2, (c) 0.08E-Cu/SiO2, (d) 0.12E-Cu/SiO2, (e) 0.3E-Cu/SiO2.
Catalysts 12 00320 g003
Figure 4. H2 TPR profiles of the calcined xE-Cu–SiO2 catalysts. (a) Cu/SiO2, (b) 0.04E-Cu/SiO2, (c) 0.08E-Cu/SiO2, (d) 0.12E-Cu/SiO2, (e) 0.3E-Cu/SiO2.
Catalysts 12 00320 g004
Figure 5. FT-IR spectra of the calcined catalysts. (a) Cu/SiO2, (b) 0.04E-Cu/SiO2, (c) 0.08E-Cu/SiO2, (d) 0.12E-Cu/SiO2, (e) 0.3E-Cu/SiO2.
Catalysts 12 00320 g005
Figure 6. XPS spectra of (A) the calcined catalysts and (B) the reduced catalysts of xE-Cu/SiO2. (a) Cu/SiO2, (b) 0.04E-Cu/SiO2, (c) 0.08E-Cu/SiO2, (d) 0.12E-Cu/SiO2, (e) 0.3E-Cu/SiO2.
Catalysts 12 00320 g006
Figure 7. Cu LMM XAES spectra of the reduced xE-Cu/SiO2 catalysts. (a) Cu/SiO2, (b) 0.04E-Cu/SiO2, (c) 0.08E-Cu/SiO2, (d) 0.12E-Cu/SiO2, (e) 0.3E-Cu/SiO2.
Catalysts 12 00320 g007
Figure 8. DMO hydrogenation over 0.08E-Cu/SiO2 catalyst as a function of time on stream. Reaction conditions: T = 180 °C, P(H2) = 2.0 MPa, H2 /DMO = 100 (mol mol−1).
Catalysts 12 00320 g008
Figure 9. The evolution of the structure–performance relationship caused by the introduction of EDTA.
Catalysts 12 00320 g009
Table 1. Physical and chemical properties of xE-Cu/SiO2 catalysts.
SampleCu Loading (wt%) aSBET (m2g−1) bVp
(cm3g−1) c
dp
(nm) d
SCu
(m2g−1) e
Cu Dispersion
(%) e
C Loading
(wt%) f
dCu
(nm) g
dCu2O
(nm) g
Cu/SiO221.63940.463.811.28.0<0.34.94.1
0.04E-Cu/SiO222.24110.504.012.48.6<0.34.53.5
0.08E-Cu/SiO222.24290.524.212.89.3<0.3-2.9
0.12E-Cu/SiO218.54000.464.011.19.3<0.3-3.5
0.3E-Cu/SiO214.83540.474.68.28.5<0.3-3.1
a Determined by ICP-OES. b SBET: specific surface area. c Vp: total pore volume. d dp: average pore diameter. e Cu metal surface area and dispersion determined by N2O titration. f Determined by EA for the dried catalyst precursors. g Calculated from the XRD data based on the Scherrer equation.
Table 2. Surface Cu species of the reduced xE-Cu/SiO2 catalysts derived from Cu LMM XAES spectra.
CatalystsKE (eV) aAP (eV) bBE of
Cu2p 3/2 (eV)
X Cu+ (%) c
Cu+Cu0Cu+Cu0
Cu/SiO2913.1916.11846.11849.1933.061.3
0.04E-Cu/SiO2913.2916.21846.01849.0932.860.5
0.08E-Cu/SiO2912.7916.01845.81849.1933.163.0
0.12E-Cu/SiO2913.0916.01846.11849.0933.061.6
0.3E-Cu/SiO2912.5915.81845.61848.9933.155.8
a Kinetic energy. b Auger parameter. c Intensity ratio between Cu+ and (Cu+ + Cu0) by deconvolution of Cu LMM XAES.
Table 3. The catalytic activity of xE-Cu/SiO2 catalysts for DMO hydrogenation a.
Sample160 °C180 °C
Conv.
(%)
Selec. (%)TOF c
(h−1)
Conv.
(%)
Selec. (%)
EGEtOHMGOther bEGEtOHMGOther b
Cu/SiO228.808.430.0291.328.668.6296.3456.580.0543.0556.9
0.04E-Cu/SiO243.4412.540.0387.220.2111.7599.7687.320.1512.100.43
0.08E-Cu/SiO260.9015.100.0284.700.1815.9599.9997.700.500.781.02
0.12E-Cu/SiO243.6012.930.0486.800.2313.1799.9897.780.610.650.96
0.3E-Cu/SiO225.867.040.0592.640.2710.5799.2467.890.0631.790.26
a Reaction conditions: P(H2) = 2.0 MPa, H2/DMO = 100 (mol mol−1), WLHSVDMO = 1 h−1. b Other byproducts, including 1,2-BDO and 1,2-PDO. c TOF values were calculated by the surface Cu numbers of N2O titration.
Publisher’s Note: MDPI stays neutral with regard to jurisdictional claims in published maps and institutional affiliations.

