Article

Insight into Crystallization Features of MOR Zeolite Synthesized via Ice-Templating Method

1
School of Chemistry and Chemical Engineering, Qingdao University, Qingdao 266071, China
2
School of Chemistry and Chemical Engineering, Liaocheng University, Liaocheng 252059, China
*
Author to whom correspondence should be addressed.
Catalysts 2022, 12(3), 301; https://doi.org/10.3390/catal12030301
Submission received: 17 February 2022 / Revised: 3 March 2022 / Accepted: 4 March 2022 / Published: 7 March 2022

Abstract

:
Hydrothermal, solvothermal or ionothermal routes are usually employed for the synthesis of zeolite, which is often accompanied by a high energy consumption, high cost and low efficiency. We have developed a novel route for the rapid and high yield synthesis of mordenite (MOR) zeolite via an ice-templating method. In comparison with traditional hydrothermal synthesis, not only the high yield, but also the superior crystallinity, large reduction in water level and reaction pressure, simple device and conventional silica sources by this route can have great potential for the commercial production of pure MOR zeolite. Moreover, the changed bonding environment of silicon atoms in MOR zeolite, that is, a relative decrease in the tetrahedrally coordinated Si–O–Si bond, and accordingly, an increase in the T–OH (T = Si, Al) groups and Si–O–Al sites, remarkably enhances its acid strength.

Graphical Abstract

1. Introduction

Zeolites are microporous aluminosilicates or aluminophosphate materials with precisely uniform channels that play a significant role in chemical industry due to their excellent properties, such as high surface area, large pore volume, hydrothermal stability and strong acidity [1,2,3]. In particular, mordenite (MOR) zeolite has been studied as an active matrix in crucial reactions, such as isomerization, alkylation, reforming, dewaxing, the selective carbonylation of dimethyl ether to methyl acetate, and light olefins synthesis [4,5]. Its microporous structure consists of two pore channels with a one–dimensional channel composed of 12–MR (0.67 × 0.70 nm) and two narrow 8–MR (0.26 × 0.57 nm and 0.34 × 0.48 nm) [6,7,8].
It has long been accepted that zeolites are synthesized by hydrothermal, solvothermal and ionothermal methods, which are usually unavoidable in terms of a large amount of solvents, high energy consumption, high autogenous pressure and low yields [5,9,10]. Dry gel conversion (DGC) and solvent–free synthesis have been studied extensively with a significant increase in the space–time yield of zeolite production [11,12,13,14]. The DGC process is carried out in a specially equipped reactor at a temperature of 150~200 ℃, where a dry gel sample is placed on the top of a Teflon reservoir with water or other volatile liquids [15]. In addition, the powder–state dry gel is obtained by being oven–dried at 60 °C~100 °C to remove the large amount of water solvent, which can be regarded as pre–crystallization treatment and may destroy the framework of the initial gel [16,17,18]. In 2001, the direct formation of self–bonded pellets to MOR zeolite via the treatment with low–water–content systems was researched by P. De Luca et al., addressing the issues resulting from excessive water usage [19]. In 2012, a novel and generalized solvent–free route was proposed by Xiao’s group for synthesizing zeolites with a physical mixture of hydrated solid raw materials, followed by grinding and heating, where the solvents could be almost completely avoided [20]. Compared with the traditional hydrothermal methods, it not only significantly enhances the zeolite yields but also decreases to a great extent the production of polluted waste. However, it should be noted that the hydrated form of raw materials is a crucial factor in solvent–free synthesis. Nowadays, it is still a big challenge for industrial conventional anhydrous raw materials [2,20,21].
The ice-templating method (also known as freeze casting or ice–segregation–induced self–assembly) has the advantages of versatility, cost efficiency and environmental friendliness in porous constructing technology. It has been extensively used in the preparation of porous inorganic materials, the design of biological materials and even human tissue engineering [22,23,24]. Small ice crystals were formed during the frozen process and act as templates to change the initial structure of the precursors, which are then removed by sublimation during the drying stage, leaving the precursors with porous structures [25,26,27].
Herein, we proposed a novel route for the rapid and efficient synthesis of MOR zeolite by the ice-templating method. Compared with traditional hydrothermal synthesis, it shows distinct advantages with respect to fast nucleation and crystallization, high crystallinity, high zeolite yields, simple device and conventional silica sources. Considering those “efficient” properties, it is believable that the ice-templating method is of significant importance for zeolites production.

2. Results and Discussions

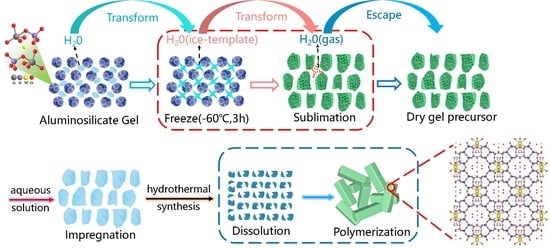
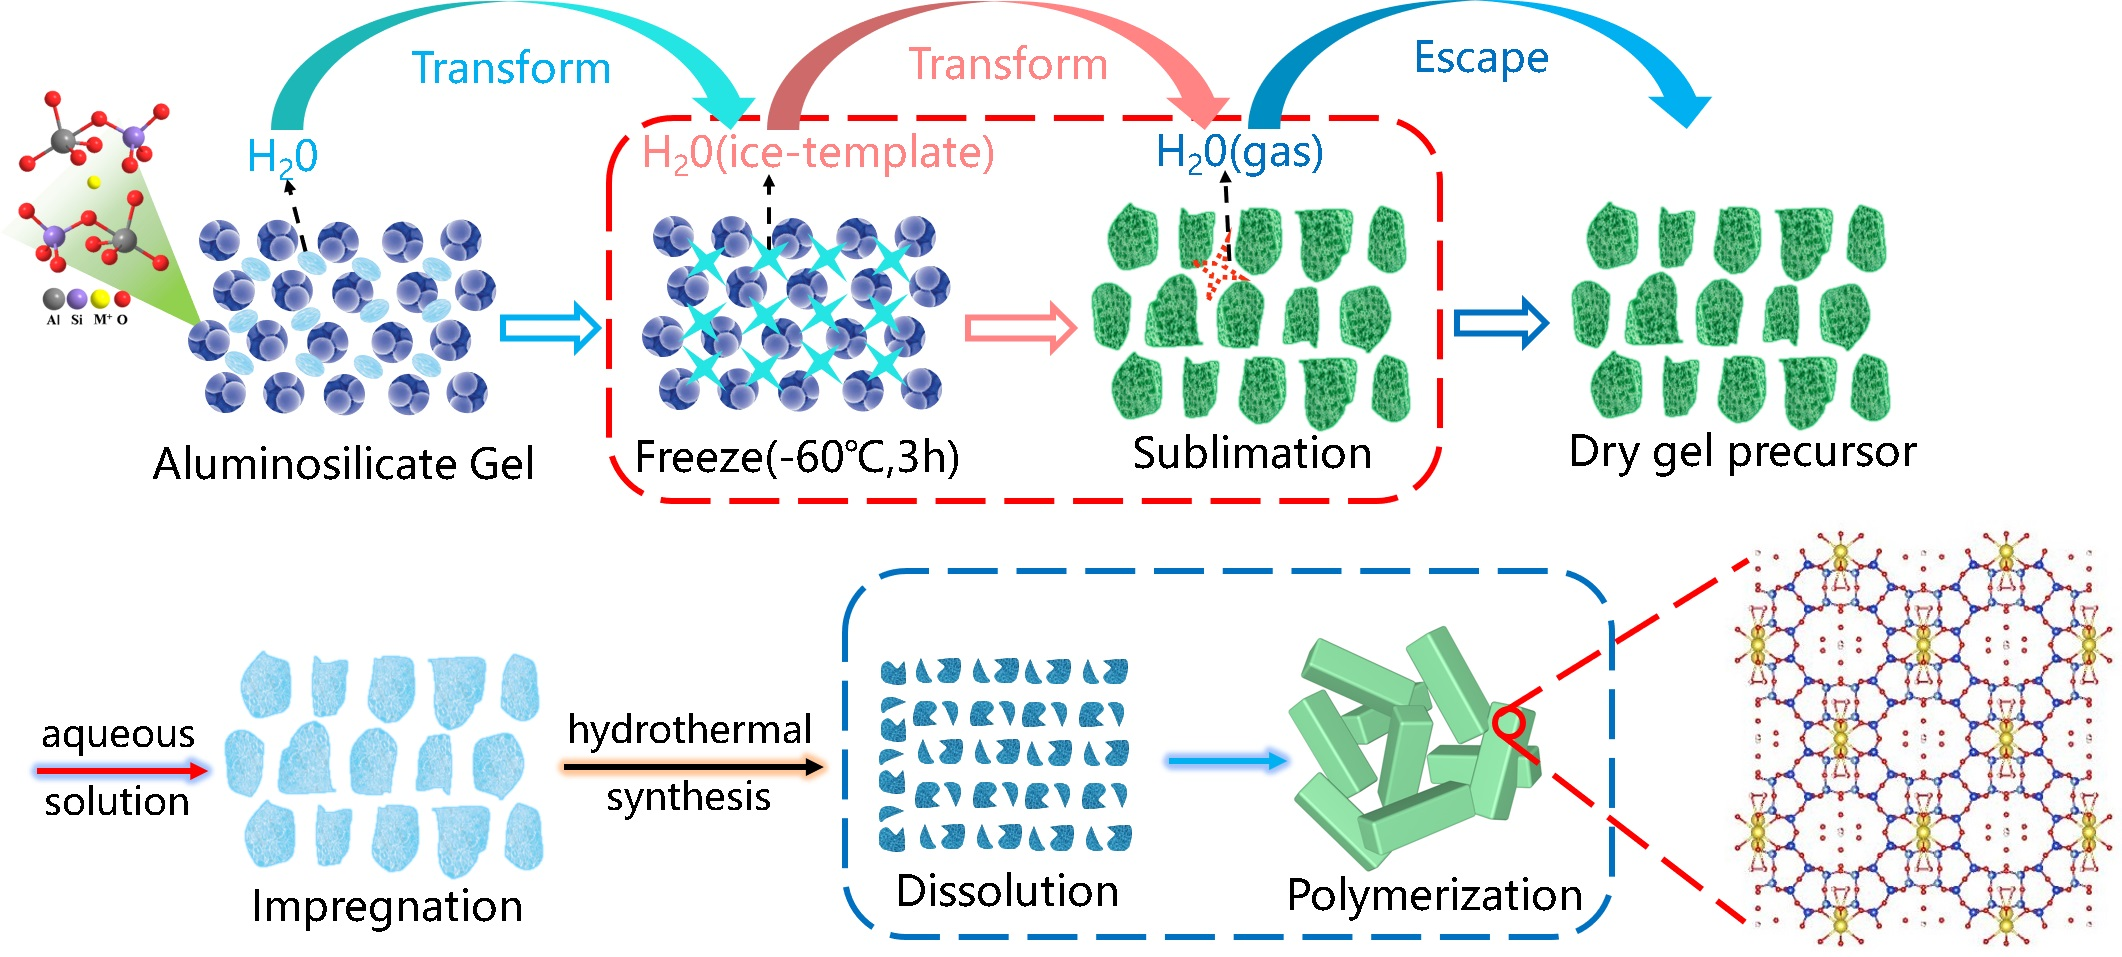
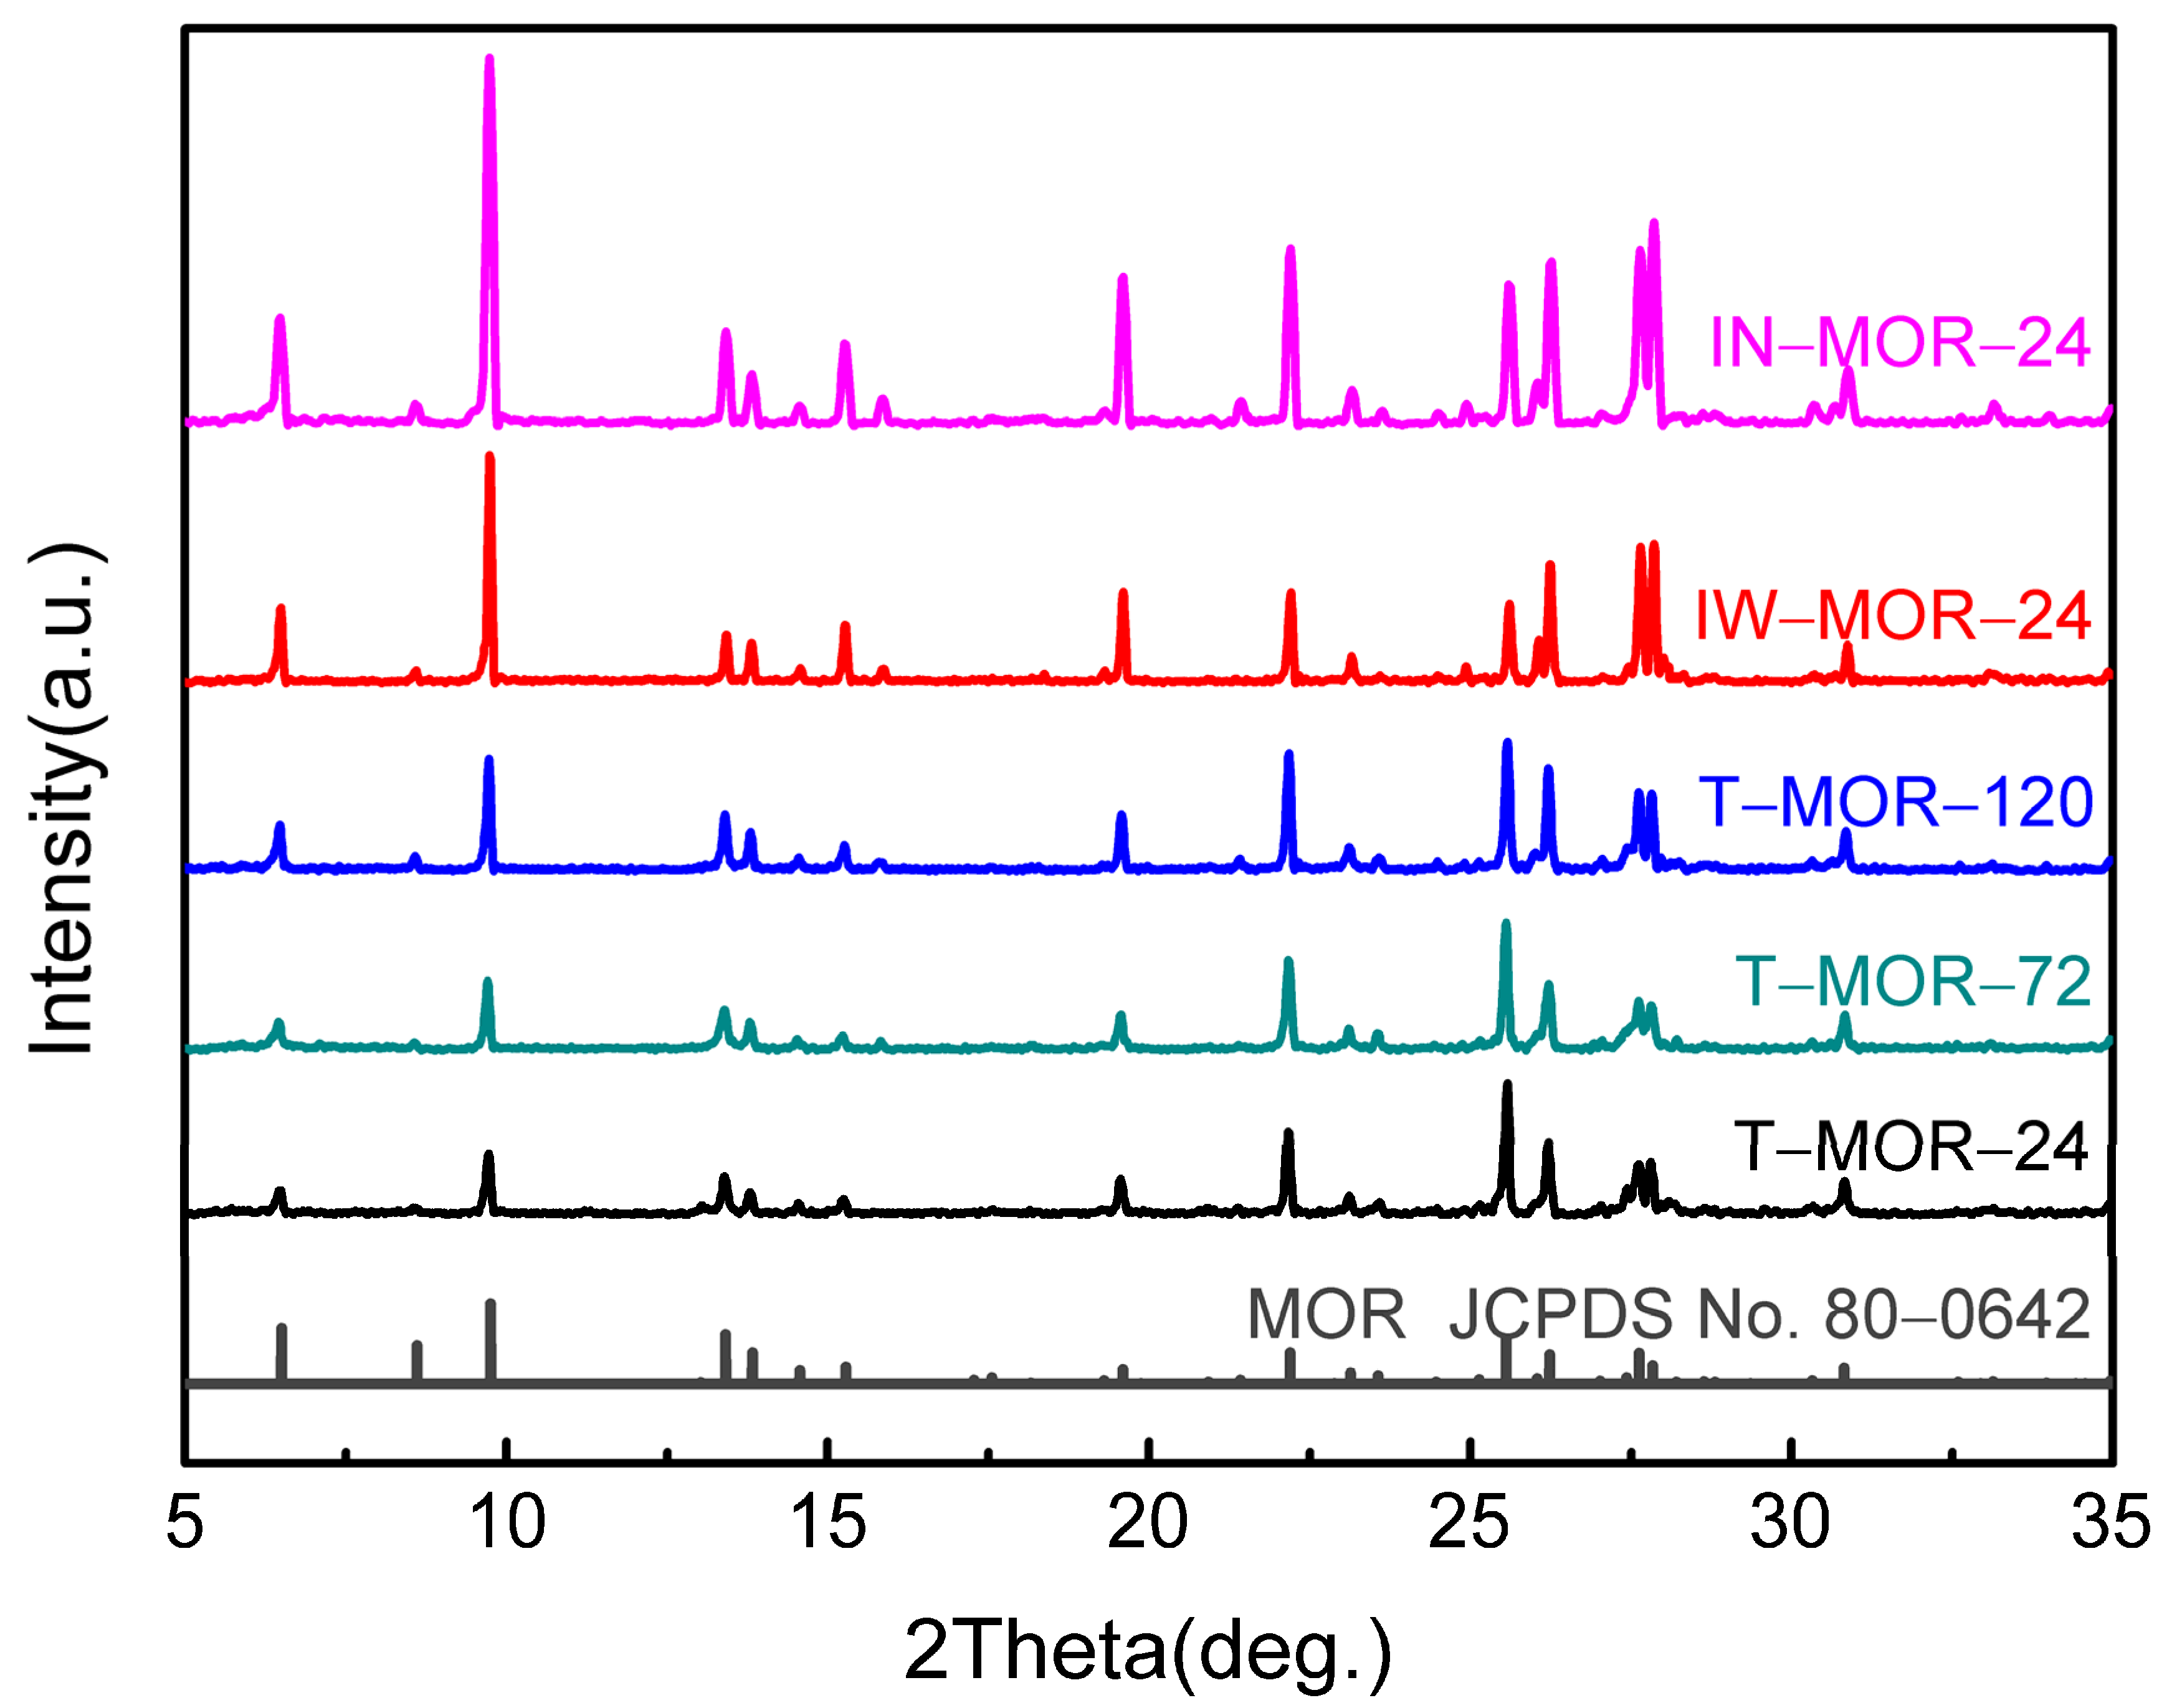
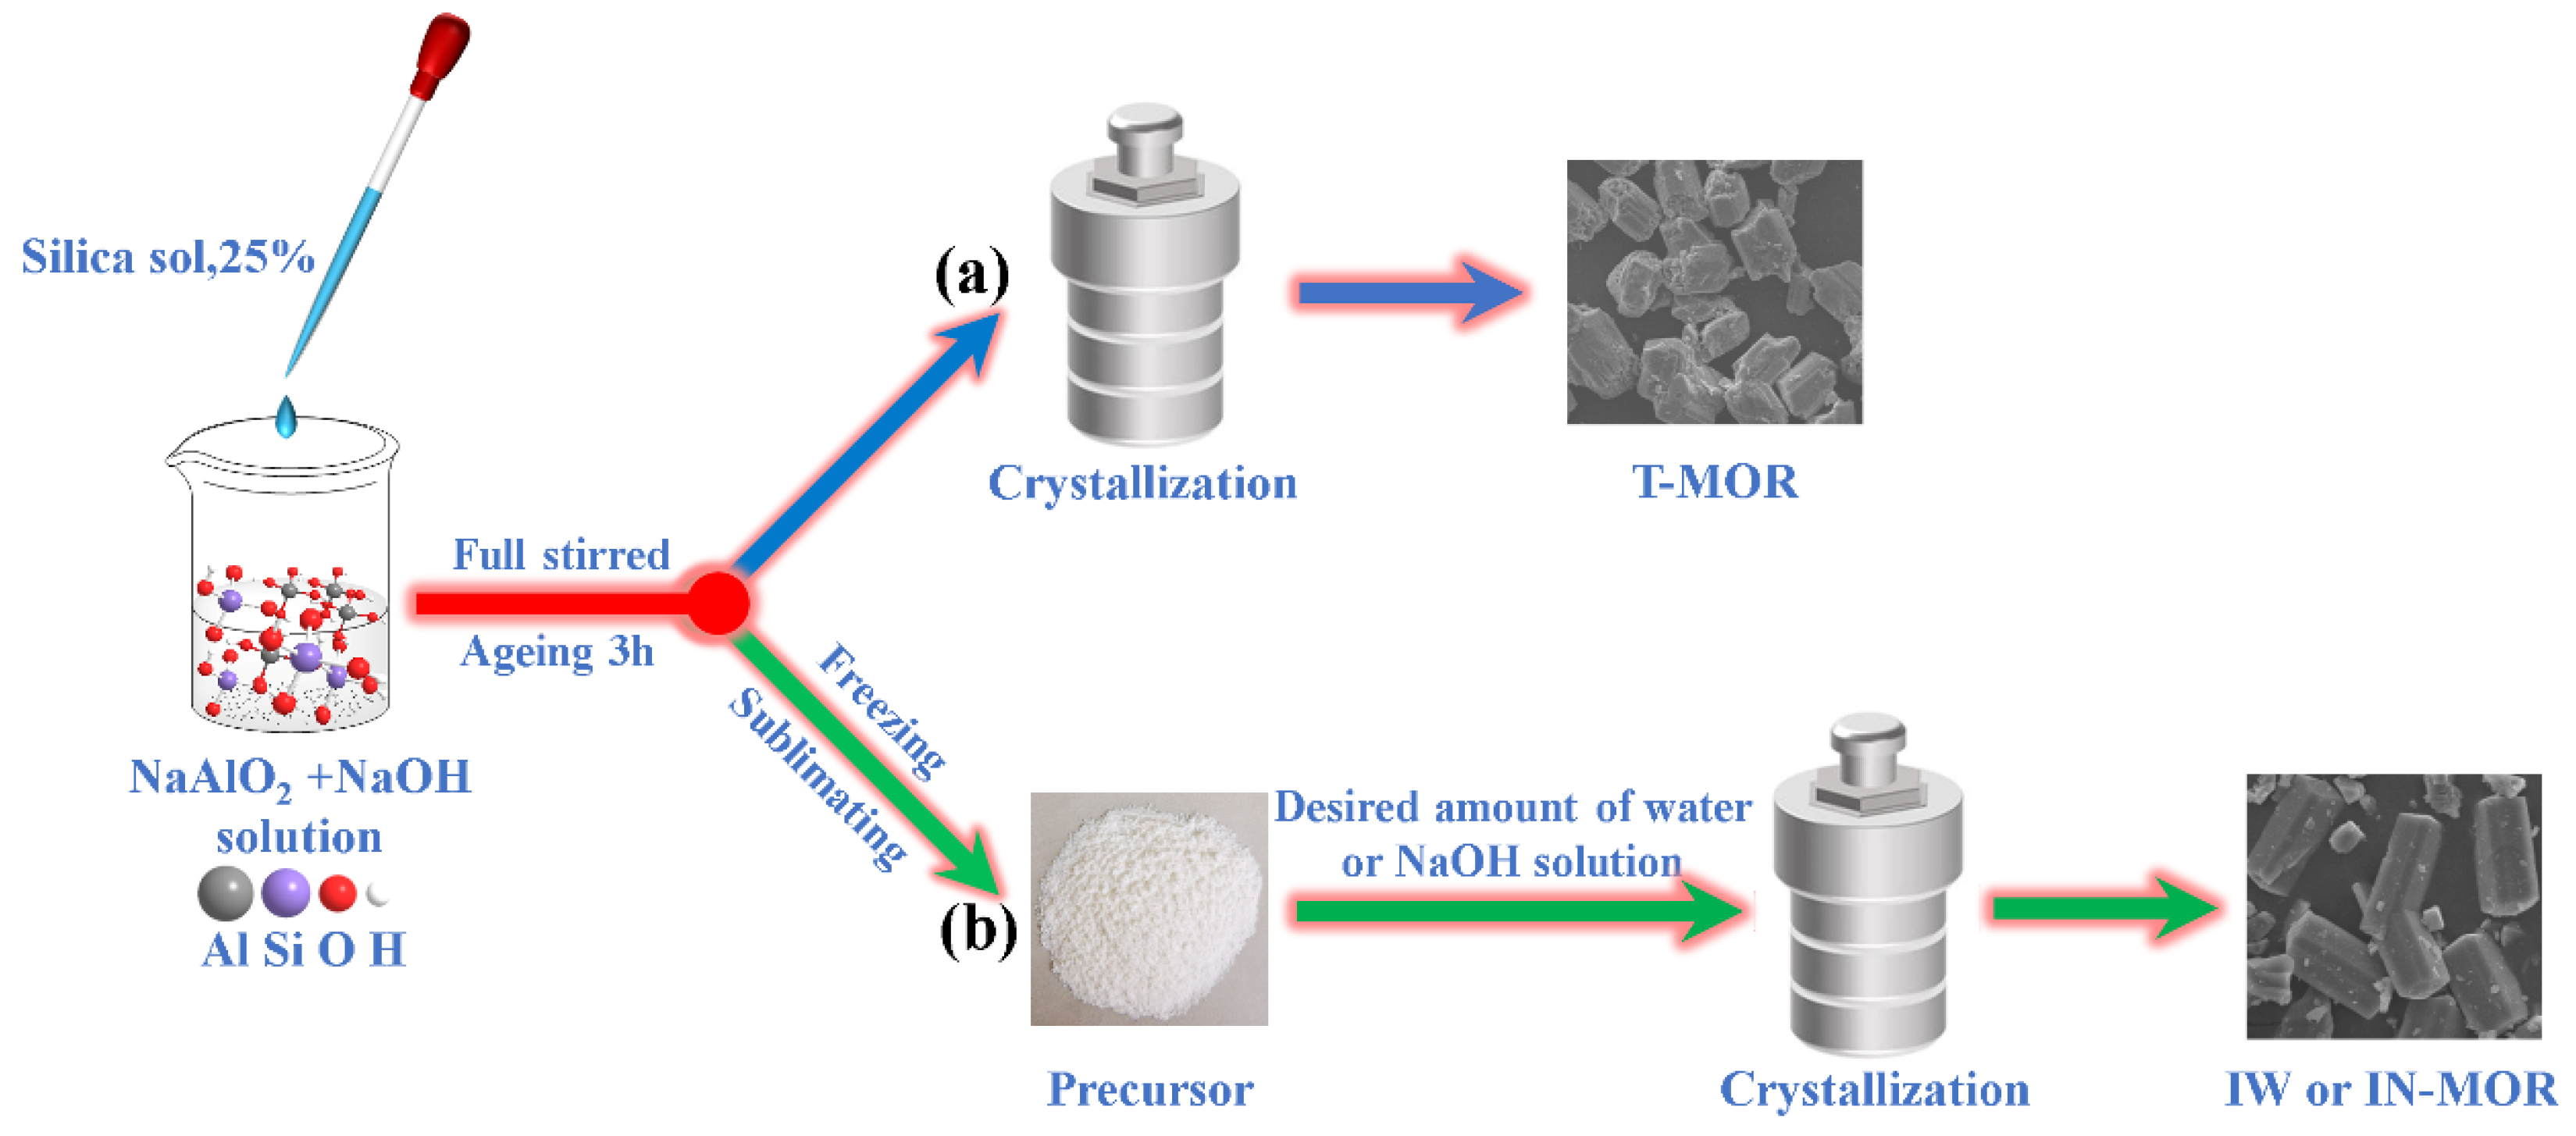
2.1. Formation of MOR Zeolite by Ice-Templating Method

The XRD patterns in Figure 1 show the typical features of MOR zeolites produced by the traditional hydrothermal synthesis method with H2O/SiO2 = 17.7 at 180 °C for 24 h (T–MOR–24), 72 h (T–MOR–72) and 120 h (T–MOR–120), as well as the sample prepared by the ice-templating method under a desired water (H2O/SiO2 = 3.0) or Na2O content (H2O/SiO2 = 3.0, Al2O3/Na2O = 34) at 180 °C for 24 h (IW–MOR–24 and IN–MOR–24, respectively). All of these samples reveal a high crystallinity that is consistent with the standard XRD pattern of MOR zeolite (JCPDS No.80–0642) [28,29]. It indicates that the well–designed MOR zeolites were successfully synthesized via the ice-templating method in this work. Furthermore, it seems that the crystallinities of the prepared IW–MOR–24 and IN–MOR–24 zeolites are superior to that of T–MOR–120, showing in the relatively enhanced diffraction peaks at 2θ values of 9.7°, 22.2°, 25.6°, 26.2° and 27.6° in Table 1 (the relative crystallinity of the samples was calculated according to Section 3.3, and the IN–MOR–24 samples were regarded as 100%). This result clearly demonstrates that the crystallization rate of zeolites was accelerated by the ice-templating method, especially when the dry gel was crystallized under a desired Na2O content.

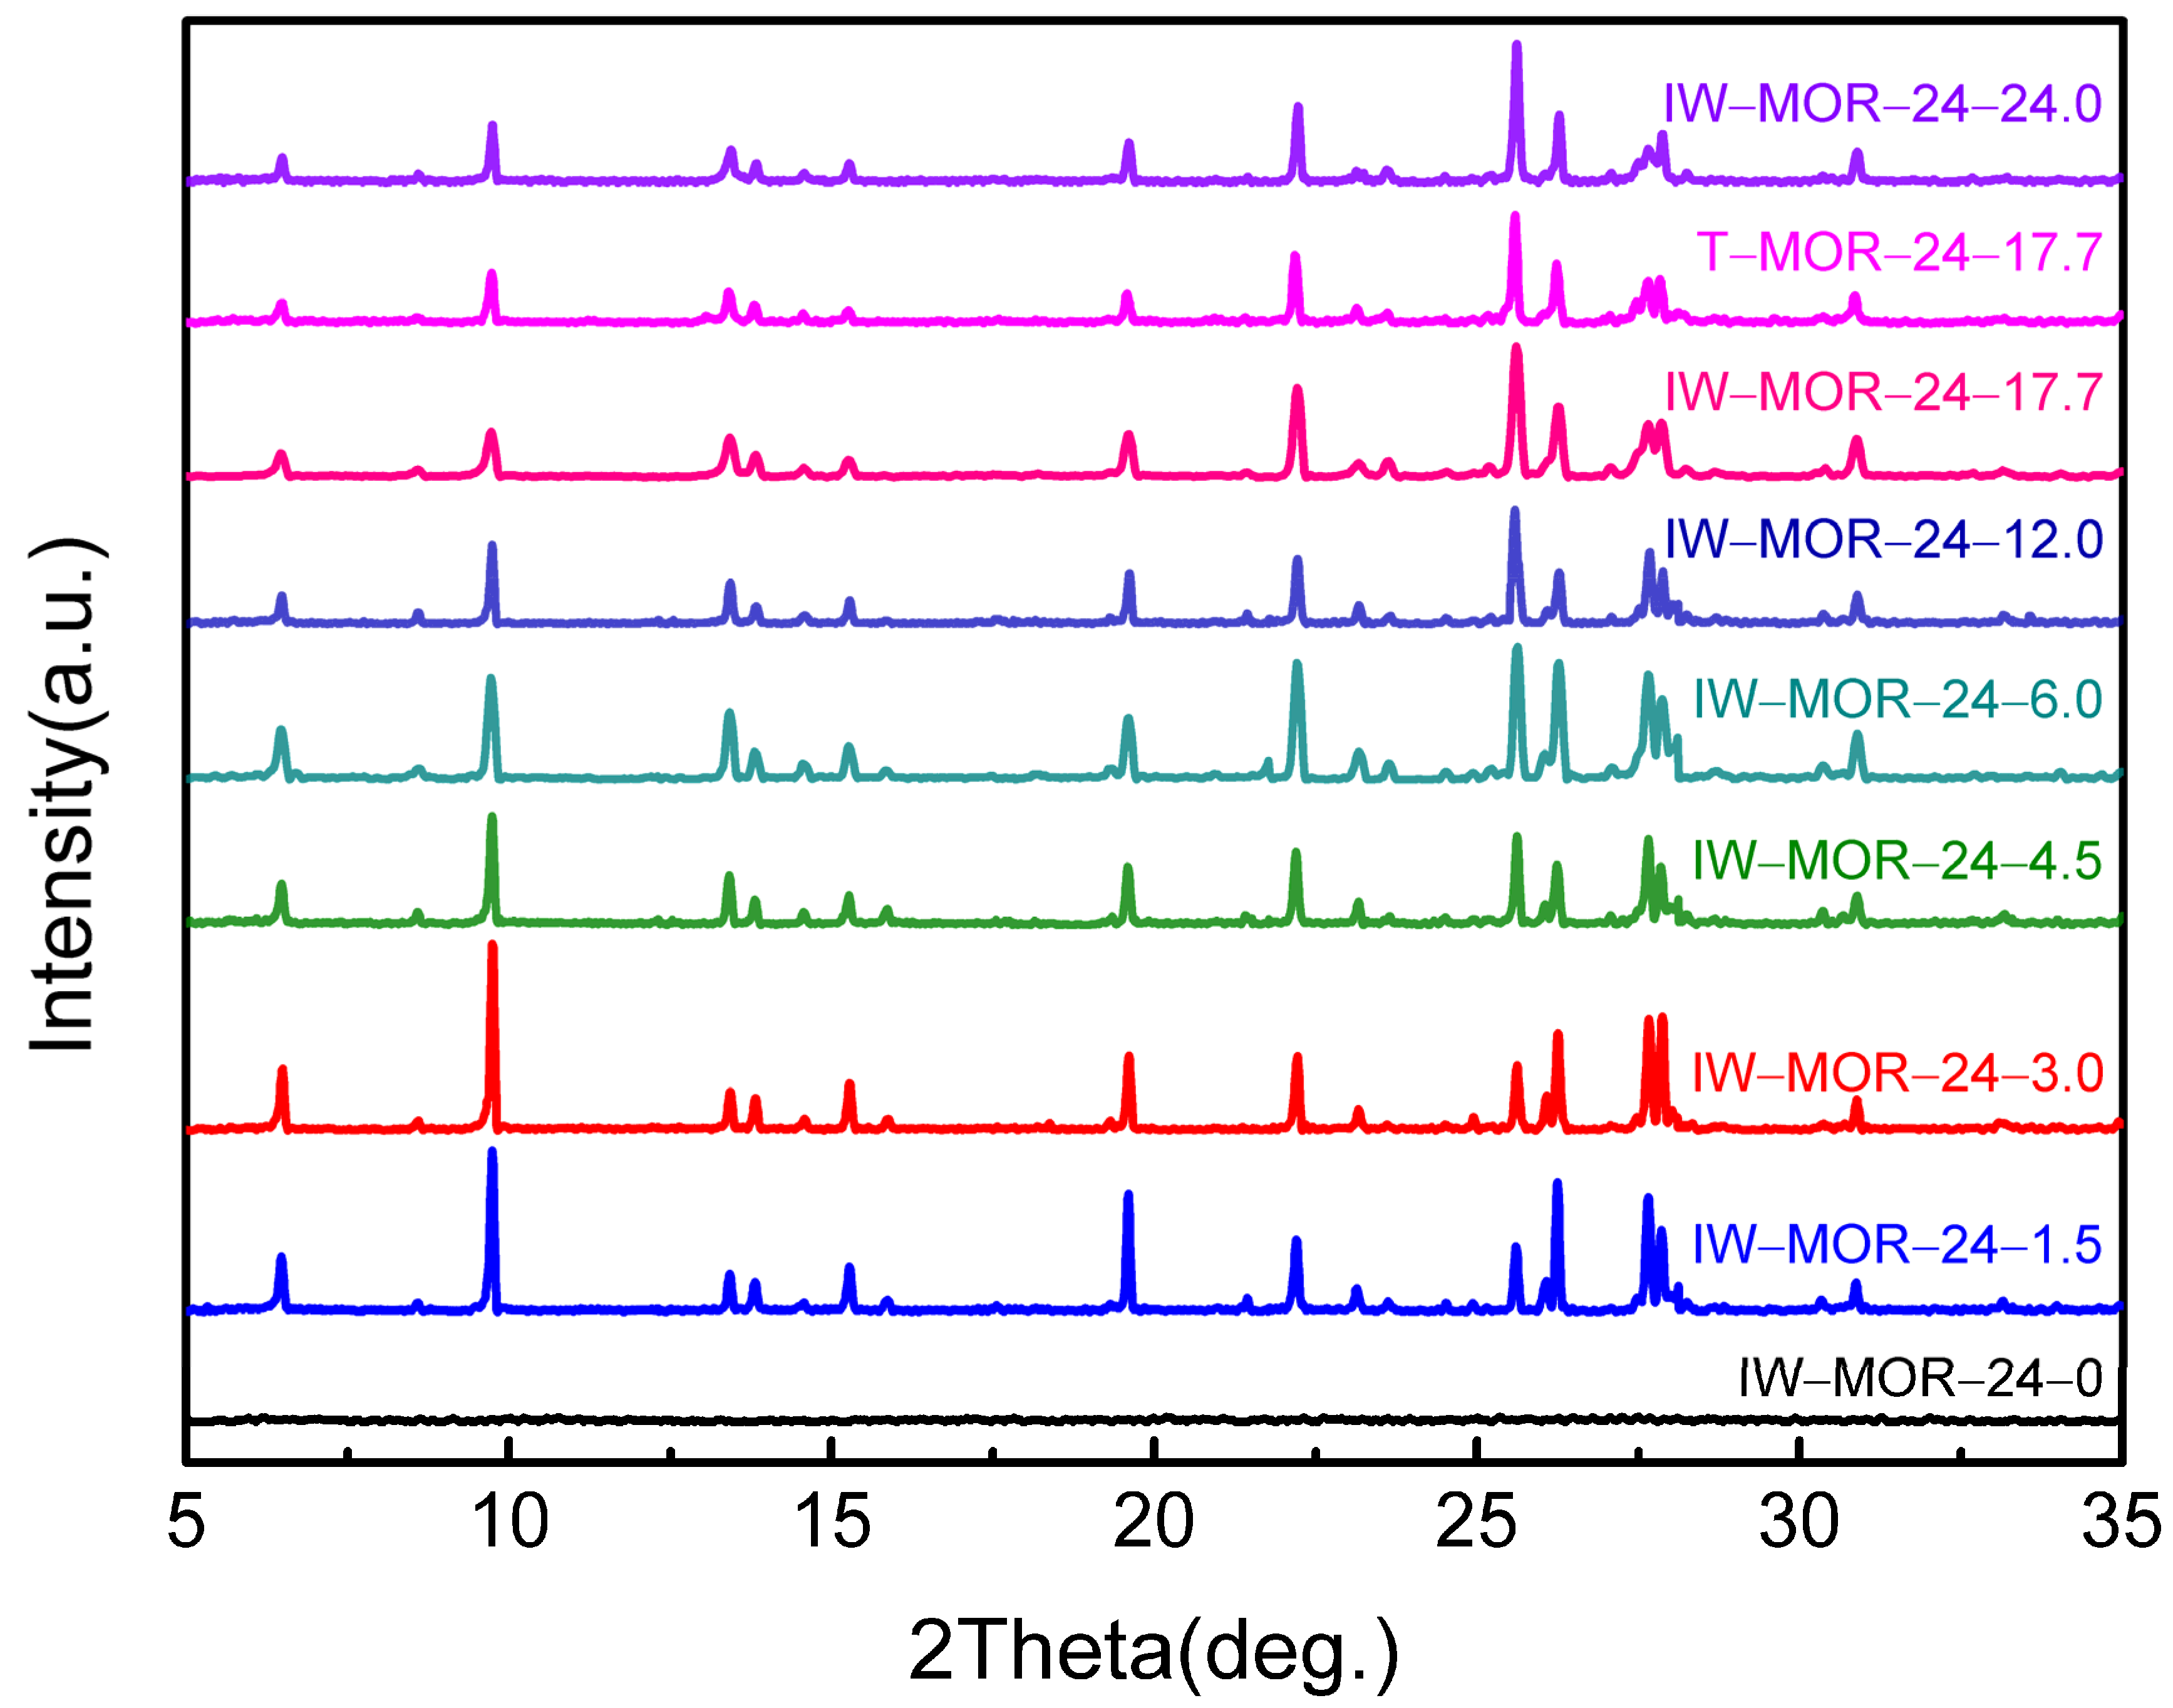
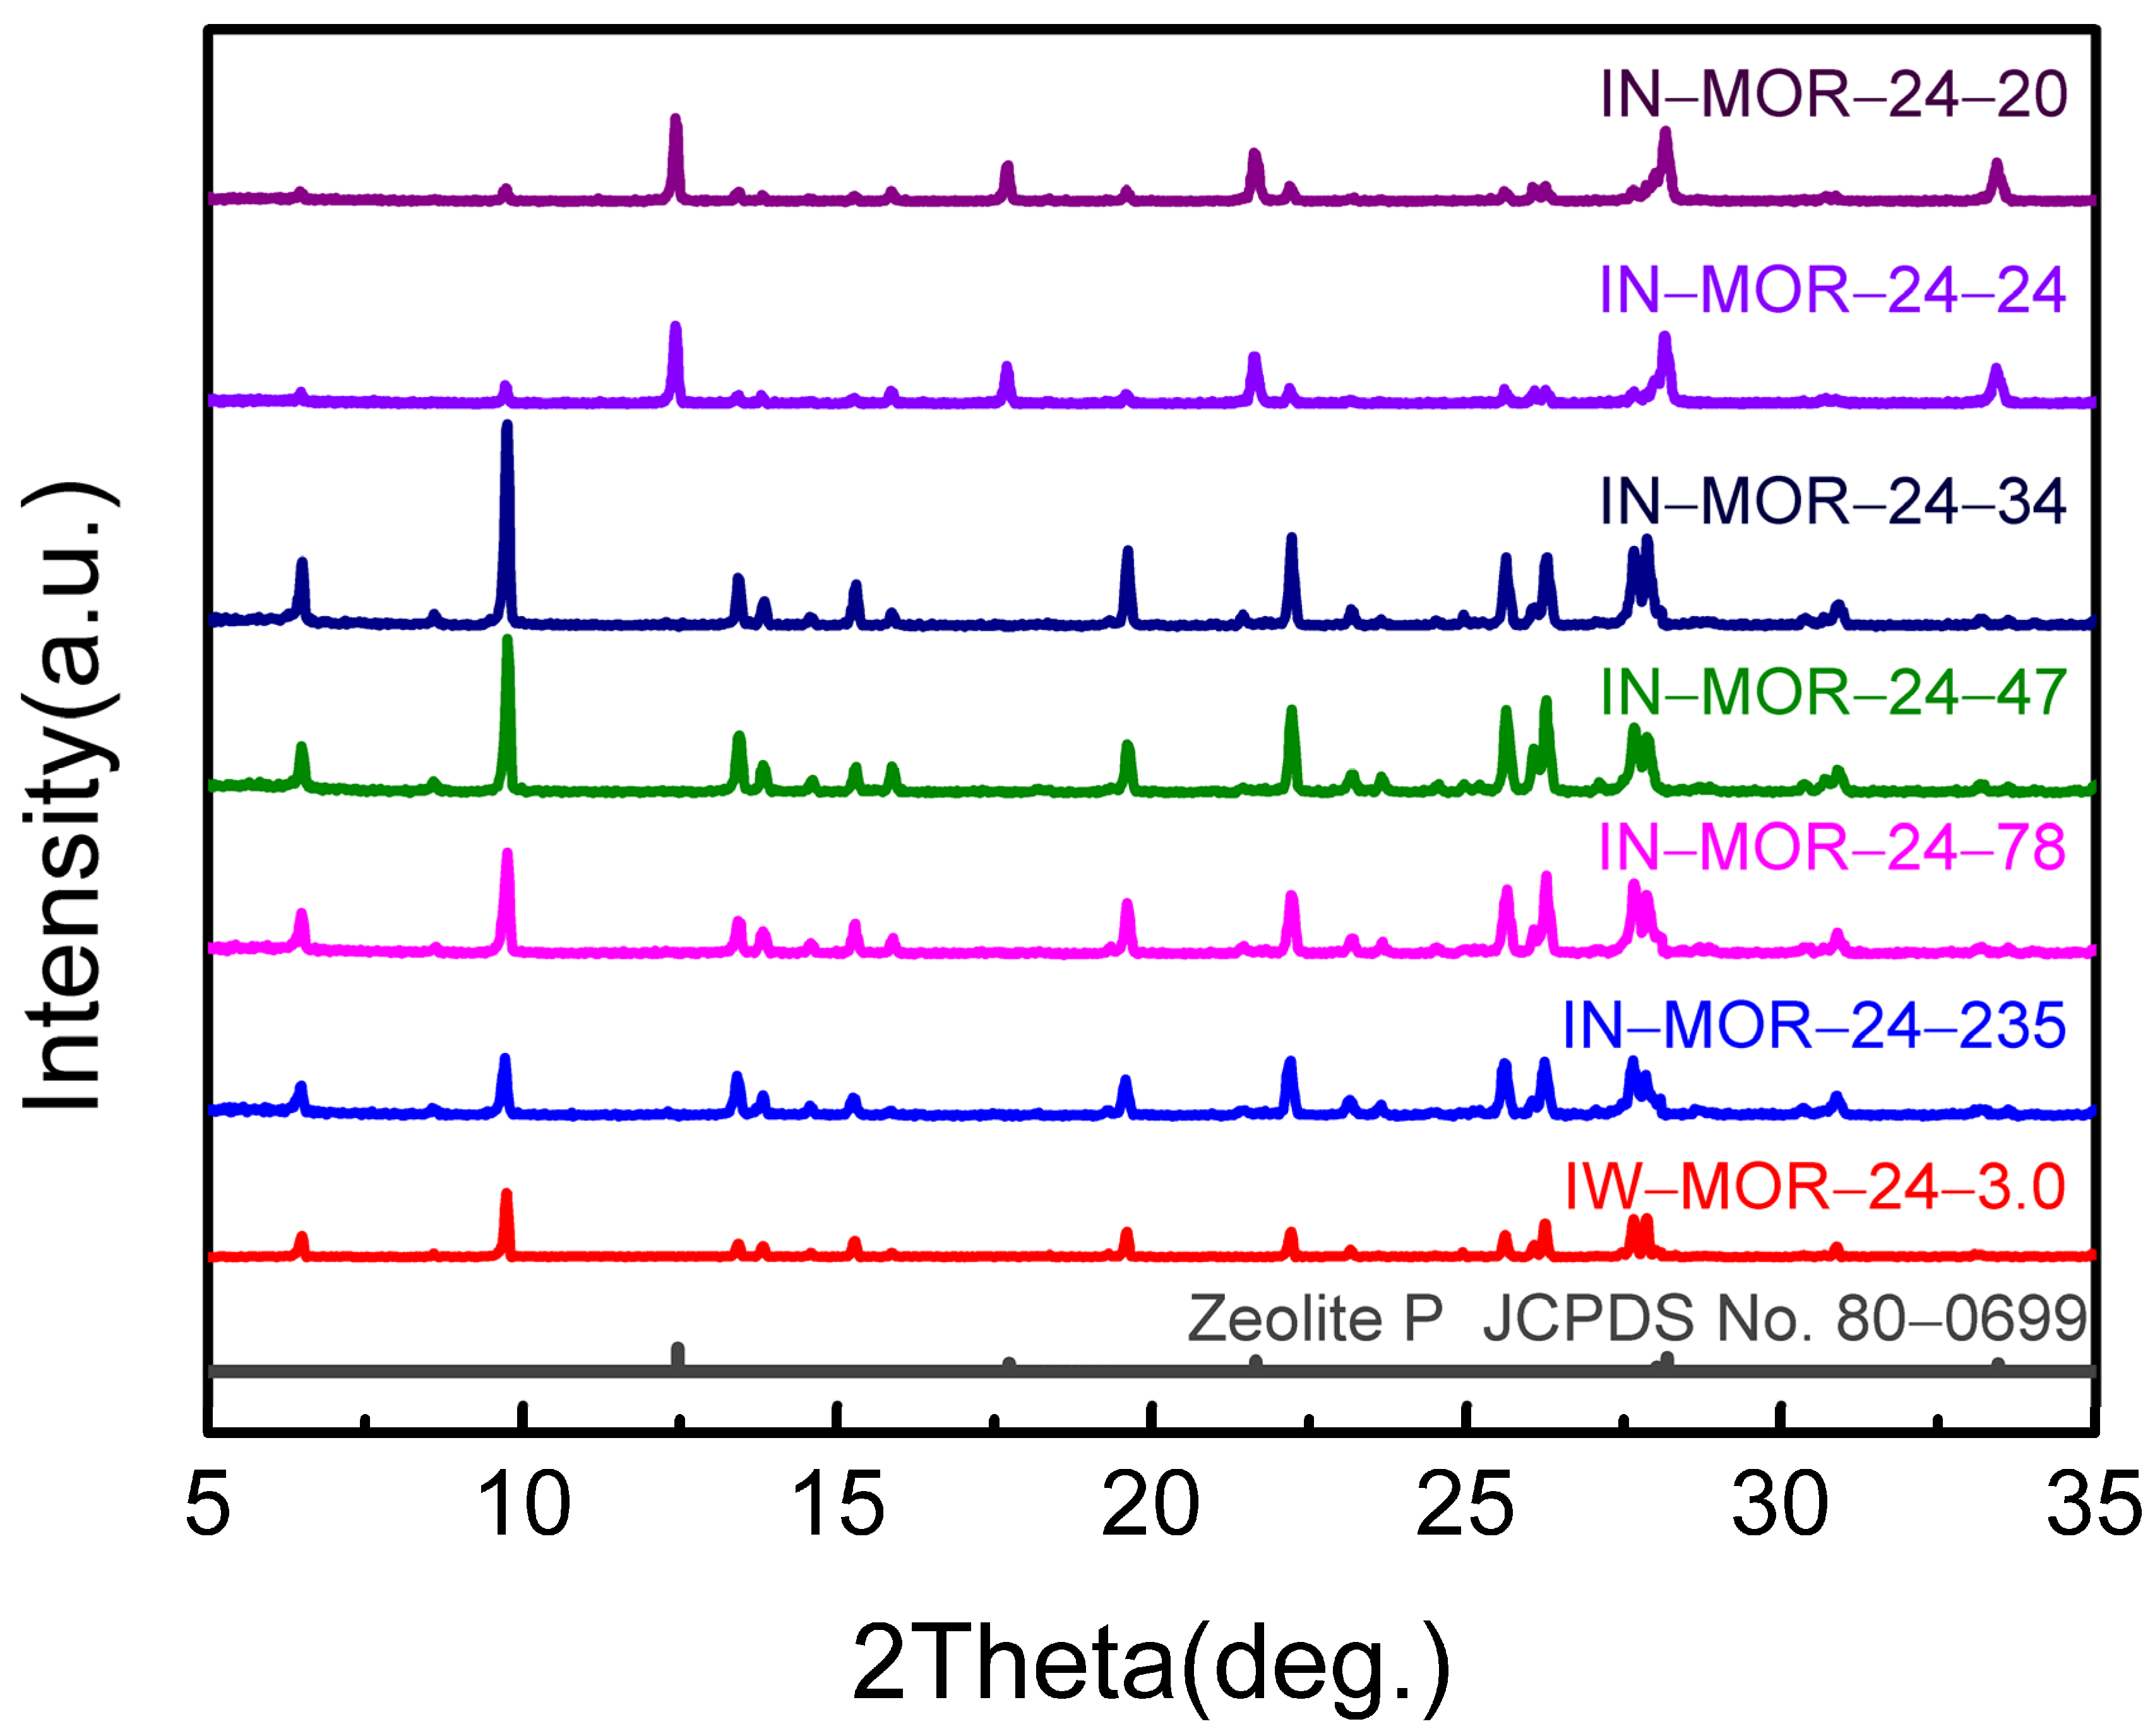
2.2. Influence of H2O/SiO2 Ratio during the Crystallization of Dry Gel

To achieve a deeper understanding of the water role during the crystallization of dry gel, the MOR samples were crystallized with different H2O/SiO2 molar ratio ranging from 0, 1.5, 3.0, 4.5, 6.0, 12.0, 17.7 to 24.0 under 180 °C for 24 h. The prepared catalysts in this section were donated as IW–MOR–24–x, where x represents the H2O/SiO2 ratio, while the sample prepared by traditional hydrothermal synthesis was designed as T–MOR–24–17.7. It can be seen clearly from the XRD patterns (Figure 2) that IW–MOR–24–0 zeolite without any water amount displays no diffraction peaks, which suggests that the synthesis of zeolite requires a small amount of water participation at least [14,30]. Furthermore, the crystallinity of the zeolites tends to be enhanced as the H2O/SiO2 ratio increases from 1.5 to 3.0, while the crystallinity gradually decreases as the water amount increases further to 4.5 and even more. It is generally believed that there is a depolymerization process of the formed amorphous aluminosilicate gel and a repolymerization to a desired topology through nucleation and crystal growth during hydrothermal synthesis [31,32]. It can be inferred that the depolymerization process and the number of spontaneously generated nucleus sites is sufficient for achieving perfect crystallization within only 24 h with such a small amount of water (H2O/SiO2 = 3.0), which is much more efficient than the traditional hydrothermal synthesis method with H2O/SiO2 = 17.7. It can be attributed to the generation of a high concentration of the Si, Al–O–Si, Al bonds for repolymerization and the concentrated hydroxyl ions (OH) for the coordination of tetrahedral silicon atoms to pentahedral or octahedral silicon atoms to accelerate zeolite crystallization [21,33], which is further confirmed in Section 2.3. Furthermore, a significant reduction in autogenous pressure can be achieved by the addition of trace water in the crystallization process; hence, the security concerns are effectively resolved. Whereas it is revealed that the crystallinity of the samples significantly decreases as the water amount increases further from 4.5 to 24.0 ratio. It is noteworthy that almost the same crystallinity is observed in the IW–MOR–24–17.7 and T–MOR–24–17.7 samples. The results presented above can be attributed to the decreased concentration of the Si, Al–O–Si, Al bonds, as well as the decline in alkaline content with a higher H2O/SiO2 ratio, which is further confirmed in the following Section 2.3.

2.3. Influence of Alkaline Content during the Crystallization of Dry Gel

The dry gel precursor was crystallized under a series of alkaline ratios in Figure 3 at the above perfect crystallinity of H2O/SiO2 = 3.0, with the purpose of investigating the effect of alkaline content on zeolite crystallization. The prepared catalysts in this section were donated as IN–MOR–24–x, where x represents the Al2O3/Na2O molar ratio. It is clearly demonstrated that the crystallinity significantly increases with the increased Na2O content (Figure 3). At the same time, IW–MOR–24 without Na2O content presents a relatively low crystallinity. It is widely accepted that Na2O plays an essential role in accelerating the crystallization of zeolites by decreasing the polymerization degree of polysilicate ions, and thus enhancing the polymerization between polysilicate ions and aluminate ions [32,33,34]. It should be noted that the similar enhancing acceleration happens to the samples by the ice-templating method with the increasing Na2O content from 235~34, showing on the increased peak intensity. However, the further increased Na2O content up to 24 and 20 gives rise to the significant degeneration of distinct characteristic peaks (2θ = 9.7°, 22.2°, 25.6°, 26.2° and 27.6°) and the enhanced peaks intensity (2θ = 12.5°, 17.7°, 21.6°, 28.1° and 33.4°) with evolution to zeolite P [35,36]. It can be inferred that the excessive Na2O content is favorable for zeolite P, which is in agreement with the literature report preparing zeolite P by the hydrothermal treatment of natural mordenite with NaOH solutions [37,38].

2.4. Elucidation of the Crystallization Behavior

For a further understanding of the crystallization behavior of MOR zeolite by ice-templating method, the framework structure and morphology of the aluminosilicate intermediates at various crystallization periods were characterized by XRD (Figure 4), SEM (Figure 5) and FT–IR (Figure 6). As shown in Figure 4 and Figure 5, IW–MOR–2 and IW–MOR–4 samples suffered from little or no crystallinity and an irregular morphology, which could be considered as the depolymerization process of the dry gel and spontaneous formation of nucleus sites. Subsequently, the samples gradually evolve into zeolite P with improved crystallinity and partially regular morphology as crystallization, proceeding to 8 h (IW–MOR–8) and 12 h (IW–MOR–12). In contrast, intensive and characteristic diffraction peaks of MOR appeared on the samples, IW–MOR–16, IW–MOR–24 and IW–MOR–36, crystallized for more than 16 h, which is in good agreement with the SEM images, although there are still some small irregular particles, aside from the constantly regular morphology, as shown here. It was suggested that the phase transformation of irregular zeolite P existed during the initial crystallization process. Combined with the above results that zeolite P could be formed with the extension of the Na2O content, it could be concluded that there was a reverse–phase transformation between MOR and zeolite P.
In addition, the further enhanced intensity of the MOR characteristic peaks and changes in morphology with the extension of crystallization time from 24 h to 36 h were not observed. Furthermore, a decreased intensity of the distinct MOR peaks and a smaller irregular morphology were exhibited on the IW–MOR–48 sample (Figure 4 and Figure 5). These observations indicate that the sufficient crystallization can be accomplished with H2O/SiO2 = 3.0 at 180 °C for 24 h.
The vibrations of TO4 (T = Si and Al) tetrahedra were monitored by FT–IR spectroscopy in the 400~1300 cm−1 range on samples synthesized by the hydrothermal method for 24 h and the ice-templating method for 16 h, 24 h, and 36 h (Figure 6). It was recognized that the major characteristic absorption peaks at 430 cm−1, 570 cm−1, 802 cm−1, 1035 cm−1 and 1220 cm−1 were ascribed to the MOR framework [29,39], which is shown on the as–synthesized MOR zeolites in this work. It also proves the successful formation of well–constructed MOR zeolites via the ice-templating method, consistent with the XRD results. It should be noted that the maximum absorption peak at 1035 cm−1 were generally ascribed to the asymmetric stretching vibration of the Si–O–Si bonds. Moreover, they show a much stronger intensity for the IW–MOR–24, IW–MOR–36 and IN–MOR–24 samples in comparison with the T–MOR–24 and IW–MOR–16, suggesting the greater ordering degree of T–O units and crystallinity of samples, as revealed in the XRD patterns.

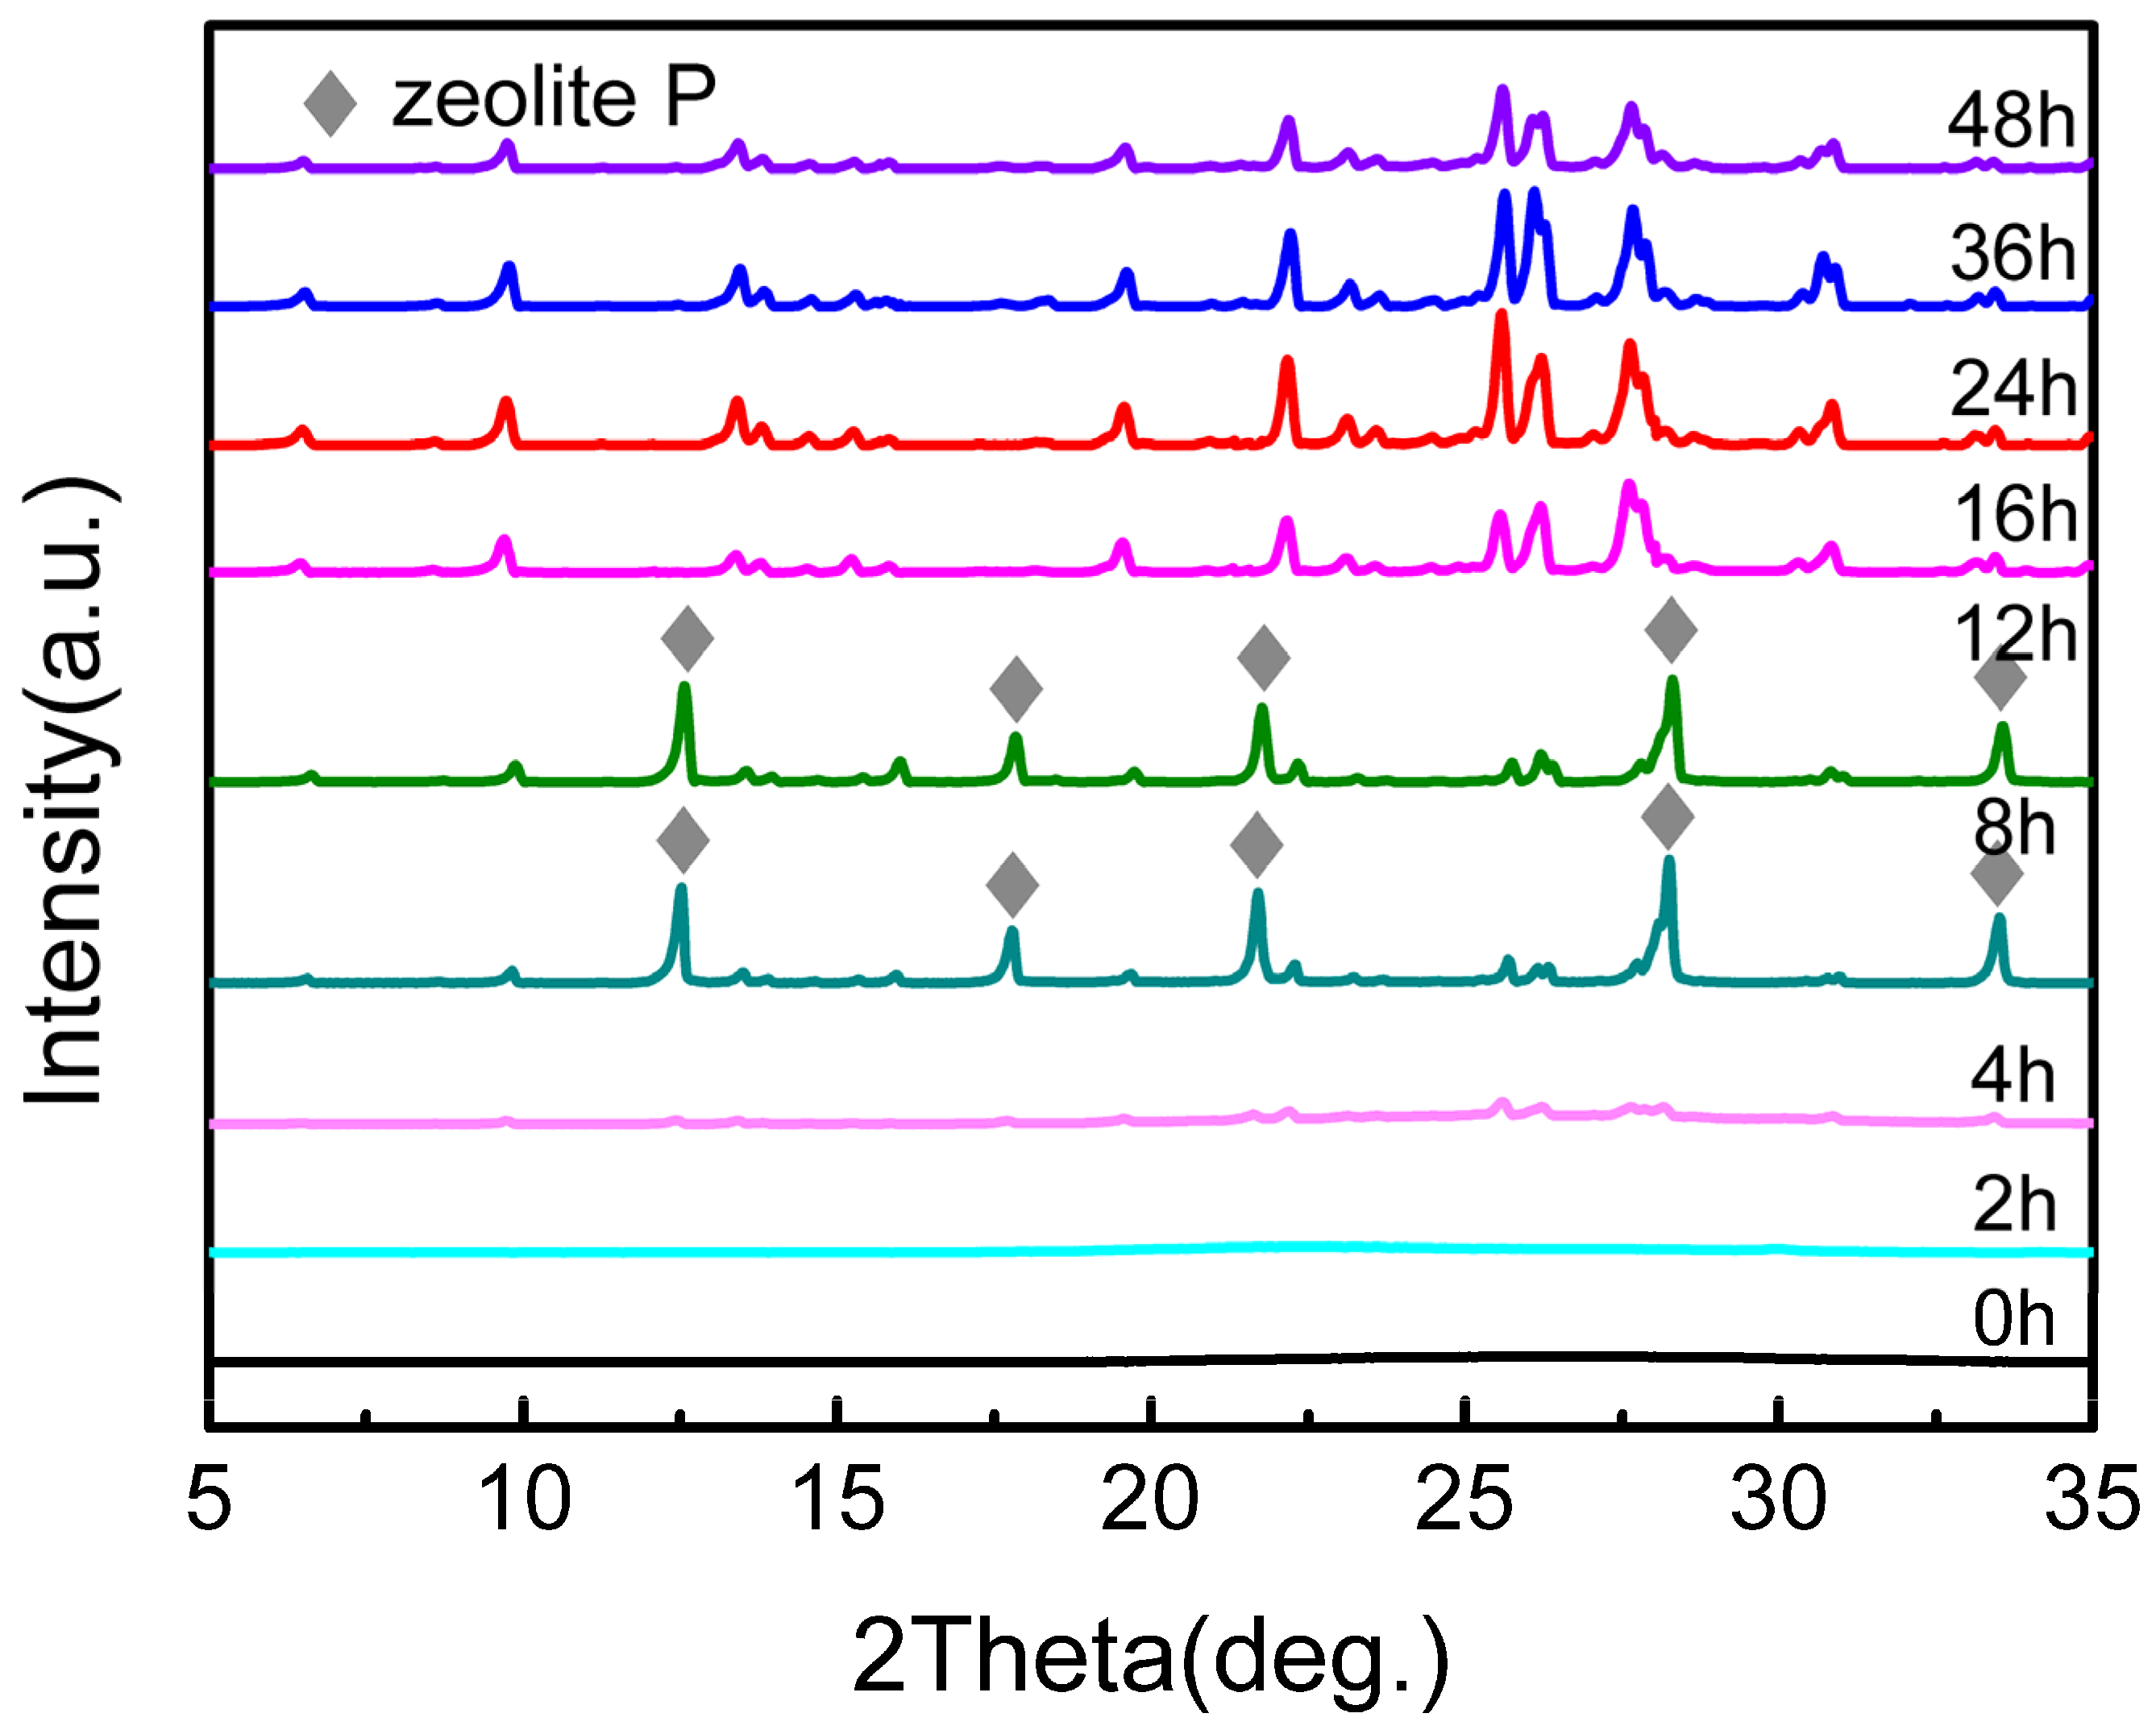
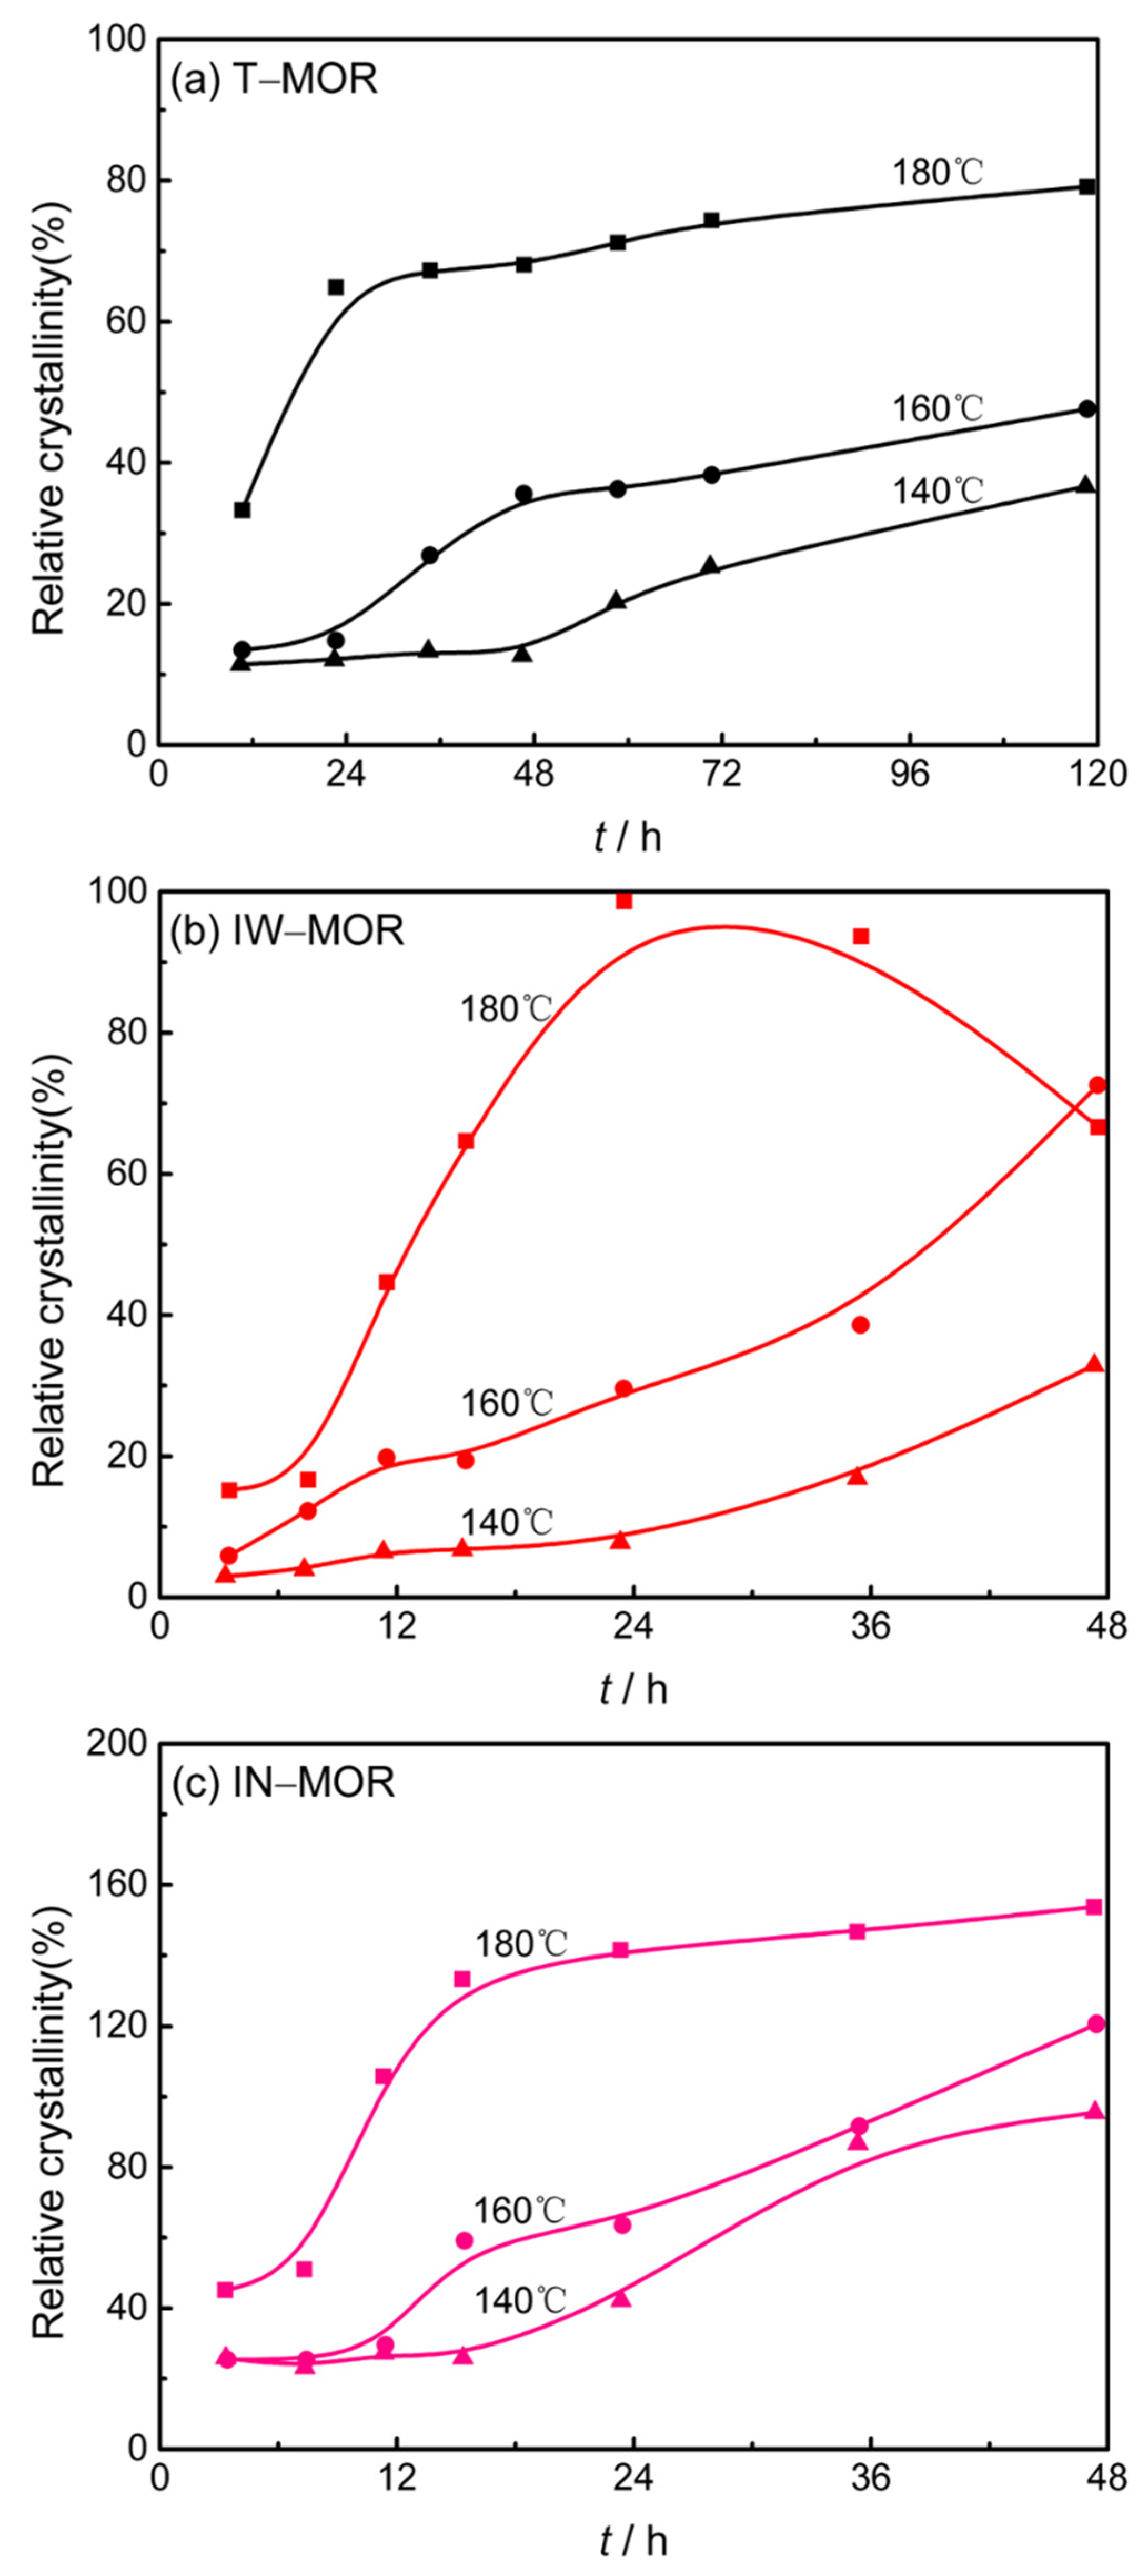
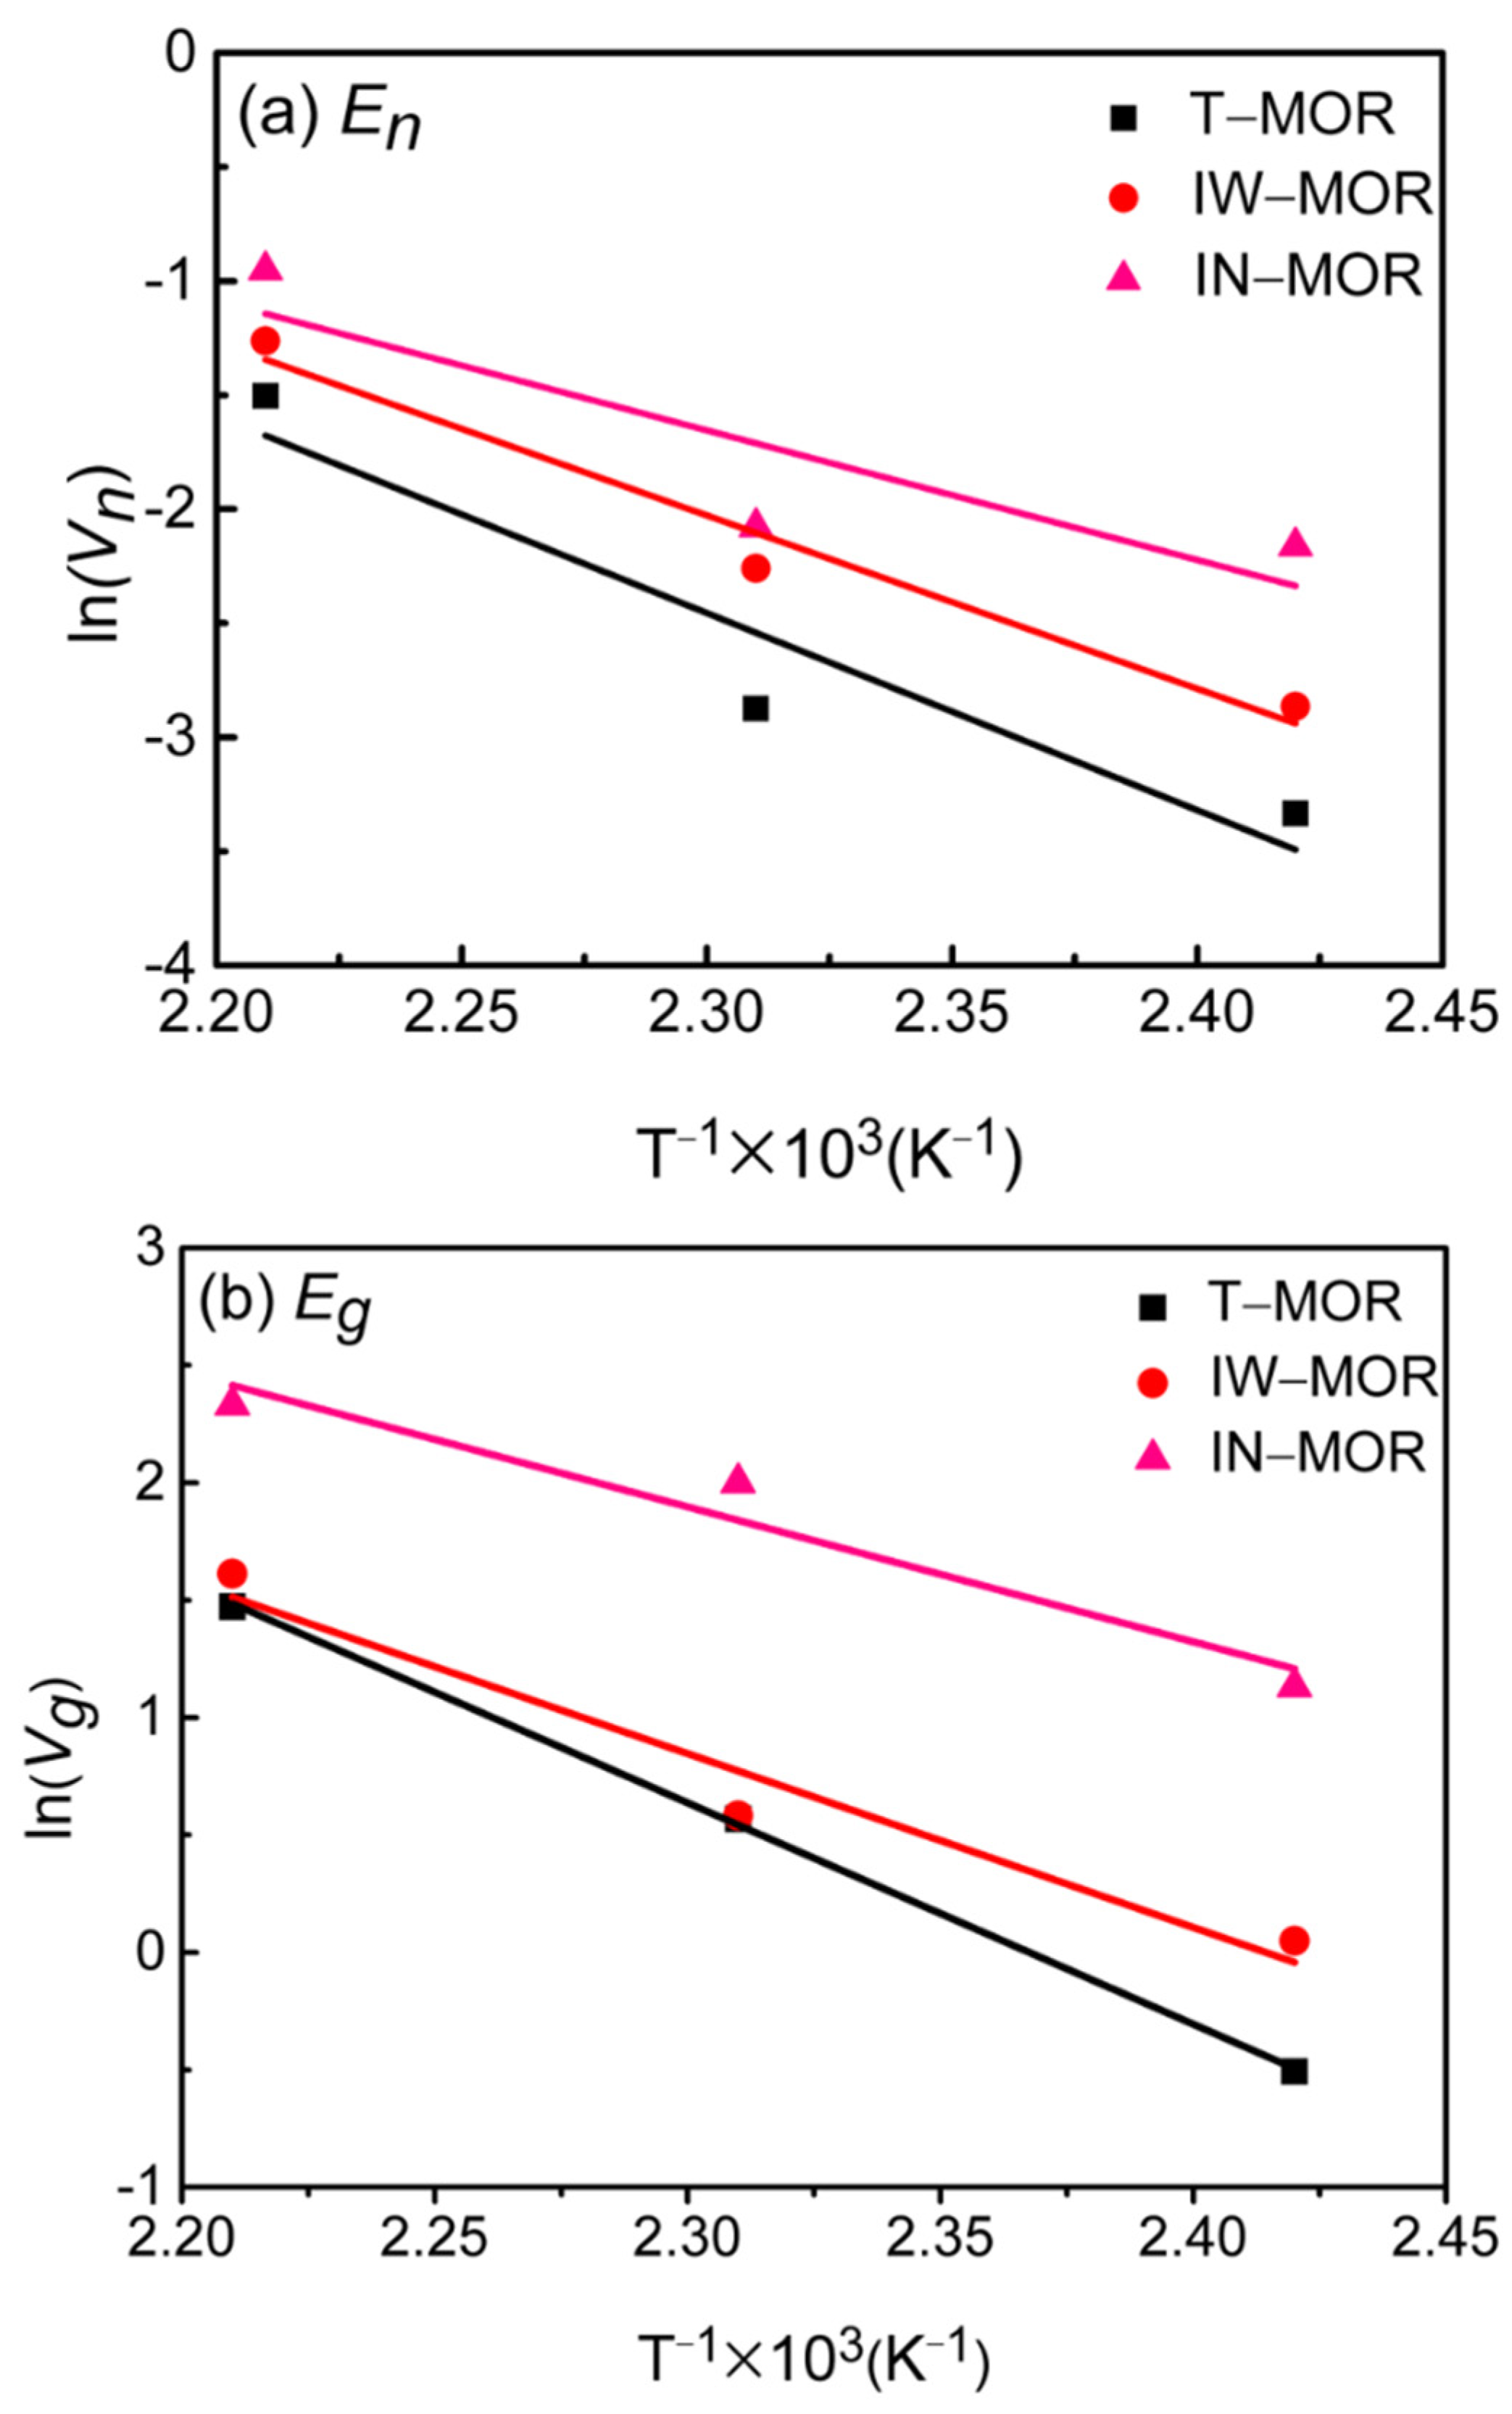
2.5. Crystallization Kinetics

To shed more light on the nucleation and growth of MOR zeolite, as well as a more precise control of the MOR formation, the crystallization kinetics of the synthetic system, using the hydrothermal (T–MOR–t) and ice-templating method (IW–MOR–t and IN–MOR–t), were studied on a series of “time–relative crystallinity–temperature (t–C%–T)” crystallization curves by exactly controlling the crystallization temperature and period.
The crystal nucleation induction period tn is the corresponding time extended to zero crystallinity from the rapid rising section of the crystallization curve, and the reciprocal 1/tn is taken as the crystal nucleation rate Vn. The slope of the rapidly rising section of the crystallization curve is considered as the crystal growth rate Vg (Figure 7). On the basis of Vn and Vg, the activation energy En of the nucleation and activation energy Eg of crystal growth can be obtained via the Arrhenius formula [40,41] (Figure 8).
It is shown in Figure 7 that the crystallization rate of samples slows down and they reach their respective peaks after a period of rapid rising crystallization. The relative crystallinity of the samples enhances as the temperature increases from 140 °C to 180 °C regardless of the methods used. It can be concluded that a high crystallinity can be obtained in a short time at high temperature. Simulation data, including the nucleation induction period tn, nucleation rate Vn, crystal growth rate Vg, apparent activation energy of nucleation En and crystal growth En are listed in Table 2 and shown in Figure 8. This clearly demonstrates that the higher the crystallization temperature, the shorter the nucleation induction period, and the sooner the nucleation rate and growth rate occur, regardless of the synthesis methods, which further suggests that a high temperature is conducive to both the formation and continuous growth of crystal nucleation. In addition, it clearly reveals that the ice-templating method shows advantages over the traditional hydrothermal method from the perspective of a fast nucleation rate and growth rate, as well as a lower apparent activation energy. Moreover, the significant increase in the crystallinity for the IN–MOR samples can be discussed in terms of the remarkable decrease in the apparent activation energy of nucleation and crystal growth, as well as the sharp increase in the nucleation and crystal growth rate.
In general, the crystal growth rate depends on the driving force of the phase transition (parent phase to new phase) and the migration process of the nutrient material over the new phase. The growth rate of the new phase   u is proportional to the concentration difference between parent phase C 0 and C α component at the phase boundary, defined as u ( C 0 C α ) , where it is applied to the one–dimensional, long–range diffusion growth process of Fick’s first law [42]. The mass concentration of the silicon aluminum nutrients of the T–MOR reaction system was far less than the IW–MOR and IN–MOR systems, due to the presence of a large amount of water. Meanwhile, the freezing and sublimation in the synthesis of precursors may produce a large number of pores, which is beneficial for water diffusion during the crystallinity, necessary to accelerate the depolymerization process of polysilicate ions and the repolymerization to a desired MOR zeolite. It is speculated that the ice-templating method can have a high crystal growth rate compared to conventional hydrothermal synthesis, which is consistent with the above results obtained by the simulation.

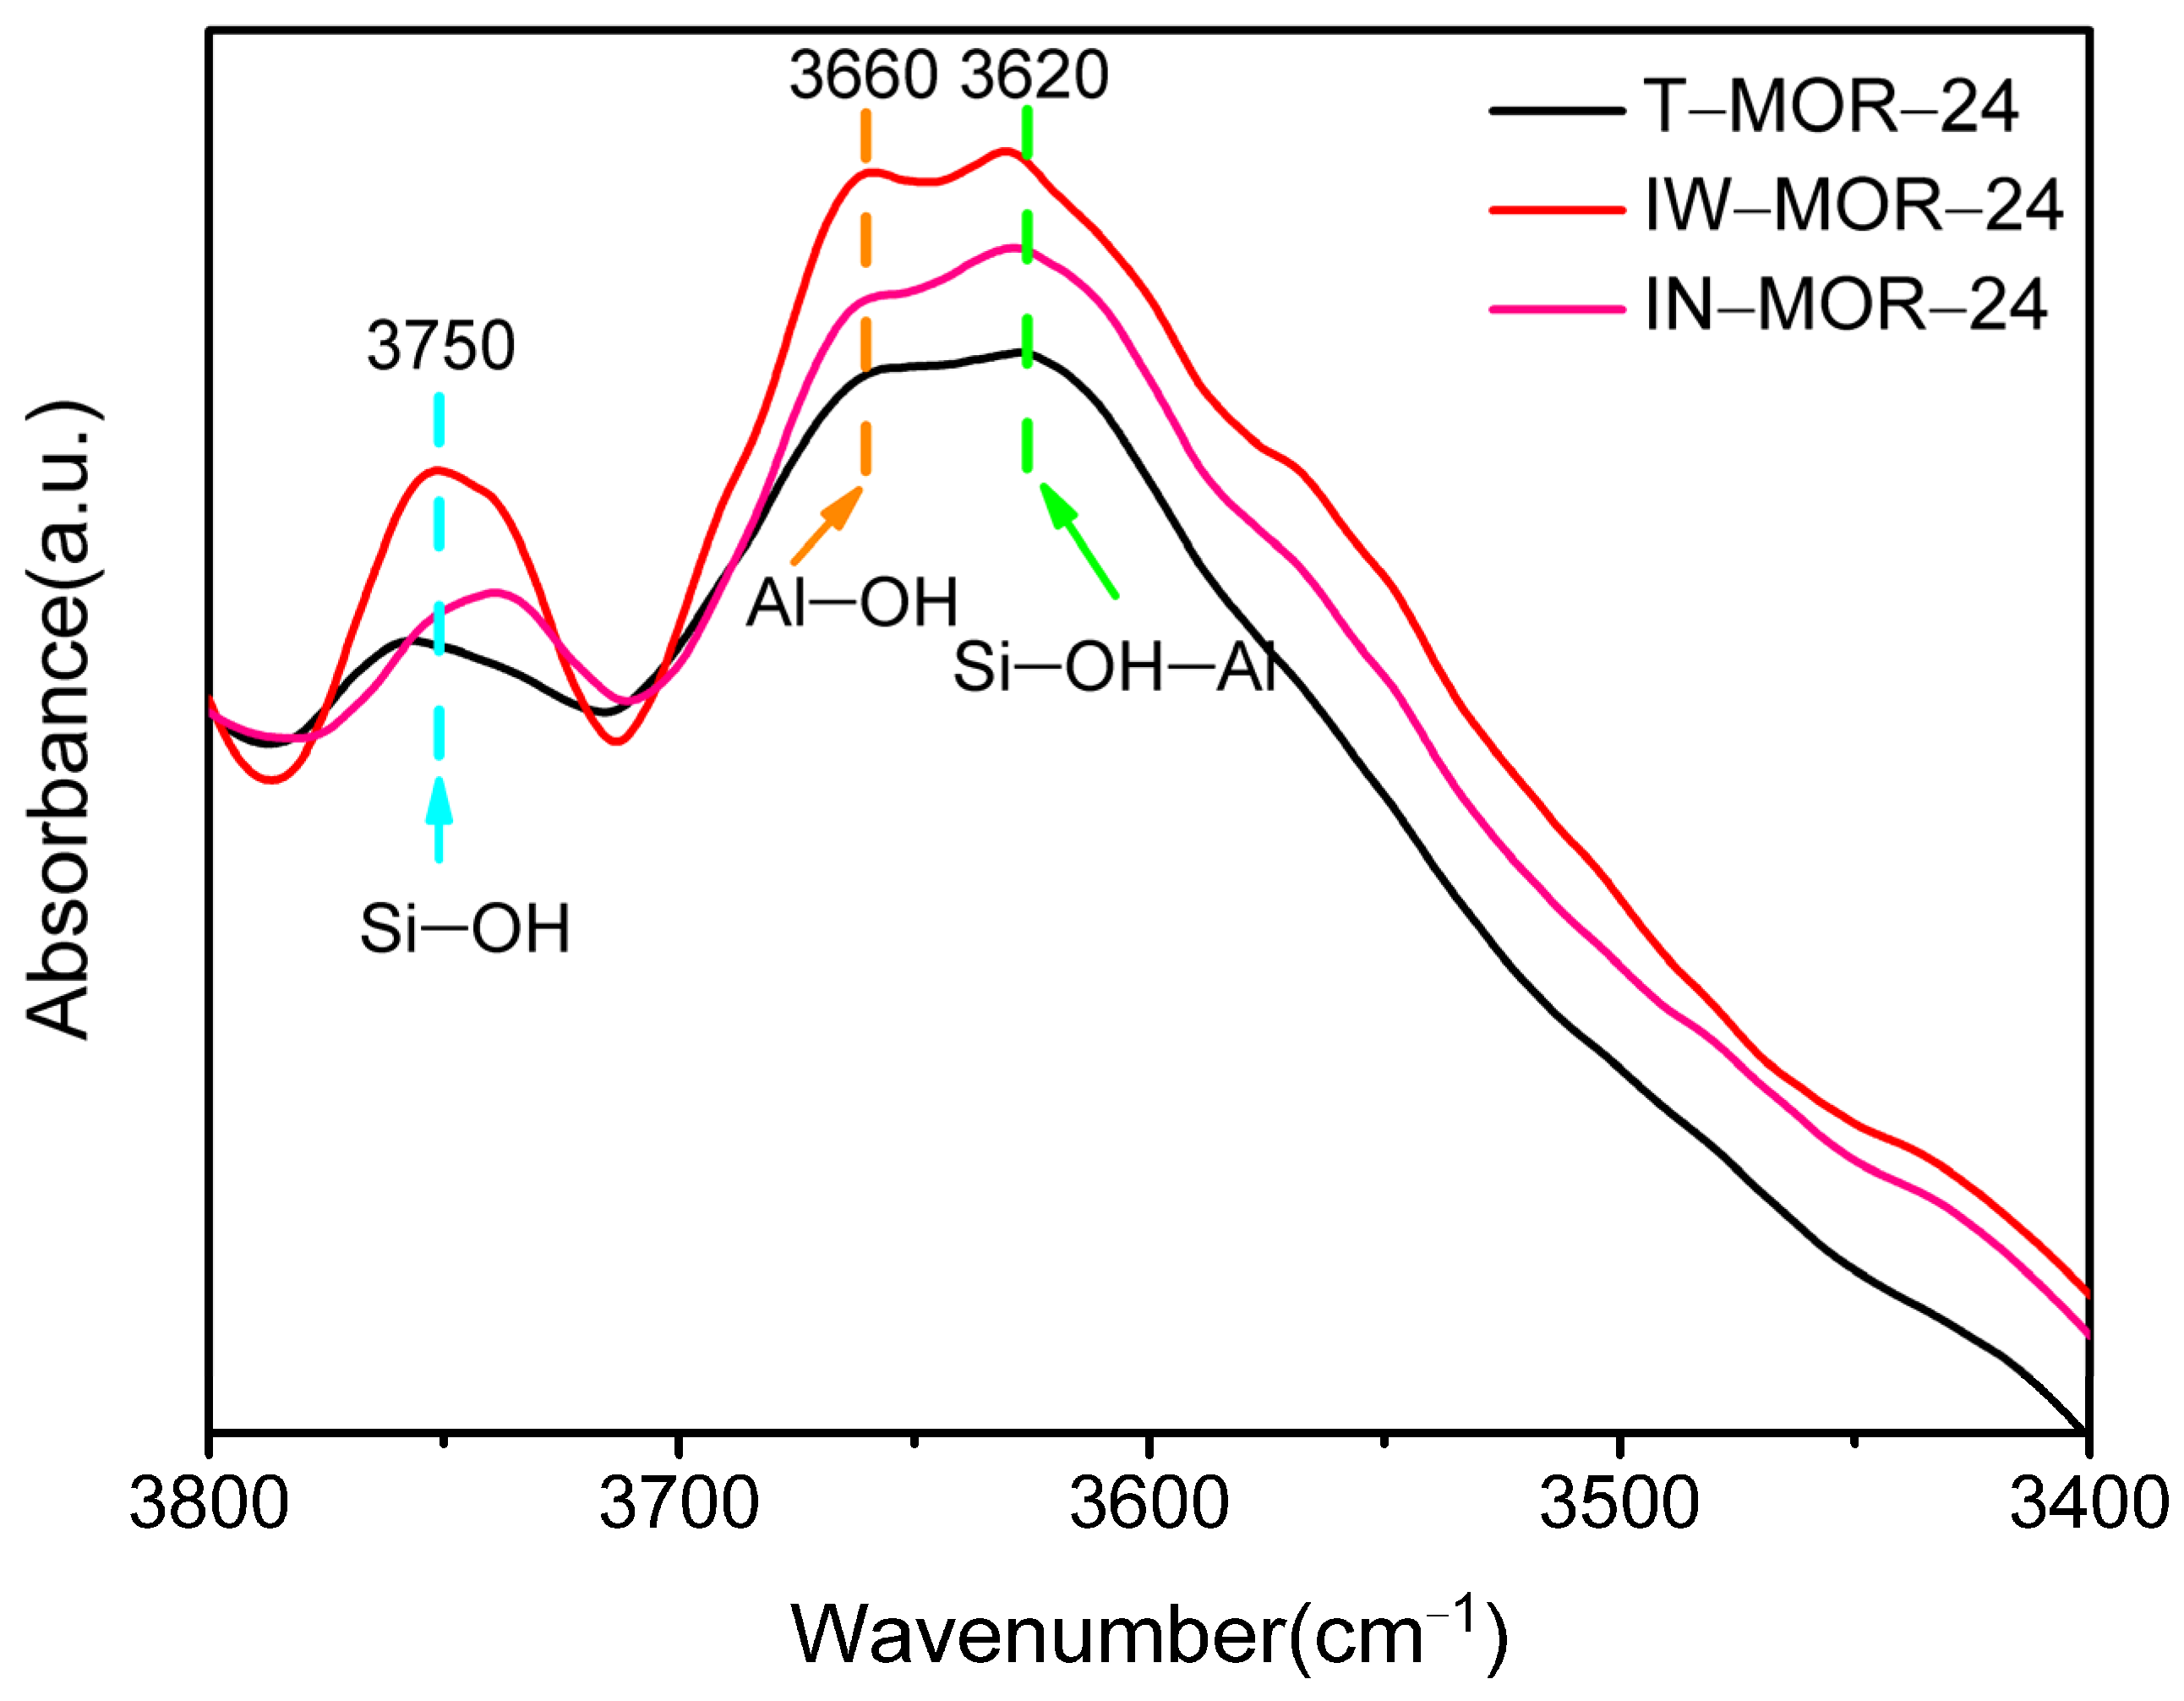
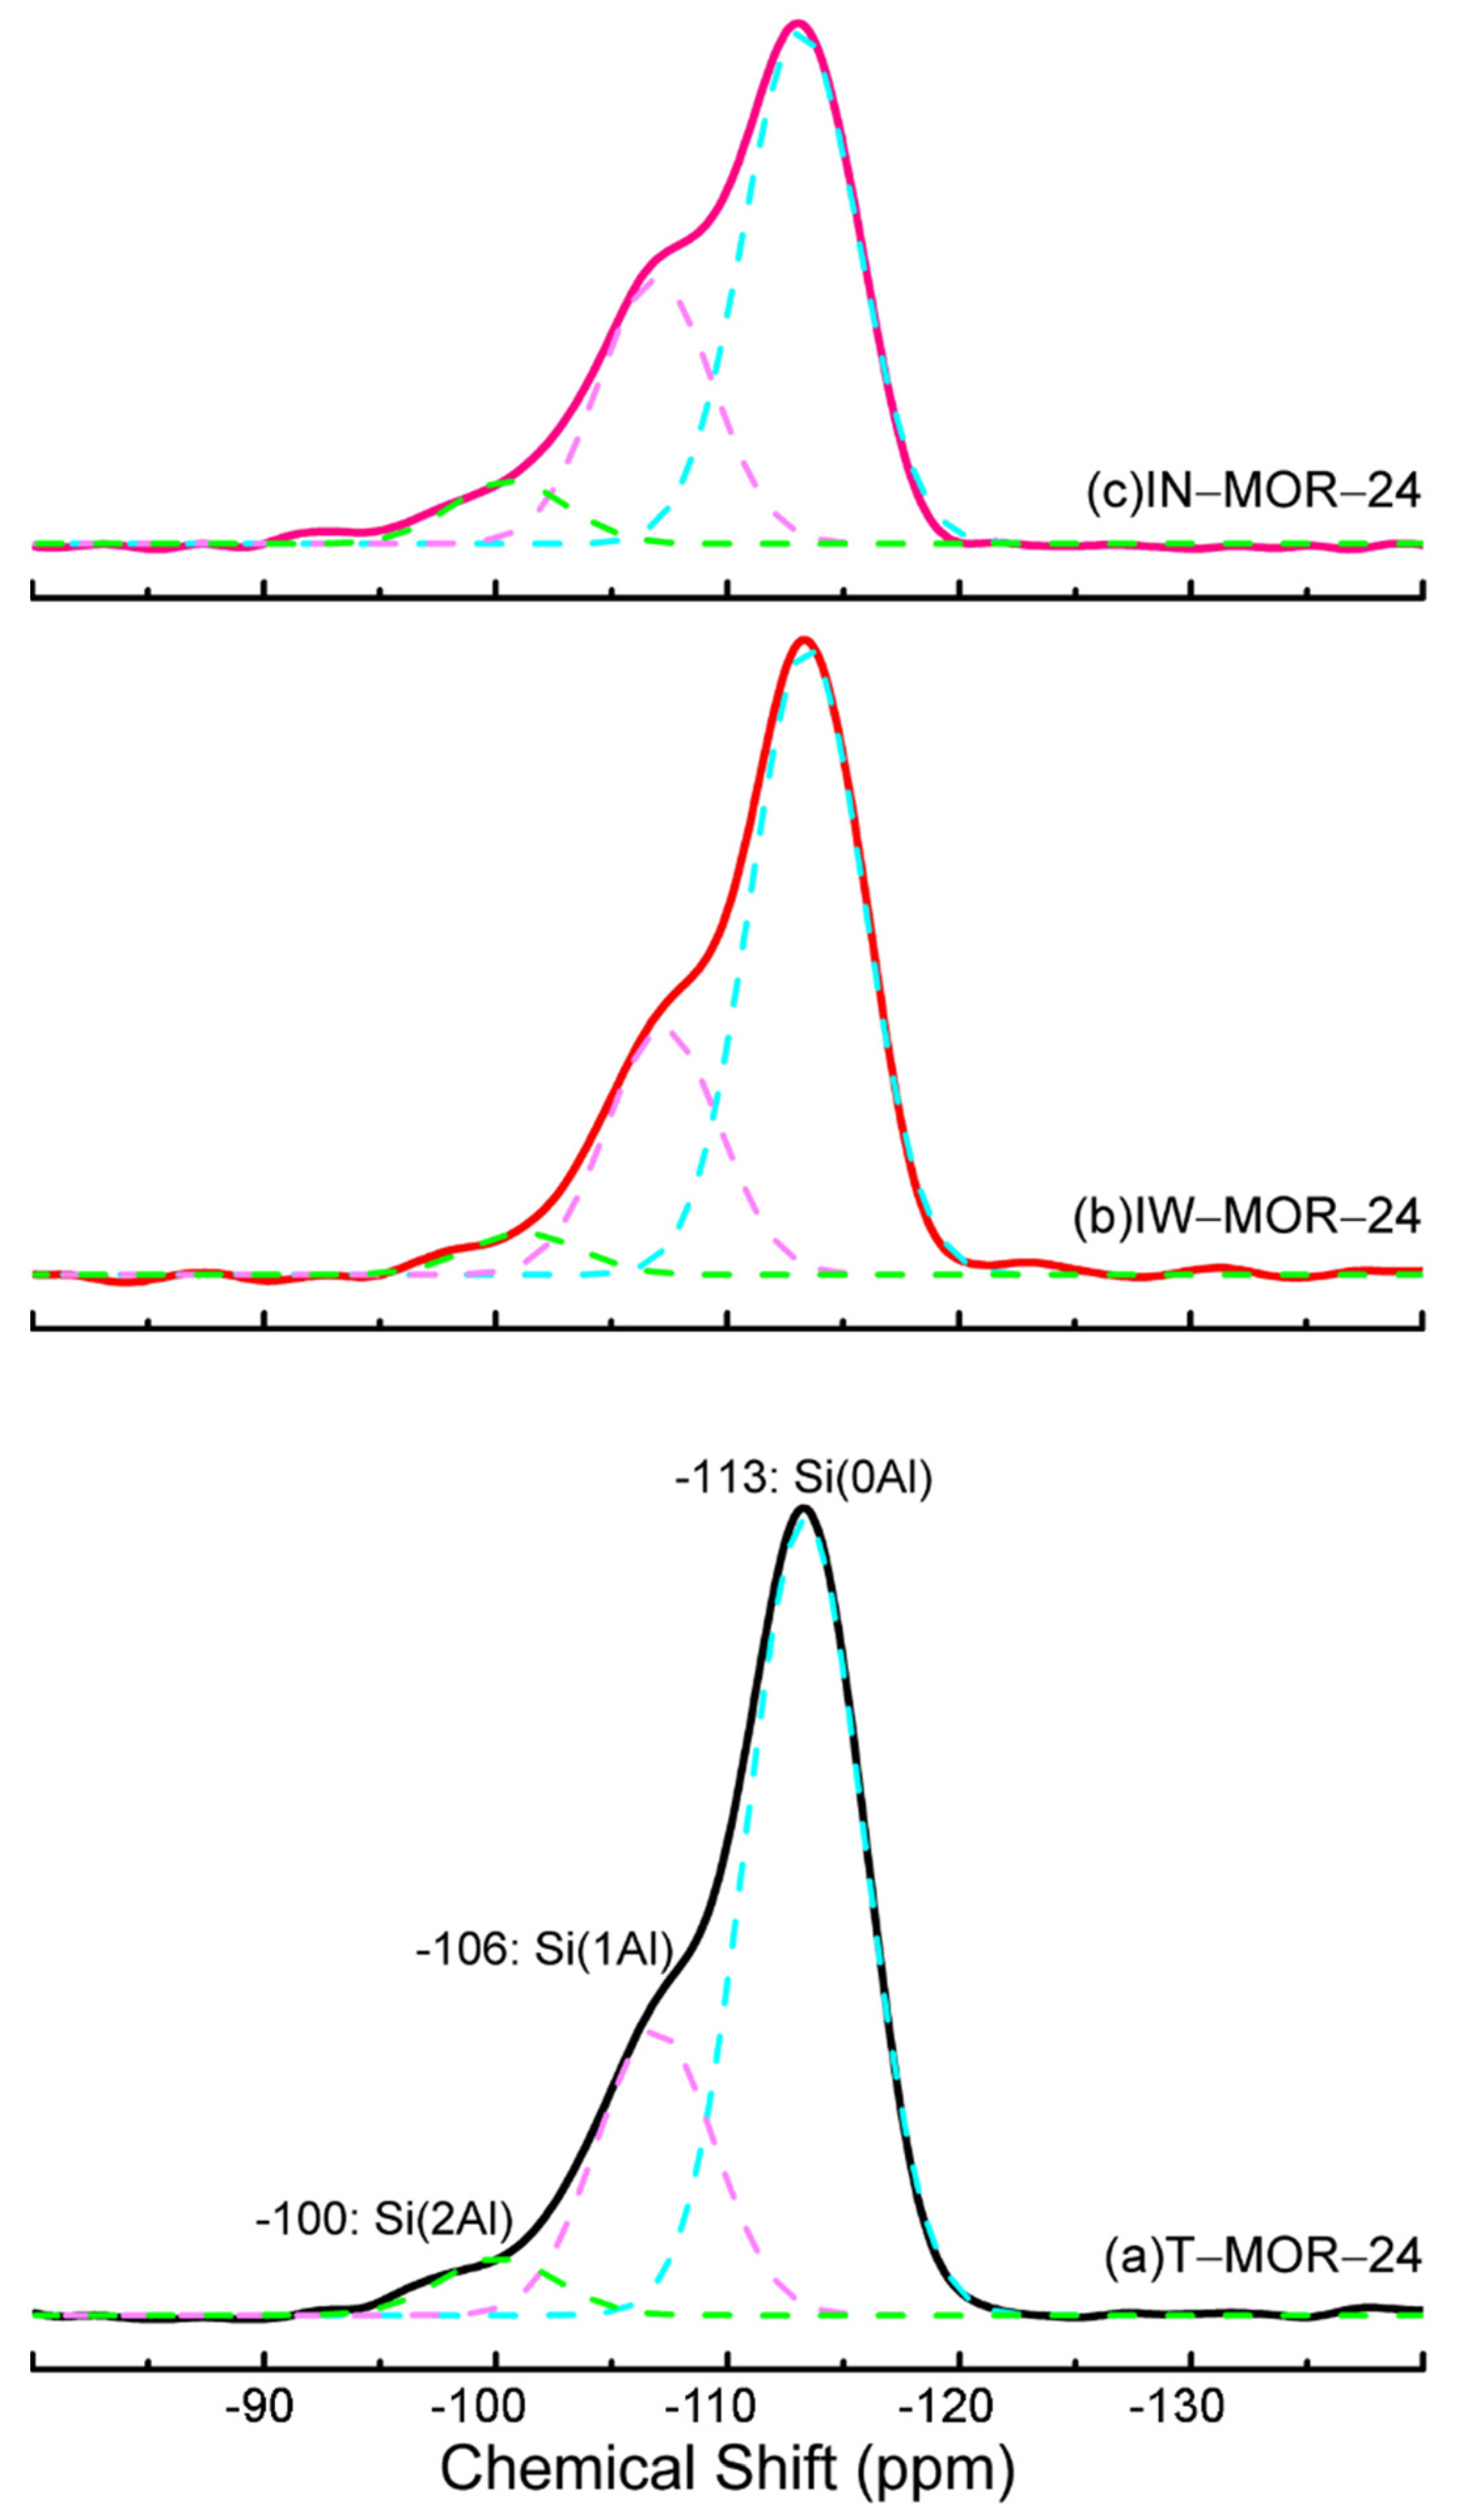
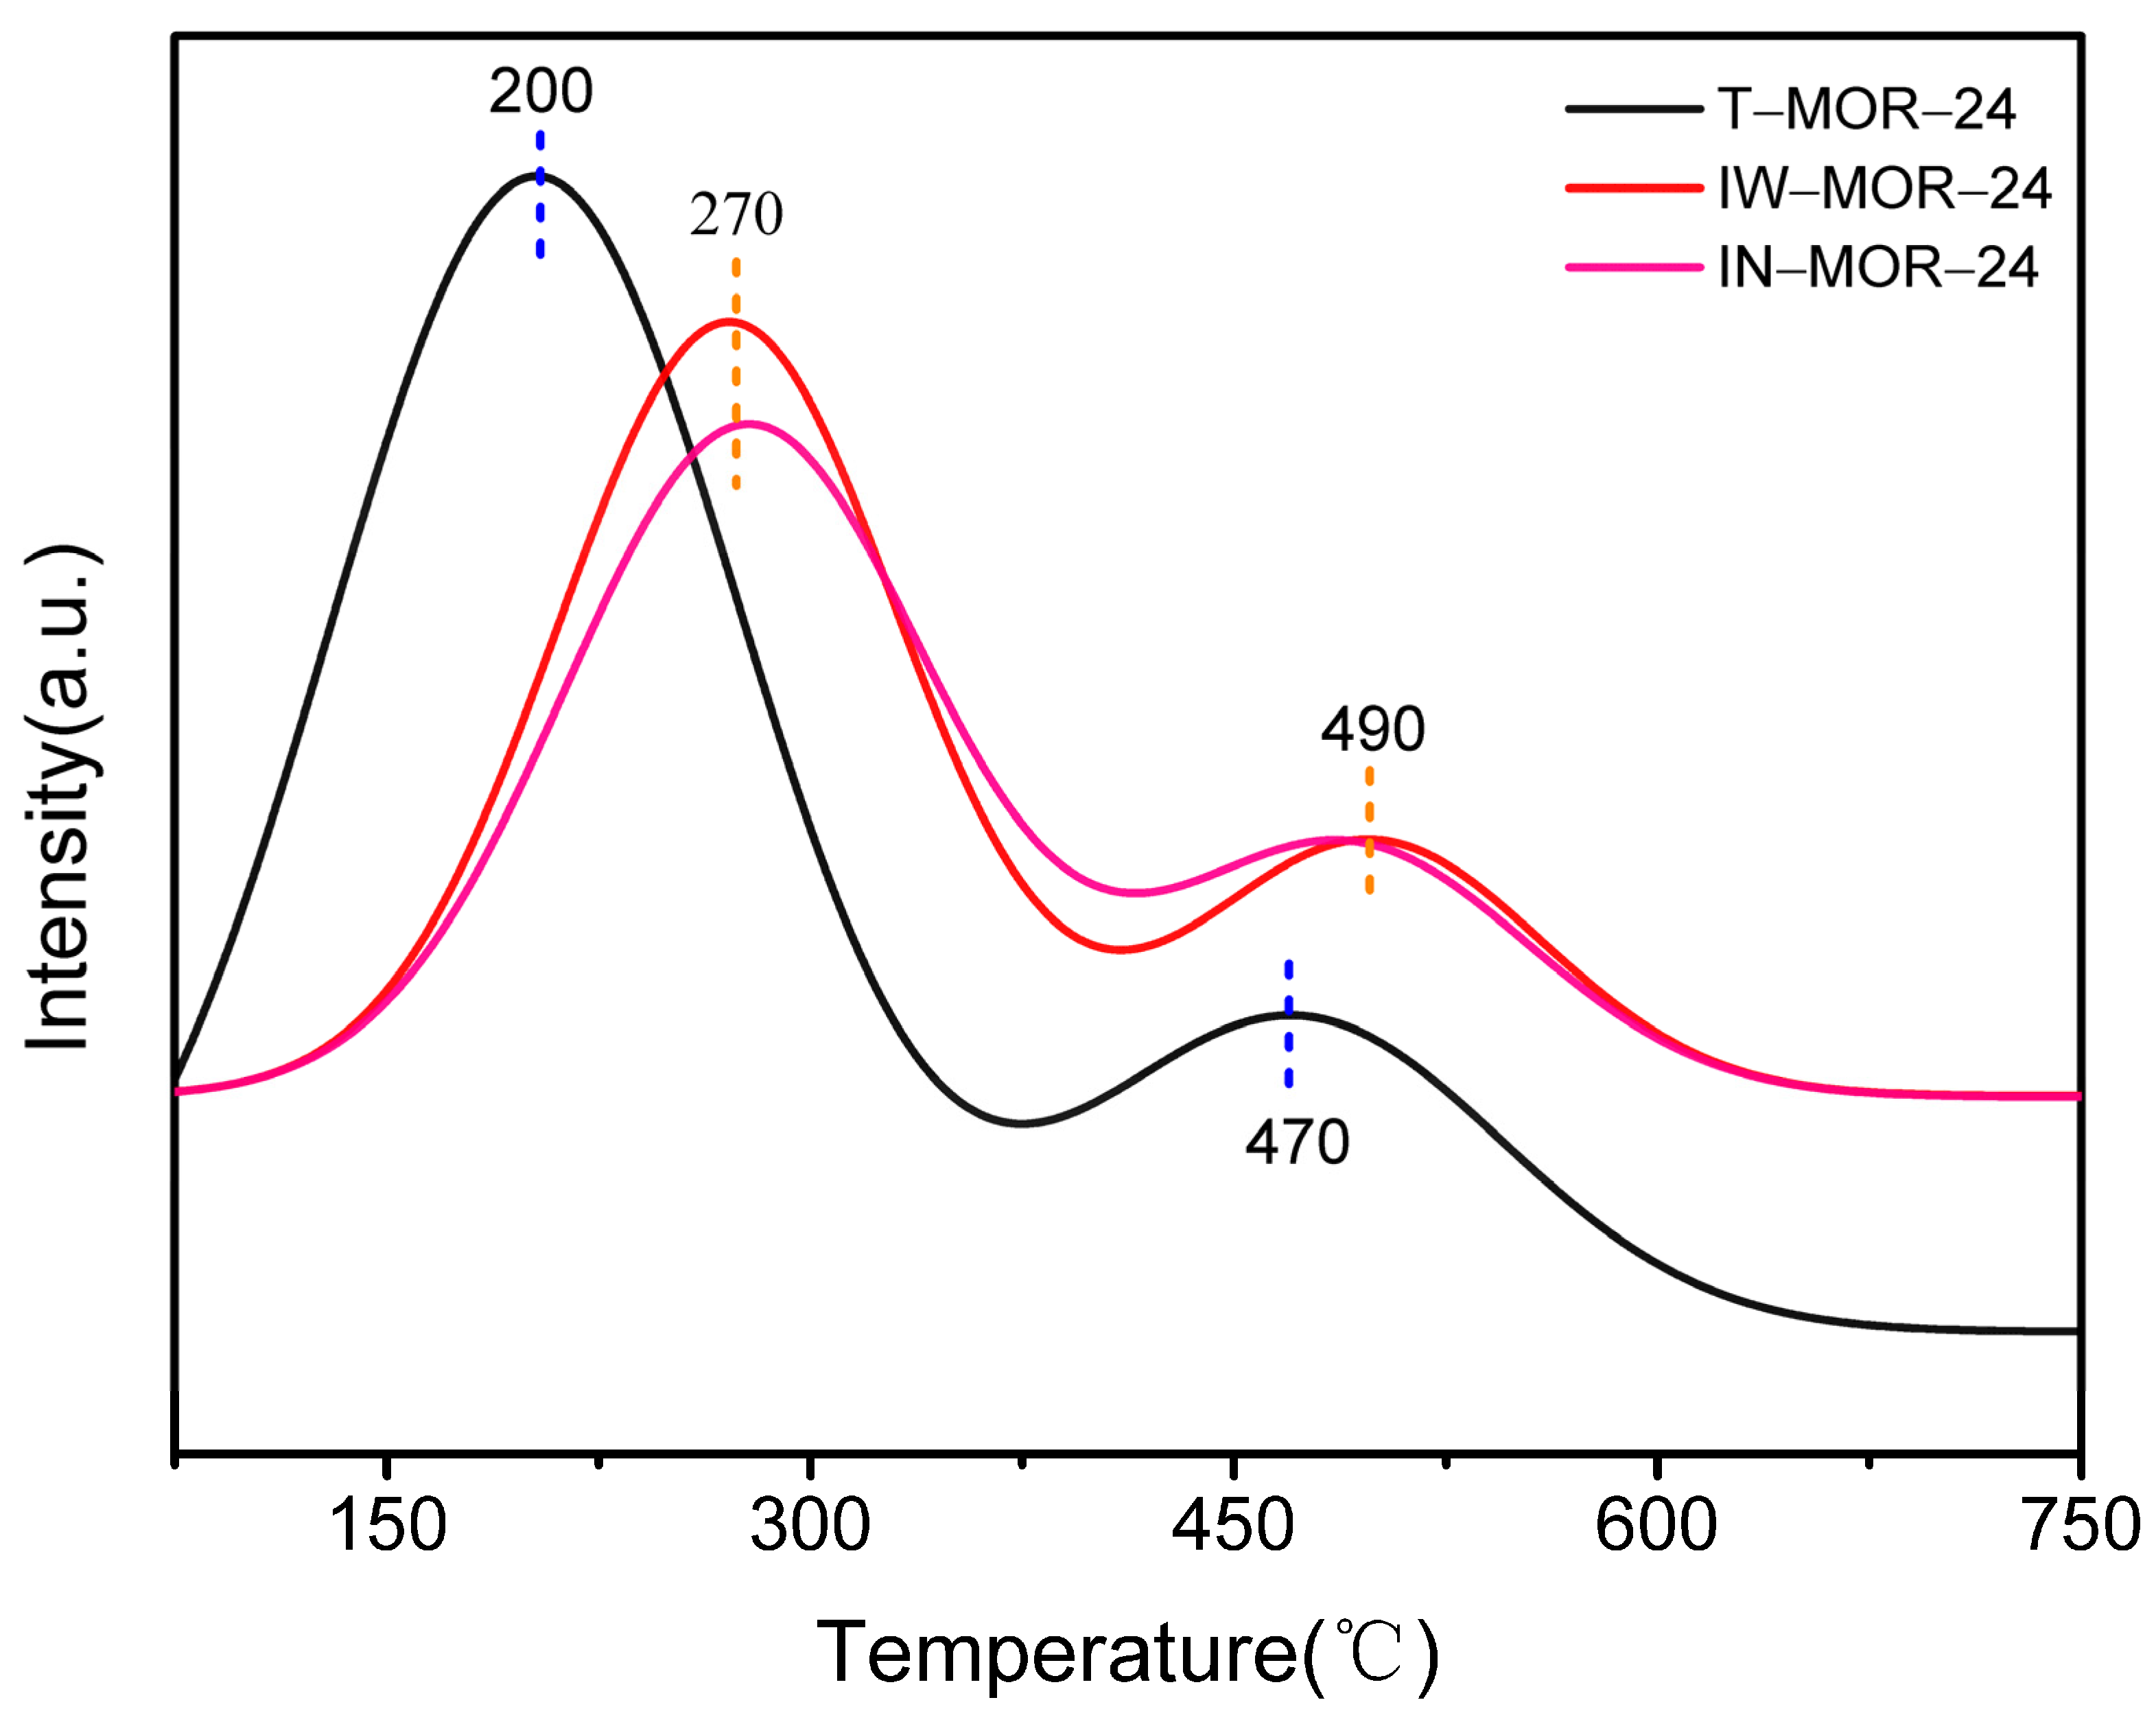
2.6. Acid Properties

It is generally accepted that the FTIR absorption spectra at around 3750 cm−1 and 3660 cm−1 is attributed to the terminal silanol groups on the external surface and the aluminol of extra–framework Al species, respectively [43,44,45,46]. Moreover, the signal located at 3620 cm−1 is considered to be the bridging hydroxyls, which are responsible for the strong Bronsted acidic (Si–OH–A1) sites [47,48,49,50]. Compared with T–MOR–24 sample, the absorption peaks of IW–MOR–24 and IN–MOR–24 at 3620 cm−1, 3660 cm−1 and 3750 cm−1 clearly become sharp with the increased intensities (Figure 9). It is indicated that there are more T–OH (T = Si, Al) groups and Si–OH–Al sites, which are closely related to an enhanced acid strength [51,52,53]. Furthermore, the bonding environment of the silicon atoms in the zeolite framework was recorded by the solid–state 29Si MAS NMR spectrum, and the spectrum resonances centered at around −113, −106 and −100 ppm are ascribed to Si(0Al), Si(1Al) and Si(2Al) structure types, respectively [46]. The relative decrease in the tetrahedrally coordinated Si(0Al) is confirmed (Q4) (Figure 10 and Table 3). Taking into account of above observations, it is speculated that the ice-templating method changes the chemical environment of silicon atoms in MOR zeolite, resulting in a relative decline in the tetrahedrally coordinated Si–O–Si bond and, correspondingly, an increase in the T–OH (T = Si, Al) groups and Si–OH–Al sites, which is the main reason for their superior acid strength [29,53]. This conclusion is further proven through NH3–TPD analysis (Figure 11). It is clearly exhibited that the NH3 desorption profiles for IW–MOR–24 and IN–MOR–24 samples show the significant shift to higher temperatures in comparison with the T–MOR–24, regardless of the low temperature peak (lower than 300 °C, corresponding to the weak acid center) and high temperature peak (greater than 400 °C, ascribed to the strong acid centers) [46,54].

2.7. Yield

Generally, a relatively low yield of zeolites has been provided by hydrothermal synthesis method because the necessary solvent takes up most of the autoclave space, and partial raw materials, such as silicates and aluminates, are still included in the solvent when crystallization is completed [2,55]. A high yield of MOR zeolites was obtained in this work due to the effective conversion of amorphous aluminosilicate dry gel into MOR zeolites. For example, autoclaves with a volume of 150 mL are applied to synthesize MOR zeolite with amounts of raw materials as follows: 52.29 g silica sol, 2.31 g NaAlO2 and 3.45 g NaOH. It was calculated that the ice-templating route provided the IW–MOR–24 product with a weight of 19.08 g, which is nearly twice the yield of the T–MOR–24 (9.56 g) zeolite by a traditional hydrothermal route. Not only the high yield but also the superior crystallinity (as shown in Table 4 and Figure 1), as well as the large reduction in the amount of water and reaction pressure by this route can be of great potential for the industrial production of MOR zeolite.

3. Experimental Section

3.1. Materials

Silica sol (SiO2, 25 wt%) was taken from Qingdao Haiyang Chemical Co., Ltd. Sodium aluminate (NaAlO2, 41 wt% Al2O3) and sodium hydroxide (NaOH, 96 wt%) were provided by Sino pharm Chemical Reagent Co., Ltd. The chemicals above were used as received without the requirement of further purification.

3.2. Synthesis of MOR Zeolite by Ice-Templating Method

The synthesis of MOR zeolite was carried out via an ice-templating method without any structure–directing agents (shown in Scheme 1). The molar compositions of the mixtures were set to 1.0 SiO2/0.04 Al2O3/0.2 Na2O/17.7 H2O. In a typical run, NaOH was dissolved in deionized water, followed by the addition of NaAlO2 and stirring for about 10 min at room temperature to provide a clear solution. Then, silica sol was added slowly into the clear solution with fast stirring. The gel mixture was continuously stirred vigorously for 3 h, and then transferred into a freezer at −50 °C for 4 h. The dry gel precursor was obtained with subsequent sublimation under vacuum for 24 h. Subsequently, it was further crystallized under a desired H2O or NaOH solution with H2O (or NaOH solution)/dry gel = 0, 0.3, 0.6, 0.9, 1.2, 2.4, 3.5 and 4.8 mass ratio (the corresponding H2O/SiO2 = 0, 1.5, 3.0, 4.5, 6.0, 12.0, 17.7 and 24.0) in a 150 mL Teflon–sealed autoclave at T °C for t h. All crystallized samples were washed several times with deionized water until the pH value was neutral and dried at 110 °C for 12 h. Finally, the as–prepared MOR zeolites was received after calcination at 550 °C for 6 h. The as–obtained zeolites were designated as IW–MOR–t (crystallization under water solution) and IN–MOR–t (crystallization under NaOH solution), where “t” denotes the crystallization time.
For comparison, MOR zeolite with the same molar ratio, 1.0 SiO2/0.04 Al2O3/0.2 Na2O/17.7 H2O, was prepared by traditional hydrothermal synthesis method. NaOH, NaAlO2 and silica sol were mixed to produce the gel precursor, which was then crystallized in the Teflon–sealed autoclave at the same temperatures as above for t h (t = 12, 24, 36, 48, 60, 72 and 120 h). The synthesized MOR by traditional hydrothermal crystallization was represented as T–MOR–t, where “t” also denotes the crystallization time.

3.3. Characterization

The crystalline structure of the zeolites was characterized by powder X–ray diffraction (XRD, Rigaku, Japan) on a Cu Kα diffractometer (λ = 1.54 Å) at 40 kV and 20 mA, at a scanning rate of 3°/min in the 2θ = 5°~35°. The relative crystallinity of the samples was calculated by comparing the sum of peak intensities for each sample with that for IW–MOR–24–3.0 as follows:
Relative   Crystallinity = sum   of   peak   intensities   for   each   sample sum   of   peak   intensities   of   IW MOR 24 3.0 × 100 %
A JEOL JSM–6390LV (JEOL, Tokyo, Japan) instrument operating at 15 kV was used to observe the scanning electron microscopy (SEM) images and crystal size of the zeolites.
The IR spectra were recorded on Nicolet iS50 FT–IR (Thermo Fisher Scientific, Waltham, MA, USA) spectrometer in 400–4000 cm−1 at a spectral resolution of 2 cm−1. Typically, the self–supporting wafers made of zeolites and KBr were pretreated at 350 °C under vacuum before measurement.
The 29Si MAS NMR spectra were collected on a Bruker AVANCE Ⅲ HD 400 MHz NMR spectrometer (Bruker, Germany) via single–pulse method. The resonant frequency is 79.49 MHz at a spinning speed of 3 kHz and a recycling delay of 9 μs. The 29Si chemical shift was corrected using polydimethylsiloxane as reference.
The surface acidic properties of the zeolites were measured via NH3 temperature–programmed desorption (NH3–TPD) on Micromeritics Autochem Ⅱ (FINTEC, China) with a thermal conductivity detector (TCD). Typically, ~100 mg zeolite was heated at 550 °C for 1 h with a He flow to remove the water adsorbed physically on the surface. Then, the zeolite sample was cooled down to 100 °C followed by saturation with NH3 in He (1.0 vol%) for 1 h and purging with He for 0.5 h to eliminate the surface NH3. Subsequently, the NH3 desorption was carried out in a He flow from 100 °C to 800 °C at a heating rate of 10 °C/min. All flow rates of He mentioned above were 50 mL/min.

4. Conclusions

We demonstrated a novel route for the successful synthesis of mordenite (MOR) zeolite with a fast nucleation and crystallization, high crystallinity, high zeolite yields, simple device and conventional silica sources. This route is achieved on the basis of a small ice template formation flowed by a fast hydrothermal crystallization. Moreover, the formed small ice template during the frozen process changed the bonding environment of silicon atoms in MOR zeolite. Herein, there were more T–OH (T = Si, Al) groups and Si–OH–Al sites in the IW–MOR and IN–MOR samples instead of the traditional tetrahedrally coordinated Si–O–Si (Q4) groups in T–MOR samples. NH3–TPD studies revealed that the strength of the acid sites for the obtained samples, IW–MOR–24 and IN–MOR–24, is greatly improved in comparison with the traditional T–MOR–24.

Author Contributions

Conceptualization, Z.L.; methodology, Z.L. and S.Z.; software, S.Z., H.L. and W.Z.; validation, Z.L., S.Z. and H.L.; formal analysis, Z.L.; investigation, Z.L. and S.Z.; resources, Z.L.; data curation, Z.L. and S.Z.; writing–original draft preparation, S.Z.; writing–review and editing, Z.L.; visualization, S.Z. and H.L.; supervision, B.W., X.Y., Y.P. and Y.Z.; project administration, Z.L.; funding acquisition, Z.L. All authors have read and agreed to the published version of the manuscript.

Funding

This research was funded by the National Natural Science Foundation of China (Grant no.: 21706140, 52172093, 21808115) And the APC was funded by the National Natural Science Foundation of China.

Data Availability Statement

The data presented in this study are available on request from the corresponding author.

Acknowledgments

This work was supported by the National Natural Science Foundation of China (21706140, 52172093, 21808115), Natural Science Foundation of Shandong Provincial (ZR2017BB039, ZR2019BB044).

Conflicts of Interest

The authors declare no conflict of interest.

References

  1. Moliner, M.; Rey, F.; Corma, A. Towards the rational design of efficient organic structure–directing agents for zeolite synthesis. Angew. Chem. Int. Ed. 2013, 52, 13880–13889. [Google Scholar] [CrossRef] [PubMed]
  2. Wu, Q.M.; Liu, X.L.; Zhu, L.F.; Ding, L.H.; Gao, P.; Wang, X.; Pan, S.X.; Bian, C.Q.; Meng, X.J.; Xu, J.; et al. Solvent–free synthesis of zeolites from anhydrous starting raw solids. J. Am. Chem. Soc. 2015, 137, 1052–1055. [Google Scholar] [CrossRef] [PubMed]
  3. Lu, K.; Huang, J.; Ren, L.; Li, C.; Guan, Y.; Hu, B.; Xu, H.; Jiang, J.; Ma, Y.; Wu, P. High ethylene selectivity in methanol–to–olefin (MTO) reaction over MOR–zeolite nanosheets. Angew. Chem. Int. Ed. 2020, 59, 6258–6262. [Google Scholar] [CrossRef] [PubMed]
  4. Jin, Y.J.; Zhao, S.L.; Li, P.; Lv, Z.B.; Zhang, S.D. Generation of mesoporosity in MOR zeolites synthesized under perturbation conditions. Mater. Lett. 2011, 65, 2959–2962. [Google Scholar] [CrossRef]
  5. Gao, W.Z.; Amoo, C.C.; Zhang, G.H.; Javed, M.; Mazonde, B.; Lu, C.X.; Yang, R.Q.; Xing, C.; Tsubaki, N. Insight into solvent–free synthesis of MOR zeolite and its laboratory scale production. Microporous Mesoporous Mater. 2019, 280, 187–194. [Google Scholar] [CrossRef]
  6. Sano, T.; Wakabayashi, S.; Oumi, Y.; Uozumi, T. Synthesis of large mordenite crystals in the presence of aliphatic alcohol. Microporous Mesoporous Mater. 2001, 46, 67–74. [Google Scholar] [CrossRef]
  7. Kato, M.; Itabashi, K.; Matsumoto, A.; Tsutsumi, K. Characteristics of MOR–framework zeolites synthesized in fluoride–containing media and related ordered distribution of Al atoms in the framework. J. Phys. Chem. B 2003, 107, 1788–1797. [Google Scholar] [CrossRef]
  8. Santos, B.P.S.; Almeida, N.C.; Santos, I.S.; Marques, M.D.F.V.; Fernandes, L.D. Synthesis and characterization of mesoporous mordenite zeolite using soft templates. Catal. Lett. 2018, 148, 1870–1878. [Google Scholar] [CrossRef]
  9. Li, X.L.; Li, K.D.; Tao, S.; Ma, H.J.; Xu, R.S.; Wang, B.C.; Wang, P.; Tian, Z.J. Ionothermal synthesis of LTA–type aluminophosphate molecular sieve membranes with gas separation performance. Microporous Mesoporous Mater. 2016, 228, 45–53. [Google Scholar] [CrossRef]
  10. Musa, M.; Dawson, D.M.; Ashbrook, S.E.; Morris, R.E. Ionothermal synthesis and characterization of CoAPO–34 molecular sieve. Microporous Mesoporous Mater. 2017, 239, 336–341. [Google Scholar] [CrossRef] [Green Version]
  11. Sajo, P.N.; Chiang, S.T.; Thompson, R.W. Synthesis of zeolitic mesoporous materials by dry gel conversion under controlled humidity. J. Phys. Chem. B 2003, 107, 7006–7014. [Google Scholar]
  12. Zhou, D.; Lu, X.H.; Xu, J.; Yu, A.; Li, J.Y.; Deng, F.; Xia, Q.H. Dry gel conversion method for the synthesis of organic–inorganic hybrid MOR zeolites with modifiable catalytic activities. Chem. Mater. 2012, 24, 4160–4165. [Google Scholar] [CrossRef]
  13. Gu, J.; Zhang, Z.Y.; Hu, P.; Ding, L.P.; Xue, N.H.; Peng, L.M.; Guo, X.F.; Lin, M.; Ding, W.P. Platinum nanoparticles encapsulated in MFI zeolite crystals by a two–step dry gel conversion method as a highly selective hydrogenation catalyst. ACS Catal. 2015, 5, 6893–6901. [Google Scholar] [CrossRef]
  14. Wu, Q.M.; Meng, X.G.; Gao, X.G.; Xiao, F.S. Solvent–free synthesis of zeolites: Mechanism and utility. Acc. Chem. Res. 2018, 51, 1396–1403. [Google Scholar] [CrossRef] [PubMed]
  15. Luo, Y.Y.; Zhu, Y.D.; Pan, J.G.; Chen, X.H. Fast synthesis of hierarchical Al–free Ti–bea plate–like nanocrystals from low–templated dry gel via a steam–assisted conversion method. Green Chem. 2020, 22, 1681–1697. [Google Scholar] [CrossRef]
  16. Catalfamo, P.; Patrizia, F.C.; Primerano, P.; Pasquale, S.D. Study of the pre–crystallization stage of hydrothermally treated amorphous aluminosilicates through the composition of the aqueous phaset. J. Chem. Soc. Faraday Trans. 1993, 89, 171–175. [Google Scholar] [CrossRef]
  17. Ma, Z.P.; Xie, J.Y.; Zhang, J.L.; Zhang, W.; Zhou, Y.; Wang, J. Mordenite zeolite with ultrahigh SiO2/Al2O3 ratio directly synthesized from ionic liquid–assisted dry–gel–conversion. Microporous Mesoporous Mater. 2016, 224, 17–25. [Google Scholar] [CrossRef]
  18. Jia, Y.; Wang, J.W.; Zhang, K.; Chen, G.L.; Yang, Y.F.; Liu, S.B.; Ding, C.M.; Meng, Y.Y.; Liu, P. Hierarchical ZSM–5 zeolite synthesized via dry gel conversion–steam assisted crystallization process and its application in aromatization of methanol. Powder Technol. 2018, 328, 415–429. [Google Scholar] [CrossRef]
  19. Luca, P.D.; Crea, F.; Fonseca, A.; Nagy, J.B. Direct formation of self–bonded pellets during the synthesis of mordenite and ZSM–11zeolites from low water content systems. Microporous Mesoporous Mater. 2001, 42, 37–48. [Google Scholar] [CrossRef]
  20. Ren, L.M.; Wu, Q.M.; Yang, C.G.; Zhu, L.F.; Li, C.J.; Zhang, P.L.; Zhang, H.Y.; Meng, X.J.; Xiao, F.S. Solvent–free synthesis of zeolites from solid raw materials. J. Am. Chem. Soc. 2012, 134, 15173–15176. [Google Scholar] [CrossRef]
  21. Meng, X.J.; Xiao, F.S. Green routes for synthesis of zeolites. Chem. Rev. 2014, 114, 1521–1543. [Google Scholar] [CrossRef] [PubMed]
  22. Liu, G.; Zhang, D.; Meggs, C.; Button, T.W. Porous Al2O3–ZrO2 composites fabricated by an ice template method. Scr. Mater. 2010, 62, 466–468. [Google Scholar] [CrossRef]
  23. Arabi, N.; Zamanian, A. Effect of cooling rate and gelatin concentration on the microstructural and mechanical properties of ice template gelatin scaffolds. Biotechnol. Appl. Biochem. 2013, 60, 573–579. [Google Scholar] [CrossRef] [PubMed]
  24. Mao, L.B.; Gao, H.L.; Yao, H.B.; Liu, L.; Cölfen, H.; Liu, G.; Chen, S.M.; Li, S.K.; Yan, Y.X.; Liu, Y.Y.; et al. Synthetic nacre by predesigned matrix–directed mineralization. Science 2016, 354, 107–110. [Google Scholar] [CrossRef] [PubMed] [Green Version]
  25. Nishihara, H.; Mukai, S.R.; Yamashita, D.; Tamon, H. Ordered macroporous silica by ice templating. Chem. Mater. 2005, 17, 683–689. [Google Scholar] [CrossRef]
  26. Wang, Y.; Kong, D.Z.; Shi, W.H.; Liu, B.; Sim, G.J.; Ge, Q.; Yang, H.Y. Ice templated free–standing hierarchically WS2/CNT–Rgo aerogel for high–performance rechargeable lithium and sodium ion batteries. Adv. Energy Mater. 2016, 6, 1601057. [Google Scholar] [CrossRef]
  27. Zhang, P.; Zhu, Q.Z.; Soomro, R.A.; He, S.Y.; Sun, N.; Qiao, N.; Xu, B. In situ ice template approach to fabricate 3D flexible Mxene film-based electrode for high performance supercapacitors. Adv. Funct. Mater. 2020, 30, 2000922. [Google Scholar] [CrossRef]
  28. Fajar, A.T.N.; Nurdin, F.A.; Mukti, R.R.; Subagjo; Rasrendra, C.B.; Kadja, G.T.M. Synergistic effect of dealumination and ceria impregnation to the catalytic properties of MOR zeolite. Mater. Today Chem. 2020, 17, 100313. [Google Scholar] [CrossRef]
  29. Liu, Q.R.; Zhou, D.; Liu, H.; Li, H.; Lu, X.H.; Xia, Q.H. Synergistic roles of B/L acids and hierarchical micro–mesoporous structures for the unexpected isomerization of β–pinene over dual–modified MOR zeolite by inorganic/organic bases. Microporous Mesoporous Mater. 2021, 323, 111195. [Google Scholar] [CrossRef]
  30. Morris, R.E.; James, S.L. Solventless synthesis of zeolites. Angew. Chem. Int. Ed. 2013, 52, 2163–2165. [Google Scholar] [CrossRef]
  31. Cundy, C.S.; Cox, P.A. The hydrothermal synthesis of zeolites: Precursors, intermediates and reaction mechanism. Microporous Mesoporous Mater. 2005, 82, 1–78. [Google Scholar] [CrossRef]
  32. Feng, G.D.; Yan, W.F.; Boronat, B.; Li, X.; Su, J.H.; Wang, J.Y.; Li, Y.; Corma, A.; Xu, R.R.; Yu, J.H. Accelerated crystallization of zeolites via hydroxyl free radicals. Science 2016, 351, 1188–1191. [Google Scholar] [CrossRef] [PubMed] [Green Version]
  33. Cundy, C.S.; Cox, P.A. The hydrothermal synthesis of zeolites: History and development from the earliest days to the present time. Chem. Rev. 2003, 103, 663–701. [Google Scholar] [CrossRef]
  34. Mousavi, S.F.; Jafari, M.; Kazemimoghadam, M.; Mohammadi, T. Template free crystallization of zeolite Rho via hydrothermal synthesis: Effects of synthesis time, synthesis temperature, water content and alkalinity. Ceram. Int. 2013, 39, 7149–7158. [Google Scholar] [CrossRef]
  35. Huo, Z.P.; Xu, X.Y.; Lü, Z.; Song, J.Q.; He, M.Y.; Li, Z.F.; Wang, Q.; Yan, L.J. Synthesis of zeolite NaP with controllable morphologies. Microporous Mesoporous Mater. 2012, 158, 137–140. [Google Scholar] [CrossRef]
  36. Tang, Q.; Ge, Y.Y.; Wang, K.T.; He, Y.; Cui, X.M. Preparation of porous P–type zeolite spheres with suspension solidification method. Mater. Lett. 2015, 161, 558–560. [Google Scholar] [CrossRef]
  37. Mimura, H.; Akiba, K. Adsorption behavior of cesium and strontium on synthetic zeolite P. J. Nucl. Sci. Technol. 1993, 30, 436–443. [Google Scholar] [CrossRef]
  38. Du, Y.C.; Shi, S.L.; Dai, H.X. Water–bathing synthesis of high–surface–area zeolite P from diatomite. Particuology 2011, 9, 174–178. [Google Scholar] [CrossRef]
  39. Hussain, I.; Jalil, A.A.; Hassan, N.S.; Hambali, H.U.; Jusoh, N.W.C. Fabrication and characterization of highly active fibrous silica–mordenite (FS@SiO2–MOR) cockscomb shaped catalyst for enhanced CO2 methanation. Chem. Eng. Sci. 2020, 228, 115978. [Google Scholar] [CrossRef]
  40. Culfaz, A.L.I.; Sand, L.B. Mechanism of nucleation and crystallization of zeolites from gels. Mol. Sieves 1973, 121, 140–151. [Google Scholar]
  41. Grizzetti, R.; Artioli, G. Kinetics of nucleation and growth of zeolite LTA from clear solution by in situ and exsitu XRPD. Microporous Mesoporous Mater. 2002, 54, 105–112. [Google Scholar] [CrossRef]
  42. Sun, C.T.; Xue, D.F. Polymorph growth of inorganic functional materials. Funct. Mater. Lett. 2017, 10, 1741001. [Google Scholar] [CrossRef]
  43. Wu, P.; Yashima, T. IR and MAS NMR studies on the incorporation of aluminum atoms into defect sites of dealuminated mordenites. J. Phys. Chem. 1995, 99, 10923–10931. [Google Scholar] [CrossRef]
  44. Pastvova, J.; Pilar, R.; Moravkova, J.; Kaucky, D.; Rathousky, J.; Sklenak, S.; Sazama, P. Tailoring the structure and acid site accessibility of mordenite zeolite for hydroisomerisation of n–hexane. Appl. Catal. A 2018, 562, 159–172. [Google Scholar] [CrossRef]
  45. Cao, K.P.; Fan, D.; Li, L.Y.; Fan, B.H.; Wang, L.Y.; Zhu, D.L.; Wang, Q.Y.; Tian, P.; Liu, Z.M. Insights into the pyridine–modified MOR zeolite catalysts for DME carbonylation. ACS Catal. 2020, 10, 3372–3380. [Google Scholar] [CrossRef]
  46. Cao, K.P.; Fan, D.; Zeng, S.; Fan, B.H.; Chen, N.; Gao, M.B.; Zhu, D.L.; Wang, L.Y.; Tian, P.; Liu, Z.M. Organic–free synthesis of MOR nanoassemblies with excellent DME carbonylation performance. Chin. J. Catal. 2021, 42, 1468–1477. [Google Scholar] [CrossRef]
  47. Zholobenko, V.L.; Makarova, M.A.; Dwyer, J. Inhomogeneity of brónsted acid sites in H–mordenite. J. Phys. Chem. 1993, 97, 5962–5964. [Google Scholar] [CrossRef]
  48. Korfinyi, T.I.; Föttinger, K.; Vinek, H.; Nagy, J.B. Characterization of aluminium siting in MOR and BEA zeolites by 27A1, 29Si NMR and FTIR spectroscopy. Stud. Surf. Sci. Catal. 2005, 158, 765–772. [Google Scholar]
  49. Allian, B.A.D.; Sunley, G.J.; Law, D.J.; Iglesia, E. Specificity of sites within eight–membered ring zeolite channels for carbonylation of methyls to acetyls. J. Am. Chem. Soc. 2007, 129, 4919–4924. [Google Scholar]
  50. Iglesia, B.E. A link between reactivity and local structure in acid catalysis on zeolites. Acc. Chem. Res. 2008, 41, 559–567. [Google Scholar]
  51. Gutiérrez, A.; Larrubia, M.A.; Ramirez, J.; Busca, G. FT–IR evidence of the interaction of benzothiophene with the hydroxyl groups of H–MFI and H–MOR zeolites. Vib. Spectrosc. 2006, 41, 42–47. [Google Scholar] [CrossRef]
  52. Cai, K.; Huang, S.Y.; Li, Y.; Cheng, Z.Z.; Lv, J.; Ma, X.B. Influence of acid strength on the reactivity of dimethyl ether carbonylation over H–MOR. ACS Sustain. Chem. Eng. 2018, 7, 2027–2034. [Google Scholar] [CrossRef]
  53. Chen, Z.W.; Li, Z.; Zhang, Y.; Chevella, D.; Li, G.M.; Chen, Y.P.; Guo, X.H.; Liu, J.; Yu, J.Q. A green route for the synthesis of nano–sized hierarchical ZSM–5 zeolite with excellent DTO catalytic performance. Chem. Eng. J. 2020, 388, 124322. [Google Scholar] [CrossRef]
  54. He, S.B.; Muizebelt, I.; Heeres, A.; Schenk, N.J.; Blees, R.; Heeres, H.J. Catalytic pyrolysis of crude glycerol over shaped ZSM–5/bentonite catalysts for bio–BTX synthesis. Appl. Catal. B 2018, 235, 45–55. [Google Scholar] [CrossRef]
  55. Jin, Y.Y.; Sun, Q.; Qi, G.D.; Yang, C.G.; Xu, J.; Chen, F.; Meng, X.J.; Deng, F.; Xiao, F.S. Solvent–free synthesis of silicoaluminophosphate zeolites. Angew. Chem. Int. Ed. 2013, 52, 9172–9175. [Google Scholar] [CrossRef]
Figure 1. XRD patterns of samples prepared via traditional hydrothermal synthesis method (T–MOR–24, T–MOR–72, T–MOR–120) and the ice-templating method (IW–MOR–24, IN–MOR–24).
Catalysts 12 00301 g001
Figure 2. XRD patterns of IW–MOR–24 samples synthesized with a different molar ratio to H2O/SiO2.
Catalysts 12 00301 g002
Figure 3. XRD patterns of IN–MOR–24 samples synthesized with various Al2O3/Na2O ratios.
Catalysts 12 00301 g003
Figure 4. XRD patterns of IW–MOR samples that were crystallized for 0, 2, 4, 8, 12, 16, 24, 36, and 48 h.
Catalysts 12 00301 g004
Figure 5. SEM images of IW–MOR samples that were crystallized for (a) 0 h, (b) 2 h, (c) 4 h, (d) 8 h, (e) 12 h, (f) 16 h, (g) 24 h, (h) 36 h, (i) 48 h; (j) T–MOR–24 sample; (k) IN–MOR–24–0.07 sample; and (l) IN–MOR–24–0.1 sample.
Catalysts 12 00301 g005
Figure 6. FT–IR profiles of T–MOR–24, IW–MOR–16, IW–MOR–24, IW–MOR–36 and IN–MOR–24 samples.
Catalysts 12 00301 g006
Figure 7. The relative crystallinity kinetics of MOR samples intensities, as estimated from the XRD. (a) T–MOR, (b) IW–MOR, (c) IN–MOR.
Catalysts 12 00301 g007
Figure 8. Arrhenius plot for the (a) nucleation activation energy En and (b) crystal growth activation energy Eg.
Catalysts 12 00301 g008
Figure 9. FT–IR spectra in the ν(OH) vibration region of T–MOR–24, IW–MOR–24 and IN–MOR–24 samples.
Catalysts 12 00301 g009
Figure 10. 29Si MAS NMR spectra of (a) T–MOR–24, (b) IW–MOR–24, (c) IN–MOR–24 samples.
Catalysts 12 00301 g010
Figure 11. NH3–TPD profiles of T–MOR–24, IW–MOR–24 and IN–MOR–24 samples.
Catalysts 12 00301 g011
Scheme 1. A series of charts illustrate the preparation of MOR zeolites via (a) hydrothermal synthesis method and (b) ice-templating method.
Catalysts 12 00301 sch001
Table 1. The relative crystallinity of various samples.
Samples
T–MOR–24T–MOR–72T–MOR–120IW–MOR–24IN–MOR–24
39%42%53%64%100%
Table 2. Nucleation rate, crystallization rate, activation energy for nucleation (En) and crystal growth (Eg) of MOR zeolites.
Temperature (℃)Samples
T–MORIW–MORIN–MOR
Vn
(h−1)
Vg
(h−1)
En
(kJ/mol)
Eg
(kJ/mol)
Vn
(h−1)
Vg
(h−1)
En
(kJ/mol)
Eg
(kJ/mol)
Vn
(h−1)
Vg
(h−1)
En
(kJ/mol)
Eg
(kJ/mol)
1400.040.6071.878.40.051.0563.261.50.123.1047.247.8
1600.061.770.141.790.137.39
1800.224.350.285.010.3910.28
Table 3. 29Si NMR result of MOR zeolites with hydrothermal synthesis method and ice-templating method.
SamplesChemical Shift (ppm)Peak Area
T–MOR–24−113(Q4)23,230
−106(Q3)8315
−100(Q2)1658
IW–MOR–24−113(Q4)17,600
−107(Q3)6871
−101(Q2)1159
IN–MOR–24−113(Q4)14,610
−106(Q3)7508
−100(Q2)1781
Q4: Si(0Al); Q3: Si(1Al); Q2: Si(2Al).
Table 4. The yield of T–MOR–24 and IW–MOR–24 samples.
SamplesRaw MaterialsYield/g
Silica sol/gNaAlO2/gNaOH/gH2O/g
T–MOR–24–17.752.292.3123.4309.56
IW–MOR–24–3.052.292.3123.41219.08
Publisher’s Note: MDPI stays neutral with regard to jurisdictional claims in published maps and institutional affiliations.

