Article

Bacterial Competition for the Anode Colonization under Different External Resistances in Microbial Fuel Cells

1
Laboratoire Ampère, Ecole Centrale de Lyon, Université de Lyon, CNRS, UMR 5005, 69130 Ecully, France
2
Environmental Microbial Genomics, Laboratoire Ampère, Université Claude Bernard Lyon 1, CNRS, UMR 5005, 69100 Villeurbanne, France
3
CPE-Lyon, CP2M, Université Claude Bernard Lyon 1, CNRS, UMR 5128, 69100 Villeurbanne, France
*
Author to whom correspondence should be addressed.
Catalysts 2022, 12(2), 176; https://doi.org/10.3390/catal12020176
Submission received: 15 December 2021 / Revised: 26 January 2022 / Accepted: 27 January 2022 / Published: 29 January 2022
(This article belongs to the Special Issue Catalysts for Biofuel and Bioenergy Production)

Abstract

:
This study investigated the effect of external resistance (Rext) on the dynamic evolution of microbial communities in anodic biofilms of single-chamber microbial fuel cells fueled with acetate and inoculated with municipal wastewater. Anodic biofilms developed under different Rext (0, 330 and 1000 ohms, and open circuit condition) were characterized as a function of time during two weeks of growth using 16S rRNA gene sequencing, cyclic voltammetry (CV) and fluorescence microscopy. The results showed a drastic difference in power output of MFCs operated with an open circuit and those operated with Rext from 0 to 1000 ohms. Two steps during the bacterial community development of the anodic biofilms were identified. During the first four days, nonspecific electroactive bacteria (non-specific EAB), dominated by Pseudomonas, Acinetobacter, and Comamonas, grew fast whatever the value of Rext. During the second step, specific EAB, dominated by Geobacter and Desulfuromonas, took over and increased over time, except in open circuit MFCs. The relative abundance of specific EAB decreased with increasing Rext. In addition, the richness and diversity of the microbial community in the anodic biofilms decreased with decreasing Rext. These results help one to understand the bacterial competition during biofilm formation and suggest that an inhibition of the attachment of non-specific electroactive bacteria to the anode surface during the first step of biofilm formation should improve electricity production.

1. Introduction

Microbial fuel cell (MFC) technology relies on EAB as biocatalysts to produce electricity through oxidation of organic compounds. Several applications of this technology are under development, such as sustainable energy production for wastewater treatment [1,2] and biosensors for monitoring the dissolved organic carbon as well as toxic pollutants [3,4,5]. The selection of EAB during biofilm formation on the anode is a crucial step for improving the performance of MFCs. Several research groups have reported different strategies to improve EAB enrichment by using various factors that shape biofilm formation, such as substrate, temperature, pH, flow rate, anode potential, anode surface topology and surface chemistry [6,7,8]. One of the most investigated factors is the external resistance (Rext) used in the external circuit of the MFC to control the electron flow from the anode to the cathode. The rate of substrate oxidation by the anodic biofilm is high, with a low Rext, and decreases with the application of a high Rext. Therefore, changing the value of Rext during the start-up phase of the MFC can produce notable variability in the microbial community composition of anodic biofilms. This selection strategy is the simplest way of improving MFC performances by applying a static external load, without requiring any specific equipment that could be limiting for practical purposes in large-scale applications. Most studies have demonstrated large differences in microbial community composition and electrical power production of MFCs operated at different Rext. Lyon et al. described drastic differences in microbial community composition of anodic biofilms in MFCs operated at different Rext but no significant change in power output [9]. The flexibility of MFC systems was demonstrated through the ability of two different communities to produce similar power inputs. Rismani-Yazdi et al. showed that changes in the Rext affected both the power production and bacterial diversity of anodic biofilms [10]. Jung et al. reported that Rext affects not only anode potential and current generation but also the anode biofilm community and methanogenesis [11]. In a recent study reported by Koók et al., the microbial community structure, performance and stability of anodic biofilms were investigated in MFCs operated under dynamic and static Rext [12]. This study showed that dynamic Rext adjustment improves the electrical performance of MFCs by increasing the dominance of EAB in anodic biofilms but decreasing operational stability. However, they did not distinguish between specific and nonspecific EAB. Low performances were obtained by the application of static low or high Rext, while operational stability increased with increased diversity in the microbial community of anodic biofilms. Although several comprehensive investigations into the effect of Rext on the microbial composition of anodic biofilm formation have been reported [13,14,15,16,17,18], there is limited information concerning the microbial community dynamics of anodic biofilms maturating under different Rext. In all the studies mentioned above, microbial community structures were identified once the biofilms had been established and not during the maturation process. Paitier et al. expressed interest in examining the early microbial community shifts of anodic biofilms in MFCs since the competition between EAB was critical during the colonization of anodic surfaces [19]. Hodgson et al. studied the anodic microbial communities in a MFC cascade at different times during biofilm formation [20]. They highlighted the relationship between the fermentative and anodophilic populations in MFC. Both of these studies on the evolution of microbial community in anodic biofilms were carried out without changing Rext. More investigations about the dynamic behavior of biofilm formation would help one to understand the role of bacterial communities and their interactions in anodic biofilm subjected to various Rext. Recently, Pasternak et al. studied the dynamic evolution of the physical structure of anodic biofilms using environmental scanning electron microscopy in MFCs matured under different Rext values [21]. The connected Rext appeared to have a significant effect on biofilm three-dimensional structure, and the initial conditions of biofilm development can affect its long-term structure, properties and activity. To the best of our knowledge, the effect of the Rext on the dynamic evolution of the microbial community in anodic biofilms has not been investigated to date, although this is critical for developing the appropriate microbial selection strategies to maximize MFC performance.
The goal of this study was to understand how EAB selection takes place in anodic biofilms of MFCs developing under different Rext values. Single-chamber MFCs with carbon-cloth anodes and air-breathing cathodes were used. MFCs were filled with wastewater effluent from a domestic wastewater treatment plant and fed with acetate under anaerobic conditions. MFCs were set up in duplicate (experiments (a) and (b)) under different Rext in order to aid or hinder electron flow. MFCs were started with different Rext: 1000 ohms (MFC-1000-a and MFC-1000-b), 330 ohms (MFC-330-a, MFC-330-b), without resistance (MFC-0-a and MFC-0-b) and with an open circuit simulating an infinite resistant (MFC-inf-a and MFC-inf-b). The effect of Rext on microbial community structure was evaluated by following bacterial competition or syntropy in microbial succession during electroactive biofilm formation. Biofilm formation was followed by fluorescence microscopy. The electrocatalytical activity was measured by maximal power measurements and cyclic voltammetry. The evolution of the microbial community in anodic biofilms was characterized by 16S rRNA gene sequencing over time.

2. Results

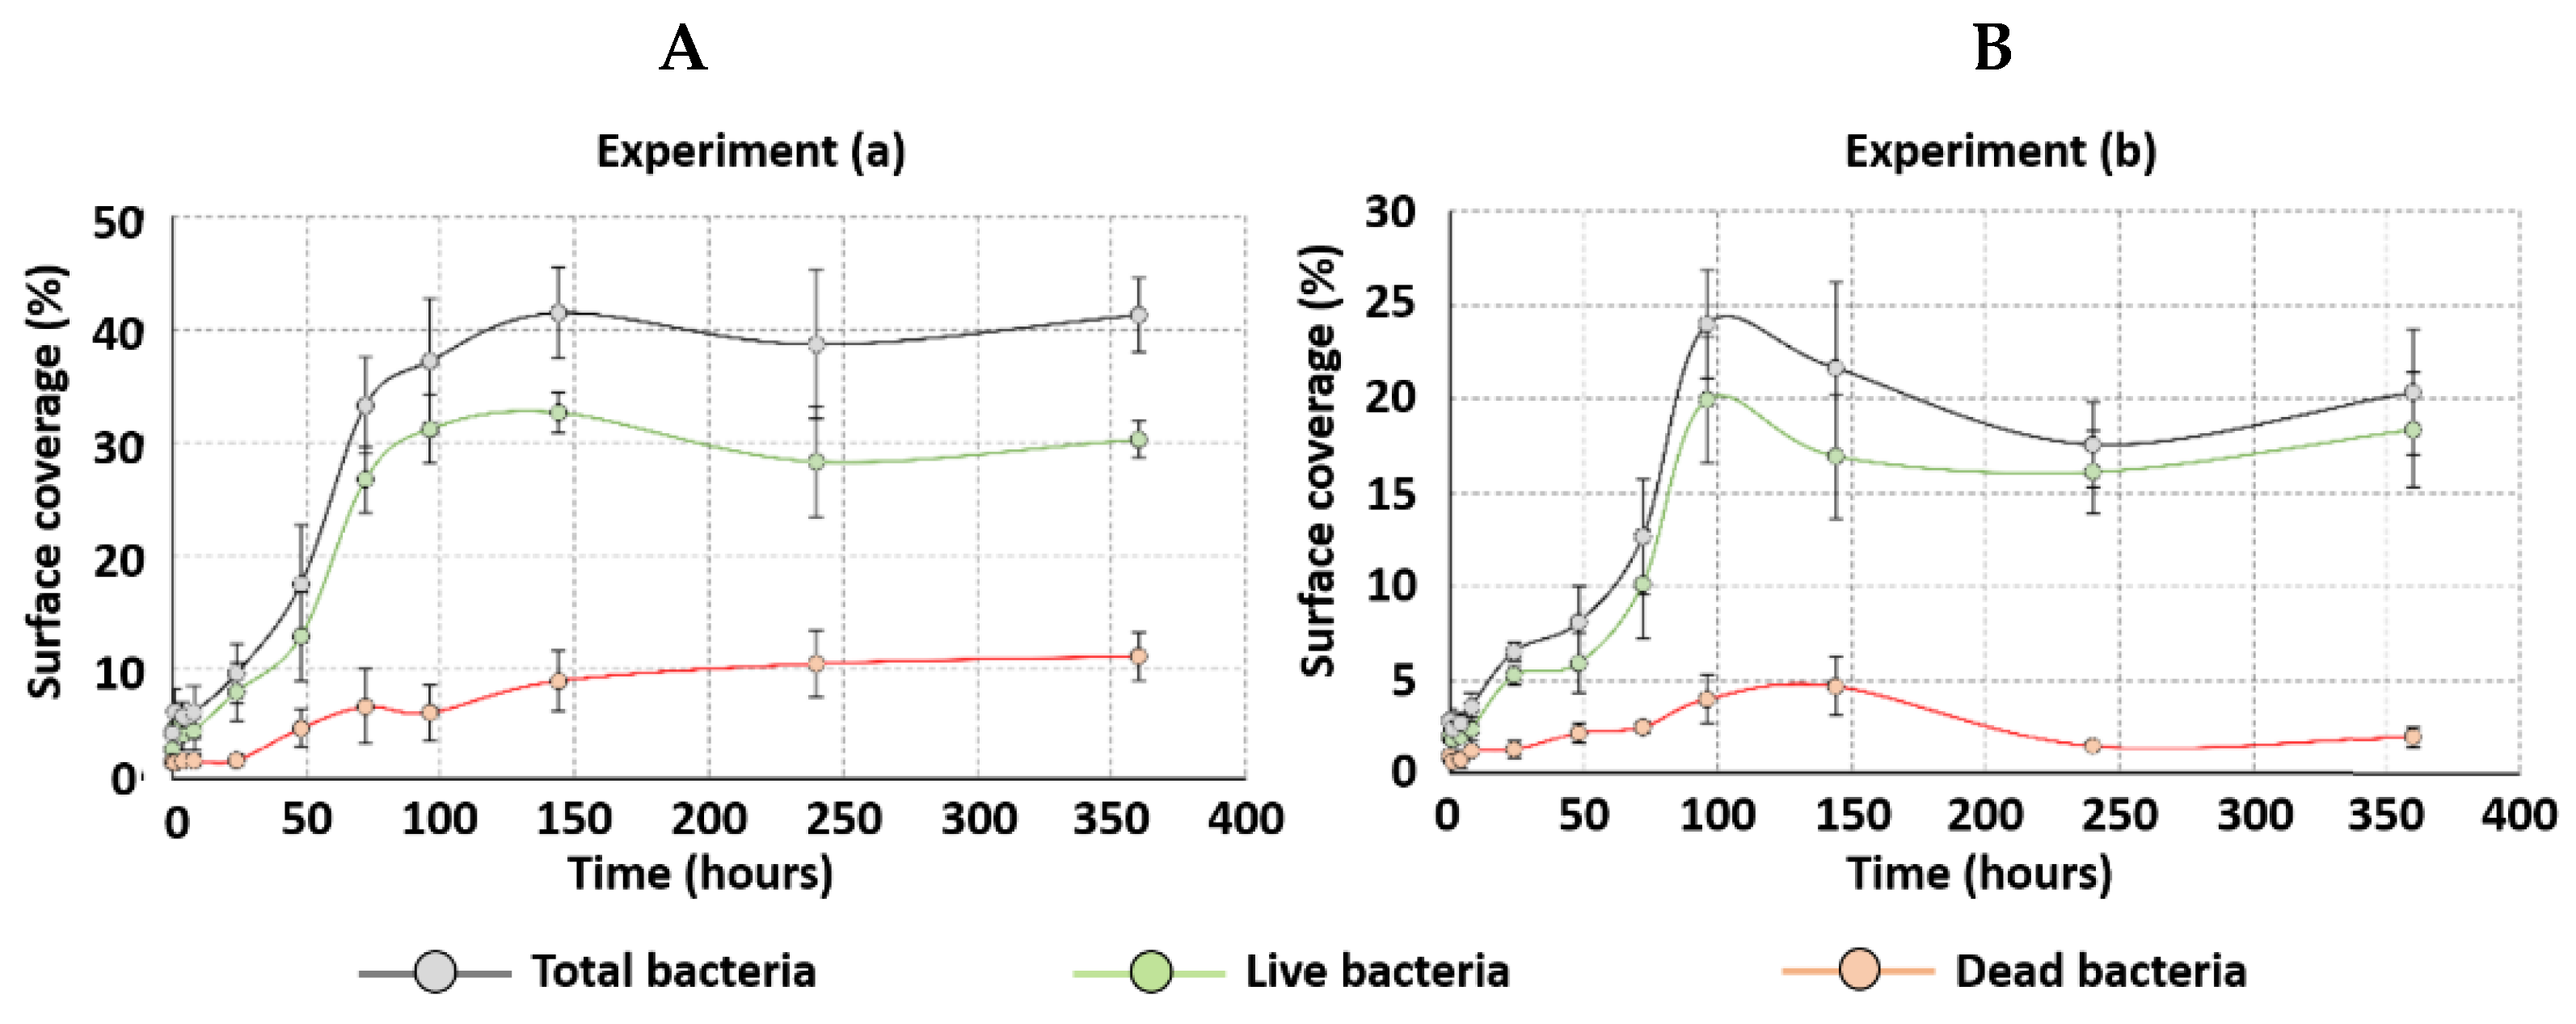
2.1. Impact of External Resistance on Anodic Biofilm Growth

Voltage and current outputs of MFCs were recorded as a function of the time during two weeks in order to follow biofilm growth (Figure 1A,B). The voltage of open-circuit MFCs (MFC-inf-a and MFC-inf-b) increased quickly from the first day, until an equilibrium voltage of 700 mV reached only in 3 days. Under this condition, no current could circulate in the external circuit. With Rext of 330 and 1000 ohms, voltage and current outputs started to increase on the 3rd day (a) and the 5th day of the experiment (b) and became stable after 5 and 7 days (a) and (b), respectively. In both experiments, electrical performances of MFCs were similar under the same conditions: a current density of about 20 mA m−2 (corresponding to a cell voltage of about 200 mV) for MFC-330-a and MFC-330-b, and about 23 mA m−2 (corresponding to a cell voltage of about 350 mV) for MFC-1000-a and MFC-1000-b. The voltage output of MFCs without Rext stayed low at about 600 µV after 2 weeks. The current density started to increase on the 4th day and the 6th day for MFC-0-a and MFC-0-b, respectively. The current density became stable on the 5th and 8th days, with corresponding current densities of 26 and 20 mA m−2 for MFC-0-a and MFC-0-b, respectively. These results showed that reducing the value of Rext delayed the start-up phase of the MFC. This trend was consistent with previous results reported by Zhang et al. [15].
The coverage percentage of anode surfaces during biofilm formation was followed as a function of the time by fluorescence microscopy. The microscopic observation of the all eight MFCs revealed no major influence of Rext on the biofilm coverage of anode surface during growth (Figure 2). During the start-up period, the biofilm growth on the anode was low for the four MFCs of each experiment, with a total coverage percentage of (17 ± 5)% in the experiment (a), and (8 ± 2)% in the experiment (b) after 2 days. After 4 days, the coverage percentage became stable, with a total coverage percentage of about (41 ± 3)% in the experiment (a) and (20 ± 4)% in the experiment (b). Primary inoculum and/or anaerobic condition were probably more favorable for the biofilm growth in the experiment (a) than in the experiment (b). The negligible impact of Rext on the biofilm coverage of anode surface was unexpected because lower Rext was thought to lead to a higher energy gain for anodic biofilms. These results are inconsistent with previous reports describing a higher biofilm production at a lower Rext [21,22]. Indeed, a lower Rext induced a higher difference between the anode potential (electron acceptor) and the redox potential of acetate (electron donor), leading to a higher energy gain of microbial metabolism. This inconsistency is probably related to the consumption of a higher portion of energy for the synthesis of extracellular polymeric substances rather than for growth, as previously described [15]. Furthermore, even if the coverage percentage stayed stable, microscopic images showed that biofilms thickened between 4 and 15 days (Figure S1). Thus, Rext could influence the growth at the level of biofilm thickness. The thickness (both bacteria and exopolymer) of the anodic biofilms was difficult to measure in this study.

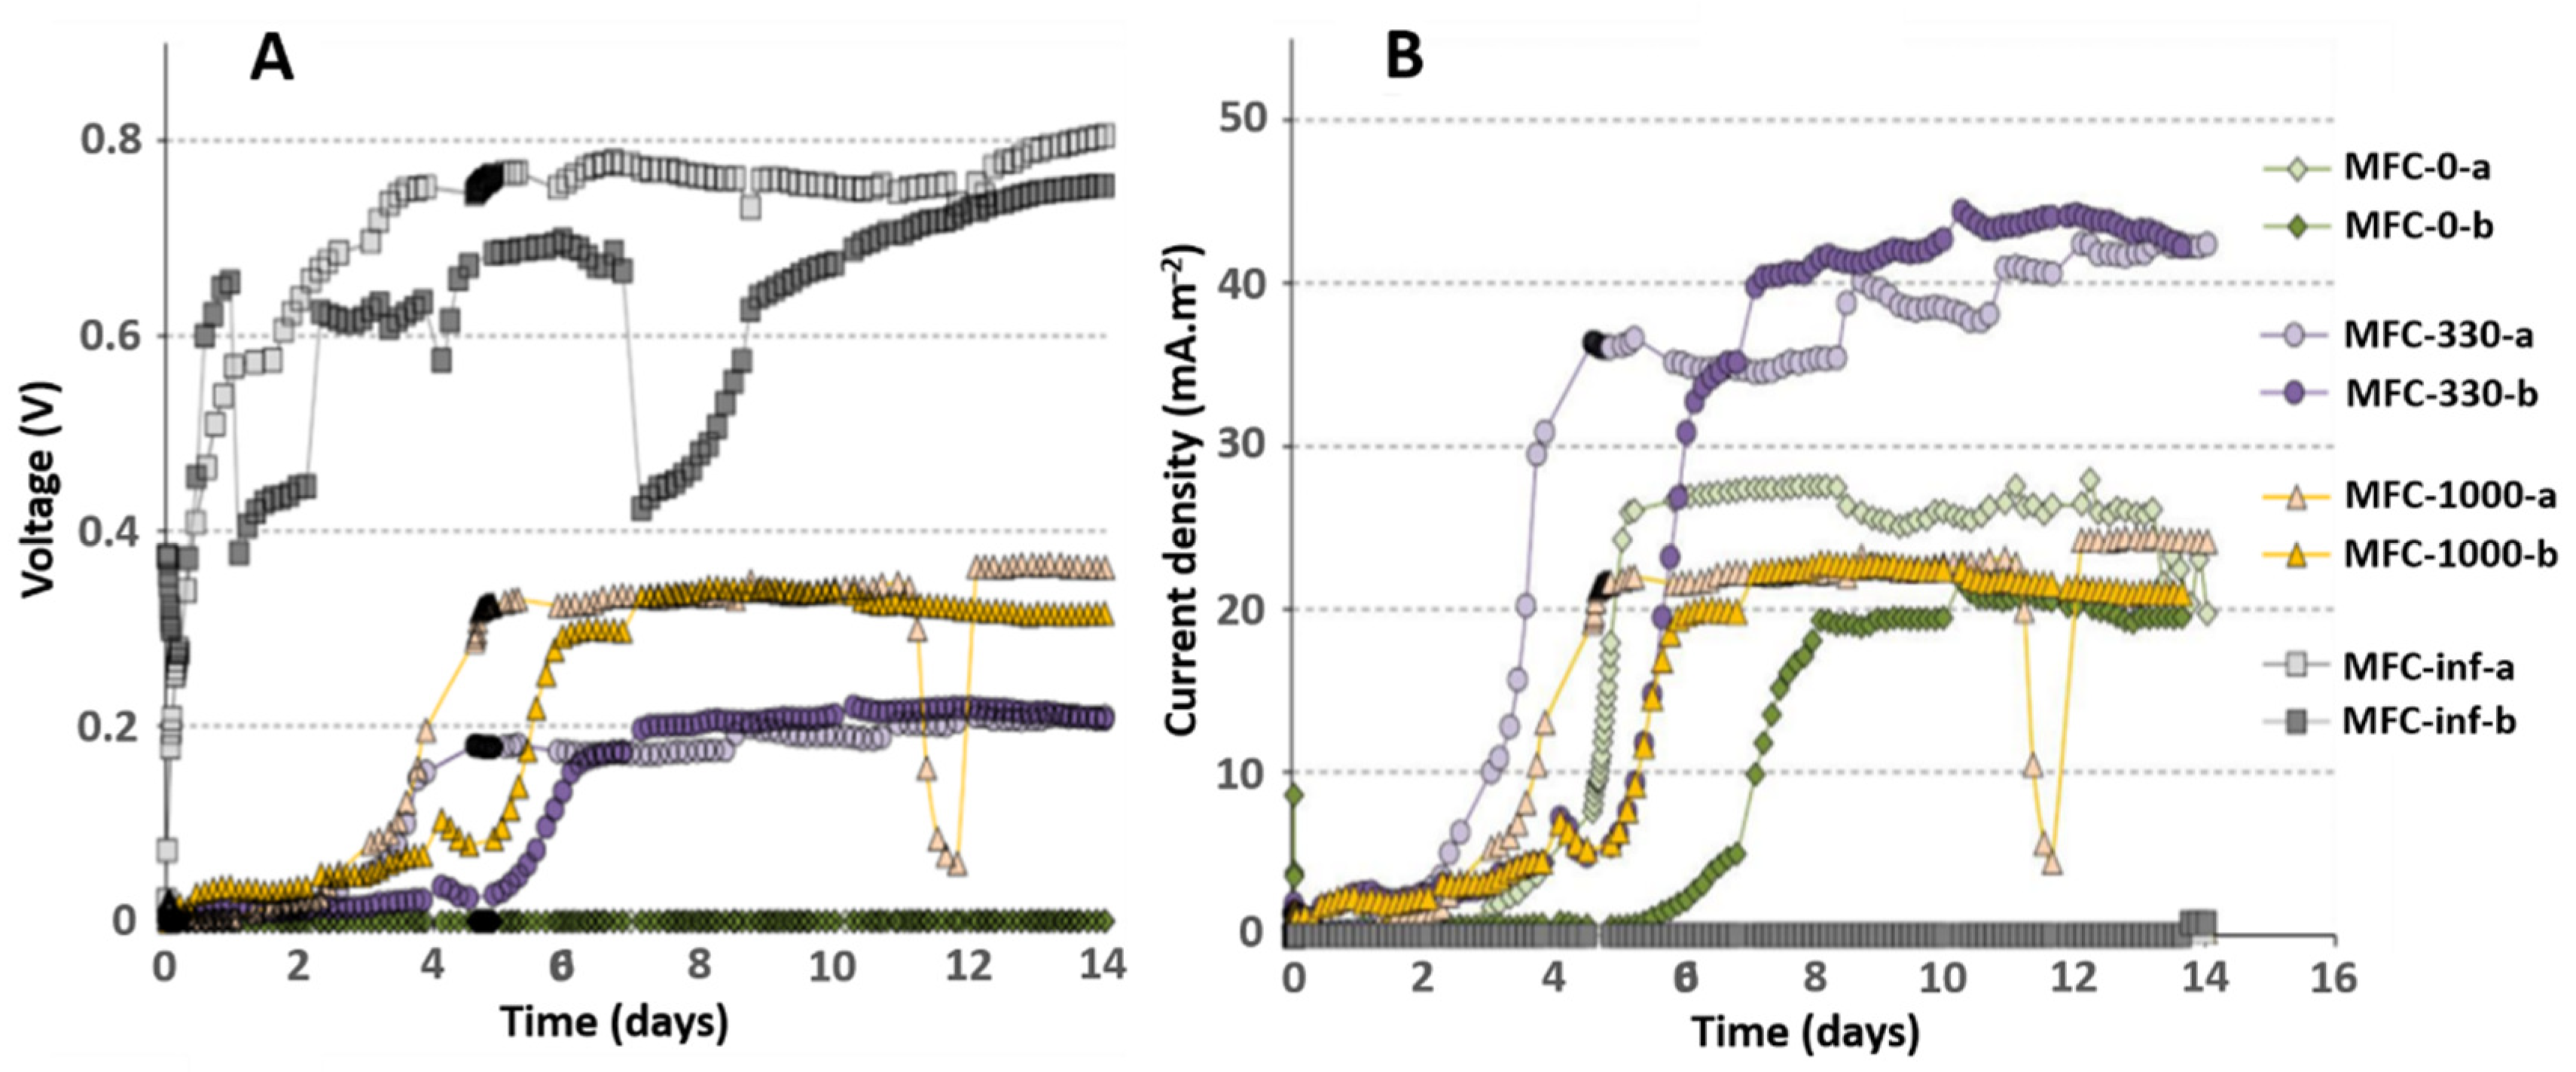
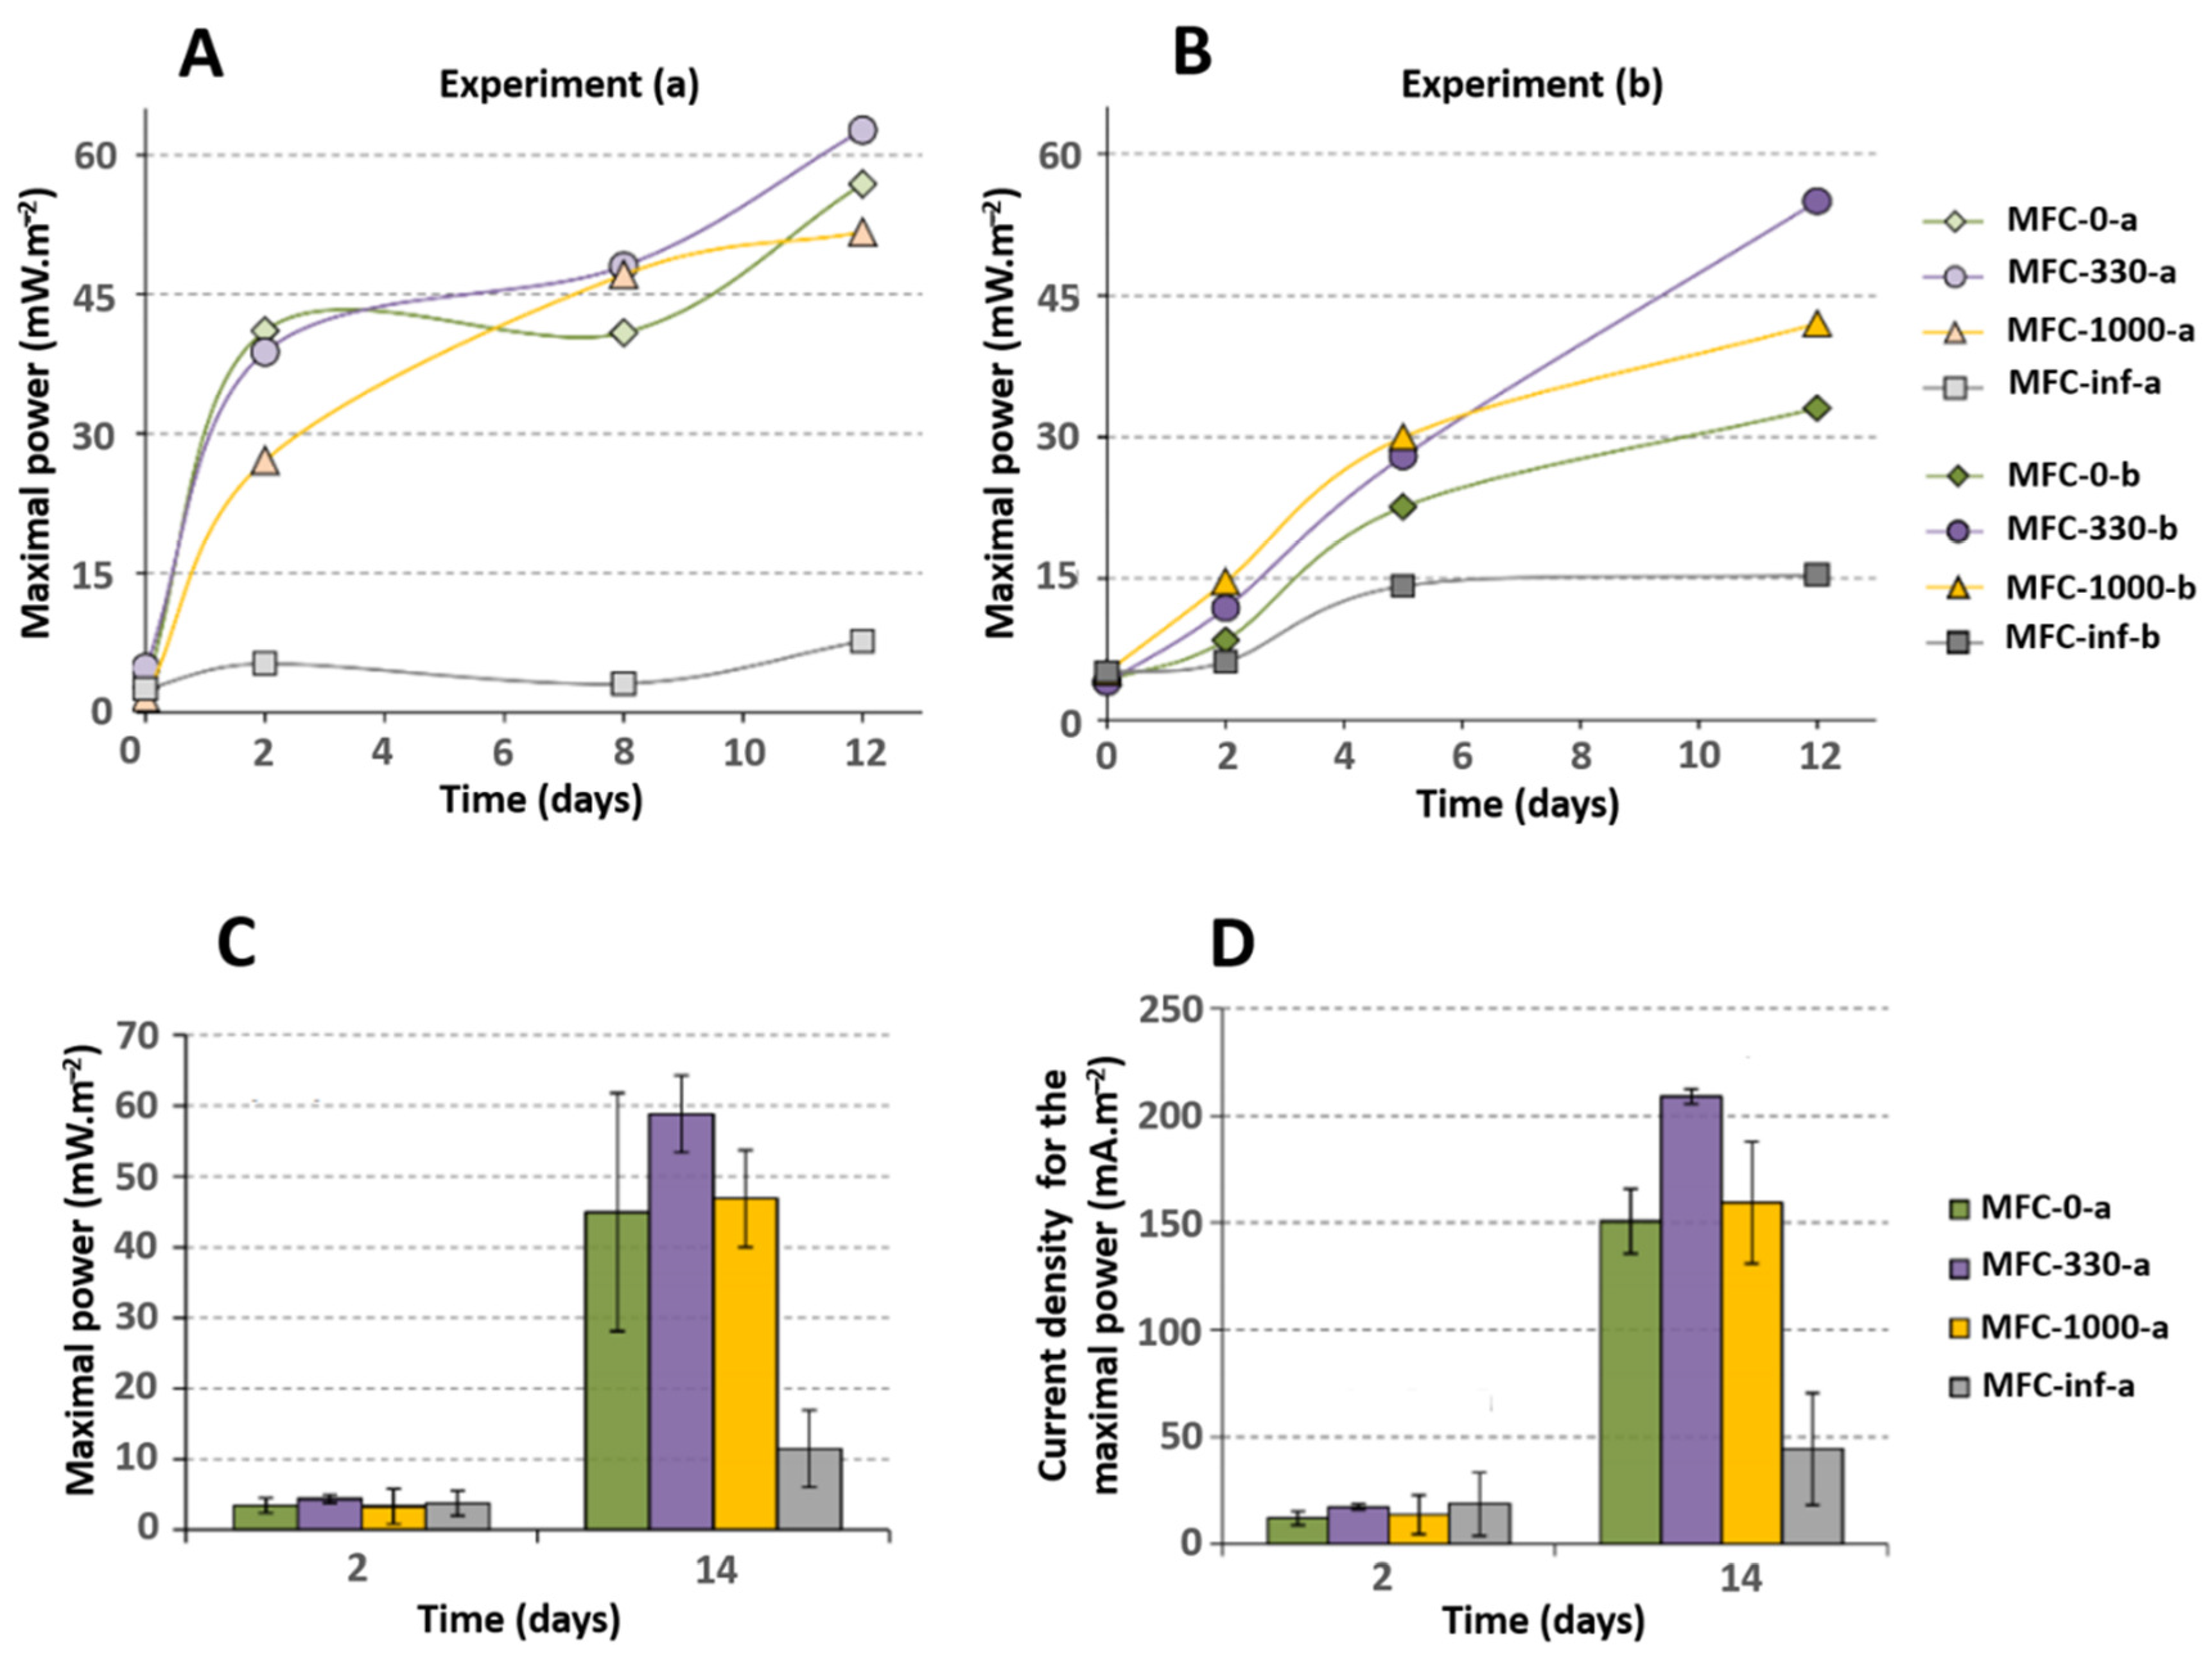
2.2. Impact of External Resistance on Electrical Performance of MFCs

The maximal power density of MFCs was measured at different times in order to compare the electroactivity of anodic biofilms (Figure 3). After 2 days, the maximal power density was similar for the eight MFCs (3.7 ± 1.3 mW m−2). This maximal power density was calculated for a current density of 15.5 ± 7.2 mA m−2. The maximal power densities increased faster in the experiment (a) than in the experiment (b). The maximal power density and current density of MFC-inf stayed low even after 2 weeks in both experiments (11.1 ± 5.3 mW m−2/ 43.3 ± 26.5 mA m−2). The best performance was obtained for MFC-330 in both experiments, with a maximum power density of 58.8 ±.5.4 mW m−2 and current density of 209 ± 3.1 mA m−2. The maximum power densities obtained for MFC-0 and MFC-1000 were 44.5 ± 16.6 mW m−2 and 46.5 ± 6.7 mW m−2, respectively. The corresponding current densities were 150 ± 15.6 mA m−2 for MFC-0 and 160 ± 28.6 mA m−2 for MFC-1000. These results showed no significant difference in power output of MFCs operated with Rext that allowed current flow (MFC-1000, MFC-330 and MFC-0). These results are in good agreement with those previously described by Lyon et al. [9]. Moreover, the power densities of MFCs operating with lower Rext (MFC-1000, MFC-330 and MFC-0) were similar for those previously reported for MFCs using carbon cloth anodes and wastewater as inoculum (50 mW m−2) [19]. However, drastic difference in electrical performance was observed between MFCs operated with an open circuit and MFCs operated at lower Rext. These results indicated that the formation of electroactive biofilms requires a minimum of current flow from anode to cathode, without which EAB would have difficulties to grow competitively on the anode surface.

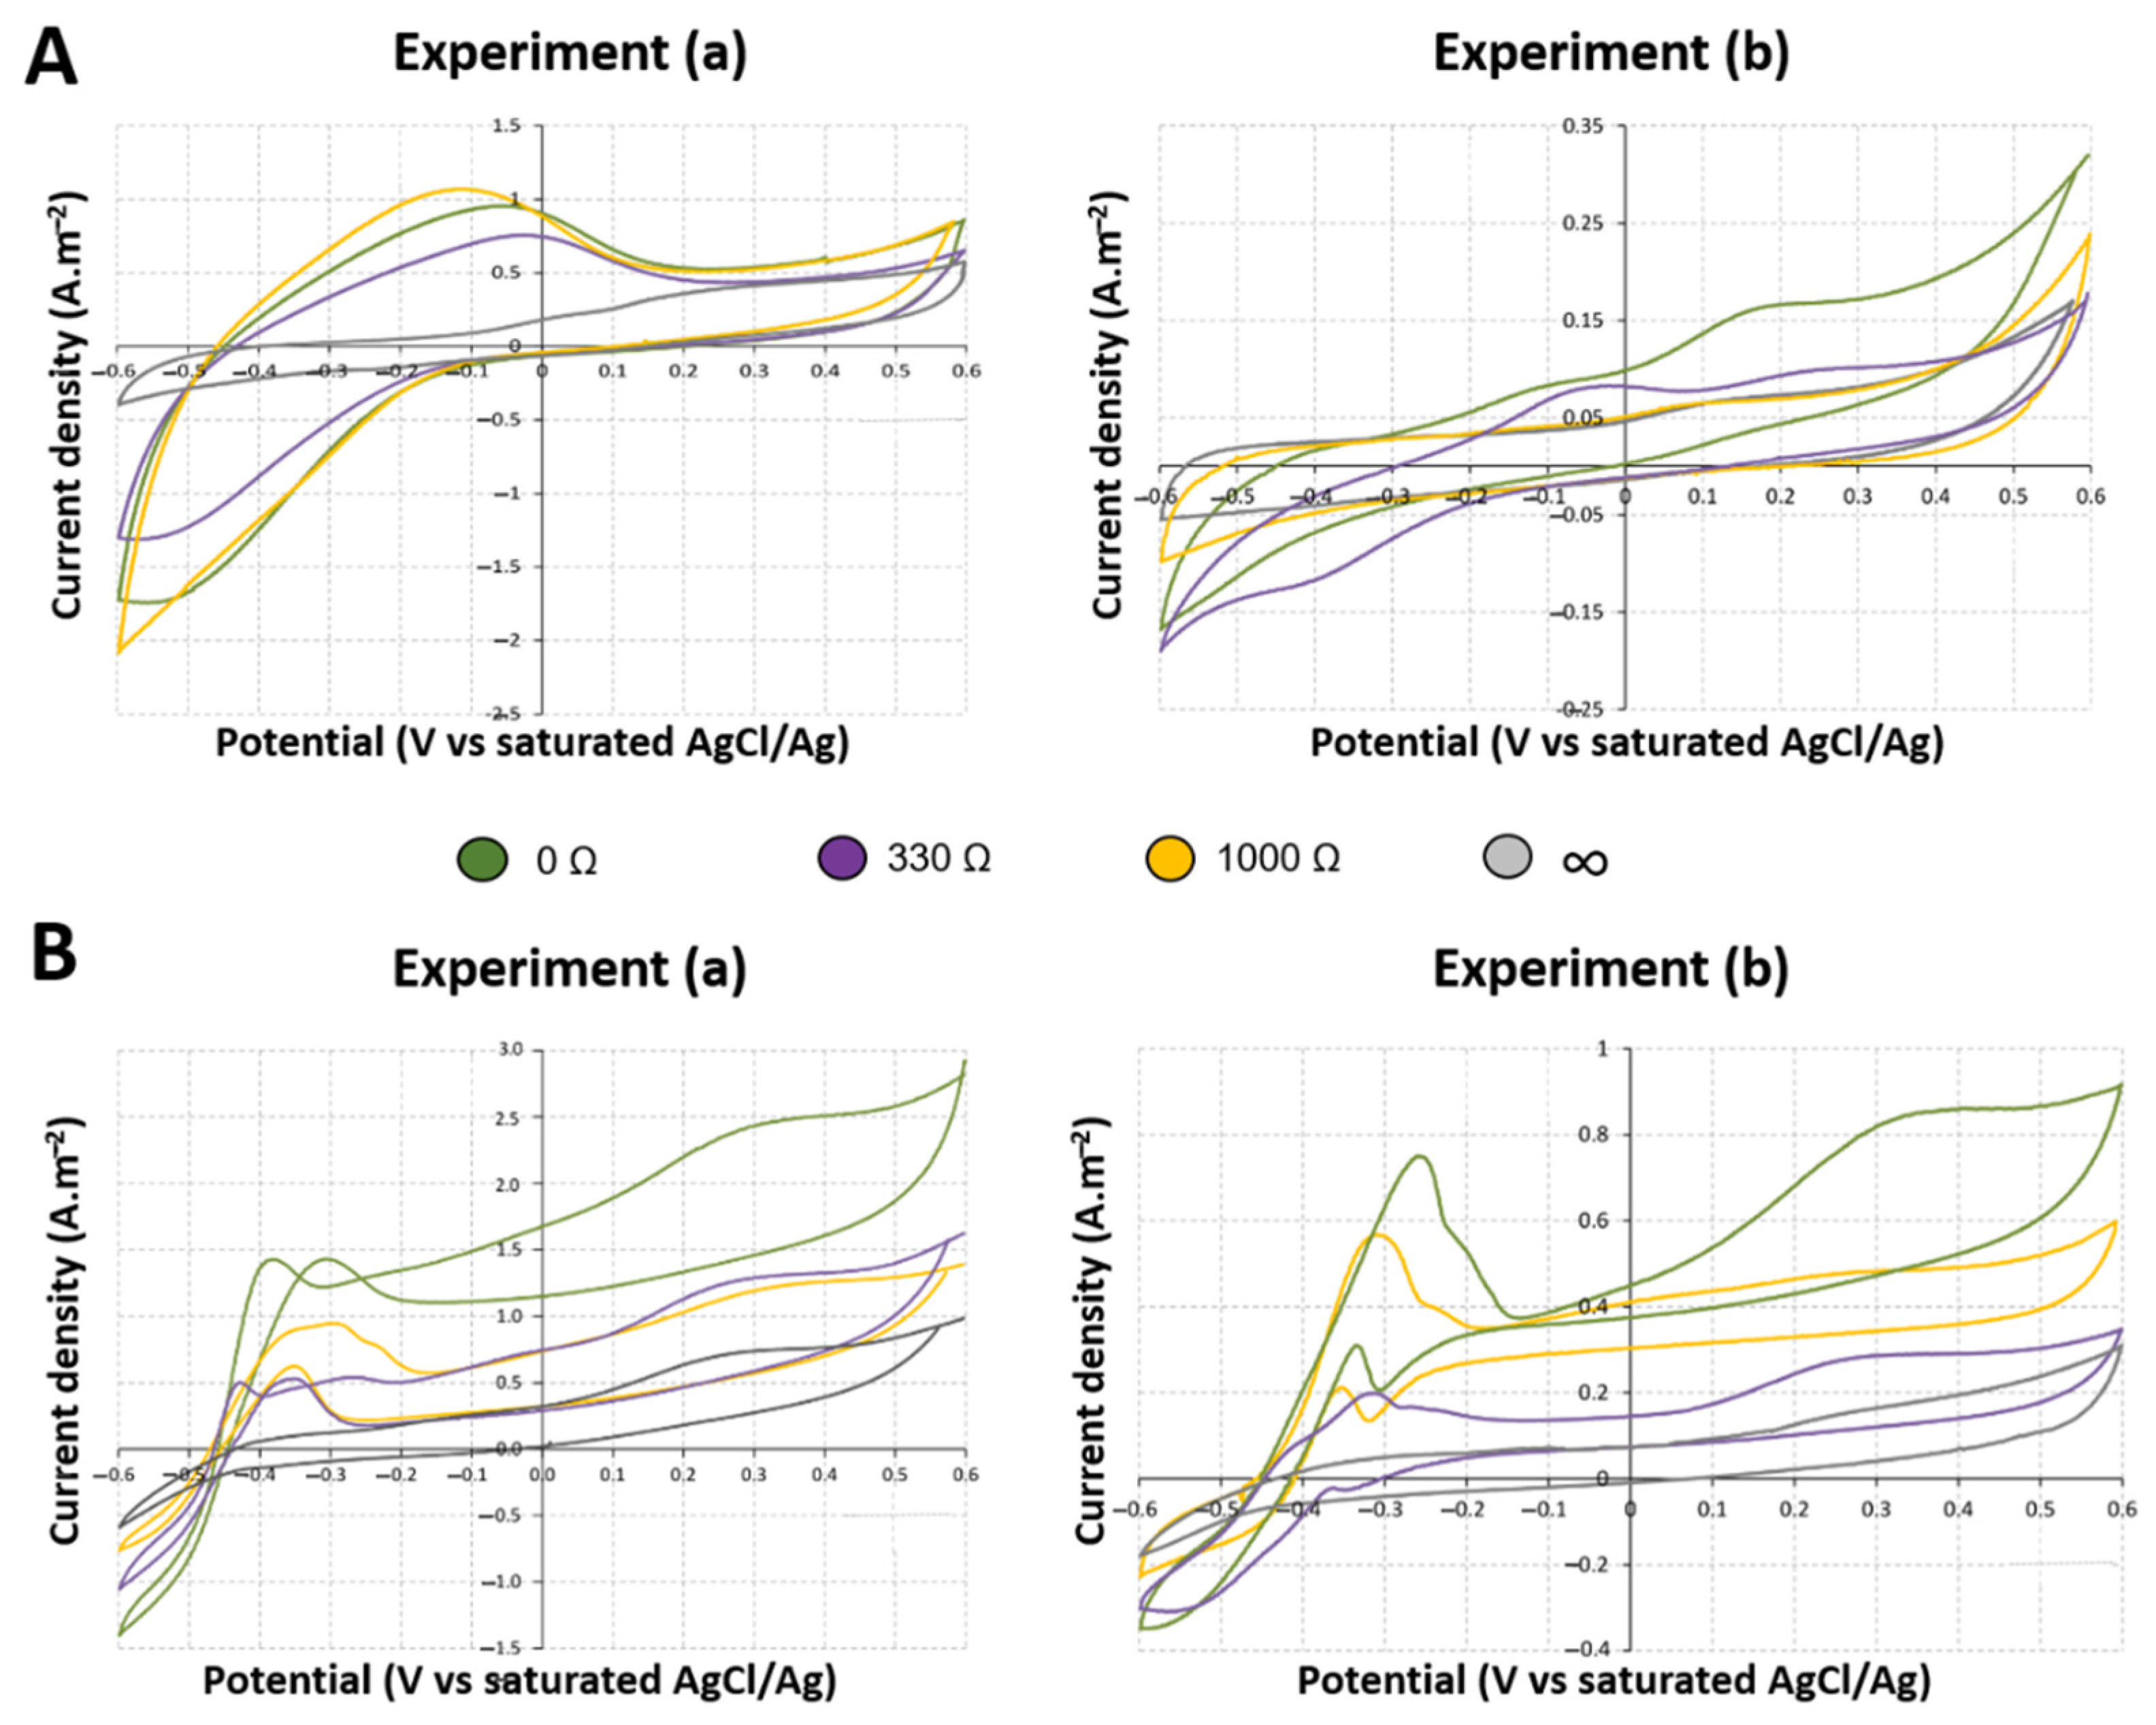
2.3. Influence on Electrochemical Activity of Anodic Biofilms

In order to assess extracellular electron transfer (EET) in biofilms, cyclic voltammograms (CVs) of the anodes were performed after 2 days and after 2 weeks of operation (Figure 4). CVs of MFC-inf anodes in both experiments exhibited low catalytic activity even after 2 weeks of operation. These results are in good agreement with the power performance of MFCs-inf. After 2 days, CVs of anodes in MFC-0, MFC-330 and MFC-1000 showed large redox peaks centered at −300 mV (vs. Ag/AgCl). Based on previously reported studies, the large separation in peak potentials and the negative potential regions of these redox peaks can be attributed to electroactive bacteria capable of using a large range of electron acceptors and substrates and able to mediate indirect EET [13,23,24]. For example, Oziat et al. reported a complex electrochemical response of Pseudomonas composed of at least 7 redox peaks that are the electrochemical image of the redox secretome complexity [25]. Moreover, Xiao et al. reported the CVs of Acinetobacter composed of four redox peaks spread over a potential window ranging from −0.4 to 0.9 V vs. AgCl/Ag [26]. After 2 weeks, the electrochemical response of anodes changed and had two intense peaks in both positive and negative potential regions. Sharp redox peaks observed at around −270 mV (vs. AgCl/Ag) and the oxidative peak at 300 mV (vs. AgCl/Ag) suggest that the direct electron transfer was the major EET mechanism, as previously described [27]. Based on previously reported results, the shape and the potential region of these peaks could correspond to mediated electron transfer of Shewanella oneidensis and/or heterogeneous electron transfer via nanowires of Geobacter sulfurreducens [13,24]. Another mechanism could be a direct electron transfer via c-type cytochrome as in Clostridium, Geobacter or Shewanella [28]. The similarities in the CVs of anodes in MFC-0, MFC-330 and MFC-1000 suggest that electron transfer mechanisms in the biofilm were not significantly influenced by differences in Rext between 0 to 1000 ohms.

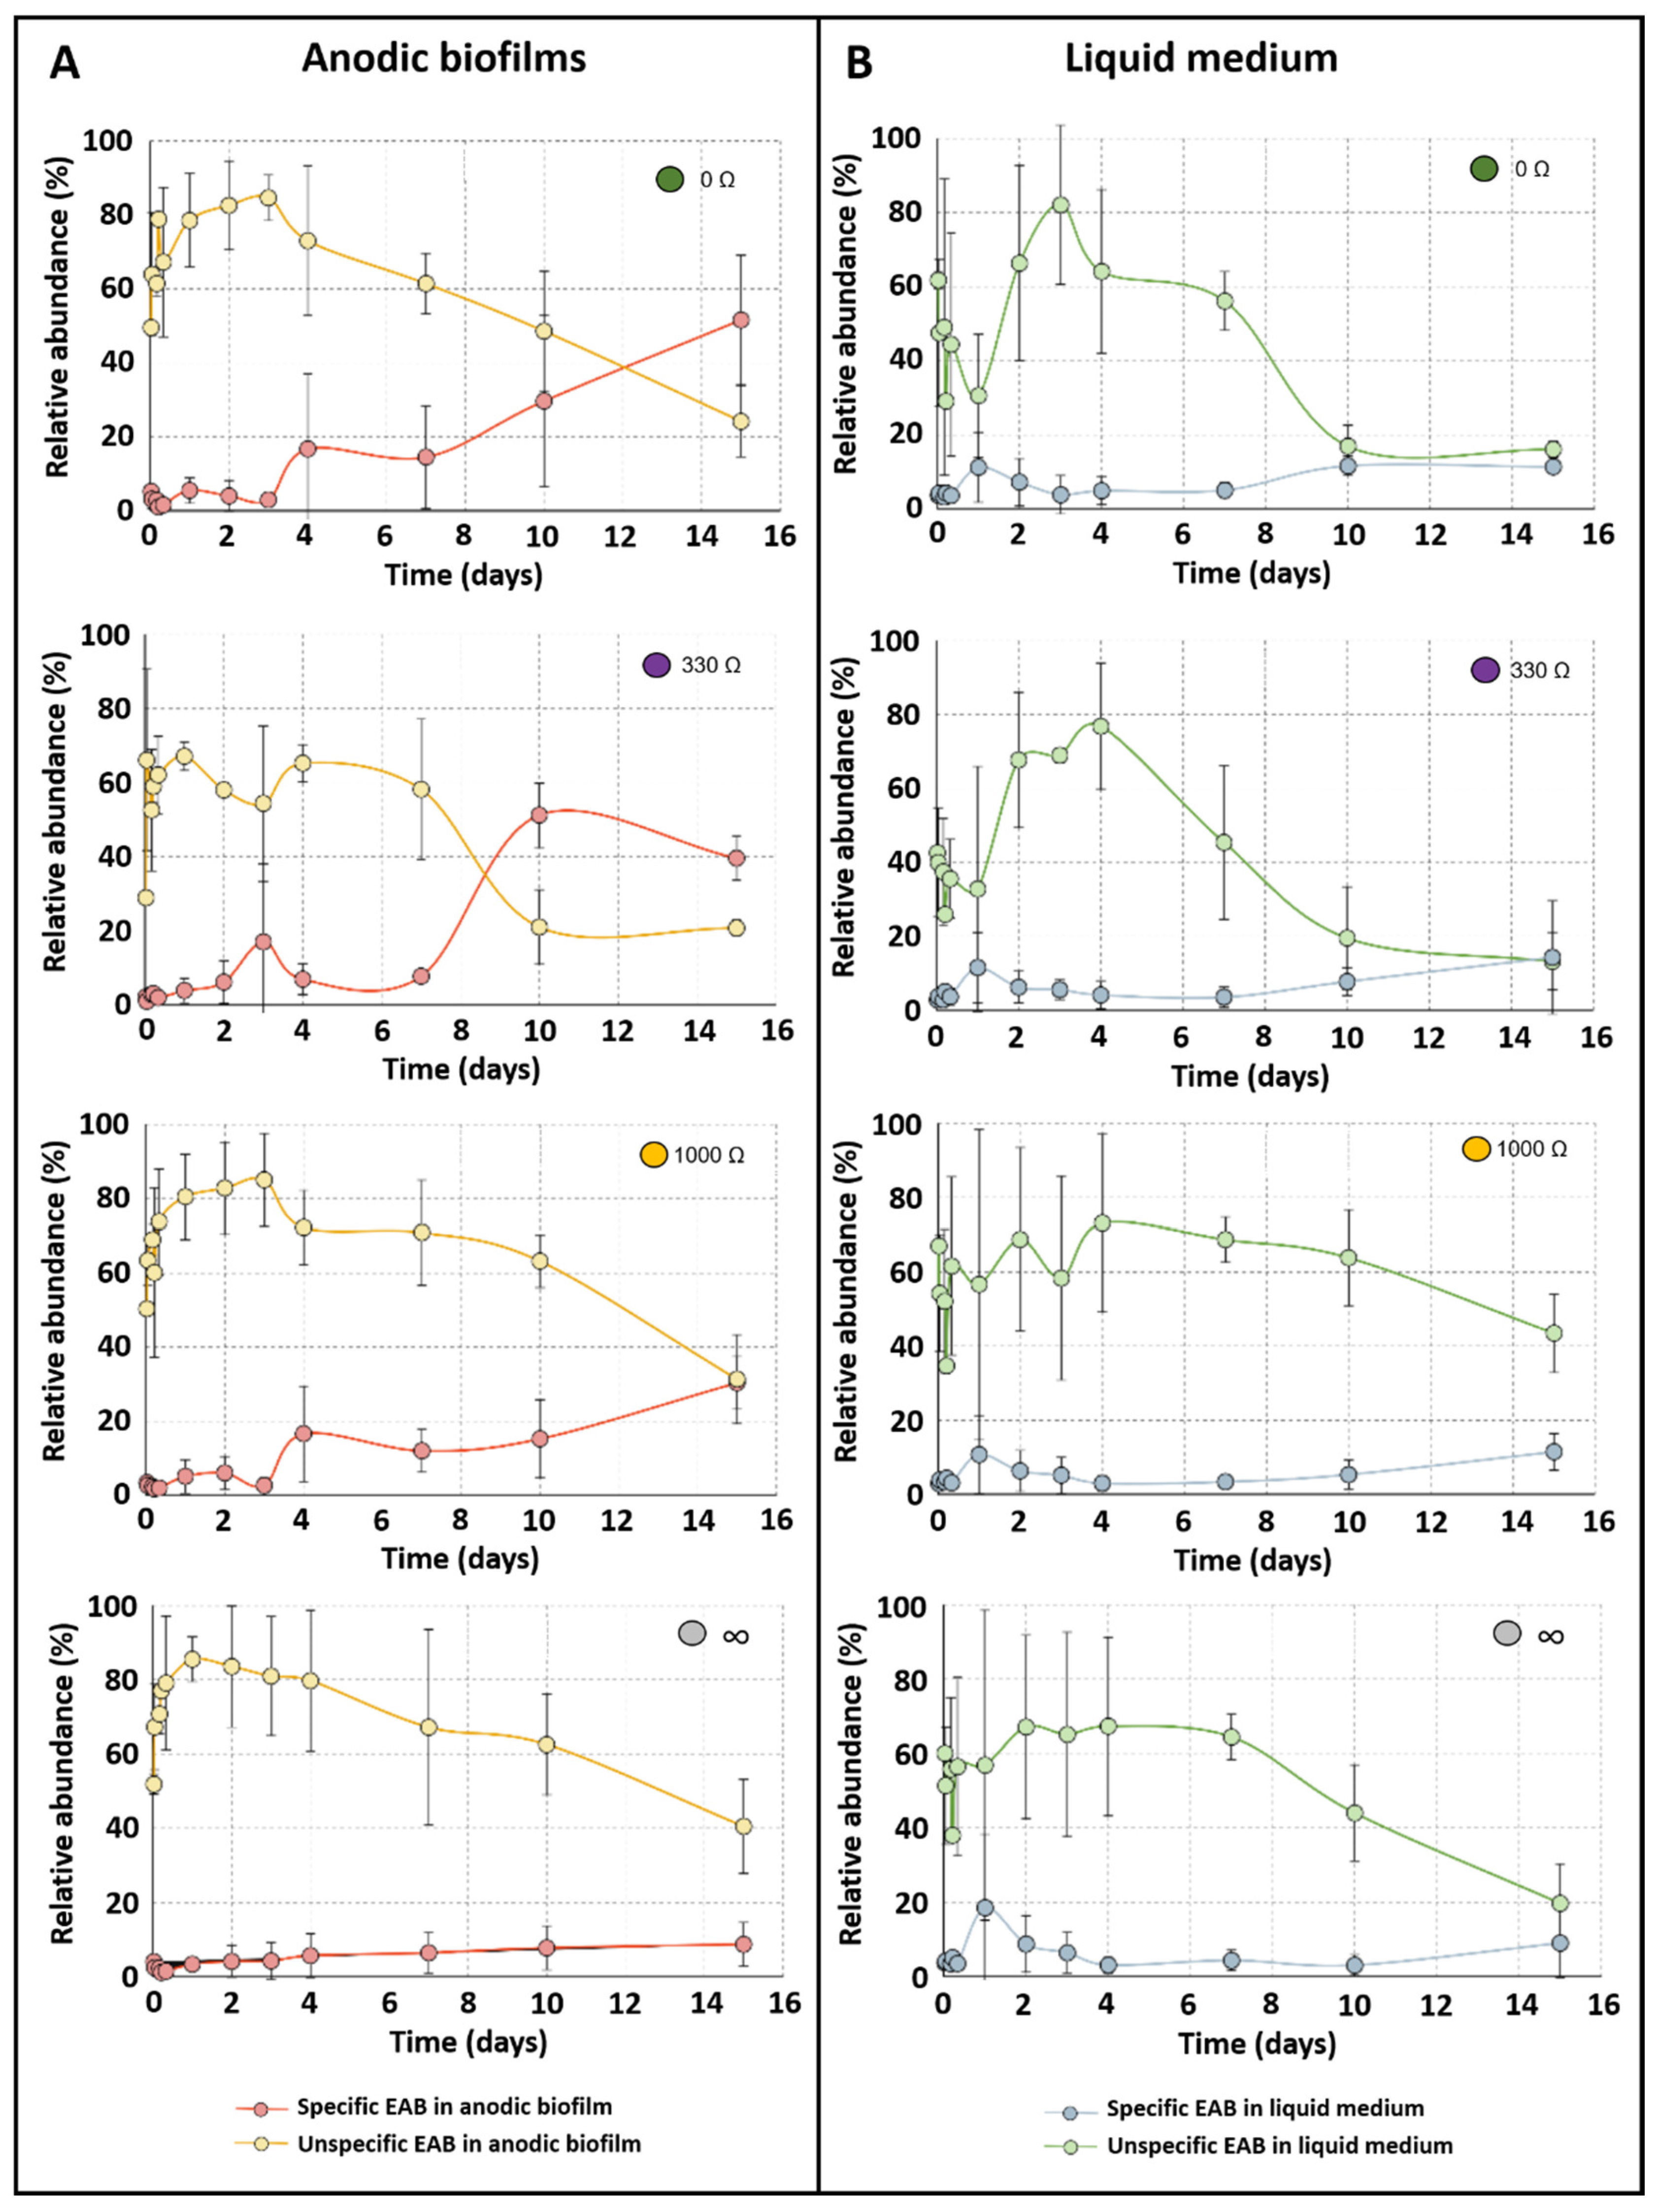
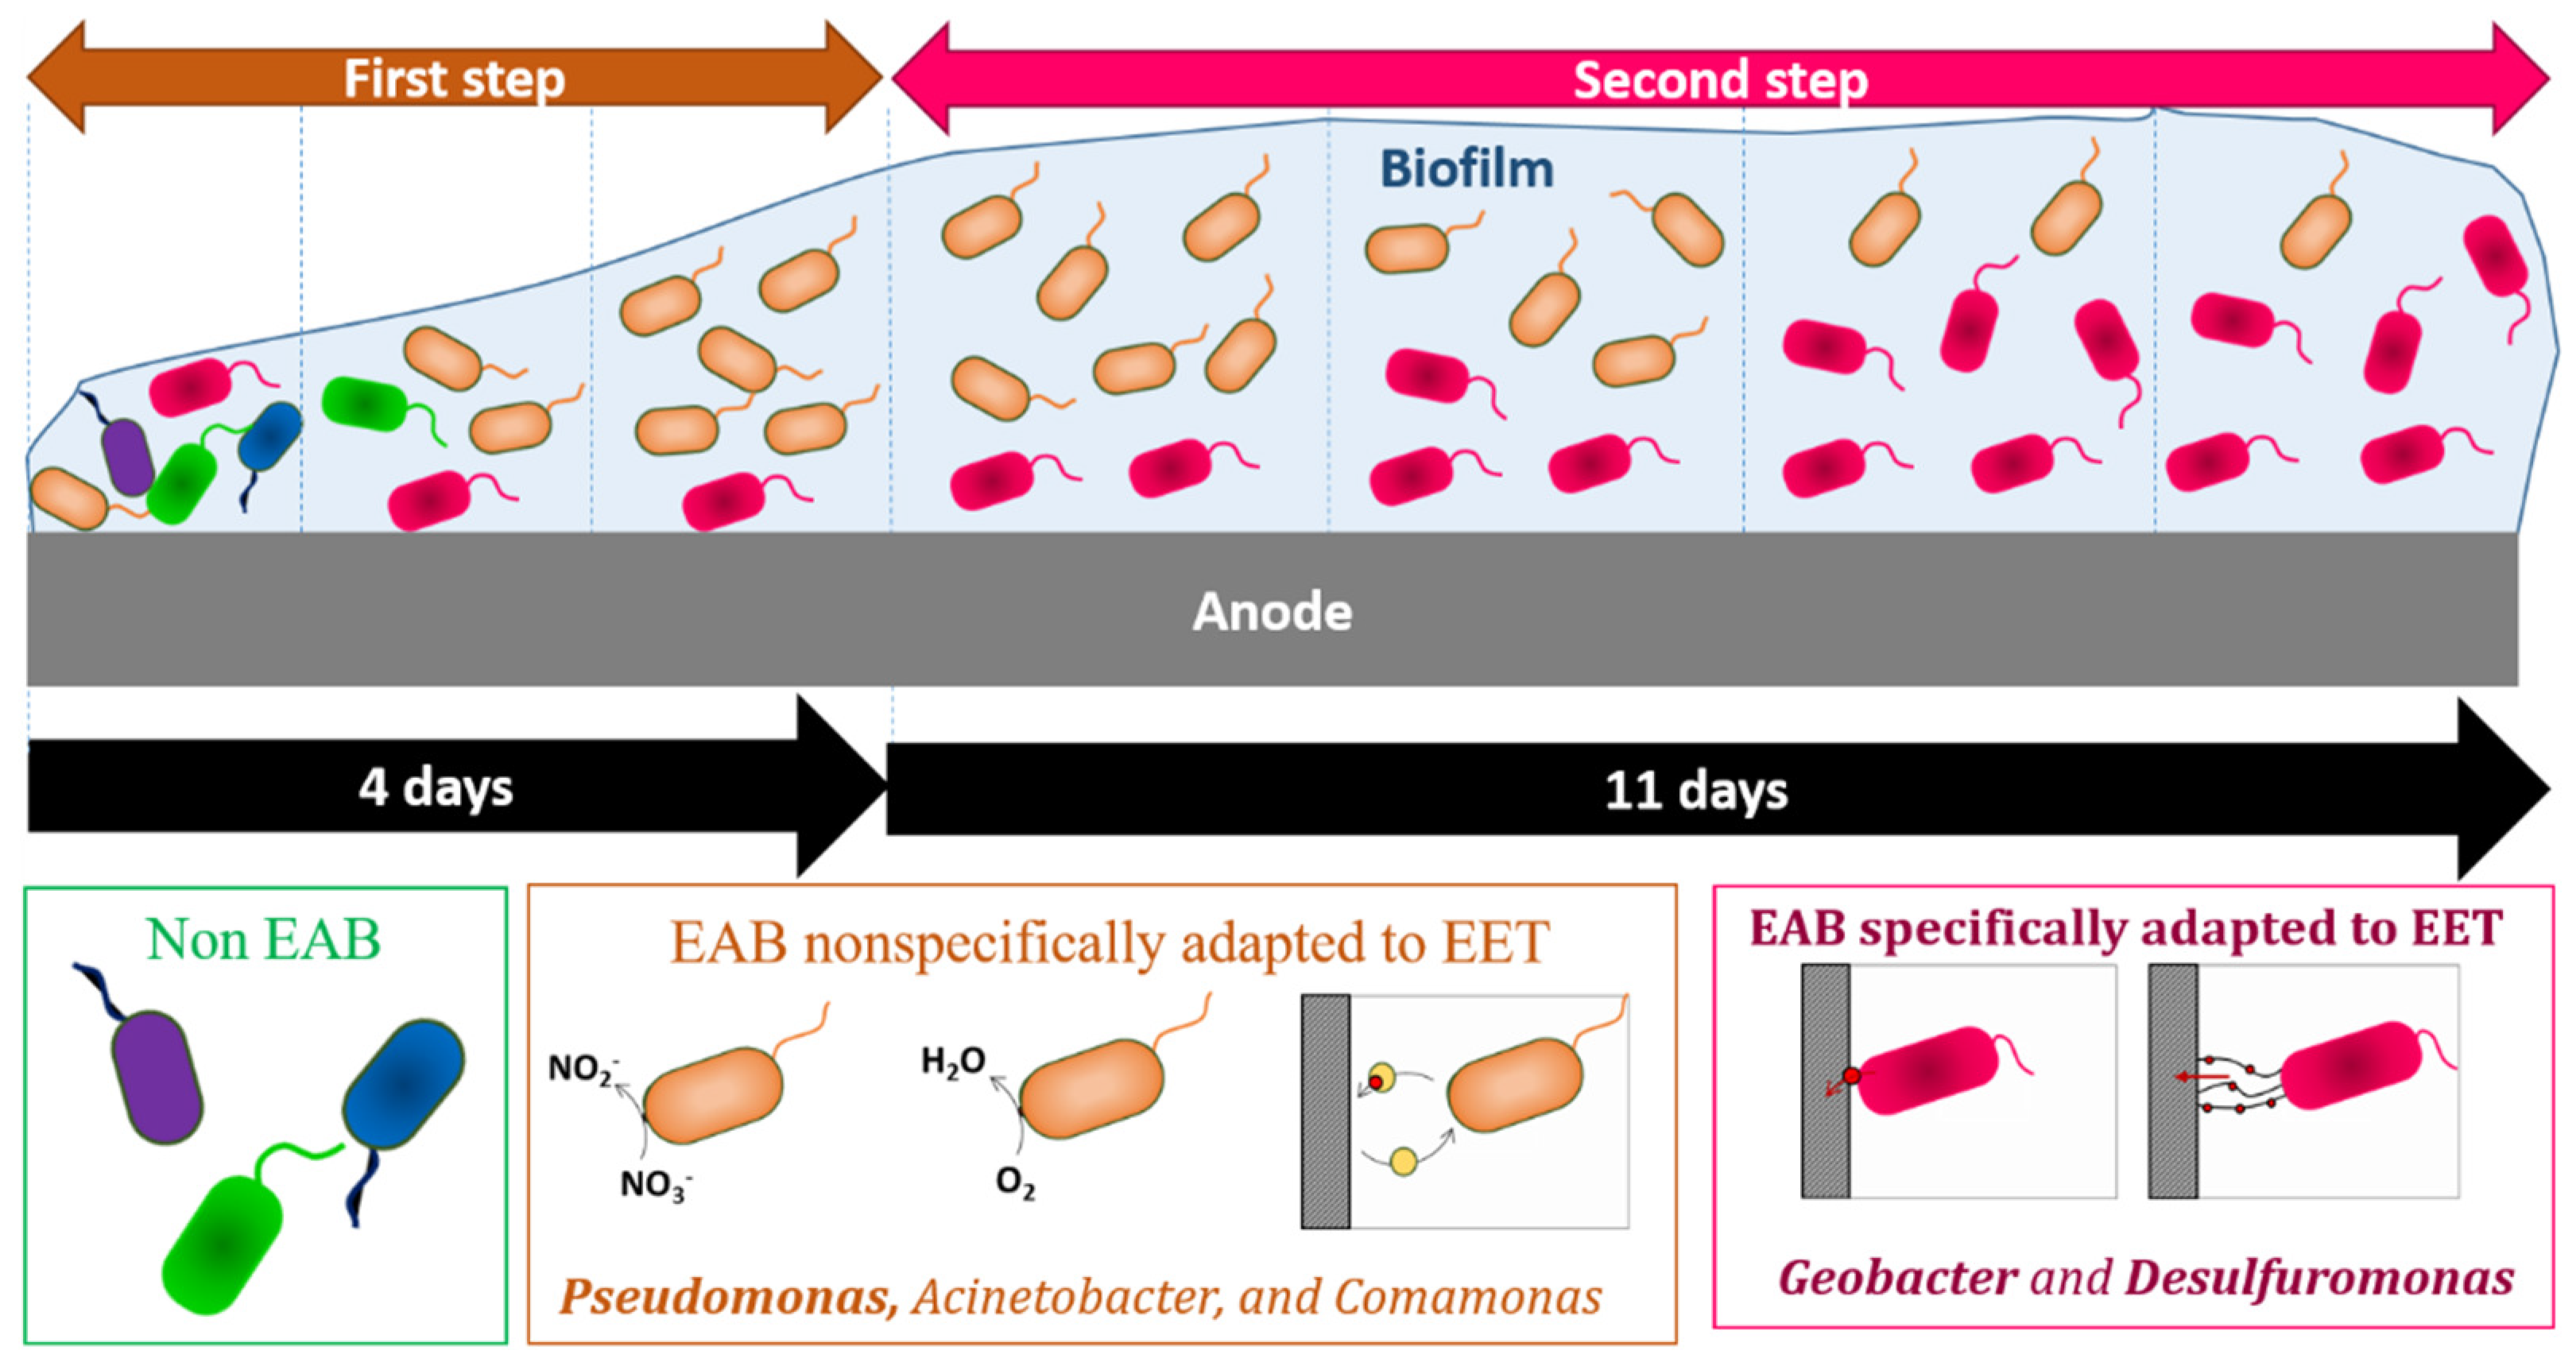
2.4. Impact of External Resistance on Bacterial Community Dynamic of Anodic Biofilms

In order to follow the bacterial community dynamic during anodic biofilm growth, DNA was extracted at different times and the 16S rRNA gene was sequenced by MiSeq Illumina paired-end sequencing. The sequences were annotated using the RDP databases [29,30]. Two major communities were identified from annotated sequences: EAB specifically adapted to EET using a direct EET as Geobacteraceae, and EAB nonspecifically adapted to EET such as Pseudomonodaceae using mainly an indirect EET and that could use other soluble electron acceptors (Figure 5). The relative abundance of nonspecific EAB increased very quickly until reaching around 80% at the second day in anodic biofilms of all MFCs. From the 4th day onward, their relative abundance decreased until reaching 24 ± 10%, 20 ± 2%, 31 ± 11% and 40 ± 13% for MFC-0, MFC-330, MFC-1000 and MFC-inf, respectively. The major genus present of the nonspecific EAB were Pseudomonas, Acinetobacter and Comamonas (Table S2). The relative abundance of specific EAB increased from the 4th day onward in MFCs producing electricity (i.e., MFC-0, MFC-330 and MFC-1000), and more in MFCs with a higher electricity production (MFC-330).
After two weeks, the relative abundance of specific EAB was 51 ± 17%, 39 ± 5%, 30 ± 7% and 9 ± 6% in MFC-0, MFC-330, MFC-1000 and MFC-inf, respectively. The major genus of specific EAB were Geobacter and Desulfuromonas. A similar increase in the relative abundance of nonspecific EAB was observed in the liquid medium of all MFCs until the 4th day (around 80%), followed by a decrease in the relative abundance of this community as in the anodic biofilm samples. Unlike in anodic samples, the specific EAB did not increase in the liquid medium. After 2 weeks, the relative abundance of specific EAB in the liquid medium was only 11 ± 2%, 14 ± 8% and 11 ± 5% in MFC-0, MFC-330 and MFC-1000, respectively. Their relative abundance in the MFC-inf was 9 ± 8%. Thus, the EAB increase was not observed in the liquid medium. These results indicated two steps in the bacterial community development in the anodic biofilms: a first step where the relative abundance of nonspecific EAB increased in both the liquid medium and the anodic biofilm and a second step where specific EAB increased in the anodic biofilm.
No significant difference in the bacterial community dynamic of anodic biofilms was observed for MFCs with Rext of 0, 330 and 1000 ohms. However, the bacterial communities (measured by the relative abundance of EAB, genus numbers and Shannon index) were different as a function of Rext (Table 1). After two weeks, the relative abundance of specific EAB was lower when the Rext was higher. The number of genera was calculated as an indicator of the richness of the microbial community, and the Shannon index was also calculated as an indicator of richness and evenness of the microbial diversity. After two weeks, the genus number and the Shannon index were larger when the Rext was higher (Table 1). These results showed that the richness and the diversity of the microbial community in anodic biofilms decreased with decreasing Rext. A decrease of the biofilm diversity was an indicator of specialization of the bacterial community [31,32].

3. Discussion

This study addressed the development of the anodic biofilm under different external resistances. Two steps in the biofilm formation were observed. First, the richness and the evenness of the diversity decreased during the first four days. Nonspecific EAB grew fast by mainly using indirect EET. Indeed, nonspecific EAB can use a large diversity of carbon source and electron acceptors. Pseudomonas and Acinetobacter, which were previously described as nonspecific EAB [33,34], were the major genus of this group. During this phase, the electricity production began but stayed relatively low. Nonspecific EAB likely used other electron acceptors than the anode, such as oxygen and nitrate to grow quickly. Since they used soluble electron acceptors, they grew on both the anode and in the liquid medium. Electrochemical response of anodes during this phase suggests that these bacterial species secreted redox molecules either for EET to the anode or to communicate for the biofilm formation. Pseudomonas is known to use quorum sensing during biofilm formation [31,32]. As previously described, quorum sensing favors the electroactivity in mixed biofilm community [35,36,37]. During this first phase, the cell voltage was low and the electrochemical potential of the anode was relatively high (Table S3). This step occurred in all the MFCs regardless of the Rext or electrical conditions. During the second step, the relative abundance of nonspecific EAB decreased, potentially due to the decrease of the other electron acceptors such as oxygen and nitrogen and to the initial development of a potential on. The electrochemical potential of the anode decreased (Table S1). Specific EAB that are more dependent on EET for their growth increased. Geobacter and Desulfuromonas were the major genus of this community in this study. The microbial richness stayed low but the microbial evenness increased (Supplementary Materials, Evolution of the biofilm diversity S2). The electricity production increased in terms of current density and maximal power density. The growth of specific EAB was more dependent of electricity production. Their relative abundance increased with decreasing Rext. This trend was not observed in the MFC-inf. For this reason, this bacterial community only grew on the anode and not in the liquid medium. A different type of competition occurred during anode colonization. First, there was a competition between nonspecific and specific EAB (Figure 6). Nonspecific EAB colonized the anode first because their growth was faster and because they could use soluble electron acceptors that are possibly more favorable energetically, such as oxygen and nitrate. After the consumption of soluble electron acceptors, specific EAB became more competitive and colonized the anode. During the second step, the space for the anode colonization decreased and there was competition between different specific EAB, as observed in the 20 samples where the relative abundance of specific EAB was higher than nonspecific EAB. When Geobacteriaceae increased, the relative abundance of Desulfuromonodaceae decreased (Figure S3). The Spearman coefficient correlation was −0.735 with a p-value < 0.001. If there was no competition between these two families, these groups should have increase simultaneously. However, it is difficult to determine if this competition is due to anode accessibly or to the carbon source.

4. Materials and Methods

4.1. MFC Steup and Sampling

Single-chamber batch MFCs were set up in 250 mL Wheaton bottles in the laboratory at ambient temperature (Figure S4). The anode consisted of one 10 × 15 cm piece of carbon cloth. The carbon cloth would be cut during sampling to have 25 (0.5 × 8 cm) pieces (Figure S5). The cathode was prepared with PTFE coating and 5% of platinum catalyst as described by Cheng et al. [38]. The MFCs were filled with 250mL of primary effluent and 1 g of dehydrated sludge from a Grand Lyon domestic wastewater treatment plant (Lyon, France) and fed with 1 g/L of sodium acetate. The experiment was done in duplicate (a and b) separated by a period of 3 months. 2 × 4 MFCs were started with different Rext: 1000 ohms (MFC-1000-a and MFC-1000-b), 330 ohms (MFC-330-a, MFC-330-b), without resistance (MFC-0-a and MFC-0-b) and with an open circuit simulating an infinite resistant (MFC-inf-a and MFC-inf-b) (Figure S6). The MFC voltage was recorded every 5 min with a precision of 1 µV. For each time point (0.5, 1, 4, 8, 24, 48, 72, 96, 168, 240 and 360 h), two samples of 800 µL were taken from liquid medium and two anodic samples of 0.5 × 8 cm were taken in each MFC. One part of the anode (0.5 × 6 cm) was used for DNA extraction and one part (0.5 × 2 cm) was used for microscopic observations. In order to compare the evolution of electroactivity, the maximal power was determined by polarization curve analysis and cyclic voltammetry for the time points 48, 96, 168, 240 and 360 h.

4.2. Electrochemical Measurements

The polarization curves of MFCs were measured at different time points by linear voltammetry with a rate of either 1 mV/s or 0.5 mV/s in a three-electrode system [39,40,41]. The anode was used as the working electrode, the cathode as the auxiliary electrode and an Ag/AgCl electrode as the reference electrode. The potential of the reference electrode Ag/AgCl was +198 mV versus a standard hydrogen electrode. All electrochemical potentials were expressed versus Ag/AgCl. A voltammeter was added to measure the cell voltage during the linear voltammetry measurements. Under these conditions, the voltage of the cell, and the anodic and cathodic potential, could be determined as a function of the current density. The CV of the anodes was performed using the same three electrode system. The CV experiments scanned the potential range from −0.6 V to 0.8 V vs. Ag/AgCl with a rate of 10 mV/s. The CV tests were carried out with potentiostat Origalys 0GF01A (Origalys, Rilleux-La-Pape, France).

4.3. Microscopic Observations and Image Analyses

The anodic biofilms were observed by fluorescence microscopy. The samples were labelled using a LIVE/DEAD BacLight Bacterial viability kit (Invitrogen). An aliquot (1.5 µL) of SYTO9 and 1.5 µL of propidium iodide were mixed in 2 mL of sterile NaCl 0.8%. Then, 200 µL were deposed on each anodic biofilm sample. Samples were incubated for 15 min in the dark before observations with (Axio Imager Zeiss microscope, France). Four images were taken per sample using a z-stack of one image per 10 µm and a focus of ×200 or ×500 (Figure S4). The image size was 1388 × 1040 pixels with a resolution of 150 ppp. The coverage percentage and the proportion of active and inactive bacteria were determined using the Image J software (Bethesda, MD, USA) (Supplementary Materials, Image analysis with image J S1).

4.4. Sequencing Analyses

For each sample (0.5 × 6 cm²), DNA was extracted using the Nucleospin Soil kit. The solution SL1 was used for the cell lysis, and DNA was eluted using 2 × 25 µL of the elution solution. Then, the V3-V4 region of 16S rRNA gene was amplified using Platinum Taq DNA Polymerase of ThermoFisher Scientific. The forward primer sequence was 5′ TCGTCGGCAGCGTCAGATGTGTATAAGAGACAGCCTACGGGNGGCWGCAG 3′, and the reverse primer sequence was 5′ GTCTCGTGGGCTCGGAGATGTGTATAAGAGACAGGACTACHVGGGTATCTAATCC. The PCR program was 95 °C for 3 min, 25 cycles of 95 °C for 30 s, 55 °C for 30 s and 72 °C for 30 s, then a final step of 72 °C for 5 min. The resulting amplicon size was about 550 bp. The library preparation was performed following the Illumina protocol. The amplicons were sequenced by a paired-end MiSeq sequencing using the technology V3 of Illumina with 2 × 300 cycles. The adapter sequences were removed by internal Illumina software at the end of the sequencing (forward overhang 5′TCGTCGGCAGCGTCAGATGTGTATAAGAGACAG and reverse overhang 5′GTCTCGTGGGCTCGGAGATGTGTATAAGAGACAG). The repartition of the sequence number after paired-end assembling is shown in the Figure S7 (mean = 51,446 ± 18,240 sequences per sample). In the bacterial community analysis, family rank was chosen as a good compromise between the precision of the taxonomic rank and the annotated percentage. Two bacterial communities were particularly examined: the nonspecific adapted EAB (composed of Pseudomonadaceae, Comamonadaceae and Moraxellaceae), and specific adapted EAB (composed of Geobacteraceae, Desulfuromonadaceae, Clostridiaceae and Desulfovibrionaceae).

4.5. Statistical Analyses

The diversity analysis was done at the genus level using R software and the R package vegan. Two hundred random subsamples of 10,000 sequences each were repetitively taken in each sample in order to compare the diversity between samples. The mean of the number of genus and the mean of the Shannon index was calculated for each sample from these 200 subsamples. Statistical tests were done using R software. Normal distribution of data was tested using the function shapiro.test. If the data followed a normal distribution, parametric tests were privileged. Otherwise, non-parametric tests were used.

5. Conclusions

The present work described the effect of different Rext on the power production of MFCs and on the dynamic evolution of microbial community in anodic biofilms. This study showed that reducing the value of Rext delays the start-up phase of the MFC. No significant effect of Rext was observed in power output of MFCs operating with Rext allowing current flow (from 0 to 1000 ohms). However, a drastic difference in electrical performance and in the electrocatalytic activity of anodic biofilms was observed between MFCs operated with an open circuit and those operated with lower Rext. The microscopic observation revealed no major difference in the biofilm coverage of anode surface during growth, whatever the value of Rext. The main results of this study were the determination of the two-step process in the biofilm formation. The first was characterized by the growth of nonspecific EAB (Pseudomonas, Acinetobacter and Comamonas) in a similar way, regardless of the Rext value. The second step, during which electricity production increased, was determined by the decrease of nonspecific EAB and the growth of specific EAB (Geobacter and Desulfuromonas), whose relative abundance decreased by increasing Rext. In addition, the richness and the diversity of the microbial community in the mature anodic biofilms decreased by decreasing Rext. These results suggest that an inhibition of the first step of biofilm growth could decrease the competition between nonspecific and specific EAB during anode colonization, allowing for the improvement of electricity production. The hydrodynamic forces and, more specifically, the shear forces strongly influence bacterial adhesion. We hypothesized that the shear stress could select EAB on the anode during the adhesion step by detaching non-specific EAB. This is the first of two papers in series, where we have focused on the analysis of the effect of different parameters on the dynamic evolution of microbial community in anodic biofilms. The second part of this study will focus on the effect of hydrodynamic forces.

Supplementary Materials

The following are available online at https://www.mdpi.com/article/10.3390/catal12020176/s1, S1: Image analysis with image J; S2: Evolution of the biofilm diversity; S3: MFC setup and sampling; Table S1: Anodic potentials at different time; Table S2: Relative abundance of the most represented genus in the anodic biofilms of MFCs after 2 days and after 2 weeks of operation; Table S3: Statistical paired Student test from diversity data; Figure S1: Anodic biofilm dynamics observed in fluorescence microscopy; Figure S2: Evolution of the biofilm diversity; Figure S3: Bacterial competition between specific EAB; Figure S4: MFC bottle with an air cathode; Figure S5: Schematic of the anodes; Figure S6: Schematic of MFCs operated under different external resistances; and Figure S7: Histogram of the repartition of the number of samples in function of the number of sequences.

Author Contributions

A.G.: Formal analysis, Methodology, Investigation, Writing, Original Draft, Validation, Review and Editing. N.H.: Supervision, Conceptualization, Methodology, Investigation, Writing, Original Draft, Resources, Funding Acquisition, Writing, Review and Editing. P.F.: Supervision, Formal Analysis, Investigation and Validation. T.M.V.: Supervision, Investigation, Validation, Methodology, Supervision, Writing, Review and Editing. All authors have read and agreed to the published version of the manuscript.

Funding

This work was financially supported by the LABEX IMUST Université de Lyon (AAP 2014/BIOFORCE Project) and the “Hubert Curien Program” through the PHC MAGHREB Project number 19MAG23/41382WC.

Conflicts of Interest

The authors declare no conflict of interest.

References

  1. Saadi, M.; Pézard, J.; Haddour, N.; Erouel, M.; Vogel, T.M.; Khirouni, K. Stainless Steel Coated with Carbon Nanofiber/PDMS Composite as Anodes in Microbial Fuel Cells. Mater. Res. Express 2020, 7, 25504. [Google Scholar] [CrossRef]
  2. Bensalah, F.; Julien, P.; Haddour, N.; Erouel, M.; Buret, F.; Khirouni, K. Carbon Nano-Fiber/PDMS Composite Used as Corrosion-Resistant Coating for Copper Anodes in Microbial Fuel Cells. Nanomaterials 2021, 11, 3144. [Google Scholar] [CrossRef]
  3. Jia, H.; Yang, G.; Wang, J.; Ngo, H.H.; Guo, W.; Zhang, H.; Zhang, X. Performance of a Microbial Fuel Cell-Based Biosensor for Online Monitoring in an Integrated System Combining Microbial Fuel Cell and Upflow Anaerobic Sludge Bed Reactor. Bioresour. Technol. 2016, 218, 286–293. [Google Scholar] [CrossRef] [PubMed]
  4. Cui, Y.; Lai, B.; Tang, X. Microbial Fuel Cell-Based Biosensors. Biosensors 2019, 9, 92. [Google Scholar] [CrossRef] [PubMed] [Green Version]
  5. Song, N.; Yan, Z.; Xu, H.; Yao, Z.; Wang, C.; Chen, M.; Zhao, Z.; Peng, Z.; Wang, C.; Jiang, H.L. Development of a Sediment Microbial Fuel Cell-Based Biosensor for Simultaneous Online Monitoring of Dissolved Oxygen Concentrations along Various Depths in Lake Water. Sci. Total Environ. 2019, 673, 272–280. [Google Scholar] [CrossRef] [PubMed]
  6. Prévoteau, A.; Rabaey, K. Electroactive Biofilms for Sensing: Reflections and Perspectives. ACS Sens. 2017, 2, 1072–1085. [Google Scholar] [CrossRef] [PubMed]
  7. Pinck, S.; Ostormujof, L.M.; Teychené, S.; Erable, B. Microfluidic Microbial Bioelectrochemical Systems: An Integrated Investigation Platform for a More Fundamental Understanding of Electroactive Bacterial Biofilms. Microorganisms 2020, 8, 1841. [Google Scholar] [CrossRef] [PubMed]
  8. Greenman, J.; Gajda, I.; You, J.; Mendis, B.A.; Obata, O.; Pasternak, G.; Ieropoulos, I. Microbial Fuel Cells and Their Electrified Biofilms. Biofilm 2021, 3, 100057. [Google Scholar] [CrossRef] [PubMed]
  9. Lyon, D.Y.; Buret, F.; Vogel, T.M.; Monier, J.M. Is Resistance Futile? Changing External Resistance Does Not Improve Microbial Fuel Cell Performance. Bioelectrochemistry 2010, 78, 2–7. [Google Scholar] [CrossRef]
  10. Rismani-Yazdi, H.; Christy, A.D.; Carver, S.M.; Yu, Z.; Dehority, B.A.; Tuovinen, O.H. Effect of External Resistance on Bacterial Diversity and Metabolism in Cellulose-Fed Microbial Fuel Cells. Bioresour. Technol. 2011, 102, 278–283. [Google Scholar] [CrossRef]
  11. Jung, S.; Regan, J.M. Influence of External Resistance on Electrogenesis, Methanogenesis, and Anode Prokaryotic Communities in Microbial Fuel Cells. Appl. Environ. Microbiol. 2011, 77, 564–571. [Google Scholar] [CrossRef] [PubMed] [Green Version]
  12. Koók, L.; Nemestóthy, N.; Bélafi-Bakó, K.; Bakonyi, P. Investigating the Specific Role of External Load on the Performance versus Stability Trade-off in Microbial Fuel Cells. Bioresour. Technol. 2020, 309, 123313. [Google Scholar] [CrossRef] [PubMed]
  13. Katuri, K.P.; Scott, K.; Head, I.M.; Picioreanu, C.; Curtis, T.P. Microbial Fuel Cells Meet with External Resistance. Bioresour. Technol. 2011, 102, 2758–2766. [Google Scholar] [CrossRef] [PubMed]
  14. Pinto, R.P.; Srinivasan, B.; Uiot, S.R.; Tartakovsky, B. The Effect of Real-Time External Resistance Optimization on Microbial Fuel Cell Performance. Water Res. 2011, 45, 1571–1578. [Google Scholar] [CrossRef] [PubMed] [Green Version]
  15. Zhang, L.; Zhu, X.; Li, J.; Liao, Q.; Ye, D. Biofilm Formation and Electricity Generation of a Microbial Fuel Cell Started up under Different External Resistances. J. Power Sources 2011, 196, 6029–6035. [Google Scholar] [CrossRef]
  16. Vilajeliu-Pons, A.; Bañeras, L.; Puig, S.; Molognoni, D.; Vilà-Rovira, A.; Del Amo, E.H.; Balaguer, M.D.; Colprim, J. External Resistances Applied to MFC Affect Core Microbiome and Swine Manure Treatment Efficiencies. PLoS ONE 2016, 11, e0164044. [Google Scholar] [CrossRef] [PubMed]
  17. Kamau, J.M.; Mbui, D.N.; Mwaniki, J.M.; Mwaura, F.B.; Kamau, G.N. Microbial Fuel Cells: Influence of External Resistors on Power, Current and Power Density. J. Thermodyn. Catal. 2017, 8, 1–5. [Google Scholar] [CrossRef] [Green Version]
  18. Rossi, R.; Logan, B.E. Impact of External Resistance Acclimation on Charge Transfer and Diffusion Resistance in Bench-Scale Microbial Fuel Cells. Bioresour. Technol. 2020, 318, 123921. [Google Scholar] [CrossRef]
  19. Paitier, A.; Godain, A.; Lyon, D.; Haddour, N.; Vogel, T.M.; Monier, J.M. Microbial Fuel Cell Anodic Microbial Population Dynamics during MFC Start-Up. Biosens. Bioelectron. 2017, 92, 357–363. [Google Scholar] [CrossRef]
  20. Hodgson, D.M.; Smith, A.; Dahale, S.; Stratford, J.P.; Li, J.V.; Grüning, A.; Bushell, M.E.; Marchesi, J.R.; Avignone Rossa, C. Segregation of the Anodic Microbial Communities in a Microbial Fuel Cell Cascade. Front. Microbiol. 2016, 7, 1–11. [Google Scholar] [CrossRef] [Green Version]
  21. Pasternak, G.; Greenman, J.; Ieropoulos, I. Dynamic Evolution of Anodic Biofilm When Maturing under Different External Resistive Loads in Microbial Fuel Cells. Electrochemical Perspective. J. Power Sources 2018, 400, 392–401. [Google Scholar] [CrossRef] [PubMed]
  22. Freguia, S.; Rabaey, K.; Yuan, Z.; Keller, J. Electron and Carbon Balances in Microbial Fuel Cells Reveal Temporary Bacterial Storage Behavior during Electricity Generation. Environ. Sci. Technol. 2007, 41, 2915–2921. [Google Scholar] [CrossRef] [PubMed]
  23. Aelterman, P.; Versichele, M.; Marzorati, M.; Boon, N.; Verstraete, W. Loading Rate and External Resistance Control the Electricity Generation of Microbial Fuel Cells with Different Three-Dimensional Anodes. Bioresour. Technol. 2008, 99, 8895–8902. [Google Scholar] [CrossRef] [PubMed]
  24. Roy, J.N.; Babanova, S.; Garcia, K.E.; Cornejo, J.; Ista, L.K.; Atanassov, P. Electrochimica Acta Catalytic Biofilm Formation by Shewanella Oneidensis MR-1 and Anode Characterization by Expanded Uncertainty. Electrochim. Acta 2014, 126, 3–10. [Google Scholar] [CrossRef]
  25. Oziat, J.; Cohu, T.; Elsen, S.; Gougis, M.; Malliaras, G.G.; Mailley, P. Electrochemical Detection of Redox Molecules Secreted by Pseudomonas Aeruginosa—Part 1: Electrochemical Signatures of Different Strains. Bioelectrochemistry 2021, 140, 107747. [Google Scholar] [CrossRef]
  26. Xiao, Y.; Zheng, Y.; Wu, S.; Zhang, E.H.; Chen, Z.; Liang, P.; Huang, X.; Yang, Z.H.; Ng, I.S.; Chen, B.Y.; et al. Pyrosequencing Reveals a Core Community of Anodic Bacterial Biofilms in Bioelectrochemical Systems from China. Front. Microbiol. 2015, 6, 1410. [Google Scholar] [CrossRef] [Green Version]
  27. Pinto, D.; Coradin, T.; Laberty-Robert, C. Effect of Anode Polarization on Biofilm Formation and Electron Transfer in Shewanella Oneidensis/Graphite Felt Microbial Fuel Cells. Bioelectrochemistry 2018, 120, 1–9. [Google Scholar] [CrossRef] [Green Version]
  28. Jung, S. Impedance Analysis of Geobacter Sulfurreducens PCA, Shewanella Oneidensis MR-1, and Their Coculture in Bioeletrochemical Systems. Int. J. Electrochem. Sci. 2012, 7, 11091–11100. [Google Scholar]
  29. Wang, Q.; Garrity, G.M.; Tiedje, J.M.; Cole, J.R.; Al, W.E.T. Naïve Bayesian Classifier for Rapid Assignment of RRNA Sequences into the New Bacterial Taxonomy. Appl. Environ. Microbiol. 2007, 73, 5261–5267. [Google Scholar] [CrossRef] [Green Version]
  30. Cole, J.R.; Wang, Q.; Fish, J.A.; Chai, B.; Mcgarrell, D.M.; Sun, Y.; Brown, C.T.; Porras-alfaro, A.; Kuske, C.R.; Tiedje, J.M. Ribosomal Database Project: Data and Tools for High Throughput RRNA Analysis. Nucleic Acids Res. 2014, 42, 633–642. [Google Scholar] [CrossRef] [Green Version]
  31. Kiely, P.D.; Call, D.F.; Yates, M.D.; Regan, J.M.; Logan, B.E. Anodic Biofilms in Microbial Fuel Cells Harbor Low Numbers of Higher-Power-Producing Bacteria than Abundant Genera. Appl. Microbiol. Biotechnol. 2010, 88, 371–380. [Google Scholar] [CrossRef] [PubMed]
  32. Sun, Y.; Wei, J.; Liang, P.; Huang, X. Bioresource Technology Electricity Generation and Microbial Community Changes in Microbial Fuel Cells Packed with Different Anodic Materials. Bioresour. Technol. 2011, 102, 10886–10891. [Google Scholar] [CrossRef] [PubMed]
  33. Pham, T.H.; Boon, N.; Maeyer, K. De Use of Pseudomonas Species Producing Phenazine-Based Metabolites in the Anodes of Microbial Fuel Cells to Improve Electricity Generation. Appl. Microbiol. Biotechnol. 2008, 80, 985–993. [Google Scholar] [CrossRef] [PubMed]
  34. Freguia, S.; Tsujimura, S.; Kano, K. Electrochimica Acta Electron Transfer Pathways in Microbial Oxygen Biocathodes. Electrochim. Acta 2010, 55, 813–818. [Google Scholar] [CrossRef]
  35. Kievit, T.R. De Minireview Quorum Sensing in Pseudomonas Aeruginosa Biofilms. Environ. Microbiol. 2009, 11, 279–288. [Google Scholar] [CrossRef]
  36. Dietrich, L.E.P.; Price-whelan, A.; Petersen, A.; Whiteley, M.; Newman, D.K. The Phenazine Pyocyanin Is a Terminal Signalling Factor in the Quorum Sensing Network of Pseudomonas Aeruginosa. Mol. Microbiol. 2006, 61, 1308–1321. [Google Scholar] [CrossRef]
  37. Chen, S.; Jing, X.; Tang, J.; Fang, Y.; Zhou, S. Biosensors and Bioelectronics Quorum Sensing Signals Enhance the Electrochemical Activity and Energy Recovery of Mixed-Culture Electroactive Biofilms. Biosens. Bioelectron. 2017, 97, 369–376. [Google Scholar] [CrossRef]
  38. Cheng, S.; Liu, H.; Logan, B.E. Increased Performance of Single-Chamber Microbial Fuel Cells Using an Improved Cathode Structure. Electrochem. Commun. 2006, 8, 489–494. [Google Scholar] [CrossRef]
  39. Kang, H.; Jeong, J.; Gupta, P.L.; Jung, S.P. Effects of Brush-Anode Configurations on Performance and Electrochemistry of Microbial Fuel Cells. Int. J. Hydrogen Energy 2017, 42, 27693–27700. [Google Scholar] [CrossRef]
  40. Kang, H.; Kim, E.; Jung, S.P. Influence of Flowrates to a Reverse Electro-Dialysis (RED) Stack on Performance and Electrochemistry of a Microbial Reverse Electrodialysis Cell (MRC). Int. J. Hydrogen Energy 2017, 42, 27685–27692. [Google Scholar] [CrossRef]
  41. Nam, T.; Son, S.; Koo, B.; Hoa Tran, H.V.; Kim, J.R.; Choi, Y.; Jung, S.P. Comparative Evaluation of Performance and Electrochemistry of Microbial Fuel Cells with Different Anode Structures and Materials. Int. J. Hydrogen Energy 2017, 42, 27677–27684. [Google Scholar] [CrossRef]
Figure 1. (A) Voltage outputs of MFCs as a function of time with different Rext: 1000 ohms (purple), 330 ohms (yellow), 0 ohms (green) and an infinite resistance (electrode is disconnected) (gray). (B) Current density as a function of time, calculated by the equation I = U/R. The resistances for MFC-0-a and b were considered of 2 ohms (the cable resistance).
Catalysts 12 00176 g001
Figure 2. Surface coverage percentage of the anode as a function of time for live bacteria (green), dead bacteria (red) and total biofilm coverage (black). Points represent the mean at each time of (A) the four MFCs for the experiment (a) and (B) the four for experiment (b). Error bars represent the standard deviation.
Catalysts 12 00176 g002
Figure 3. (A) Maximal power density of the experiment (a) as a function of time. (B) Maximal power density of the experiment (b) in function of the time. (C) Maximal power density mean of the experiments (a) and (b). (D) Current density means of the experiments (a) and (b) corresponding to the maximal power.
Catalysts 12 00176 g003
Figure 4. (A) Cyclic voltammetry at 10 mV·s−1 of MFC anodes (A) on the 2nd day and (B) on the 15th day of the experiments (a) and (b).
Catalysts 12 00176 g004
Figure 5. Relative abundance of specific EAB and nonspecific EAB as a function of time for anodic biofilms (A) and liquid medium (B). The points represent the means of samples from the experiments (a) and (b). The error bars represent the standard errors of samples from the experiments (a) and (b).
Catalysts 12 00176 g005
Figure 6. Schematic representation of two steps of competition between nonspecific and specific EAB during anodic biofilm formation.
Catalysts 12 00176 g006
Table 1. Relative abundance of specific EAB, Genus number and Shannon index, obtained from anodic biofilm samples of MFCs after two weeks of operation.
MFCRelative Abundance of Specific EAB (%)Genus NumberShannon Index
MFC-051 ± 17123 ± 82.09 ± 0.40
MFC-33039 ± 5127 ± 92.54 ± 0.12
MFC-100030 ± 7138 ± 172.76 ± 0.40
MFC-inf9 ± 6163 ± 133.20 ± 0.23
Publisher’s Note: MDPI stays neutral with regard to jurisdictional claims in published maps and institutional affiliations.

