

Characterization and Syngas Production at Low Temperature via Dry Reforming of Methane over Ni-M (M = Fe, Cr) Catalysts Tailored from LDH Structure
 , and
, and
Abstract
:
1. Introduction
2. Results
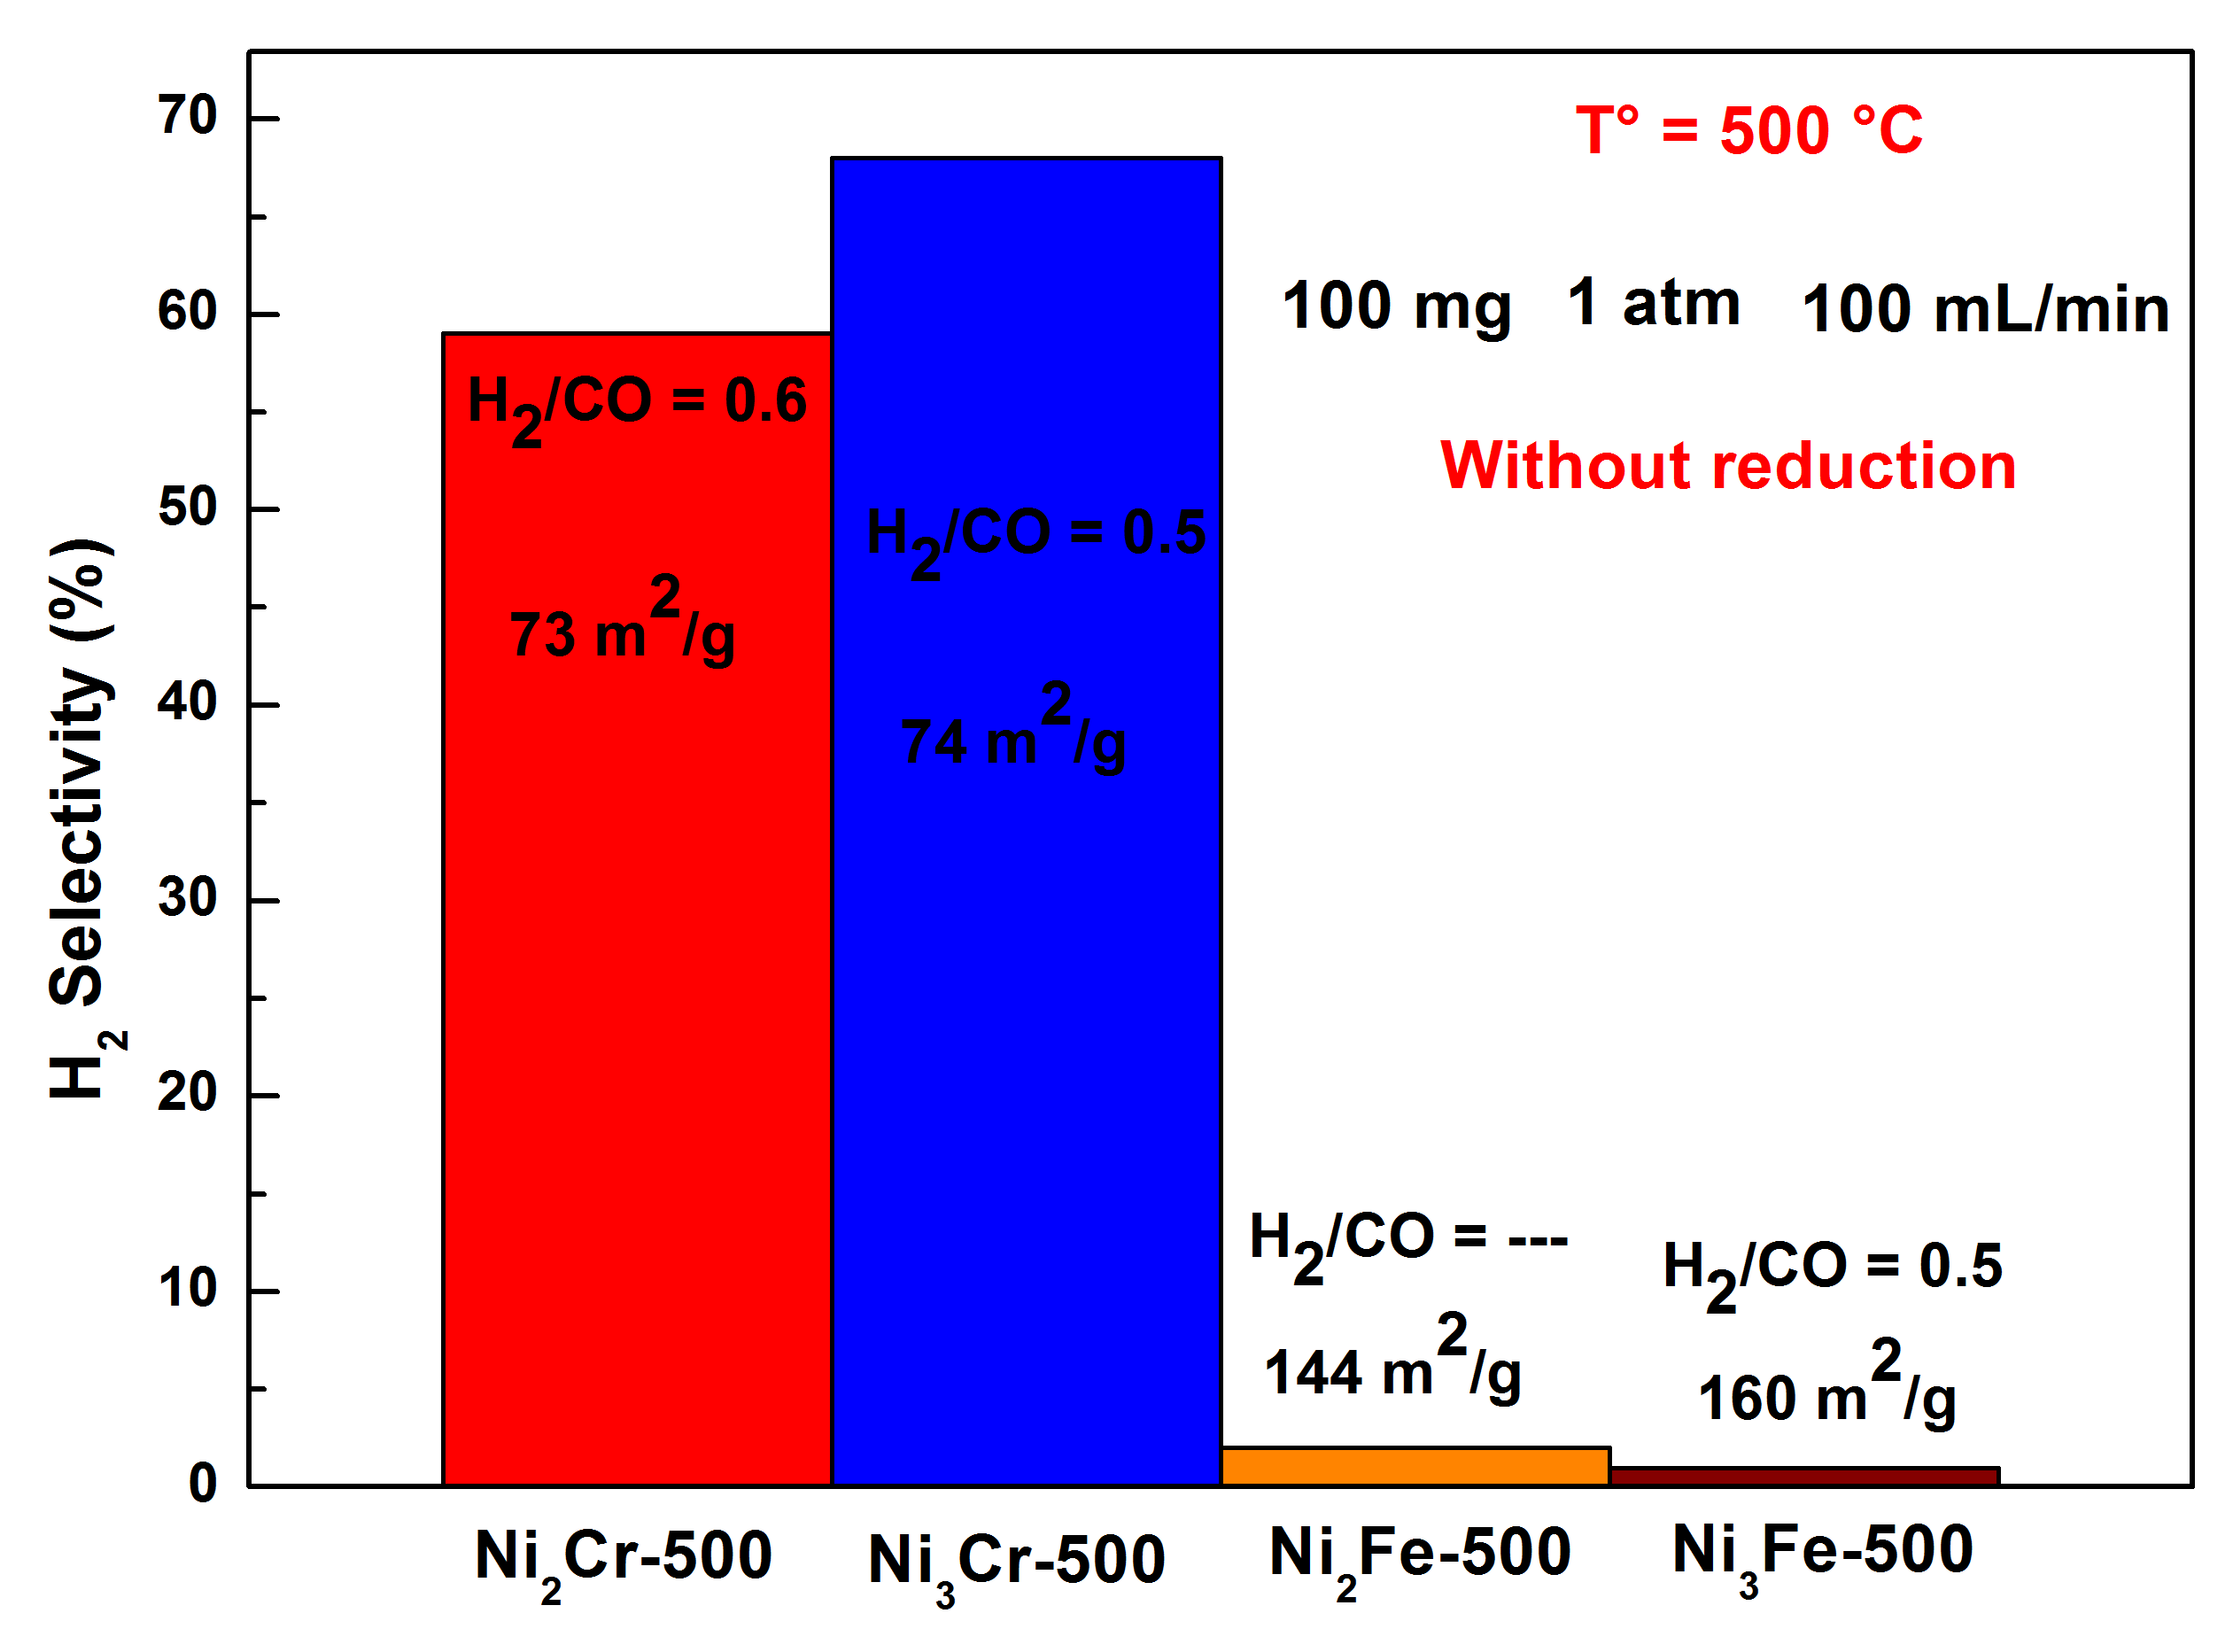
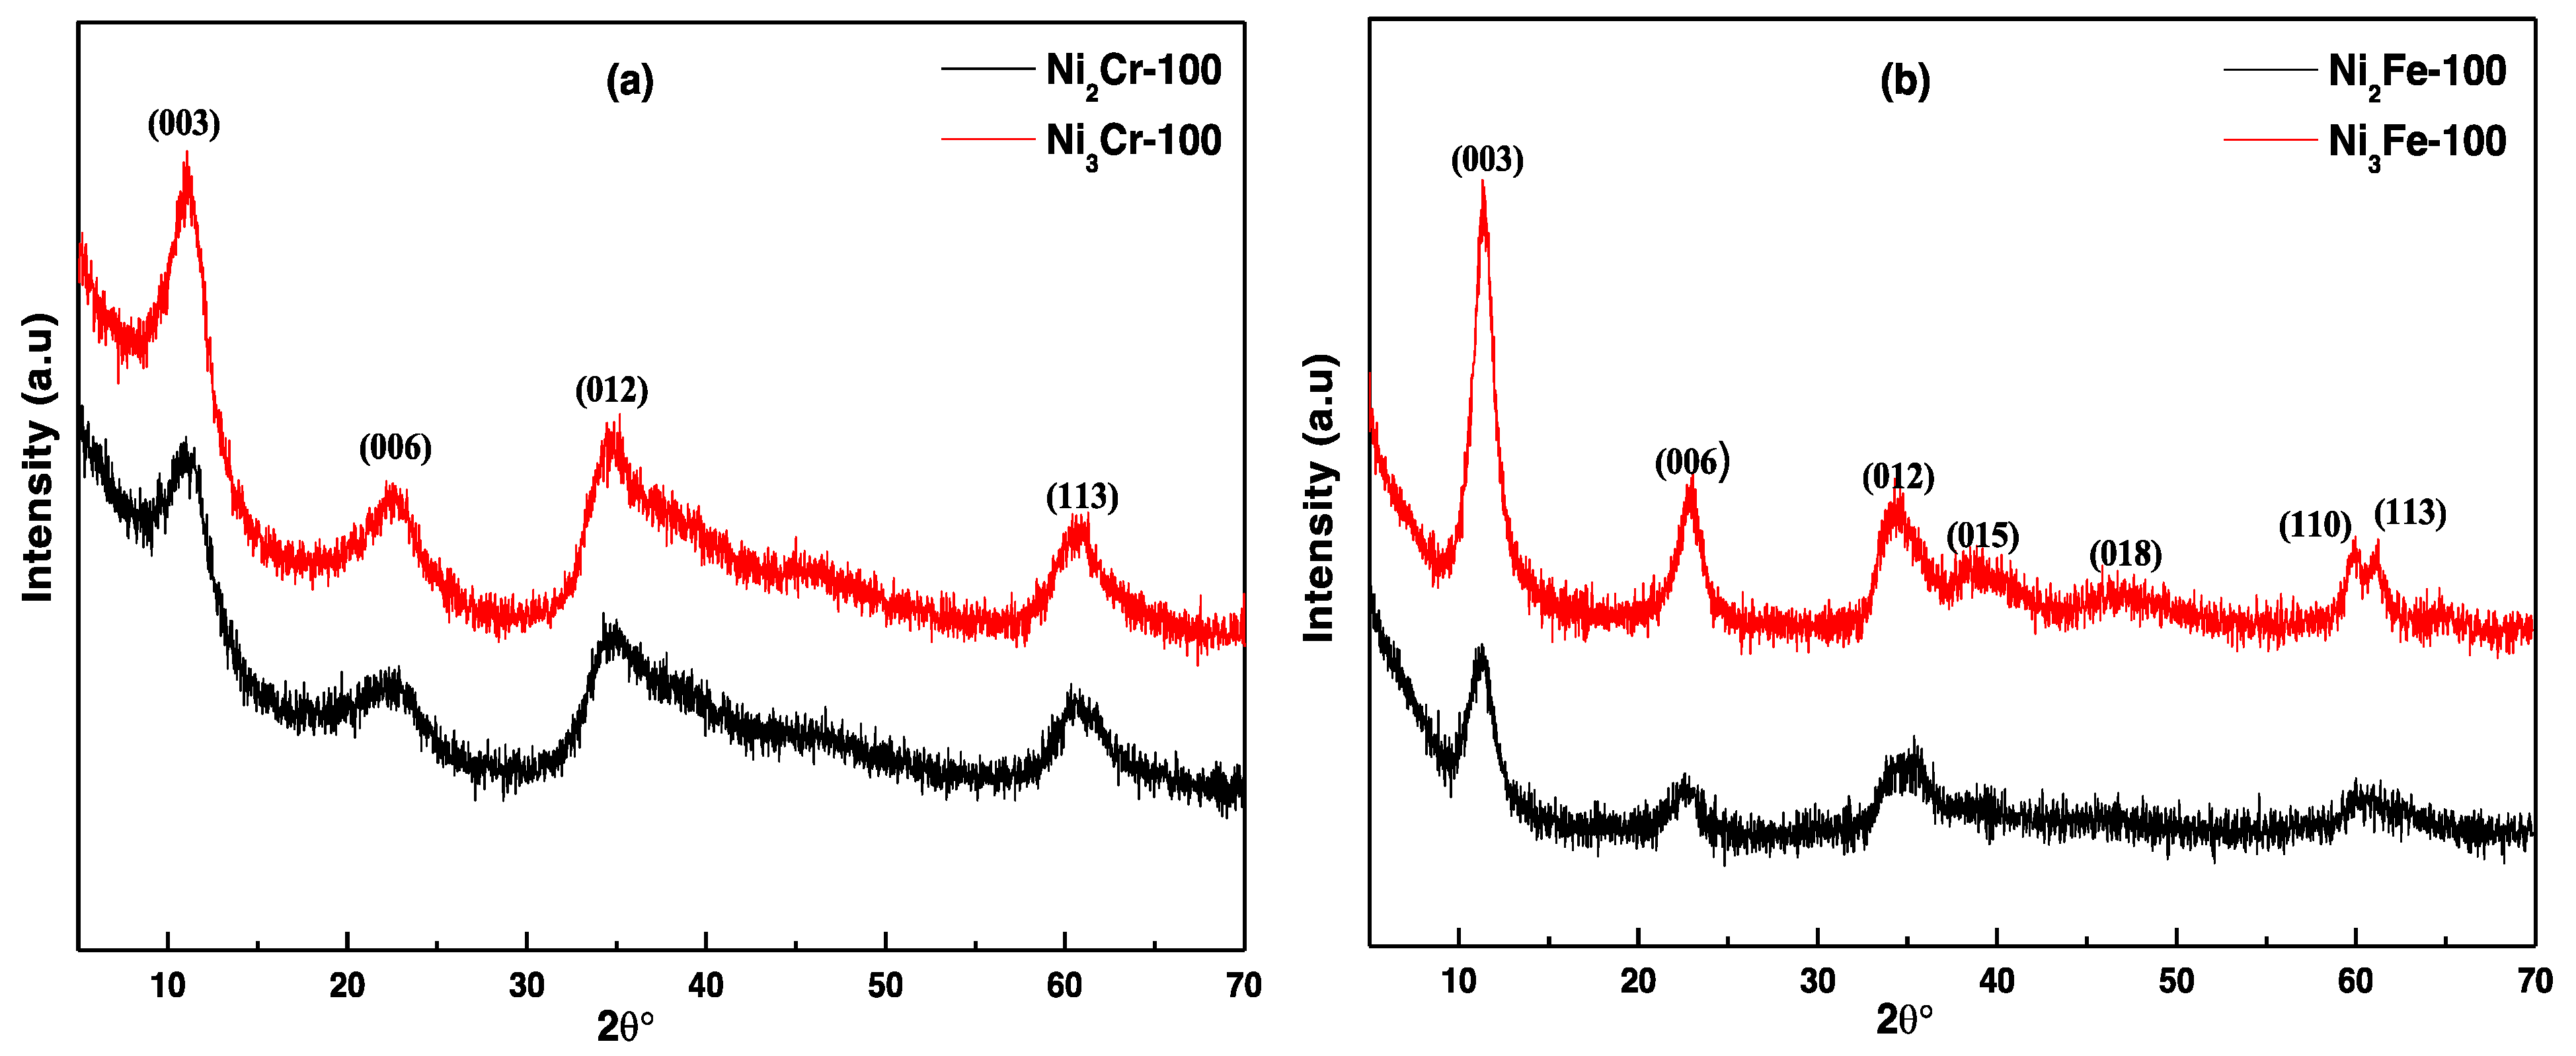
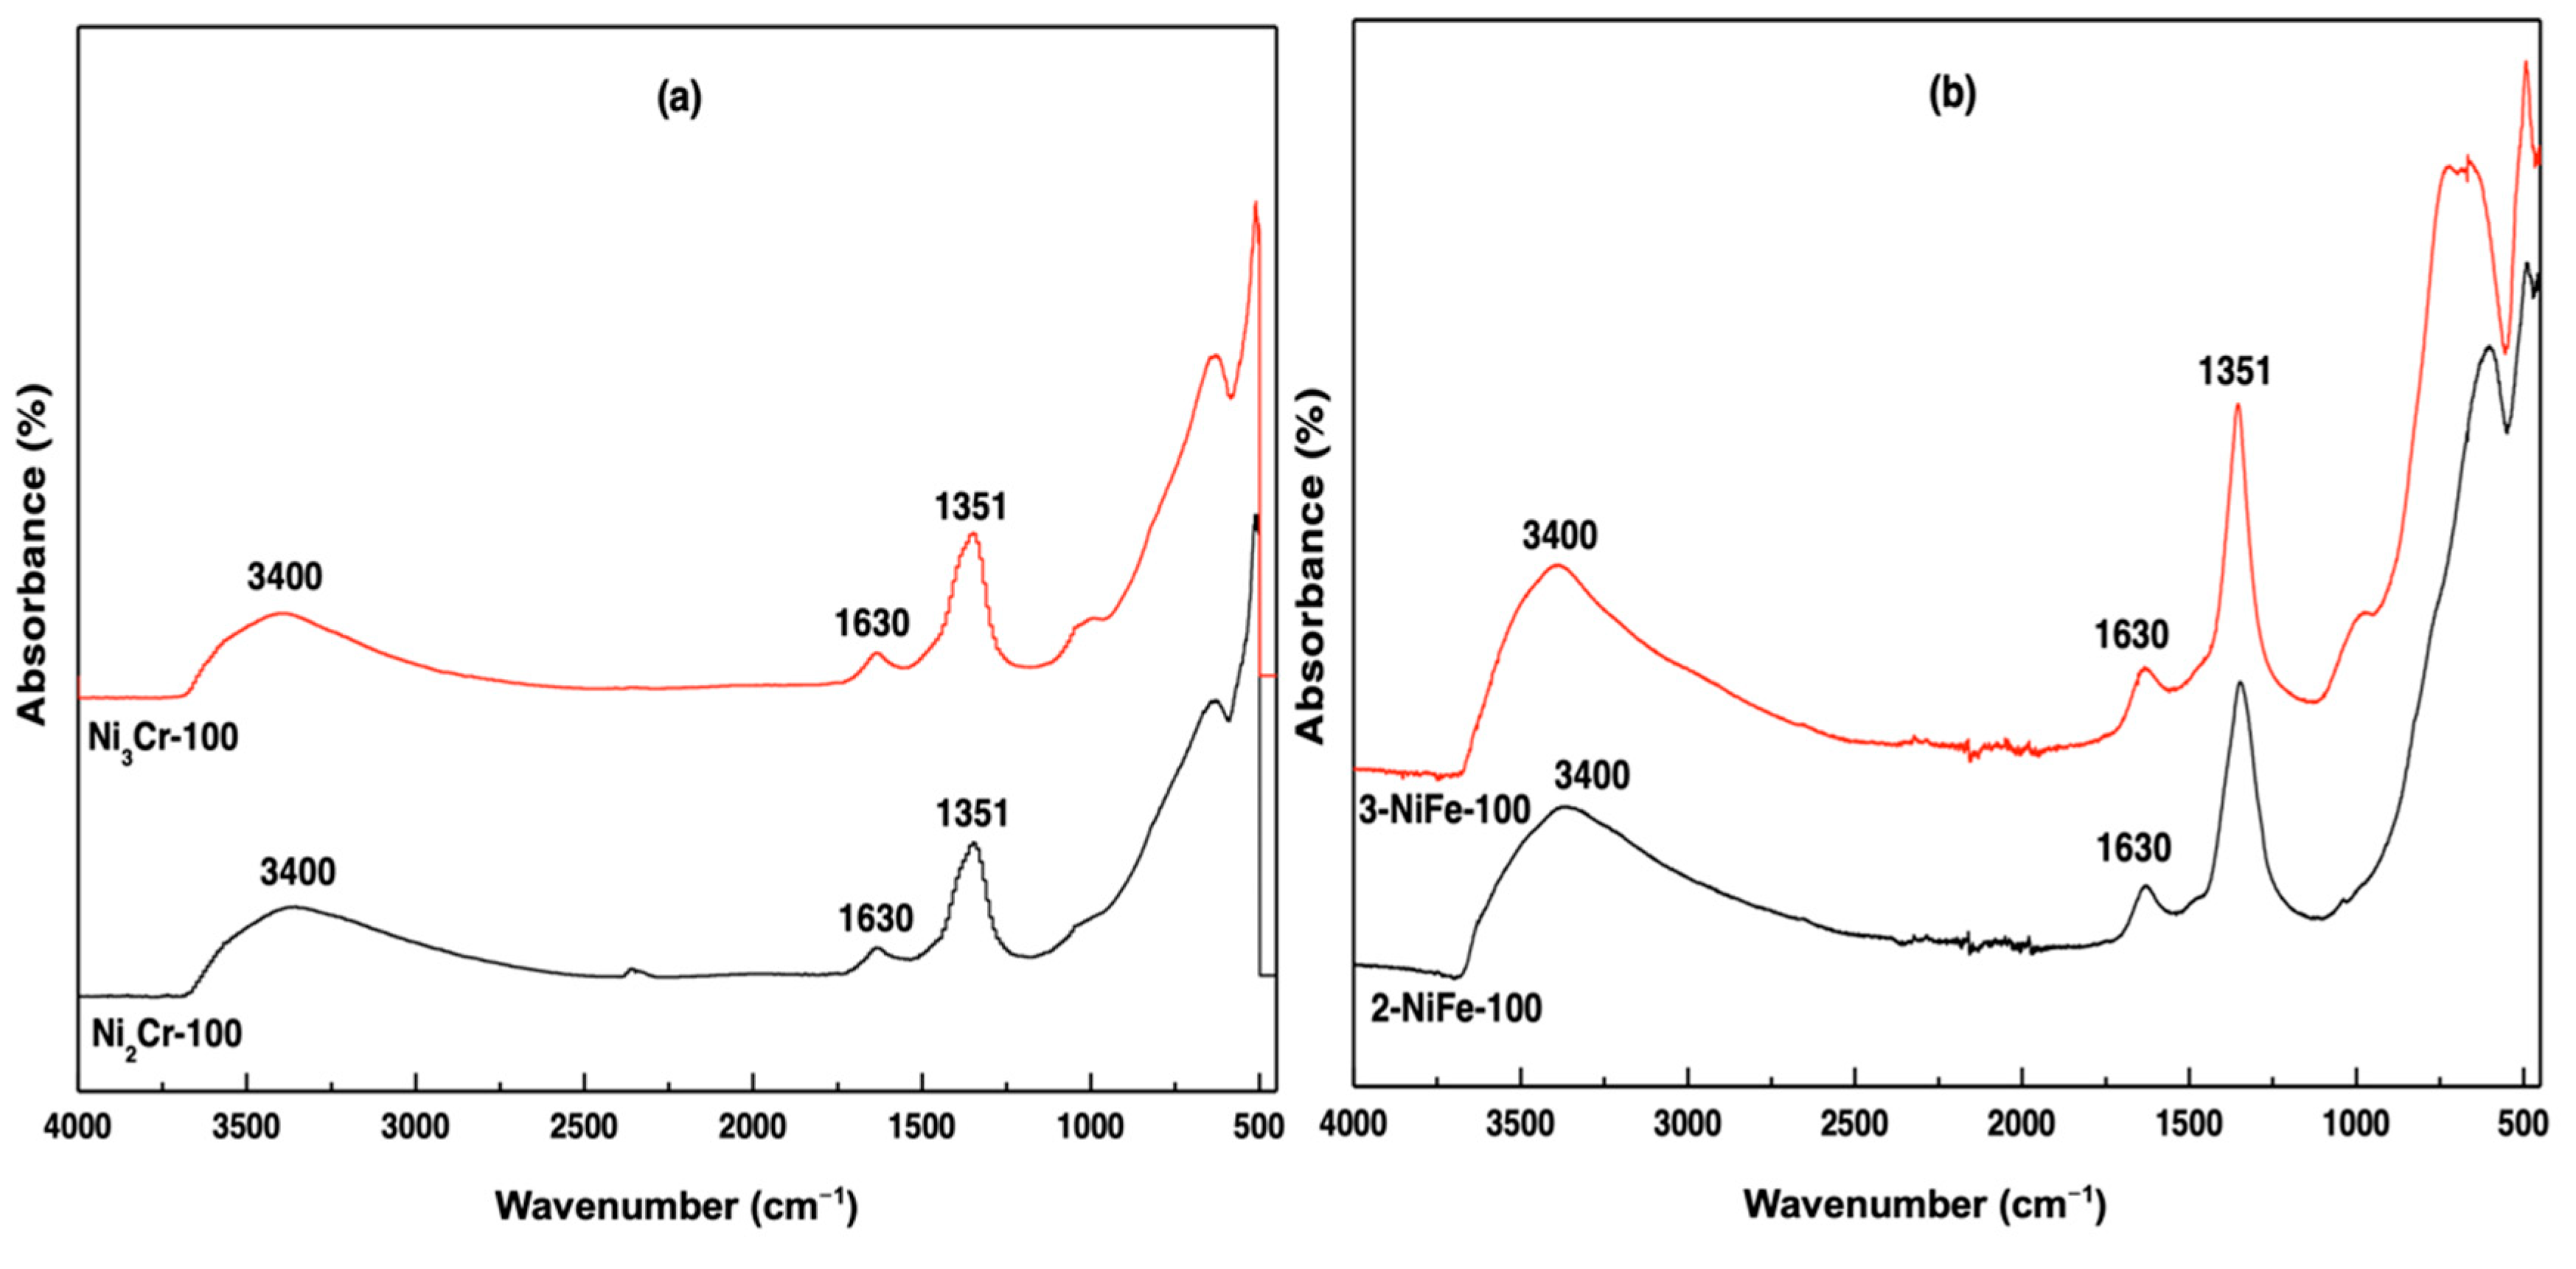
2.1. Structural Characterization (XRD, Raman, and FTIR) of LDH Precursors
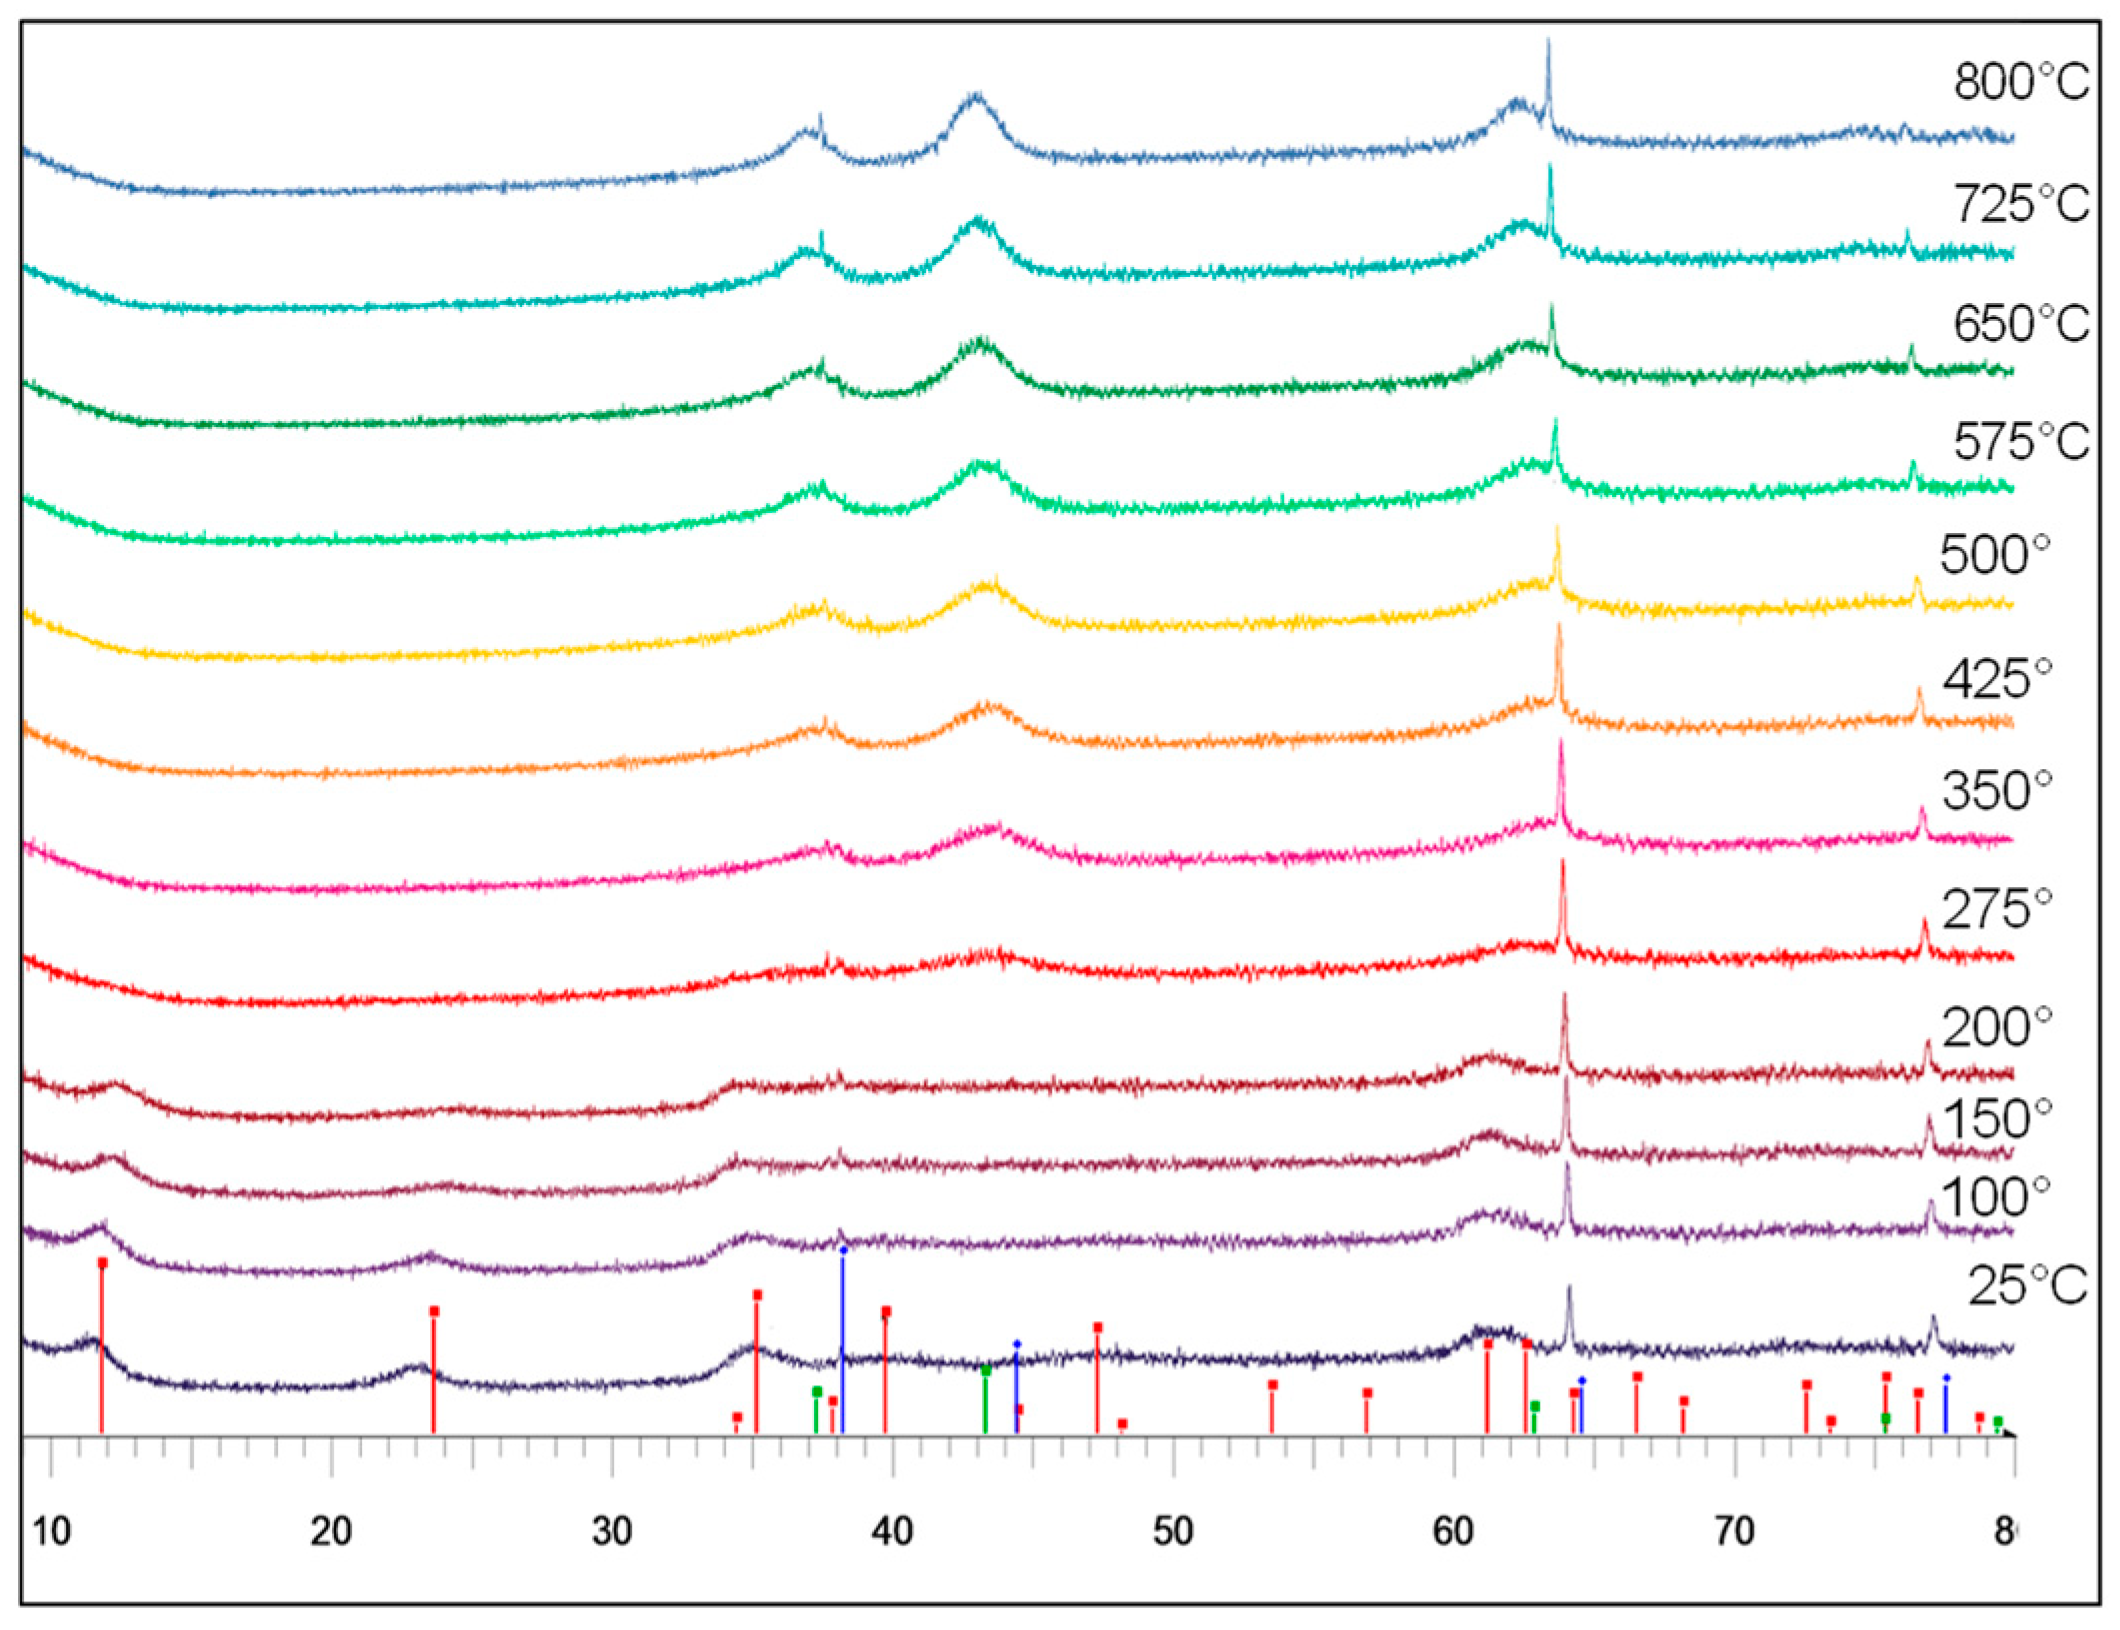
2.2. Thermal Decomposition (HT-XRD and TG-DTA) of LDH Precursors
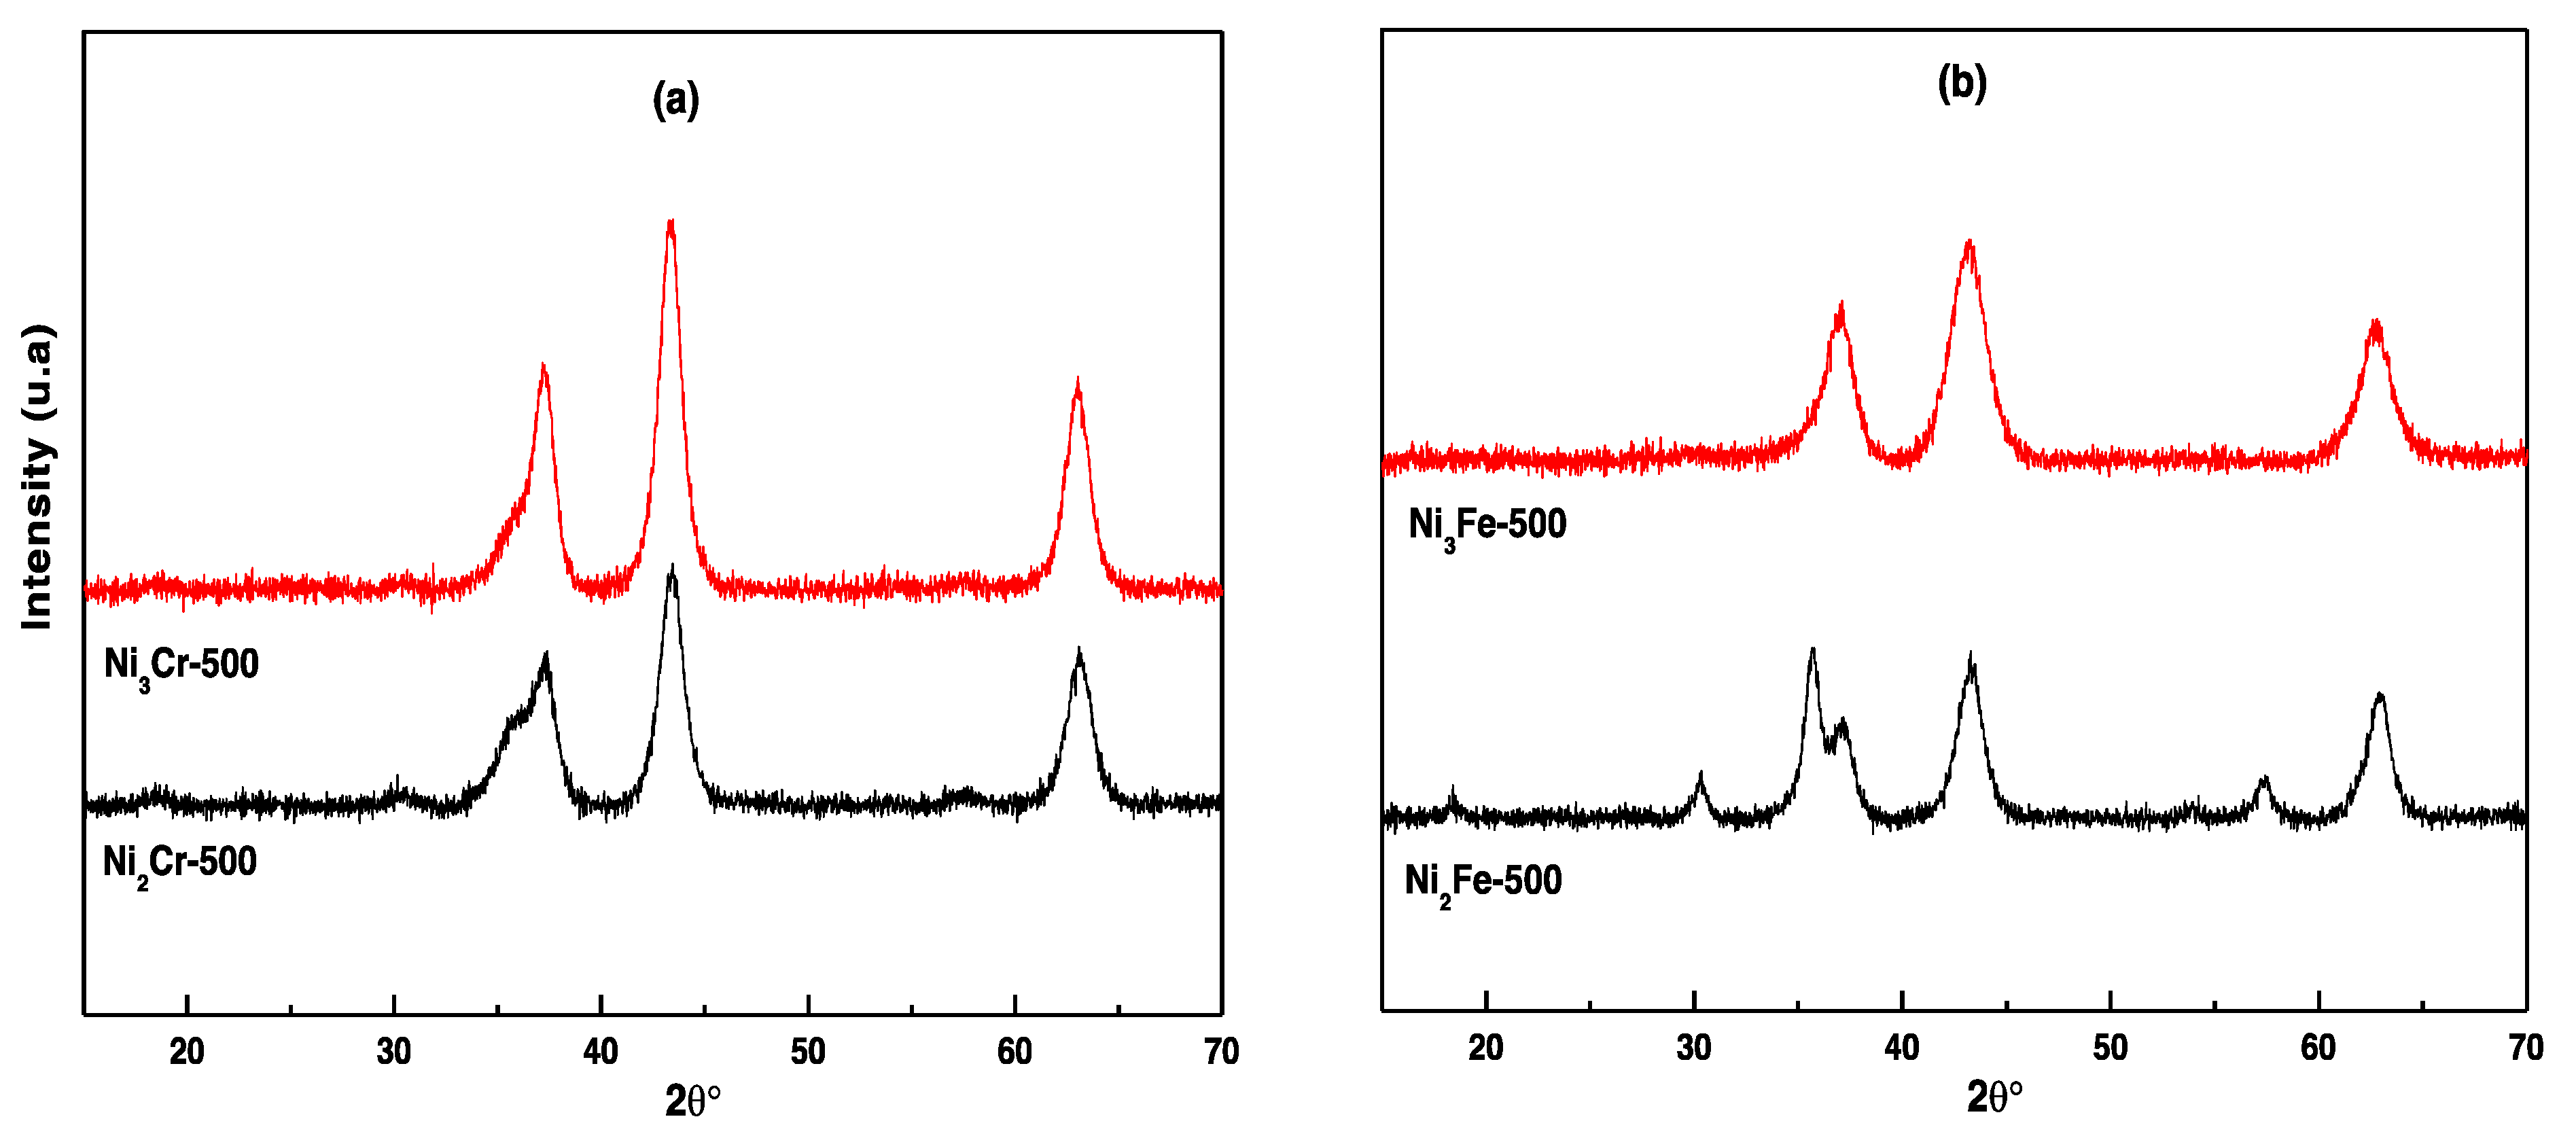
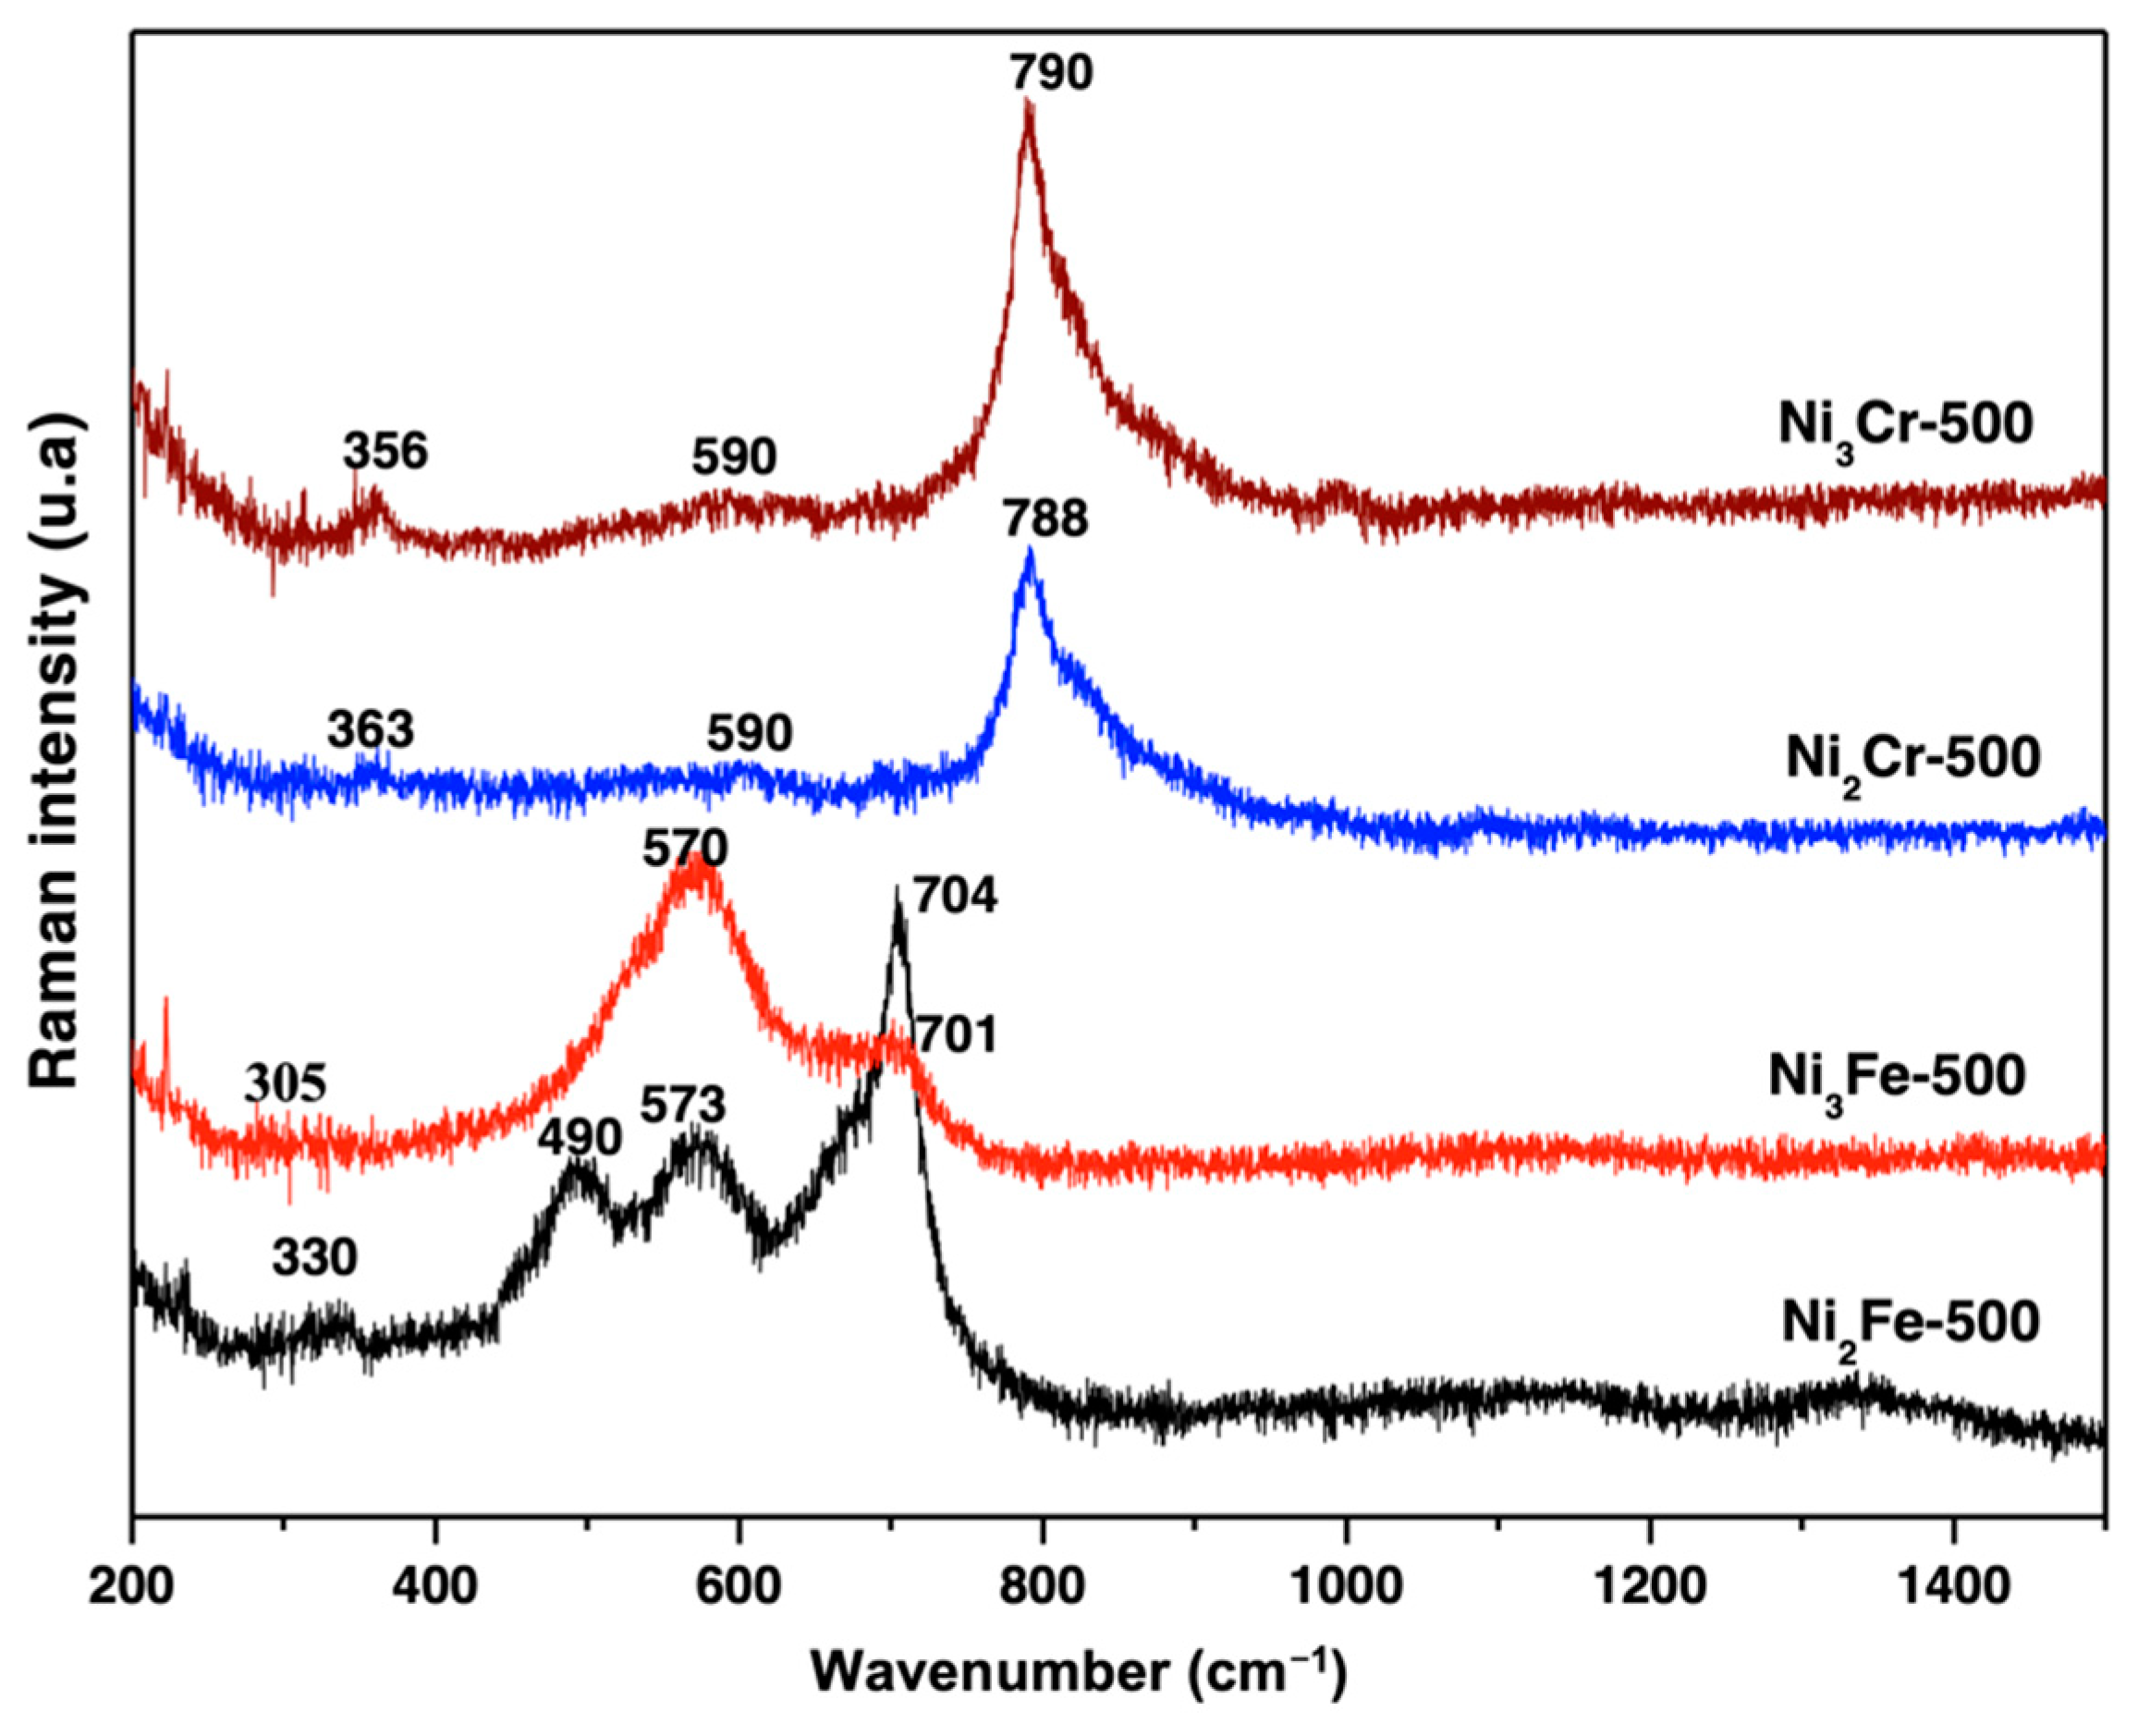
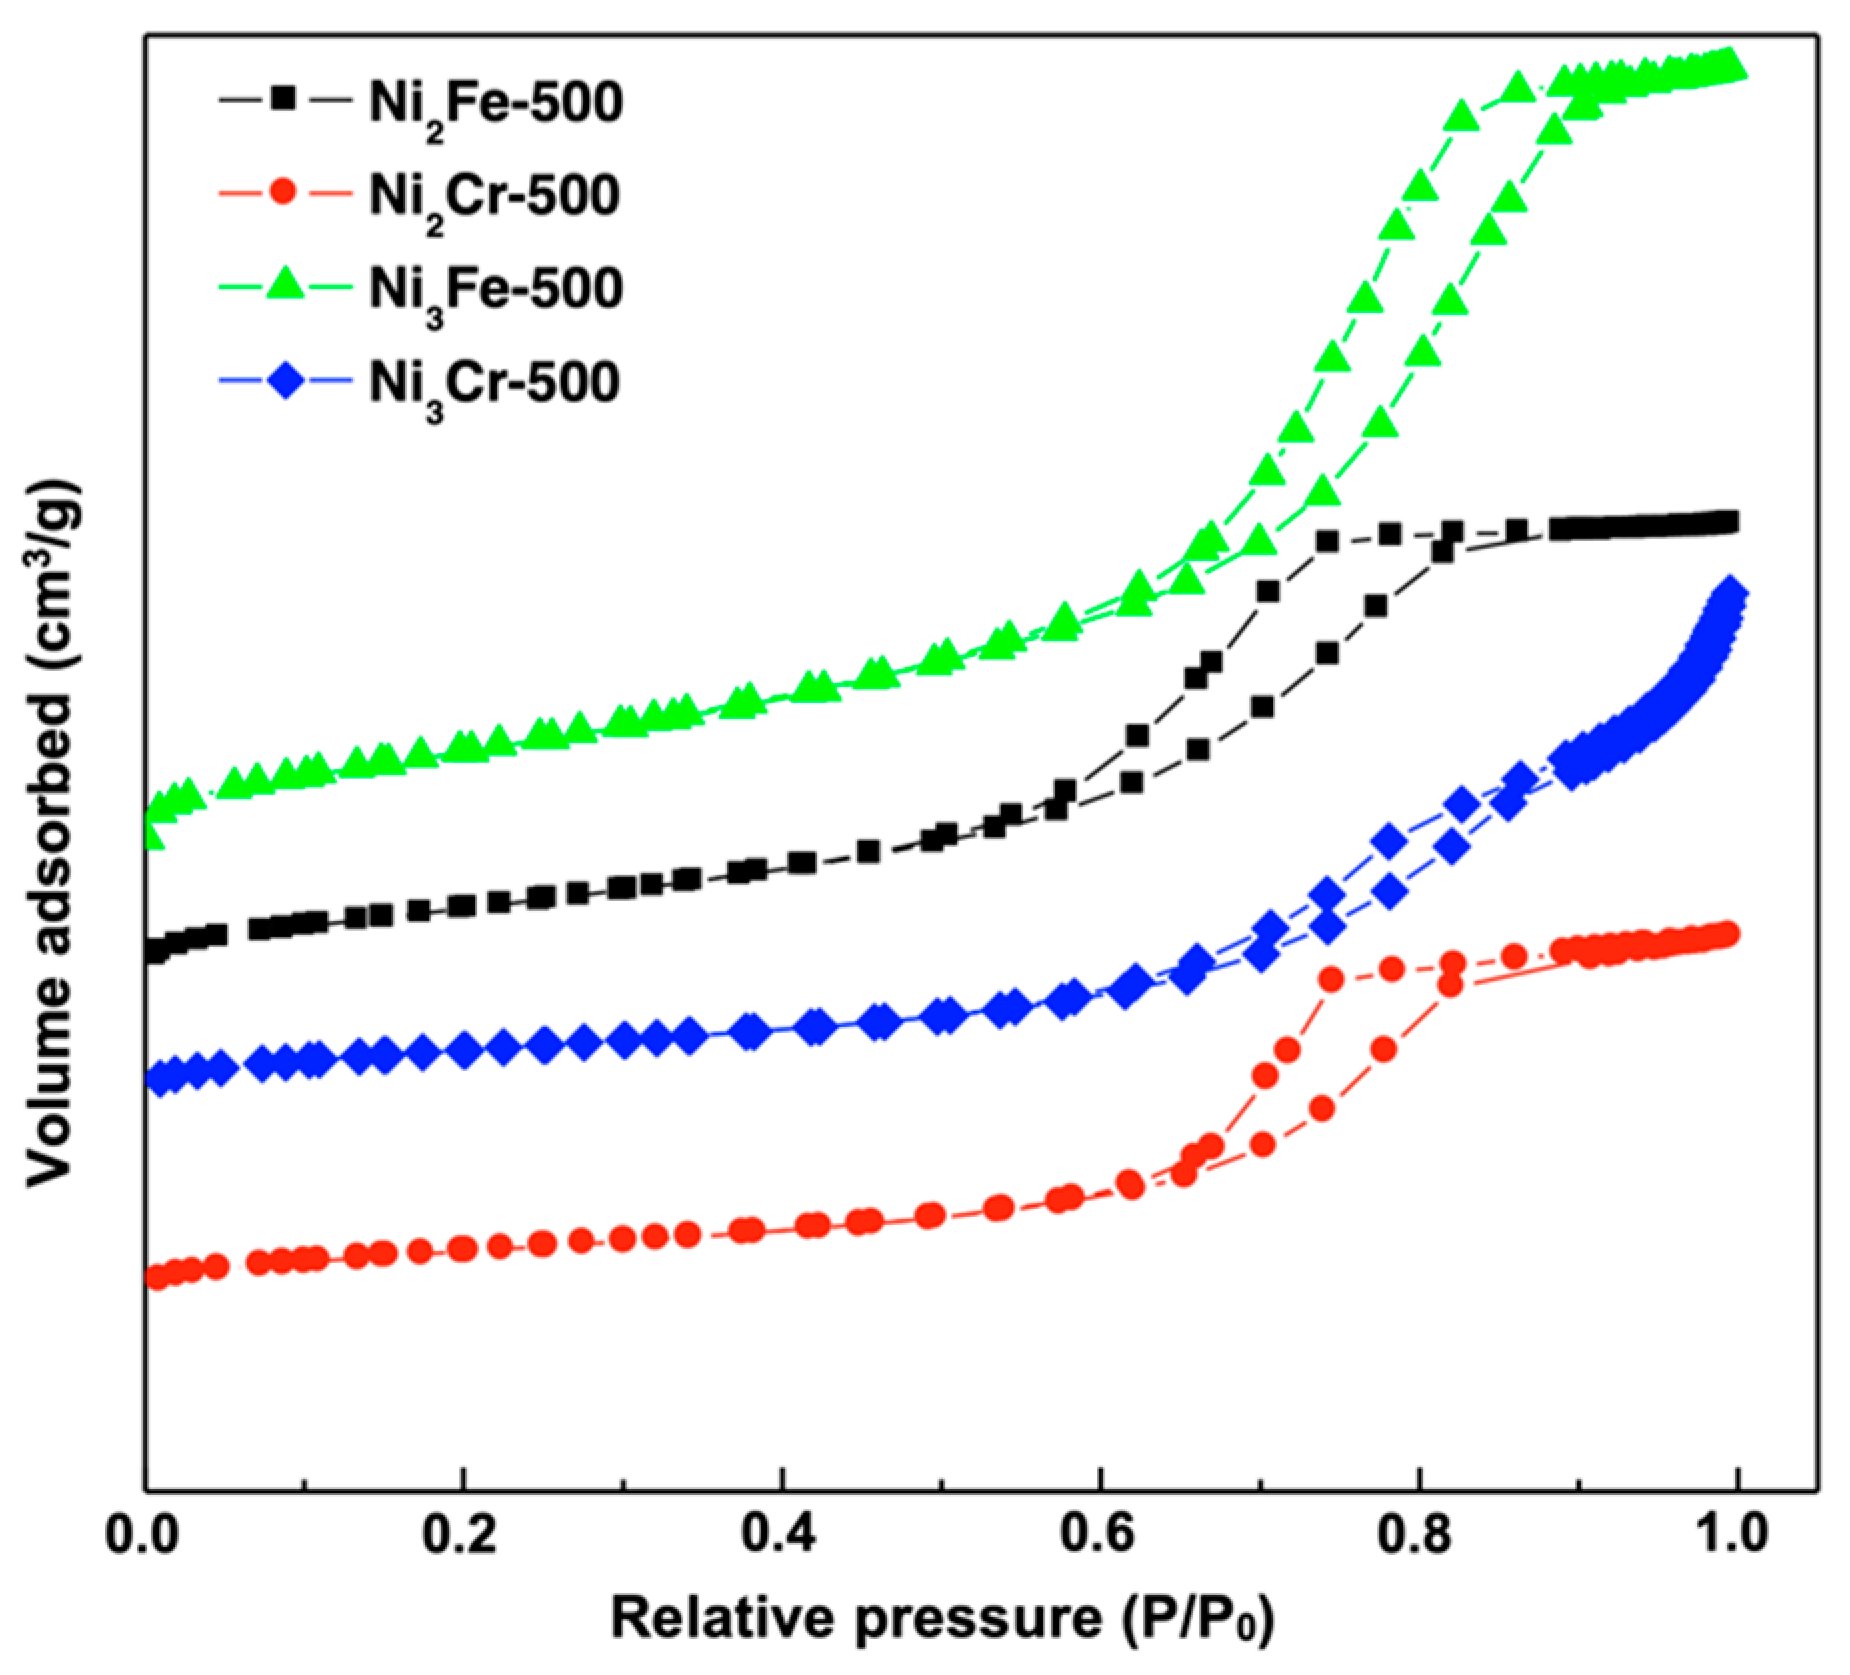
2.3. Characterization (XRD, Raman, BET, XPS, and H2-TPR) of Mixed Oxide Catalysts
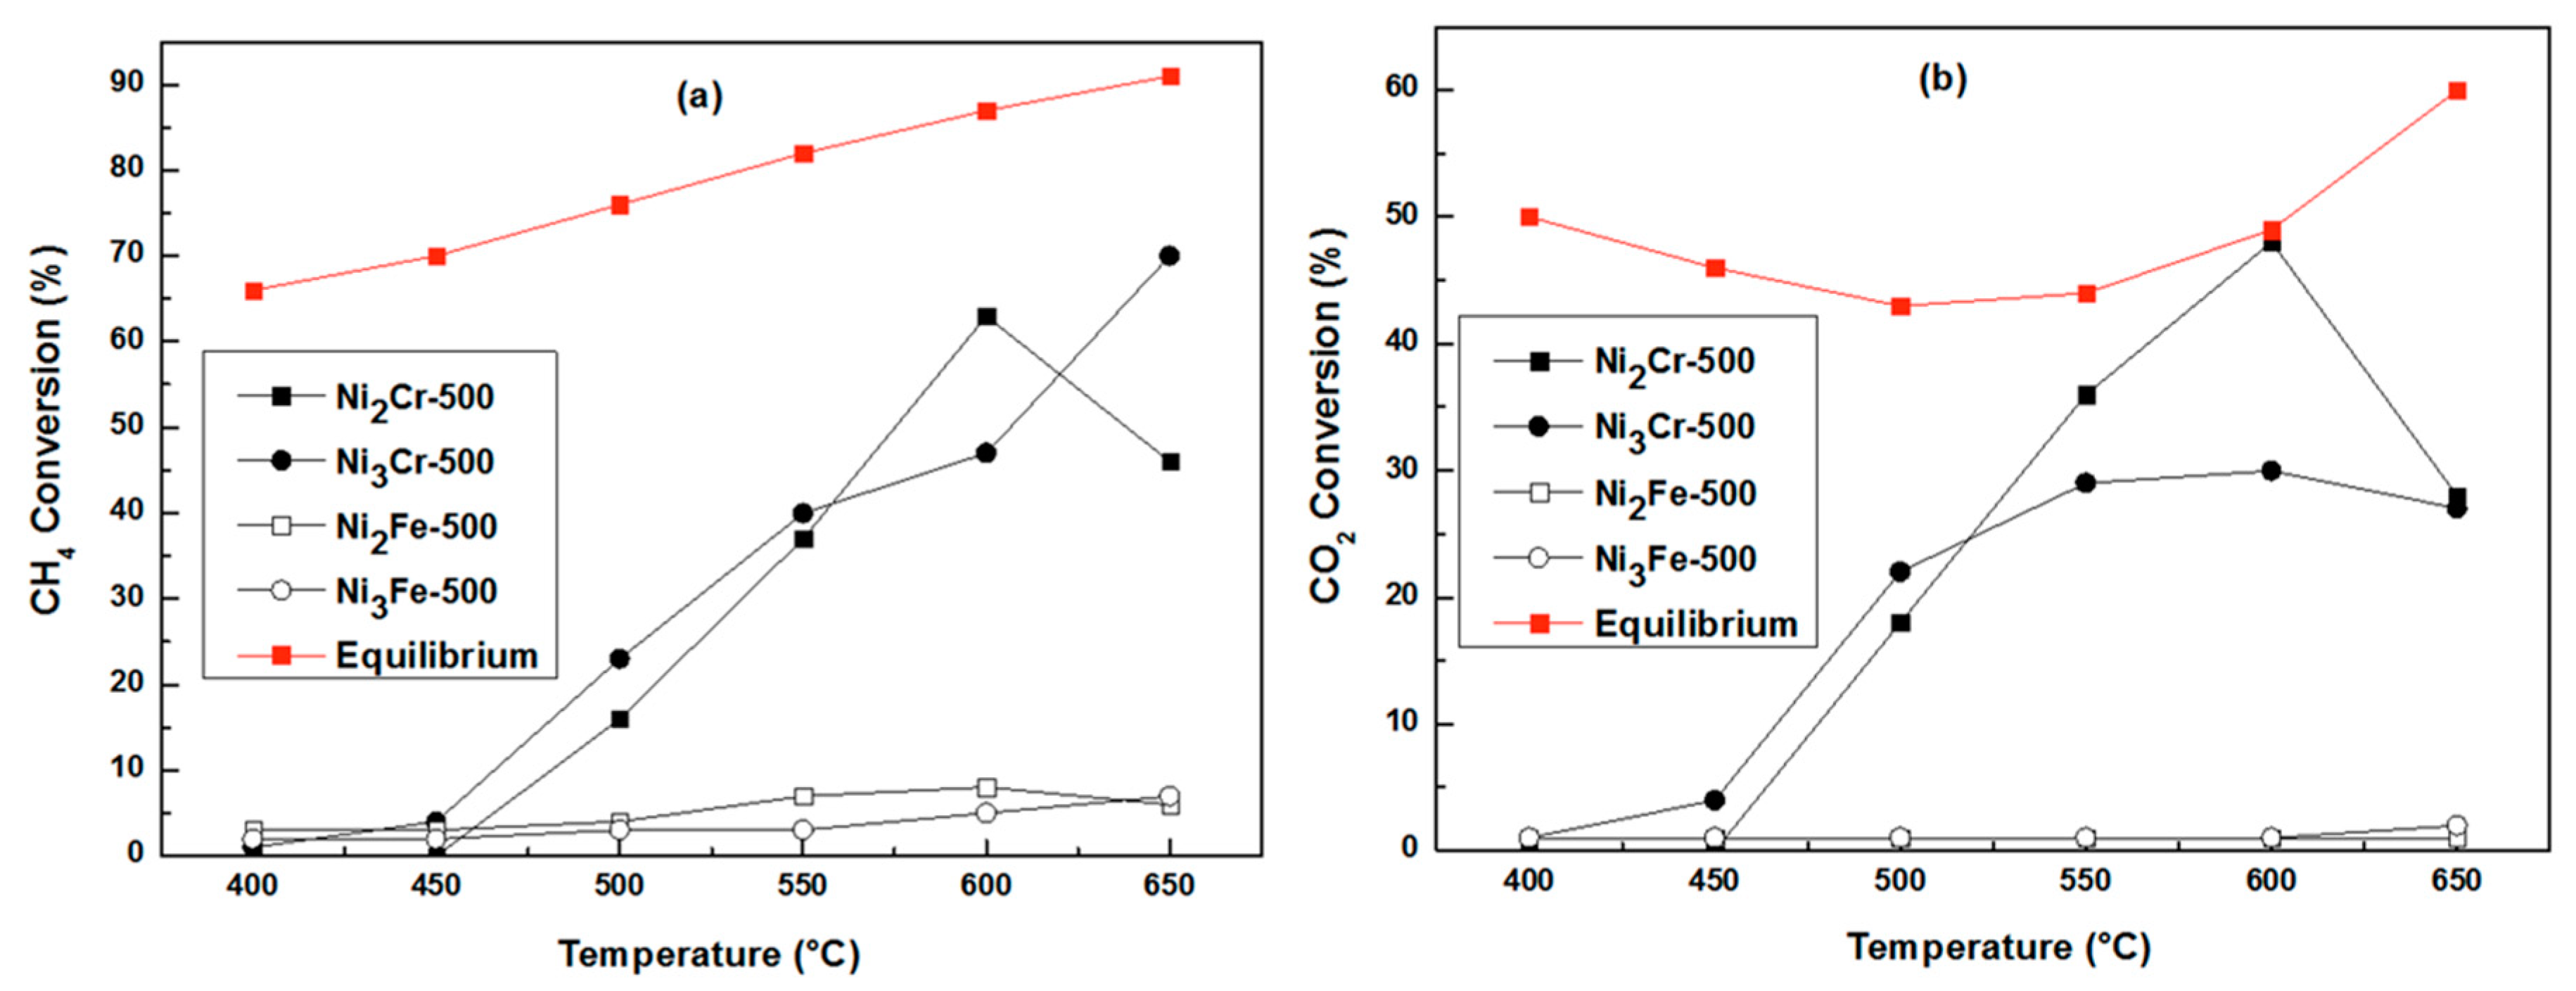
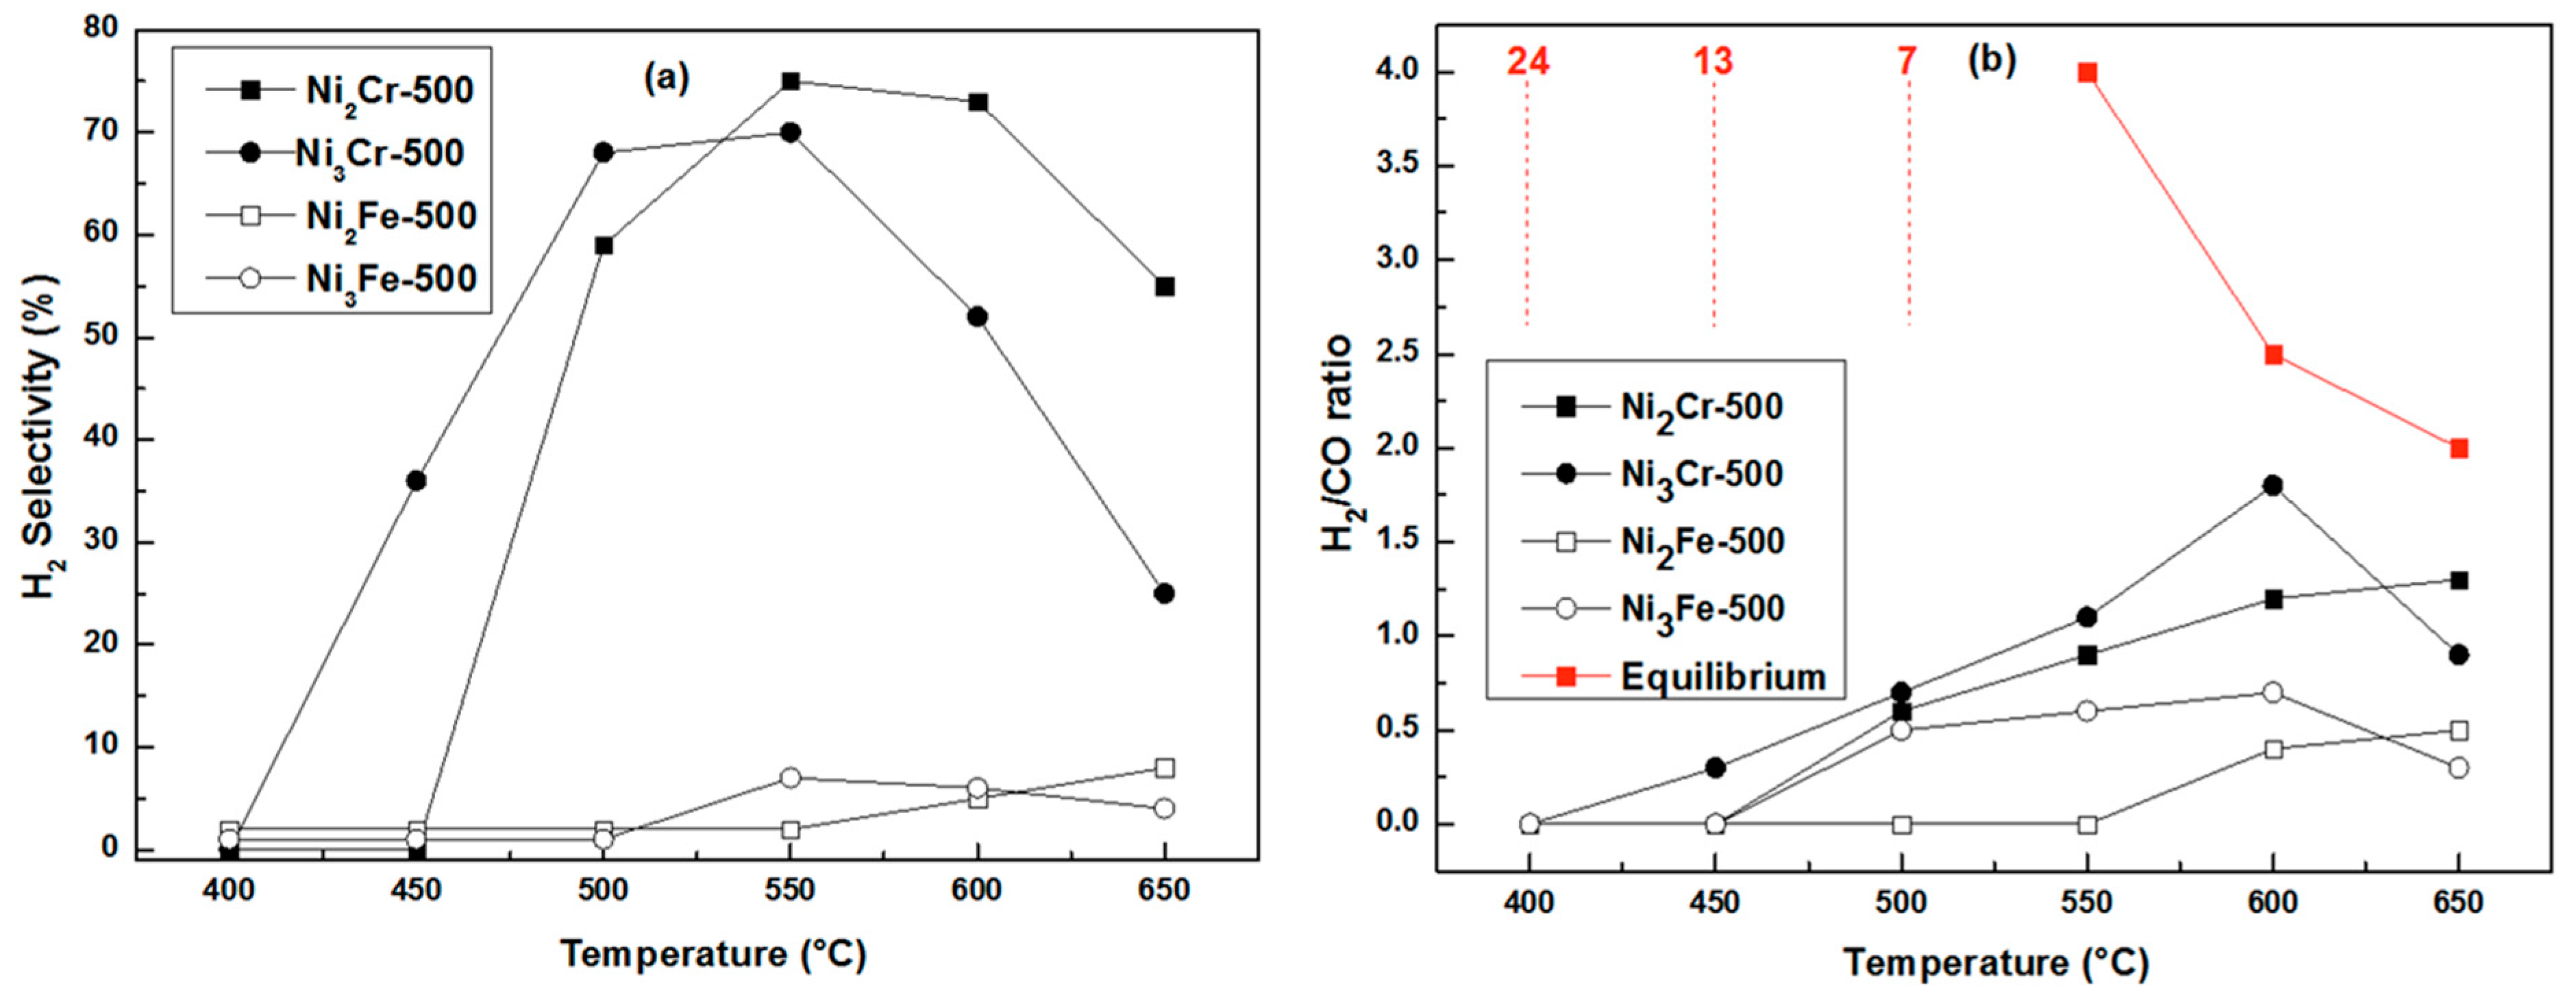
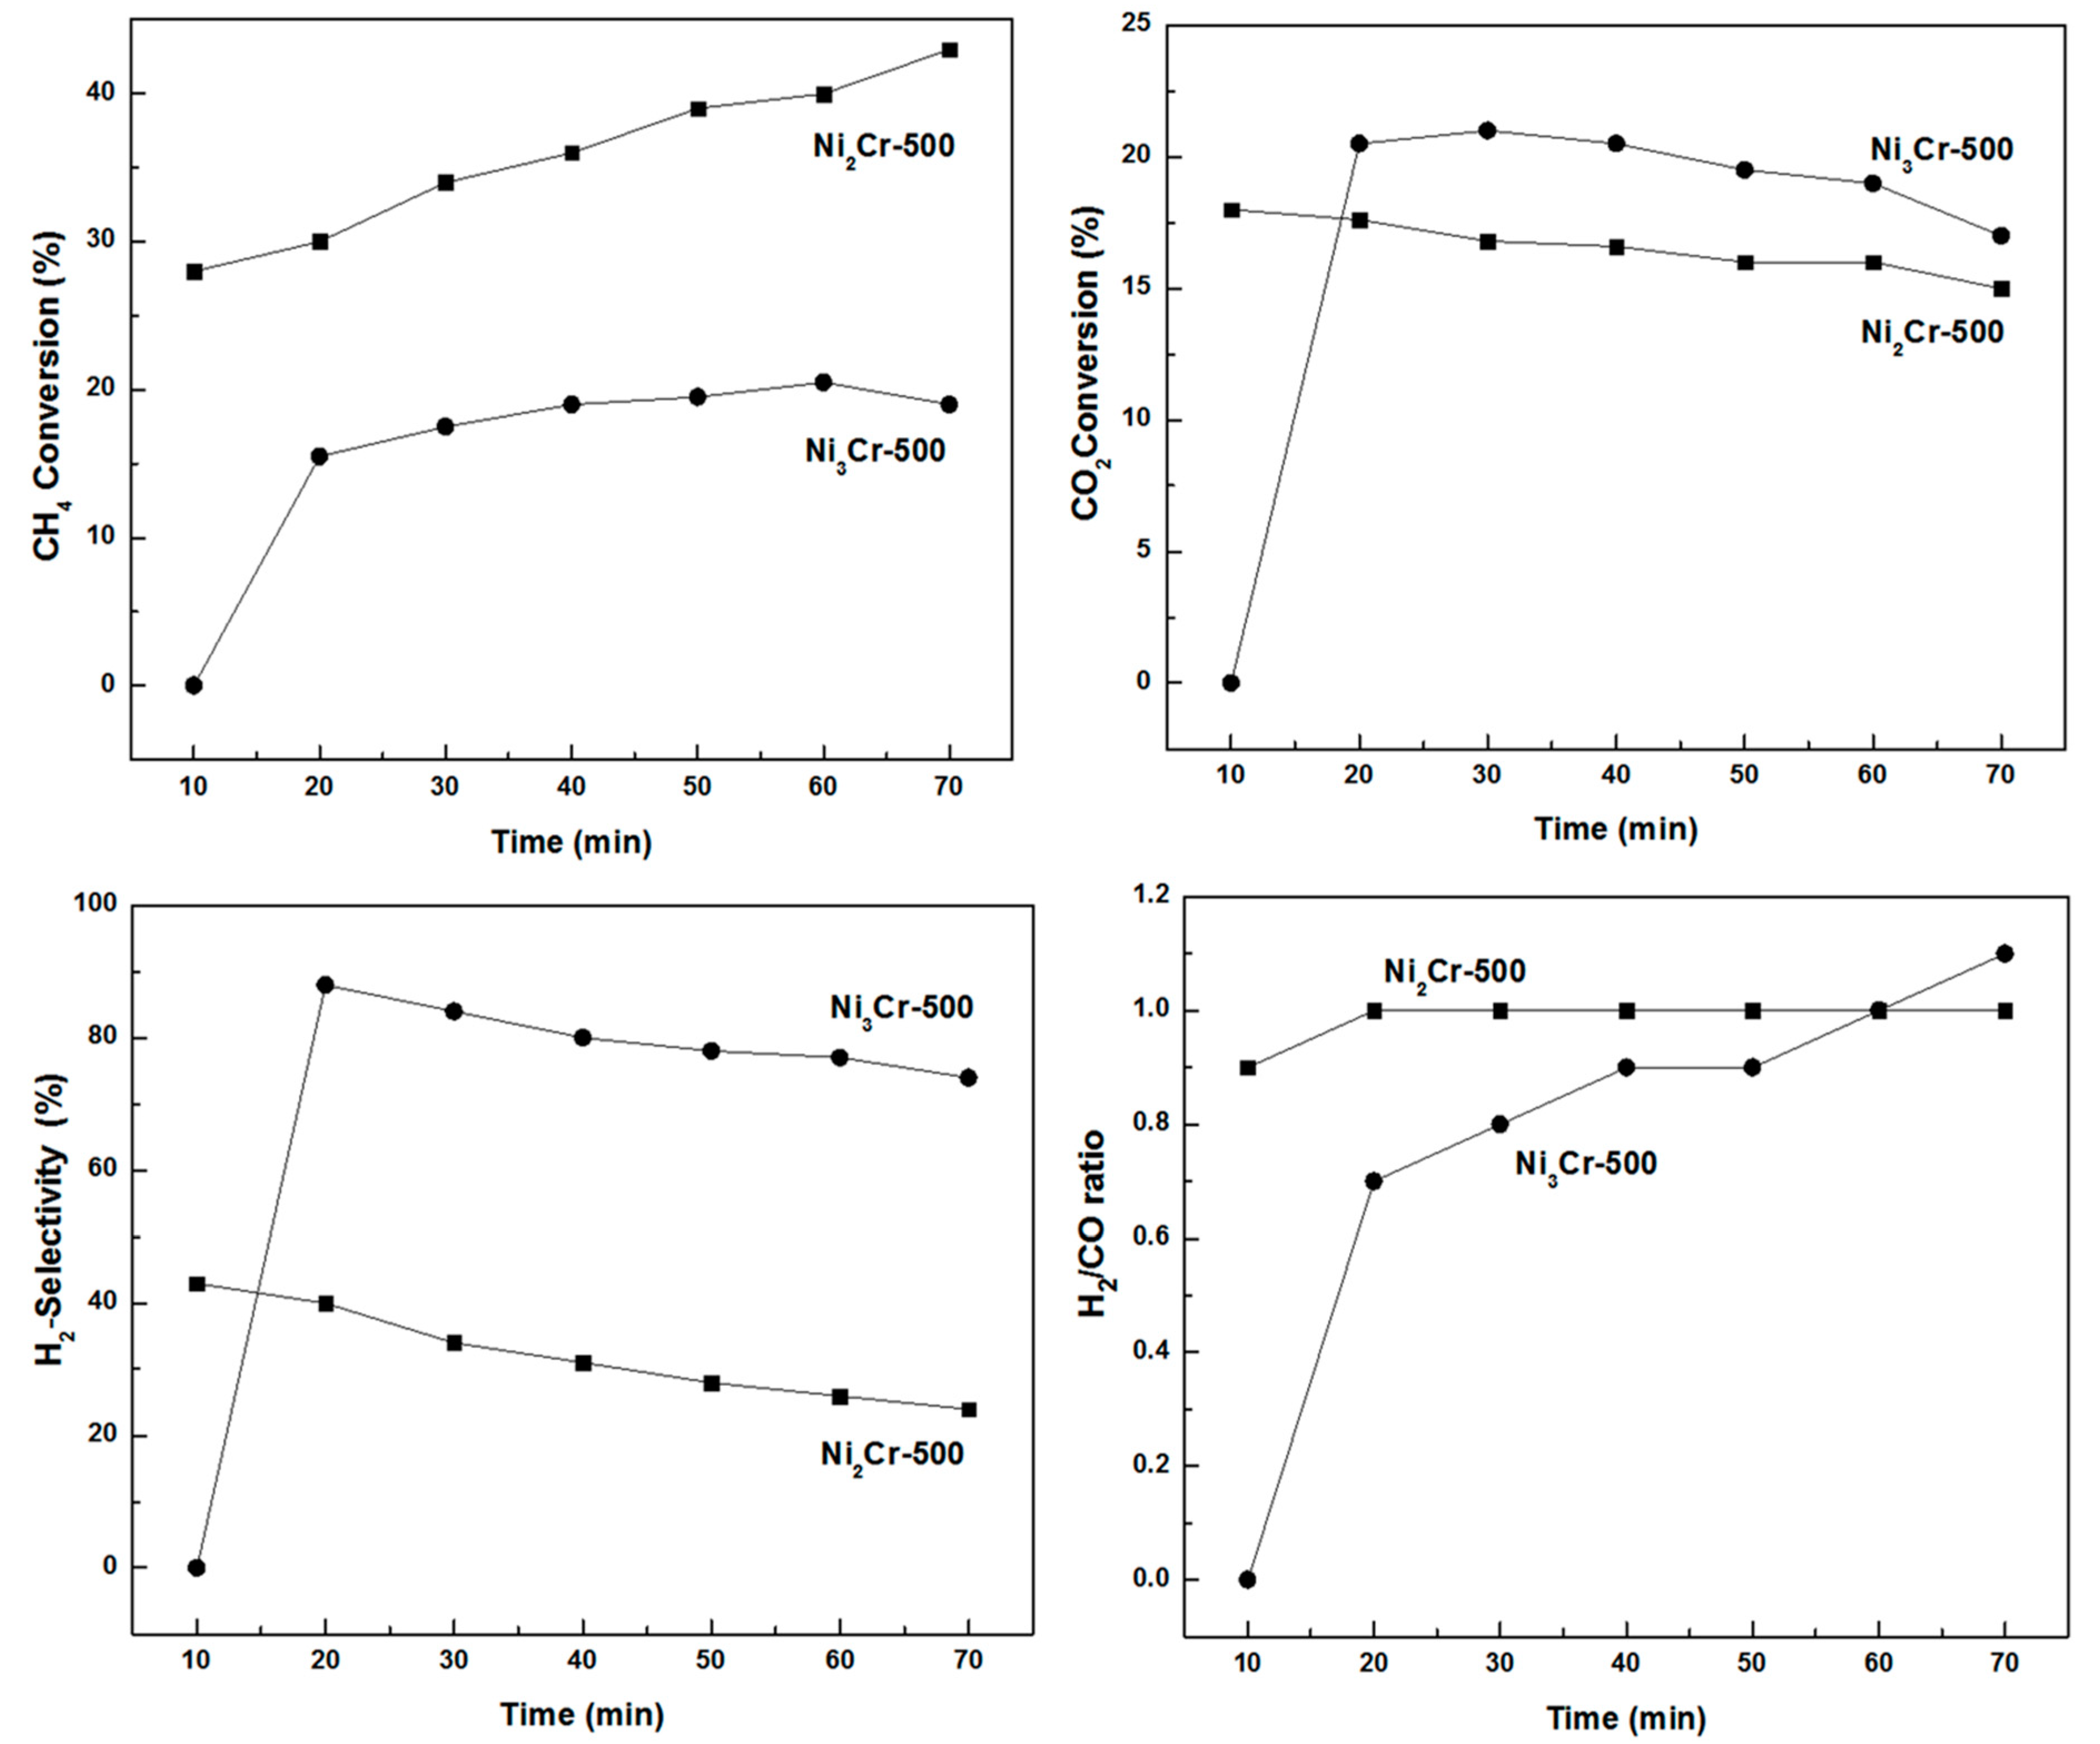
2.4. Catalytic Properties in CO2-Reforming of Methane
3. Materials and Methods
3.1. Chemicals
3.2. Catalyst Preparation
3.3. Catalysts Characterization
3.4. Catalytic Reforming Experiments
4. Conclusions
Supplementary Materials
Author Contributions
Funding
Data Availability Statement
Acknowledgments
Conflicts of Interest
References
- Tungatarova, S.; Xanthopoulou, G.; Vekinis, G.; Karanasios, K.; Baizhumanova, T.; Zhumabek, M.; Sadenova, M. Ni-Al Self-Propagating High-Temperature Synthesis Catalysts in Dry Reforming of Methane to Hydrogen-Enriched Fuel Mixtures. Catalysts 2022, 12, 1270. [Google Scholar] [CrossRef]
- Pinheiro, A.L.; Pinheiro, A.N.; Valentini, A.; Filho, J.M.; Sousa, F.F.; Sousa, J.R.; Rocha, M.G.C.; Bargiela, P.; Oliveira, A.C. Analysis of coke deposition and study of the structural features of MAl2O4 catalysts for the dry reforming of methane. Catal. Commun. 2009, 11, 11–14. [Google Scholar] [CrossRef]
- Crisafulli, C.; Scire, S.; Maggiore, R.; Minico, S.; Galvagno, S. CO2 reforming of methane over Ni–Ru and Ni–Pd bimetallic catalysts. Catal. Lett. 1999, 59, 21–26. [Google Scholar] [CrossRef]
- Wang, H.Y.; Ruckenstein, E. Carbon dioxide reforming of methane to synthesis gas over supported rhodium catalysts: The effect of support. Appl. Catal. A-Gen. 2000, 204, 143–152. [Google Scholar] [CrossRef]
- Erdohelyi, A. Catalytic Reaction of Carbon Dioxide with Methane on Supported Noble Metal Catalysts. Catalysts 2021, 11, 159. [Google Scholar] [CrossRef]
- Ruckenstein, E.; Hu, Y.H. Carbon dioxide reforming of methane over nickel/alkaline earth metal oxide catalysts. Appl. Catal. A-Gen. 1995, 133, 149–161. [Google Scholar] [CrossRef]
- Rostrup-Nielsen, J.R.; Bak Hansen, J.H. CO2-reforming of methane over transition metals. J. Catal. 1993, 144, 38–49. [Google Scholar] [CrossRef]
- Bradford, M.C.J.; Vannice, M.A. CO2 reforming of CH4. Catal. Rev.-Sci. Eng. 1999, 41, 1–42. [Google Scholar] [CrossRef]
- Rostrup-Nielsen, J.R. Production of synthesis gas. Catal. Today 1993, 18, 305–324. [Google Scholar] [CrossRef]
- Wang, S.B.; Lu, G.Q. Carbon dioxide reforming of methane to produce synthesis gas over metal-supported catalysts: state of the art. Energy Fuels 1996, 10, 896–904. [Google Scholar] [CrossRef]
- Romero, A.; Jobbagy, M.; Laborde, M.; Baronetti, G.; Amadeo, N. Ni(II)–Mg(II)–Al(III) catalysts for hydrogen production from ethanol steam reforming: Influence of the Mg content. Appl. Catal. A-Gen. 2014, 47, 398–404. [Google Scholar] [CrossRef] [Green Version]
- Jin, L.; Xie, T.; Ma, B.; Li, Y.; Hu, H. Preparation of carbon-Ni/MgO-Al2O3 composite catalysts for CO2 reforming of methane. Int. J. Hydrog. Energy 2017, 42, 5047–5055. [Google Scholar] [CrossRef]
- Roussel, H.; Briois, V.; Elkaim, E.; De Roy, A.; Besse, J.P.; Jolivet, J.P. Study of the Formation of the layered double hydroxide [Zn−Cr−Cl]. Chem. Mater. 2001, 13, 329–337. [Google Scholar] [CrossRef]
- You, Y.; Zhao, H.; Vance, G.F. Hybrid organic–inorganic derivatives of layered double hydroxides and dodecylbenzenesulfonate: Preparation and adsorption characteristics. J. Mater. Chem. 2002, 12, 907–912. [Google Scholar] [CrossRef]
- Chatla, A.; Almanassra, I.W.; Kochkodan, V.; Laoui, T.; Alawadhi, H.; Atieh, M.A. Efficient Removal of Eriochrome Black T (EBT) Dye and Chromium (Cr) by Hydrotalcite-Derived Mg-Ca-Al Mixed Metal Oxide Composite. Catalysts 2022, 12, 1247. [Google Scholar] [CrossRef]
- Triantafyllidis, K.S.; Peleka, E.N.; Komvokis, V.G.; Mavros, P.P. Iron-modified hydrotalcite-like materials as highly efficient phosphate sorbents. J. Colloid Interface Sci. 2010, 342, 427–436. [Google Scholar] [CrossRef]
- Frost, R.; Jagannadha-Reddy, B. Thermo-Raman spectroscopic study of the natural layered double hydroxide manasseite. Spectrochim. Acta A Mol. Biomol. Spectrosc. 2006, 65, 553–559. [Google Scholar] [CrossRef] [Green Version]
- Borromeo, L.; Zimmermann, U.; Andò, S.; Coletti, G.; Bersani, D.; Basso, D.; Gentile, P.; Schulz, B.; Garzanti, E. Raman spectroscopy as a tool for magnesium estimation in Mg-calcite. J. Raman Spectrosc. 2017, 48, 983–992. [Google Scholar] [CrossRef]
- Benrabaa, R.; Boukhlouf, H.; Löfberg, A.; Rubbens, A.; Vannier, R.N.; Bordes-Richard, E.; Barama, A. Nickel ferrite spinel as catalyst precursor in the dry reforming of methane: Synthesis, characterization and catalytic properties. J. Nat. Gas Chem. 2012, 21, 595–604. [Google Scholar] [CrossRef]
- Kreisel, J.; Lucazeau, G.; Vincent, H. Raman Spectra and Vibrational Analysis of BaFe12O19 Hexagonal Ferrite. J. Sol. State Chem. 1998, 137, 127–137. [Google Scholar] [CrossRef]
- Faid, A.Y.; Barnett, A.O.; Seland, F.; Sunde, S. Ni/NiO nanosheets for alkaline hydrogen evolution reaction: In situ electrochemical-Raman study. Electrochim. Acta 2020, 361, 137040. [Google Scholar] [CrossRef]
- Colomban, P.; Jullian, S.; Parlier, M.; Monge-Cadet, P. Identification of the high-temperature impact/friction of aeroengine blades and cases by micro Raman spectroscopy. Aerosp. Sci. Technol. 1999, 3, 447–459. [Google Scholar] [CrossRef]
- Singh, J.; Kumar, R.; Vermaa, V.; Kumar, R. Role of Ni2+ substituent on the structural, optical and magnetic properties of chromium oxide (Cr2-xNixO3) nanoparticles. Ceram. Int. 2020, 46, 24071–24082. [Google Scholar] [CrossRef]
- Olszówka, E.; Karcz, R.; Bielańska, E.; Kryściak-Czerwenka, J.; Napruszewska, D.; Sulikowski, B.; Socha, P.; Gaweł, A.; Bahranowski, K.; Olejniczak, Z.; et al. New insight into the preferred valency of interlayer anions in hydrotalcitelike compounds: The effect of Mg/Al ratio. Appl. Clay Sci. 2018, 155, 84–94. [Google Scholar] [CrossRef]
- Rozov, K.; Berner, U.; Taviot-Gueho, T.; Leroux, F.; Renaudin, G.; Kulil, D.; Diamond, L.W. Synthesis and characterization of the LDH hydrotalcite–pyroaurite solid-solution series. Cem. Concr. Res. 2010, 40, 1248–1254. [Google Scholar] [CrossRef]
- Benito, P.; Labajos, F.M.; Rives, V. Microwave-treated layered double hydroxides containing Ni2+ and Al3+: The effect of added Zn2+. J. Solid State Chem. 2006, 179, 3784–3797. [Google Scholar] [CrossRef]
- Kovanda, F.; Rojka, T.; Bezdicka, P.; Jiratova, K.; Obalova, L.; Pacultova, K.; Bastl, Z.; Grygar, T. Effect of hydrothermal treatment on properties of Ni–Al layered double hydroxides and related mixed oxides. J. Solid State Chem. 2009, 182, 27–36. [Google Scholar] [CrossRef]
- Shebanova, O.N.; Lazor, P. Raman spectroscopic study of magnetite (FeFe2O4): A new assignment for the vibrational spectrum. J. Solid State Chem. 2003, 174, 424–430. [Google Scholar] [CrossRef]
- Graves, P.R.; Johnston, C.; Campaniello, J.J. Raman scattering in spinel structure ferrites. Mat. Bul Res. 1988, 23, 1651–1660. [Google Scholar] [CrossRef]
- D’Ippolito, V.; Andreozzi, G.B.; Bersani, D.; Lotticib, P.P. Raman fingerprint of chromate, aluminate and ferrite spinels. J. Raman Spectrosc. 2015, 46, 1255–1264. [Google Scholar] [CrossRef]
- Hyun-Kim, J.; Soon- Hwang, I. Development of an in situ Raman spectroscopic system for surface oxide films on metals and alloys in high temperature water. Nucl. Eng. Des. 2005, 235, 1029–1040. [Google Scholar] [CrossRef]
- Takehira, K.; Kawabata, T.; Shishido, T.; Murakami, K.; Ohi, T.; Shoro, D.; Honda, M.; Takaki, K. Mechanism of reconstitution of hydrotalcite leading to eggshell-type Ni loading on Mg–Al mixed oxide. J. Catal. 2005, 231, 92–104. [Google Scholar] [CrossRef]
- X-ray Photoelectron Spectroscopy (XPS) Reference Pages. Available online: http://www.xpsfitting.com/ (accessed on 1 September 2022).
- Biesingera, M.C.; Payne, B.P.; Grosvenor, A.P.; Laua, L.W.M.; Gerson, A.R.; Smart, R.S.C. Resolving surface chemical states in XPS analysis of first row transition metals, oxides and hydroxides: Cr, Mn, Fe, Co and Ni. Appl. Surf. Sci. 2011, 257, 2717–2730. [Google Scholar] [CrossRef]
- Hosseini, S.A.; Alvarez-Galvan, M.C.; Fierro, J.L.G.; Niaei, A.; Salari, D. MCr2O4 (M=Co, Cu, and Zn) nanospinels for 2-propanol combustion: Correlation of structural properties with catalytic performance and stability. Ceram. Int. 2013, 39, 9253–9261. [Google Scholar] [CrossRef]
- Rouibah, K.; Barama, A.; Benrabaa, R.; Guerrero-Caballero, J.; Kane, T.; Vannier, R.N.; Rubbens, A.; Löfberg, A. Dry reforming of methane on nickel-chrome, nickel-cobalt and nickel-manganese catalysts. Int. J. Hydrogen Energy 2017, 42, 29725–29734. [Google Scholar] [CrossRef]
- Benrabaa, R.; Aissat, F.; Fodil Cherif, N.; Gouasmia, A.; Yeste, P.; Cauqui, M.A. Catalytic oxidation of carbon monoxide over CeO2 and La2O3 oxides supported nickel catalysts: The effect of the support and NiO loading. ChemistrySelect 2022, 7, 104–133. [Google Scholar] [CrossRef]
- Benrabaa, R.; Löfberg, A.; Rubbens, A.; Bordes-Richard, E.; Vannier, R.N.; Barama, A. Structure, reactivity and catalytic properties of nanoparticles of nickel ferrite in the dry reforming of methane. Catal. Today 2013, 203, 188–195. [Google Scholar] [CrossRef]
- Bhavsar, S.; Najera, M.; Solunke, R.; Veser, G. Chemical looping: To combustion and beyond. Catal. Today 2014, 228, 96–105. [Google Scholar] [CrossRef]
- Bhavsar, S.; Veser, G. Chemical looping beyond combustion: Production of synthesis gas via chemical looping partial oxidation of methane. RSC Adv. 2014, 4, 47254–47267. [Google Scholar] [CrossRef]
- Galvita, V.; Poelman, H.; Detavernier, C.; Marin, G. Catalyst-assisted chemical looping for CO2 conversion to CO. Appl. Catal. B Environ. 2015, 164, 184–191. [Google Scholar] [CrossRef]
- Löfberg, A.; Guerrero-Caballero, J.; Kane, T.; Rubbens, A.; Jalowiecki-Duhamel, L. Ni/CeO2 based catalysts as oxygen vectors for the chemical looping dry reforming of methane for syngas production. Appl. Catal. B Environ. 2017, 212, 159–174. [Google Scholar] [CrossRef]
- Löfberg, A.; Guerrero-Caballero, J.; Kane, T.; Jalowiecki-Duhamel, L. Chemical looping dry reforming of methane: Toward shale-gas and biogas valorization. Chem. Eng. Process. Process Intensif. 2017, 122, 523–529. [Google Scholar] [CrossRef]
- Tang, M.; Xu, L.; Fan, M. Progress in oxygen carrier development of methane-based chemical-looping reforming: A review. Appl. Energy 2015, 151, 143–156. [Google Scholar] [CrossRef] [Green Version]
- Assabumrungrat, S.; Charoenseri, S.; Laosiripojana, N.; Kiatkittipong, W.; Praserthdam, P. Effect of oxygen addition on catalytic performance of Ni/SiO2-MgO toward carbon dioxide reforming of methane under periodic operation. Int. J. Hydrogen Energy 2009, 34, 6211–6220. [Google Scholar] [CrossRef]


| LDH | d003 (Å) | d110 (Å) | a (Å) 1 | c (Å) 1 |
|---|---|---|---|---|
| Ni2Fe | 7.82 | 1.53 | 3.06 | 23.46 |
| Ni3Fe | 7.77 | 1.54 | 3.08 | 23.31 |
| Ni2Cr | 7.94 | 1.52 | 3.04 | 23.82 |
| Ni3Cr | 7.94 | 1.53 | 3.06 | 23.83 |
| Temperature (°C) | d003 (Å) | a (Å) 1 | c (Å) 1 |
|---|---|---|---|
| 25 | 7.814 | 3.010 | 23.442 |
| 50 | 7.694 | 3.015 | 23.082 |
| 75 | 7.665 | 3.027 | 22.995 |
| 100 | 7.576 | 3.027 | 22.728 |
| 125 | 7.467 | 3.023 | 22.401 |
| 150 | 7.399 | 3.027 | 22.197 |
| 175 | 7.265 | 3.012 | 21.795 |
| 200 | 7.221 | 3.015 | 21.663 |
| 225 | 7.102 | 3.015 | 21.306 |
| 250 | 7.017 | 3.018 | 21.051 |
| Catalysts | Cs 1 (Å) | SBET (m2 g−1) | Pore Volume (cm3 g−1) | Mean Pore Diameter (Å) | |
|---|---|---|---|---|---|
| B.E.T. | B.J.H. | ||||
| Ni2Fe-500 | 69 | 144 | 0.24 | 76 | 62 |
| Ni3Fe-500 | 53 | 160 | 0.39 | 91 | 76 |
| Ni2Cr-500 | 75 | 73 | 0.18 | 92 | 79 |
| Ni3Cr-500 | 77 | 74 | 0.23 | 124 | 107 |
| Catalysts | Binding Energy (eV) | Atomic Ratio 1 | |||
|---|---|---|---|---|---|
| Ni | Fe | Cr | Ni/Fe | Ni/Cr | |
| Ni2Fe-500 | 854.7 | 711.1 | - | 0.7 | - |
| Ni3Fe-500 | 854.9 | 711.6 | - | 0.9 | - |
| Ni2Cr-500 | 855.0 | - | 576.5 | - | 2.2 |
| Ni3Cr-500 | 855.0 | - | 576.9 | - | 3.2 |
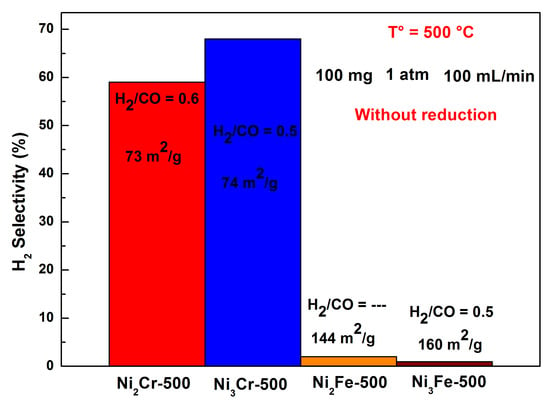
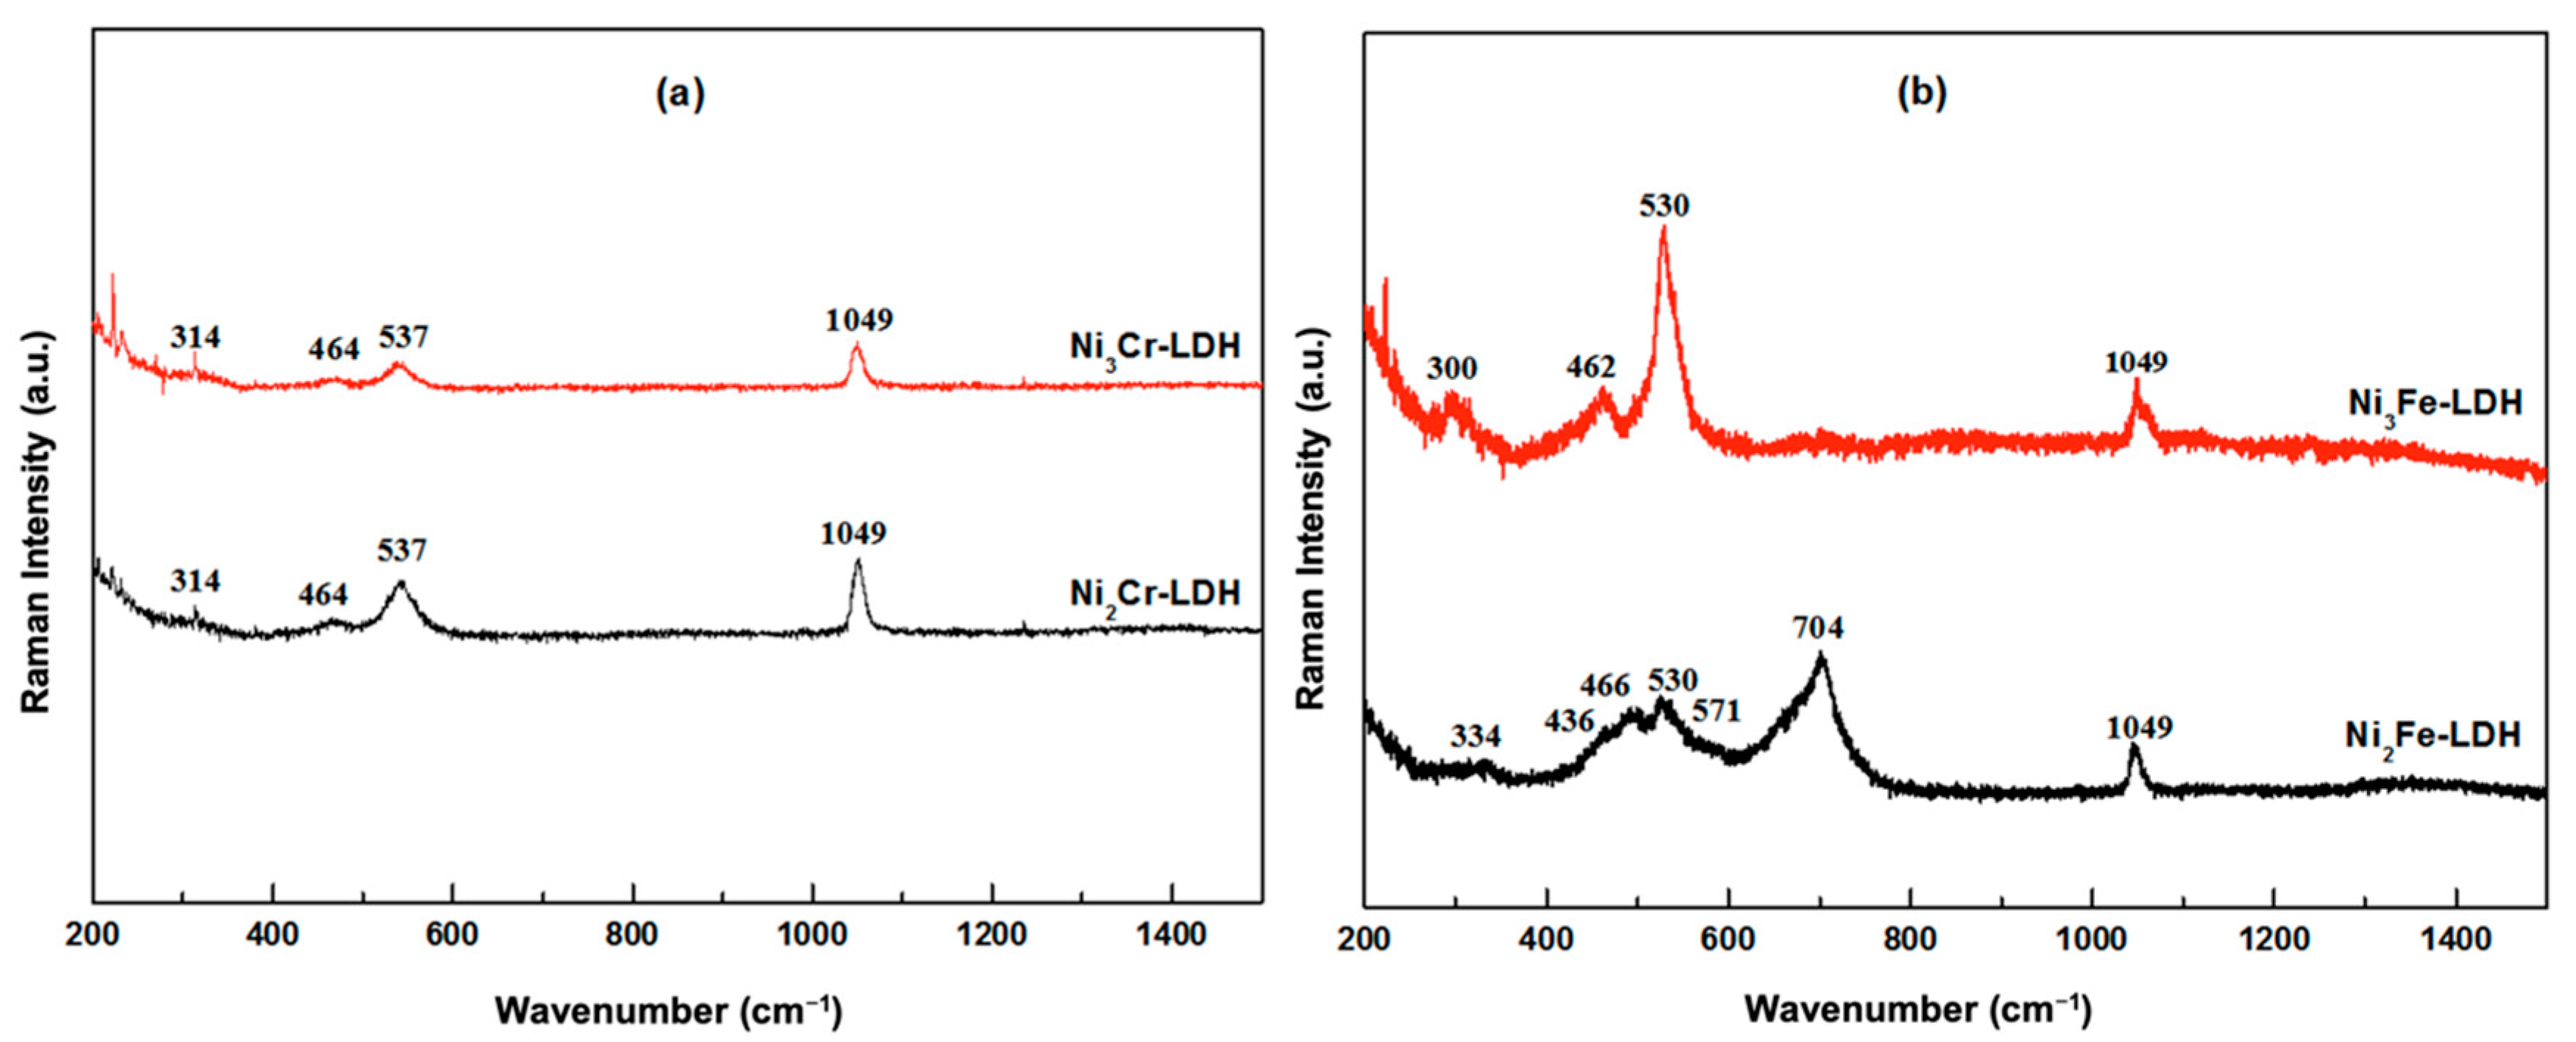
| Catalysts | X% CH4 | X% CO2 | S% H2 | H2/CO |
|---|---|---|---|---|
| Ni2Cr-500 (TP 1) | 16 | 18 | 59 | 0.6 |
| Ni3Cr-500 (TP 1) | 23 | 22 | 68 | 0.7 |
| Ni2Fe-500 (TP 1) | 4 | 1 | 2 | - |
| Ni3Fe-500 (TP 1) | 3 | 1 | 1 | 0.5 |
| Ni2Cr-500 (ISO 2, t = 20 min) | 30 | 18 | 40 | 1 |
| Ni3Cr-500 (ISO 2, t = 20 min) | 16 | 21 | 88 | 0.7 |
Publisher’s Note: MDPI stays neutral with regard to jurisdictional claims in published maps and institutional affiliations. |
© 2022 by the authors. Licensee MDPI, Basel, Switzerland. This article is an open access article distributed under the terms and conditions of the Creative Commons Attribution (CC BY) license (https://creativecommons.org/licenses/by/4.0/).
Share and Cite
Hallassi, M.; Benrabaa, R.; Cherif, N.F.; Lerari, D.; Chebout, R.; Bachari, K.; Rubbens, A.; Roussel, P.; Vannier, R.-N.; Trentesaux, M.; et al. Characterization and Syngas Production at Low Temperature via Dry Reforming of Methane over Ni-M (M = Fe, Cr) Catalysts Tailored from LDH Structure. Catalysts 2022, 12, 1507. https://doi.org/10.3390/catal12121507
Hallassi M, Benrabaa R, Cherif NF, Lerari D, Chebout R, Bachari K, Rubbens A, Roussel P, Vannier R-N, Trentesaux M, et al. Characterization and Syngas Production at Low Temperature via Dry Reforming of Methane over Ni-M (M = Fe, Cr) Catalysts Tailored from LDH Structure. Catalysts. 2022; 12(12):1507. https://doi.org/10.3390/catal12121507
Chicago/Turabian StyleHallassi, Manel, Rafik Benrabaa, Nawal Fodil Cherif, Djahida Lerari, Redouane Chebout, Khaldoun Bachari, Annick Rubbens, Pascal Roussel, Rose-Noëlle Vannier, Martine Trentesaux, and et al. 2022. "Characterization and Syngas Production at Low Temperature via Dry Reforming of Methane over Ni-M (M = Fe, Cr) Catalysts Tailored from LDH Structure" Catalysts 12, no. 12: 1507. https://doi.org/10.3390/catal12121507