

Analysis of the Catalytic Effects Induced by Alkali and Alkaline Earth Metals (AAEMs) on the Pyrolysis of Beech Wood and Corncob

Abstract
:1. Introduction
2. Materials and Methods
2.1. Feedstocks
2.2. Thermogravimetric Analyses (TGA)
2.3. Kinetic Modeling of TGA Results
3. Results and Discussion
3.1. TGA Results
3.2. Impact of AAEMs on Pyrolysis Kinetics
3.2.1. Catalytic Effects of AAEMs on Pyrolysis Kinetic Parameters
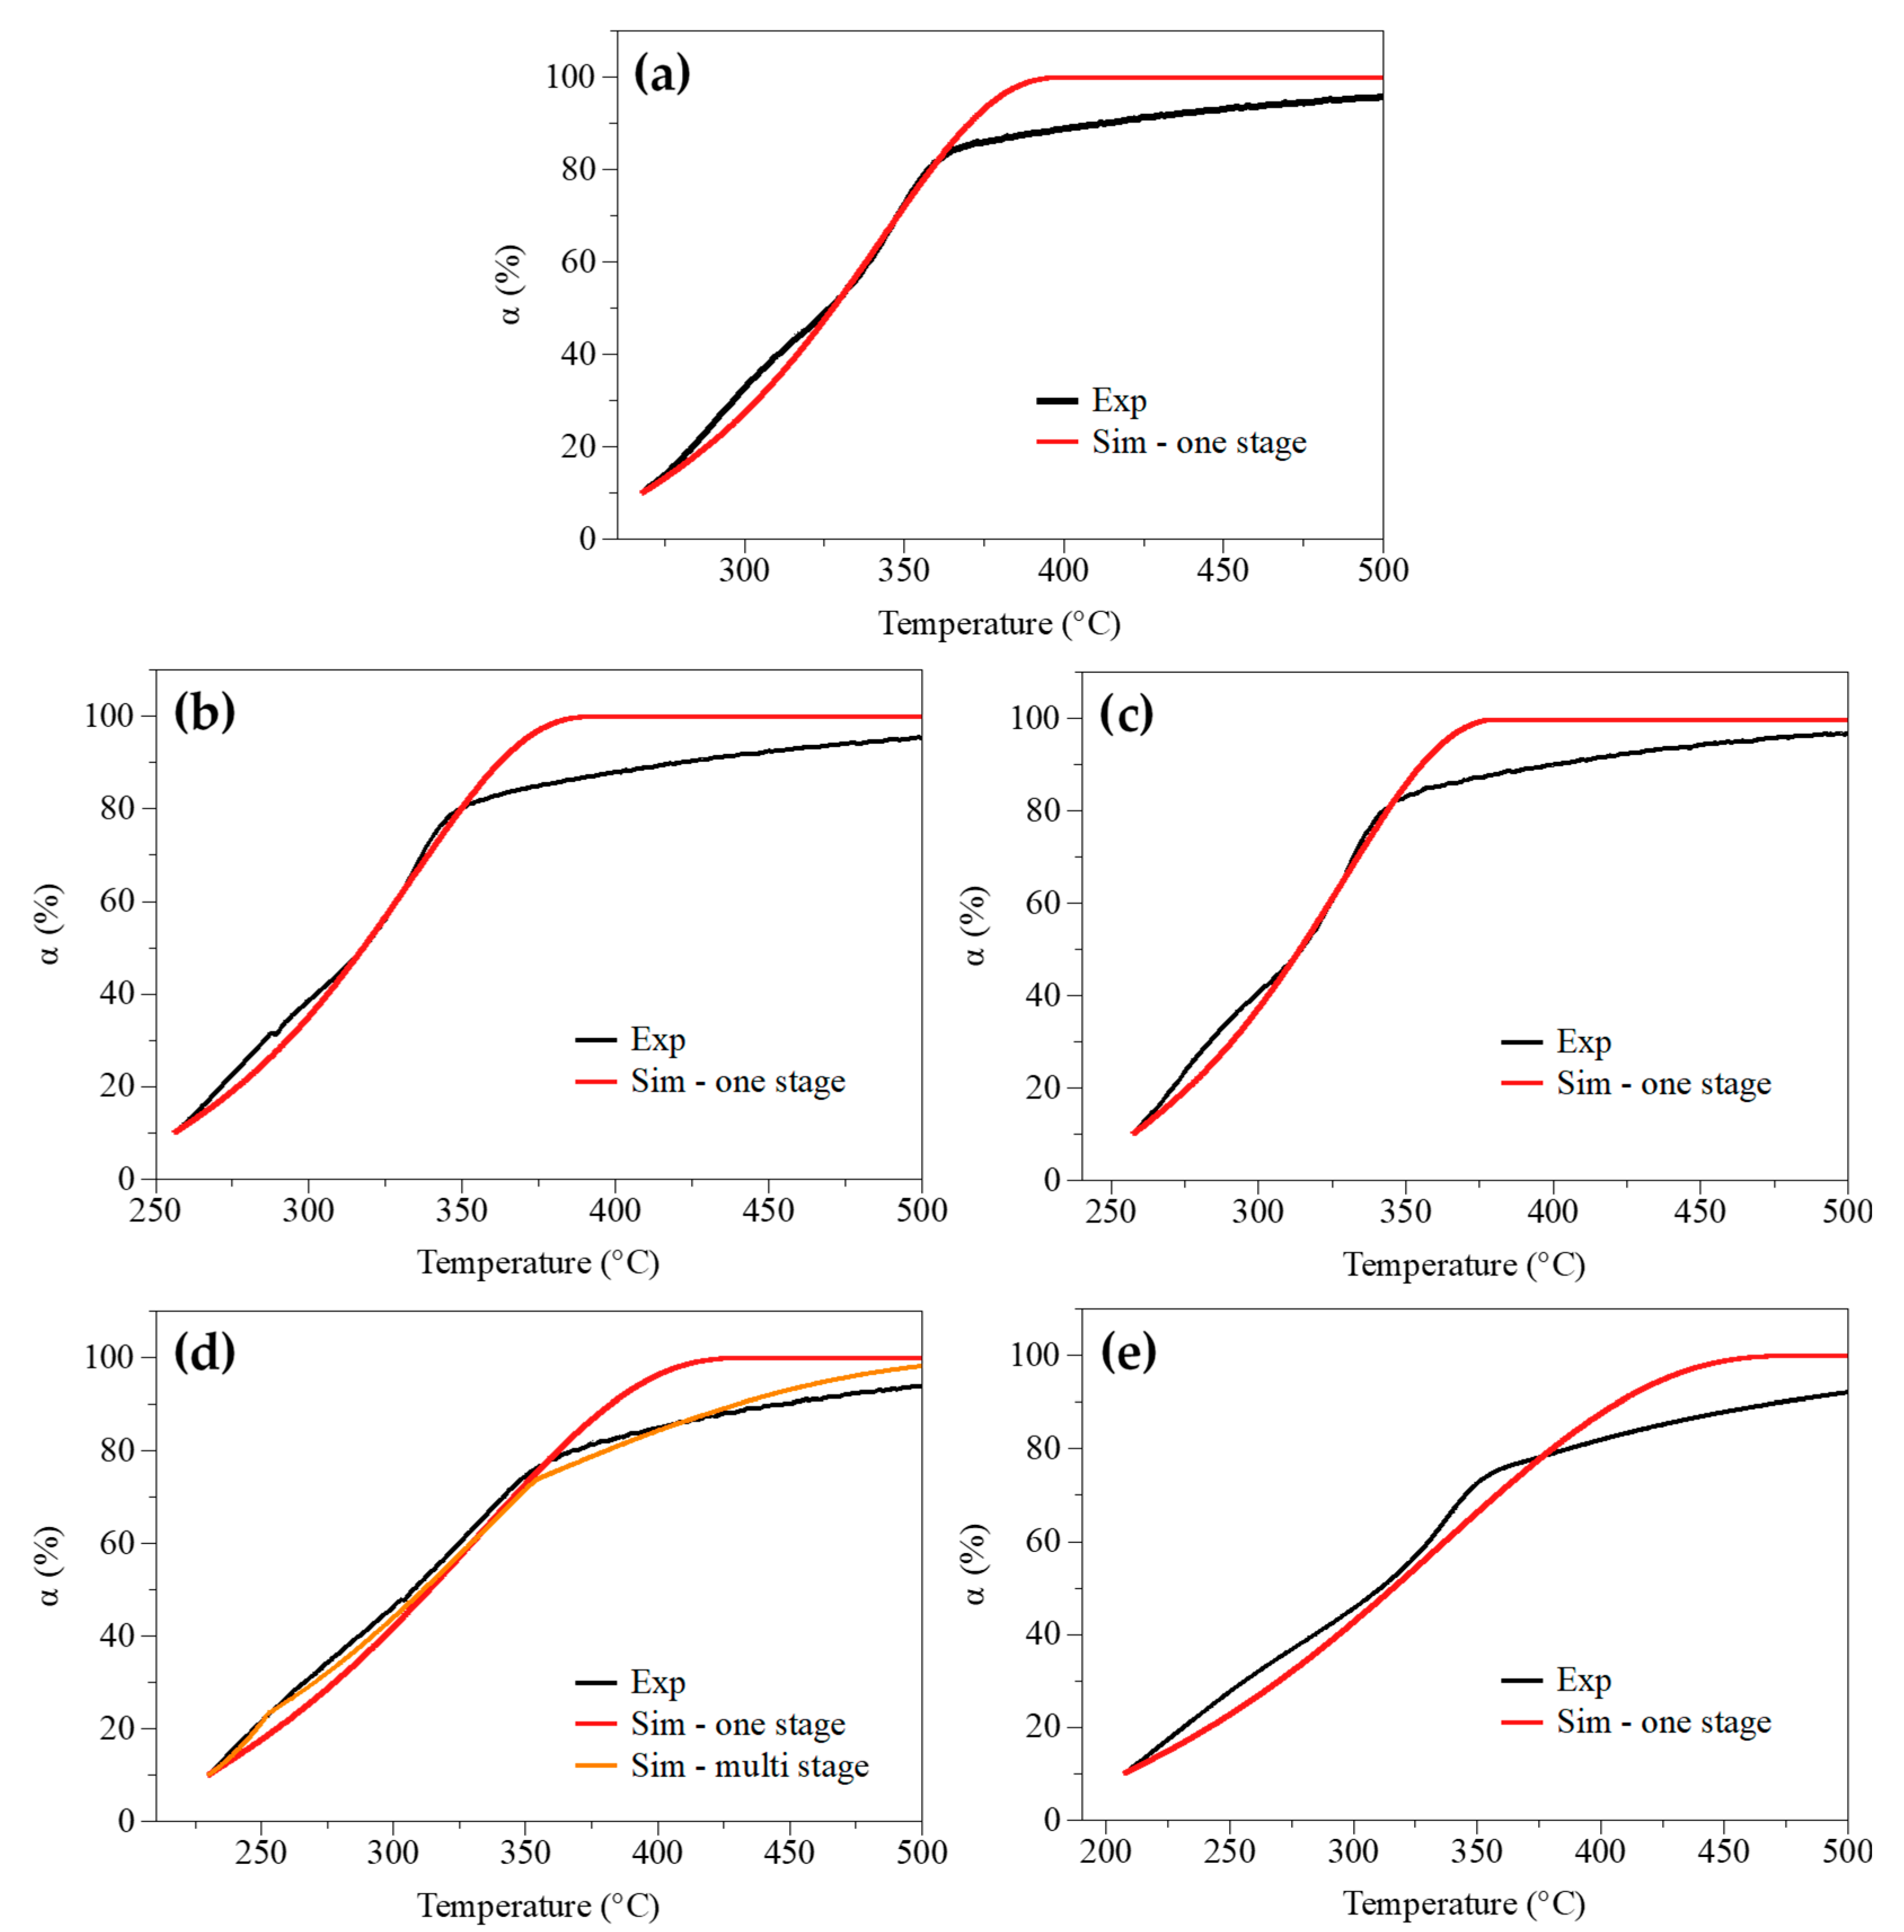
3.2.2. Comparison of Measured and Simulated Conversion Degree Profiles
3.3. Influence of the Catalyst Content
4. Conclusions
Author Contributions
Funding
Data Availability Statement
Conflicts of Interest
Appendix A

| Sample | F1 | F2 | F3 | F5 | ||||||||
|---|---|---|---|---|---|---|---|---|---|---|---|---|
| A | R2 | (s−1) | R2 | (s−1) | R2 | (s−1) | R2 | |||||
| Beech wood | 76.8 | 6.87 × 10³ | 0.9891 | 100.5 | 1.29 × 10⁶ | 0.9698 | 128.5 | 5.75 × 10⁸ | 0.9428 | 194.3 | 7.94 × 10¹⁴ | 0.8966 |
| Beech wood + NaOH | 58.6 | 5.56 × 10² | 0.9710 | 76.7 | 5.01 × 10⁴ | 0.9864 | 98.0 | 9.16 × 10⁶ | 0.9914 | 148.1 | 1.60 × 10¹² | 0.9879 |
| Beech wood + CaCl2 | 45.0 | 1.42 × 101 | 0.9877 | 63.5 | 1.29 × 10³ | 0.9959 | 85.9 | 2.59 × 10⁵ | 0.9873 | 138.7 | 5.55 × 10¹⁰ | 0.9642 |
| Beech wood + MgCl2 | 36.9 | 2.10 × 100 | 0.9735 | 51.2 | 7.92 × 101 | 0.9410 | 68.4 | 5.45 × 10³ | 0.9066 | 109.0 | 9.04 × 10⁷ | 0.8582 |
| Corncob | 67.9 | 2.26 × 10³ | 0.9787 | 90.6 | 4.43 × 10⁵ | 0.9861 | 117.6 | 2.14 × 10⁸ | 0.9752 | 181.2 | 3.66 × 10¹⁴ | 0.9469 |
| Corncob + NaCl | 63.0 | 1.01 × 10³ | 0.9797 | 85.1 | 1.96 × 10⁵ | 0.9806 | 111.6 | 9.46 × 10⁷ | 0.9629 | 173.9 | 1.61 × 10¹⁴ | 0.9276 |
| Corncob + KCl | 67.0 | 2.66 × 10³ | 0.9730 | 90.1 | 6.41 × 10⁵ | 0.9769 | 117.7 | 4.01 × 10⁸ | 0.9626 | 182.7 | 1.26 × 10¹⁵ | 0.9296 |
| Corncob + CaCl2 | 38.8 | 4.99 × 100 | 0.9812 | 55.1 | 3.24 × 10² | 0.9873 | 74.7 | 4.33 × 10⁴ | 0.9844 | 121.2 | 3.51 × 10⁹ | 0.9614 |
| Corncob + MgCl2 | 28.5 | 4.33 × 10⁻¹ | 0.9818 | 41.4 | 1.46 × 101 | 0.9827 | 57.1 | 8.78 × 10² | 0.9692 | 94.0 | 1.06 × 10⁷ | 0.9394 |
| Sample | F7 | D1 | D2 | D3 | ||||||||
| (kJ/mol) | (s−1) | R2 | (kJ/mol) | (s−1) | R2 | (kJ/mol) | (s−1) | R2 | (kJ/mol) | A (s−1) | R2 | |
| Beech wood | 268.2 | 5.35 × 10²¹ | 0.8697 | 125.8 | 4.54 × 10⁷ | 0.9908 | 137.0 | 2.65 × 10⁸ | 0.9930 | 150.1 | 1.02 × 10⁹ | 0.9928 |
| Beech wood + NaOH | 204.7 | 1.15 × 10¹⁸ | 0.9814 | 97.0 | 9.88 × 10⁵ | 0.9509 | 105.7 | 4.23 × 10⁶ | 0.9600 | 115.8 | 1.11 × 10⁷ | 0.9687 |
| Beech wood + CaCl2 | 197.6 | 4.04 × 10¹⁶ | 0.9502 | 71.2 | 1.39 × 10³ | 0.9575 | 79.5 | 5.06 × 10³ | 0.9711 | 89.4 | 1.19 × 10⁴ | 0.9829 |
| Beech wood + MgCl2 | 154.2 | 3.84 × 10¹² | 0.8342 | 60.9 | 1.35 × 10² | 0.9896 | 67.4 | 3.41 × 10² | 0.9890 | 75.2 | 5.09 × 10² | 0.9849 |
| Corncob | 252.5 | 3.06 × 10²¹ | 0.9285 | 109.5 | 5.22 × 10⁶ | 0.9591 | 120.1 | 2.99 × 10⁷ | 0.9698 | 132.5 | 1.15 × 10⁸ | 0.9788 |
| Corncob + NaCl | 243.6 | 1.28 × 10²¹ | 0.9071 | 100.9 | 1.23 × 10⁶ | 0.9682 | 111.0 | 6.74 × 10⁶ | 0.9772 | 123.0 | 2.50 × 10⁷ | 0.9840 |
| Corncob + KCl | 255.6 | 2.03 × 10²² | 0.9098 | 107.1 | 5.38 × 10⁶ | 0.9594 | 117.7 | 3.31 × 10⁷ | 0.9694 | 130.3 | 1.40 × 10⁸ | 0.9773 |
| Corncob + CaCl2 | 172.9 | 8.70 × 10¹⁴ | 0.9474 | 61.9 | 3.12 × 10² | 0.9482 | 69.2 | 9.83 × 10² | 0.9636 | 77.9 | 1.94 × 10³ | 0.9769 |
| Corncob + MgCl2 | 135.2 | 3.03 × 10¹¹ | 0.9233 | 46.5 | 9.47 × 100 | 0.9596 | 52.2 | 2.19 × 101 | 0.9729 | 59.1 | 2.99 × 101 | 0.9831 |
| Sample | R2 | R3 | A2 | A3 | ||||||||
| (kJ/mol) | (s−1) | R2 | (kJ/mol) | A (s−1) | R2 | (kJ/mol) | (s−1) | R2 | Ea (kJ/mol) | (s−1) | R2 | |
| Beech wood | 66.8 | 3.58 × 10² | 0.9921 | 70.0 | 4.94 × 10² | 0.9917 | 33.4 | 8.54 ×10⁻¹ | 0.9858 | 18.9 | 3.18 × 10⁻² | 0.9806 |
| Beech wood + NaOH | 50.8 | 3.88 × 101 | 0.9576 | 53.3 | 4.89 × 101 | 0.9625 | 24.7 | 2.25 × 10⁻¹ | 0.9581 | 13.4 | 1.20 × 10⁻² | 0.9357 |
| Beech wood + CaCl2 | 37.4 | 1.04 × 100 | 0.9708 | 39.8 | 1.28 × 100 | 0.9776 | 17.6 | 2.77 × 10⁻² | 0.9781 | 8.5 | 2.28 × 10⁻³ | 0.9553 |
| Beech wood + MgCl2 | 30.9 | 2.20 × 10⁻¹ | 0.9834 | 32.8 | 2.42 × 10⁻¹ | 0.9809 | 13.6 | 9.24 × 10⁻³ | 0.9554 | 5.9 | 9.10 × 10⁻⁴ | 0.9053 |
| Corncob | 58.3 | 1.17 × 10² | 0.9703 | 61.4 | 1.61 × 10² | 0.9751 | 29.1 | 4.73 × 10⁻¹ | 0.9751 | 16.2 | 2.07 × 10⁻² | 0.9636 |
| Corncob + NaCl | 53.8 | 5.34 × 101 | 0.9775 | 56.7 | 7.33 × 101 | 0.9810 | 26.8 | 3.08 × 10⁻¹ | 0.9792 | 14.7 | 1.51 × 10⁻² | 0.9689 |
| Corncob + KCl | 57.3 | 1.27 × 10² | 0.9693 | 60.4 | 1.80 × 10² | 0.9735 | 28.8 | 5.22 × 10⁻¹ | 0.9712 | 16.0 | 2.24 × 10⁻² | 0.9586 |
| Corncob + CaCl2 | 32.1 | 4.18 × 10⁻¹ | 0.9611 | 34.2 | 4.95 × 10⁻¹ | 0.9692 | 14.7 | 1.53 × 10⁻² | 0.9650 | 6.7 | 1.39 × 10⁻³ | 0.9215 |
| Corncob + MgCl2 | 23.2 | 4.75 × 10⁻² | 0.9677 | 24.9 | 5.16 × 10⁻² | 0.9748 | 9.6 | 3.44 × 10⁻³ | 0.9610 | 3.3 | 3.37 × 10⁻⁴ | 0.8517 |
| Sample | A4 | P2 | ||||||||||
| (kJ/mol) | (s−1) | R2 | (kJ/mol) | (s−1) | R2 | |||||||
| Beech wood | 11.6 | 5.04 × 10⁻³ | 0.9720 | 23.9 | 8.24 × 10⁻² | 0.9831 | ||||||
| Beech wood + NaOH | 7.7 | 2.18 × 10⁻³ | 0.8925 | 17.3 | 2.80 × 10⁻² | 0.9033 | ||||||
| Beech wood + CaCl2 | 3.9 | 4.34 × 10⁻⁴ | 0.8814 | 10.5 | 3.25 × 10⁻³ | 0.8751 | ||||||
| Beech wood + MgCl2 | 2.0 | 1.48 × 10⁻⁴ | 0.6774 | 8.0 | 1.48 × 10⁻³ | 0.9605 | ||||||
| Corncob | 9.7 | 3.48 × 10⁻³ | 0.9428 | 20.1 | 4.44 × 10⁻² | 0.9235 | ||||||
| Corncob + NaCl | 8.6 | 2.65 × 10⁻³ | 0.9493 | 18.1 | 2.91 × 10⁻² | 0.9368 | ||||||
| Corncob + KCl | 9.6 | 3.74 × 10⁻³ | 0.9362 | 19.6 | 4.55 × 10⁻² | 0.9243 | ||||||
| Corncob + CaCl2 | 2.6 | 2.46 × 10⁻⁴ | 0.7512 | 8.4 | 1.96 × 10⁻³ | 0.8289 | ||||||
| Corncob + MgCl2 | 0.1 | 6.07 × 10⁻⁶ | 0.0102 | 4.6 | 4.87 × 10⁻⁴ | 0.7526 | ||||||
References
- Deng, S.; Wang, X.; Zhang, J.; Liu, Z.; Mikulčić, H.; Vujanović, M.; Tan, H.; Duić, N. A kinetic study on the catalysis of KCl, K2SO4, and K2CO3 during oxy-biomass combustion. J. Environ. Manag. 2018, 218, 50–58. [Google Scholar] [CrossRef] [PubMed]
- Collard, F.-X.; Blin, J. A review on pyrolysis of biomass constituents: Mechanisms and composition of the products obtained from the conversion of cellulose, hemicelluloses and lignin. Renew. Sustain. Energy Rev. 2014, 38, 594–608. [Google Scholar] [CrossRef]
- Norouzi, O.; Taghavi, S.; Arku, P.; Jafarian, S.; Signoretto, M.; Dutta, A. What is the best catalyst for biomass pyrolysis? J. Anal. Appl. Pyrolysis 2021, 158, 105280. [Google Scholar] [CrossRef]
- Qiu, B.; Tao, X.; Wang, J.; Liu, Y.; Li, S.; Chu, H. Research progress in the preparation of high-quality liquid fuels and chemicals by catalytic pyrolysis of biomass: A review. Energy Convers. Manag. 2022, 261, 115647. [Google Scholar] [CrossRef]
- Kabir, G.; Hameed, B.H. Recent progress on catalytic pyrolysis of lignocellulosic biomass to high-grade bio-oil and bio-chemicals. Renew. Sustain. Energy Rev. 2017, 70, 945–967. [Google Scholar] [CrossRef]
- Chen, X.; Che, Q.; Li, S.; Liu, Z.; Yang, H.; Chen, Y.; Wang, X.; Shao, J.; Chen, H. Recent developments in lignocellulosic biomass catalytic fast pyrolysis: Strategies for the optimization of bio-oil quality and yield. Fuel Process. Technol. 2019, 196, 106180. [Google Scholar] [CrossRef]
- Wang, W.; Lemaire, R.; Bensakhria, A.; Luart, D. Review on the catalytic effects of alkali and alkaline earth metals (AAEMs) including sodium, potassium, calcium and magnesium on the pyrolysis of lignocellulosic biomass and on the co-pyrolysis of coal with biomass. J. Anal. Appl. Pyrolysis 2022, 163, 105479. [Google Scholar] [CrossRef]
- Shimada, N.; Kawamoto, H.; Saka, S. Different action of alkali/alkaline earth metal chlorides on cellulose pyrolysis. J. Anal. Appl. Pyrolysis 2008, 81, 80–87. [Google Scholar] [CrossRef] [Green Version]
- Siriwardane, R.V.; Poston, J.A.; Robinson, C.; Simonyi, T. Effect of additives on decomposition of sodium carbonate: Precombustion CO2 capture sorbent regeneration. Energy Fuels 2011, 25, 1284–1293. [Google Scholar] [CrossRef]
- Hwang, H.; Oh, S.; Choi, I.-G.; Choi, J.W. Catalytic effects of magnesium on the characteristics of fast pyrolysis products—Bio-oil, bio-char, and non-condensed pyrolytic gas fractions. J. Anal. Appl. Pyrolysis 2015, 113, 27–34. [Google Scholar] [CrossRef]
- Eschenbacher, A.; Fennell, P.; Jensen, A.D. A review of recent research on catalytic biomass pyrolysis and low-pressure hydropyrolysis. Energy Fuels 2021, 35, 18333–18369. [Google Scholar] [CrossRef]
- Nowakowski, D.J.; Jones, J.M.; Brydson, R.M.D.; Ross, A.B. Potassium catalysis in the pyrolysis behaviour of short rotation willow coppice. Fuel 2007, 86, 2389–2402. [Google Scholar] [CrossRef]
- Han, L.; Wang, Q.; Ma, Q.; Yu, C.; Luo, Z.; Cen, K. Influence of CaO additives on wheat-straw pyrolysis as determined by TG-FTIR analysis. J. Anal. Appl. Pyrolysis 2010, 88, 199–206. [Google Scholar] [CrossRef]
- Wu, H.; Zhao, Z.; Zhang, W.; Li, H.; He, F. Effects of alkali/alkaline earth metals on pyrolysis characteristics of cellulose. Trans. CSAE 2012, 28, 215–220. [Google Scholar]
- Wu, H.; Li, H.; Zhao, Z. The effect of potassium on pyrolysis characteristics of cellulose. Acta Energ. Sol. Sin. 2010, 31, 1537–1542. [Google Scholar]
- Zhou, L.; Jia, Y.; Nguyen, T.-H.; Adesina, A.A.; Liu, Z. Hydropyrolysis characteristics and kinetics of potassium-impregnated pine wood. Fuel Process. Technol. 2013, 116, 149–157. [Google Scholar] [CrossRef] [Green Version]
- Wang, W.; Lemaire, R.; Bensakhria, A.; Luart, D. Thermogravimetric analysis and kinetic modeling of the co-pyrolysis of a bituminous coal and poplar wood. Chin. J. Chem. Eng. 2022, in press. [Google Scholar] [CrossRef]
- Wang, W.; Lemaire, R.; Bensakhria, A.; Luart, D. Thermogravimetric analysis and kinetic modeling of the AAEM-catalyzed pyrolysis of woody biomass. Molecules 2022, 27, 7662. [Google Scholar] [CrossRef]
- Trubetskaya, A.; Larsen, F.H.; Shchukarev, A.; Ståhl, K.; Umeki, K. Potassium and soot interaction in fast biomass pyrolysis at high temperatures. Fuel 2018, 225, 89–94. [Google Scholar] [CrossRef] [Green Version]
- Wang, M.; Tian, J.; Roberts, D.G.; Chang, L.; Xie, K. Interactions between corncob and lignite during temperature-programmed co-pyrolysis. Fuel 2015, 142, 102–108. [Google Scholar] [CrossRef]
- Rabemanolontsoa, H.; Saka, S. Comparative study on chemical composition of various biomass species. RSC Adv. 2013, 3, 3946–3956. [Google Scholar] [CrossRef] [Green Version]
- Ding, Y.; Ezekoye, O.A.; Lu, S.; Wang, C. Thermal degradation of beech wood with thermogravimetry/Fourier transform infrared analysis. Energy Convers. Manag. 2016, 120, 370–377. [Google Scholar] [CrossRef]
- Pointner, M.; Kuttner, P.; Obrlik, T.; Jäger, A.; Kahr, H. Composition of corncob as a substrate for fermentation of biofuels. Agron. Res. 2014, 12, 391–396. [Google Scholar]
- Singh, H.K.; Patil, T.; Vineeth, S.; Das, S.K.; Pramanik, A.; Mhaske, S.T. Isolation of microcrystalline cellulose from corn stover with emphasis on its constituents: Corn cover and corn cob. Mater. Today Proc. 2020, 27, 589–594. [Google Scholar] [CrossRef]
- Wang, J.; Zhang, M.; Chen, M.; Min, F.; Zhang, S.; Ren, Z.; Yan, Y. Catalytic effects of six inorganic compounds on pyrolysis of three kinds of biomass. Thermochim. Acta 2006, 444, 110–114. [Google Scholar] [CrossRef]
- Chen, M.; Wang, J.; Zhang, M.; Chen, M.; Zhu, X.; Min, F.; Tan, Z. Catalytic effects of eight inorganic additives on pyrolysis of pine wood sawdust by microwave heating. J. Anal. Appl. Pyrolysis 2008, 82, 145–150. [Google Scholar] [CrossRef]
- Yu, Y.; Liu, D.; Wu, H. Formation and characteristics of reaction intermediates from the fast pyrolysis of NaCl- and MgCl2-loaded celluloses. Energy Fuels 2014, 28, 245–253. [Google Scholar] [CrossRef]
- Wang, W.-L.; Ren, X.-Y.; Li, L.-F.; Chang, J.-M.; Cai, L.-P.; Geng, J. Catalytic effect of metal chlorides on analytical pyrolysis of alkali lignin. Fuel Process. Technol. 2015, 134, 345–351. [Google Scholar] [CrossRef]
- Zhou, W.; Bai, B.; Chen, G.; Ma, L.; Jing, D.; Yan, B. Study on catalytic properties of potassium carbonate during the process of sawdust pyrolysis. Int. J. Hydrogen Energy 2018, 43, 13829–13841. [Google Scholar] [CrossRef]
- Safar, M.; Lin, B.-J.; Chen, W.-H.; Langauer, D.; Chang, J.-S.; Raclavska, H.; Pétrissans, A.; Rousset, P.; Pétrissans, M. Catalytic effects of potassium on biomass pyrolysis, combustion and torrefaction. Appl. Energy 2019, 235, 346–355. [Google Scholar] [CrossRef]
- Haddad, K.; Jeguirim, M.; Jellali, S.; Guizani, C.; Delmotte, L.; Bennici, S.; Limousy, L. Combined NMR structural characterization and thermogravimetric analyses for the assessment of the AAEM effect during lignocellulosic biomass pyrolysis. Energy 2017, 134, 10–23. [Google Scholar] [CrossRef]
- dos Santos, J.C.; Siqueira, R.L.; Vieira, L.M.G.; Freire, R.T.S.; Mano, V.; Panzera, T.H. Effects of sodium carbonate on the performance of epoxy and polyester coir-reinforced composites. Polym. Test. 2018, 67, 533–544. [Google Scholar] [CrossRef]
- Guo, F.; Liu, Y.; Wang, Y.; Li, X.; Li, T.; Guo, C. Pyrolysis kinetics and behavior of potassium-impregnated pine wood in TGA and a fixed-bed reactor. Energy Convers. Manag. 2016, 130, 184–191. [Google Scholar] [CrossRef]
- Qin, Q.; Zhou, J.; Lin, B.; Xie, C.; Zhou, L. Influence of coal ash on the characteristics of corn straw pyrolysis products. Bioresour. Technol. 2020, 318, 124055. [Google Scholar] [CrossRef] [PubMed]
- Vyazovkin, S.; Burnham, A.K.; Criado, J.M.; Pérez-Maqueda, L.A.; Popescu, C.; Sbirrazzuoli, N. ICTAC Kinetics Committee recommendations for performing kinetic computations on thermal analysis data. Thermochim. Acta 2011, 520, 1–19. [Google Scholar] [CrossRef]
- Vyazovkin, S.; Chrissafis, K.; Di Lorenzo, M.L.; Koga, N.; Pijolat, M.; Roduit, B.; Sbirrazzuoli, N.; Suñol, J.J. ICTAC Kinetics Committee recommendations for collecting experimental thermal analysis data for kinetic computations. Thermochim. Acta 2014, 590, 1–23. [Google Scholar] [CrossRef]
- Ye, J.; Jin, C.; Song, P.; Wu, Q. Pyrolysis kinetics of alkali lignin catalyzed by sodium carbonate. Chem. Ind. For. Prod. 2010, 30, 40–44. [Google Scholar]
- Varma, A.K.; Mondal, P. Physicochemical characterization and kinetic study of pine needle for pyrolysis process. J. Therm. Anal. Calorim. 2016, 124, 487–497. [Google Scholar] [CrossRef]
- Loy, A.C.M.; Yusup, S.; Chin, B.L.F.; Gan, D.K.W.; Shahbaz, M.; Acda, M.N.; Unrean, P.; Rianawati, E. Comparative study of in-situ catalytic pyrolysis of rice husk for syngas production: Kinetics modelling and product gas analysis. J. Clean. Prod. 2018, 197, 1231–1243. [Google Scholar] [CrossRef]
- Mian, I.; Li, X.; Jian, Y.; Dacres, O.D.; Zhong, M.; Liu, J.; Ma, F.; Rahman, N. Kinetic study of biomass pellet pyrolysis by using distributed activation energy model and Coats Redfern methods and their comparison. Bioresour. Technol. 2019, 294, 122099. [Google Scholar] [CrossRef]
- Gupta, A.; Thengane, S.K.; Mahajani, S. Kinetics of pyrolysis and gasification of cotton stalk in the central parts of India. Fuel 2020, 263, 116752. [Google Scholar] [CrossRef]
- Sattar, H.; Muzaffar, I.; Munir, S. Thermal and kinetic study of rice husk, corn cobs, peanut crust and Khushab coal under inert (N2) and oxidative (dry air) atmospheres. Renew. Energy 2020, 149, 794–805. [Google Scholar] [CrossRef]
- Xiao, R.; Yang, W.; Cong, X.; Dong, K.; Xu, J.; Wang, D.; Yang, X. Thermogravimetric analysis and reaction kinetics of lignocellulosic biomass pyrolysis. Energy 2020, 201, 117537. [Google Scholar] [CrossRef]
- Zhu, L.; Zhong, Z. Effects of cellulose, hemicellulose and lignin on biomass pyrolysis kinetics. Korean J. Chem. Eng. 2020, 37, 1660–1668. [Google Scholar] [CrossRef]
- Sahoo, A.; Kumar, S.; Kumar, J.; Bhaskar, T. A detailed assessment of pyrolysis kinetics of invasive lignocellulosic biomasses (Prosopis juliflora and Lantana camara) by thermogravimetric analysis. Bioresour. Technol. 2021, 319, 124060. [Google Scholar] [CrossRef] [PubMed]
- Li, J.; Dou, B.; Zhang, H.; Zhang, H.; Chen, H.; Xu, Y. Thermochemical characteristics and non-isothermal kinetics of camphor biomass waste. J. Environ. Chem. Eng. 2021, 9, 105311. [Google Scholar] [CrossRef]
- Wang, W.; Lemaire, R. Global kinetic modeling of the devolatilization of pulverized coal and poplar wood in a thermogravimetric analyzer and a flat flame reactor. In Proceedings of the Combustion Institute—Canadian Section, Spring Technical Meeting, Ottawa, ON, Canada, 16–19 May 2022. [Google Scholar]
- Coats, A.W.; Redfern, J.P. Kinetic parameters from thermogravimetric data. Nature 1964, 201, 68–69. [Google Scholar] [CrossRef]
- Helsen, L.; Van den Bulck, E. Kinetics of the low-temperature pyrolysis of chromated copper arsenate-treated wood. J. Anal. Appl. Pyrolysis 2000, 53, 51–79. [Google Scholar] [CrossRef]
- Chen, Z.; Hu, M.; Zhu, X.; Guo, D.; Liu, S.; Hu, Z.; Xiao, B.; Wang, J.; Laghari, M. Characteristics and kinetic study on pyrolysis of five lignocellulosic biomass via thermogravimetric analysis. Bioresour. Technol. 2015, 192, 441–450. [Google Scholar] [CrossRef]
- Zhao, N.; Li, B.-X. The effect of sodium chloride on the pyrolysis of rice husk. Appl. Energy 2016, 178, 346–352. [Google Scholar] [CrossRef]
- Peng, C.; Zhang, G.; Yue, J.; Xu, G. Pyrolysis of lignin for phenols with alkaline additive. Fuel Process. Technol. 2014, 124, 212–221. [Google Scholar] [CrossRef]
- Rutkowski, P. Pyrolysis of cellulose, xylan and lignin with the K2CO3 and ZnCl2 addition for bio-oil production. Fuel Process. Technol. 2011, 92, 517–522. [Google Scholar] [CrossRef]
- Wang, Z.; Wang, F.; Cao, J.; Wang, J. Pyrolysis of pine wood in a slowly heating fixed-bed reactor: Potassium carbonate versus calcium hydroxide as a catalyst. Fuel Process. Technol. 2010, 91, 942–950. [Google Scholar] [CrossRef]
- Kastanaki, E.; Vamvuka, D.; Grammelis, P.; Kakaras, E. Thermogravimetric studies of the behavior of lignite–biomass blends during devolatilization. Fuel Process. Technol. 2002, 77–78, 159–166. [Google Scholar] [CrossRef]
- Yang, H.; Yan, R.; Chen, H.; Lee, D.H.; Zheng, C. Characteristics of hemicellulose, cellulose and lignin pyrolysis. Fuel 2007, 86, 1781–1788. [Google Scholar] [CrossRef]
- Mohammed, I.Y.; Abakr, Y.A.; Kazi, F.K.; Yusup, S.; Alshareef, I.; Chin, S.A. Comprehensive characterization of napier grass as a feedstock for thermochemical conversion. Energies 2015, 8, 3403–3417. [Google Scholar] [CrossRef] [Green Version]
- Modenbach, A.A.; Nokes, S.E. Effects of Sodium Hydroxide Pretreatment on Structural Components of Biomass. Trans. ASABE 2014, 57, 1187–1198. [Google Scholar] [CrossRef]
- Madorsky, S.L.; Hart, V.E.; Straus, S. Pyrolysis of cellulose in a vacuum. J. Res. Natl. Inst. Stand. Technol. 1956, 56, 343–354. [Google Scholar] [CrossRef]
- Patwardhan, P.R.; Satrio, J.A.; Brown, R.C.; Shanks, B.H. Influence of inorganic salts on the primary pyrolysis products of cellulose. Bioresour. Technol. 2010, 101, 4646–4655. [Google Scholar] [CrossRef]
- Kawamoto, H.; Yamamoto, D.; Saka, S. Influence of neutral inorganic chlorides on primary and secondary char formation from cellulose. J. Wood Sci. 2008, 54, 242–246. [Google Scholar] [CrossRef]
- Eom, I.-Y.; Kim, J.-Y.; Kim, T.-S.; Lee, S.-M.; Choi, D.; Choi, I.-G.; Choi, J.-W. Effect of essential inorganic metals on primary thermal degradation of lignocellulosic biomass. Bioresour. Technol. 2012, 104, 687–694. [Google Scholar] [CrossRef] [PubMed]
- Zhao, D.; Dai, Y.; Chen, K.; Sun, Y.; Yang, F.; Chen, K. Effect of potassium inorganic and organic salts on the pyrolysis kinetics of cigarette paper. J. Anal. Appl. Pyrolysis 2013, 102, 114–123. [Google Scholar] [CrossRef]
- Zhu, C.; Maduskar, S.; Paulsen, A.D.; Dauenhauer, P.J. Alkaline-earth-metal-catalyzed thin-film pyrolysis of cellulose. ChemCatChem 2016, 8, 818–829. [Google Scholar] [CrossRef]
- Leng, E.; Wang, Y.; Gong, X.; Zhang, B.; Zhang, Y.; Xu, M. Effect of KCl and CaCl2 loading on the formation of reaction intermediates during cellulose fast pyrolysis. Proc. Combust. Inst. 2017, 36, 2263–2270. [Google Scholar] [CrossRef]
- Santana, J.A.; Sousa, N.G.; Cardoso, C.R.; Carvalho, W.S.; Ataíde, C.H. Sodium, zinc and magnesium chlorides as additives for soybean hulls pyrolysis: Influence on the temperature range of reactions and product selectivity. J. Therm. Anal. Calorim. 2016, 125, 471–481. [Google Scholar] [CrossRef]
- Liu, D.; Yu, Y.; Long, Y.; Wu, H. Effect of MgCl2 loading on the evolution of reaction intermediates during cellulose fast pyrolysis at 325 °C. Proc. Combust. Inst. 2015, 35, 2381–2388. [Google Scholar] [CrossRef]
- Yang, C.; Yao, J.; Lin, W.; Ding, Y.; Liu, S. Influence of minerals on biomass pyrolysis and its solution. Chem. Bioeng. 2005, 10, 17–19. [Google Scholar]
- Wang, S.; Dai, G.; Yang, H.; Luo, Z. Lignocellulosic biomass pyrolysis mechanism: A state-of-the-art review. Prog. Energy Combust. Sci. 2017, 62, 33–86. [Google Scholar] [CrossRef]
- Naqvi, S.R.; Uemura, Y.; Osman, N.; Yusup, S. Kinetic study of the catalytic pyrolysis of paddy husk by use of thermogravimetric data and the Coats–Redfern model. Res. Chem. Intermed. 2015, 41, 9743–9755. [Google Scholar] [CrossRef]
- Balasundram, V.; Ibrahim, N.; Kasmani, R.M.; Hamid, M.K.A.; Isha, R.; Hasbullah, H.; Ali, R.R. Thermogravimetric catalytic pyrolysis and kinetic studies of coconut copra and rice husk for possible maximum production of pyrolysis oil. J. Clean. Prod. 2017, 167, 218–228. [Google Scholar] [CrossRef]
- Shimada, N.; Kawamoto, H.; Saka, S. Solid-state hydrolysis of cellulose and methyl α- and β-d-glucopyranosides in presence of magnesium chloride. Carbohydr. Res. 2007, 342, 1373–1377. [Google Scholar] [CrossRef] [PubMed] [Green Version]
- Xu, Y.; Zhang, Y.; Zhang, G.; Guo, Y.; Zhang, J.; Li, G. Pyrolysis characteristics and kinetics of two Chinese low-rank coals. J. Therm. Anal. Calorim. 2015, 122, 975–984. [Google Scholar] [CrossRef]
- Xing, L.; Qu, Y.; Wang, C.; Shao, L.; Zou, Z.; Song, W. Kinetic study on thermal decomposition behavior of hematite ore fines at high temperature. Metall. Mater. Trans. B 2020, 51, 395–406. [Google Scholar] [CrossRef]
- Zhang, H.; Dou, B.; Zhang, H.; Li, J.; Ruan, C.; Wu, C. Study on non-isothermal kinetics and the influence of calcium oxide on hydrogen production during bituminous coal pyrolysis. J. Anal. Appl. Pyrolysis 2020, 150, 104888. [Google Scholar] [CrossRef]
- Zhang, J.; Ding, Y.; Du, W.; Lu, K.; Sun, L. Study on pyrolysis kinetics and reaction mechanism of Beizao oil shale. Fuel 2021, 296, 120696. [Google Scholar] [CrossRef]
- Wu, H.; Li, H.; Zhao, Z. Thermogravimetric analysis and pyrolytic kinetic study on coal/biomass blends. J. Fuel Chem. Technol. 2009, 37, 538–545. [Google Scholar]


| Sample | Proximate Analysis | Ultimate Analysis | |||||||
|---|---|---|---|---|---|---|---|---|---|
| Fixed Carbon (wt%, db †) | Volatiles (wt%, db) | Ash (wt%, db) | C (wt%, daf ‡) | H (wt%, daf) | O * (wt%, daf) | N (wt%, daf) | S (wt%, daf) | Cl (wt%, daf) | |
| Beech wood | 14.36 | 84.48 | 1.16 | 51.6 | 5.4 | 43.0 | - | - | - |
| Corncob | 13.47 | 85.05 | 1.48 | 47.5 | 6.0 | 42.9 | 0.6 | 0.42 | 2.58 |
| Class of Reaction Model | Denomination | ||
|---|---|---|---|
| Order-based | Mampel first-order (F1) † | (1 − α)1 | −ln(1 − α) |
| nth-order (Fn) † | (1 − α)n | [1−(1 − α)1 − n]/(1 − n) | |
| Diffusion | 1-D diffusion(D1) † | 1/2 × α−1 | α2 |
| 2-D diffusion (D2) † | [−ln(1 − α)]−1 | (1 − α) × ln(1 − α) + α | |
| 3-D diffusion Jander (D3) † | 3/2 × (1 − α)2/3 × [1 − (1 − α)1/3]−1 | [1 − (1 − α)1/3]2 | |
| 3-D diffusion Ginstling-Brounshtein (D4) | 3/2 × [(1 − α)−1/3 − 1]−1 | 1 − 2/3 × α − (1 − α)2/3 | |
| Geometrical contraction | Contracting cylinder (R2) † | 2 × (1 − α)1/2 | 1 − (1 − α)1/2 |
| Contracting sphere (R3) † | 3 × (1 − α)2/3 | 1 − (1 − α)1/3 | |
| Nucleation | Avrami-Erofeev (A2) † | 2 × (1 − α) × [−ln(1 − α)]1/2 | [−ln(1 − α)]1/2 |
| Avrami-Erofeev (A3) † | 3 × (1 − α) × [−ln(1 − α)]2/3 | [−ln(1 − α)]1/3 | |
| Avrami-Erofeev (A4) † | 4 × (1 − α) × [−ln(1 − α)]3/4 | [−ln(1 − α)]1/4 | |
| Power law | 2-Power law (P2) † | 2 × α1/2 | α1/2 |
| 3-Power law (P3) | 3 × α2/3 | α1/3 | |
| 4-Power law (P4) | 4 × α3/4 | α1/4 |
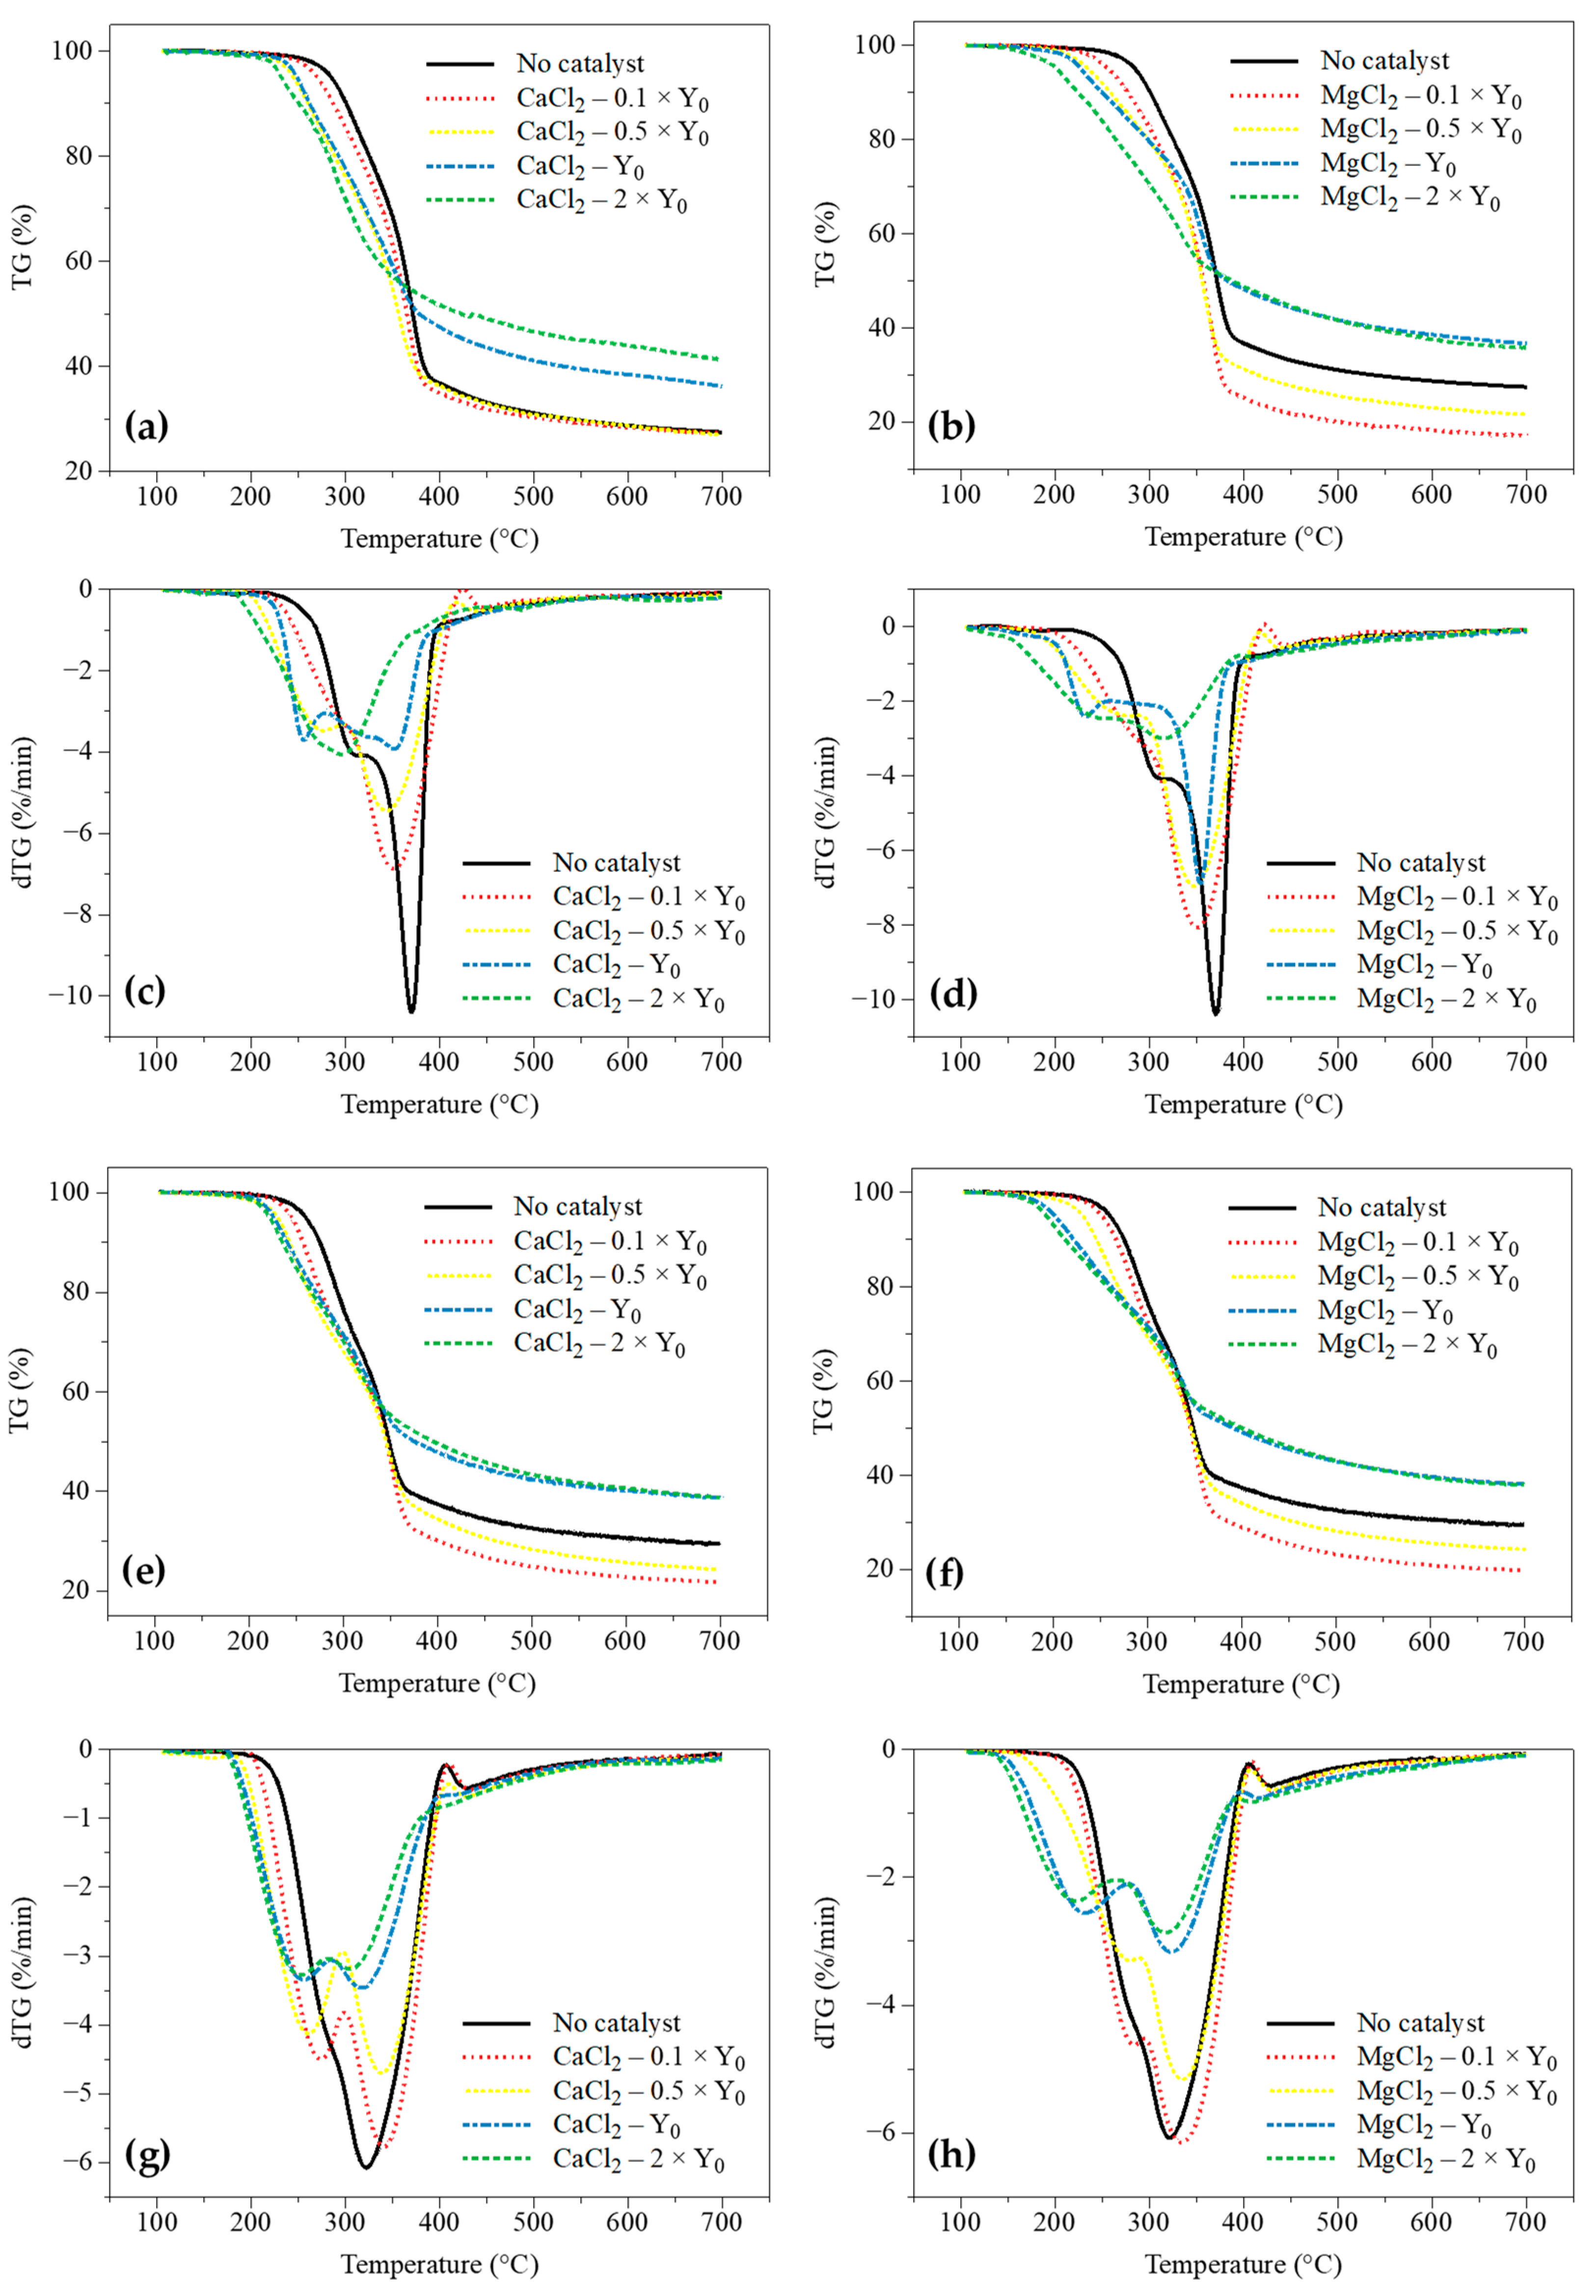
| Sample | dTGmax (wt%/min) | Ti (°C) | Tf (°C) | Tp (°C) |
|---|---|---|---|---|
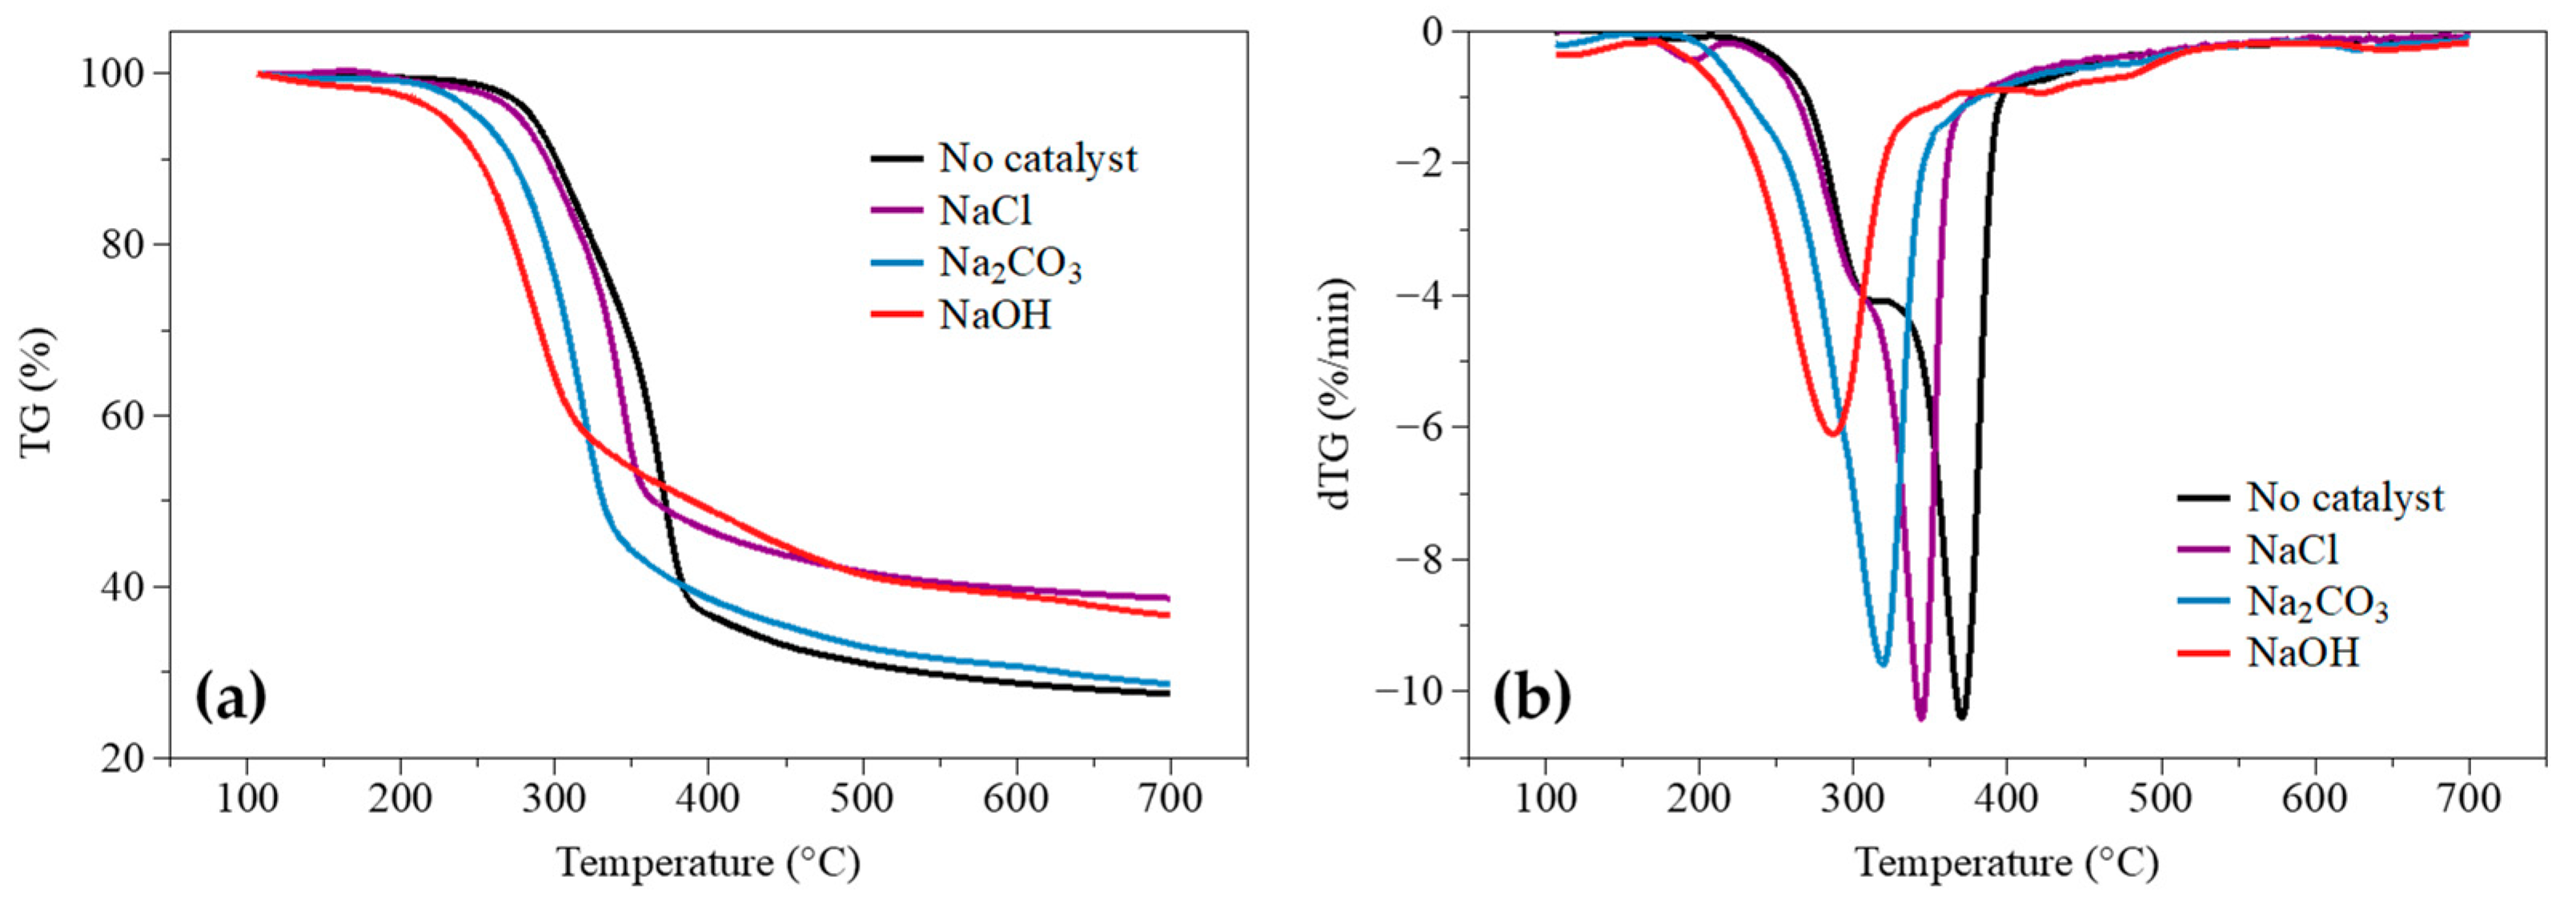
| Beech wood | −4.09 †; −10.37 | 293 | 380 | 322 †; 371 |
| Beech wood + NaCl | −4.05 †; −10.38 | 281 | 359 | 307 †; 344 |
| Beech wood + Na2CO3 | −9.60 | 261 | 359 | 319 |
| Beech wood + NaOH | −6.11 | 235 | 398 | 287 |
| Sample | dTGmax (wt%/min) | Ti (°C) | Tf (°C) | Tp (°C) |
|---|---|---|---|---|
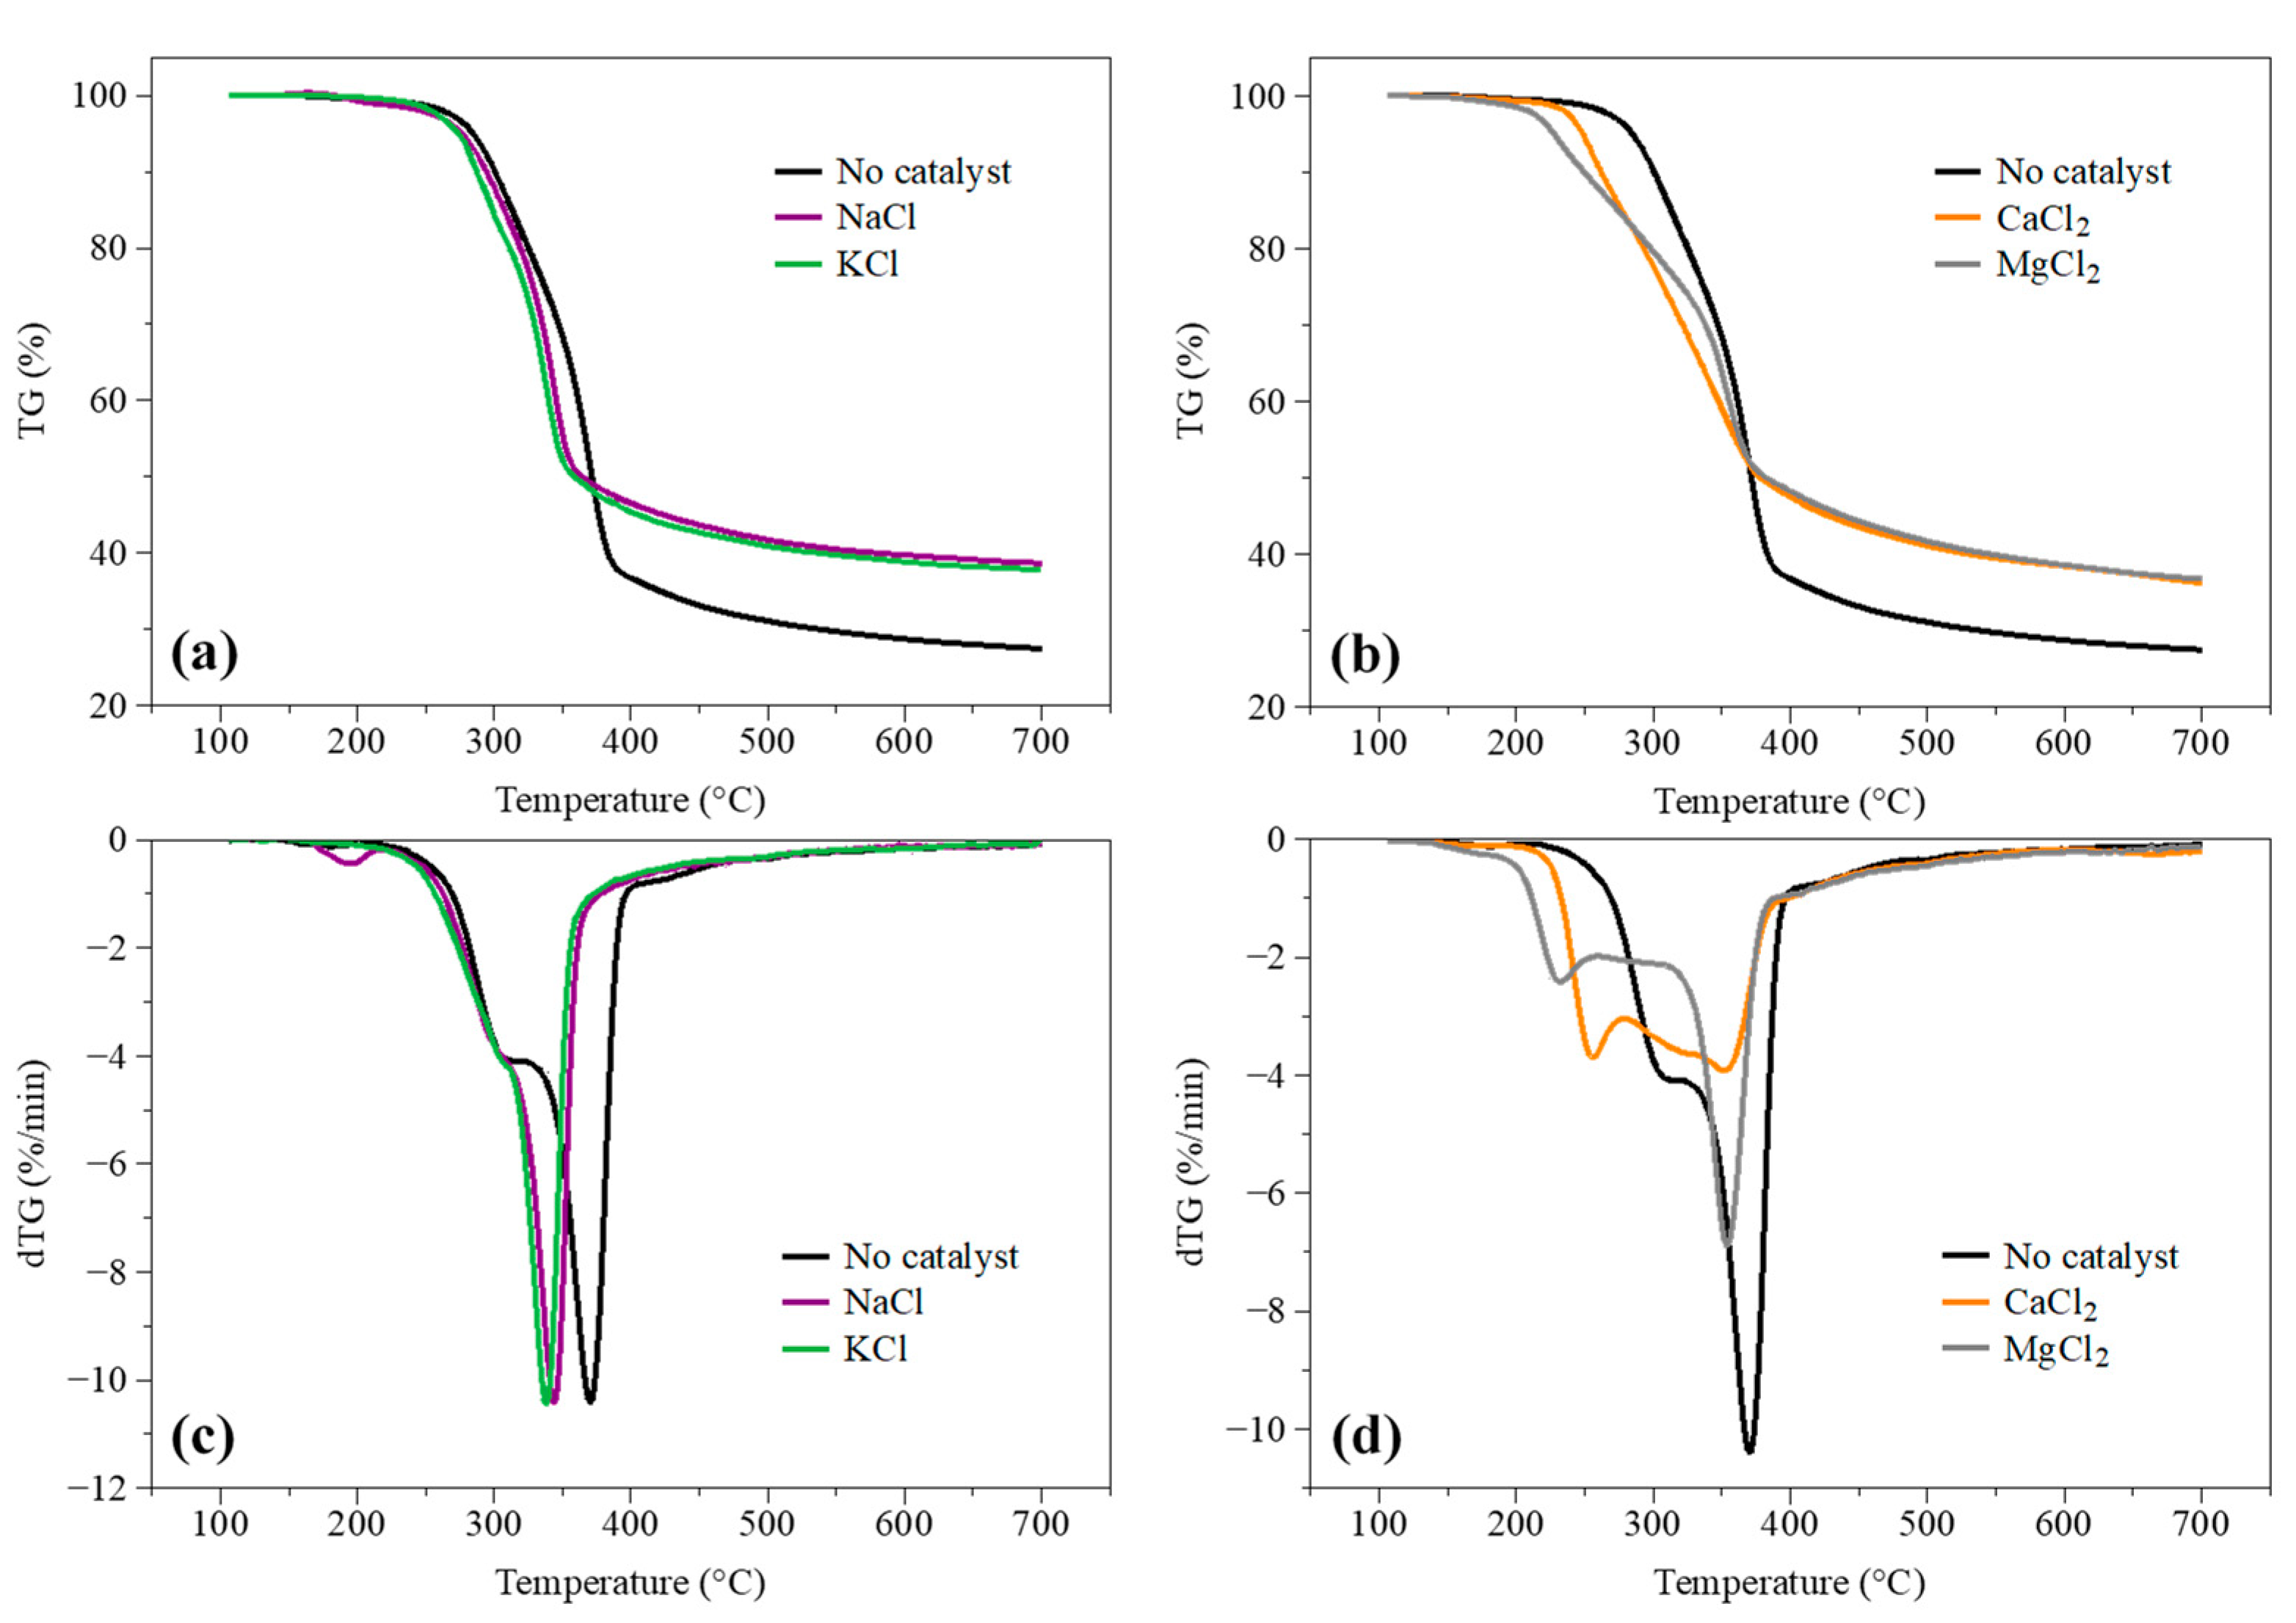
| Beech wood | −4.09 †; −10.37 | 293 | 380 | 322 †; 371 |
| Beech wood + NaCl | −4.04 †; −10.38 | 281 | 359 | 307 †; 344 |
| Beech wood + KCl | −4.13 †; −10.45 | 278 | 356 | 306 †; 338 |
| Beech wood + CaCl2 | −3.67 †; −3.88 | 252 | 385 | 258 †; 355 |
| Beech wood + MgCl2 | −2.40 †; −6.83 | 233 | 388 | 234 †; 355 |
| Sample | dTGmax (wt%/min) | Ti (°C) | Tf (°C) | Tp (°C) |
|---|---|---|---|---|
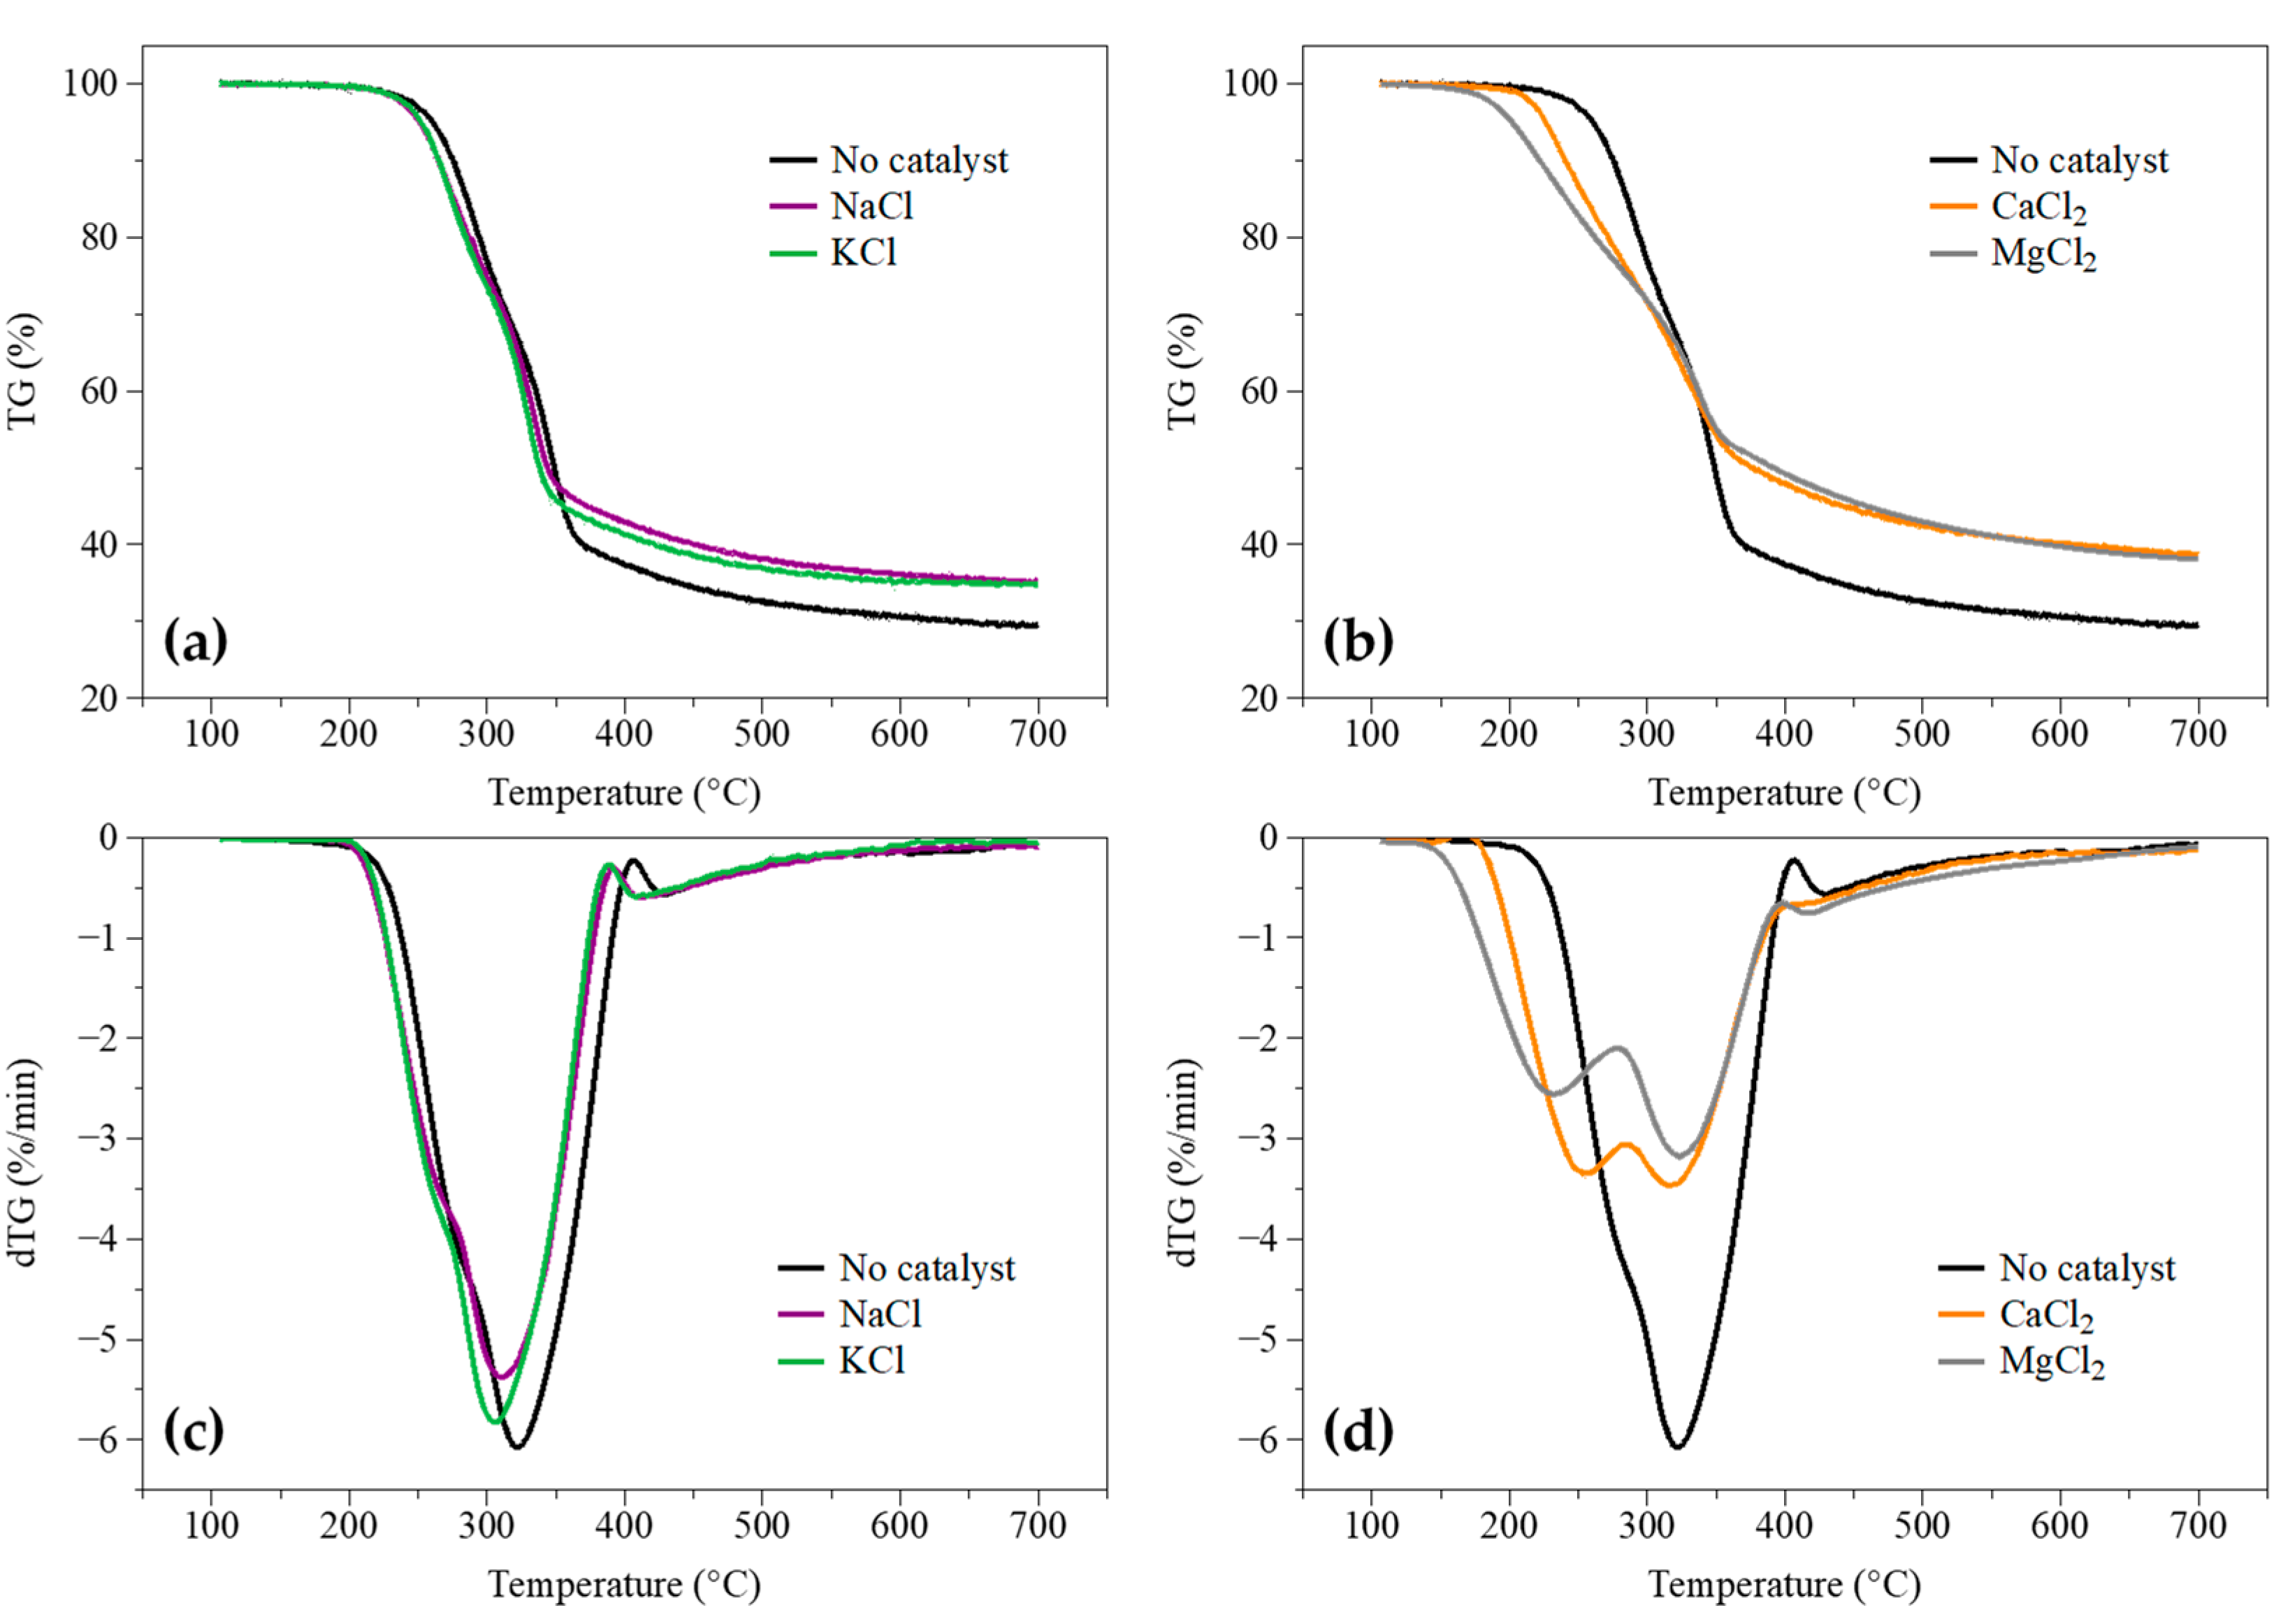
| Corncob | −4.22 †, −6.07 | 268 | 357 | 282 †, 321 |
| Corncob + NaCl | −3.79 †, −5.38 | 256 | 349 | 275 †, 311 |
| Corncob + KCl | −3.93 †, −5.83 | 257 | 342 | 271 †, 305 |
| Corncob + CaCl2 | −3.35 †, −3.46 | 230 | 367 | 256 †, 318 |
| Corncob + MgCl2 | −2.55 †, −3.15 | 207 | 386 | 234 †, 327 |
| Sample | dTGmax (wt%/min) | Ti (°C) | Tf (°C) | Tp (°C) | (s−1) | R2 | |
|---|---|---|---|---|---|---|---|
| Beech wood | |||||||
| No catalyst | −4.09 †; −10.37 | 293 | 380 | 322 †; 371 | 150.1 | 1.02 × 10⁹ | 0.9928 |
| CaCl2—0.1 × Y0 | −3.45 †; −6.87 | 279 | 374 | 304 †; 352 | 130.9 | 3.14 × 10⁷ | 0.9933 |
| CaCl2—0.5 × Y0 | −3.48 †; −5.45 | 252 | 369 | 275 †; 344 | 101.8 | 1.05 × 10⁵ | 0.9840 |
| CaCl2—Y0 | −3.67 †; −3.88 | 252 | 385 | 258 †; 355 | 89.4 | 1.17 × 10⁴ | 0.9829 |
| CaCl2—2 × Y0 | −4.06 | 235 | 385 | 296 | 81.3 | 3.41 × 10³ | 0.9474 |
| MgCl2—0.1 × Y0 | −3.19 †; −8.04 | 271 | 371 | 294 †; 353 | 122.9 | 6.46 × 10⁶ | 0.9902 |
| MgCl2—0.5 × Y0 | −2.39 †; −6.97 | 249 | 369 | 280 †; 347 | 94.4 | 2.30 × 10⁴ | 0.9765 |
| MgCl2—Y0 | −2.40 †; −6.83 | 233 | 388 | 234 †; 355 | 75.2 | 5.09 × 10² | 0.9849 |
| MgCl2—2 × Y0 | −2.45 †; −2.99 | 208 | 401 | 248 †; 315 | 58.5 | 2.35 × 101 | 0.9782 |
| Corncob | |||||||
| No catalyst | −4.22 †, −6.07 | 268 | 357 | 282 †, 321 | 132.5 | 1.15 × 10⁸ | 0.9788 |
| CaCl2—0.1 × Y0 | −4.50 †, −5.75 | 253 | 360 | 274 †, 344 | 95.7 | 5.51 × 10⁴ | 0.9638 |
| CaCl2—0.5 × Y0 | −4.13 †, −4.70 | 238 | 364 | 260 †, 339 | 78.2 | 1.63 × 10³ | 0.9596 |
| CaCl2—Y0 | −3,35 †, −3.46 | 230 | 367 | 256 †, 318 | 77.9 | 1.94 × 10³ | 0.9769 |
| CaCl2—2 × Y0 | −3.28 †, −3.19 | 226 | 386 | 251 †, 303 | 66.3 | 1.52 × 10² | 0.9540 |
| MgCl2—0.1 × Y0 | −4.62 †, −6.15 | 262 | 361 | 285 †, 335 | 113.1 | 1.81 × 10⁶ | 0.9727 |
| MgCl2—0.5 × Y0 | −3.30 †, −5.16 | 240 | 363 | 280 †, 334 | 83.4 | 4.61 × 10³ | 0.9815 |
| MgCl2—Y0 | −2.55 †, −3.15 | 207 | 386 | 234 †, 327 | 59.1 | 2.99 × 101 | 0.9831 |
| MgCl2—2 × Y0 | −2.36 †, −2.87 | 198 | 397 | 229 †, 319 | 49.6 | 3.65 × 100 | 0.9876 |
Publisher’s Note: MDPI stays neutral with regard to jurisdictional claims in published maps and institutional affiliations. |
© 2022 by the authors. Licensee MDPI, Basel, Switzerland. This article is an open access article distributed under the terms and conditions of the Creative Commons Attribution (CC BY) license (https://creativecommons.org/licenses/by/4.0/).
Share and Cite
Wang, W.; Lemaire, R.; Bensakhria, A.; Luart, D. Analysis of the Catalytic Effects Induced by Alkali and Alkaline Earth Metals (AAEMs) on the Pyrolysis of Beech Wood and Corncob. Catalysts 2022, 12, 1505. https://doi.org/10.3390/catal12121505
Wang W, Lemaire R, Bensakhria A, Luart D. Analysis of the Catalytic Effects Induced by Alkali and Alkaline Earth Metals (AAEMs) on the Pyrolysis of Beech Wood and Corncob. Catalysts. 2022; 12(12):1505. https://doi.org/10.3390/catal12121505
Chicago/Turabian StyleWang, Wei, Romain Lemaire, Ammar Bensakhria, and Denis Luart. 2022. "Analysis of the Catalytic Effects Induced by Alkali and Alkaline Earth Metals (AAEMs) on the Pyrolysis of Beech Wood and Corncob" Catalysts 12, no. 12: 1505. https://doi.org/10.3390/catal12121505