Article

Influence of Components Deposition Order on Silver Species Formation in Bimetallic Ag-Fe System Supported on Mordenite

by
Perla Sánchez-López
1,
Yulia Kotolevich
1,*,
Joel Antúnez-García
1,*,
Fernando Chávez-Rivas
2,
Evgeny Khramov
3,
Gloria Berlier
4,
Luis Moreno-Ruiz
5,
Yan Zubavichus
6,
Vitalii Petranovskii
1,
Sergio Fuentes-Moyado
1 and
Alexey Pestryakov
7,*
1
Centro de Nanociencias y Nanotecnología, Universidad Nacional Autónoma de México, Ensenada 22860, Mexico
2
Escuela Superior de Física y Matemáticas, Instituto Politécnico Nacional, Mexico City 07738, Mexico
3
National Research Center “Kurchatov Institute”, 123182 Moscow, Russia
4
Department of Chemistry and NIS Centre, University of Turin, Via P. Giuria 7, 10125 Turin, Italy
5
Centro de Nanociencias y Micro y Nanotecnologías, Instituto Politécnico Nacional, Mexico City 07738, Mexico
6
Boreskov Institute of Catalysis, Siberian Branch, Russian Academy of Sciences, 630090 Novosibirsk, Russia
7
Research School of Chemistry and Applied Biomedical Sciences, Tomsk Polytechnic University, 634050 Tomsk, Russia
*
Authors to whom correspondence should be addressed.
Catalysts 2022, 12(11), 1453; https://doi.org/10.3390/catal12111453
Submission received: 14 October 2022 / Revised: 7 November 2022 / Accepted: 8 November 2022 / Published: 17 November 2022
(This article belongs to the Special Issue Advances in Transition Metal Catalysis)

Abstract

:
In the present work, various experimental and theoretical methods were combined to study in detail the modifying effect of differences in the order of deposition of components on the state of silver in bimetallic iron–silver samples based on mordenite. In each of the silver-containing samples, the formation of large (≥2 nm in diameter) varieties of silver was observed, which differed from the varieties in the other samples, and in varying degrees. The formation of large Ag NPs on the outer surface of mordenite is explained by the redox interaction of Ag+-Fe2+ and the selectivity of ion exchange. The local surrounding of Ag in the studied samples is different: for AgMOR—monatomic species dominate, FeAgMOR—silver dimers and AgFeMOR—metal particles. In all investigated samples, the partially charged intra-channel Agnδ+ clusters (~0.7 nm in size) were formed due to partial Ag+ reduction and subsequent Ag0 agglomeration into the mordenite channel. Most of the silver in the bulk of the zeolite is represented in the cationic state attached to the mordenite framework by differently coordinated electrostatic forces, which can be Ag-O, Ag-Si or Ag-Al, with variations in interatomic distances and do not depend on the order of metal deposition. In addition, the arrangement of the cations in the side pockets means that the transport channels of mordenite are free, which is favorable for the application of the materials under study in catalysis and adsorption.

1. Introduction

Zeolites are excellent carriers for catalysts because they contribute to the stabilization of transition metal particles considering their peculiar structural characteristics, such as uniform cavities and pores [1], as well as the ability to change properties due to compositional variations, including ion exchange methods [2]. Being an active substrate, the surface of zeolites can form a variety of sites differing in properties, which make it possible to stabilize the active components consisting of transition metal atoms [3,4], and thus acting as a bifunctional (or even polyfunctional) catalyst [5,6]; different centers also interact with each other, increasing the number of particles under study. During the last decade, great efforts have been made to understand the nature of catalytically active forms of transition metals, such as individual atoms, ions, clusters, colloids, and nanoparticles (NPs) [7,8,9,10]. However, multicomponent zeolite catalysts still remain a challenge to study due to the numerous interactions between components.
Catalysis is vital to the global economy, but optimizing catalytic materials through rational manufacturing techniques has received relatively little attention. It is necessary to turn the “art of preparing catalysts” into a science. These efforts require an additional smart focus compared to the traditional «know-how» method. Undoubtedly, old-fashioned methods have made significant progress in modern analytical and computational methods for obtaining structural and functional dependencies: correlations of the physicochemical composition of catalytic materials at the atomic level with their reactivity. These studies tell us why a particular catalyst performs well or poorly, and in the best computational cases, what catalytic material should be prepared and with what arrangement of atoms.
How exactly to prepare such optimized materials is another story. The study of the synthesis of heterogeneous solids is interdisciplinary: materials science, colloid chemistry, physical chemistry, and in the case of zeolites, geochemistry. To eliminate empiricism in the development of catalysts, it is necessary to understand the fundamental origin of their structure; from the preceding preparation-structure relationship. To understand the nature of various physicochemical phenomena, especially those associated with ion exchange in zeolites, it is necessary to accurately establish the distribution of ion exchange cations in the pores and channels of zeolites. Recently, the distribution of aluminum in the framework, as well as non-framework Na+ cations for mordenite (MOR) zeolite, have been studied in detail and theoretically solved [11]. In the present study, given that the original mordenite is in the sodium form, and ion exchange for Ag+ and Fe2+ cations occur with Na+ cations, we will rely on the above work to interpret and substantiate our experimental observations.
Monometallic Ag and Fe systems on zeolites have been shown to be good prospects in such catalytic processes as selective catalytic NOx reduction (SCR-deNOx), capture and conversion of CO2, H2 production and activation, and conversion of CH4 [2,12]. In particular, in the deNOx reaction, silver species have been observed to exhibit activity at low (<300 °C) and high (>350 °C) temperatures, which is associated with a difference in active centers, which can be Ag+ ions, Ag clusters or nanoparticles in a reduced state [13,14]. The stabilization of silver species in the zeolitic framework is still under study [15], as well as their catalytic properties in deNOx. Regarding the iron species, it was shown that Fe2+/Fe3+ ions, Fe3+-O-Fe3+ dimers, iron complexes and oxides are very active above 300 °C in de-NOx [16,17,18]. In addition, Fe3+ replacing Al3+ in the zeolite framework should be considered as an active center in the de-NOx reaction [19]. According to our knowledge, the interaction between Ag and Fe in a bimetallic system in any support has not been elucidated. However, the Ag-Fe redox interaction may increase the efficiency and the operating temperature range in the deNOx reaction. Therefore, understanding the nature of the active species of Ag and Fe is fundamental for better design and optimization of bimetallic catalysts.
In our previous work, we reported that AgFe bimetallic system on mordenite is highly prospective in the low-temperature de-NOx process, and iron species are responsible for the catalytic activity [20]. Nevertheless, the presence of Ag affected the catalytic behavior of the material, and the impact of the order of the exchange of components on the properties of the catalysts was observed. Thus, the modifying influence of silver in AgFeMOR and FeAgMOR (samples in which the element whose symbol stands first in the formula entry was introduced first) requires a detailed study to understand the nature of the active centers. In accordance with our knowledge, there is no clear understanding of the interaction between Ag and Fe in a bimetallic system on any support. In [19], we shed light on active centers of AgFeMOR in de-NOx. It is logical to assume that by knowing the interaction mechanism between silver, iron and mordenite, the formation of active sites may be controlled and, potentially, improve the efficiency of the materials under study in de-NOx be improved.
This work is a continuation of our previous study of promising AgFeMOR-FeAgMOR de NOx catalysts [12,20], which combines theoretical and experimental methods. Here, the state of silver in AgFeMOR and FeAgMOR catalysts by changing the order of deposition of the components was studied. The aim of this work was to shed light on the effect of the order of deposition of components on the formation of silver species in a bimetallic Ag-Fe system supported on mordenite. It is known that the properties of mordenite depend on the Si/Al ratio in its framework, and the model with Si/Al = 7 ratio was utilized for the DFT calculations in this work as the closest to the real mordenite composition with Si/Al = 6.5 used in the experiments.

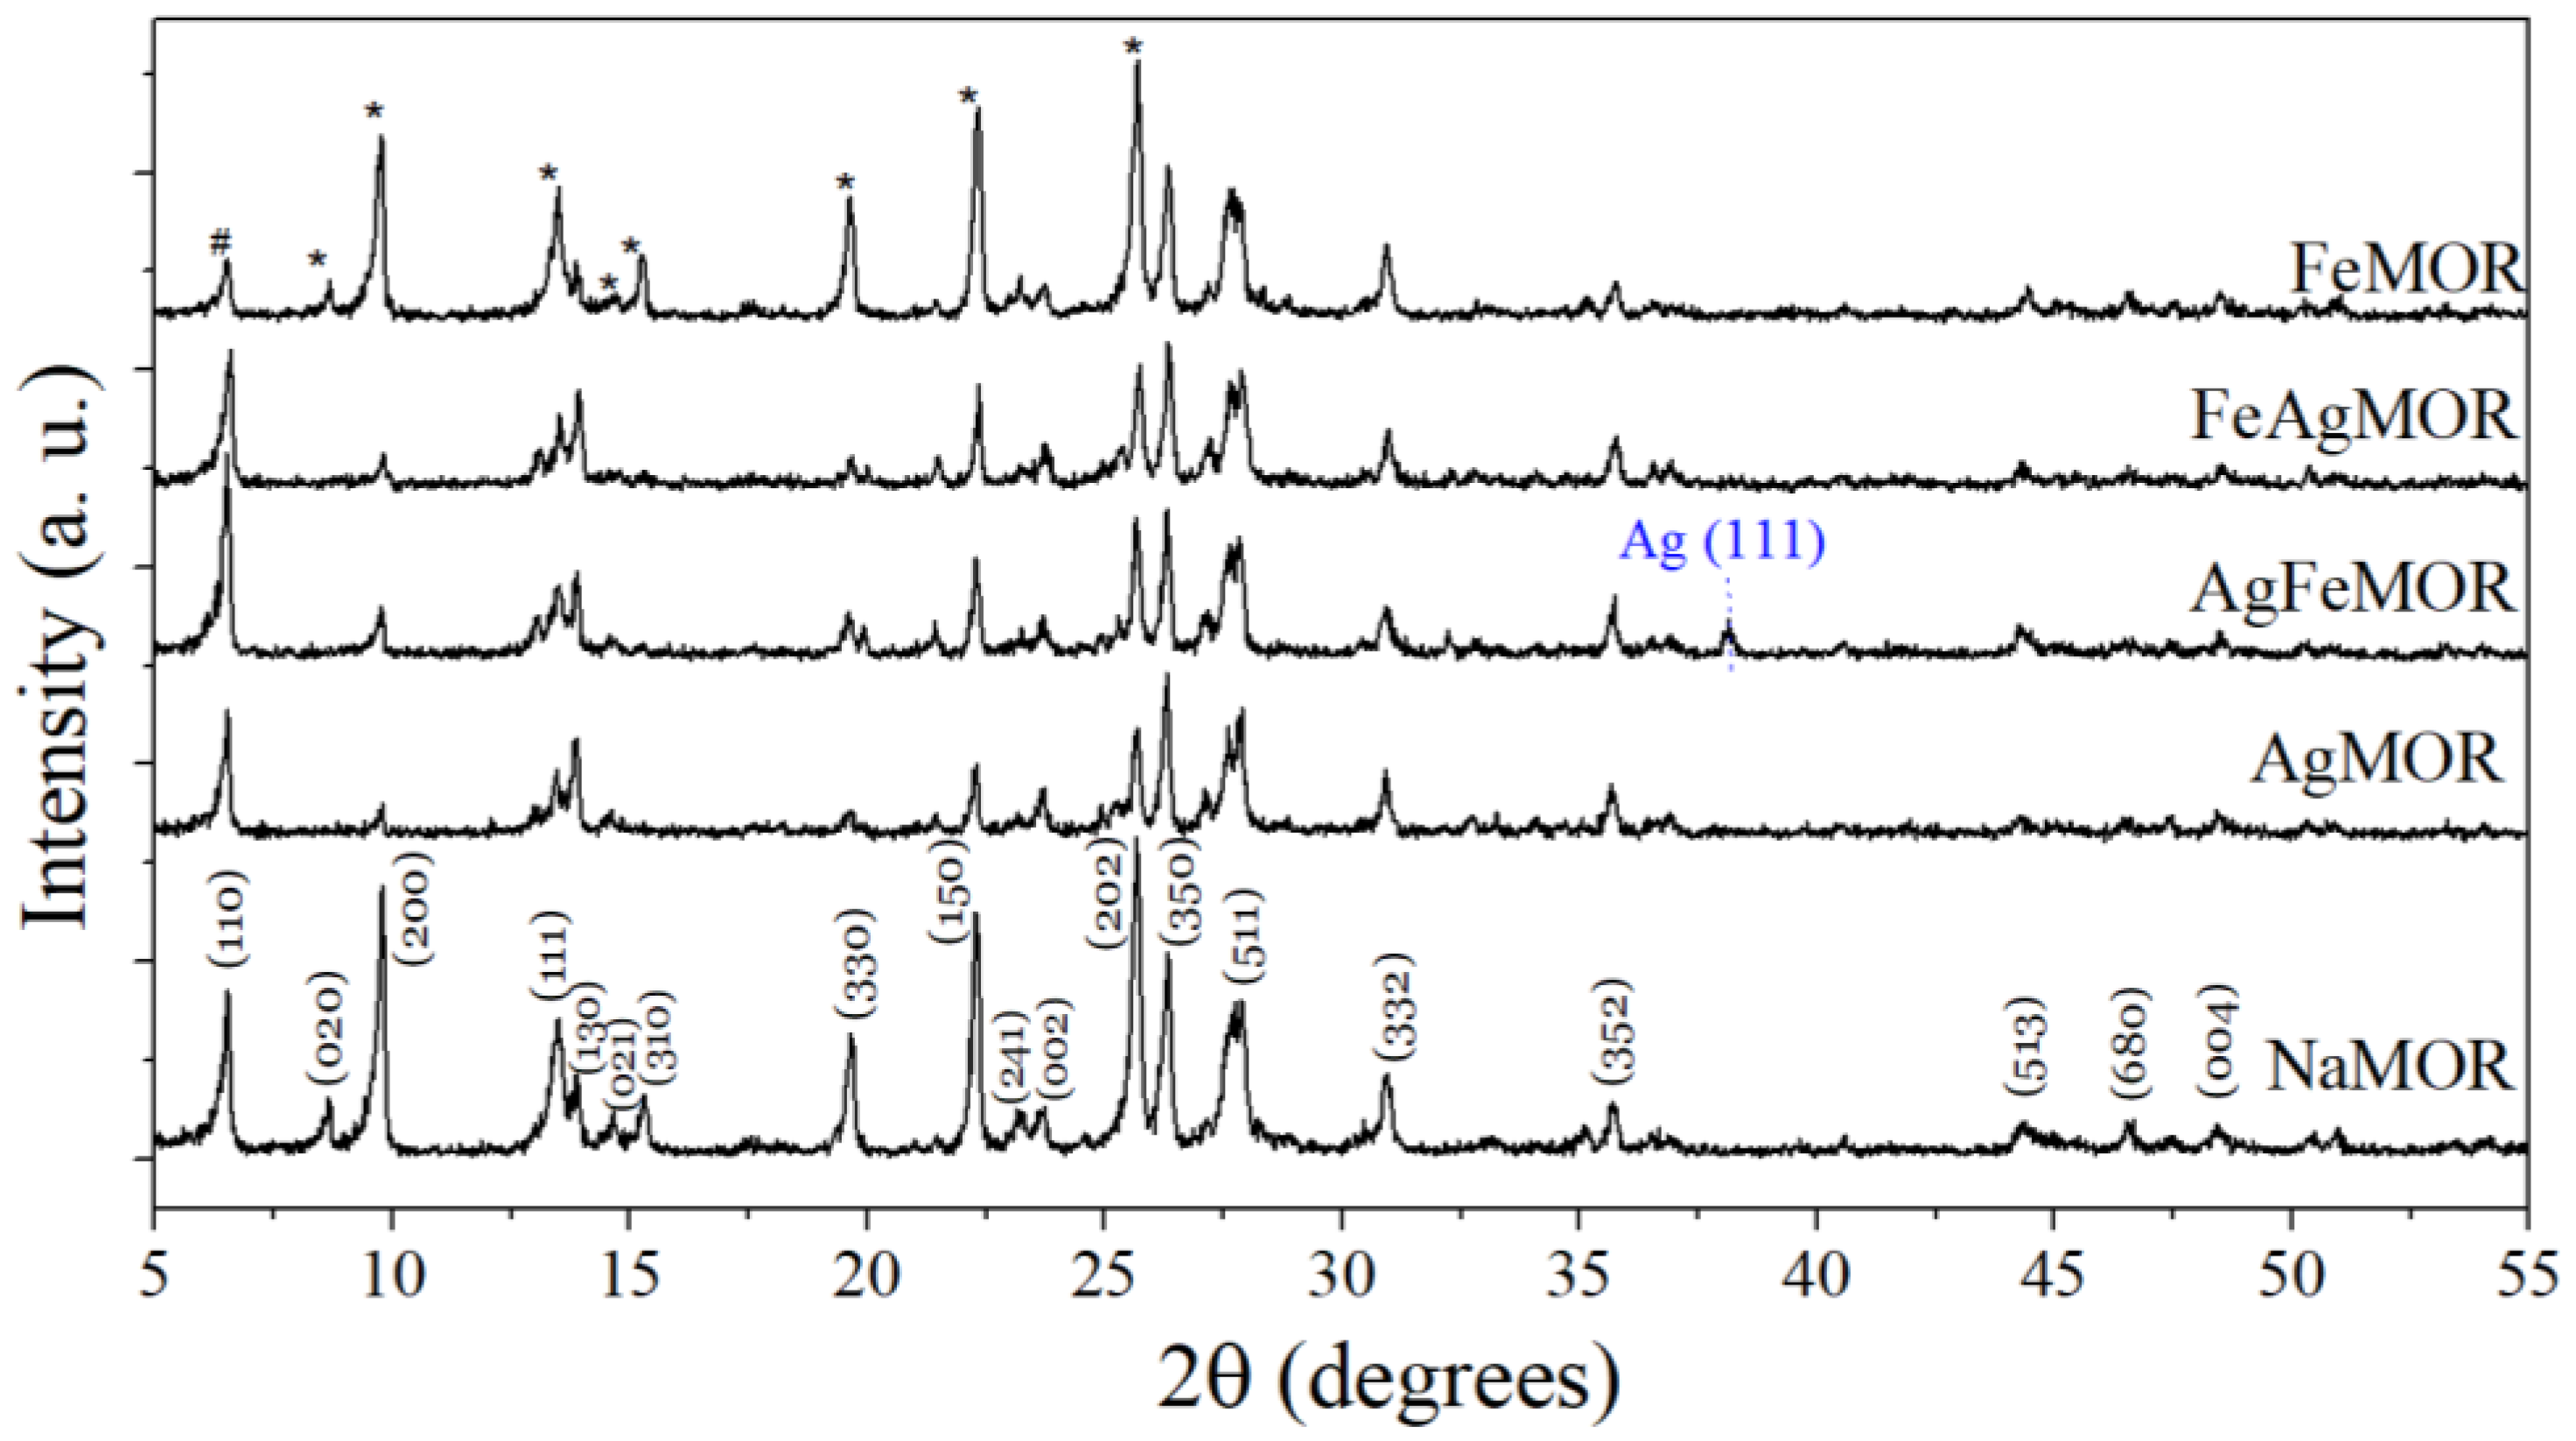
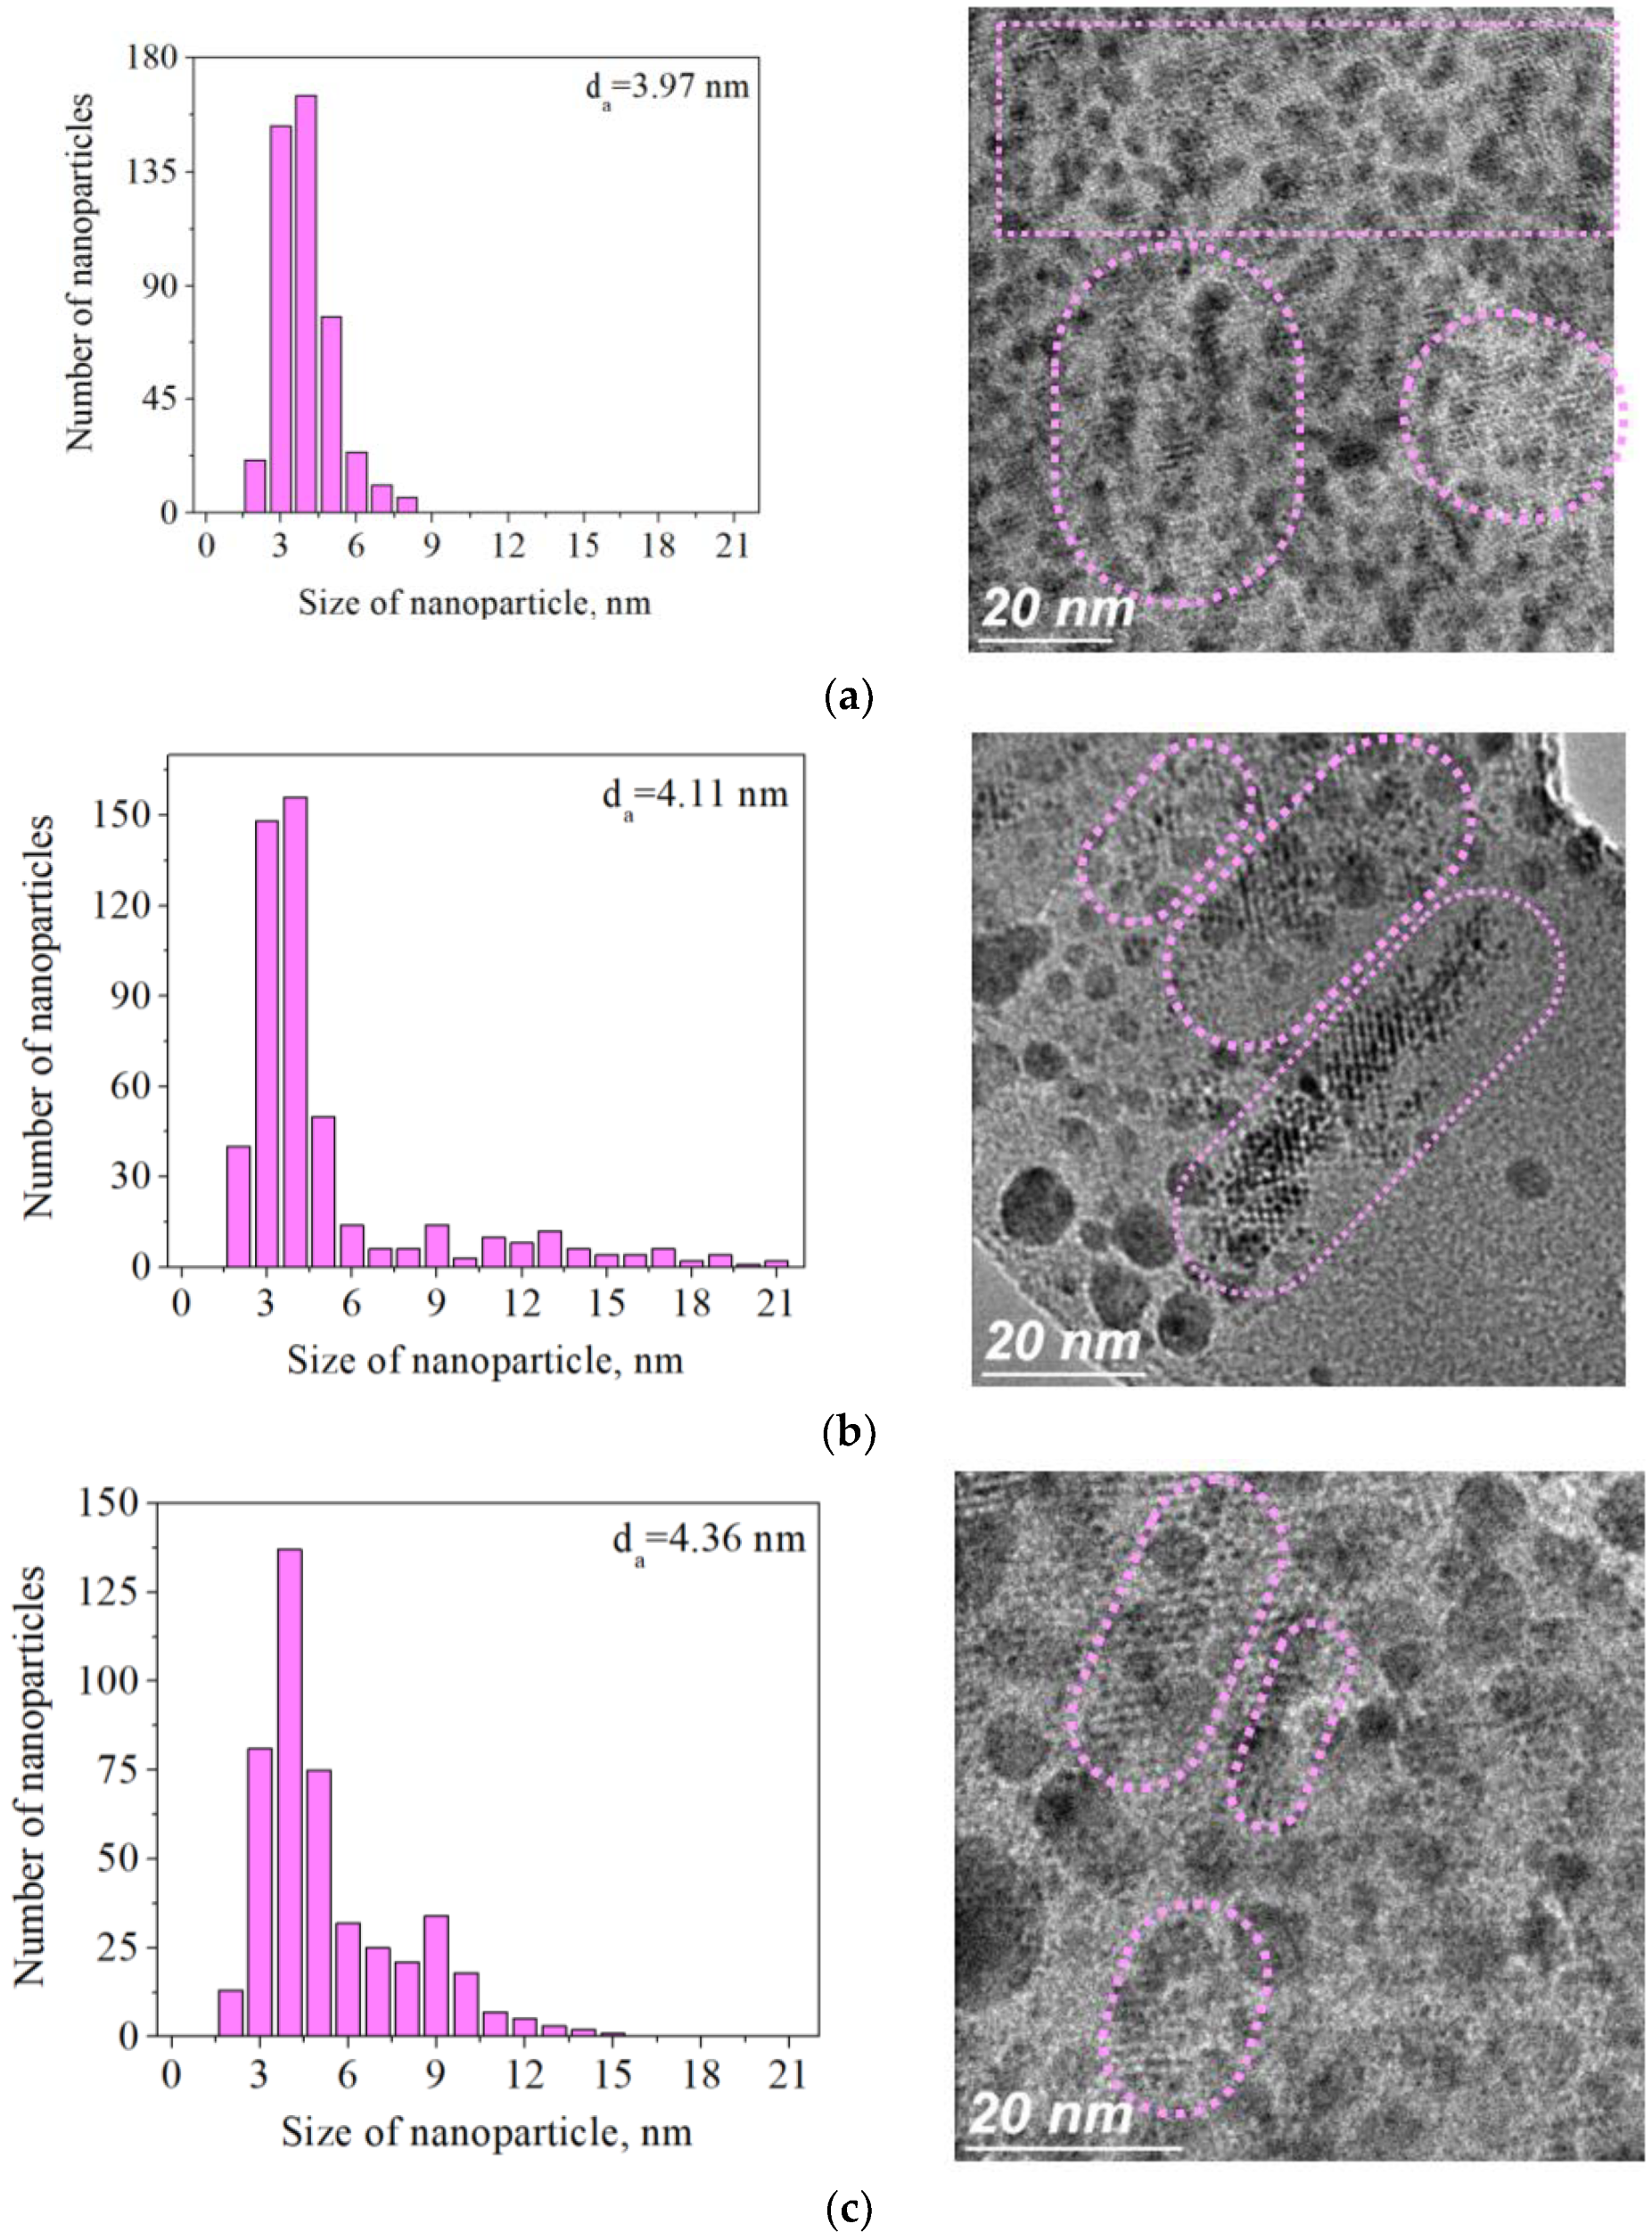
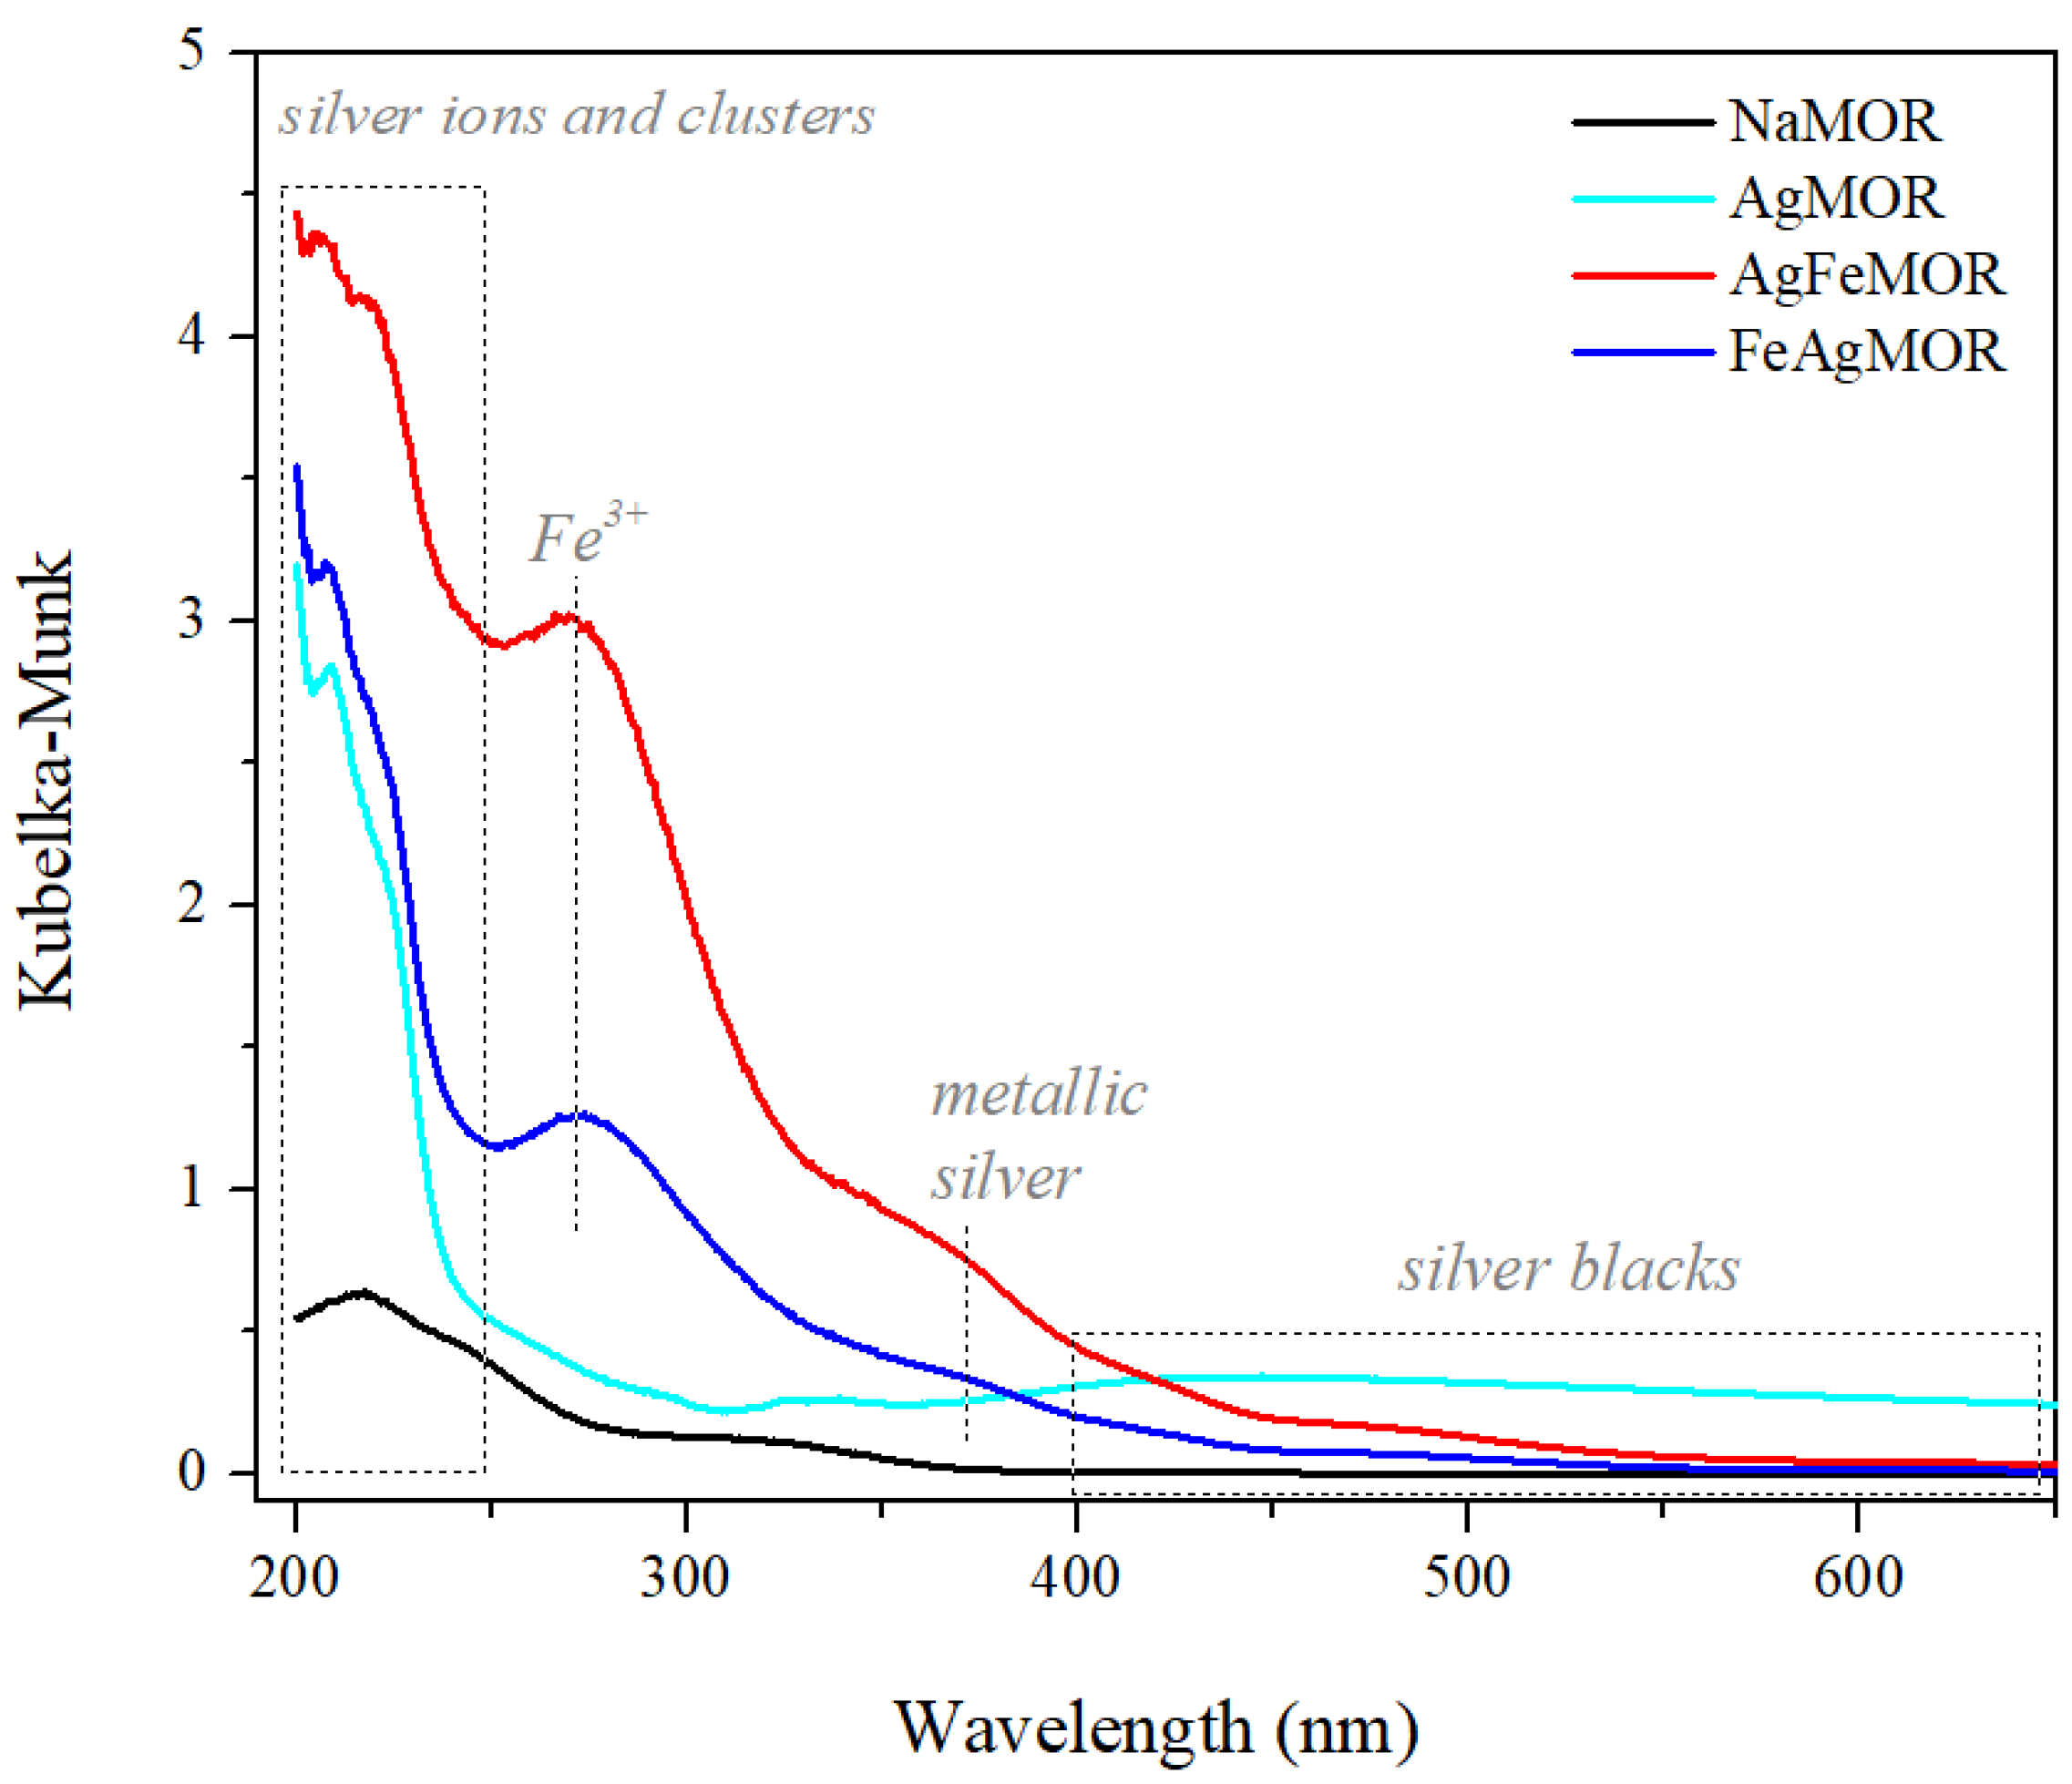
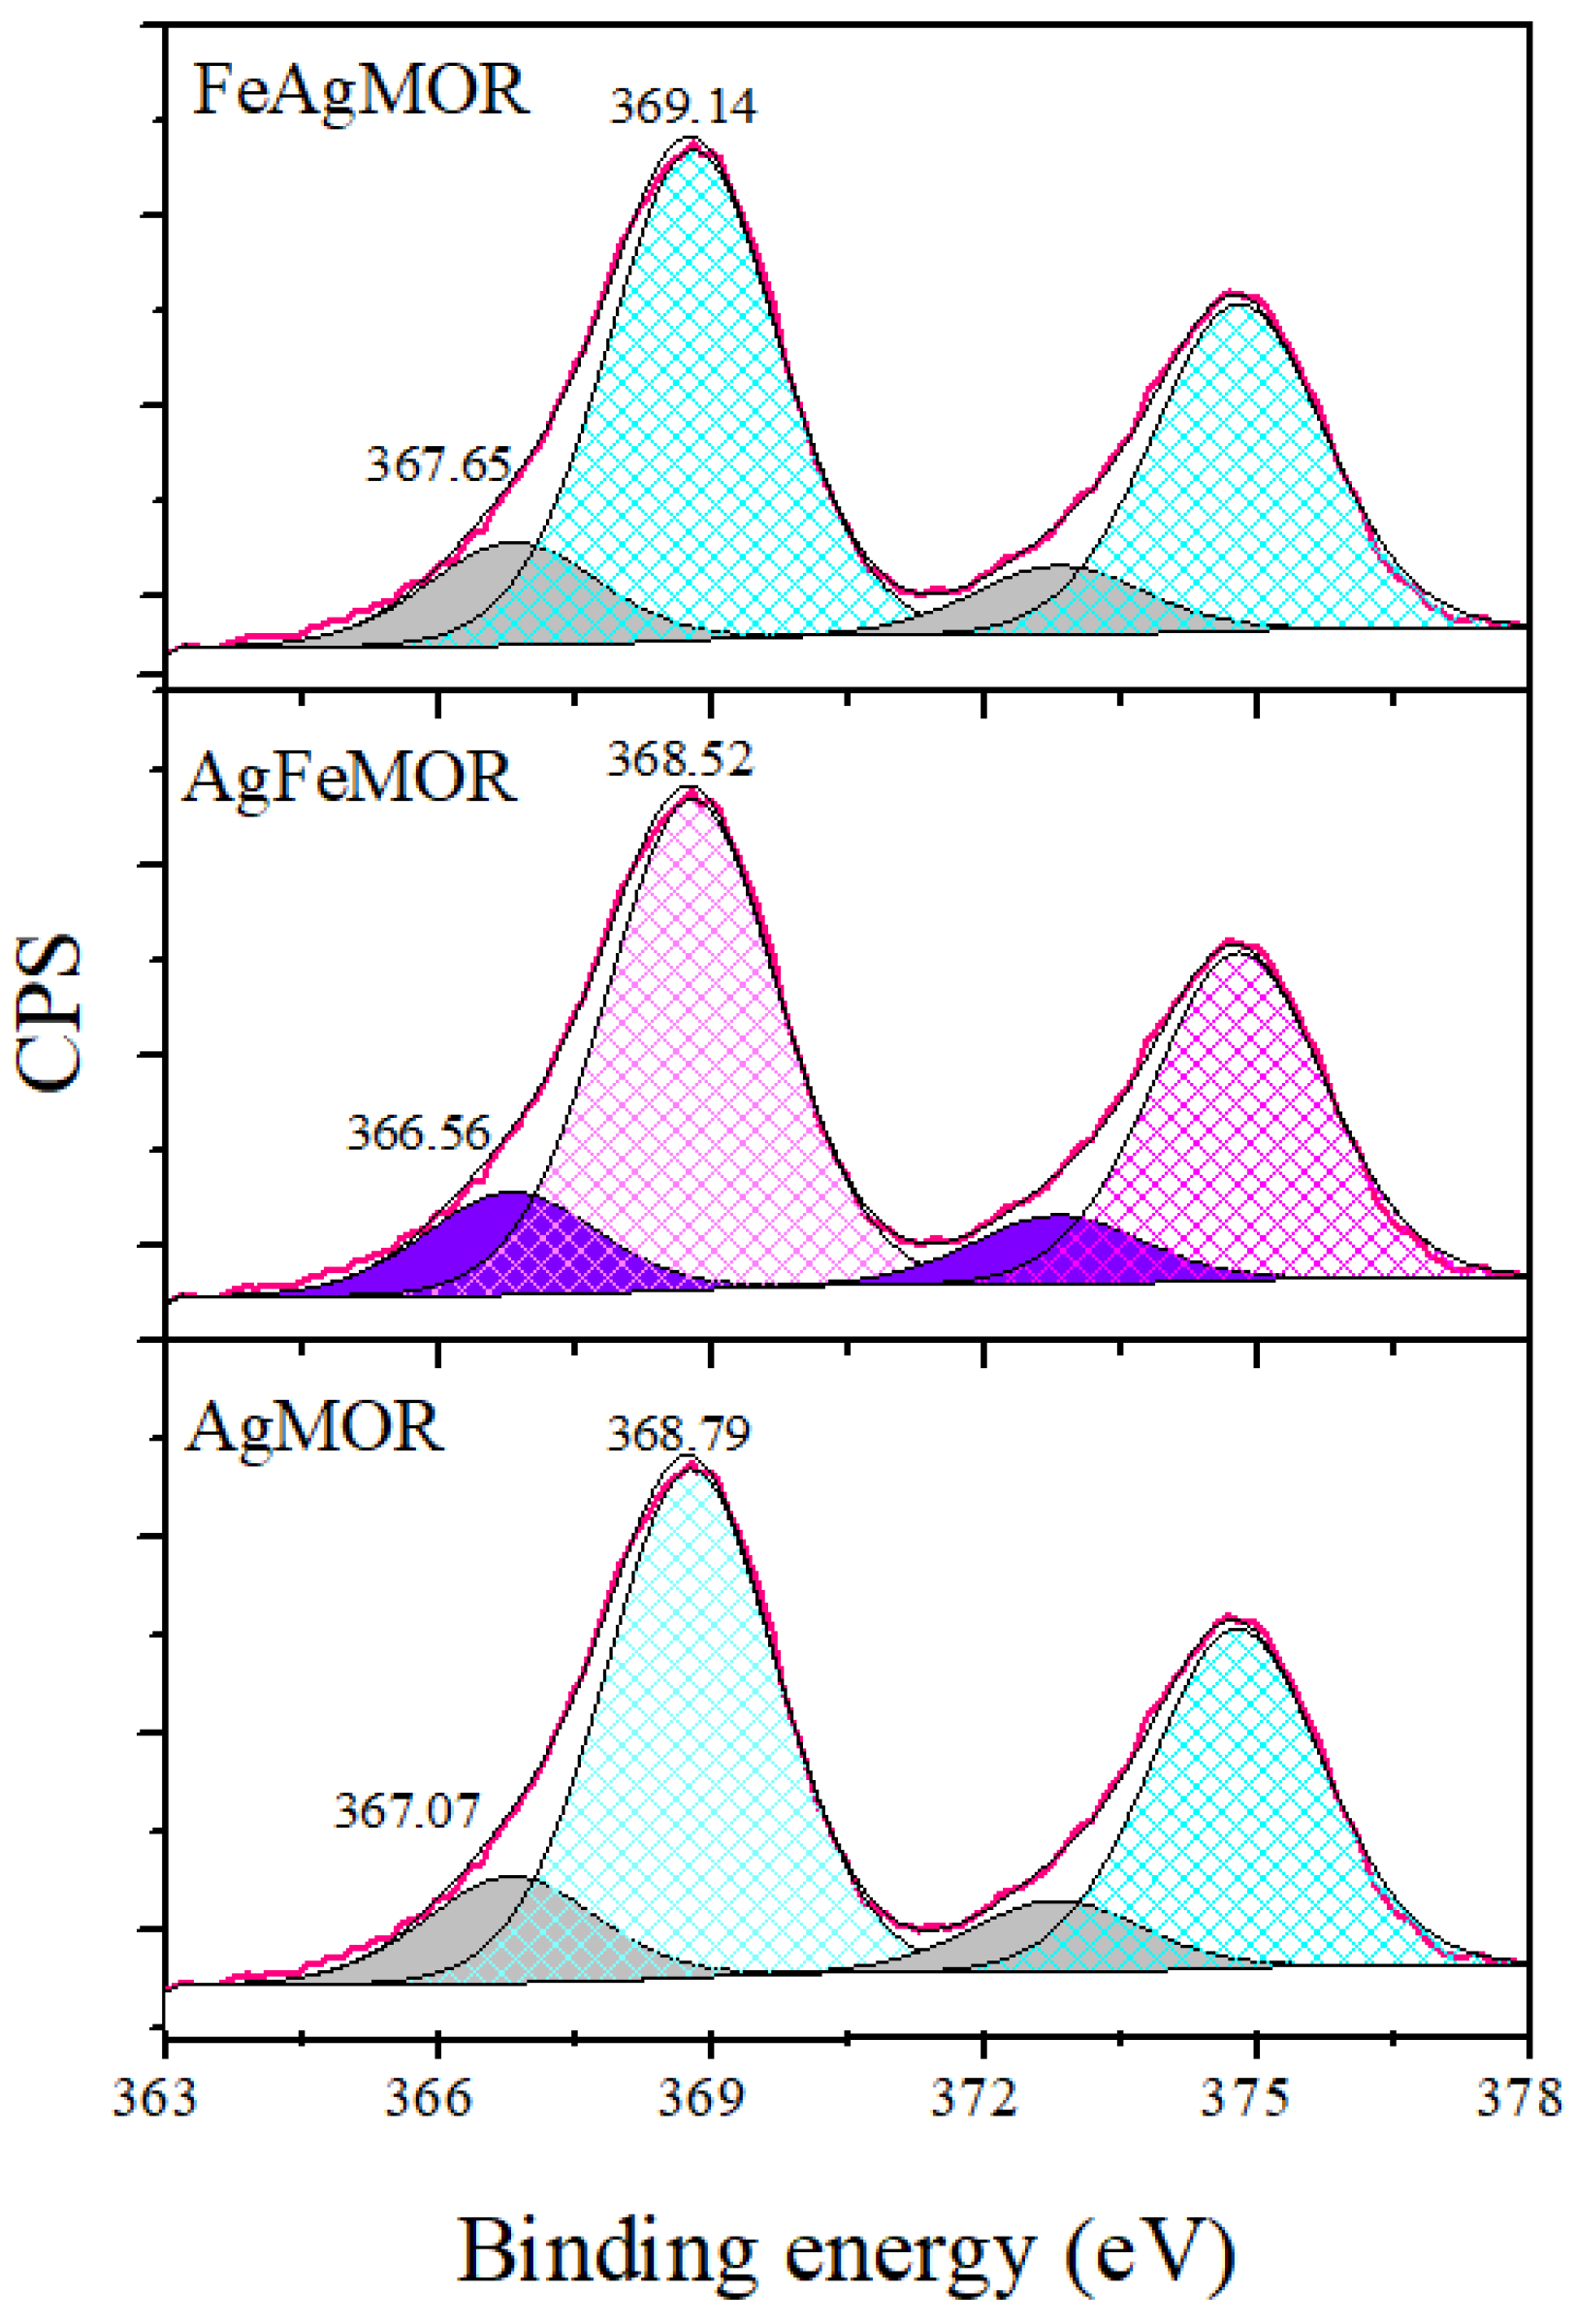
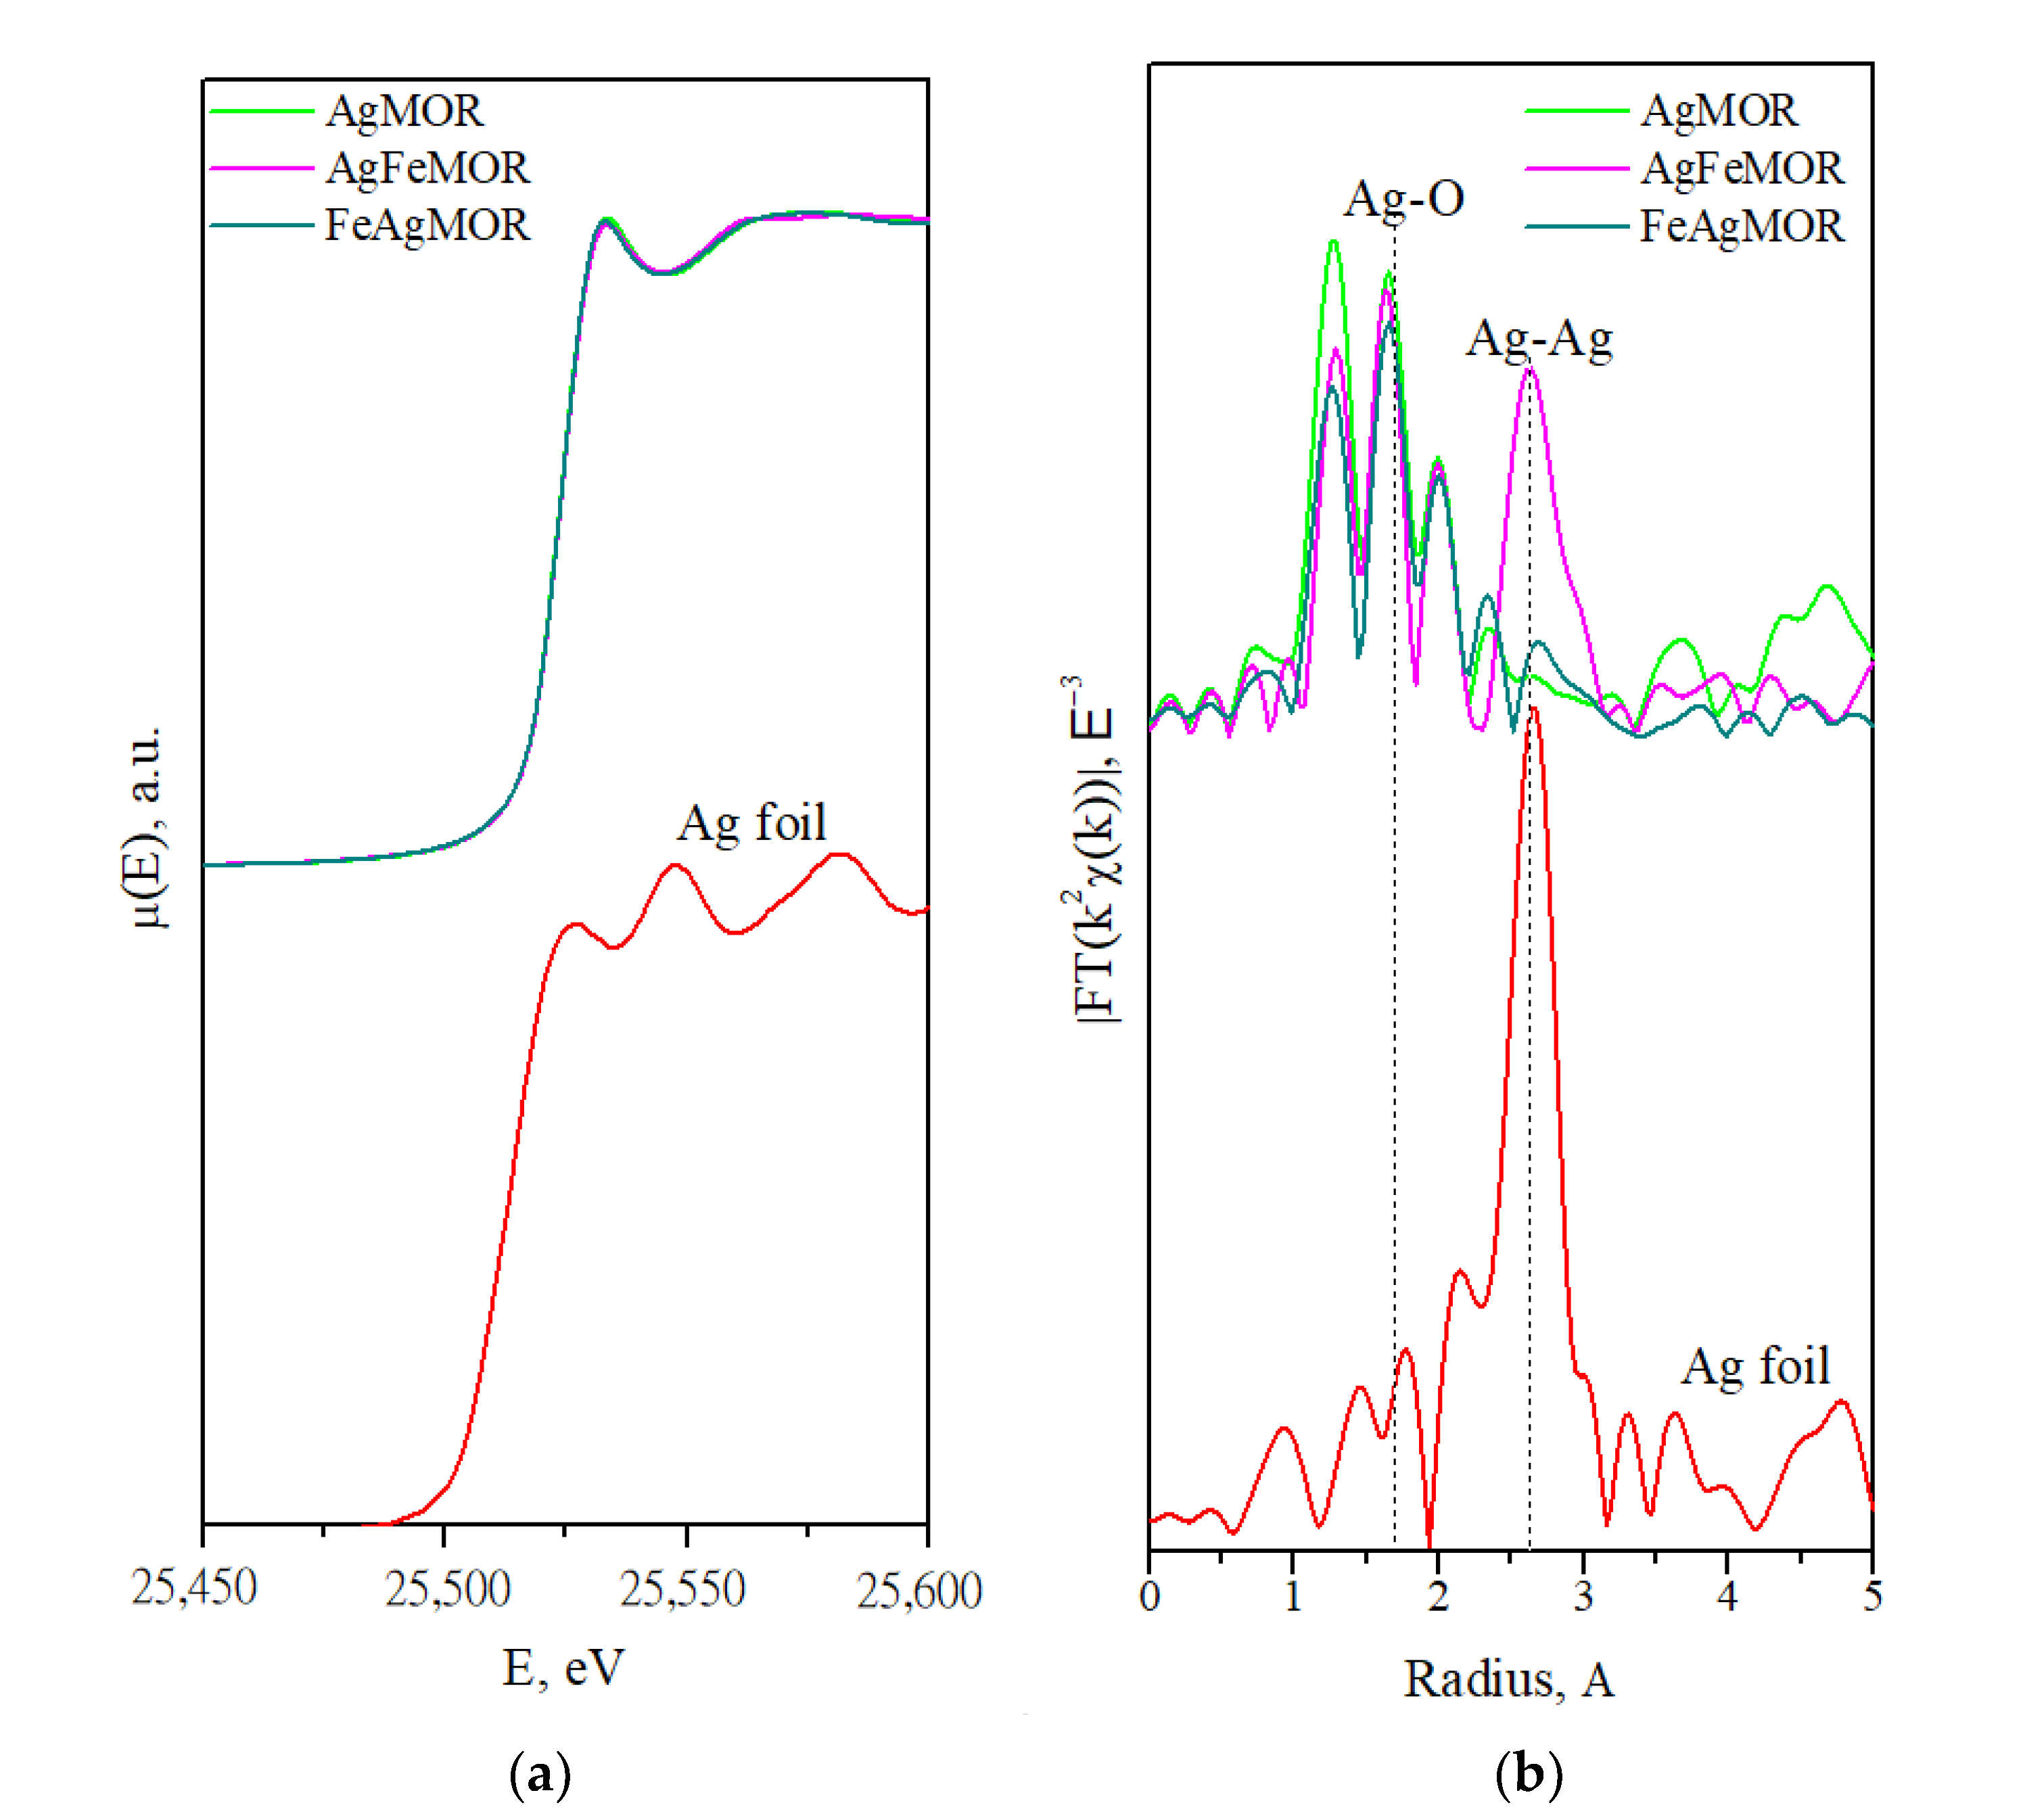
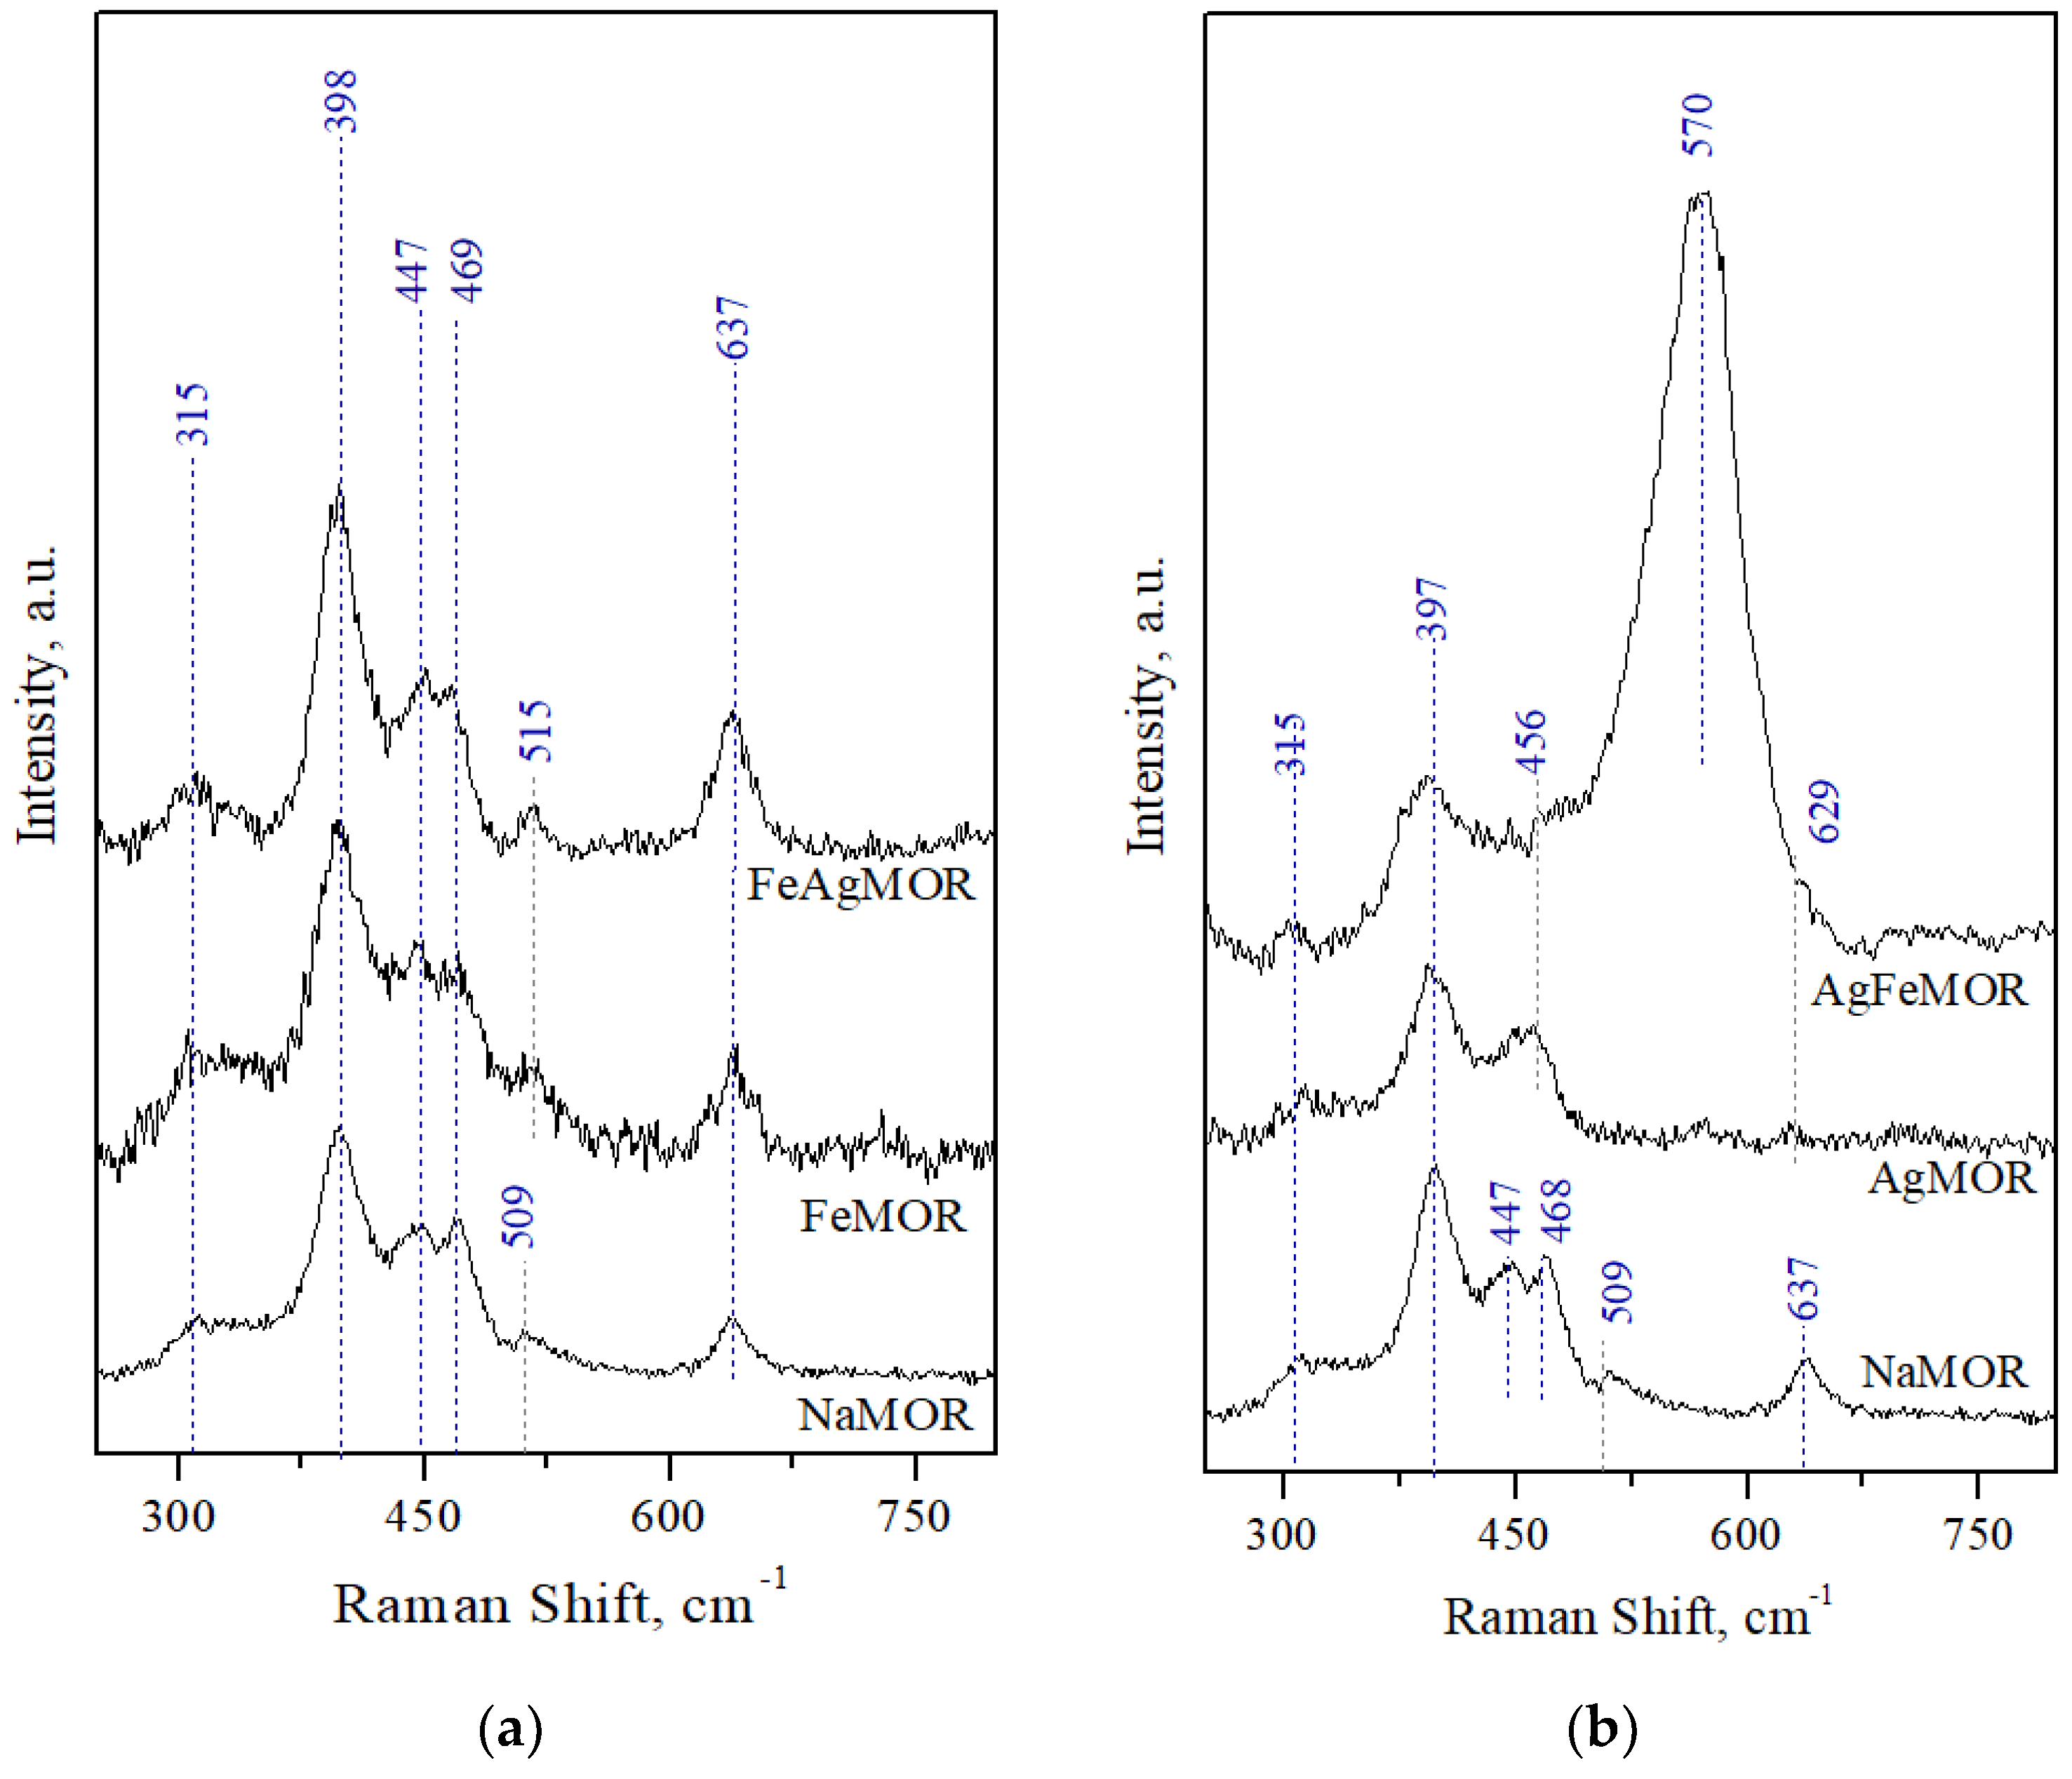
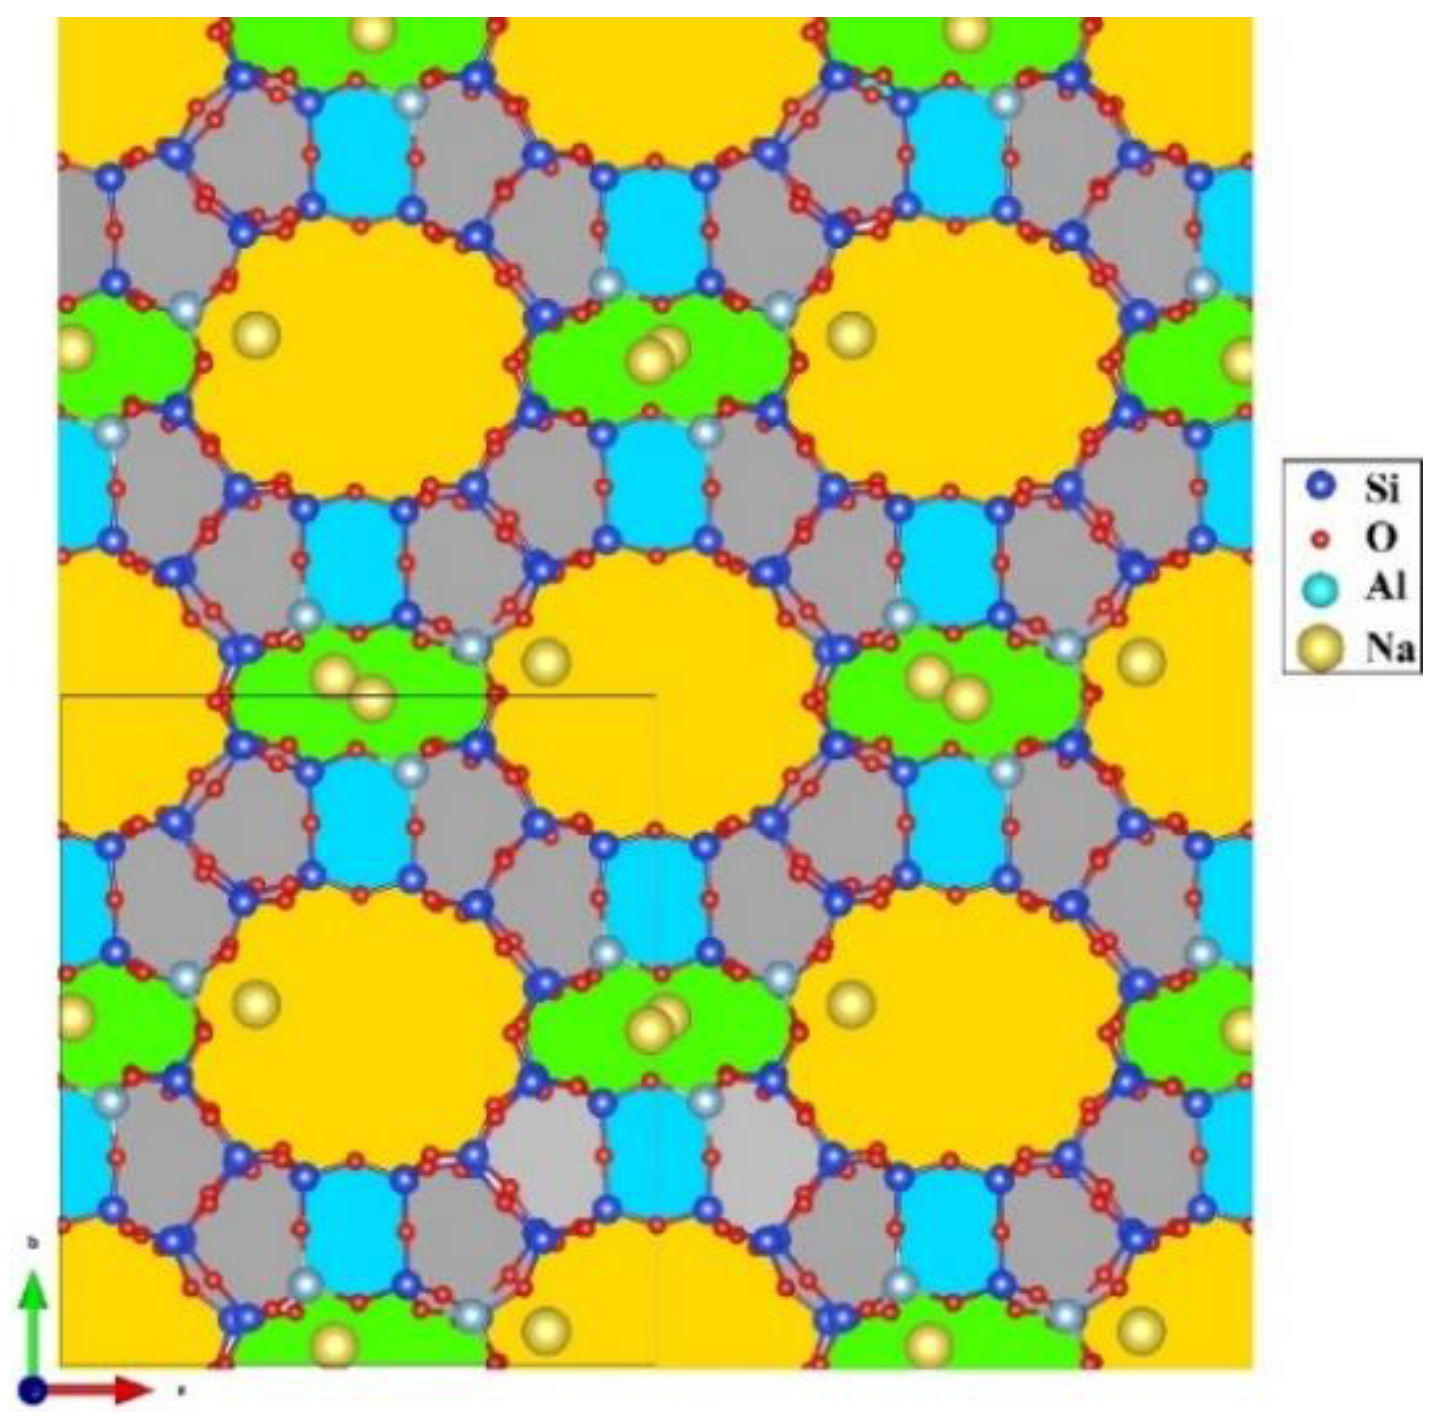
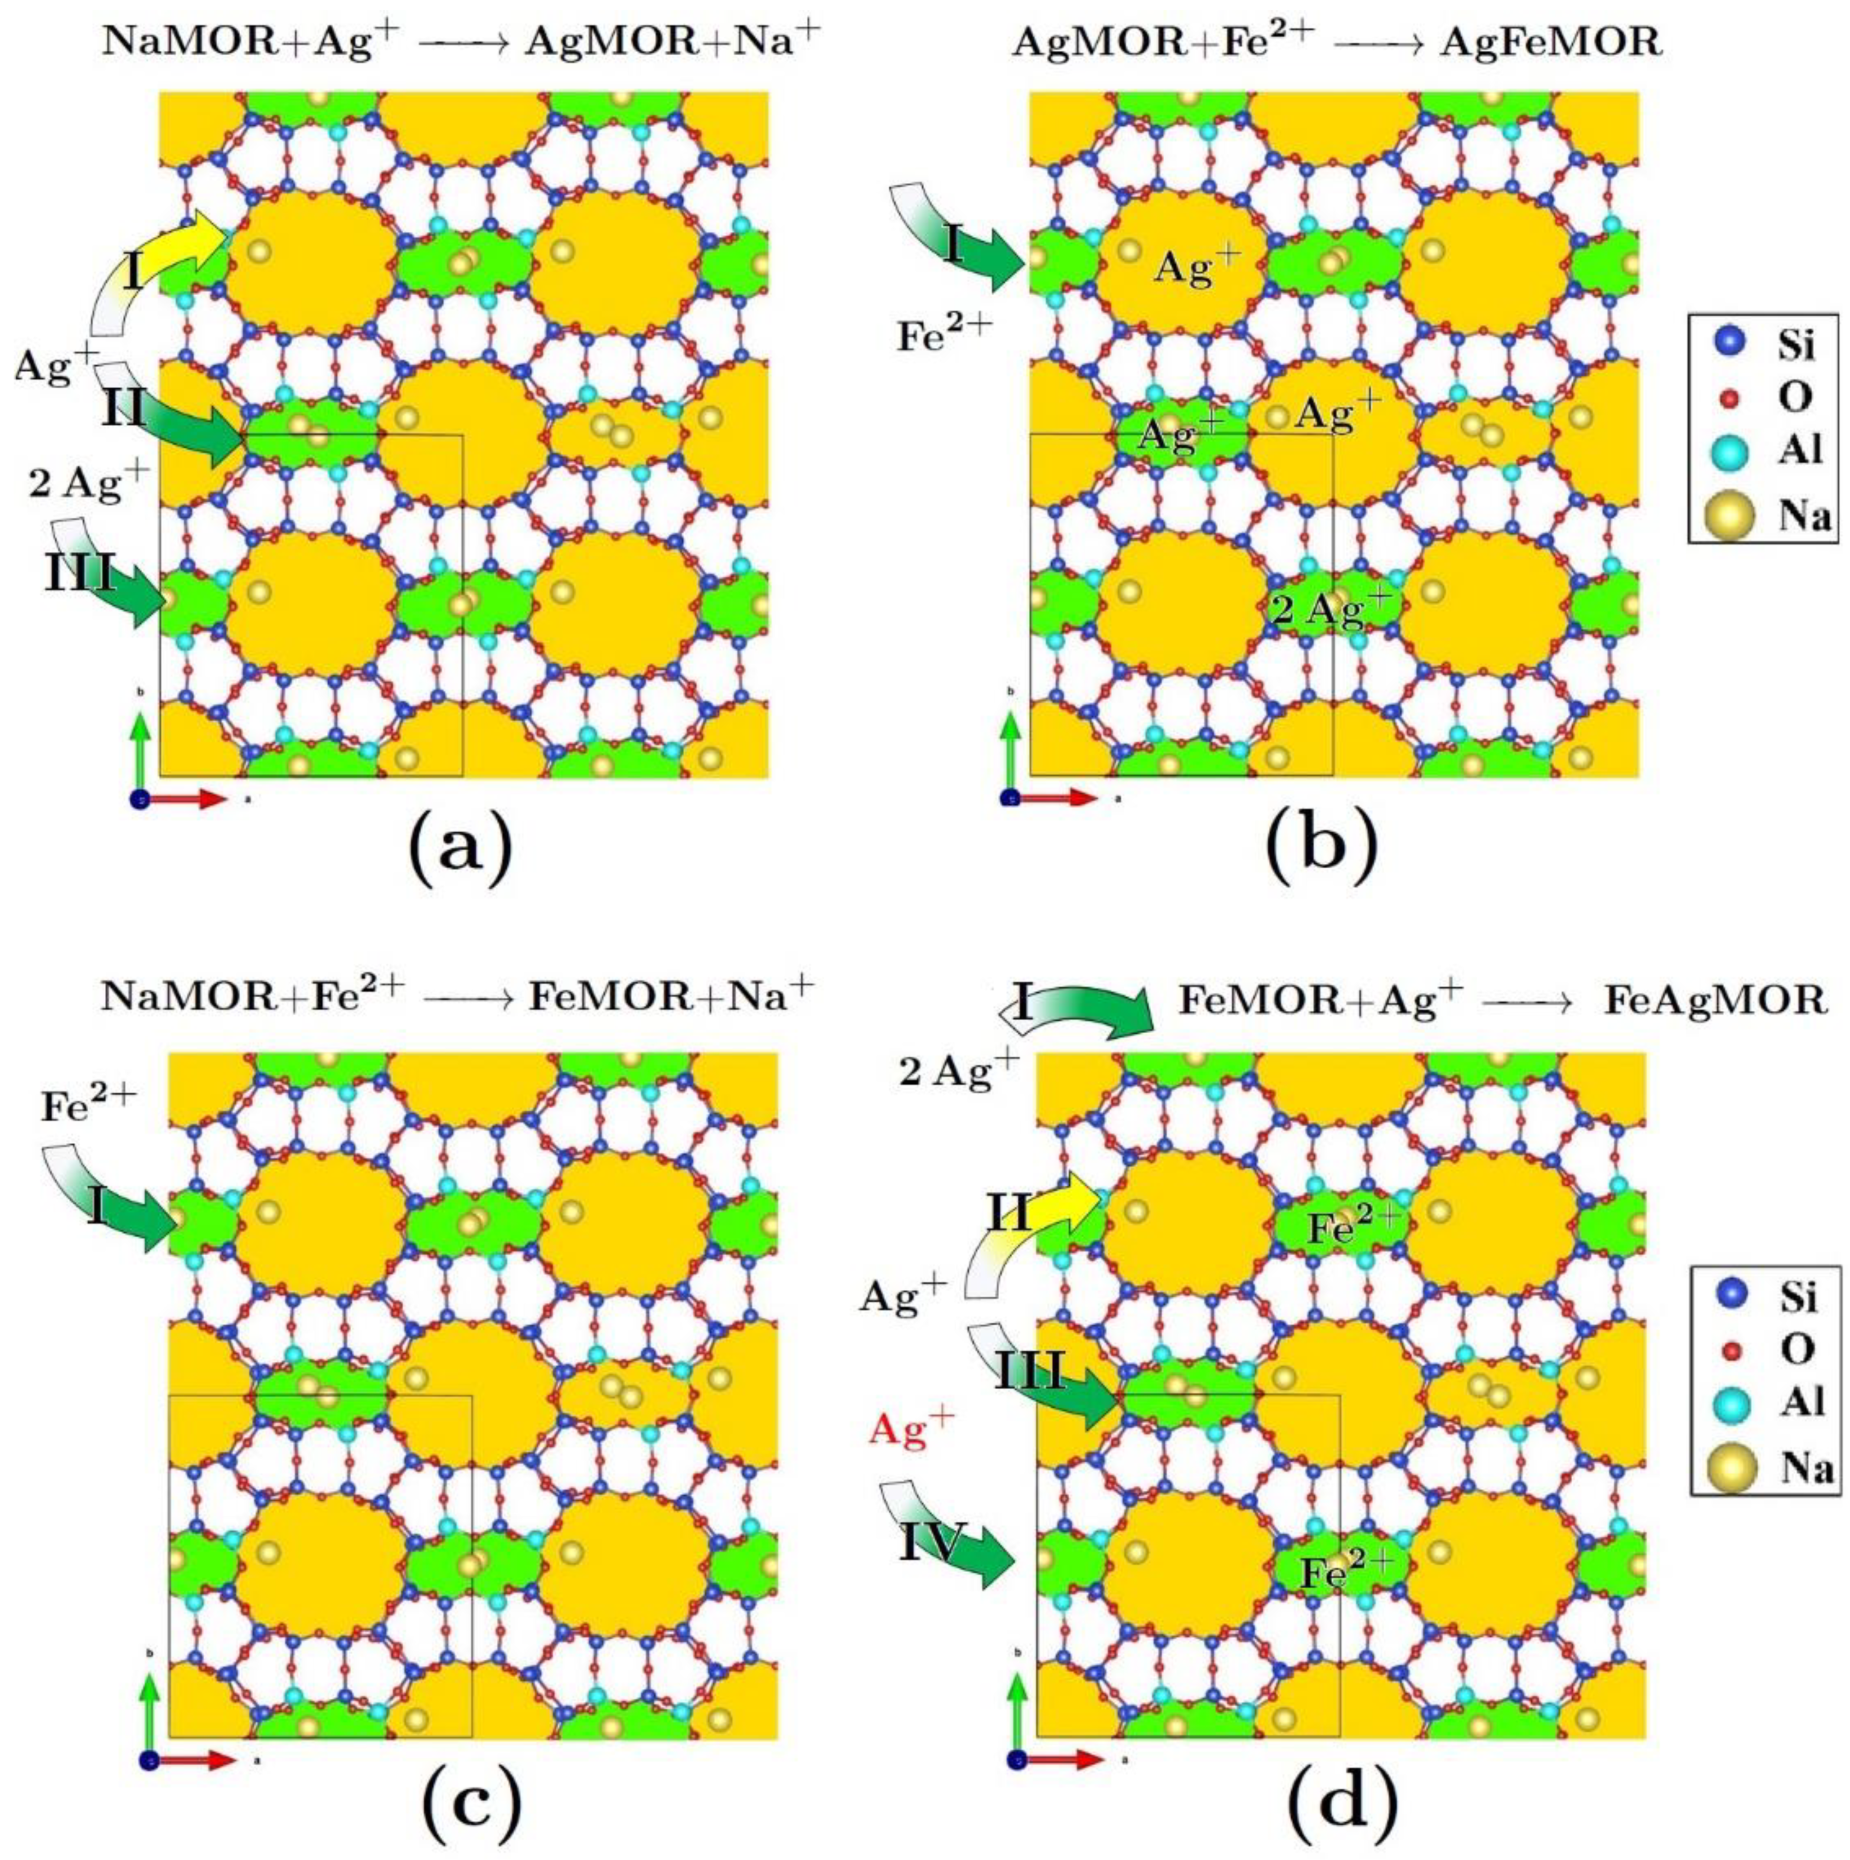
2. Results and Discussion

The textural properties and chemical composition of the studied samples are presented in Table 1 and Table 2, respectively. The textural properties (see Table 1) show minimal changes after the first and second steps of ion exchange. The chemical composition demonstrates slight dealumination after the first steps of ion exchange; moreover, there is an excess of Na+ in the initial commercial mordenite, as was also observed before [20]. The ion exchange abilities of zeolites are based on the negative charge induced by the presence of aluminum in the neutral silicate framework, which is compensated by some exchanged cation. These exchangeable cations are located on the surface of channels and pores, which makes it possible to efficiently use a large surface in the exchange, adsorption or catalytic process and avoid diffusion hindrances. The equilibrium ion exchange modulus (EIEM) indicates how complete the ion exchange is. It can be calculated as the sum of the charges of all cations present divided by the aluminum content and should be equal to 1. In this study, the utilized cations were Ag+, Fe2+, Fe3+ and H+ (from the acidified iron precursor solution), along with residual Na+ of the initial mordenite (if any):
EIEM = 1 Na + + 1 Ag + + 1 H + + 2 Fe 2 + + 3 Fe 3 + Al = 1 ,
The chemical composition of the samples, as measured by ICP-OES, is presented in Table 2. By comparing the Si/Al ratio of the monometallic and bimetallic samples with the initial value for NaMOR, all samples, except AgMOR, exhibit a weak dealumination, which is attributed to the acidic pH of the iron solution used in the exchange. EIEM calculations based on elemental analysis for these materials are complicated by four facts at once. First, as it was found [12], Fe2+ and Ag+ have red-ox interaction, leading to precipitation of some amount of Ag+ in Ag0, which does not participate in the ion exchange, but it is present in the quantitative data on the component contents. Second, the method does not allow estimating separately Fe2+ and Fe3+, which invariably introduces an error in the calculations by equation (1). Third, as was shown [19,20], some part of Fe3+ is incorporated into the mordenite framework instead of aluminum rather than taking part in the process of ion exchange, which leads to dealumination. This also means the participation of Fe3+ in ion exchange in a new capacity and adds unknowns to Equation (1). Finally, the amount of H+ cannot be estimated by ICP-OES, but as can be judged from thermodynamic parameters considered here [20], H+ participates in competitive ion exchange in the presence of Ag+ and Na+ and must be considered.
Thus, the EIEM was calculated from ICP-OES results for all samples with several assumptions (see Table 2). Different values were observed between NaMOR, AgMOR and three Fe-containing samples. Since it is impossible to estimate the number of iron cations in the framework and evaluate Fe2+ to Fe3+ ratio [20] from ICP-OES data, the limit values of EIEM-Fe2+ and EIEM-Fe3+ were calculated, considering that all the iron is entirely as cations of one of the possible oxidation states (Fe2+ or Fe3+). These values represent the interval within which the real value of the modulus lies:
EIEM-Fe 2 + = 1 Na + + 1 Ag + + 1 H + + 2 Fe 2 + Al ,
EIEM-Fe 3 + = 1 Na + + 1 Ag + + 1 H + + 3 Fe 3 + Al ,
As is seen from Table 2, EIEM for most samples is close to one, with the exception of NaMOR and FeMOR. The high EIEM value for NaMOR was previously associated with the fact that NaOH, which is present during the synthesis of zeolite in the industrial process, was not completely removed by washing the resulting material [20]. For FeMOR, the EIEM has a value of less than 1. This can be explained by the participation of H+ in the process of ion exchange.
In Figure 1, the experimental XRD patterns of the studied samples are presented. The angular positions (2θ) of the peaks remain unchanged after the replacement of compensating Na+ ions by exchanged Ag+ and/or Fe2+ ions. However, relative intensities of peaks of the NaMOR zeolite are affected depending on the nature of the introduced exchangeable cation. This is evident when comparing FeMOR and AgMOR patterns with NaMOR X-ray diffraction patterns. It appears that Fe2+ affects the intensity of the peak associated with the (110) plane, while Ag+ cations affect the amplitude of several peaks in the range 8 < 2θ < 30. The effect of Ag+ cation exchange is so great that the amplitudes of some peaks, such as those associated with planes (020), (200) and (202), are very strongly suppressed. Of course, Fe2+ and Ag+ cations are of different natures, but these results show that they are hosted in significantly different positions accessible for the exchangeable zeolite cations.
In the case of bimetallic samples, except for some differences, the diffraction patterns of FeAgMOR and AgFeMOR show a noticeable similarity with the pattern for the monometallic AgMOR sample. These differences show that, regardless of the order in which a second exchangeable cation is introduced, in all cases, the Ag+ cation affects the intensity of the peak associated with the (110) plane, while the Fe2+ cation causes a change in the intensity of the peak associated with the (202) plane. Such an increase in the intensity of only some planes suggests the coexistence of Ag+ and Fe2+ cations in a certain region of the zeolitic matrix and the presence of preferred positions for each of the cations. In addition, the more pronounced effects of Ag+ cations on the diffraction pattern suggest they can access a larger number of exchange sites than Fe2+ cations. This is consistent with the results presented in Table 1, which show that Ag is always found in higher amounts than Fe, regardless of the sample type. The phase peak of metallic Ag (Ag 00-003-0921) was observed in the XRD pattern of only one sample: AgFeMOR. The crystallite size, defined as the size of the region of coherent X-ray scattering, was equal to 6 nm. The formation of Ag0 was caused by the redox interaction between Ag+ and Fe2+, as was explained earlier for bimetallic Ag-Fe samples on mordenite prepared from iron (II) perchlorate [12]. For FeAgMOR, redox interaction between Ag+ and Fe2+ also took place, but XRD did not register the product of this reaction, the Ag0-containing phase. This may indicate that the order of deposition of Ag+ and Fe2+ ions contributed to the formation of this phase. A similar effect of the order of deposition of Ag+ and Fe2+ was observed for AgFeMOR, prepared at varying synthesis parameters [20].
Micrographs and particle size distribution (PSD) of silver NPs are presented in Figure 2. The average particle diameter for all samples is approximately 4 nm (from 3.97 to 4.36 nm), and only the PSD widths represent differences between them. In all cases, PSD has a single intense peak; however, only the PSD of AgMOR can be called unimodal. For bimetallic samples, a second maximum was observed at 9 nm; for AgFeMOR, another maximum was also seen at 13 nm. In addition, the monometallic AgMOR (see Figure 2a) has the narrowest PSD: from 2 to 8 nm, whereas the bimetallic samples have a wider range PSD: 2–21 nm for AgFeMOR (Figure 2b) and 2–15 nm for FeAgMOR (Figure 2c).
Nevertheless, for all three samples, at least 30% of the Ag NPs are greater than 5 nm, which means they are large and numerous enough to be detected by XRD. According to XRD results, the presence of a crystalline phase of metallic silver was confirmed only for AgFeMOR (see Figure 1). When considering that the presence of Fe increases the wide distribution and the fact that XRD analysis confirmed the presence of a metallic silver phase only in AgFeMOR, it is logical to conclude that the large Ag NPs in AgFeMOR sample have a metallic structure due to reduction in silver ions by iron (II). Thus, it can be assumed that Ag NPs in FeAgMOR could also be metallic due to the presence of Fe2+, but the particles are simply too small to be registered by XRD. In the case of AgMOR, the nature of silver species that we observe with HRTEM should be additionally studied.
In the micrographs of Figure 2, for all three Ag-containing samples, in the areas highlighted by the dotted line, except for Ag NPs agglomerated on the zeolite surface, all three samples contain ordered domains of Ag species of equally small size. The diameter of these species is approximately 0.7 nm, which coincides with the size of the cross-section of the main mordenite channel. These clusters were not included in the particle size distribution counts because they are monodispersed and because such a size is beyond the limits of reliable diameter measurement due to image quality limitations. The parameters of such highly ordered structural domains were analyzed previously using a specially developed image processing program that uses the Fast Fourier Transform to detect periodic textures in HRTEM images [21,22]. However, these 0.7 nm Ag nanospecies are widely represented: their amount in each sample is several times greater than the number of Ag NPs in the corresponding histogram. Since the distances between Ag nanospecies in each domain are similar to the distances between the main mordenite channels, and the size is quite close to the diameter of the main mordenite channels, we can conclude that we observed intra-channel silver clusters. Detection of silver clusters formed inside the zeolite cavities due to a reduction in hydrogen flow at elevated temperatures of Ag+ inside mordenite channels has been described earlier [23,24,25,26,27]. However, to our knowledge, before the present work, these clusters had never been registered by HRTEM. In addition, we did not apply reductive treatments. This species may represent another type of active center [13,14]. The study of their physicochemical and catalytic properties requires additional research, with adequate methods to study the clusters.
DRS UV-Vis was applied to determine the presence of various silver species in studied samples, and spectra are presented in Figure 3. The broad absorption band at 375 nm for both bimetallic samples can be easily interpreted as the plasmon resonance peak of metallic silver subcolloidal NPs with sizes in the range of ca. 1–3 nm [28,29]. In a work conducted by Mulvaney [30], a peak around 380 nm was reasonably attributed to Ag NPs with a diameter of 3 nm in an aqueous medium. It should be considered that, in our case, the NPs are located not in an aqueous environment but on the surface of mordenite. In our experimental spectra, attention is drawn to an almost complete absence of plasmon of Ag NPs in the 410–450 nm range, which usually appears in all systems where reduction and aggregation of silver ions take place [29]. It should be noted that in [28], the appearance of a 380 nm peak was observed under the mildest conditions of reduction in a hydrogen flow (temperature in the range of 20–50 °C), and a further increase in temperature resulted in the formation of a peak at 420 nm. This is because of their size, which exceeds the available diameters of regular mordenite channels; both subcolloidal (absorption peak at 370–380 nm) and larger silver particles (peak at λ > 380 nm) can only be found on the outer surface of microcrystals or in existing mesopores [31].
The position of this peak changes when the size of Ag NPs is adjusted [32]. It can also be seen that FeAgMOR has a much lower content of Ag NPs with a size of 1–3 nm when compared to AgFeMOR (see peak “metallic silver” intensities), so we suppose the number of metallic NPs with a size ≥5 nm was not enough to appear on XRD patterns. Thus, according to DRS UV-Vis data, both AgFeMOR and FeAgMOR bimetallic samples exhibited a redox interaction between Ag+ and Fe2+ with the formation of metallic Ag NPs. However, the order of cation deposition definitely affects the final content and ratio of silver species.
For all Ag-containing samples, a weak and broad structure with low absorption at 300–650 nm corresponding to the silver-black—non-crystalline silver colloids are observed [29,33,34]. AgMOR demonstrated the most intense absorption in this range. It is assumed that the silver-black particles are Ag NPs, which we see in the AgMOR micrographs (see Figure 2a) and which could not be identified by XRD. Unfortunately, the intense absorption of mordenite in the 200–250 nm wavelength range and the absorption peak with a maximum at 272 nm corresponding to the charge transfer of O → Fe(III) in tetrahedral coordination [35,36,37] makes this range unavailable for identifying any of Ag ions or clusters.
Thus, according to XRD, HRTEM and DRS UV-Vis results, the studied samples demonstrated a significant difference in the formation of relatively large silver species on MOR.
For all Ag-containing samples, colloidal non-structured Ag NPs up to 15 nm in size were detected; AgMOR exhibited the largest amount of them. Additionally, colloidal Ag NPs for both bimetallic samples because of redox interaction between Ag+ and Fe2+ metallic Ag NPs were also observed; however, for FeAgMOR, it was in insignificant amounts. As it is known, the formation of large Ag NPs on the outer mordenite surface for these samples is a result of the Ag+-Fe2+ redox interaction and ion exchange selectivity, and cation deposition order has a decisive influence on what form Ag0-base species will take: clusters, colloids or metallic particles [20]. The present paper is dedicated to developing this mechanism and understanding the formation of small silver species, such as clusters and ions, on the inner surface voids of mordenite. In order to characterize such species, XPS, Raman spectroscopy and XAFS methods were applied. The XPS results are presented in Figure 4 and in Table 3.
The electronic state of silver with the largest contribution is characterized by BE = 369 eV and is related to silver clusters less than 2 nm in diameter [38], which could be those intrachannel silver clusters with a size of ~0.7 nm organized into domains and registered by HRTEM (see Figure 2). Spectra also show a small Ag 3d3/2 peak, with a BE of about ~366.6–367.7 eV. According to the literature data, the peak at BE = 366.2 eV corresponds to silver ions in solution, and the peak at 367–368 eV is interpreted as the electron state of silver interacting with Si and O in non-zeolitic Si-containing supports [39,40,41]. We may only suggest the presence of Ag+ supported on mordenite, according to the XPS data. Thus, we can conclude that most of the silver is in the form of clusters Agn < 2 nm, which, the most probable, are those species observed on micrographs as the ones organized in domains (see Figure 2).
XAFS methods were applied to study the interaction of cations with mordenite at the atomic level. XANES spectra (Figure 5a) show practically no differences between Ag-containing samples. The shape of all XANES spectra differs from bulk reference samples with simple structures, such as Ag foil, Ag2O, AgCl, etc. (not shown here). However, similar XANES results were obtained for ionic silver in zeolite A [42]. Therefore, one may assume Ag in the studied samples to be mainly ionic. The molar fraction of crystalline Ag observed by XRD in the case of AgFeMOR is exceedingly small and does not significantly affect the shape of the XANES spectrum. Since XANES spectra are almost coincident for all samples, we assume that almost all Ag is located in the MOR framework, forming very similar local structures for AgMOR, FeAgMOR and even AgFeMOR.
The Ag K-edge EXAFS curves (see Figure 5b) include multiple sharp peaks between 1 and 2.4 Å, which are similar for all samples, and a wider peak at 2.6 Å. This last peak is clearly observed only in the case of AgFeMOR and can be attributed to the first coordination sphere in metallic silver. The observation of an Ag-Ag peak for this sample is in good agreement with XRD results confirming the formation of a crystalline phase of metallic silver in the AgFeMOR sample. For all samples at shorter distances, a series of maxima with slight variations in intensity are observed. Based on the XANES data, it can be assumed that these maxima correspond to the local environment of silver ions in the mordenite structure. Therefore, these peaks can be attributed to the Ag-O, Ag-Si or Ag-Al interatomic distances. Nevertheless, since the exact numbers and positions of the maxima vary sharply with the k-range, we suggest that the so-called «EXAFS interference phenomenon» occurs.
The phenomenon of EXAFS interference is sometimes observed when two or more interatomic distances in a local structure are close but not equal. Usually, in k-space, each scattering path is represented by a sine wave with variable amplitude. The lighter the atom, the smaller the k value at which the amplitude has a maximum, after which the wave attenuates. However, the addition of two sinusoidal contributions of light atoms (e.g., O) with very close (but not equal) frequencies in k-space leads to the appearance of a sinusoidal wave with a similar frequency, the amplitude of which first decreases but then increases again at large k values, especially in the case of large k-weights. Such a shape of the EXAFS spectrum may be misinterpreted as the presence of heavy atoms at very short interatomic distances. A similar problem was described for a bimetallic Pt-Sn sample on SiO2 in [43]. When the EXAFS functions of pure Pt and PtSn alloy were combined, the resulting Fourier transform (FT) exhibited two main peaks at 2.18 and 2.78 Å, which is in good correspondence with the experimental FT. By using references to theoretical works, the authors demonstrated this peak at a short distance to arise from interference phenomenon in the EXAFS spectra, resulting from the coexistence of pure Pt clusters and PtSn alloy. The presence of this peak is not only a fingerprint for the Pt-Sn interaction but also evidence for the existence of undoped Pt.
In terms of EXAFS FT, the interference phenomenon leads to a rise in additional peaks. The positions and intensities of those peaks may not correspond to the real electron density distribution over the coordination spheres. Since the intensities, exact positions and even the number of peaks may gradually change depending on the k-range in which the FT is taken, we propose to call these peaks (peaks at short distances such as 1.27, 1.66, 2.03 Å) an “interference crest”. In order to fit the crest, we took into consideration a high-k part of the EXAFS spectrum by extending the FT range to 15 Å and using kw = 3. In order to model the local surroundings of Ag, we introduced four scattering paths of Ag-Si, assuming the Ag ion to be attached to the mordenite framework, and the Ag-Si (or Ag-Al) distances were close but not equal, giving rise to the interference crest. However, the two main maxima of the interference crest were remarkably similar to those observed for Ag coordinated with O (see Ag2O reference in Figure 5b). Therefore, we also introduced four Ag-O scattering paths, imposing silver to interact with O atoms. The Debye factors were equalized for all Ag-O and Ag-Si paths to reduce the number of parameters. One Ag-Ag path was also included to account for metal particles in AgFeMOR.
As seen from Table 4, observing a reduction in the interatomic distances and coordination numbers of the studied samples if compared with the references, it may be concluded that the silver, in all three samples, is mostly in the form of monoatomic species attached to the mordenite framework. Moreover, based on the fit results, it can be concluded that the coordination of Ag in AgMOR is different from that for bimetallic samples. For this sample, 4 O and 4 Si atoms were not enough to describe the low-distance part of the interference crest, which is more intense for AgMOR if compared with the spectra of bimetallic samples. By varying the coordination numbers, we assumed the presence of an additional O atom next to Ag in the AgMOR. However, the addition of the Ag-Ag path does not improve the model and results in either higher R factors or zero coordination numbers of Ag-Ag. This may mean that silver exists in AgMOR as a single-atom oxidized silver species in the form of Ag+.
For bimetallic samples, the formation of Ag clusters might not be ruled out. In accordance with data in Table 4, the presence of Ag-Ag distance in the FeAgMOR sample reduces the R factor, which is speaking of the formation of some amount of metallic silver species, while most of the silver in FeAgMOR is in the form of dimers. In the case of AgFeMOR, the Ag-Ag peak is intense due to the presence of metal particles (see Figure 5b), while the presence of silver dimers is not registered. However, since the shape of the interference crest is similar to that for FeAgMOR and the “4 O + 4 Si/Al” model is sufficient to fit the spectrum, we assume that the coordination of Ag is included in the MOR for both FeAgMOR and AgFeMOR equally. Thus, in accordance with the EXAFS results, the position of Ag in the bimetallic samples does not depend on the cation deposition order, even though this order affects the final product: formation of silver dimers in FeAgMOR and formation of silver metal phase in AgFeMOR. Deposition of Ag leads to similar changes in the relative intensities of Bragg peaks, regardless of whether silver was deposited before or after iron, which is supported by XRD data (see Figure 1). It is also worth noting that for AgFeMOR and FeAgMOR, the two shortest Ag-Si/Al distances coincide with the third decimal place, i.e., 2 of 4 Si/Al atoms around Ag are chemically equivalent. This observation may help to establish the exact structure of Ag metal centers.
As the study of the surface by XPS methods showed, most of the small silver species on mordenite are represented by partially charged small silver clusters Agnδ+. Following HRTEM data, those clusters are organized into domains, in which the arrangement of clusters coincides with the symmetry of location and size of the main mordenite channels. The presence of some amount of Ag+-MOR on the surface was reported by the XPS method, while by the XANES method, it was shown that most of the silver in the bulk of the samples was present as Ag+-MOR. By the EXAFS method, it was found that the Ag+ ion was coordinated with the mordenite framework by four bonds, which can be Ag-O, Ag-Si or Ag-Al; the interatomic distances in all of them are close but not equal. The coordination of Ag in the zeolite bulk is similar for the two bimetallic samples and does not depend on the order of metal deposition, while the coordination of silver in the monometallic one differs from them; that is, iron significantly affects the state of silver. The results of EXAFS fit show silver in AgMOR to be mostly present in monoatomic form; in FeAgMOR, it is in the form of silver dimers, and in AgFeMOR, it is in the form of metal clusters, confirming the influence of the exchange order on the local structure of the samples.
Spectra of micro-Raman scattering of powder samples, obtained by excitation with the 784.29 nm line, are shown in Figure 6. The set of these results has the finality of demonstrating evidence that the micro-Raman spectra of the AgFeMOR, an isomorphous substitution of Fe3+ ions in the framework of mordenite, is observed. In order to validate this hypothesis, we measured the Raman spectra for each sample in at least three different sites with different conditions of incident excitation power. In Figure 6, for NaMOR, we presented the Raman spectra after subtracting the fluorescence background. For each one of these Raman spectra, we have characteristic Raman bands, coinciding with those previously published and measured by conventional Raman equipment, with a source line of 514.5 nm, for the same commercial NaMOR from Zeolyst International with SiO2/Al2O3 = 13 [45]. Raman bands of NaMOR at 315 and 397 cm−1 correspond to 8- and 5-membered rings (8-MR and 5-MR), respectively; a band at 509 cm−1 and a pair at 447 and 452 cm−1 were assigned to 4-MR. The band around 639 cm−1 corresponded to asymmetric stretching motions of T-O bonds [46,47]. Raman spectra of NaMOR reported by [48] show similar changes in the location and intensity of bands due to ion exchange: 397 associated with 5-MR vibrations, 447, 470 and 510 cm−1, to 4-MR vibrations. Visual identification of the different rings mentioned above are given below.
As it is known, changes within the range of 250–600 cm−1 are attributed to large deformation of the rings in the mordenite structure, and it may take place due to ion exchange [48]. It can be seen from Figure 6a that the bands of FeMOR are practically the same as for NaMOR, with a relative increase in the band intensity at 637 cm−1 associated with asymmetric stretching motions of T-O bonds. In addition, on the FeMOR and FeAgMOR, the position of the band at 509 cm−1, corresponding to 4-MR vibrations, shifted to 515 cm−1. The micro Raman spectrum of FeAgMOR does not demonstrate any drastic changes in its spectrum after the ion exchange of FeMOR with Ag+.
On the contrary, with FeMOR-based samples, micro-Raman spectra of AgMOR-based ones (AgMOR and AgFeMOR) demonstrate obvious changes in the range of 250–650 cm−1 if compared with NaMOR. From Figure 6b, bands corresponding to 4-MR vibration were affected: the band at 509 cm−1 disappeared, and instead of a pair at 447 and 469 cm−1, a single band at 456 cm−1 appeared. A band at 637 cm−1 has shifted to 629 cm−1, indicating changes in asymmetric stretch T-O motion. Thus, NaMOR after an exchange with Ag+ led to the deformation of rings in the framework, while spectra showed minor changes after an exchange with Fe2+. Results of micro-Raman spectroscopy agree with the XRD (see description in Figure 1). Moreover, it must be concluded that the cation of the first step of ion exchange defines the framework changes (in our case, Fe2+ saves the structure while Ag+ leads to large deformation in the mordenite structure), which confirms the cation deposition order to be a crucial factor to properties of the resulting materials.
Expected framework deformation in AgFeMOR is connected to Fe3+ incorporation into mordenite framework instead of Al3+, proved by Mössbauer spectroscopy [19] and by EXAFS [20] for samples studied in the present work. The new band at 570 cm−1 appearing on the AgFeMOR is ascribed to ions of Fe3+ in tetrahedral positions in the mordenite framework, also confirming it. Similar Raman bands at ca. attributed to a symmetric stretch of tetrahedrally coordinated Fe-O-Si were observed in the literature: at 516 cm−1 for Fe-ZSM-5 [49,50,51], at 530 cm−1 for Fe-ZSM-35 [52], at 510 cm−1 for Fe-SBA-15 [53], at 605 cm−1 for the Fe/MFI-15 and at 418 and 596 cm−1 for Fe/MFI-37 [54]. The band registered at 570 cm−1 for AgFeMOR is characterized by strong broadening; it could be due to (1) overlap because of a presence of a new family of 5- or 4-MR containing the Fe3+ ion in the mordenite framework or (2) iron incorporation into the mordenite framework, which induces a new framework disorder [55].
Our previous work considered the formation mechanism of bimetallic Ag-Fe samples deposited on mordenite [20]. As was already mentioned, a different order of cation deposition was applied, and two independent processes were considered: ion exchange on the mordenite surface, including the outer surface of crystals and the inner surface of the porous system, and the parallel redox interaction between Ag+ and Fe2+ ions. In that paper, the main attention was paid to the state of iron ions. However, the logic of further investigation with a focus on the peculiarities of Ag species formation leads to the need to consider the specific location of exchange cations on the inner surface of mordenite channels. In order to compare theoretical and experimental results and thus shed light on the formation of all occurring types of silver species, in the present study, a theoretical model was considered for Si/Al = 7 ratio [11]; it is a model with the closest value of the chemical composition of mordenite used in our experimental work.
Figure 7 shows this model of the distribution of different types of atoms in the a-b plane for the NaMOR framework; the unit cell was enlarged 2 × 2 times to appreciate better the distribution of Al and Na atoms and the main channels in the zeolite. Two potential ion exchange centers were considered: the channels in yellow color are associated with the 12-MR and those in green color with the 8-MRs. It also means that cation location in the side pockets leaves channels of zeolite free for reactant transporting, which is beneficial for applying studied materials in catalysis and adsorption.
As it was mentioned, micro-Raman spectroscopy presents evidence of isomorphic substitution of Fe3+ for Al3+ cations in the zeolite matrix, which affects the 4-MR and 5-MR vibrations, demonstrated on the insert image of Figure 8 by cyan and green colors, respectively. Although this case was not considered in the model construction in Figure 7, recent results (not yet published) show that this type of substitution occurs preferentially of Al3+ by Fe3+. That is, Fe3+ cations substitute for aluminum cations at existing positions rather than Si4+ cations at random positions in the lattice. Consequently, the ion exchange sites are unaltered, respecting the ion exchange rules just discussed without the presence of Fe3+ in the lattice, which will be published elsewhere.
Based on this model, the possible exchange mechanism for different cation deposition orders is suggested in Figure 8. In each process, the arrows and their color indicate the channel where the respective cation is exchanged. Additionally, in each case, the Roman numerals indicate the number of possible exchange sites of a particular ion.
The main feature of zeolite structures is that when a silicon atom is isomorphically substituted with an aluminum atom, such a tetrahedron acquires a negative charge that requires cations outside the crystal structure for neutralization. Since the Ag+ cation has the same valence as Na+, Figure 8a shows that the one-to-one ion exchange can occur in three ways: (a) exchange in the 12-MR channels (position labeled I), (b) exchange of one or two Na+ cations for Ag+ (positions labeled II and III). Meanwhile, 12-MR channels have the largest dimensions; Ag+ cations diffuse predominantly through this channel, and consequently, their exchange occurs preferentially in this channel. According to Table 1, the ion exchange of Na+ for Ag+ in the AgMOR sample is not 100%, indicating that there are still sites (but in a much smaller proportion than in starting NaMOR) with Na+ cations available for exchange.
Due to valence 2+ of iron cation, its exchange only occurs within the 8-MR channels, as shown in Figure 8b. This is because the Fe2+ cation necessarily requires both single-charge sites in the 8-MR channels for its exchange, and the presence of at least one Ag+ cation in this channel makes its lodging impossible. Therefore, if the zeolite is first exchanged with Ag+ ions, these lodge in as many 8 MR rings as possible (Figure 8c), thus decreasing the number of accessible sites for Fe2+ (Figure 8d). Indeed, the silver content in the AgFeMOR sample is the lowest for our system (see Table 1). As already discussed, the Ag+ ion alone has a marked effect on planes located in the range 8 < 2θ < 30, whereas the iron ion alone directly affects the (110) plane. XRD pattern of the AgFeMOR sample (see Figure 1) is still dominated by the influence of Ag and, to a lesser extent, Fe. This agrees with the described ion exchange model.
Figure 8c shows the channels through which the exchange of Fe2+ in NaMOR zeolite is possible. As mentioned above, it corresponds to 8-MR channels only. Without the prior presence of Ag+ cations, the number of 8-MR channels in which Fe2+ cations can be accommodated is relatively greater. Starting from this configuration (which is associated with the FeMOR sample), Figure 8d shows four possible sites where Ag+ cations can be located, giving rise to the expected configuration in the FeAgMOR sample: (a) in 12-MR (indicated by I), (b) in 8-MR channels where no Fe2+ is present (indicated by II and III, respectively) and (c) ionic substitution of Fe2+ cations by Ag+ cations in the 8-MR channels (indicated by IV). Evidence of the substitution of Fe cations for Ag can be seen in Table 1, which shows the percentage of Fe in the FeAgMOR sample to be lower than in FeMOR. A comparison of XRD patterns of FeMOR and FeAgMOR samples (see Figure 1) shows the order of Ag introduction to increase the intensity of the peak associated with the Mordenite (110) plane, which also points to partial removal of Fe from the sample. Additionally, the XRD patterns of AgMOR, FeAgMOR and AgFeMOR samples show that the peaks in the range 8 < θ < 30 present similar behaviors. This indicates that Ag takes up the exchange sites, removing Fe, which can only be found in the 8-MR channels. This type of interaction has already been observed in other studies [12,20].

3. Materials and Methods

3.1. Samples Preparation

The sodium form of mordenite (NaMOR) with a Si/Al atomic ratio of 6.5 was supplied by Zeolyst Int. (Product CBV-10A, Zeolyst International, Conshohocken, PA, USA). The precursor of Ag was a 0.03 N AgNO3 aqueous solution, and the precursor of Fe was a 0.03 N FeSO4 aqueous solution. In order to avoid hydrolysis, the solution was acidified by adding H2SO4 until the pH was adjusted to 2; the choice of this particular value is based on data from [56]. Both cations (Ag+ and Fe2+) were sequentially introduced into initial mordenite by routine ion exchange method from solution for 24 h at a temperature of 60 °C. After each ion exchange procedure, samples were filtered, washed and dried in air at 110 °C for 20 h. All sample preparation steps were conducted under conditions excluding direct light penetration, reducing illumination time to the minimum achievable to avoid, if possible, the potential reduction in silver ions under the action of light.
For sample preparation, 2 g of NaMOR were sequentially treated with solutions containing the same total equivalent concentration (normality) of each of the metals, varying the order of successive exchanges. Preparation of monometallic samples involves one ion exchange step of the starting NaMOR in the corresponding solution. The preparation of bimetallic samples includes two stages of ion exchange; the resulting samples were labeled as AgFeMOR and FeAgMOR, where the first element symbol refers to the cation that was exchanged by the first.

3.2. Characterization Methods

Quantitative chemical analysis of the samples was carried out by inductively coupled plasma optical emission spectrometry (ICP-OES) method using a VARIAN VISTA MPX CCD SIMULTANEOUS spectrometer (Varian Inc., Palo Alto, CA, USA). Samples were pretreated by degassing followed by dissolution in a mixture of HNO3 and HF at 40 °C overnight and adding a solution of H3BO3 at 40 °C for 5 h.
Textural properties were determined from nitrogen adsorption-desorption isotherms at 196 °C, recorded with a Micromeritics TriStar 3000 apparatus (Micromeritics Instruments Corp., Norcross, GA, USA). Before experiments, samples were degassed at 300 °C in a vacuum for 5 h. The volume of adsorbed N2 was normalized to standard temperature and pressure. The specific surface area (SBET) of samples was calculated by applying the BET method to nitrogen adsorption data within the P/P0 range of 0.005–0.250. The average pore diameter was calculated by applying the Barret–Joyner–Halenda (BJH) method to the adsorption and desorption branches of N2 isotherms. Total pore volume was obtained from isotherms at P/P0 = 0.99.
High-resolution transmission electron microscopy (HRTEM) studies were carried out using a JEM 2010 microscope operating at an accelerating voltage of 200 kV (JEOL Ltd., Tokyo, Japan). Samples were ground into a fine powder and ultrasonically dispersed in isopropanol at room temperature. Then, a drop of the suspension was put on a lace carbon-coated Cu grid. For each sample, at least ten representative images were captured. Each sample plotted particle size distribution histograms for 450–500 particles.
X-Ray diffraction patterns were recorded on a Panalytical X’Pert diffractometer using Cu Kα radiation (λ = 0.154 nm). Samples were measured in a 2θ range of 5–55° at 45 kV and 40 mA using a scan step of 0.02° per second. Rietveld refining was performed using X’Pert HighScore Plus software (Malvern Panalytical Ltd., Malvern, UK).
Diffuse reflectance UV-Vis absorption spectra (DR UV-Vis) were recorded in a reflectance mode using a UV-Vis-NIR Cary 5000 spectrometer (Agilent Technologies Inc., Santa Clara, CA, USA) equipped with a diffuse reflectance attachment with an integrating sphere coated by BaSO4. Prior to each measurement, the baseline spectrum was collected using Teflon as a reference sample. The obtained DR UV-Vis spectra measured at room temperature are reported as a Kubelka–Munk function F(R) versus wavelength (nm).
Samples were analyzed by X-ray photoelectron spectroscopy (XPS, DLD, HSA3500, SPECS, Berlin, Germany) with a custom-made SPECS GmbH system using a PHOIBOS 150 WAL hemispherical analyzer and a non-monochromatic X-Ray source. All data were acquired using Al Kα X-rays (1486.6 eV, 200 W). A pass energy of 50 eV, a step size of 0.1 eV/step and a high-intensity lens mode were selected. The diameter of the analyzed area was 3 mm. Charging shifts were correlated against adventitious carbon (C 1s at 284.5 eV). Pressure in the analytical chamber was maintained below 1 × 10⁻⁸ mbar. The accuracy of the binding energy (BE) values was about ±0.1 eV.
Ag K-edge EXAFS spectra were measured in transmission mode at Structural Materials Science end-station (Kurchatov Syncrotron Radiation Source, Moscow, Russia). Two different channel-cut monochromators were used for energy scanning: Si (220) in the case of the Ag K edge and Si (111) in the case of the Fe K-edge. Incident and transmitted X-ray beam intensities were measured using ion chambers filled with Ar and Xe, respectively, at atmospheric pressure. Primary processing of the XAFS spectra was conducted in terms of the IFEFFIT software package [57,58].
Micro-Raman spectra were measured at room temperature with a Jobin Yvon HR800 LabRam spectrometer (Horiba Ltd., Tokyo, Japan) provided with a confocal Olympus BX41 microscope, using a CCD detector, an 1800-line grating and a 784.29 nm laser diode as an excitation light source. A few milligrams of powders of the analyzed samples were dispersed on an aluminum sheet that formed a layer about 10 mm in diameter and about 1 mm thick, and a laser beam was directed to the center of this area. The beam size has a diameter of ca. 2 μm. The reported micro-Raman spectra of the set of samples were measured at a power of 3.0 mW. All micro-Raman measurements have a wide and strong signal due to fluorescence, which was eliminated. Spectra were normalized to the intensity of the band at 398 cm−1 of the NaMOR sample. The spectral region analyzed in this report is from 200 to 800 cm−1 because this region contains the lattice vibrational modes of mordenite rings of its framework structure.

4. Conclusions

Several species of silver were formed in two promising environment protection mordenite-based catalysts with different orders of cation deposition, AgFeMOR and FeAgMOR, and a reference monometallic sample AgMOR. The local environment of Ag atoms in the obtained samples is different: in the AgMOR sample, silver is mainly in the monoatomic form, in the FeAgMOR sample, there are silver dimers, and in the AgFeMOR a high value of the Ag-Ag coordination number corresponds to the presence of metal NPs. In all samples, the formation of a certain amount of large (more than 2 nm) silver particles was observed, but the proportion is associated with each sample. For AgMOR, there are colloidal unstructured NPs, while for AgFeMOR and FeAgMOR, the crystalline metallic silver phase is also observed besides colloidal. Partially charged Agnδ+ clusters with a size of the order of ~0.7 nm, which corresponds to the free diameter of the mordenite channel, are observed in all studied samples. These particles are organized into domains with distances between particles similar to those between mordenite channels and are formed due to the partial reduction in Ag+ in mordenite voids and subsequent agglomeration of atoms and ions.
According to XPS and XANES data, most of the silver in all samples is in a cationic state, and Ag+ coordination in the mordenite structure does not depend on the order of metal deposition. However, EXAFS data indicate the presence of small particles and/or Ag clusters in all samples. Considering the phenomenon of interference in EXAFS oscillations, which interprets in terms of the local structure of Ag in zeolite difficult, four different (close but not identical) interatomic distances between Ag and each of its nearest neighbors (Ag-O, Ag-Si or Ag-Al) were determined. EXAFS data show no difference in the coordination of silver cations in mordenite structure, either because of the presence of the second cation or because of changes in the order of cation deposition. By micro-Raman spectroscopy, it was shown the cation of the first step of ion exchange to define framework changes (exchange with Fe2+ saved the structure of NaMOR, while exchange with Ag+ leads to large deformation in the mordenite structure), while the second step ion exchange does not make much difference. It confirms cation deposition order to be a crucial factor for the properties of resulting materials. It was approved by micro-Raman results that mordenite framework deformation in AgFeMOR connected with the incorporation of Fe3+ into the mordenite framework at the Al3+ position.
For the first time, it was proposed a theoretical model of mordenite structure, which made it possible to reveal the distribution of exchangeable silver and iron cations and synergistic effects in the preparation of bimetallic samples. The mechanism considered ion exchange from solutions, redox cation–cation interaction in zeolite voids, and cation–zeolite electrostatic interaction. It was shown that silver cations could be located both in 8 and 12-member ring pockets, while iron cation exchange selectively in 8-member ring pockets. Cation deposition order designates who will take 8-MR first, silver or iron, and, consequently, determines the physicochemical and catalytic properties of resulting materials. Moreover, cation location in the side pockets means that mordenite transporting channels are free, which is beneficial for applying studied materials in catalysis and adsorption.

Author Contributions

Conceptualization, Y.K. and V.P.; methodology, P.S.-L., E.K., G.B. and L.M.-R.; software, J.A.-G.; validation, F.C.-R., V.P., S.F.-M. and A.P.; formal analysis, V.P., S.F.-M. and A.P.; investigation, P.S.-L., E.K., G.B. and V.P.; data curation, P.S.-L. and Y.K.; writing—original draft preparation, P.S.-L., Y.K., J.A.-G. and V.P.; writing—review and editing, Y.Z., V.P., S.F.-M. and A.P.; supervision, Y.Z., F.C.-R., V.P. and S.F.-M.; funding acquisition, F.C.-R., V.P., S.F.-M. and A.P. All authors have read and agreed to the published version of the manuscript.

Funding

This research was funded by basic-science grant A1-S-33492; CONACYT, grant 117373 project SENER-CONACyT 117373, COFAA-IPN-México, Tomsk Polytechnic University grant Priority-2030-NIP/EB-045-1308-2022.

Acknowledgments

The authors thank E. Smolentseva, E. Aparicio, D. Domínguez, F. Ruiz, J. Mendoza and E. Flores for valuable technical assistance.

Conflicts of Interest

The authors declare no conflict of interest.

References

  1. Liu, L.; Corma, A. Confining isolated atoms and clusters in crystalline porous materials for catalysis. Nat. Rev. Mater. 2020, 6, 244–263. [Google Scholar] [CrossRef]
  2. Sánchez-López, P.; Kotolevich, Y.; Yocupicio-Gaxiola, R.I.; Antúnez-García, J.; Chowdari, R.K.; Petranovskii, V.; Fuentes-Moyado, S. Recent Advances in Catalysis Based on Transition Metals Supported on Zeolites. Front. Chem. 2021, 9, 716745. [Google Scholar] [CrossRef] [PubMed]
  3. Zhang, Q.; Gao, S.; Yu, J. Metal Sites in Zeolites: Synthesis, Characterization, and Catalysis. Chem. Rev. 2022. [Google Scholar] [CrossRef] [PubMed]
  4. Xue, K.; Mo, Y.; Long, B.; Wei, W.; Shan, C.; Guo, S.; Niu, L. Single-atom catalysts supported on ordered porous materials: Synthetic strategies and applications. InfoMat 2022, 4, e12296. [Google Scholar] [CrossRef]
  5. Luo, W.; Cao, W.; Bruijnincx, P.C.A.; Lin, L.; Wang, A.; Zhang, T. Zeolite-supported metal catalysts for selective hydrodeoxygenation of biomass-derived platform molecules. Green Chem. 2019, 21, 3744–3768. [Google Scholar] [CrossRef]
  6. Dalena, F.; Giglio, E.; Marino, A.; Aloise, A.; Giorgianni, G.; Migliori, M.; Giordano, G. Steam Reforming of Bioethanol Using Metallic Catalysts on Zeolitic Supports: An Overview. Catalysts 2022, 12, 617. [Google Scholar] [CrossRef]
  7. Liu, H.; You, C.; Wang, H. Experimental and Density Functional Theory Studies on the Zeolite-Based Fe–Ni–W Trimetallic Catalyst for High-Temperature NOx Selective Catalytic Reduction: Identification of Active Sites Suppressing Ammonia Over-oxidation. ACS Catal. 2021, 11, 1189–1201. [Google Scholar] [CrossRef]
  8. Lu, Y.; Zhang, Z.; Lin, F.; Wang, H.; Wang, Y. Single-atom Automobile Exhaust Catalysts. ChemNanoMat 2020, 6, 1659–1682. [Google Scholar] [CrossRef]
  9. Pappas, D.K.; Kvande, K.; Kalyva, M.; Dyballa, M.; Lomachenko, K.A.; Arstad, B.; Borfecchia, E.; Bordiga, S.; Olsbye, U.; Beato, P.; et al. Influence of Cu-speciation in mordenite on direct methane to methanol conversion: Multi-Technique characterization and comparison with NH3 selective catalytic reduction of NOx. Catal. Today 2021, 369, 105–111. [Google Scholar] [CrossRef]
  10. Xu, G.; Wang, H.; Yu, Y.; He, H. Role of silver species in H2-NH3-SCR of NOx over Ag/Al2O3 catalysts: Operando spectroscopy and DFT calculations. J. Catal. 2021, 395, 1–9. [Google Scholar] [CrossRef]
  11. Antúnez-García, J.; Galván, D.H.; Petranovskii, V.; Murrieta-Rico, F.N.; Yocupicio-Gaxiola, R.I.; Shelyapina, M.G.; Fuentes-Moyado, S. Aluminum distribution in mordenite-zeolite framework: A new outlook based on density functional theory calculations. J. Solid State Chem. 2022, 306, 122725. [Google Scholar] [CrossRef]
  12. Sánchez-López, P.; Kotolevich, Y.; Miridonov, S.; Chávez-Rivas, F.; Fuentes, S.; Petranovskii, V. Bimetallic AgFe Systems on Mordenite: Effect of Cation Deposition Order in the NO Reduction with C3H6/CO. Catalysts 2019, 9, 58. [Google Scholar] [CrossRef] [Green Version]
  13. Yeom, Y.; Li, M.; Sachtler, W.; Weitz, E.W. Low-temperature NOx reduction with ethanol over Ag/Y: A comparison with Ag/γ-Al2O3 and BaNa/Y. J. Catal. 2007, 246, 413–427. [Google Scholar] [CrossRef]
  14. Bartolomeu, R.; Mendes, A.N.; Fernandes, A.; Henriques, C.; da Costa, P.; Ribeiro, M.F. NOx SCR with decane using Ag–MFI catalysts: On the effect of silver content and co-cation presence. Catal. Sci. Technol. 2015, 6, 3038–3048. [Google Scholar] [CrossRef]
  15. Rodríguez-Iznaga, I.; Petranovskii, V.; Chávez-Rivas, F.; Shelyapina, M.G. Bimetallic Copper-Silver Systems Supported on Natural Clinoptilolite: Long-Term Changes in Nanospecies’ Composition and Stability. Inorganics 2022, 10, 34. [Google Scholar] [CrossRef]
  16. Liu, Q.; Bian, C.; Ming, S.; Guo, L.; Zhang, S.; Pang, L.; Liu, P.; Chen, Z.; Li, T. The opportunities and challenges of iron-zeolite as NH3-SCR catalyst in purification of vehicle exhaust. Appl. Catal. A Gen. 2020, 607, 117865. [Google Scholar] [CrossRef]
  17. Gao, F. Fe-Exchanged Small-Pore Zeolites as Ammonia Selective Catalytic Reduction (NH3-SCR) Catalysts. Catalysts 2020, 10, 1324. [Google Scholar] [CrossRef]
  18. Zhu, N.; Lian, Z.; Zhang, Y.; Shan, W.; He, H. Improvement of low-temperature catalytic activity over hierarchical Fe-Beta catalysts for selective catalytic reduction of NO with NH3. Chin. Chem. Lett. 2019, 30, 867–870. [Google Scholar] [CrossRef]
  19. Shelyapina, M.G.; Gurgul, J.; Łątka, K.; Sánchez-López, P.; Bogdanov, D.; Kotolevich, Y.; Petranovskii, V.; Fuentes, S. Mechanism of formation of framework Fe3+ in bimetallic Ag-Fe mordenites-Effective catalytic centers for deNOx reaction. Microporous Mesoporous Mater. 2020, 299, 109841. [Google Scholar] [CrossRef]
  20. Sánchez-López, P.; Kotolevich, Y.; Khramov, E.; Chowdari, R.K.; Estrada, M.A.; Berlier, G.; Zubavichus, Y.; Fuentes, S.; Petranovskii, V.; Chávez-Rivas, F. Properties of Iron-Modified-by-Silver Supported on Mordenite as Catalysts for NOx Reduction. Catalysts 2020, 10, 1156. [Google Scholar] [CrossRef]
  21. Fuentes, S.; Petranovskii, V.; Kotolevich, Y.; Miridonov, S.; Sánchez-López, P.; Chávez-Rivas, F.; Machorro, R. Self-assembling of ordered domains of silver nanoparticles into the mordenite channel system. In Proceedings of the 13th International Symposium on Nanophotonics and Metamaterials, St. Petersburg, Russia, 4–8 June 2018; p. 194. [Google Scholar]
  22. Sánchez-Lopez, P.; Miridonov, S.; Kotolevich, Y.; Chávez-Rivas, F.; Machorro, R.; Shelyapina, M.; Petranovskii, V.; Fuentes-Moyado, S. Domains of ordered monosized Ag clusters stabilized in mordenite channels formed in bimetallic Fe-Ag system supported on mordenite. In Proceedings of the XV Congreso Mexicano de Catálisis y VI Congreso Internacional, Monterrey, Mexico, 1–6 October 2017. [Google Scholar]
  23. Heo, N.H.; Kim, Y.; Kim, J.J.; Seff, K. Surprising Intrazeolitic Chemistry of Silver. J. Phys. Chem. C 2016, 120, 5277–5287. [Google Scholar] [CrossRef]
  24. Ogden, J.S.; Bogdanchikova, N.E.; Corker, J.M.; Petranovskii, V.P. Structure of silver clusters embedded in erionite channels. Eur. Phys. J. D 1999, 9, 605–608. [Google Scholar] [CrossRef]
  25. Fiddy, S.G.; Bogdanchikova, N.E.; Petranovskii, V.P.; Ogden, J.S.; Avalos-Borja, M. EXAFS and optical spectroscopy characterisation of silver within zeolite matrices. Stud. Surf. Sci. Catal. 2002, 142, 1939–1946. [Google Scholar] [CrossRef]
  26. Fiddy, S.G.; Ogden, J.S.; Petranovskii, V.P. EXAFS and optical spectroscopy characterisation of reduction products of binary silver-copper ion mixture in mordenite. Eur. Phys. J. D–At. Mol. Opt. Phys. 2003, 24, 253–256. [Google Scholar] [CrossRef]
  27. Antúnez-García, J.; Galván, D.H.; Petranovskii, V.; Posada-Amarillas, A. A DFT study of copper-oxide clusters embedded in dry and water-immersed siliceous mordenite. Comput. Mater. Sci. 2015, 106, 140–148. [Google Scholar] [CrossRef]
  28. Bogdanchikova, N.E.; Petranovskii, V.P.; Machorro, M.R.; Sugi, Y.; Soto, G.V.M.; Fuentes, S. Stability of silver clusters in mordenites with different SiO2/Al2O3 molar ratio. Appl. Surf. Sci. 1999, 150, 58–64. [Google Scholar] [CrossRef]
  29. Gurin, V.S.; Petranovskii, V.P.; Bogdanchikova, N.E. Metal clusters and nanoparticles assembled in zeolites: An example of stable materials with controllable particle size. Mater. Sci. Eng. C 2002, 19, 327–331. [Google Scholar] [CrossRef]
  30. Mulvaney, P. Surface Plasmon Spectroscopy of Nanosized Metal Particles. Langmuir 1996, 12, 788–800. [Google Scholar] [CrossRef]
  31. Gurin, V.S.; Petranovskii, V.P.; Hernandez, M.-A.; Bogdanchikova, N.E.; Alexeenko, A.A. Silver and copper clusters and small particles stabilized within nanoporous silicate-based materials. Mater. Sci. Eng. A 2005, 391, 71–76. [Google Scholar] [CrossRef]
  32. Mogensen, K.B.; Kneipp, K. Size-Dependent Shifts of Plasmon Resonance in Silver Nanoparticle Films Using Controlled Dissolution: Monitoring the Onset of Surface Screening Effects. J. Phys. Chem. C 2014, 118, 28075–28083. [Google Scholar] [CrossRef]
  33. Lysenko, V.S.; Mal’nev, A.F. Optical characteristics of metal blacks. J. Appl. Spectrosc. 1969, 10, 566–570. [Google Scholar] [CrossRef]
  34. Rodríguez-Iznaga, I.; Petranovskii, V.; Castillón-Barraza, F.; Concepción-Rosabal, B. Copper-Silver Bimetallic System on Natural Clinoptilolite: Thermal Reduction of Cu2+ and Ag+ Exchanged. J. Nanosci. Nanotechnol. 2011, 11, 5580–5586. [Google Scholar] [CrossRef]
  35. Santhosh Kumar, M.; Schwidder, M.; Grunert, W.; Bentrup, U.; Bruckner, A. Selective reduction of NO with Fe-ZSM-5 catalysts of low Fe content: Part II. Assessing the function of different Fe sites by spectroscopic in situ studies. J. Catal. 2006, 239, 173–186. [Google Scholar] [CrossRef]
  36. Bordiga, S.; Buzzoni, R.; Geobaldo, F.; Lamberti, C.; Giamello, E.; Zecchina, A.; Leofanti, G.; Petrini, G.; Tozzola, G.; Vlaic, G. Structure and Reactivity of Framework and Extraframework Iron in Fe-Silicalite as Investigated by Spectroscopic and Physicochemical Methods. J. Catal. 1996, 158, 486–501. [Google Scholar] [CrossRef]
  37. Setyawati, I.A.; Rettig, S.J.; Orvig, C. Cationic iron(III) complex with a hexadentate N2, N′2′, O2-aminopyridylphenolate ligand. Can. J. Chem. 1999, 77, 2033–2038. [Google Scholar] [CrossRef]
  38. Rtimi, S.; Baghriche, O.; Sanjines, R.; Pulgarin, C.; Bensimon, M.; Kiwi, J. TiON and TiON-Ag sputtered surfaces leading to bacterial inactivation under indoor actinic light. J. Photochem. Photobiol. A Chem. 2013, 256, 52–63. [Google Scholar] [CrossRef] [Green Version]
  39. Mejía, M.I.; Restrepo, G.; Marín, J.M.; Sanjines, R.; Pulgarín, C.; Mielczarski, E.; Mielczarski, J.; Kiwi, J. Magnetron-Sputtered Ag Surfaces. New Evidence for the Nature of the Ag Ions Intervening in Bacterial Inactivation. ACS Appl. Mater. Interfaces 2010, 2, 230–235. [Google Scholar] [CrossRef]
  40. Lopez-Salido, I.; Lim, D.C.; Kim, Y.D. Ag nanoparticles on highly ordered pyrolytic graphite (HOPG) surfaces studied using STM and XPS. Surf. Sci. 2005, 588, 6–18. [Google Scholar] [CrossRef]
  41. Lim, D.C.; Lopez-Salido, I.; Kim, Y.D. Size selectivity for CO-oxidation of Ag nanoparticles on highly ordered pyrolytic graphite (HOPG). Surf. Sci. 2005, 598, 96–103. [Google Scholar] [CrossRef]
  42. Suzuki, Y.; Miyanaga, T.; Hoshino, H.; Matsumoto, N.; Ainai, T. In-Situ XAFS Study of Ag Clusters in Zeolite 4A. Phys. Scr. 2005, 2005, 765. [Google Scholar] [CrossRef]
  43. Borgna, A.; Stagg, S.M.; Resasco, D.E. Interference Phenomena in the EXAFS Spectra of Pt−Sn Bimetallic Catalysts. J. Phys. Chem. B 1998, 102, 5077–5081. [Google Scholar] [CrossRef]
  44. Niggli, P. XII. Die Kristallstruktur einiger Oxyde I. Z. Für Krist.-Cryst. Mater. 1922, 57, 253–299. [Google Scholar] [CrossRef] [Green Version]
  45. Boix, A.V.; Aspromonte, S.G.; Miro, E.E. Deactivation studies of the SCR of NOx with hydrocarbons on Co-mordenite monolithic catalysts. Appl. Catal. A Gen. 2008, 341, 26–34. [Google Scholar] [CrossRef]
  46. Dutta, P.K.; Rao, K.M.; Park, J.Y. Correlation of Raman Spectra of Zeolites with Framework Architecture. J. Phys. Chem. 1991, 95, 6654–6656. [Google Scholar] [CrossRef]
  47. Dutta, P.K.; Puri, M. Synthesis and Structure of Zeolite ZSM-5: A Raman Spectroscopic Study. J. Phys. Chem. 1987, 91, 4329–4333. [Google Scholar] [CrossRef]
  48. Król, M.; Mozgawa, W.; Barczyk, K.; Bajda, T.; Kozanecki, M. Changes in the vibrational spectra of zeolites due to sorption of heavy metal cations. J. Appl. Spectrosc. 2013, 80, 644–650. [Google Scholar] [CrossRef]
  49. Jin, S.; Feng, Z.; Fan, F. UV Raman Spectroscopic Characterization of Catalysts and Catalytic Active Sites. Catal. Lett. 2015, 145, 468–481. [Google Scholar] [CrossRef]
  50. Yu, Y.; Xiong, G.; Li, C.; Xiao, F.-S. Characterization of Iron Atoms in the Framework of MFI-Type Zeolites by UV Resonance Raman Spectroscopy. J. Catal. 2000, 194, 487–490. [Google Scholar] [CrossRef]
  51. Sun, K.; Fan, F.; Xia, H.; Feng, Z.; Li, W.-X.; Li, C. Framework Fe Ions in Fe-ZSM-5 Zeolite Studied by UV Resonance Raman Spectroscopy and Density Functional Theory Calculations. J. Phys. Chem. C 2008, 112, 16036–16041. [Google Scholar] [CrossRef]
  52. Ju, X.; Tian, F.; Wang, Y.; Fan, F.; Feng, Z.; Li, C. A novel synthetic strategy of Fe-ZSM-35 with pure framework Fe species and its formation mechanism. Inorg. Chem. Front. 2018, 5, 2031–2037. [Google Scholar] [CrossRef]
  53. Li, Y.; Feng, Z.; Xin, H.; Fan, F.; Zhang, J.; Magusin, P.C.M.M.; Hensen, E.J.M.; van Santen, R.A.; Yang, Q.; Li, C. Effect of Aluminum on the Nature of the Iron Species in Fe-SBA-15. J. Phys. Chem. B 2006, 110, 26114–26121. [Google Scholar] [CrossRef]
  54. Chlebda, D.K.; Stachurska, P.; Jedrzejczyk, R.J.; Kuterasinski, Ł.; Dziedzicka, A.; Górecka, S.; Chmielarz, L.; Łojewska, J.; Sitarz, M.; Jodłowski, P.J. DeNOx Abatement over Sonically Prepared Iron-Substituted Y, USY and MFI Zeolite Catalysts in Lean Exhaust Gas Conditions. Nanomaterials 2018, 8, 21. [Google Scholar] [CrossRef] [Green Version]
  55. Bremard, C.; Le Maire, M. Low-frequency Raman spectra of dehydrated faujasite zeolites. J. Phys. Chem. 1993, 97, 9695–9702. [Google Scholar] [CrossRef]
  56. Brandenberger, S.; Kröcher, O.; Tissler, A.; Althoff, R. The State of the Art in Selective Catalytic Reduction of NOx by Ammonia Using Metal-Exchanged Zeolite Catalysts. Catal. Rev. 2008, 50, 492–531. [Google Scholar] [CrossRef]
  57. Ravel, B.; Newville, M. ATHENA, ARTEMIS, HEPHAESTUS: Data analysis for X-ray absorption spectroscopy using IFEFFIT. J. Synchrotron Radiat. 2005, 12, 537–541. [Google Scholar] [CrossRef] [Green Version]
  58. Newville, M. IFEFFIT: Interactive XAFS analysis and FEFF fitting. J. Synchrotron Radiat. 2001, 8, 322–324. [Google Scholar] [CrossRef]
Figure 1. XRD patterns of the studied samples. Diffraction lines with different relative peak intensities, corresponding to mordenite, for samples of the source material; after the exchange of Na+ for Fe2+ or Ag+ are marked with the symbols “#” and “*”, respectively.
Catalysts 12 01453 g001
Figure 2. Microphotographs and the corresponding size distribution of Ag particles for the studied samples (da is the average diameter): (a) AgMOR; (b) AgFeMOR; (c) FeAgMOR.
Catalysts 12 01453 g002
Figure 3. Diffuse reflectance UV-Vis spectra of the support, monometallic and bimetallic samples.
Catalysts 12 01453 g003
Figure 4. Ag 3d5/2 photoelectron spectra of the studied samples.
Catalysts 12 01453 g004
Figure 5. (a) Ag K-edge XANES spectra; (b) Ag K-edge EXAFS Fourier transforms taken in the k-range from 3 to 15 Å−1.
Catalysts 12 01453 g005
Figure 6. Normalized micro-Raman spectra exited by a 784.29 nm laser line for (a) NaMOR, FeMOR and FeAgMOR; (b) NaMOR, AAgMOR and AgFeMOR.
Catalysts 12 01453 g006
Figure 7. Distribution of different atomic species in the unit cell of NaMOR (enclosed in a square frame) for Si/Al = 7. In the image, the spaces enclosed by the 12-MR, 8-MR, 5-MR and 4-MR rings were colored yellow, green, gray and blue, respectively.
Catalysts 12 01453 g007
Figure 8. Sketch of distribution processes of Ag+ and Fe2+ cations in mordenite channels. Formation of (a) FeMOR, (b) FeAgMOR; (c) AgMOR and (d) AgFeMOR.
Catalysts 12 01453 g008
Table 1. Textural properties of the studied samples.
SampleSBET, m2∙g−1Vtotal, cm3∙g−1Vmicro, cm3∙g−1Pore Diameter, Å
NaMOR3380.190.1622.8
AgMOR3220.190.1423.2
FeMOR3980.230.1723.3
AgFeMOR3430.200.1523.7
FeAgMOR3360.200.1424.1
Table 2. Chemical composition of the samples, measured by ICP-OES.
SampleAtomic %
SiAlOAgFeNaSi/AlEIEM
EIEM-Fe2+EIEM–Fe3+
NaMOR48.97.533.9--9.76.51.29
AgMOR38.15.849.94.6-1.66.51.07
FeMOR44.06.445.4-0.83.46.80.780.91
FeAgMOR37.25.451.93.60.41.56.91.091.17
AgFeMOR39.75.949.73.10.90.76.70.951.10
Table 3. Ag 3d5/2 binding energy (eV) of deconvoluted peaks.
SamplesAg ionsAg-Support
Interaction
Ag0Agn Clusters, Ø < 2 nm
366.2 eV367.4–368 eV368.0–368.2 eV≥369 eV
AgMOR-367.07-(12%)-368.79-(88%)
AgFeMOR366.56-(20%)368.52-(80%)
FeAgMOR-367.65-(29%)-369.14-(71%)
Table 4. Structural parameters obtained from Ag K-edge EXAFS fitting (R-range is from 1.2 to 3 Å, k-range is from 3 to 15 Å−1, kw = 3) for references and studied samples.
SampleScattering PathCoordination NumberInteratomic
Distance, Å
Debye Factor, Å2R-Factor, %
Ref. Ag foilAg-Ag122.89--
Ref. Ag2OAg-O42.04 [44]--
Ag-Ag83.34-
AgMORAg-O1.41.910.00013.1
1.42.05
1.42.12
1.42.24
Ag-(Si or Al)1.32.820.0020
1.32.96
1.33.02
1.33.15
Ag-Ag0--
AgFeMORAg-O11.900.00012.3
12.04
12.10
12.22
Ag-(Si or Al)12.920.0028
12.92
13.12
13.21
Ag-Ag1.62.820.0059
FeAgMORAg-O11.900.00091.3
12.04
12.11
12.22
Ag-(Si or Al)12.900.0030
12.90
13.02
13.16
Ag-Ag0.52.760.0043
Publisher’s Note: MDPI stays neutral with regard to jurisdictional claims in published maps and institutional affiliations.

