Article

Efficient and Stable Catalytic Hydrogen Evolution of ZrO2/CdSe-DETA Nanocomposites under Visible Light

1
School of Food Engineering, Anhui Science and Technology University, Fengyang 233100, China
2
Key Laboratory of Functional Molecular Solids, Ministry of Education, College of Chemistry and Materials Science, Anhui Normal University, Wuhu 241000, China
3
Anhui Province Key Laboratory of Pollutant Sensitive Materials and Environmental Remediation, School of Physics and Electronic Information, Huaibei Normal University, Huaibei 235000, China
*
Authors to whom correspondence should be addressed.
Catalysts 2022, 12(11), 1385; https://doi.org/10.3390/catal12111385
Submission received: 9 October 2022 / Revised: 28 October 2022 / Accepted: 4 November 2022 / Published: 8 November 2022
(This article belongs to the Special Issue Advances in Heterojunction Photocatalysts)

Abstract

:
Composite photocatalysts are crucial for photocatalytic hydrogen evolution. In this work, ZrO2/CdSe-diethylenetriamine (ZrO2/CdSe-DETA) heterojunction nanocomposites are synthesized, and efficiently and stably catalyzed hydrogen evolution under visible light. X-ray photoelectron spectroscopy (XPS) and high resolution transmission electron microscope (HRTEM) confirm the formation of heterojunctions between ZrO2 (ZO) and CdSe-DETA (CS). Ultraviolet–visible spectroscopy diffuse reflectance spectra (UV-vis DRS), Mott–Schottky, and theoretical calculations confirm that the mechanism at the heterojunction of the ZrO2/CdSe-DETA (ZO/CS) nanocomposites is Type-I. Among the ZO/CS nanocomposites (ZO/CS-0.4, ZO/CS-0.6, and ZO/CS-0.8; in the nanocomposites, the mass ratio of ZO to CS is 0.1:0.0765, 0.1:0.1148, and 0.1:0.1531, respectively). ZO/CS-0.6 nanocomposite has the best photocatalytic hydrogen evolution activity (4.27 mmol g−1 h−1), which is significantly higher than ZO (trace) and CS (1.75 mmol g−1 h−1). Within four cycles, the ZO/CS-0.6 nanocomposite maintains an efficient catalytic hydrogen evolution rate. Due to the existence of the heterojunction of the composites, the photogenerated electron-hole pairs can be effectively separated, which accelerates the photocatalytic hydrogen evolution reaction and reduces the progress of photocorrosion. This work reveals the feasibility of ZO/CS nanocomposite photocatalysts for hydrogen evolution.

1. Introduction

The increasing consumption of nonrenewable energy has caused many environmental problems, and the exploration of clean energy is gradually increasing [1,2,3,4]. Hydrogen energy is considered as one of the ideal green energy sources because of its high heat, it only leaves water behind after combustion, it is completely pollution-free, and it is recyclable [5,6,7,8,9]. Photocatalytic technology can effectively solve the hydrogen acquisition problem by utilizing the continuous production of hydrogen from a wide range of solar energy photocatalytic semiconductor material sources [10,11,12,13,14]. As a classical semiconductor material, cadmium selenide (CdSe) has been widely used in photocatalytic hydrogen evolution experiments due to its suitable band gap, visible light absorption, and better hydrogen evolution activity [15,16,17,18]. However, the inherent drawbacks of a single photocatalyst still limit the development of CdSe. Therefore, research is needed to explore ways to effectively solve the above problems.
The traditional way to change the photocatalytic properties of a single semiconductor is to modify its morphology and thus improve its intrinsic properties. Therefore, we synthesized CdSe-diethylenetriamine (CdSe-DETA) with a large Brunauer–Emmett–Teller (BET) surface area by the method of hybridizing diethylenetriamine with CdSe, obtaining better photocatalytic hydrogen evolution activity and stability, which alleviated the inherent drawbacks of CdSe [11]. Yet, there were still no substantial changes in the band structure, light absorption characteristics, or the charge mobility of a single photocatalyst. In recent years, more and more researchers have found that the mutual recombination between semiconductor materials can effectively solve the shortcomings of a single photocatalyst [19,20,21,22,23,24,25,26]. For example, Ma et al. combined CdSe with WO3(H2O)0.333 to significantly enhance the photocatalytic hydrogen evolution activity of single materials [24]. Wang et al. combined CoOx with Pt to effectively enhance the hydrogen evolution activity and stability of single materials [25]. These studies are based on the combination of photocatalysts that have a broad forbidden band width, good stability, and are non-toxic and inexpensive. Among numerous semiconductor photocatalysts, ZrO2 (ZO) perfectly meets the above conditions. However, the study of the composite of (ZO) and CdSe-DETA (CS) in the photocatalytic system has not been reported. Therefore, we combined ZO with CS to address the inherent drawbacks of a single semiconductor photocatalyst.
After the successful composite of ZO and CS, the nanocomposites showed excellent photocatalytic hydrogen evolution activity and good stability. This is attributed to the fact that the composites can effectively separate the photogenerated electrons and holes, resulting in continuous photocatalytic hydrogen evolution. We confirmed the existence of the composites by HRTEM, XPS, and photocatalytic hydrogen evolution activity experiments [27,28,29,30,31,32,33,34,35]. The accuracy of the mechanism at the heterojunctions derived from the experiments is confirmed by theoretical calculations and Mott–Schottky analysis deriving the band gap and conduction band positions of the single materials, respectively. The reasons for the excellent photocatalytic hydrogen evolution activity and stability of the ZO/CS nanocomposites are explored in detail by combining theory and experiment. This work provides a feasible way to explore the way in which composite semiconductor materials can effectively solve the inherent defects of a single semiconductor material.

2. Results

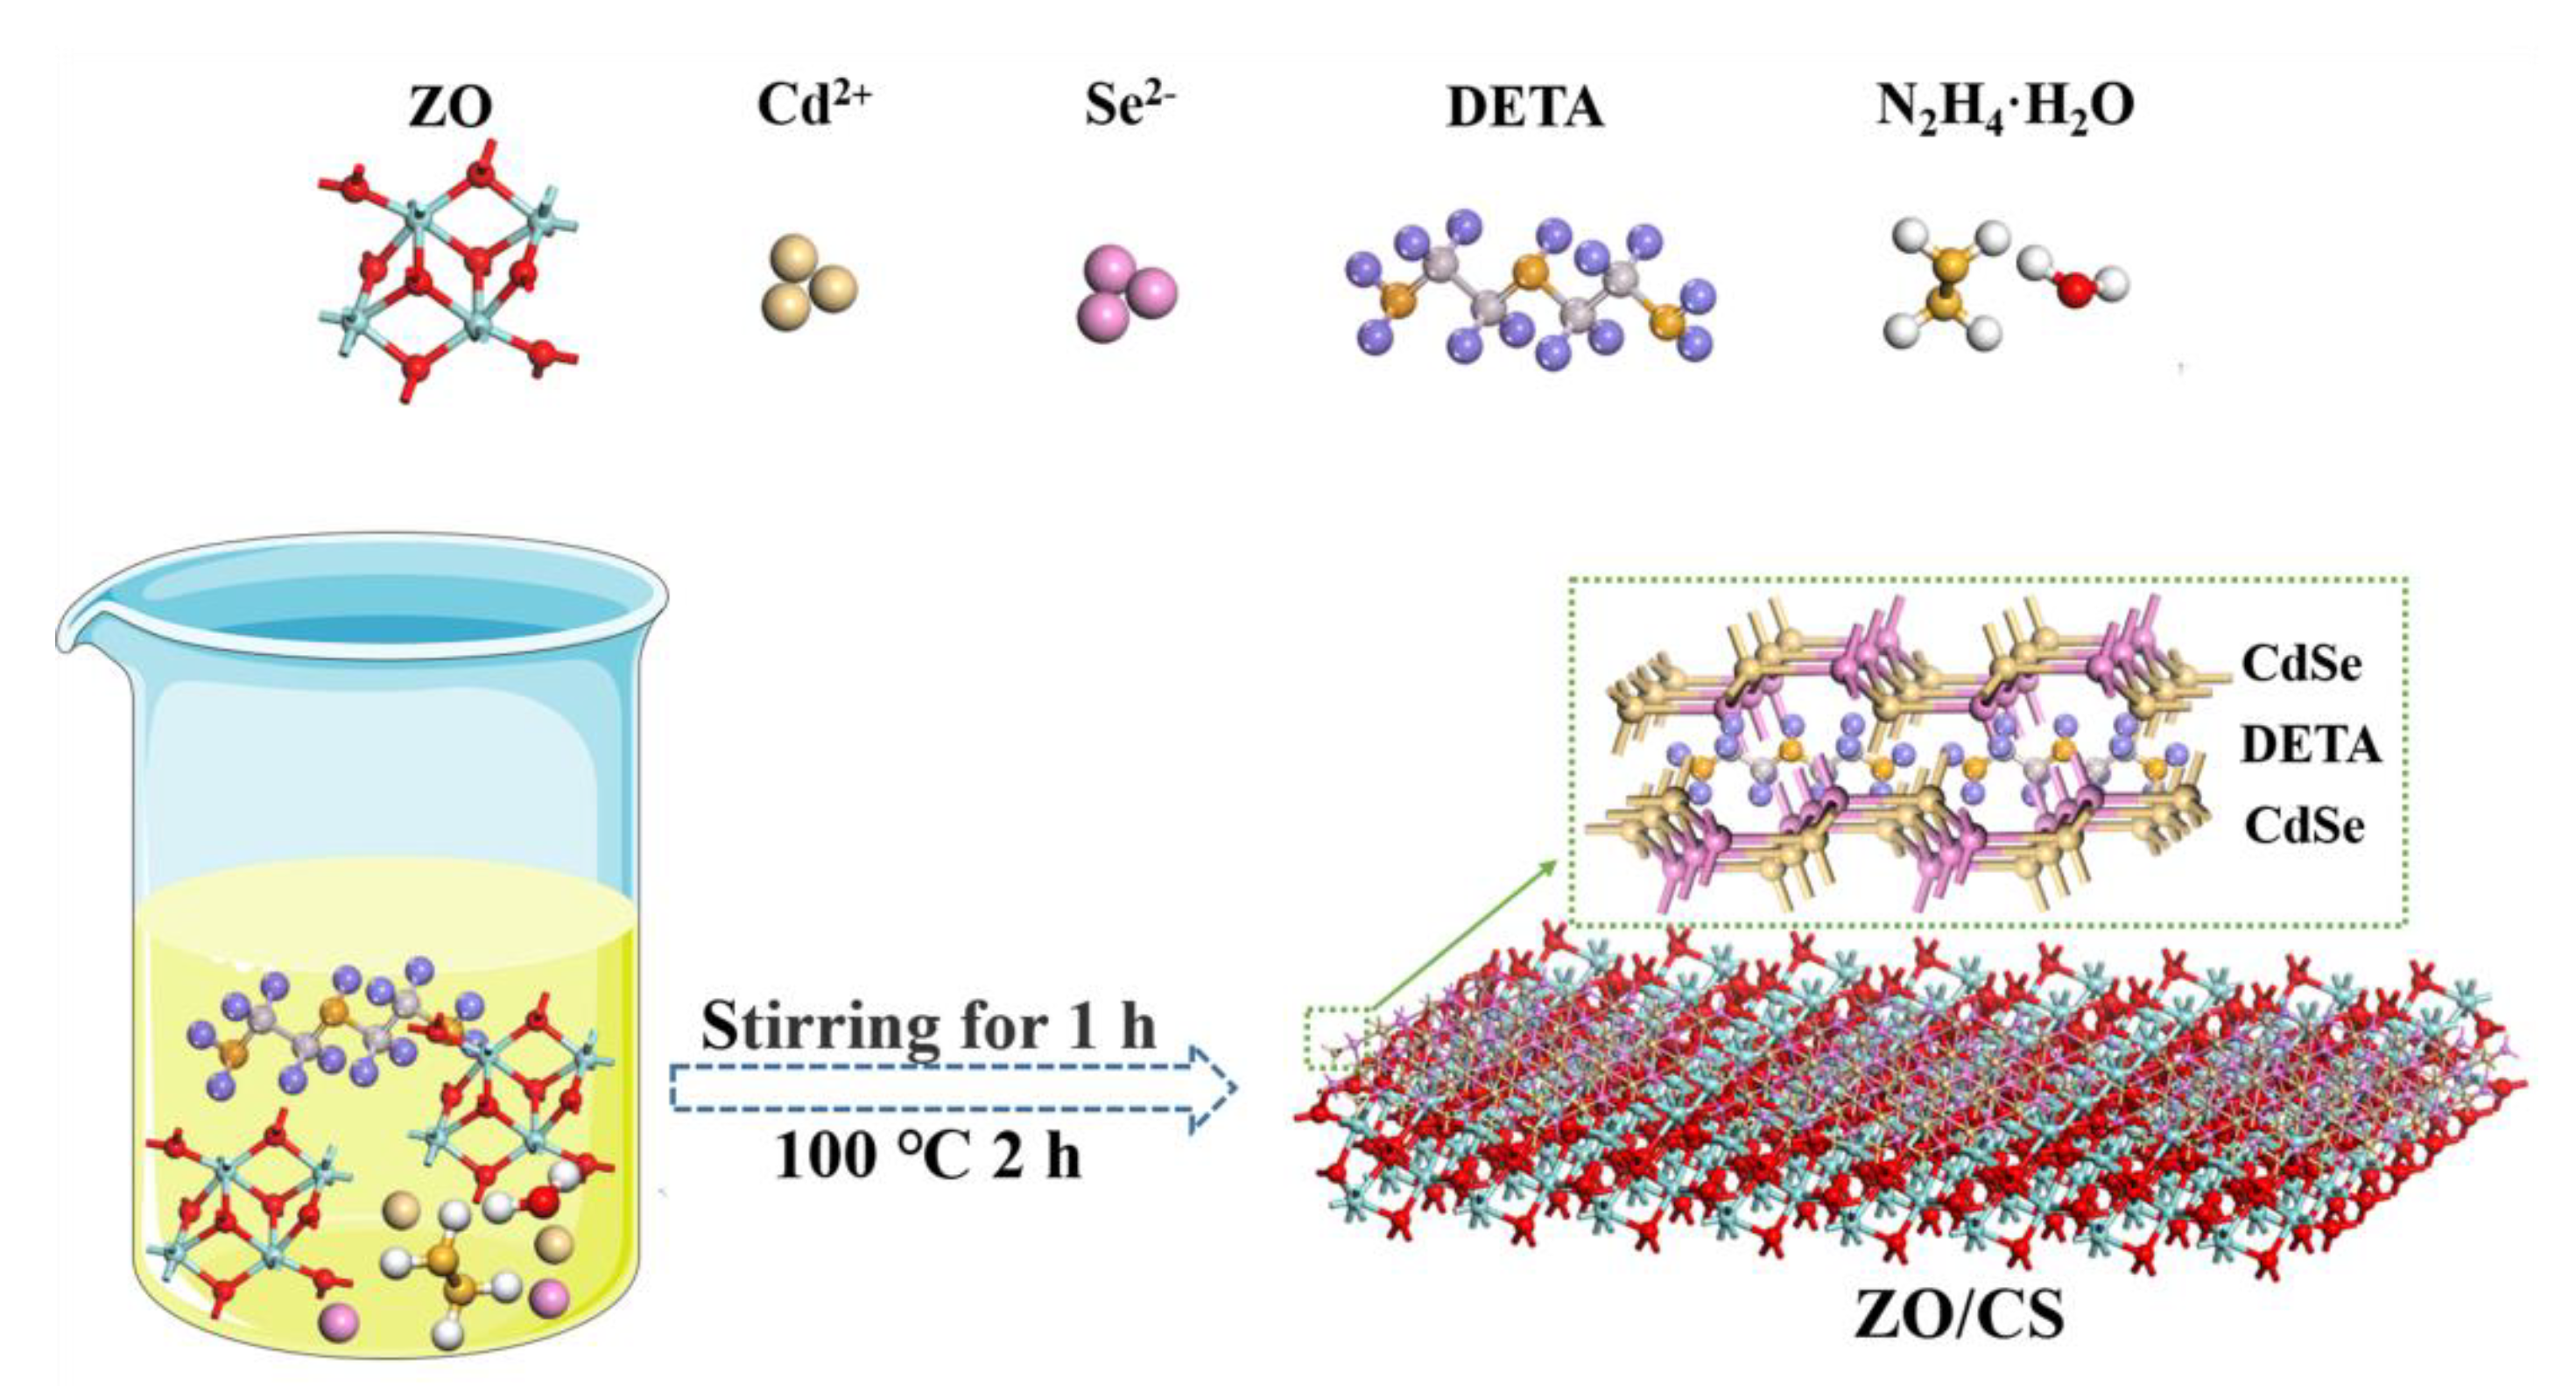
2.1. Flow Chart of Materials Synthesis

The synthesis process of ZO/CS nanocomposites is plotted by constructing a model, as shown in Scheme 1. First, ZO is added to the reactor as a substrate material. After that, Cd2+ (derived from CdCl2·2.5H2O), Se2− (derived from selenium powder), DETA, and N2H4·H2O are added to the reaction solution and stirred for 1 h at room temperature. Then, the above solution is transferred to the reaction kettle and heated in the oven (100 °C for 2 h). Finally, ZO/CS nanocomposites are obtained by repeated centrifugation (five times) and freeze-drying (≥18 h, ≤-45 °C).

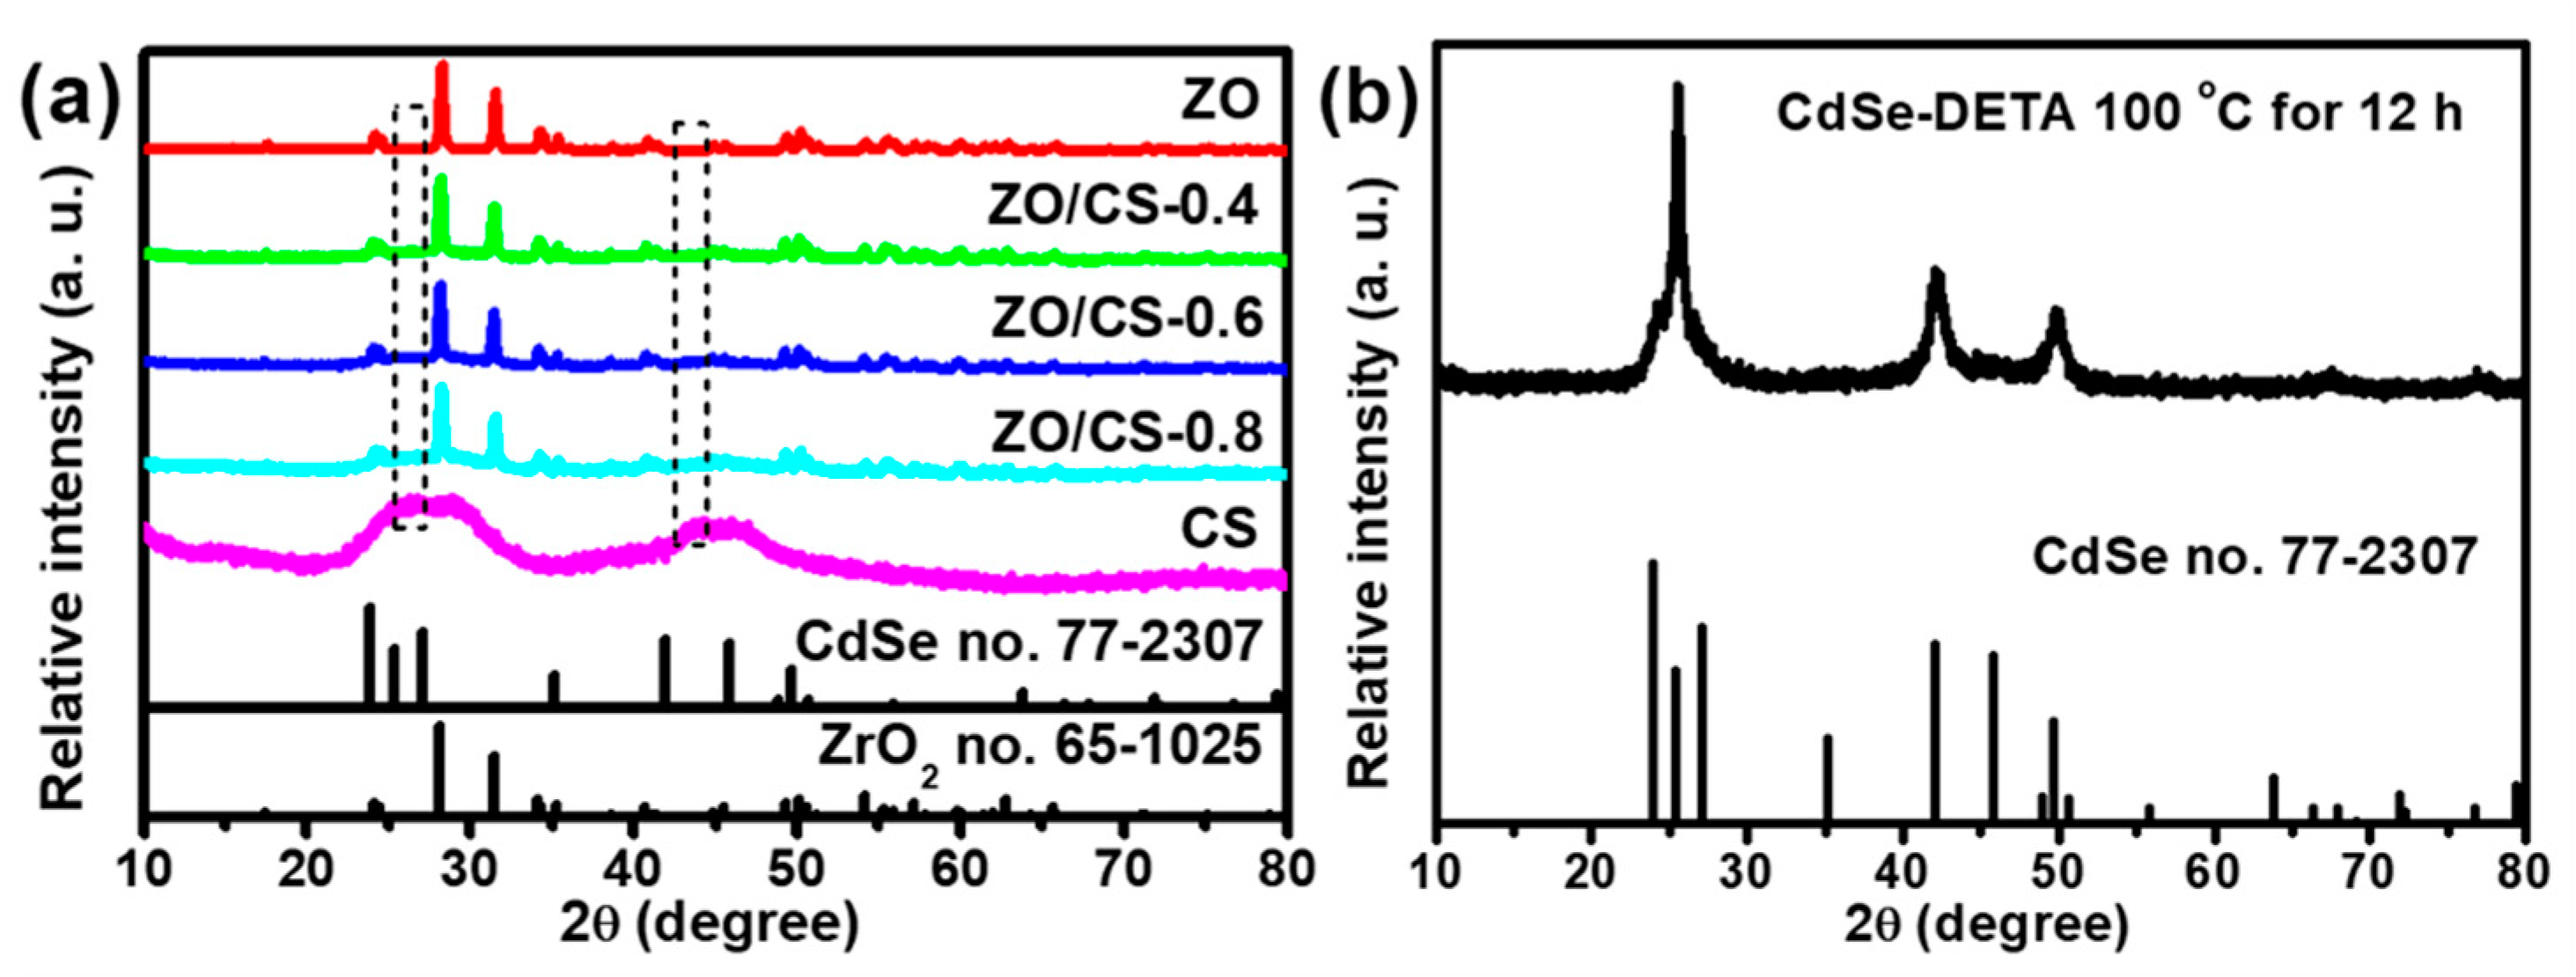
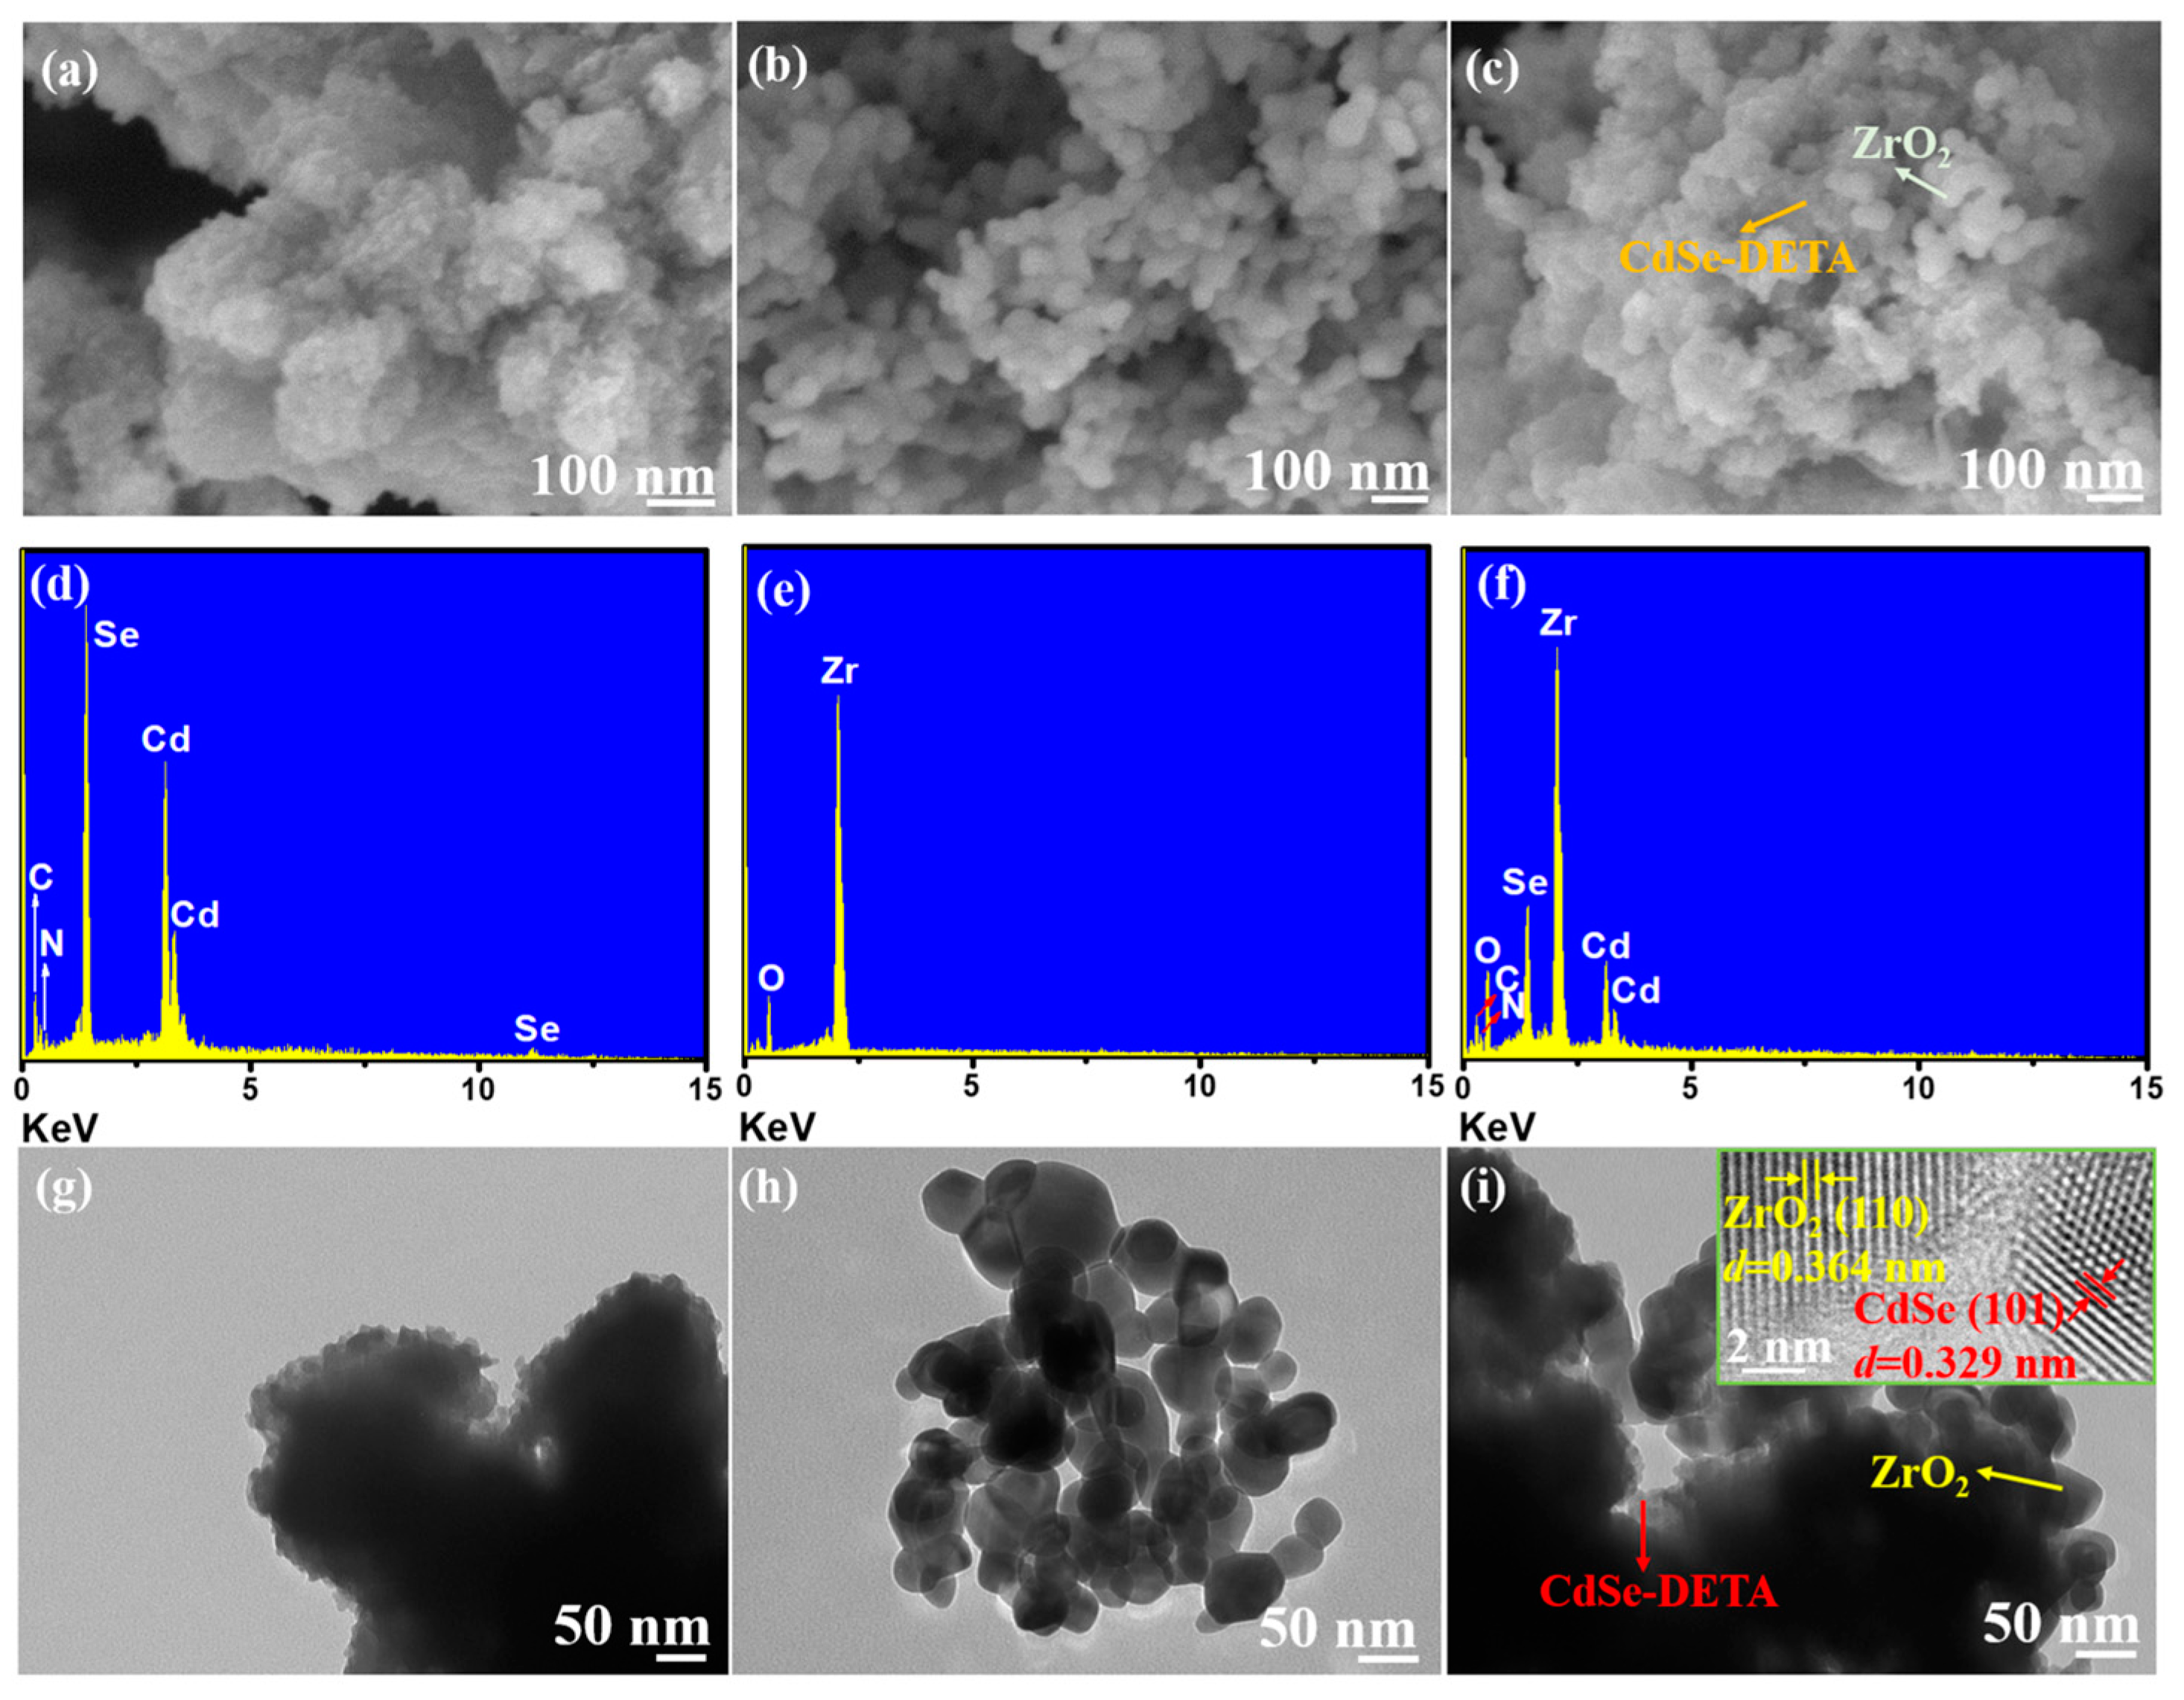
2.2. Phase and Microscopic Morphology Analysis

Figure 1 shows the X-ray diffraction (XRD) patterns of ZO, CS, and ZO/CS nanocomposites. ZO has a good crystallinity, and its XRD pattern is consistent with ZrO2 of a monoclinic phase (JCPDS No. 65-1025) [23]. The main peaks at 24.05°, 28.18°, 31.47°, 34.16°, 35.31°, 40.73°, 49.26°, 50.11°, 54.10°, 55.28°, 60.05° and 62.84° can be indexed to the (011), (-111), (111), (002), (200), (-211), (022), (220), (202), (221), (-302), and (311) crystal planes. The crystallinity of CS is low, which is due to its special synthesis conditions. When the reaction time of CS is prolonged, it will crystallize completely (shown in Figure 1b). In this work, the XRD of CS is in agreement with CdSe of the hexagonal phase (JCPDS No. 77-2307), which has been demonstrated in previous work [27]. The main peaks at 23.88°, 25.39°, 27.10°, 42.00°, 45.81°, and 49.72° can be indexed to the (100), (002), (101), (110), (103), and (112) crystal planes. Here, the crystallite sizes of ZO and CS are calculated from Scherrer’s formula [21] to be 28.04 and 20.04 nm, respectively. XRD patterns of ZO/CS nanocomposites contain peaks of ZO and CS, and peaks of CS are gradually highlighted with increasing CS content in ZO/CS (as shown by dashed boxes in Figure 1a). This indicates that ZO and CS are contained in the ZO/CS nanocomposites. In addition, there are no other miscellaneous peaks in the synthesized samples, which indicates the purity of the synthesized samples.
Scanning electron microscope (SEM) and transmission electron microscope (TEM) were used in order to better observe the micro morphology and element composition of the synthesized samples, as shown in Figure 2. It can be easily observed from the SEM images in Figure 2a–c that CS (Figure 2a) has the morphology of a flower bud, with a diameter of about 20 nm; ZO (Figure 2b) shows a nanospherical appearance, and its size is in the range of 20–100 nm; ZO/CS-0.6 (Figure 2c) nanocomposite shows the morphology of mutual wrapping of CS and ZO. Figure 2d–f is the EDS spectrum of the characterized samples, showing the elemental composition of the photographed samples. Among them, Figure 2d shows the elemental composition of CS. The results showed that only Cd, Se, C, and N elements are contained in CS, and there are no impurity peaks [11,27]. The atomic contents of Se, Cd, N, and C are 32.23%, 12.41%, 16.48%, and 38.88%, respectively. Figure 2e shows the elemental composition of ZO. ZO contained only O and Zr elements with no impurity peaks [31]. The atomic contents of O and Zr are 59.53% and 40.47%, respectively. Figure 2f shows the elemental composition of ZO/CS-0.6 nanocomposite. ZO/CS-0.6 nanocomposite contains all the pure material elements and has no impurity peaks. The atomic contents of Se, Cd, N, C, O, and Zr are 4.87%, 0.34%, 10.75%, 28.34%, 11.67%, and 6.62%, respectively. Here, the C element comes from DETA or conducting resin. The N element comes from DETA or N2H4. The difference in the content of each element is due to the fact that different elements have different energy, and the stacking of samples leads to the deviation of the test results. The results show that the tested samples contain all the constituent elements and there are no impurity peaks, which indicates the purity of the synthesized samples, in agreement with the result in Figure 1.
Figure 2g–i is the clearer TEM images of CS, ZO, and ZO/CS-0.6, which is consistent with the morphology of Figure 2a–c. Among them, the illustration in Figure 2i is the high-resolution TEM (HRTEM) image of the ZO/CS-0.6 nanocomposite. The lattice fringes of ZrO2 (110) and CdSe (101) can be clearly seen from this figure, while the appearance of a fuzzy interface for lattice fringes between them confirms the existence of heterojunctions. The presence of heterojunctions confirms the successful preparation of the ZO/CS-0.6 nanocomposite. Furthermore, Figure S1 presents the high angle annular dark field (HAADF) and elemental mapping images of ZO/CS-0.6 nanocomposite. As can be seen in Figure S1, the elements consisted of ZO/CS-0.6 nanocomposite are well distributed, indicating the homogeneous texture of the synthesized samples.

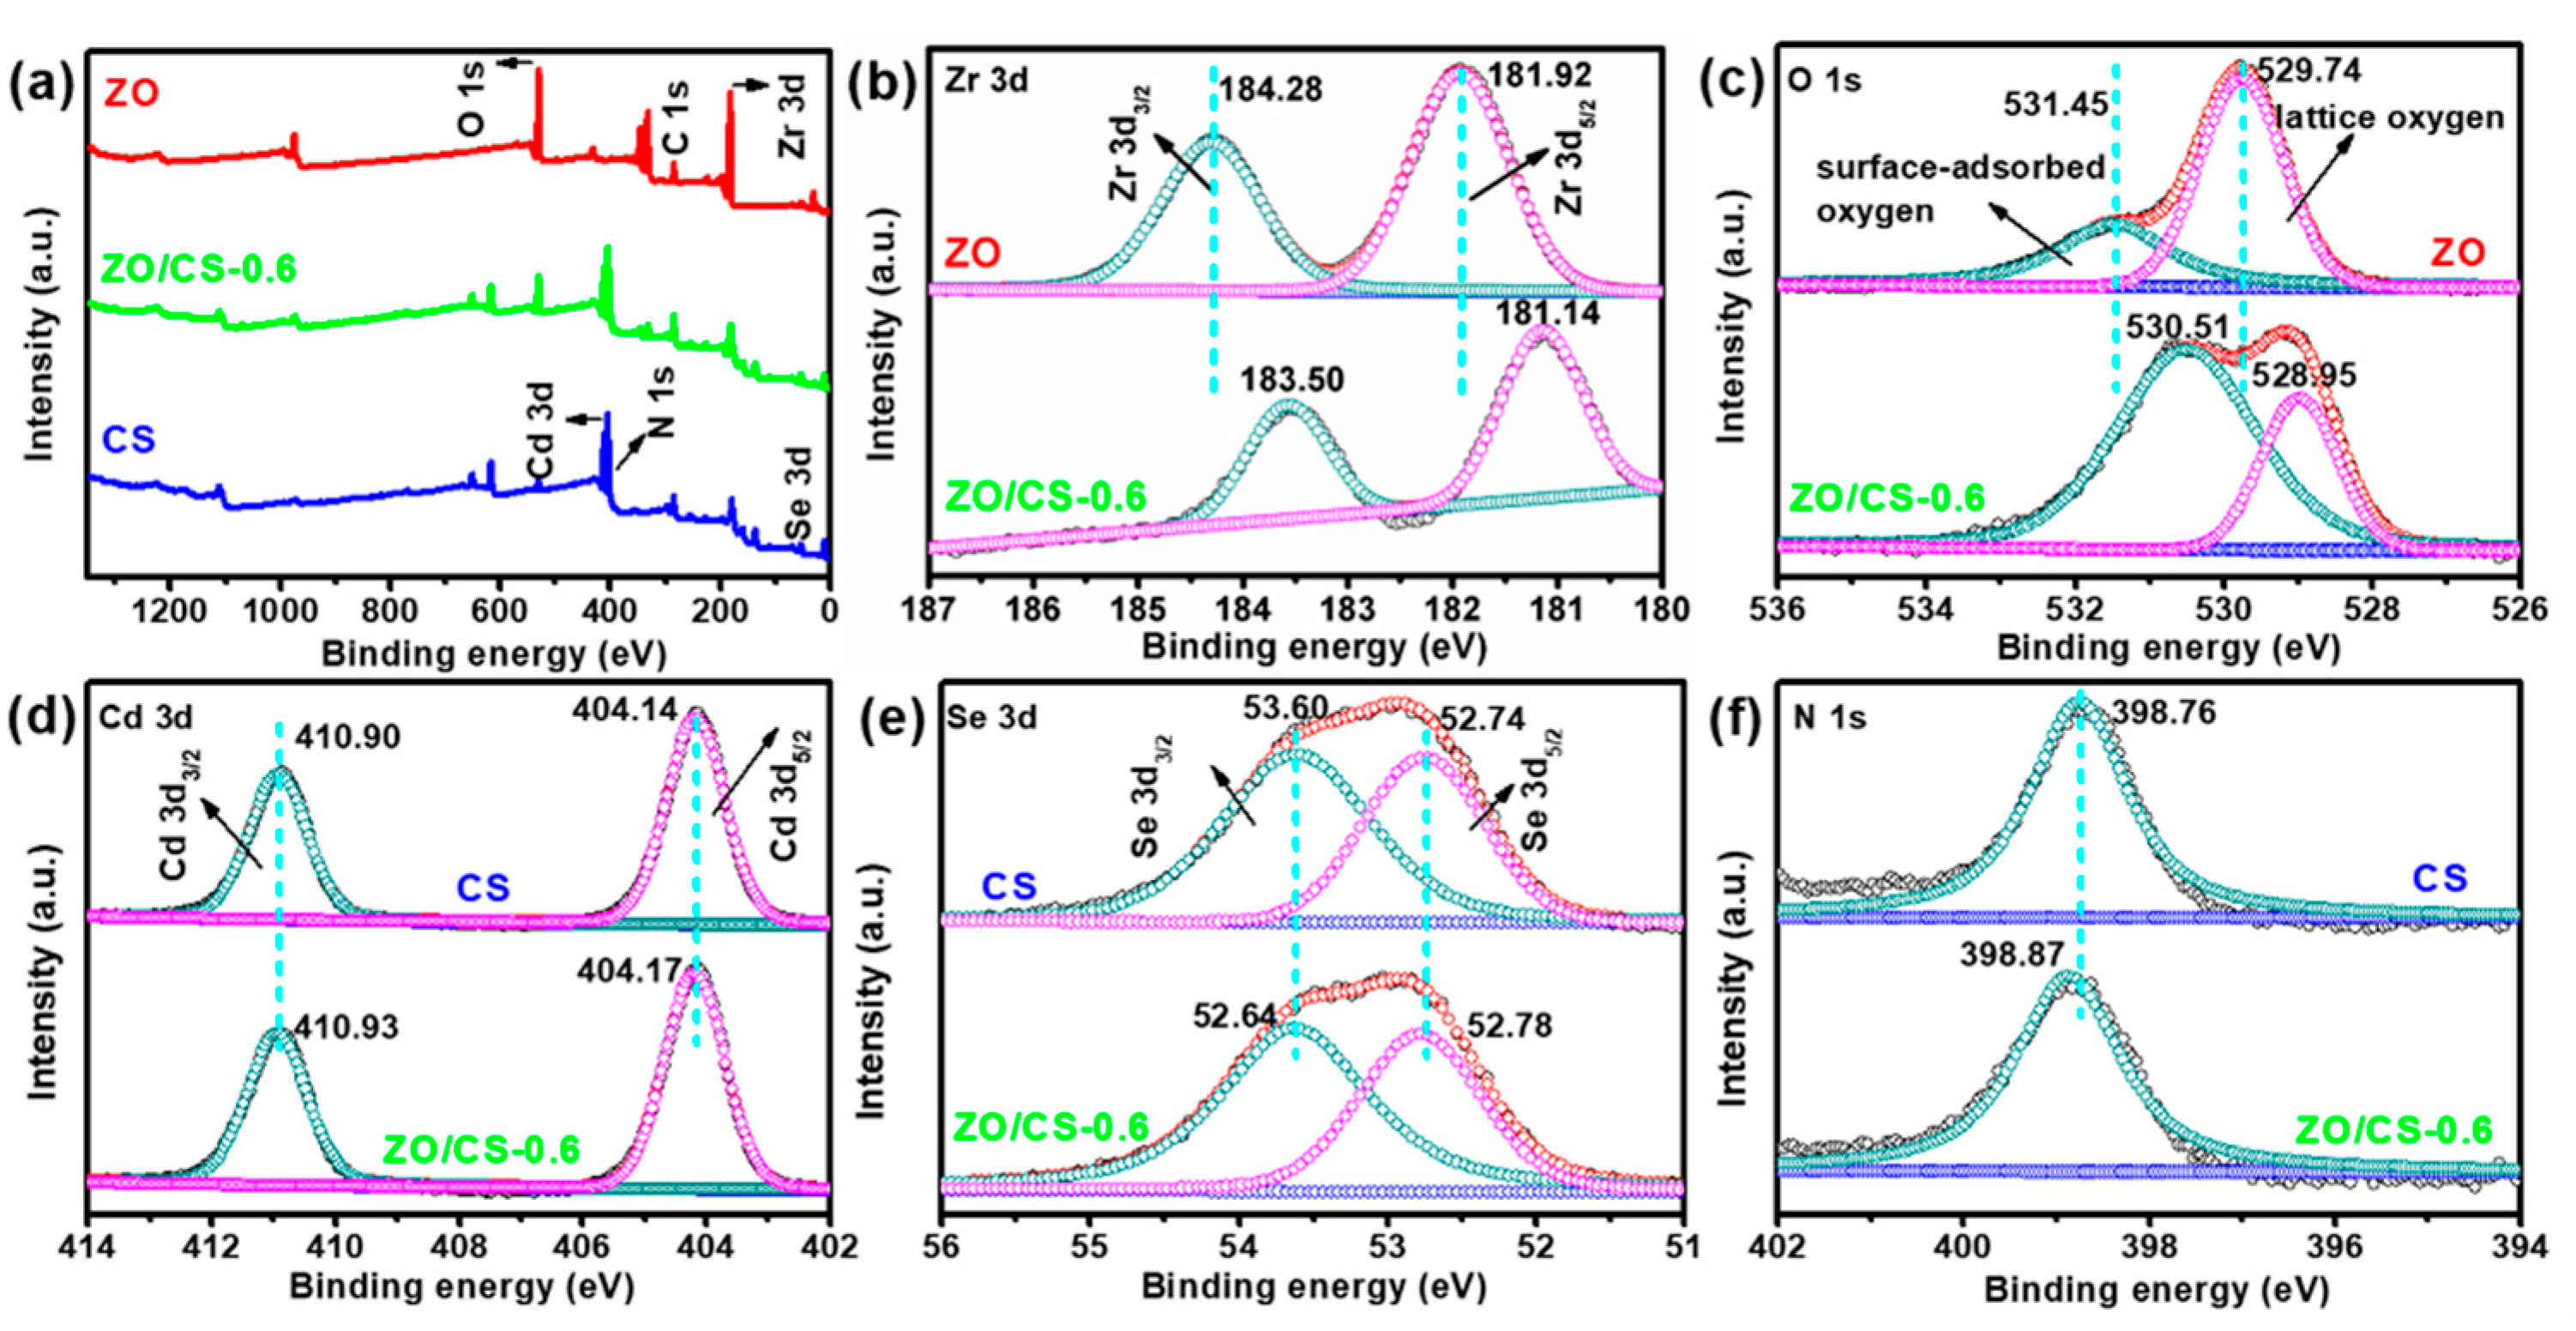
2.3. X-ray Photoelectron Spectroscopy (XPS) and Elemental Analysis

Figure 3 shows the XPS spectra of ZO, CS, and ZO/CS-0.6 nanocomposite. In Figure 3a, ZO/CS-0.6 nanocomposite contains all the elements in ZO (O, C, and Zr) and CS (Cd, N, and Se). Except for the elements of the respective samples themselves, the N element is from DETA or N2H4·H2O, and the C element is from DETA or surface adsorbed carbon dioxide. Figure 3b–f shows the high-resolution XPS spectra of some core elements of ZO, CS, and ZO/CS-0.6 nanocomposite. In Figure 3b, the two peaks (Zr 3d3/2 and Zr 3d5/2) of Zr 3d of ZO are located at 184.28 and 181.92 eV, respectively. The two peaks (Zr 3d3/2 and Zr 3d5/2) of Zr 3d of ZO/CS-0.6 nanocomposite are located at 183.50 and 181.14 eV, respectively [30]. In Figure 3c, O 1s of ZO is divided into lattice oxygen and surface-adsorbed oxygen, and the positions are located at 531.45 and 529.74 eV, respectively [30]. Similarly, the two peaks of the O 1s of ZO/CS-0.6 nanocomposite are located at 530.51 and 528.95 eV, respectively. In Figure 3d, the Cd 3d3/2 and Cd 3d5/2 peaks of the Cd 3d of CS are located at 410.90 and 404.14 eV, respectively [11]. Similarly, the two peaks of the Cd 3d of ZO/CS-0.6 nanocomposite are located at 410.93 and 404.17 eV, respectively. In Figure 3e, the Se 3d of CS can be divided into two peaks: Se 3d3/2 and Se 3d5/2, which are located at 53.60 and 52.74 eV, respectively [11]. The two peaks of the Se 3d of ZO/CS-0.6 nanocomposite are located at 52.64 and 52.78 eV, respectively. In Figure 3f, the N 1s peak of CS is located at 398.76 eV [11], which is shifted to the right by 0.11 eV relative to ZO/CS-0.6 nanocomposites. The above results show that the peak positions of each element of ZO/CS-0.6 nanocomposite are shifted relative to ZO or CS, which confirms the heterojunctions between ZO and CS. This result is consistent with that of Figure 2i.

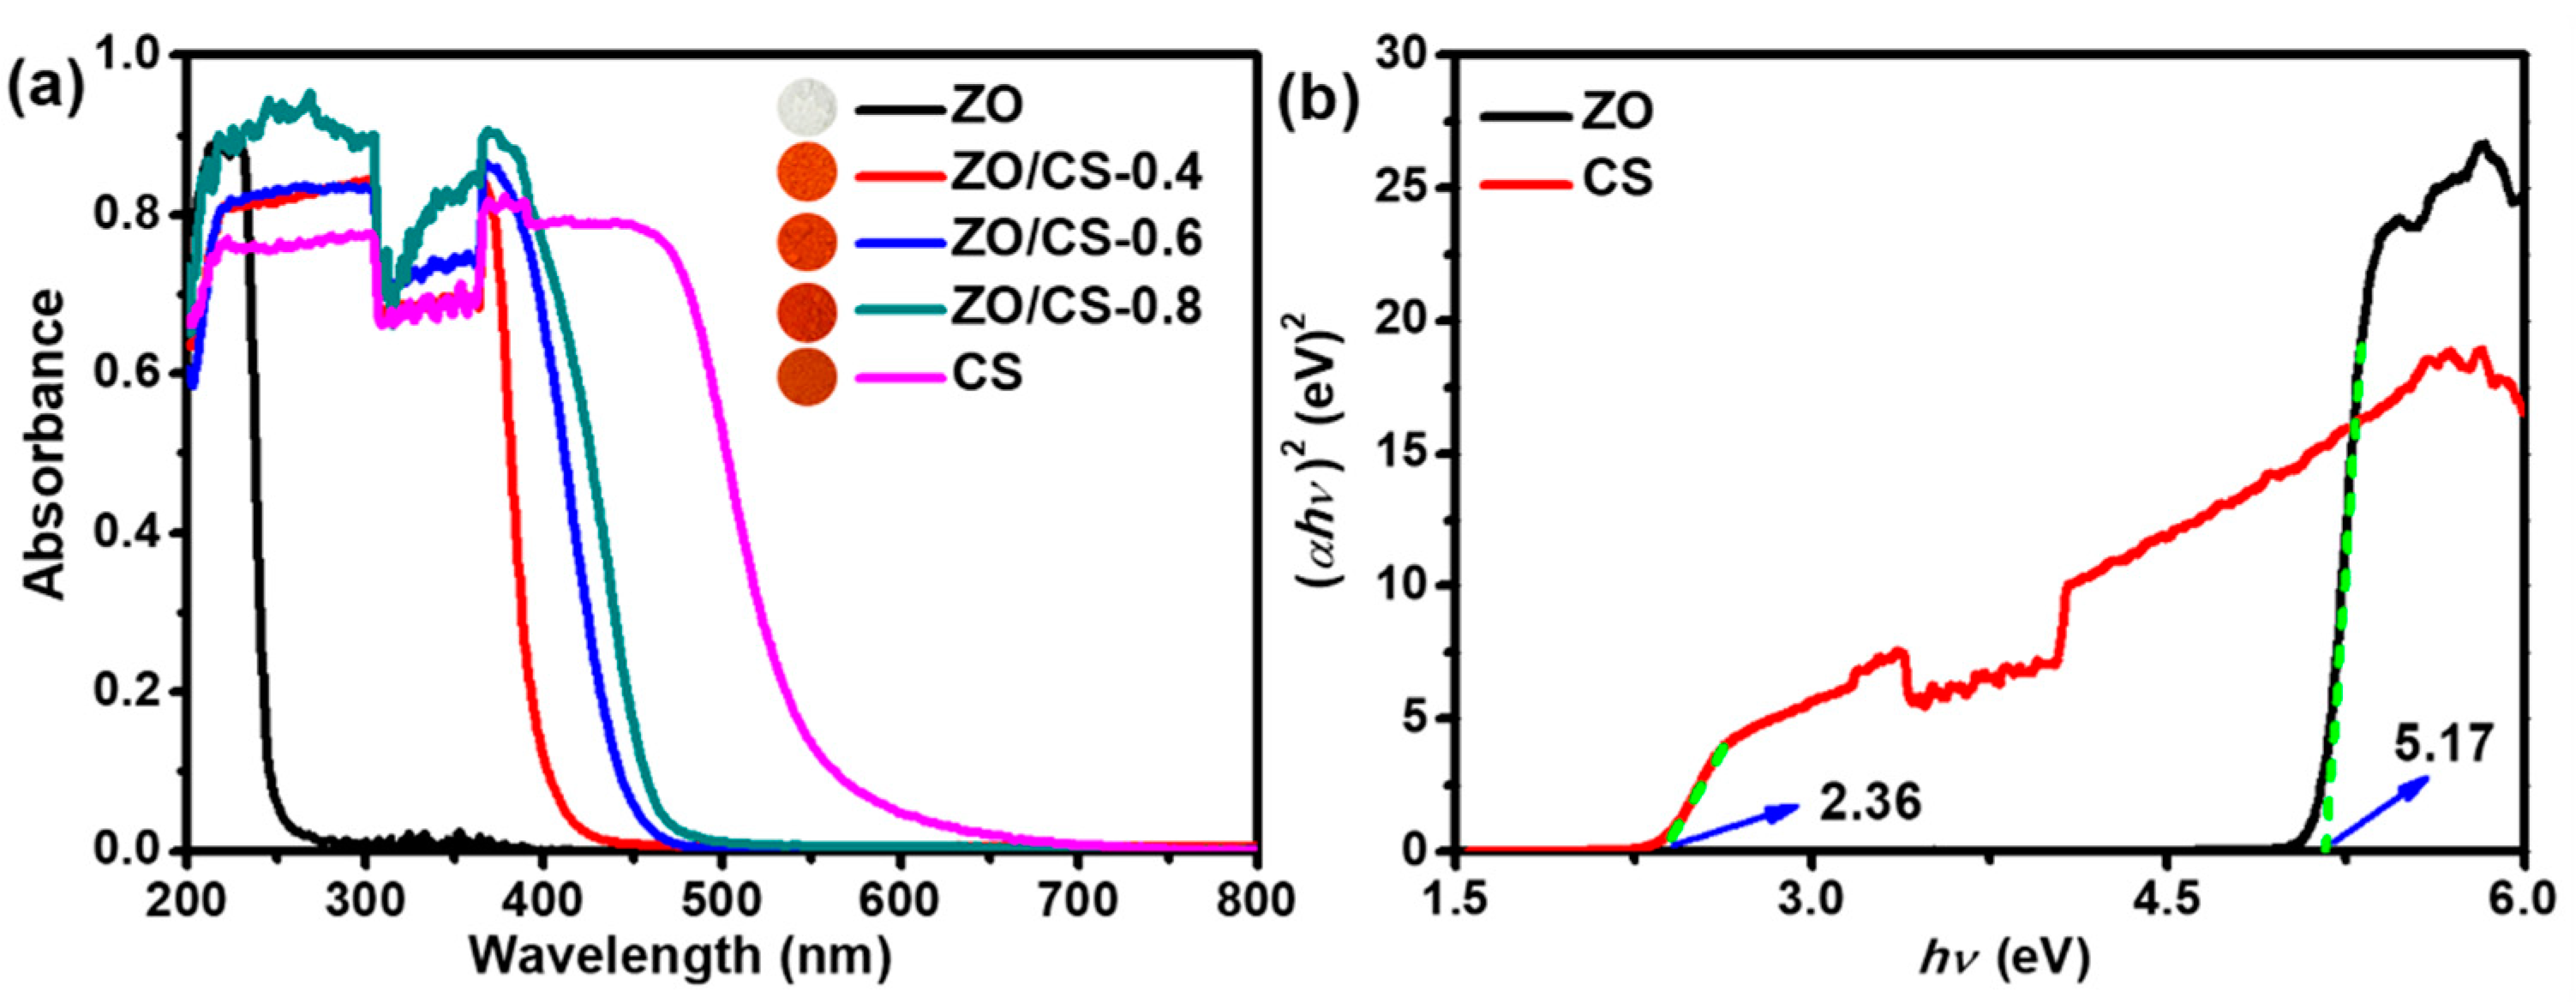
2.4. Optical Property and Band Gap Analysis

In order to explore the optical absorption properties and band gap of materials, ZO, CS, and ZO/CS nanocomposites are characterized by ultraviolet–visible spectroscopy diffuse reflectance spectra (UV-vis DRS), as shown in Figure 4. In Figure 4a, CS behaves as a visible light absorbing material with excellent visible light absorption ability, which tends to represent its smaller band gap. In contrast, ZO shows strong UV light absorption ability and is not excited in the visible range, while usually represents a large band gap. In the ZO/CS nanocomposites, the light absorption range of the nanocomposites increased gradually with increasing CS content. Furthermore, the color of each sample was uniform and without variegation, which illustrated the purity of the samples. After that, according to Figure 4a, the linear transformation plots of CS and ZO absorption curves are drawn (Figure 4b). As can be seen from the figure, the band gap of CS is 2.36 eV. The band gap of ZO is 5.17 eV, which is significantly larger than that of CS. In addition, the theoretical band gaps of ZO and CS are obtained by theoretical calculation (Figure S2). The results show that the band gap of ZO is significantly larger than that of CS, confirming the accuracy of the above results.

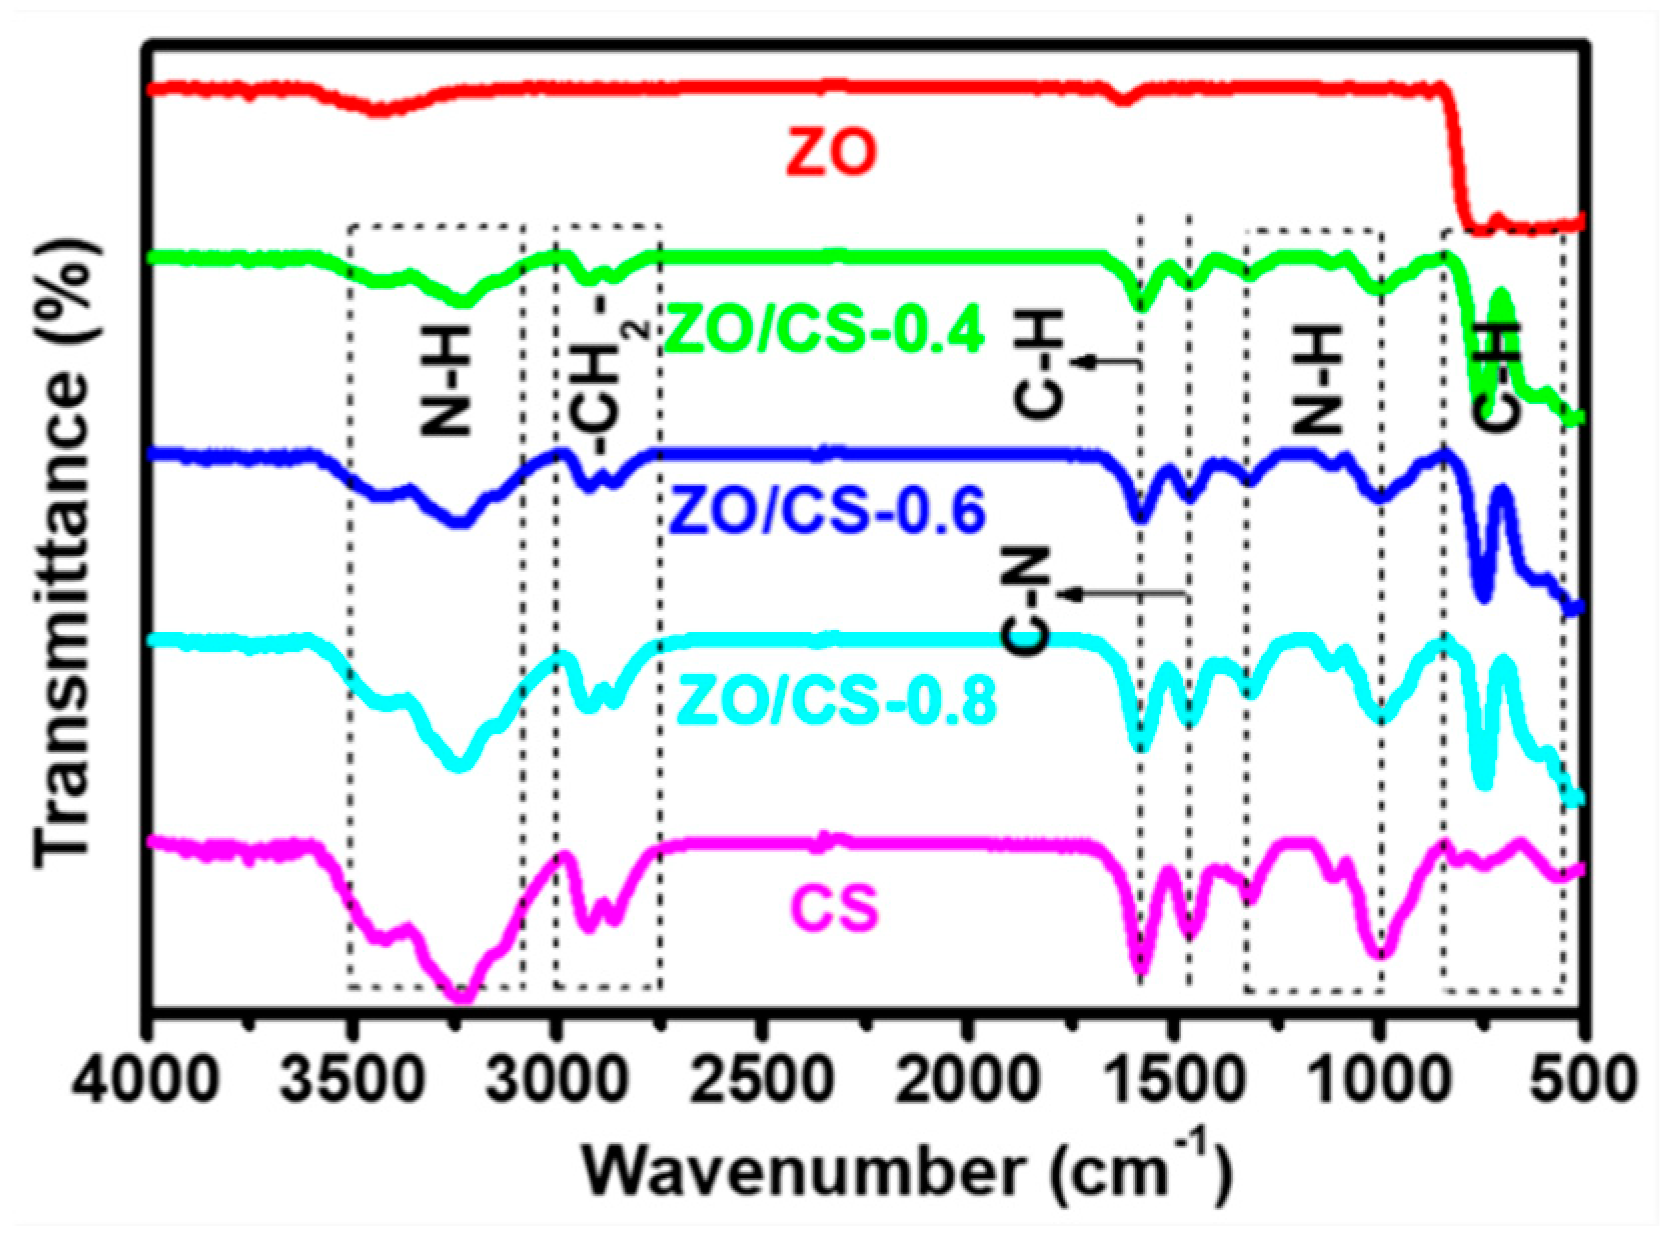
2.5. Fourier Transform Infrared Spectoscopy (FT-IR) Analysis

FT-IR is used to explore the functional groups of each sample in order to further explore its elemental composition. As shown in Figure 5, CS contains strong vibration bands of N-H (about 3090–3500 and 1000–1320 cm−1), -CH2- (approximately 2750–3000 cm−1), C-N (around 1468 cm−1) and C-H (roughly 550–850 and 1590 cm−1) [24]. Wherein, C-H, C-N, and -CH2- are from DETA. N-H comes from DETA or N2H4·H2O. ZO does not contain the above functional groups. Nevertheless, the ZO/CS nanocomposites formed by the composite of ZO and CS contain the vibration bands mentioned above, and the frequency is strong. This indicates that both CS and ZO/CS nanocomposites contain DETA.

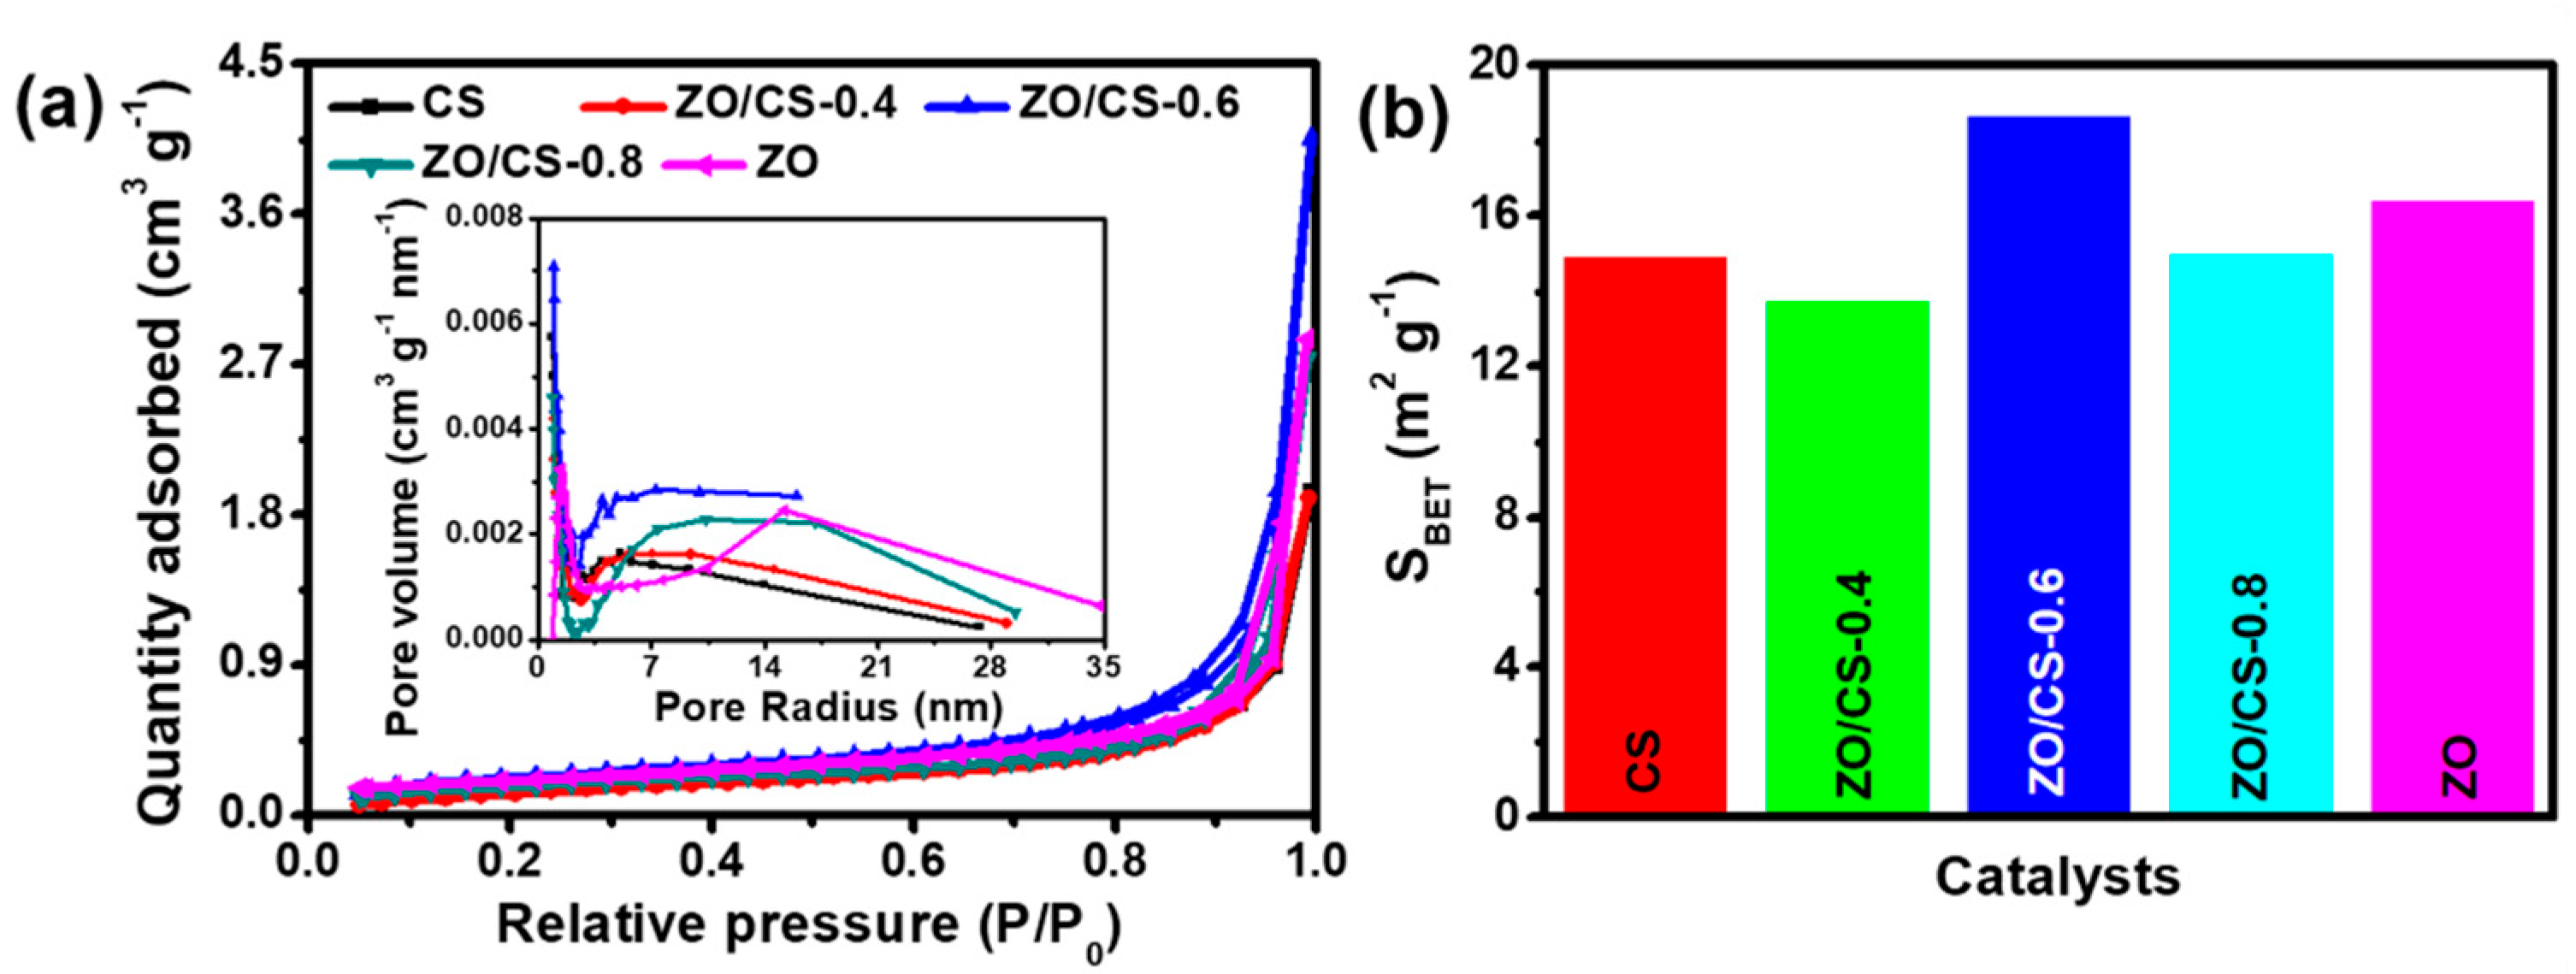
2.6. BET Surface Area

Figure 6 shows the specific surface analysis of ZO, CS, and ZO/CS nanocomposites. In Figure 6a, all samples show Type IV isotherms and H3 hysteresis loops [35]. As can be seen from the illustrations in Figure 6a, all the samples characterized are mesoporous materials. Among them, most of the pore sizes of the tested materials are distributed in the range of 2–50 nm, conforming to the characteristics of mesoporous materials. Figure 6b shows the BET surface areas of the characterized materials. In Table S1, the BET surface areas of ZO, CS, ZO/CS-0.4, ZO/CS-0.6, and ZO/CS-0.8 are 16.41, 14.87, 13.73, 18.64, and 14.97 m2 g−1, respectively. The results show that the BET surface areas of CS and ZO are smaller, and the ZO/CS nanocomposites also exhibit smaller BET surface areas. However, ZO/CS-0.6 nanocomposite exhibits the optimal BET surface area. A larger BET surface area will provide more active sites for the reaction, which is helpful to the photocatalytic hydrogen evolution reaction. In addition, the details of the average pore size and total pore volume of the tested samples are shown in Table S1.

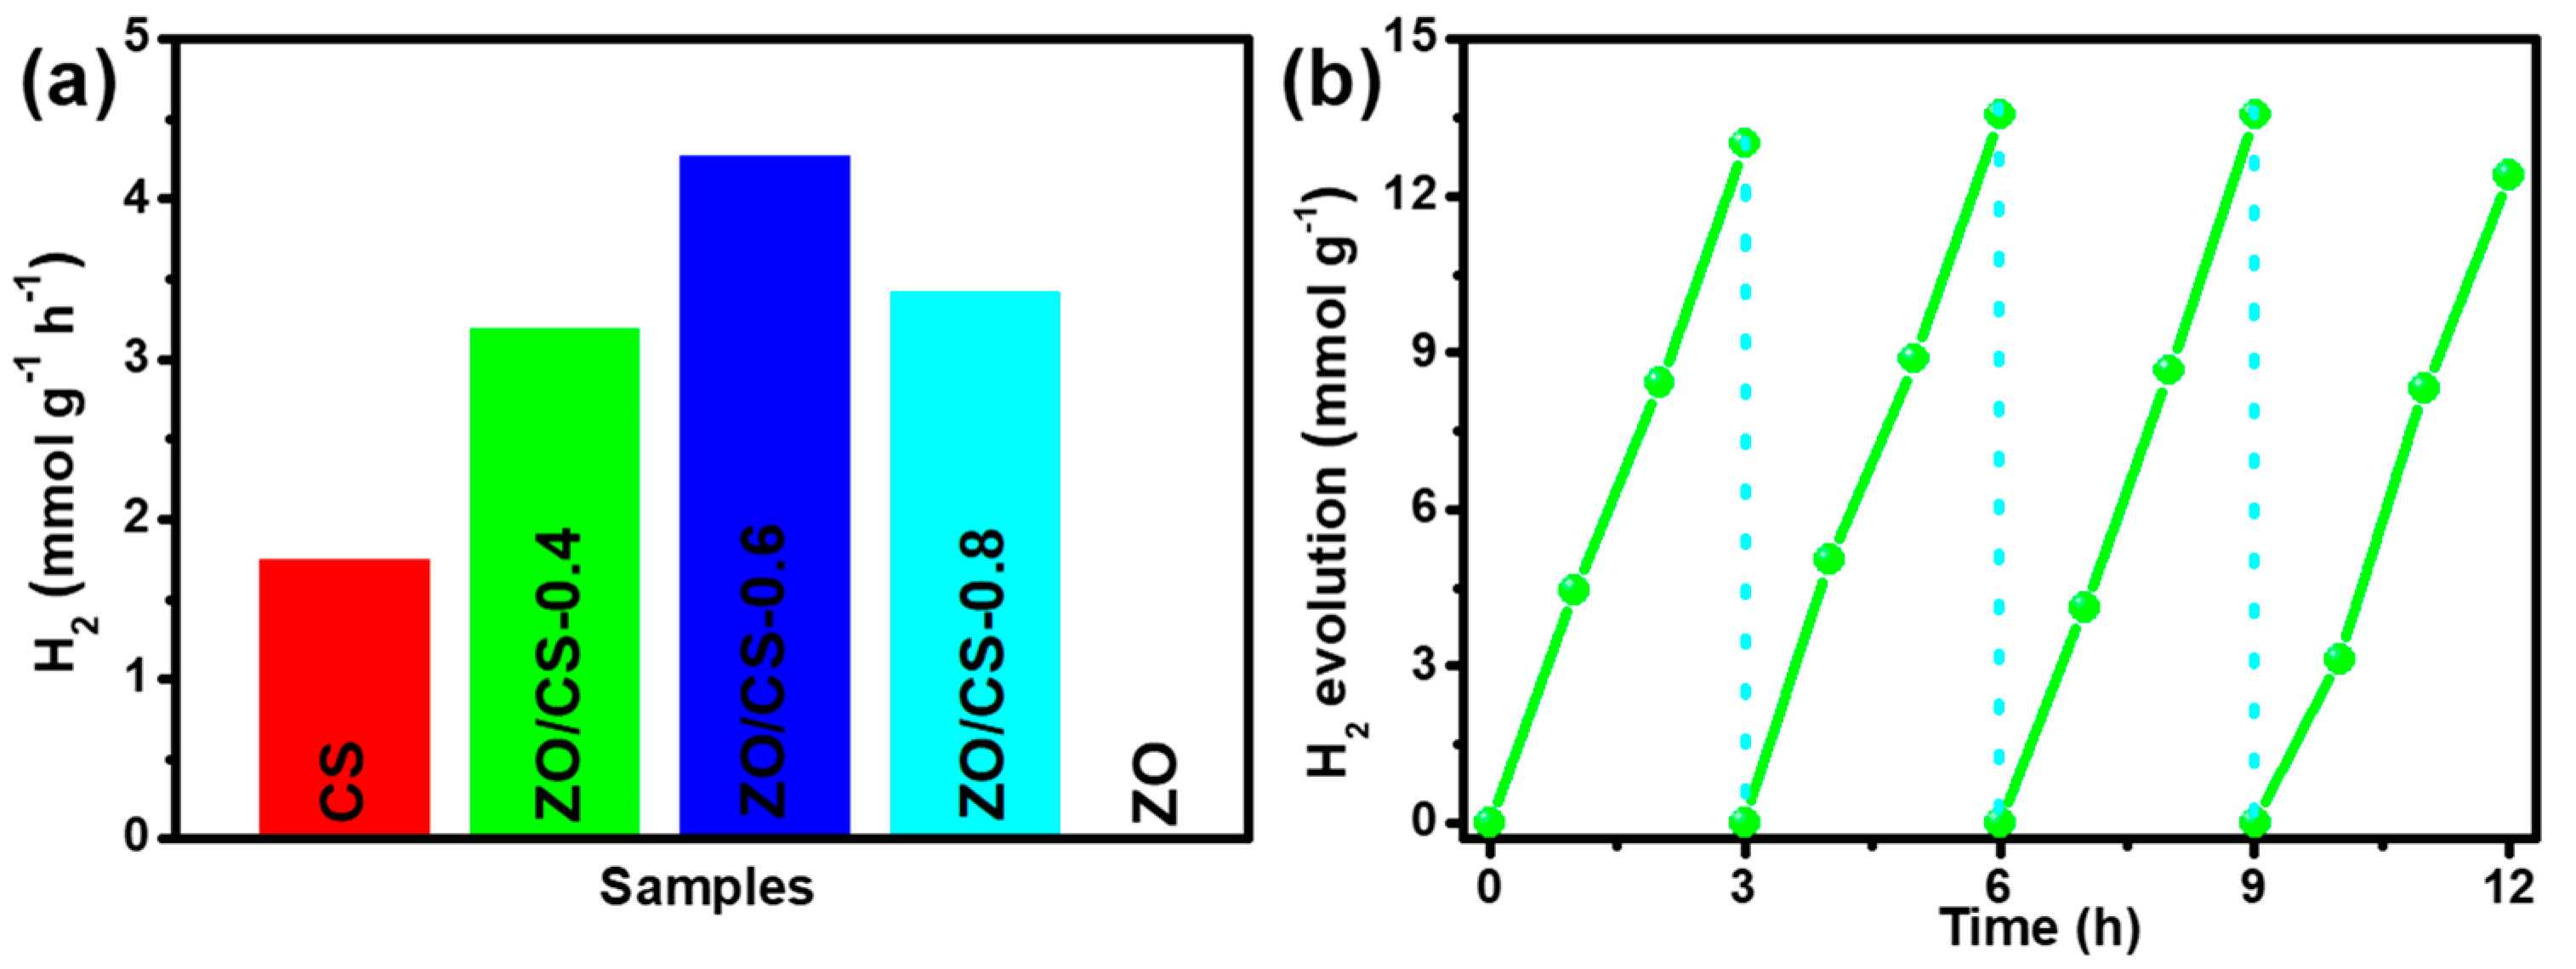
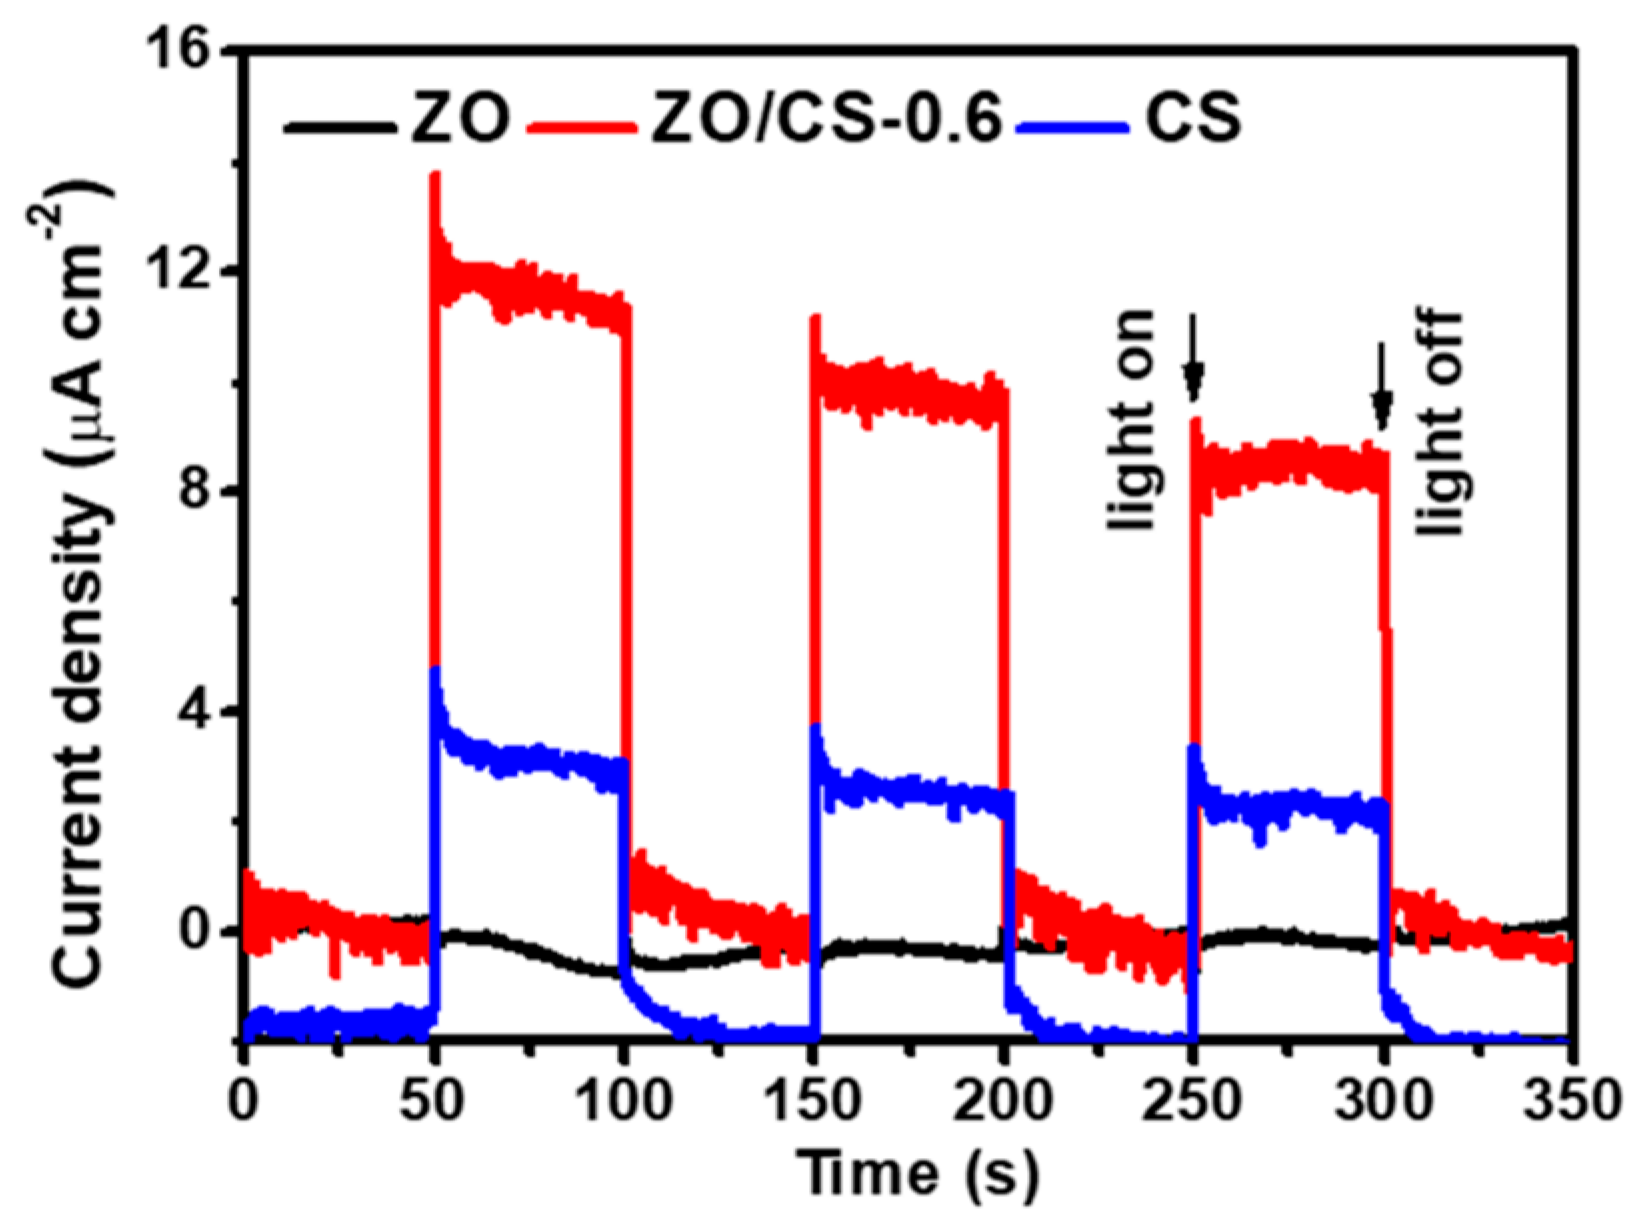
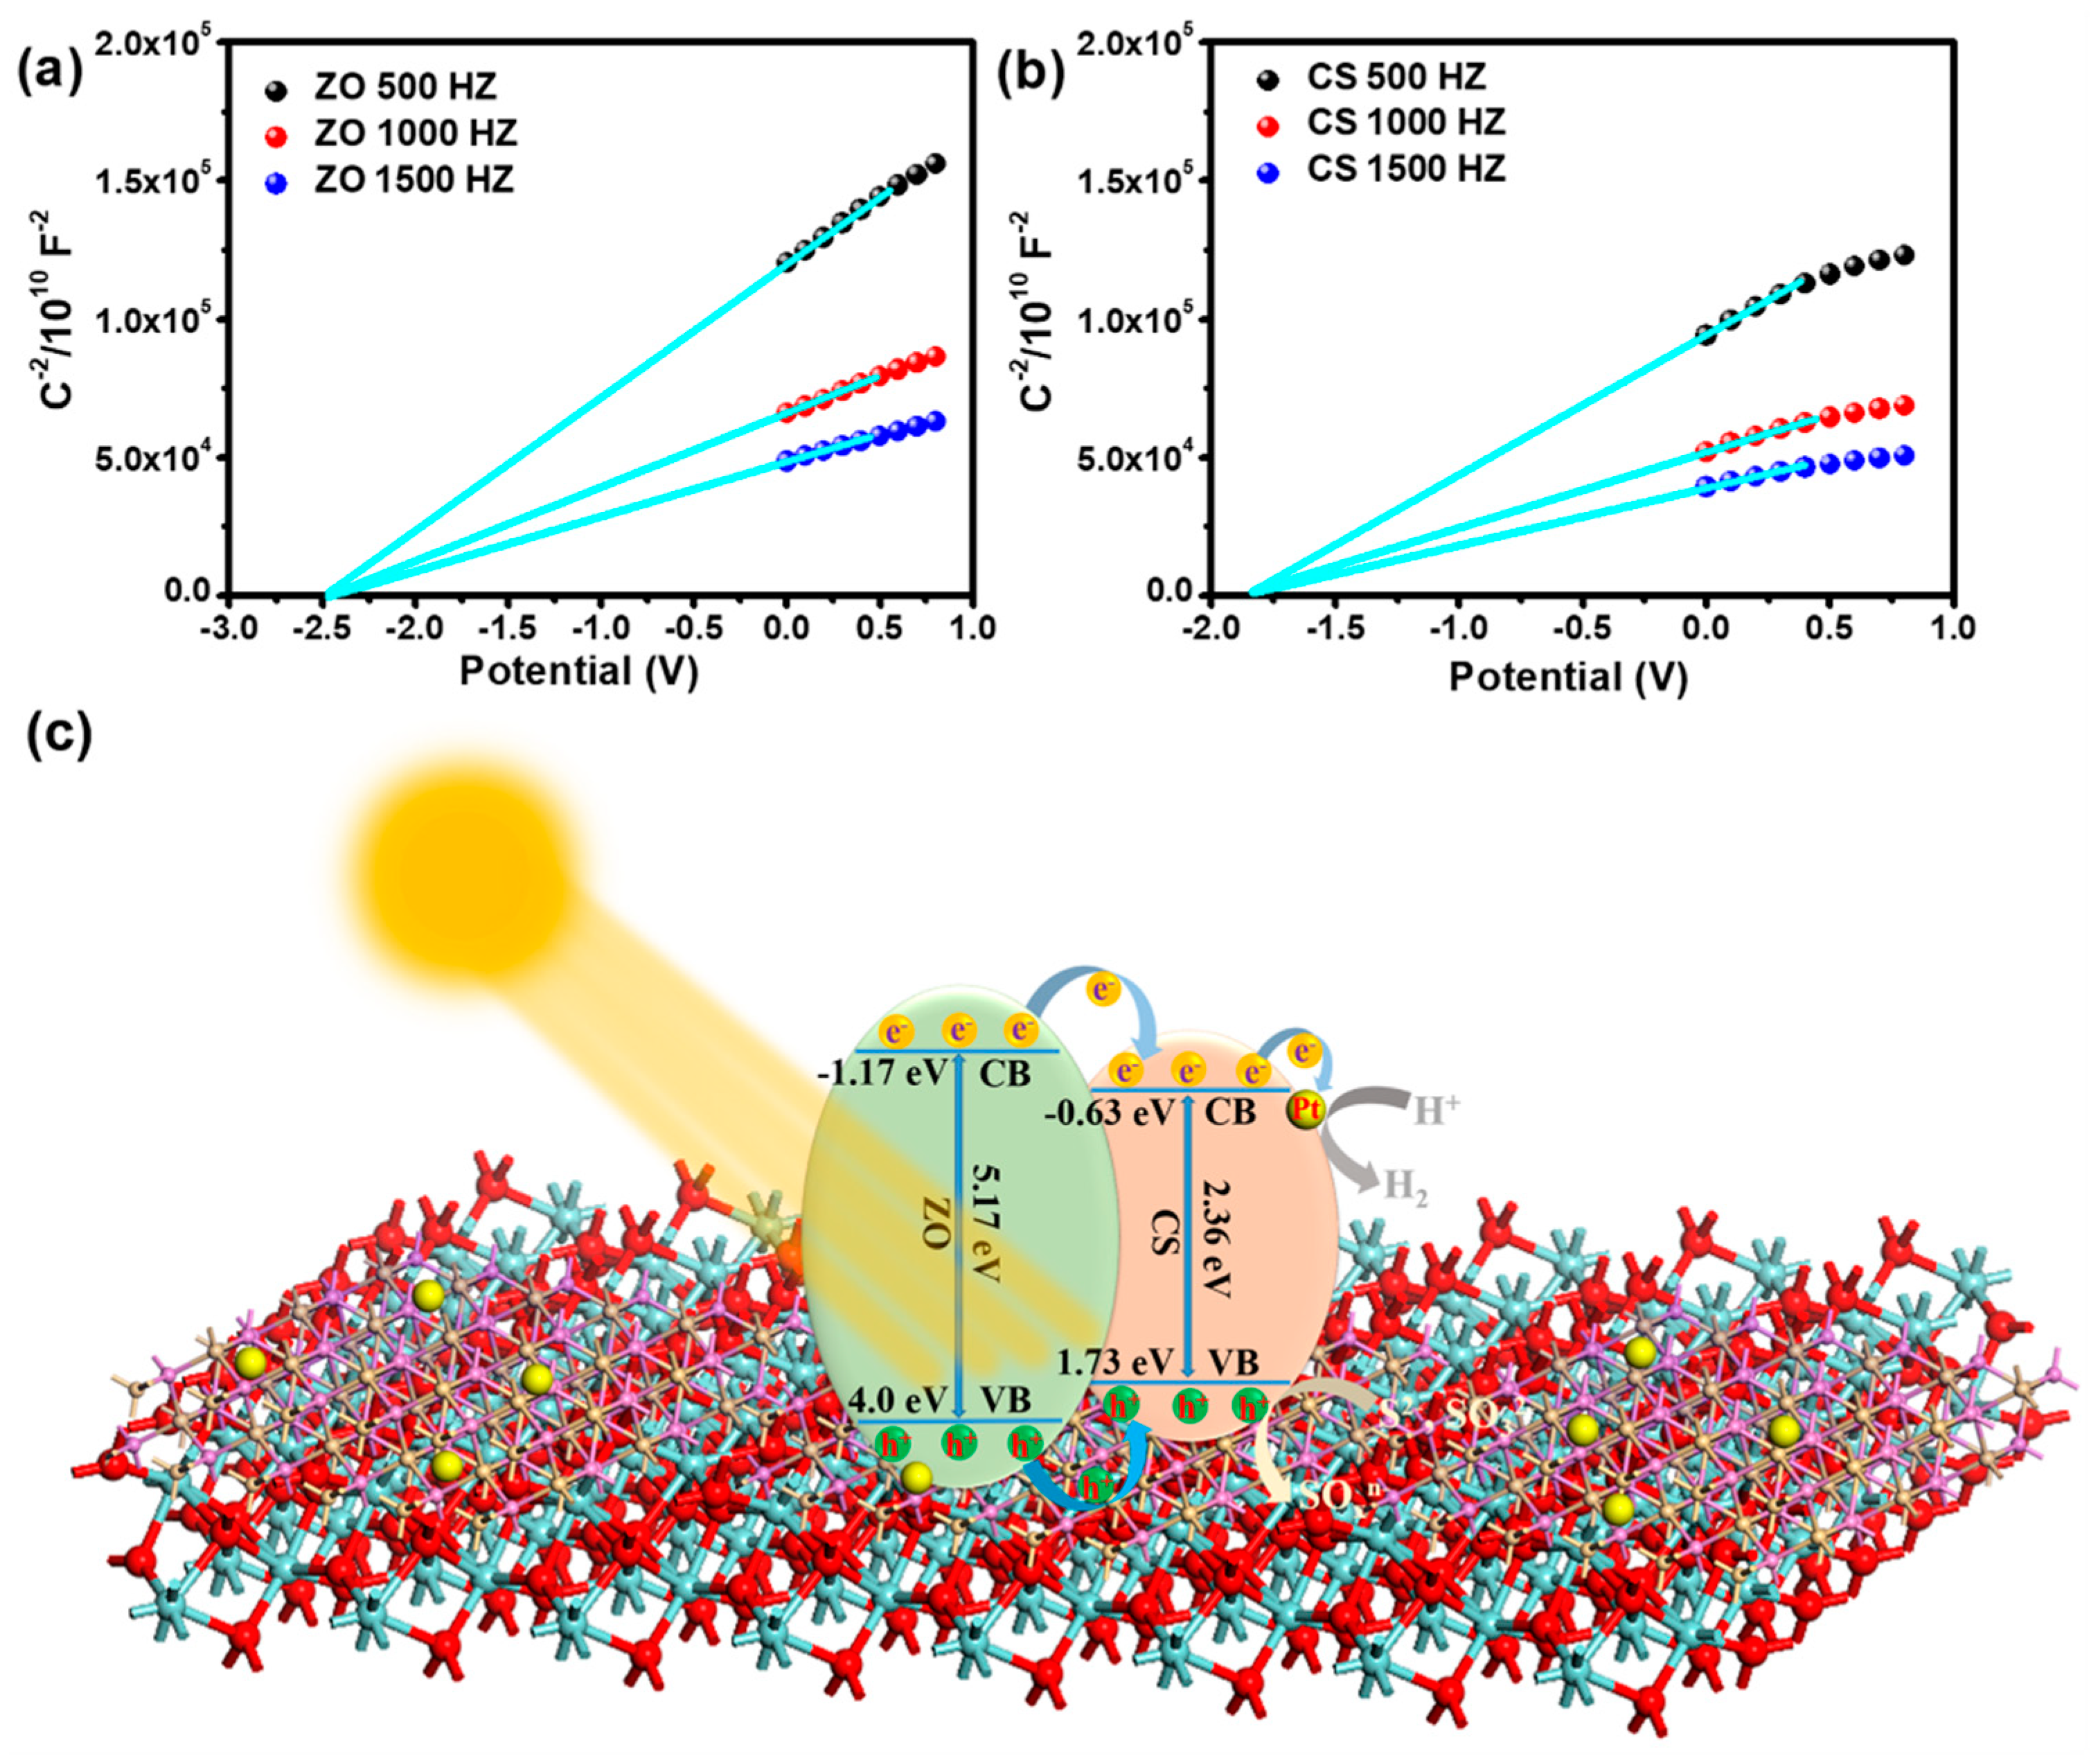
2.7. Photocatalytic H2 Evolution Performance and Electrochemical Analysis

Figure 7 shows the photocatalytic hydrogen evolution rate of ZO, CS, and ZO/CS nanocomposites, and the photocatalytic hydrogen evolution stability of ZO/CS-0.6. In Figure 7a, CS has a relatively excellent photocatalytic hydrogen evolution rate (1.75 mmol g−1 h−1). Yet, ZO has no photocatalytic hydrogen evolution activity, which is represented here by trace. When the two pure materials are compounded, ZO/CS nanocomposites show excellent photocatalytic hydrogen evolution rates, which are much higher than that of CS and ZO alone. Among them, ZO/CS-0.6 shows the best photocatalytic hydrogen evolution rate, reaching 4.27 mmol g−1 h−1. Moreover, the present work still possesses excellent photocatalytic hydrogen evolution activity compared with the photocatalysts in other literatures (Table S2). Figure 7b shows the photocatalytic hydrogen evolution stability test of ZO/CS-0.6 nanocomposite. The results showed that ZO/CS-0.6 nanocomposite showes excellent photocatalytic activity for hydrogen evolution in four cycles. In Figure S3a, ZO/CS-0.6 nanocomposite is recrystallized after cycling, showing a slightly sharp XRD peak, while the other peaks remained almost unchanged. In Figure S3b,c, the recrystallized ZO/CS-0.6 nanocomposites are recrystallized after cycling, but the overall morphology did not change obviously, which verified the results of Figure S3a. This fully shows the excellent stability of ZO/CS-0.6 nanocomposite.
The photocurrent response can effectively explore the photoexcitation ability of photocatalysts. Figure 8 shows the photocurrent density-time curves of ZO, CS, and ZO/CS-0.6 nanocomposite. It can be seen from the figure that ZO shows a very weak photocurrent response curve, which is approximately a straight line. However, CS shows a higher photocurrent response curve, which is obviously better than that of ZO. After forming the ZO/CS-0.6 nanocomposite with the composite of ZO and CS, it exhibits an excellent photocurrent response curve, which is much higher than that of ZO and CS alone. This shows that the composite of ZO and CS can effectively improve the light excitation ability of the materials and contribute to the photocatalytic hydrogen evolution reaction. This is consistent with the results of Figure 7.

2.8. Photocatalytic Mechanism

The photocatalytic hydrogen evolution mechanism at the heterojunction of ZO/CS nanocomposites is shown in Figure 9, which is the classical Type-I model [36,37,38]. According to the formula (S1)–(S3) (Supporting information) [11] and the results of Figure 4, the conduction band of ZO is at -1.17 eV and the valence band is at 4 eV. Similarly, the conduction band of CS is at -0.63 eV and the valence band is at 1.73 eV. According to the valence band position, the heterojunction mechanism of ZO/CS nanocomposites is the classical Type-I model. In addition, ZO and CS are characterized by Mott–Schottky analysis in electrochemical methods (Figure 9a,b). The results show that the mechanism of the heterojunction formation between ZO and CS is the classical Type-I model, which verifies the experimental results.
As shown in Figure 9, ZO and CS produce photogenerated electron-hole pairs under visible light irradiation. After that, the photogenerated electron-hole pairs are separated rapidly, the photogenerated electrons gather in the conduction band of the semiconductor material, and the photogenerated holes gather in the valence band. At this time, many electrons on the surface of the ZO conduction band are transferred to the position of the CS conduction band. A large number of electrons on the surface of the ZO valence band are transferred to the CS valence band location. Abundant photogenerated electrons are gathered on the surface of the CS conduction band, which are continuously transferred to the surface of the co-catalyst Pt and combine with H+ to produce hydrogen [39,40,41]. On the other hand, there are a large number of photogenerated holes on the surface of the CS valence band, which are consumed by the sacrificial agent [28]. In this way, the photogenerated electrons and holes in ZO/CS nanocomposites are continuously separated, which accelerates the photocatalytic hydrogen evolution reaction and alleviates the occurrence of photocorrosion. Therefore, ZO/CS nanocomposites show excellent photocatalytic activity and stability for hydrogen evolution.

3. Conclusions

In summary, we have successfully prepared ZO/CS nanocomposites, which effectively overcome the inherent defects of the single materials and elevate the photocatalytic hydrogen evolution activity and stability of the single materials. Among the ZO/CS nanocomposites, ZO/CS-0.6 nanocomposite showed the best photocatalytic hydrogen evolution activity (4.27 mmol g−1 h−1), which is much higher than those of CS (1.75 mmol g−1 h−1) and ZO (trace) individually. In addition, ZO/CS-0.6 nanocomposite showed excellent corrosion resistance and maintained excellent photocatalytic hydrogen evolution activity in four cycles. This is due to the Type-I mechanism at the heterojunction of ZO/CS nanocomposites, which effectively separates the photogenerated electron hole pairs, thus enabling efficient and stable photocatalytic hydrogen evolution. This work provides a way to change the inherent characteristics of a single material, which may be helpful for the development of high performance and stable photocatalysts.

Supplementary Materials

The following supporting information can be downloaded at: https://www.mdpi.com/article/10.3390/catal12111385/s1, Figure S1: HAADF and elemental mapping images of ZO/CS-0.6 nanocomposite; Figure S2: Optimized models of (a) ZrO2 and (b) CdSe. Calculated energy band structures for the (c) ZrO2 and (d) CdSe; Figure S3: (a) XRD patterns of ZO/CS-0.6 nanocomposite before and after cycling test. (b) TEM image ZO/CS-0.6 nanocomposite before cycling test. (c) TEM image ZO/CS-0.6 nanocomposite after cycling test; Table S1: The amounts of precursors in preparing CdSe-DETA, ZrO2 and ZO/CS nanocomposites and the BET surface area, average pore size and total pore volume of above materials; Table S2: Comparison of photocatalytic H2 production rate of the catalysts in references and this work.

Author Contributions

Conceptualization, Z.L. and Z.W.; methodology, Z.L.; software, Z.L.; validation, Z.L., L.Z. and T.M.; formal analysis, Z.W.; investigation, Z.W.; resources, Z.W. and J.Z.; data curation, Z.L.; writing—original draft preparation, Z.L.; writing—review and editing, Z.L.; visualization, Z.L.; supervision, Z.L.; project administration, Z.W. and J.Z; funding acquisition, Z.W. and J.Z. All authors have read and agreed to the published version of the manuscript.

Funding

This work was financial support from the National Natural Science Foundation of China (no. 51973078) and Natural Science Foundation of Anhui Province (2108085MB48) are gratefully acknowledged.

Data Availability Statement

The data presented in this study can be obtained from the first author.

Conflicts of Interest

The authors declare no conflict of interest.

References

  1. Humayun, M.; Wang, C.; Luo, W. Recent Progress in the Synthesis and Applications of Composite Photocatalysts: A Critical Review. Small Methods 2022, 6, 2101395. [Google Scholar] [CrossRef] [PubMed]
  2. Li, X.; Wu, X.; Liu, S.; Li, Y.; Fan, J.; Lv, K. Effects of fluorine on photocatalysis. Chin. J. Catal. 2020, 41, 1451–1467. [Google Scholar] [CrossRef]
  3. Wang, J.; Liu, J.; Du, Z.; Li, Z. Recent advances in metal halide perovskite photocatalysts: Properties, synthesis and applications. J. Energy Chem. 2021, 54, 770–785. [Google Scholar] [CrossRef]
  4. Yang, X.; Singh, D.; Ahuja, R. Recent Advancements and Future Prospects in Ultrathin 2D Semiconductor-Based Photocatalysts for Water Splitting. Catalysts 2020, 10, 1111. [Google Scholar] [CrossRef]
  5. Zhang, Y.; Xu, J.; Zhou, J.; Wang, L. Metal-organic framework-derived multifunctional photocatalysts. Chin. J. Catal. 2022, 43, 971–1000. [Google Scholar] [CrossRef]
  6. Zhang, L.; Zhang, J.; Yu, H.; Yu, J. Emerging S-Scheme Photocatalyst. Adv. Mater. 2022, 34, 2107668. [Google Scholar] [CrossRef]
  7. Bie, C.; Wang, L.; Yu, J. Challenges for photocatalytic overall water splitting. Chem 2022, 8, 1567–1574. [Google Scholar] [CrossRef]
  8. Wei, Y.; Qin, H.; Deng, J.; Cheng, X.; Cai, M.; Cheng, Q.; Sun, S. Semiconductor Photocatalysts for Solar-to-Hydrogen Energy Conversion: Recent Advances of CdS. Curr. Anal. Chem. 2021, 17, 573–589. [Google Scholar] [CrossRef]
  9. Bao, Y.; Song, S.; Yao, G.; Jiang, S. S-Scheme Photocatalytic Systems. Sol. RRL 2021, 5, 2100118. [Google Scholar] [CrossRef]
  10. Hayat, A.; Syed, J.A.S.G.; Al-Sehemi, A.S.; El-Nasser, K.; Taha, T.A.A.; Al-Ghamdi, A.A.; Amin, M.; Ajmal, Z.; Iqbal, W.; Palamanit, A.; et al. State of the art advancement in rational design of g-C3N4 photocatalyst for efficient solar fuel transformation, environmental decontamination and future perspectives. Int. J. Hydrogen Energy 2022, 47, 10837–10867. [Google Scholar] [CrossRef]
  11. Li, Z.; Jin, D.; Wang, Z. WO3(H2O)0.333/CdSe-diethylenetriamine nanocomposite as a step-scheme photocatalyst for hydrogen production. Surf. Interfaces 2022, 29, 101702. [Google Scholar] [CrossRef]
  12. Fu, Y.; Zhang, K.; Zhang, Y.; Cong, Y.; Wang, Q. Fabrication of visible-light-active MR/NH2-MIL-125(Ti) homojunction with boosted photocatalytic performance. Chem. Eng. J. 2021, 412, 128722. [Google Scholar] [CrossRef]
  13. Chang, Y.-S.; Hsieh, P.-Y.; Chang, T.-F.M.; Chen, C.-Y.; Sone, M.; Hsu, Y.-J. Incorporating graphene quantum dots to enhance the photoactivity of CdSe-sensitized TiO2 nanorods for solar hydrogen production. J. Mater. Chem. A 2020, 8, 13971–13979. [Google Scholar] [CrossRef]
  14. Putri, L.K.; Ng, B.-J.; Ong, W.-J.; Lee, H.W.; Chang, W.S.; Mohamed, A.R.; Chai, S.-P. Energy level tuning of CdSe colloidal quantum dots in ternary 0D-2D-2D CdSe QD/B-rGO/O-gC3N4 as photocatalysts for enhanced hydrogen generation. Appl. Catal. B Environ. 2020, 265, 118592. [Google Scholar] [CrossRef]
  15. Raheman, S.A.R.; Mane, R.S.; Wilson, H.M.; Jha, N. CdSe quantum dot/white graphene hexagonal porous boron nitride sheet (h-PBNs) heterostructure photocatalyst for solar driven H2 production. J. Mater. Chem. C 2021, 9, 8524–8536. [Google Scholar] [CrossRef]
  16. Xia, T.; Lin, Y.; Li, W.; Ju, M. Photocatalytic degradation of organic pollutants by MOFs based materials: A review. Chin. Chem. Lett. 2021, 32, 2975–2984. [Google Scholar] [CrossRef]
  17. Guo, J.; Ma, D.; Sun, F.; Zhuang, G.; Wang, Q.; Al-Enizi, A.M.; Nafady, A.; Ma, S. Substituent engineering in g-C3N4/COF heterojunctions for rapid charge separation and high photo-redox activity. Sci. China Chem. 2022, 65, 1704–1709. [Google Scholar] [CrossRef]
  18. Goktas, S.; Goktas, A. A comparative study on recent progress in efficient ZnO based nanocomposite and heterojunction photocatalysts: A review. J. Alloys Compd. 2021, 863, 158734. [Google Scholar] [CrossRef]
  19. Zhang, K.J.; Fu, Y.J.; Hao, D.R.; Guo, J.Y.; Ni, B.J.; Jiang, B.Q.; Xu, L.; Wang, Q. Fabrication of CN75/NH2-MIL-53(Fe) p-n heterojunction with wide spectral response for efficiently photocatalytic Cr(VI) reduction. J. Alloys Compd. 2022, 891, 161994. [Google Scholar] [CrossRef]
  20. Padmanabhan, N.T.; Thomas, N.; Louis, J.; Mathew, D.T.; Ganguly, P.; John, H.; Pillai, S.C. Graphene coupled TiO2 photocatalysts for environmental applications: A review. Chemosphere 2021, 271, 129506. [Google Scholar] [CrossRef]
  21. Zhang, W.; Sun, A.; Pan, X.; Han, Y.; Zhao, X.; Yu, L.; Zuo, Z.; Suo, N. Magnetic transformation of Zn-substituted Mg-Co ferrite nanoparticles: Hard magnetism → soft magnetism. J. Magn. Magn. Mater. 2020, 506, 166623. [Google Scholar] [CrossRef]
  22. Shah, N.R.A.M.; Yunus, R.M.; Rosman, N.N.; Wong, W.Y.; Arifin, K.; Minggu, L.J. Current progress on 3D graphene-based photocatalysts: From synthesis to photocatalytic hydrogen production. Int. J. Hydrogen Energy 2021, 46, 9324–9340. [Google Scholar] [CrossRef]
  23. Mohamed, R.M.; Ismail, A.A. Mesoporous Ag2O/ZrO2 heterostructures as efficient photocatalyst for acceleration photocatalytic oxidative desulfurization of thiophene. Ceram. Int. 2022, 48, 12592–12600. [Google Scholar] [CrossRef]
  24. Ma, T.; Li, Z.; Liu, W.; Chen, J.; Wu, M.; Wang, Z. Microwave hydrothermal synthesis of WO3(H2O)0.333/CdS nanocomposites for efficient visible-light photocatalytic hydrogen evolution. Front. Mater. Sci. 2021, 15, 589–600. [Google Scholar] [CrossRef]
  25. Wang, Y.; Zhu, B.; Cheng, B.; Macyk, W.; Kuang, P.; Yu, J. Hollow carbon sphere-supported Pt/CoOx hybrid with excellent hydrogen evolution activity and stability in acidic environment. Appl. Catal. B Environ. 2022, 314, 121503. [Google Scholar] [CrossRef]
  26. Fu, Y.; Tan, M.; Guo, Z.; Hao, D.; Xu, Y.; Du, H.; Zhang, C.; Guo, J.; Li, Q.; Wang, Q. Fabrication of wide-spectra-responsive NA/NH2-MIL-125(Ti) with boosted activity for Cr(VI) reduction and antibacterial effects. Chem. Eng. J. 2023, 452, 139417. [Google Scholar] [CrossRef]
  27. Cao, S.; Shen, B.; Tong, T.; Fu, J.; Yu, J. 2D/2D Heterojunction of Ultrathin MXene/Bi2WO6 Nanosheets for Improved Photocatalytic CO2 Reduction. Adv. Funct. Mater. 2018, 28, 1800136. [Google Scholar] [CrossRef]
  28. Li, Z.; Jin, D.; Wang, Z. ZnO/CdSe-diethylenetriamine nanocomposite as a step-scheme photocatalyst for photocatalytic hydrogen evolution. Appl. Surf. Sci. 2020, 529, 147071. [Google Scholar] [CrossRef]
  29. Li, S.; Cai, M.; Liu, Y.; Wang, C.; Yan, R.; Chen, X. Constructing Cd0.5Zn0.5S/Bi2WO6 S-scheme heterojunction for boosted photocatalytic antibiotic oxidation and Cr(VI) reduction. Adv. Powder Mater. 2023, 2, 100073. [Google Scholar] [CrossRef]
  30. Fu, J.; Xu, Q.; Low, J.; Jiang, C.; Yu, J. Ultrathin 2D/2D WO3/g-C3N4 step-scheme H2-production photocatalyst. Appl. Catal. B Environ. 2019, 243, 556–565. [Google Scholar] [CrossRef]
  31. Liu, Z.R.; Ding, X.; Zhu, R.; Li, Y.A.; Wang, Y.Q.; Sun, W.; Wang, D.; Wu, L.; Zheng, L. Investigation on the Effect of Highly Active Ni/ZrO2 Catalysts Modified by MgO-Nd2O3 Promoters in CO2 Methanation at Low Temperature Condition. Chemistryselect 2022, 7, e202103774. [Google Scholar]
  32. Li, S.; Cai, M.; Liu, Y.; Wang, C.; Lv, K.; Chen, X. S-Scheme photocatalyst TaON/Bi2WO6 nanofibers with oxygen vacancies for efficient abatement of antibiotics and Cr(VI): Intermediate eco-toxicity analysis and mechanistic insights. Chin. J. Catal. 2022, 43, 2652–2664. [Google Scholar] [CrossRef]
  33. He, F.; Meng, A.; Cheng, B.; Ho, W.; Yu, J. Enhanced photocatalytic H2-production activity of WO3/TiO2 step-scheme heterojunction by graphene modification. Chin. J. Catal. 2020, 41, 9–20. [Google Scholar] [CrossRef]
  34. Du, H.; Li, N.; Yang, L.; Li, Q.; Yang, G.; Wang, Q. Plasmonic Ag modified Ag3VO4/AgPMo S-scheme heterojunction photocatalyst for boosted Cr(VI) reduction under visible light: Performance and mechanism. Sep. Purif. Technol. 2023, 304, 122204. [Google Scholar] [CrossRef]
  35. Wang, Z.; Chen, Y.; Zhang, L.; Cheng, B.; Yu, J.; Fan, J. Step-scheme CdS/TiO2 nanocomposite hollow microsphere with enhanced photocatalytic CO2 reduction activity. J. Mater. Sci. Technol. 2020, 56, 143–150. [Google Scholar] [CrossRef]
  36. Lian, Z.; Sakamoto, M.; Kobayashi, Y.; Tamai, N.; Ma, J.; Sakurai, T.; Seki, S.; Nakagawa, T.; Lai, M.-W.; Haruta, M.; et al. Anomalous Photoinduced Hole Transport in Type I Core/Mesoporous-Shell Nanocrystals for Efficient Photocatalytic H2 Evolution. ACS Nano 2019, 13, 8356–8363. [Google Scholar] [CrossRef] [PubMed]
  37. Martinez-Haya, R.; Miranda, M.A.; Marin, M.L. Type I vs Type II photodegradation of pollutants. Catal. Today 2018, 313, 161–166. [Google Scholar] [CrossRef]
  38. Wang, Q.; Zhang, Y.; Li, J.; Liu, N.; Jiao, Y.; Jiao, Z. Construction of electron transport channels in type-I heterostructures of Bi2MoO6/BiVO4/g-C3N4 for improved charge carriers separation efficiency. J. Colloid Interf. Sci. 2020, 567, 145–153. [Google Scholar] [CrossRef]
  39. Liu, H.; Cheng, D.-G.; Chen, F.; Zhan, X. Porous lantern-like MFI zeolites composed of 2D nanosheets for highly efficient visible light-driven photocatalysis. Catal. Sci. Technol. 2020, 10, 351–359. [Google Scholar] [CrossRef]
  40. Deng, L.; Fang, N.; Wu, S.; Shu, S.; Chu, Y.; Guo, J.; Cen, W. Uniform H-CdS@NiCoP core-shell nanosphere for highly efficient visible-light-driven photocatalytic H2 evolution. J. Colloid Interf. Sci. 2022, 608, 2730–2739. [Google Scholar] [CrossRef]
  41. Zhang, H.; Kong, X.; Yu, F.; Wang, Y.; Liu, C.; Yin, L.; Huang, J.; Feng, Q. Ni(OH)2 Nanosheets Modified Hexagonal Pyramid CdS Formed Type II Heterojunction Photocatalyst with High-Visible-Light H2 Evolution. ACS Appl. Energy Mater. 2021, 4, 13152–13160. [Google Scholar] [CrossRef]
Scheme 1. Schematic diagram for the synthesis of ZO/CS nanocomposites.
Catalysts 12 01385 sch001
Figure 1. XRD patterns of (a) ZO, ZO/CS nanocomposites, and CS; (b) CdSe-DETA in 100 °C for 12 h.
Catalysts 12 01385 g001
Figure 2. SEM images of (a) CS, (b) ZO, and (c) ZO/CS-0.6; EDS spectra of (d) CS, (e) ZO, and (f) ZO/CS-0.6. TEM images of (g) CS, (h) ZO, and (i) ZO/CS-0.6 (inset shows the HRTEM images of the ZO/CS-0.6).
Catalysts 12 01385 g002
Figure 3. XPS spectra: (a) survey scan; (b) Zr 3d; (c) O 1s; (d) Cd 3d; (e) Se 3d and (f) N 1s.
Catalysts 12 01385 g003
Figure 4. (a) UV-vis DRS of ZO, CS, and ZO/CS nanocomposites; (b) plots of (αhν)2 versus energy () for ZO and CS.
Catalysts 12 01385 g004
Figure 5. FT-IR spectra of ZO, ZO/CS nanocomposites, and CS.
Catalysts 12 01385 g005
Figure 6. (a) N2 adsorption–desorption isotherms of ZO, ZO/CS nanocomposites, and CS, inserts are the pore size distribution curves; (b) BET surface area for the above samples.
Catalysts 12 01385 g006
Figure 7. (a) Photocatalytic H2 production rates of as-prepared photocatalysts. (b) Cycling stability for the ZO/CS-0.6.
Catalysts 12 01385 g007
Figure 8. Photocurrent density–time curves of CS, ZO/CS-0.6, and ZO.
Catalysts 12 01385 g008
Figure 9. Mott–Schottky plots of (a) ZO and (b) CS. (c) The photocatalysis mechanism of ZO/CS nanocomposite under visible light.
Catalysts 12 01385 g009
Publisher’s Note: MDPI stays neutral with regard to jurisdictional claims in published maps and institutional affiliations.

