
A Theoretical and Experimental Approach to the Analysis of Hydrogen Generation and Thermodynamic Behavior in an In Situ Heavy Oil Upgrading Process Using Oil-Based Nanofluids
 ,
,  , ,
, ,  , , and
Abstract
:1. Introduction
2. Results
2.1. Nanoparticle Selection through Adsorption Isotherms and Thermogravimetric Analysis
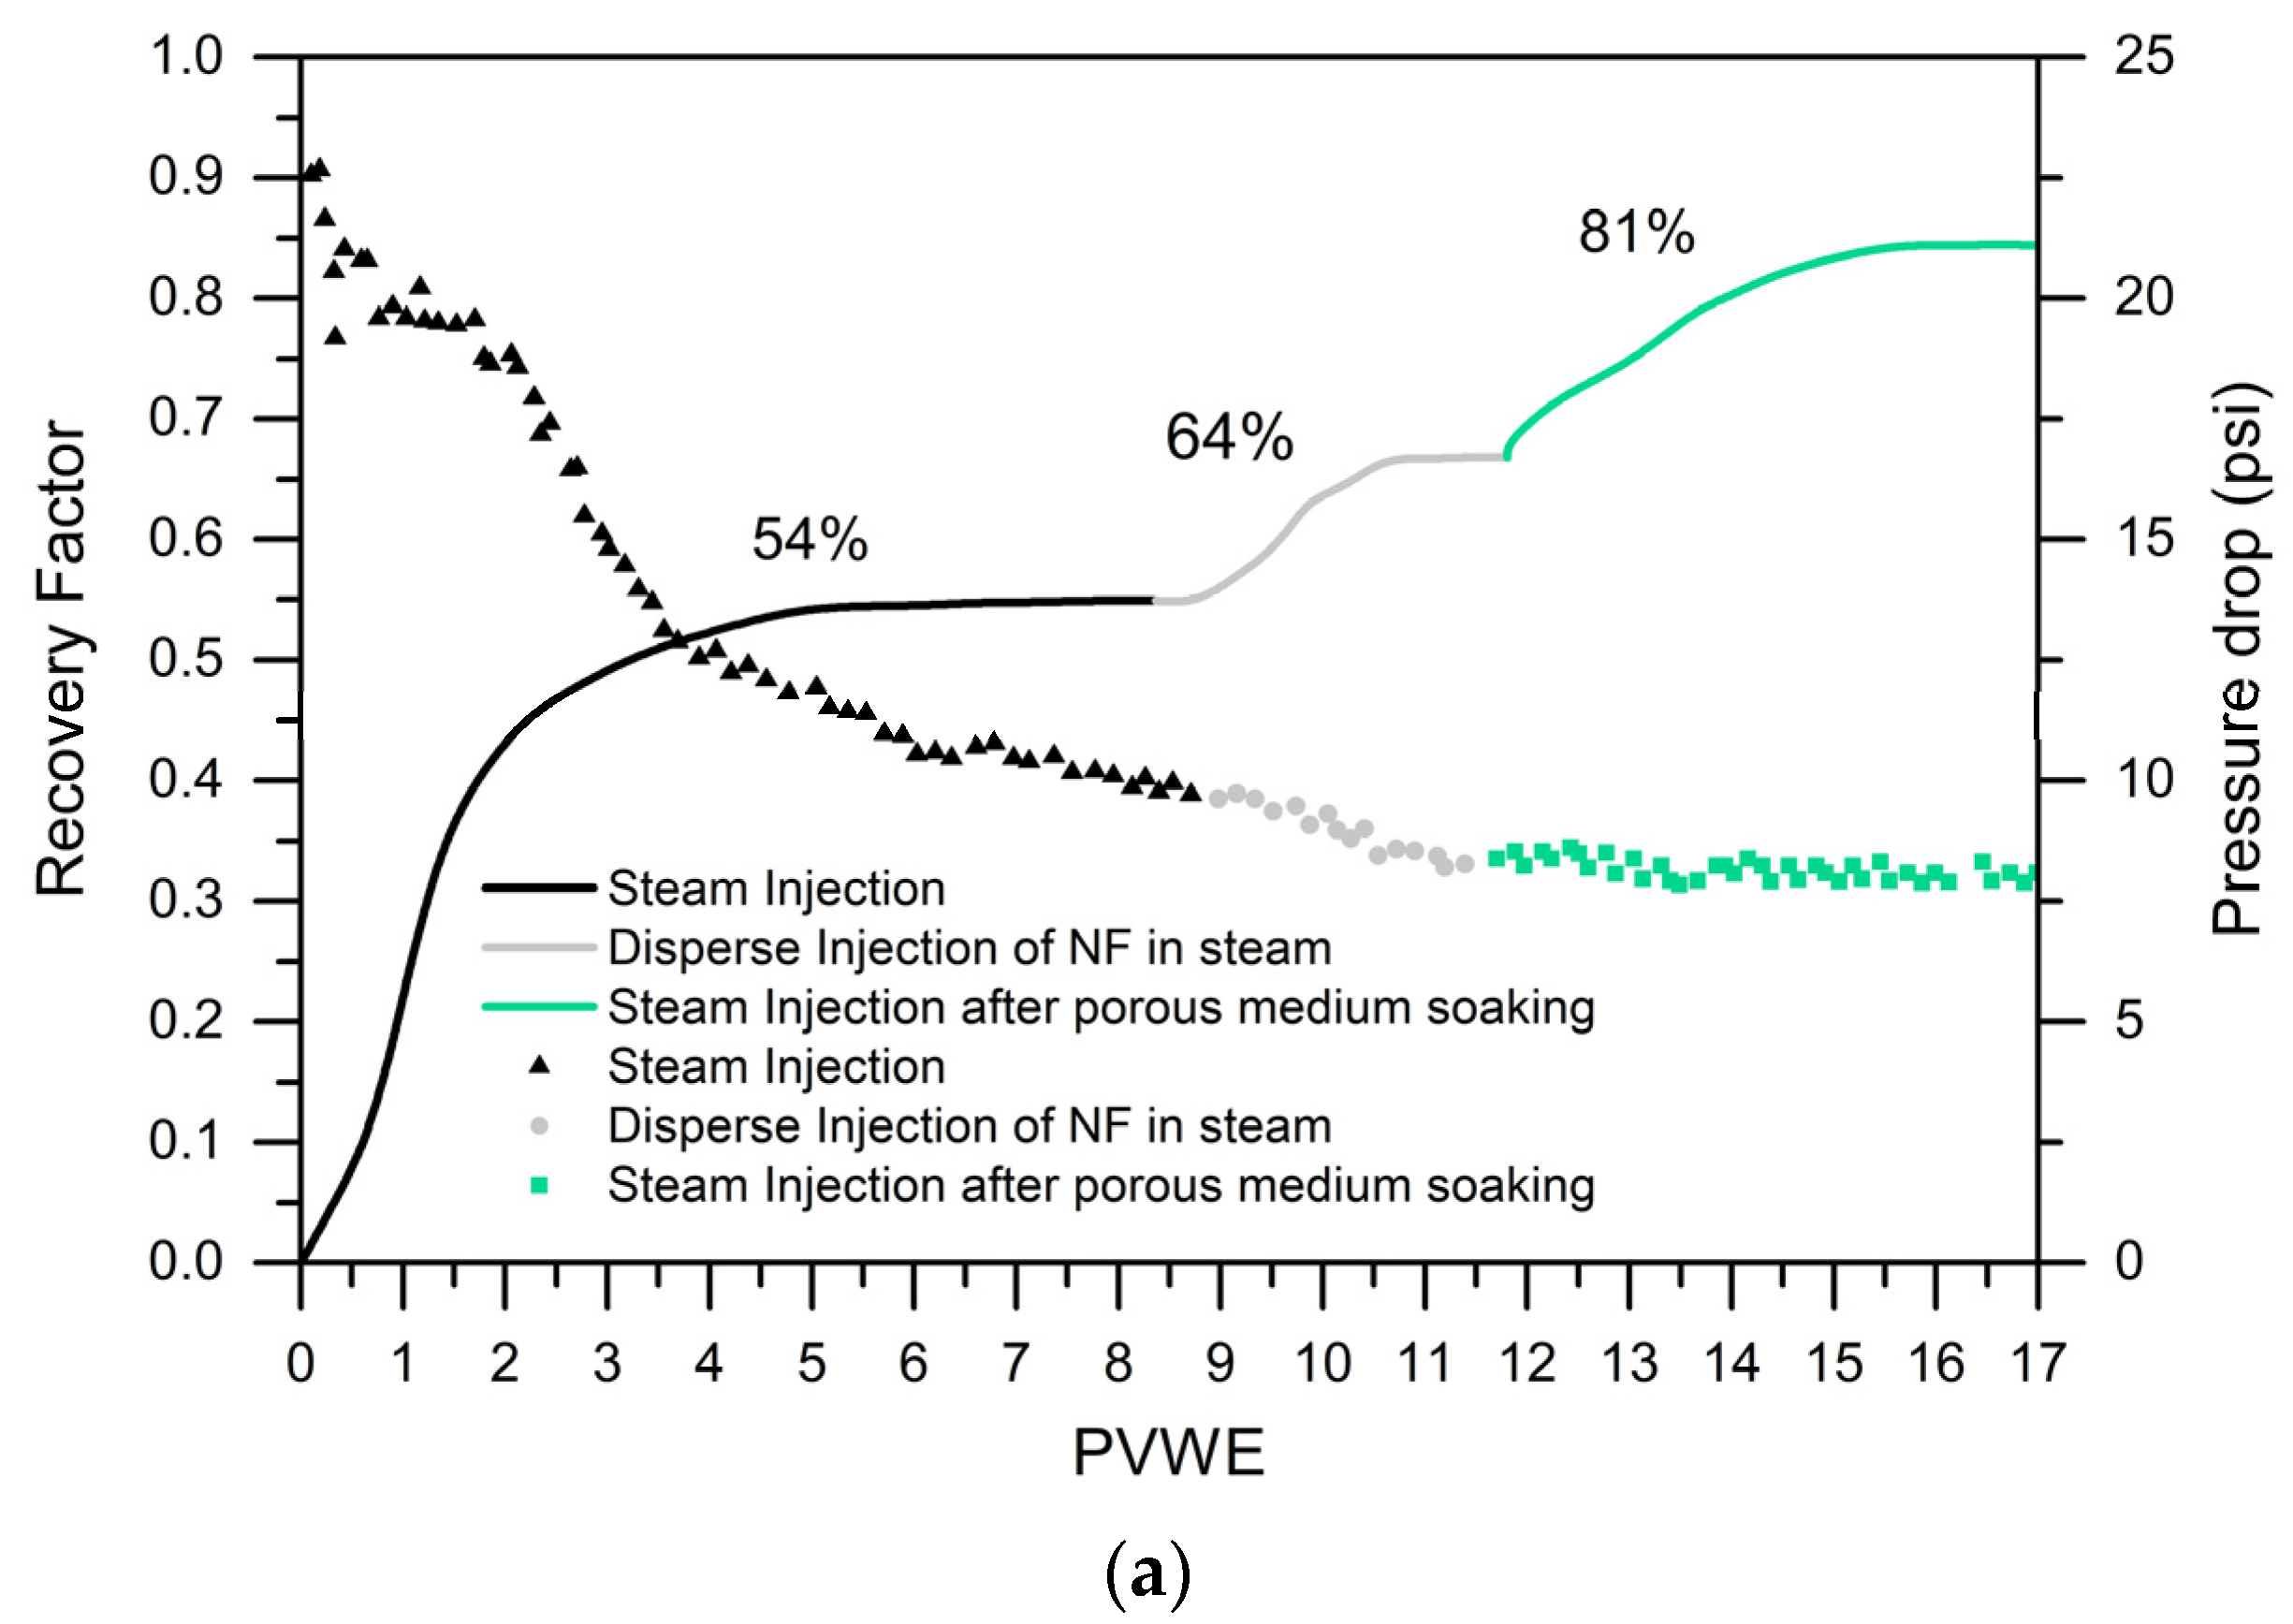
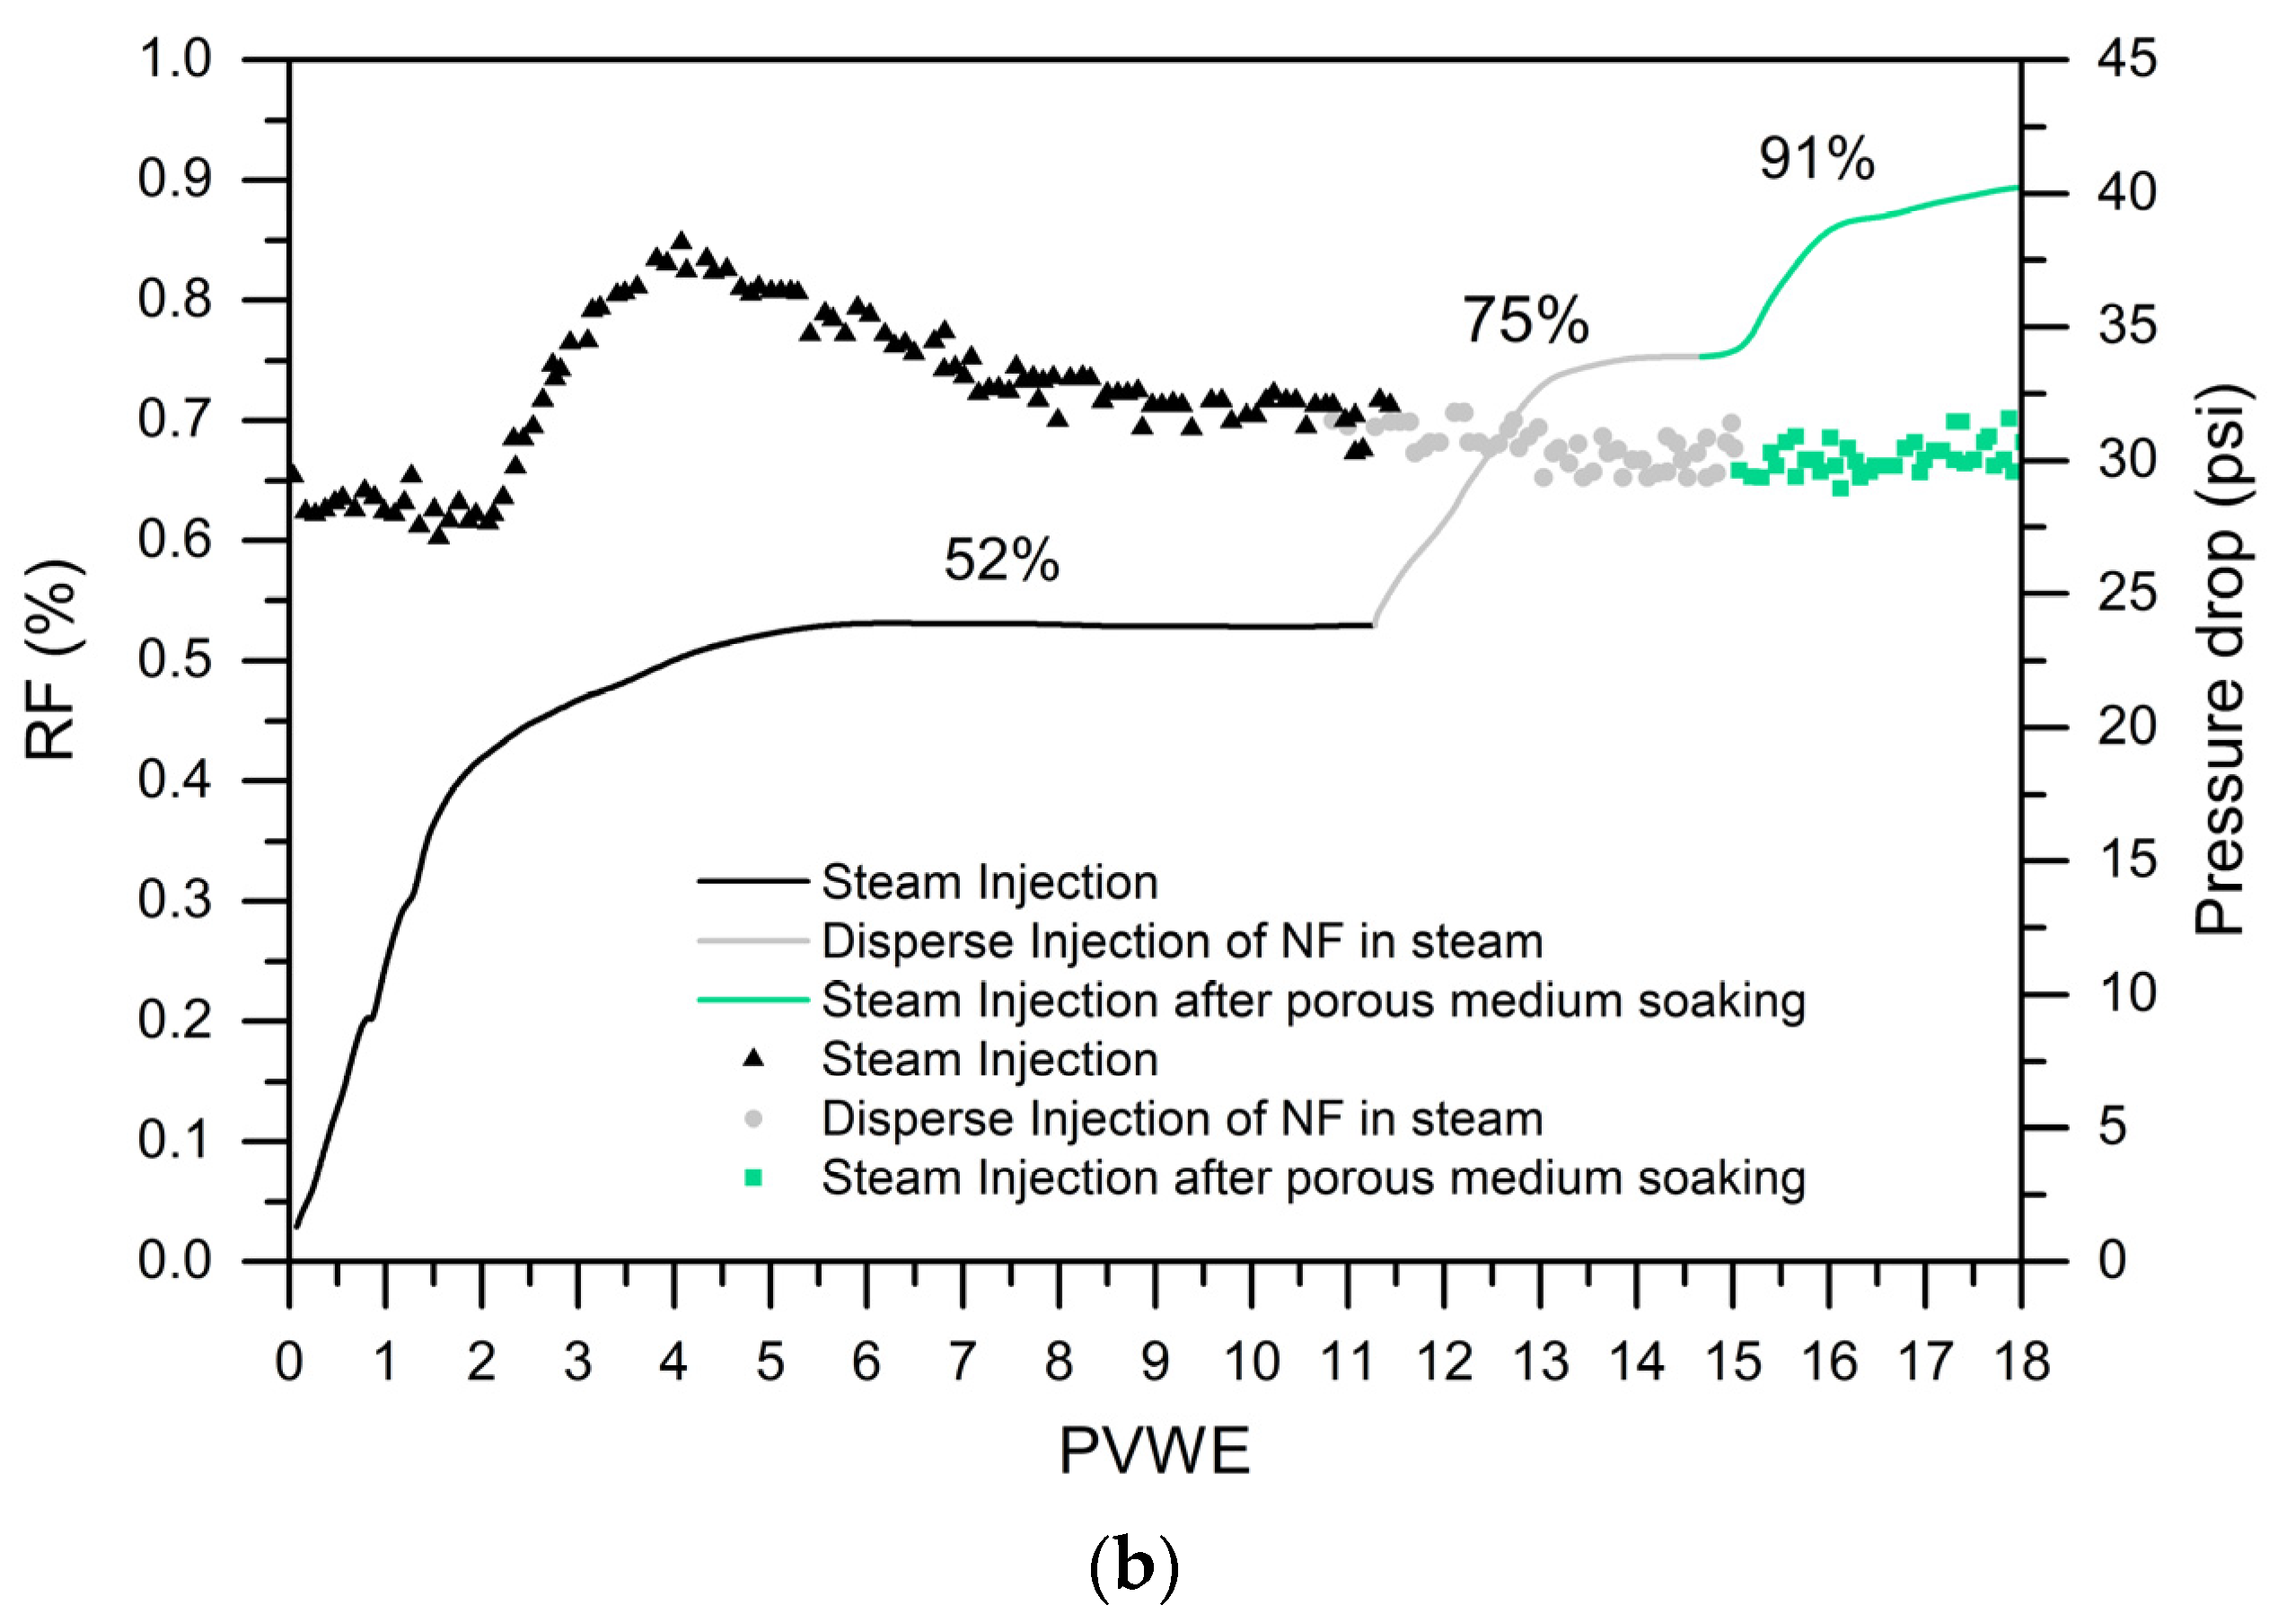
2.2. Crude Oil Recovery
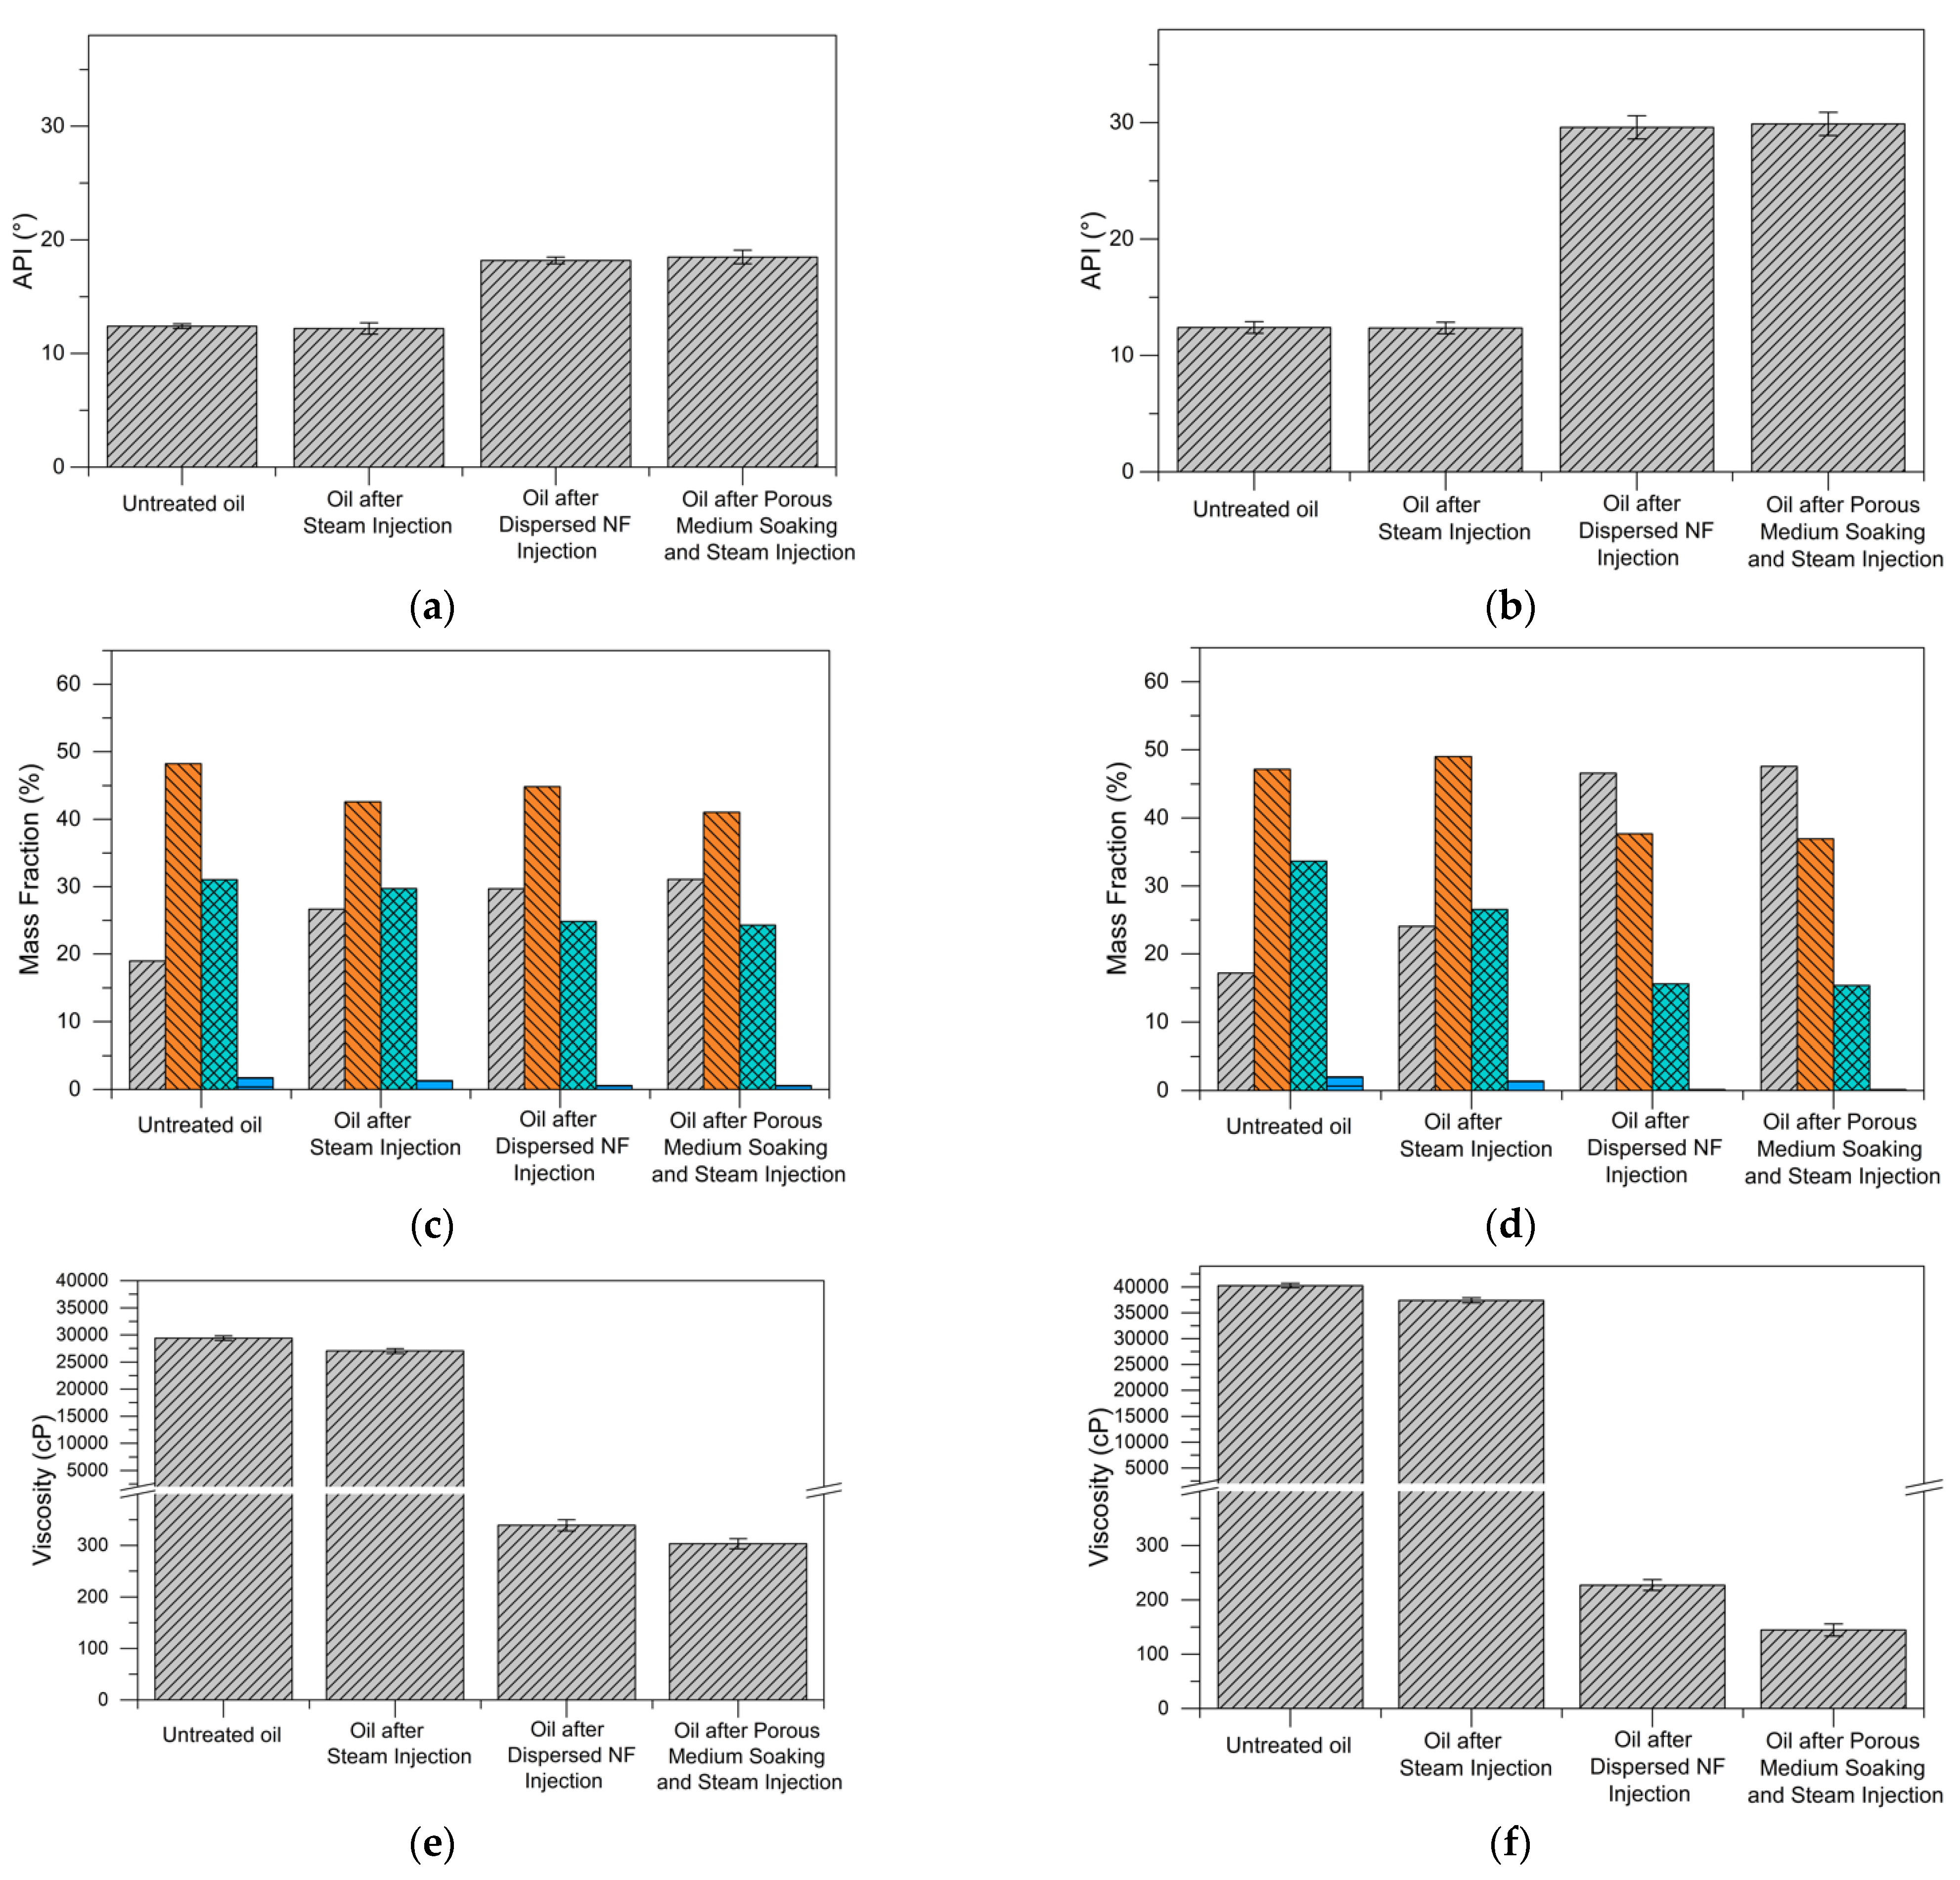
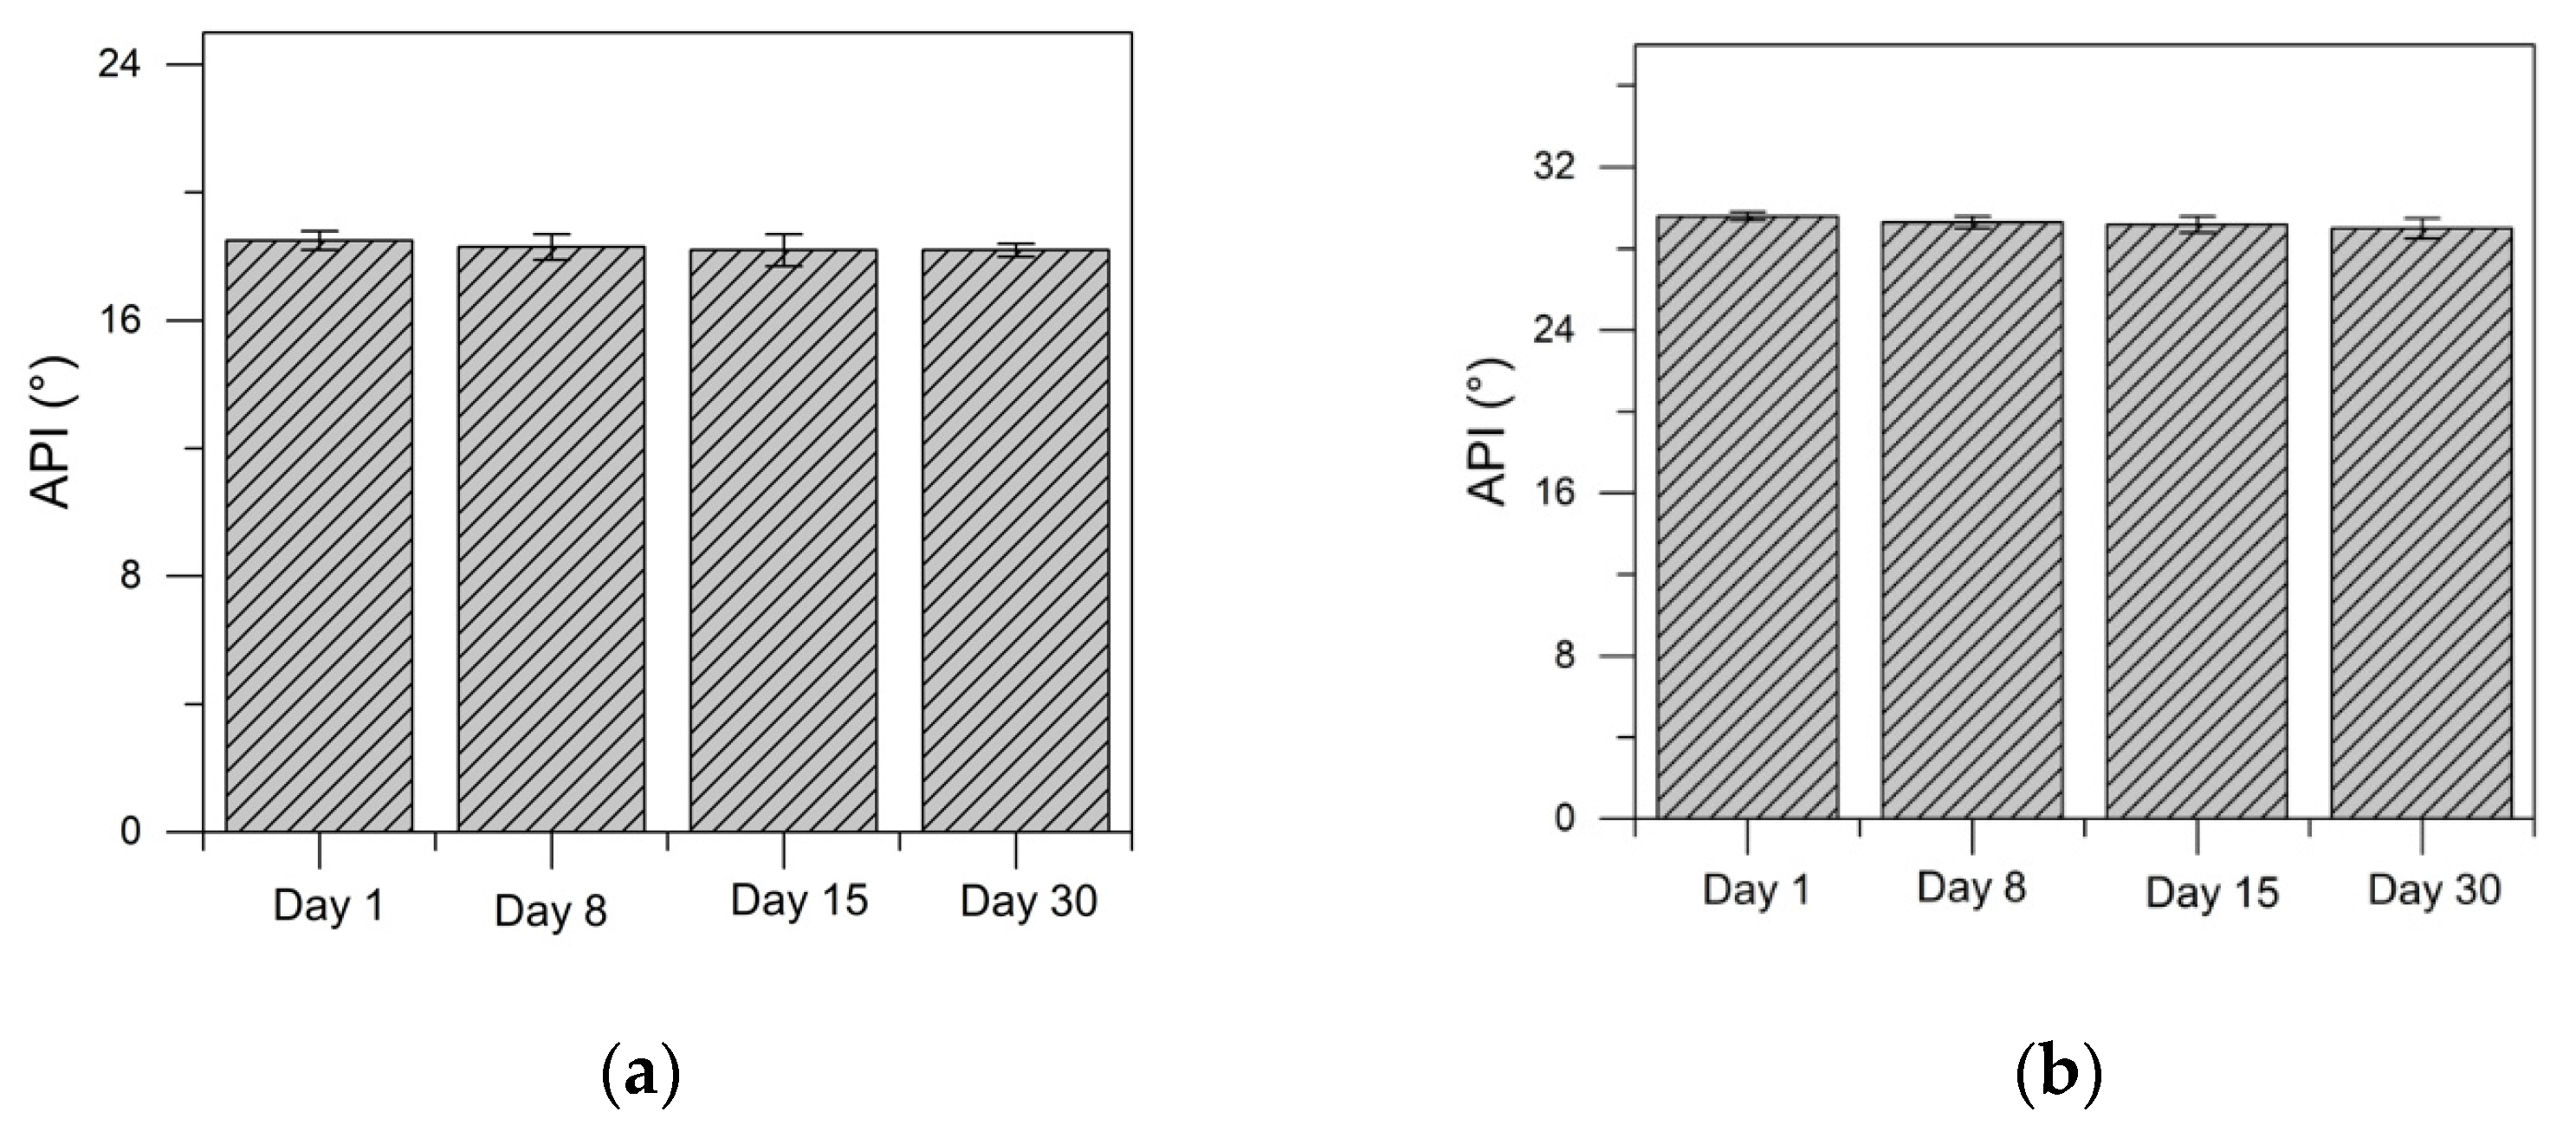
2.3. Effluent Analysis
2.4. Gaseous Products
2.5. Thermodynamic Analysis of Produced Hydrogen
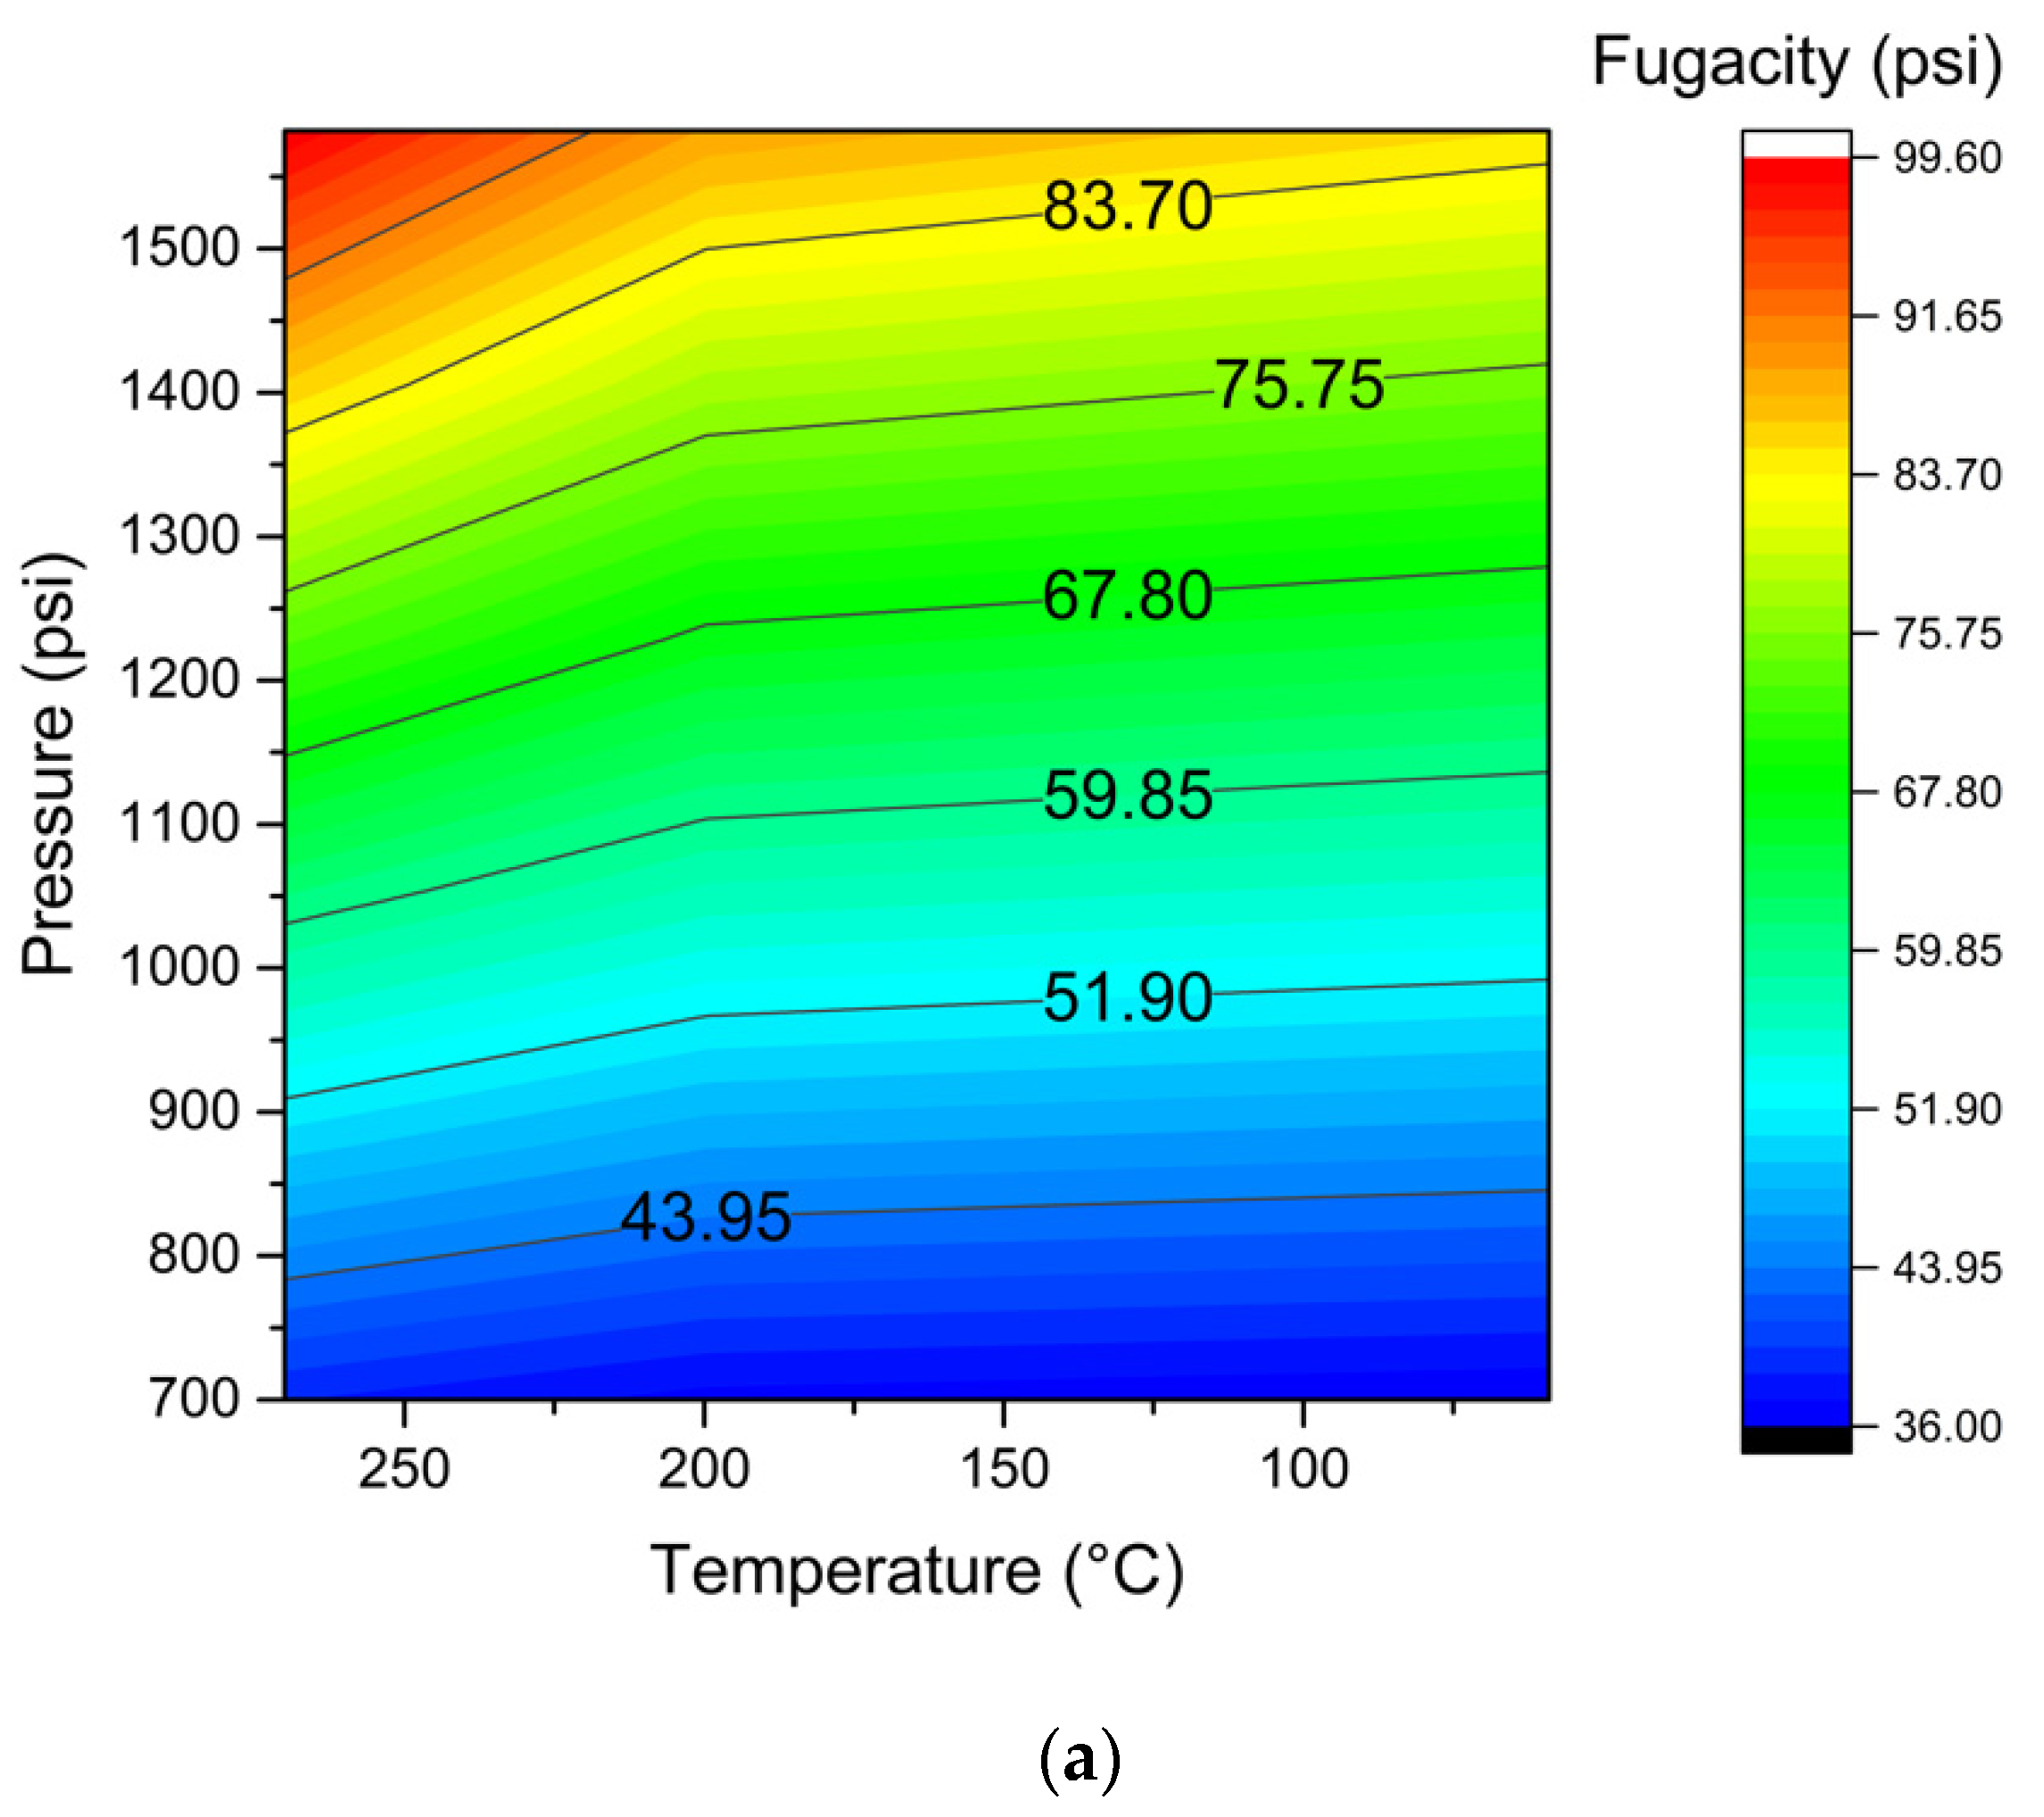
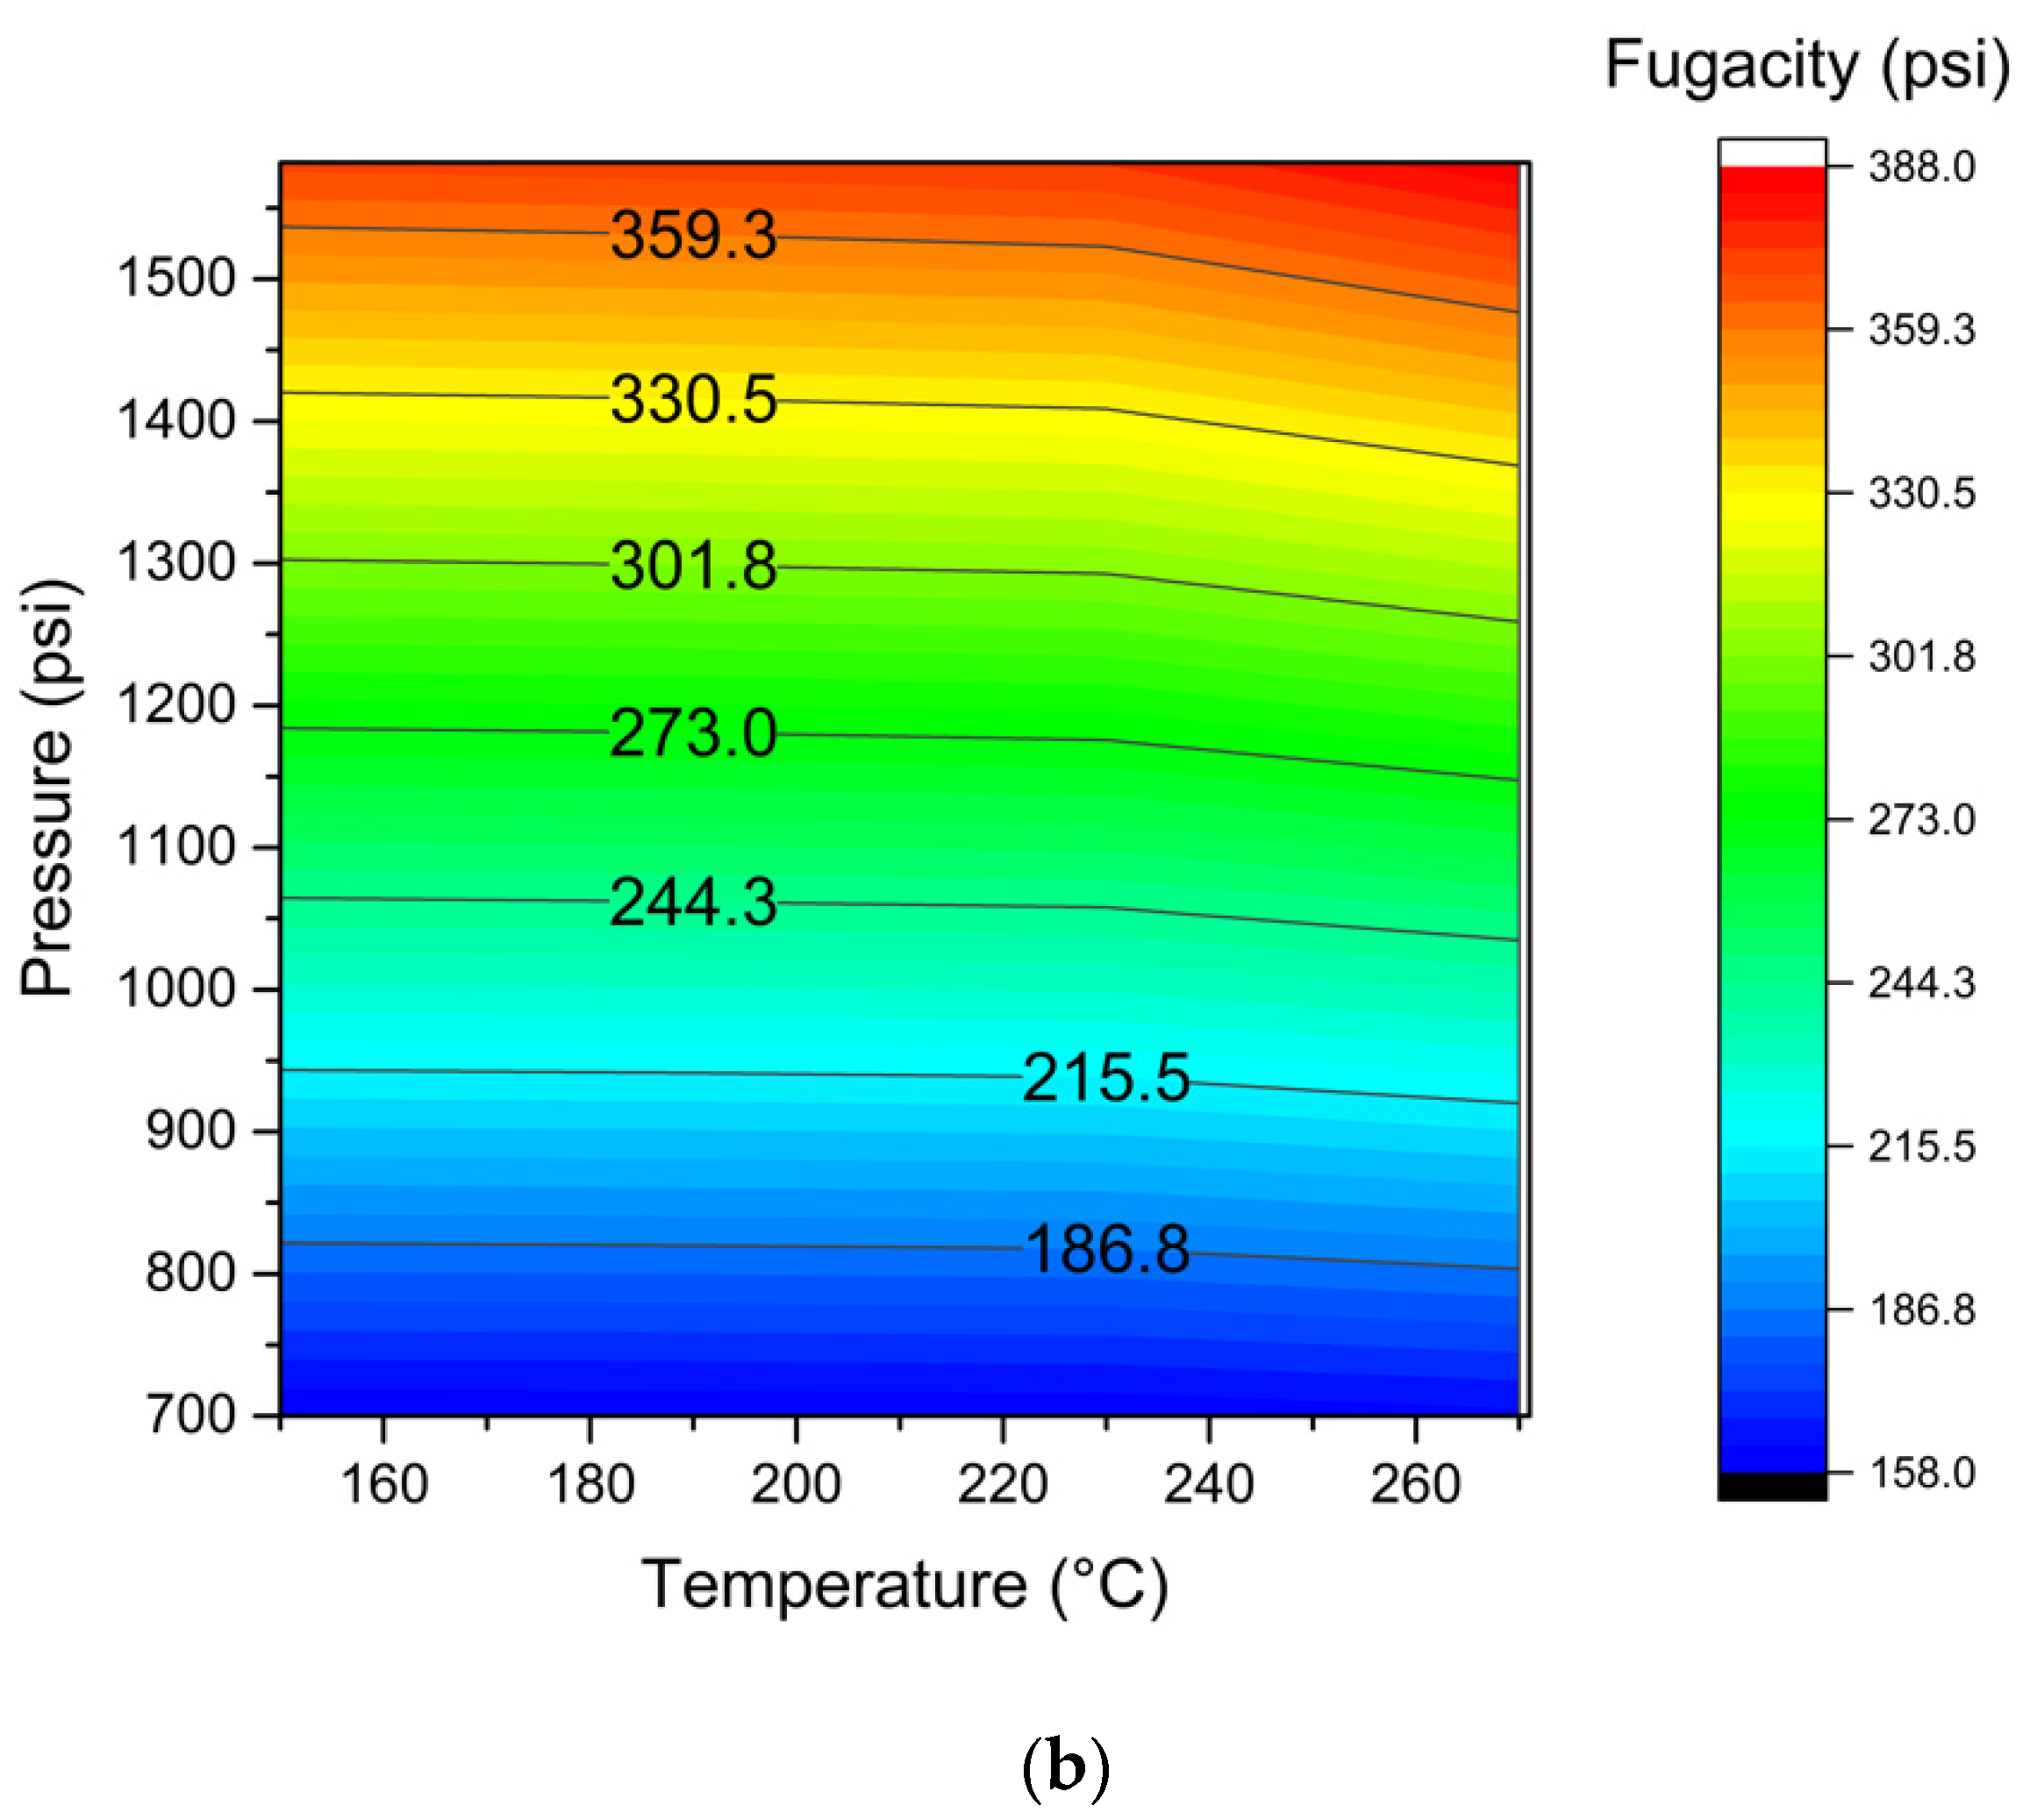
2.5.1. Hydrogen Fugacity on HO1 during Steam Injection Assisted by Nanoparticles
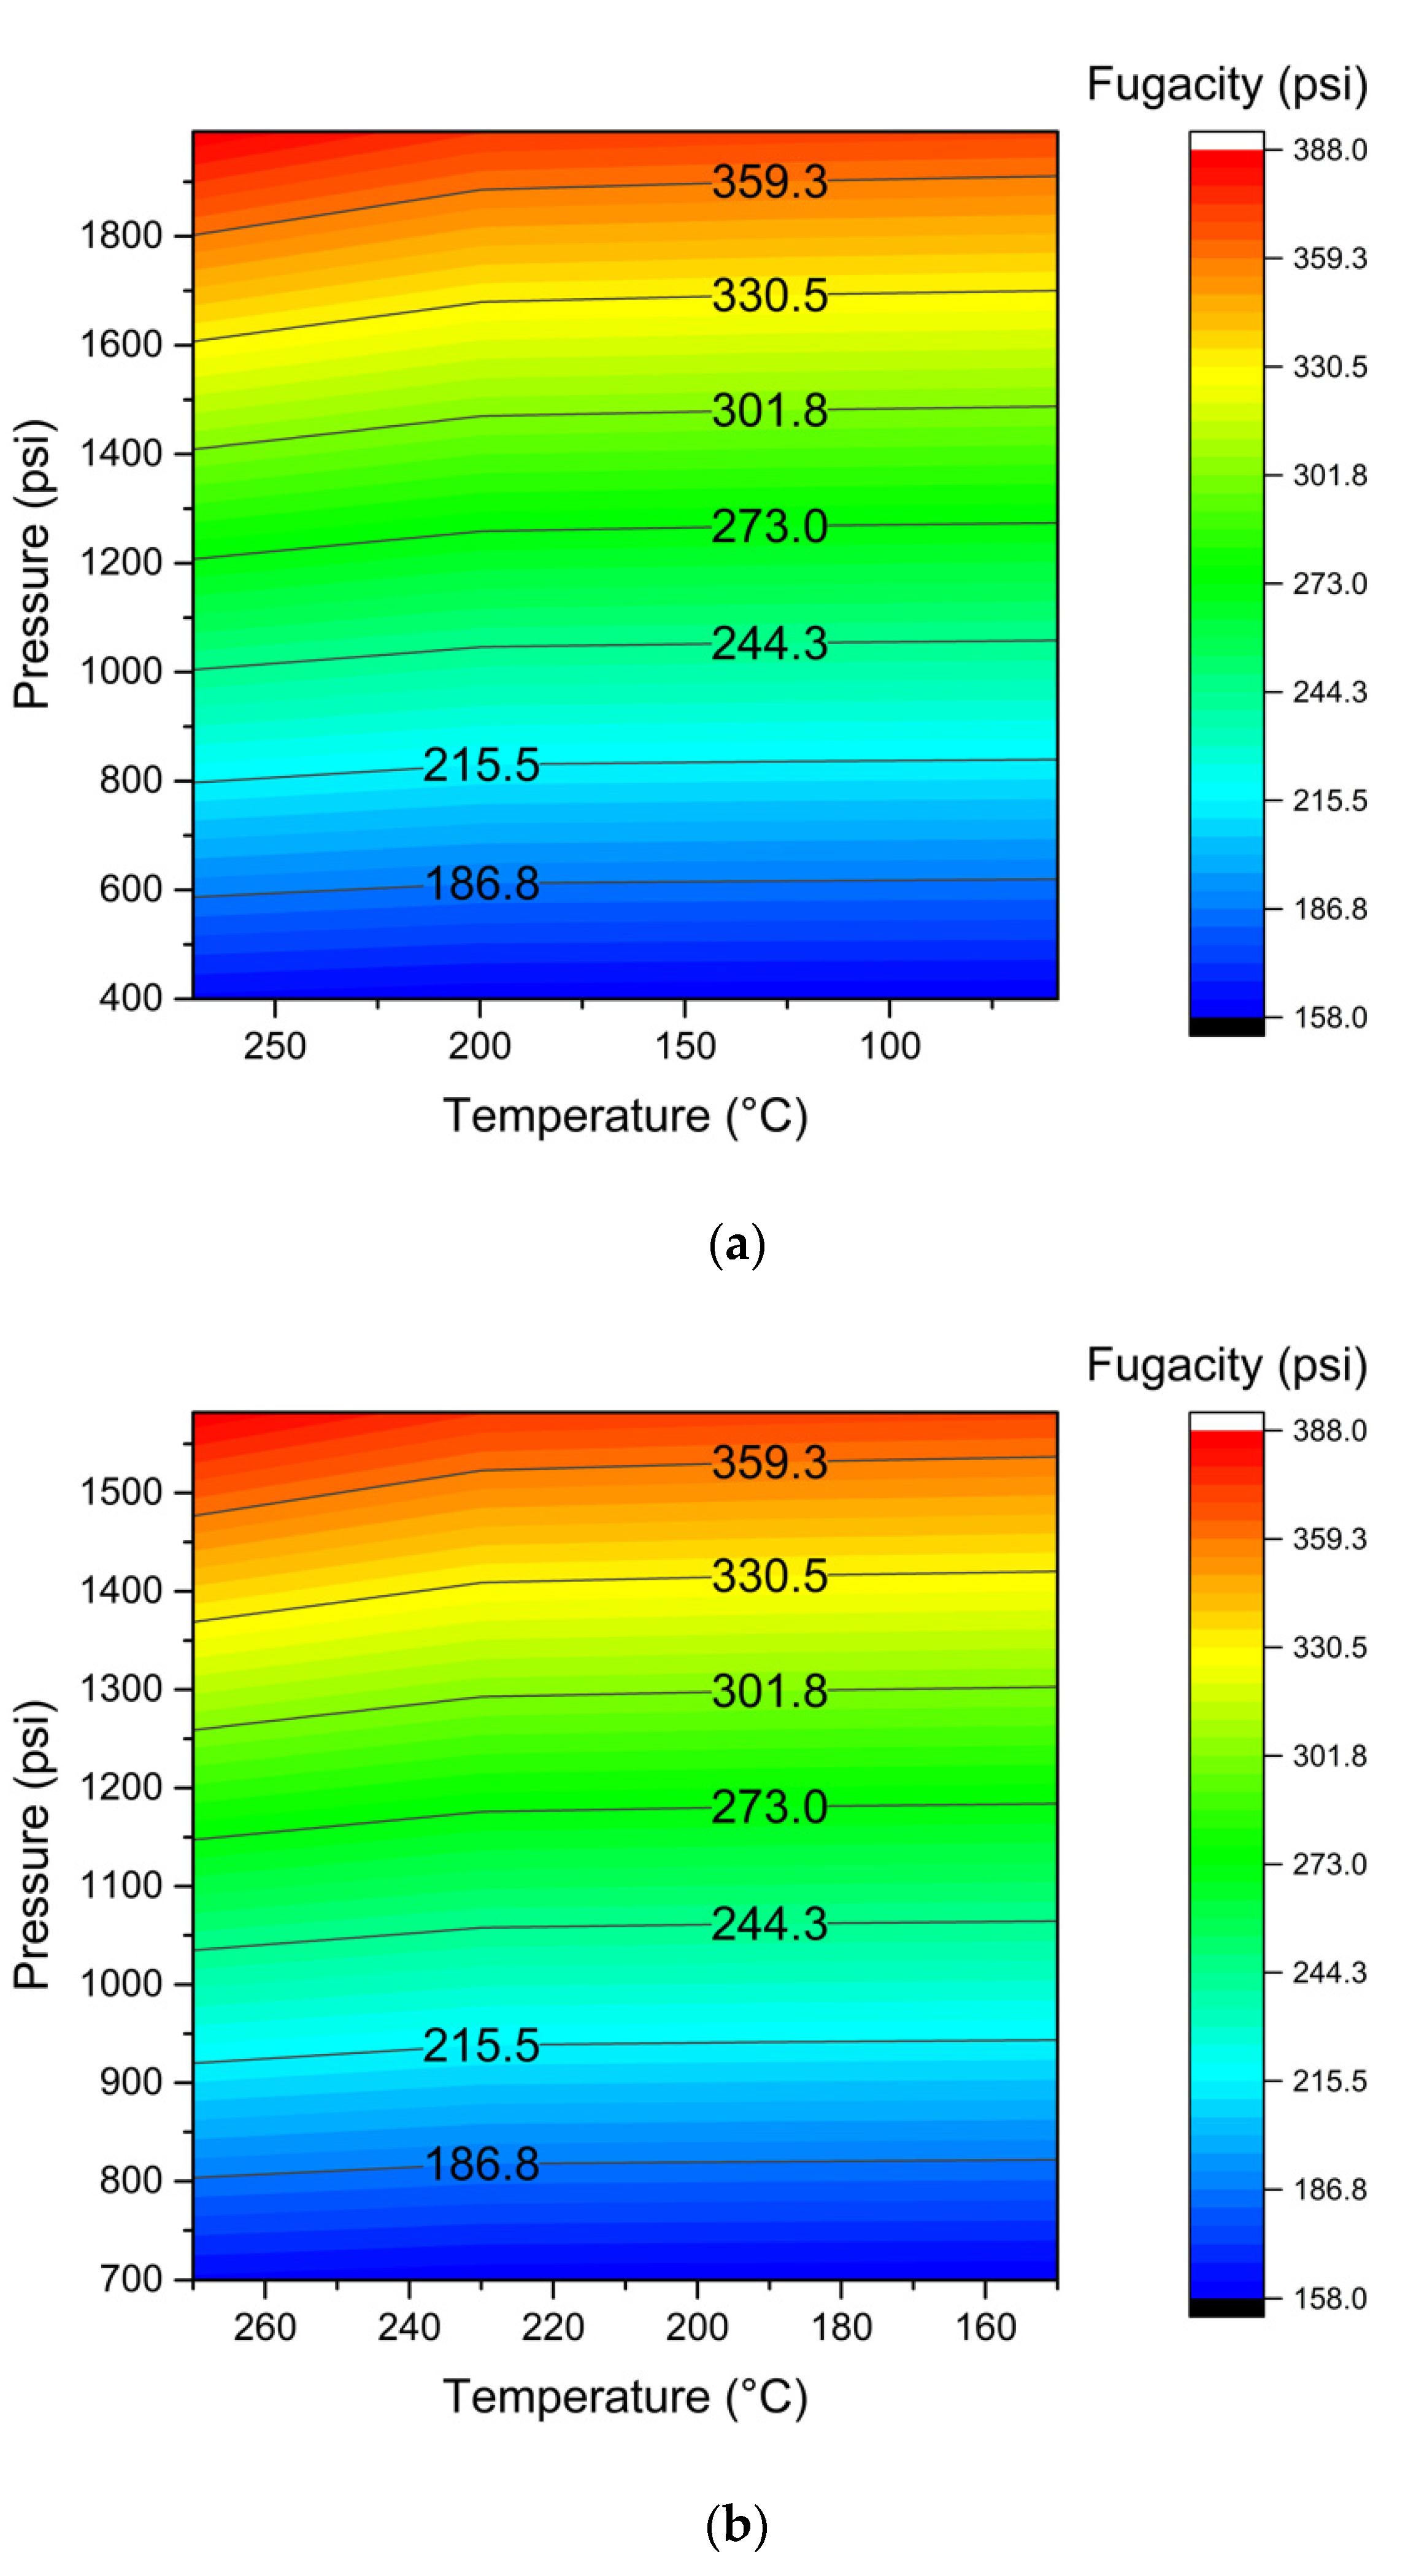
2.5.2. Hydrogen Fugacity on HO1 at Different Temperatures Assisted by Nanoparticles
2.5.3. Hydrogen Fugacity on HO2 at Different Temperatures in the Presence and Absence of Nanoparticles and Comparison with HO1
3. Materials and Methods
3.1. Materials
3.2. Static Tests for Nanoparticle Selection through Adsorption Isotherms and Thermogravimetric Analysis
3.3. Oil Recovery and Upgrading Evaluation
3.4. Effluents Characterization
3.5. Description of the Considered Scenario for In Situ Hydrogen Generated
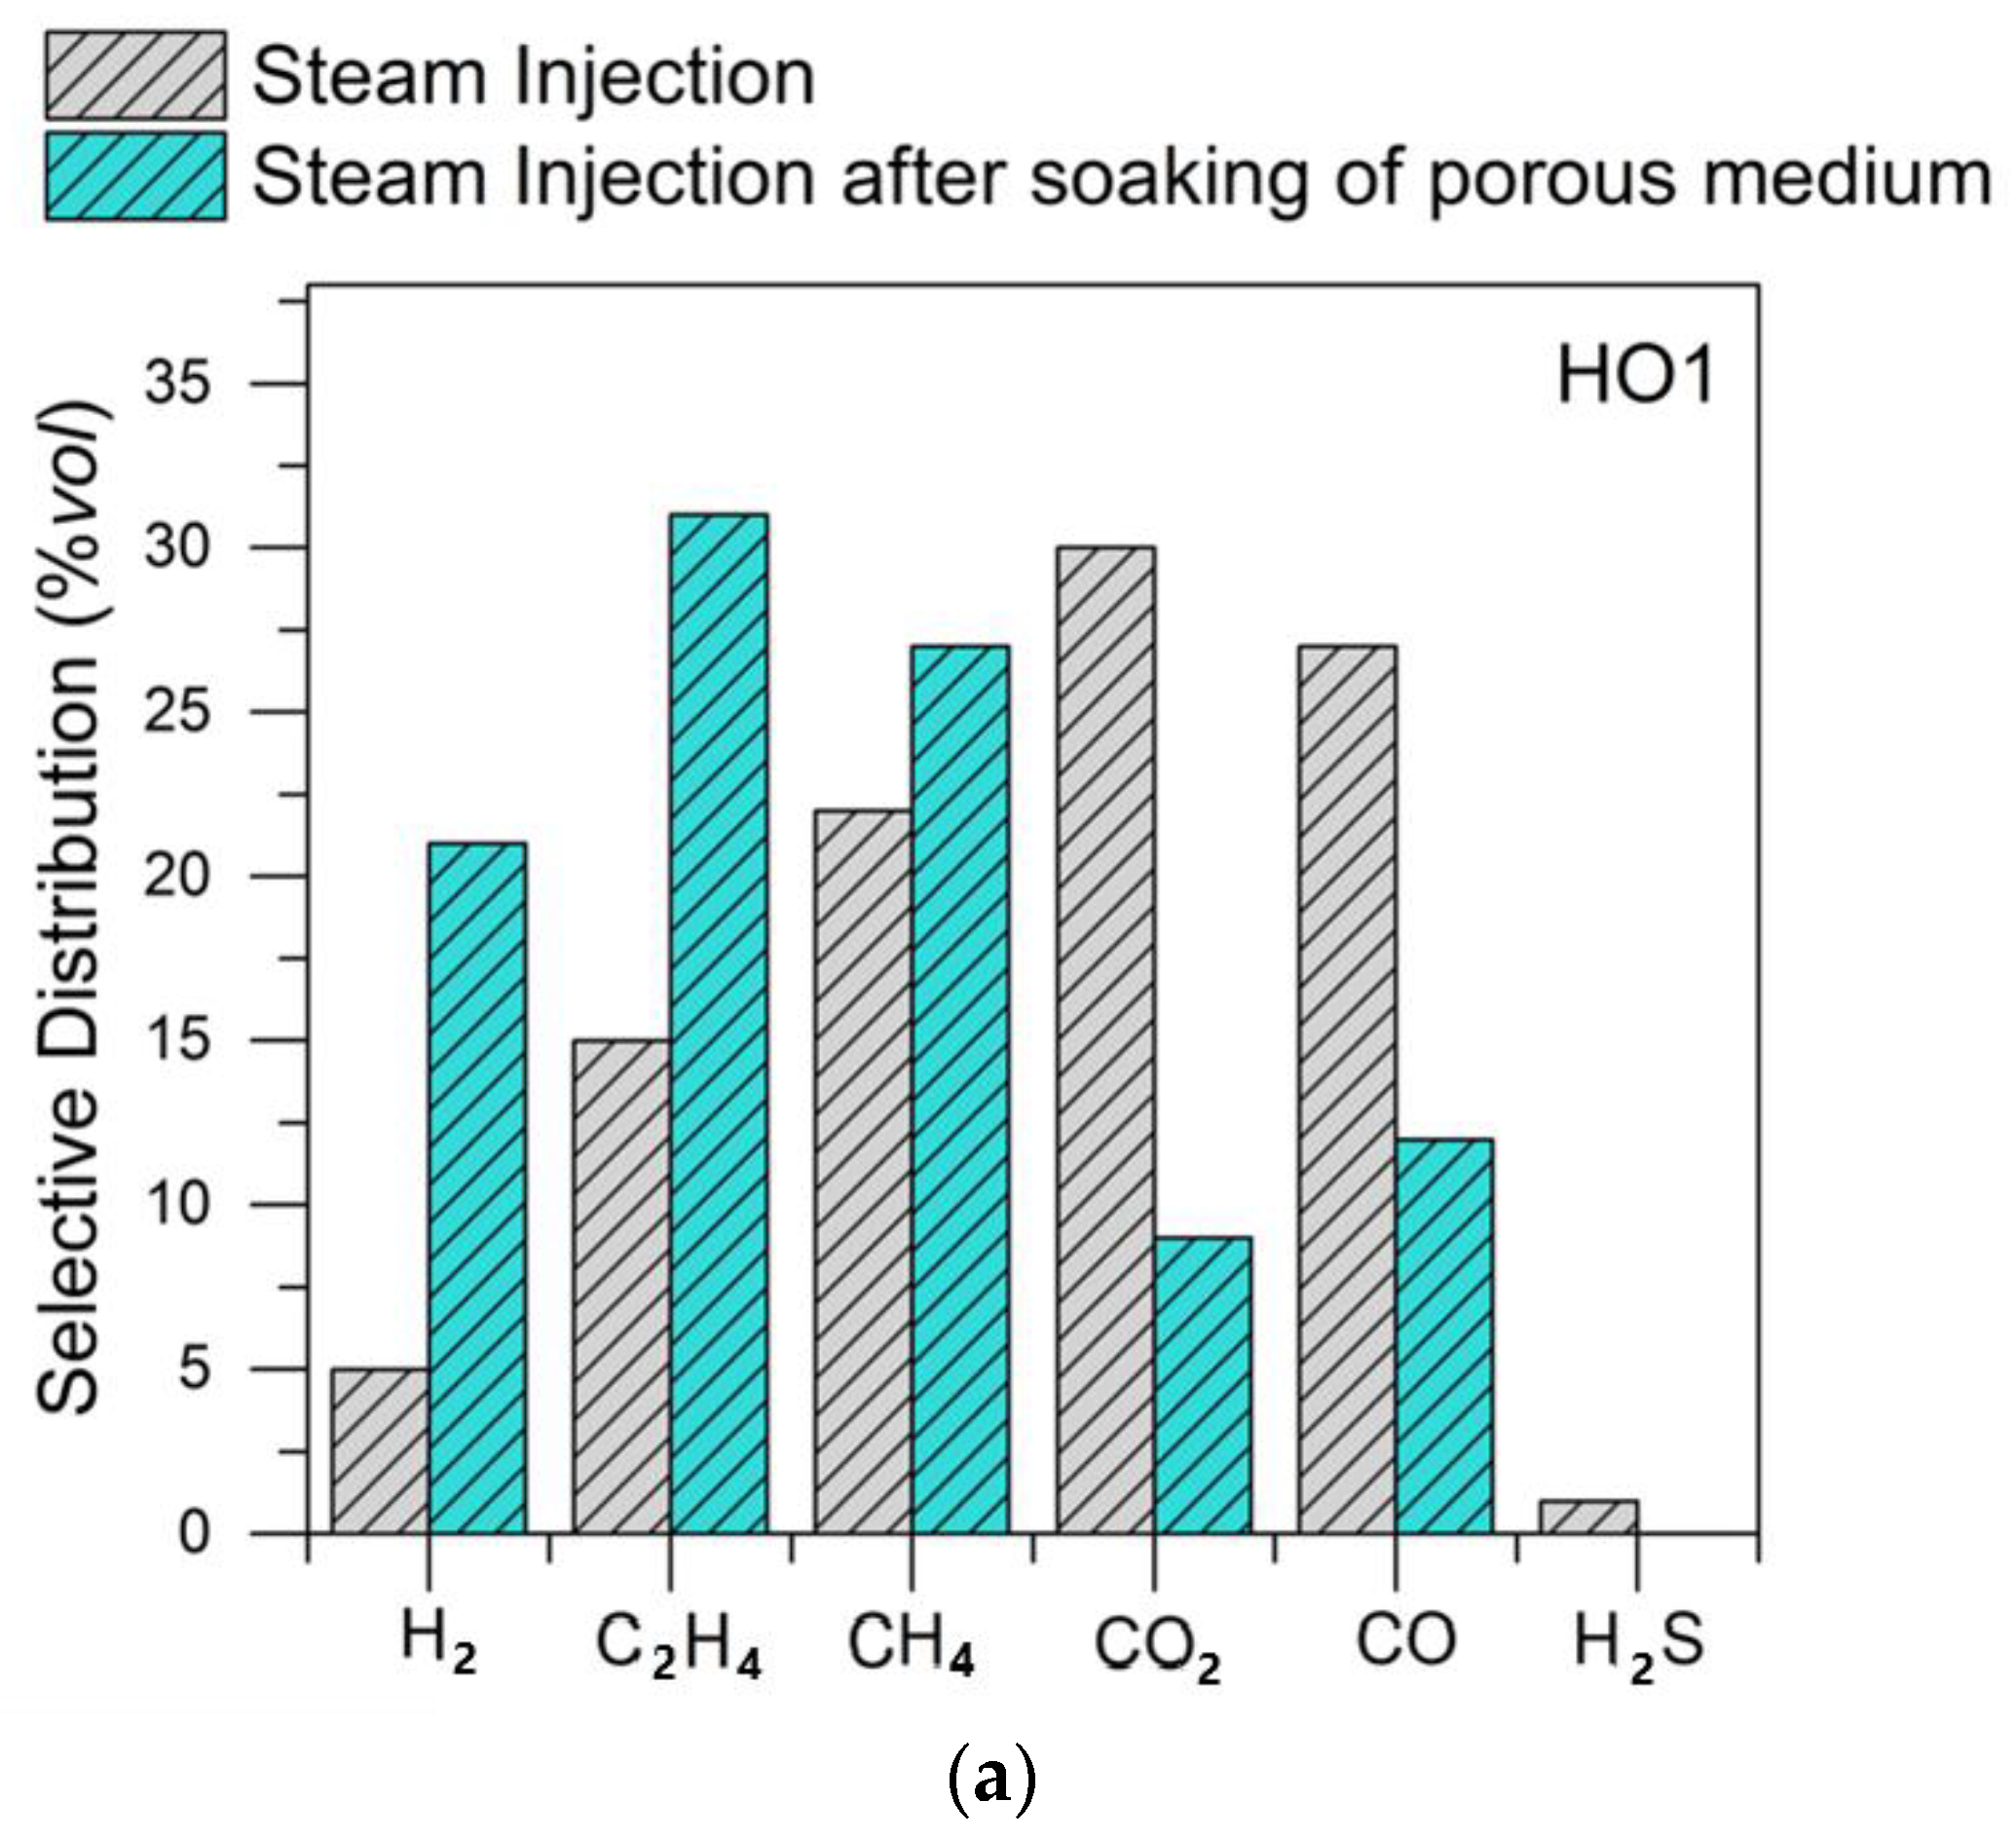
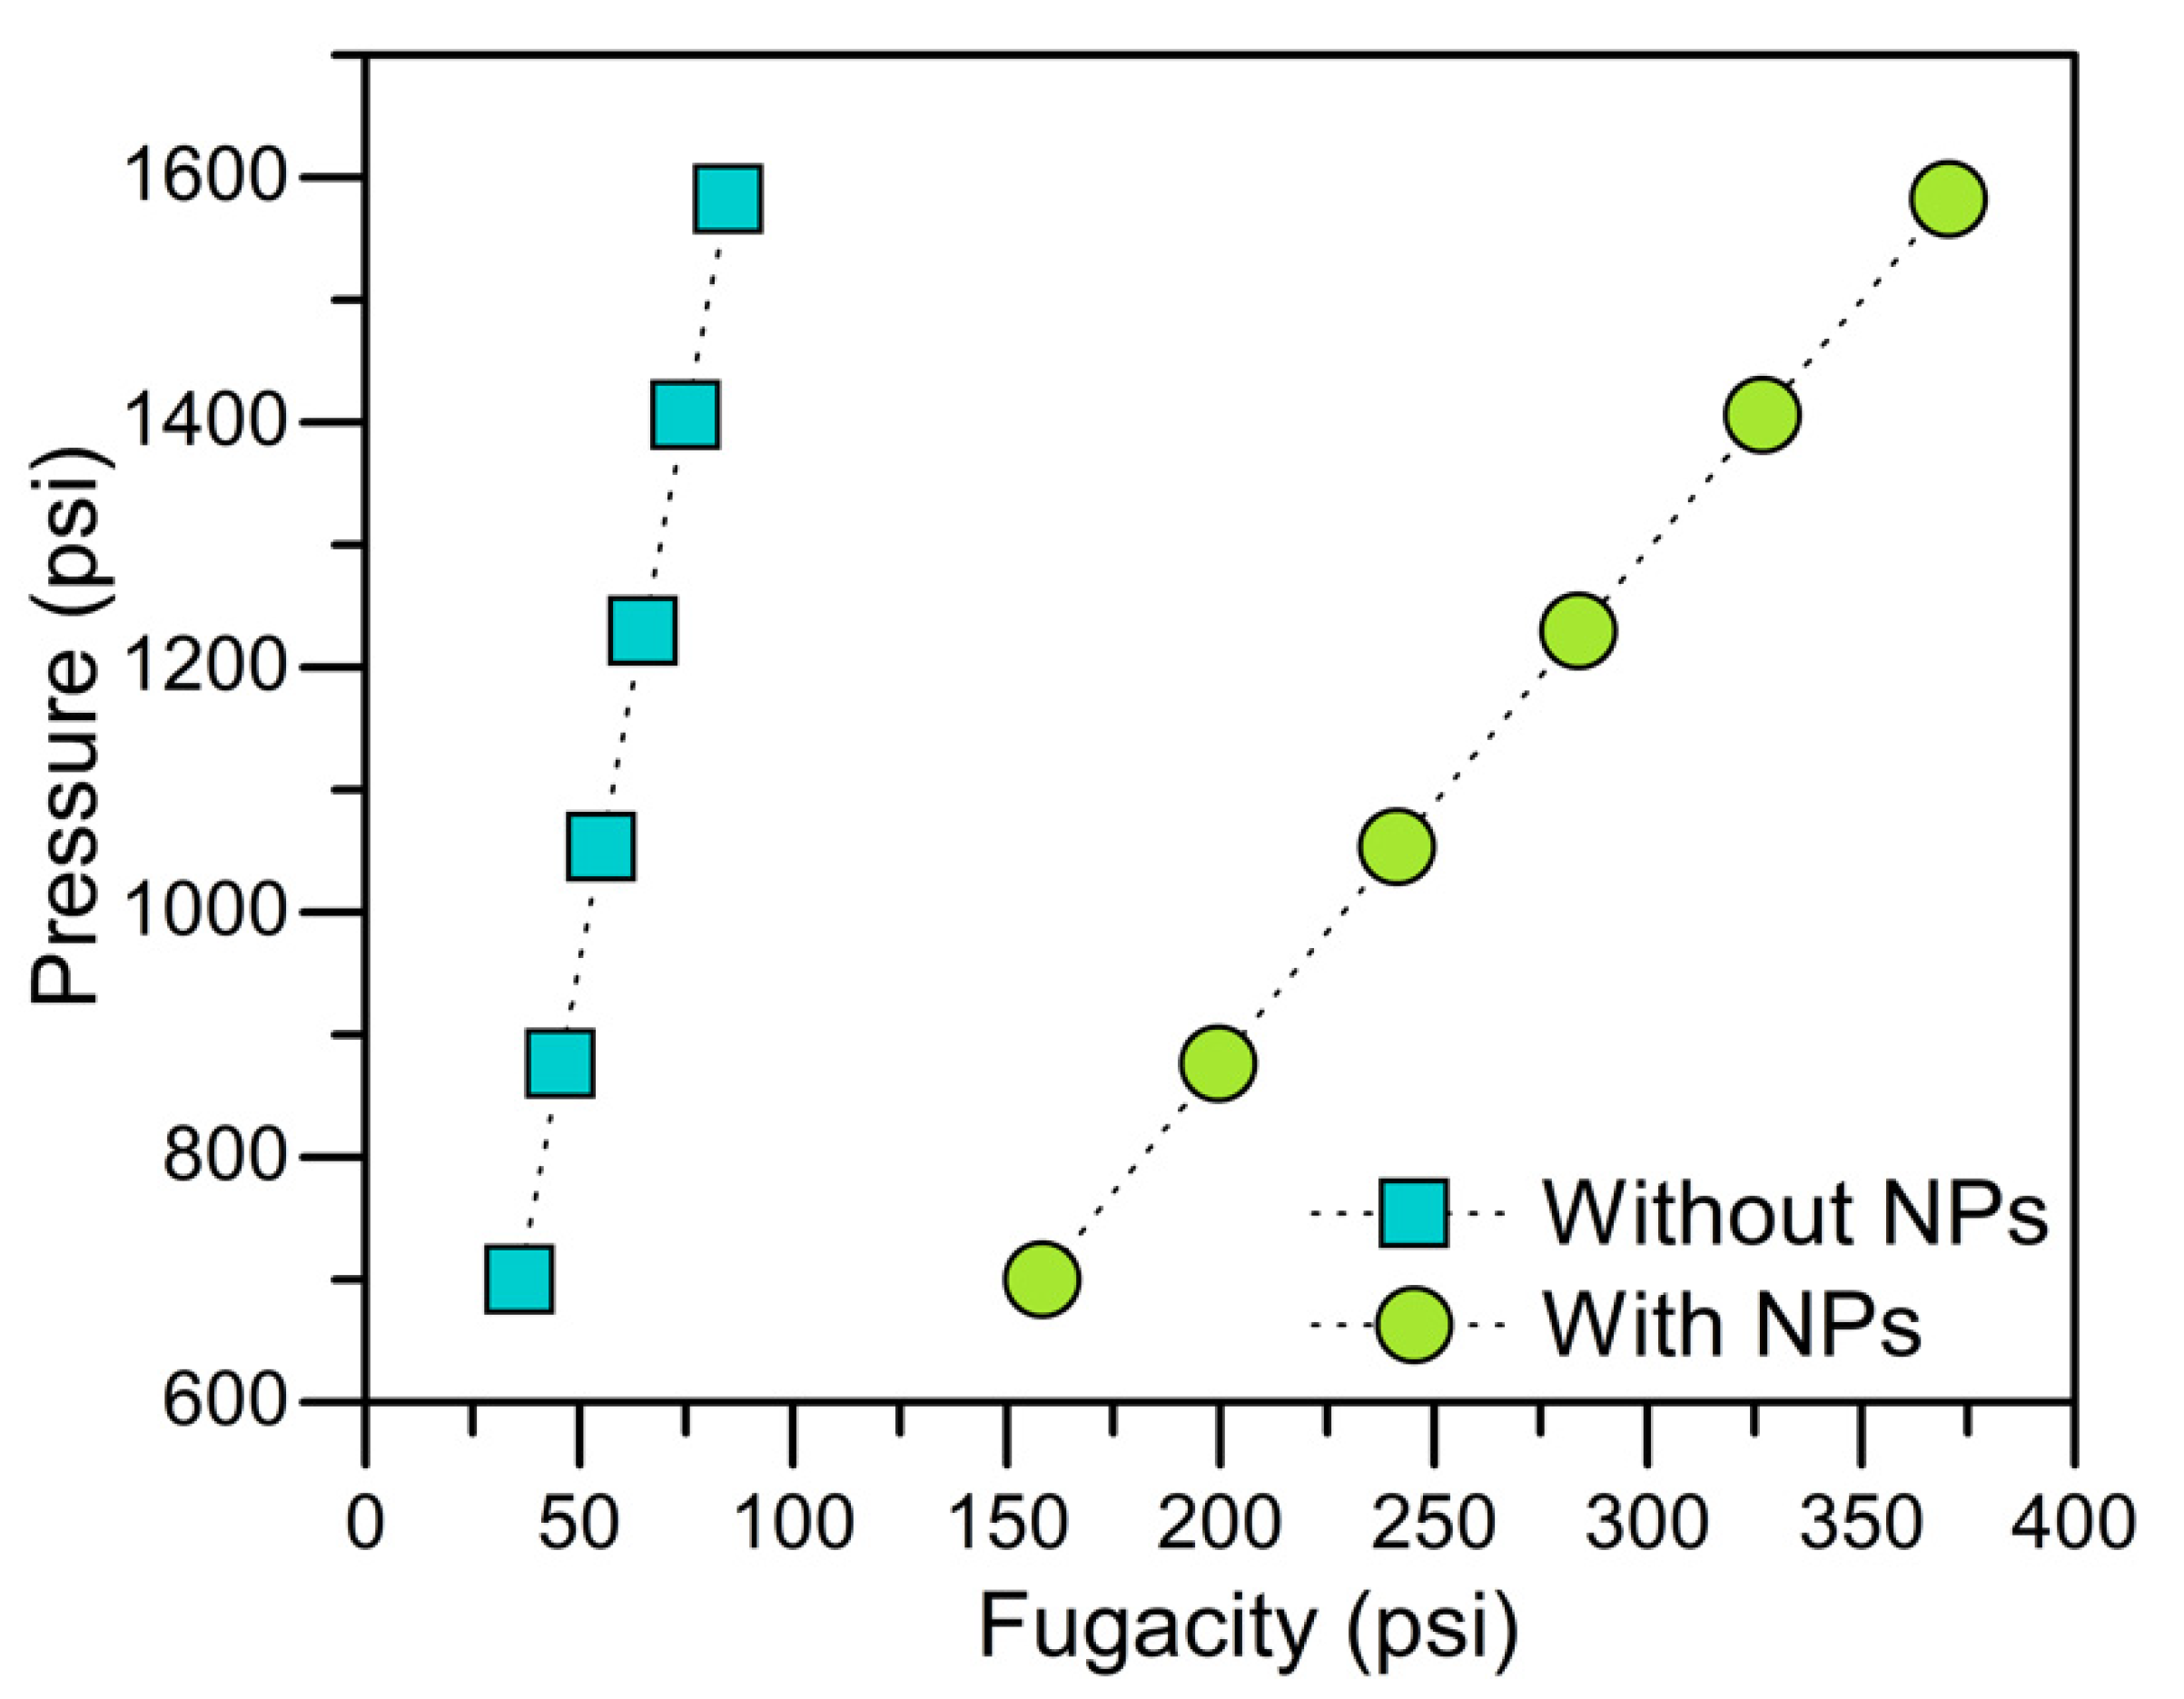
- Hydrogen fugacity analysis at steam injection temperature (first box of Figure 8) for the gaseous mixture produced without nanoparticles on the HO1 sample.
- Hydrogen fugacity analysis at steam injection temperature (first box of Figure 8) for the gaseous mixture produced from the nanotechnology-assisted steam injection on the HO1 sample.
- Hydrogen fugacity analysis as a function of temperature (second, third, and fourth boxes of Figure 8). The temperature was fixed based on the thermal profiles obtained in the experimental setup using four thermocouples at the beginning, inside, and exit of the porous medium. The analysis was performed for steam injection assisted by nanoparticles on HO1.
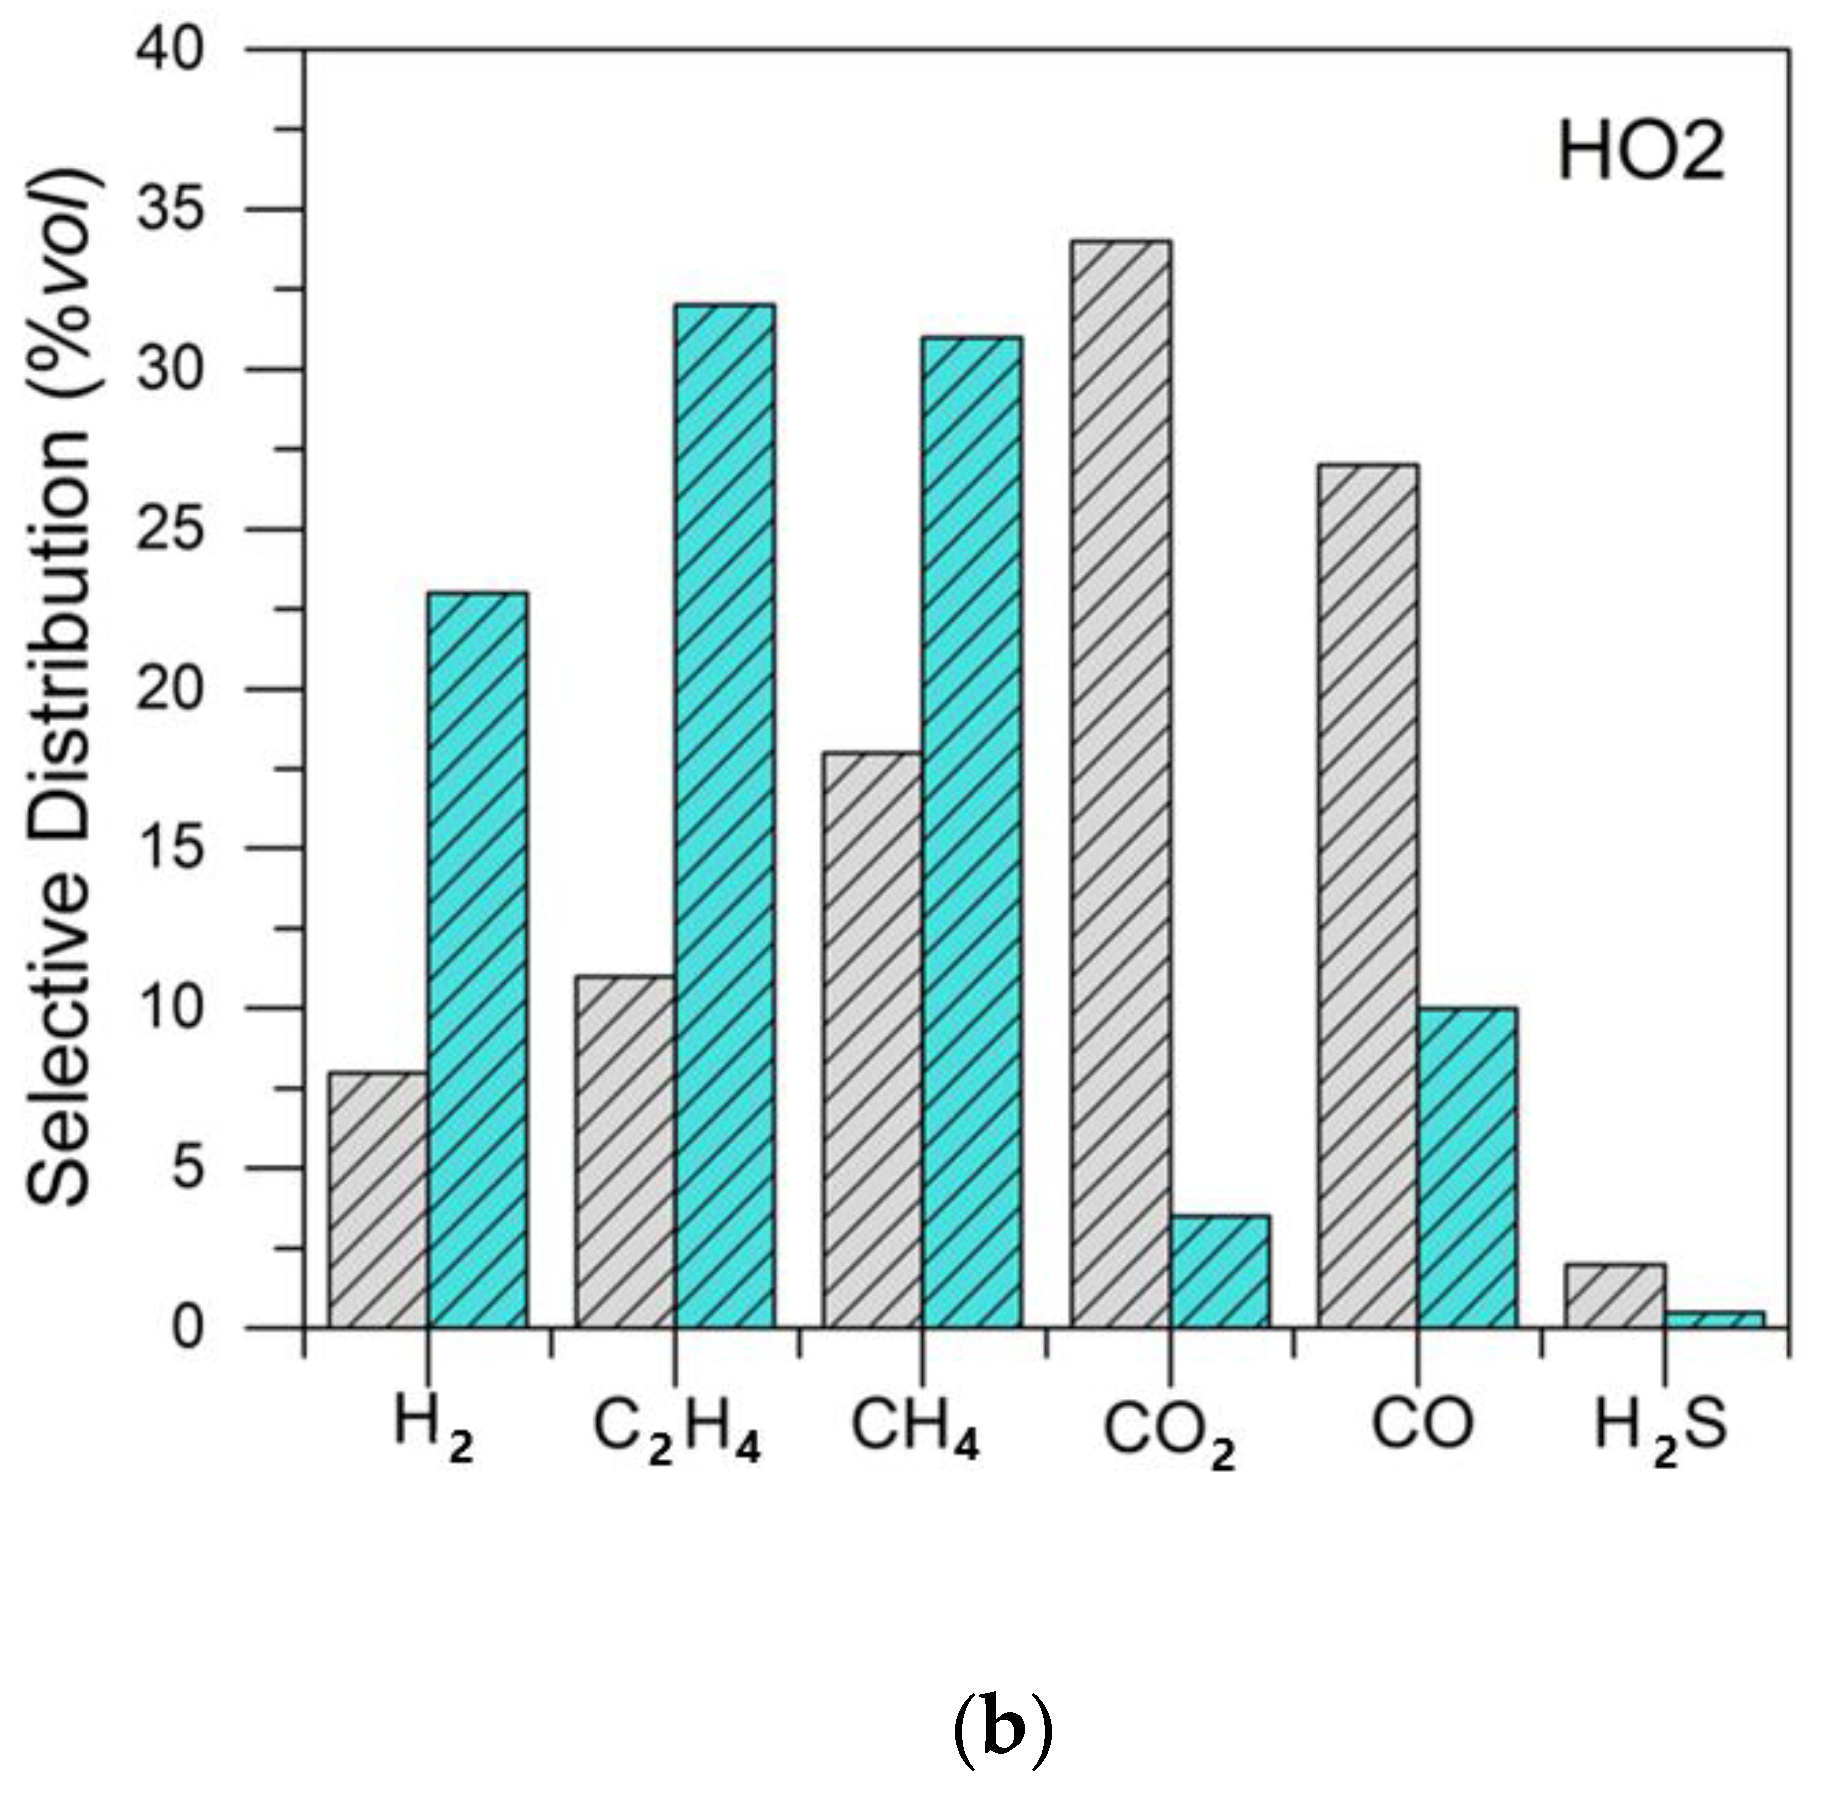
- Hydrogen fugacity analysis for HO2 considering the variation in temperature and comparison with HO1.
3.6. Thermodynamic Analysis of In Situ Hydrogen Generated
4. Conclusions
Supplementary Materials
Author Contributions
Funding
Data Availability Statement
Acknowledgments
Conflicts of Interest
References
- Holladay, J.D.; Hu, J.; King, D.L.; Wang, Y. An overview of hydrogen production technologies. Catal. Today 2009, 139, 244–260. [Google Scholar] [CrossRef]
- Hansen, J.; Sato, M.; Ruedy, R.; Lo, K.; Lea, D.W.; Medina-Elizade, M. Global temperature change. Proc. Natl. Acad. Sci. USA 2006, 103, 14288–14293. [Google Scholar] [CrossRef] [Green Version]
- Guilbert, D.; Vitale, G. Hydrogen as a Clean and Sustainable Energy Vector for Global Transition from Fossil-Based to Zero-Carbon. Clean Technol. 2021, 3, 881–909. [Google Scholar] [CrossRef]
- Navarro, R.M.; Pena, M.; Fierro, J. Hydrogen production reactions from carbon feedstocks: Fossil fuels and biomass. Chem. Rev. 2007, 107, 3952–3991. [Google Scholar] [CrossRef] [PubMed]
- Shibata, Y. Economic analysis of hydrogen production from variable renewables. IEEJ Energy J. 2015, 10, 26–46. [Google Scholar]
- Ni, M.; Leung, D.Y.; Leung, M.K.; Sumathy, K. An overview of hydrogen production from biomass. Fuel Process. Technol. 2006, 87, 461–472. [Google Scholar] [CrossRef]
- Muradov, N. How to produce hydrogen from fossil fuels without CO2 emission. Int. J. Hydrogen Energy 1993, 18, 211–215. [Google Scholar] [CrossRef]
- Seyitoglu, S.; Dincer, I.; Kilicarslan, A. Energy and exergy analyses of hydrogen production by coal gasification. Int. J. Hydrogen Energy 2017, 42, 2592–2600. [Google Scholar] [CrossRef]
- Blok, K.; Williams, R.; Katofsky, R.; Hendriks, C.A. Hydrogen production from natural gas, sequestration of recovered CO2 in depleted gas wells and enhanced natural gas recovery. Energy 1997, 22, 161–168. [Google Scholar] [CrossRef]
- Santos, R.; Loh, W.; Bannwart, A.; Trevisan, O. An overview of heavy oil properties and its recovery and transportation methods. Braz. J. Chem. Eng. 2014, 31, 571–590. [Google Scholar] [CrossRef] [Green Version]
- Guo, K.; Li, H.; Yu, Z. In-situ heavy and extra-heavy oil recovery: A review. Fuel 2016, 185, 886–902. [Google Scholar] [CrossRef]
- Curtis, C.; Kopper, R.; Decoster, E.; Guzmán-Garcia, A.; Huggins, C.; Knauer, L.; Minner, M.; Kupsch, N.; Linares, L.M.; Rough, H. Heavy-oil reservoirs. Oilfield Rev. 2002, 14, 30–51. [Google Scholar]
- Rahimi, P.M.; Gentzis, T. The chemistry of bitumen and heavy oil processing. In Practical Advances in Petroleum Processing; Springer: Berlin/Heidelberg, Germany, 2006; pp. 597–634. [Google Scholar]
- Hamedi Shokrlu, Y.; Babadagli, T. Kinetics of the in-situ upgrading of heavy oil by nickel nanoparticle catalysts and its effect on cyclic-steam-stimulation recovery factor. SPE Reserv. Eval. Eng. 2014, 17, 355–364. [Google Scholar] [CrossRef]
- Elahi, S.M.; Scott, C.E.; Chen, Z.; Pereira-Almao, P. In-situ upgrading and enhanced recovery of heavy oil from carbonate reservoirs using nano-catalysts: Upgrading reactions analysis. Fuel 2019, 252, 262–271. [Google Scholar] [CrossRef]
- Dorian, J.P.; Franssen, H.T.; Simbeck, D.R. Global challenges in energy. Energy Policy 2006, 34, 1984–1991. [Google Scholar] [CrossRef]
- Owen, N.A.; Inderwildi, O.R.; King, D.A. The status of conventional world oil reserves—Hype or cause for concern? Energy Policy 2010, 38, 4743–4749. [Google Scholar] [CrossRef]
- Medina, O.E.; Olmos, C.; Lopera, S.H.; Cortés, F.B.; Franco, C.A. Nanotechnology applied to thermal enhanced oil recovery processes: A review. Energies 2019, 12, 4671. [Google Scholar] [CrossRef] [Green Version]
- Franco, C.; Cardona, L.; Lopera, S.; Mejía, J.; Cortés, F. Heavy oil upgrading and enhanced recovery in a continuous steam injection process assisted by nanoparticulated catalysts. In Proceedings of the SPE Improved Oil Recovery Conference, Tulsa, OK, USA, 11–13 April 2016. [Google Scholar]
- Ali, S. Current status of steam injection as a heavy oil recovery method. J. Can. Pet. Technol. 1974, 13. [Google Scholar] [CrossRef]
- Medina, O.E.; Hurtado, Y.; Caro-Velez, C.; Cortés, F.B.; Riazi, M.; Lopera, S.H.; Franco, C.A. Improvement of steam injection processes through nanotechnology: An approach through in situ upgrading and foam injection. Energies 2019, 12, 4633. [Google Scholar] [CrossRef] [Green Version]
- Shin, H.; Polikar, M. Review of reservoir parameters to optimize SAGD and Fast-SAGD operating conditions. J. Can. Pet. Technol. 2007, 46. [Google Scholar] [CrossRef]
- Thomas, S. Enhanced oil recovery-an overview. Oil Gas Sci. Technol.-Rev. L’ifp 2008, 63, 9–19. [Google Scholar] [CrossRef] [Green Version]
- Lu, C.; Liu, H.; Zhao, W. Visualized study of displacement mechanisms by injecting viscosity reducer and non-condensable gas to assist steam injection. J. Energy Inst. 2017, 90, 73–81. [Google Scholar] [CrossRef]
- Dong, X.; Liu, H.; Chen, Z.; Wu, K.; Lu, N.; Zhang, Q. Enhanced oil recovery techniques for heavy oil and oilsands reservoirs after steam injection. Appl. Energy 2019, 239, 1190–1211. [Google Scholar] [CrossRef]
- Sun, X.; Zhang, Y.; Chen, G.; Gai, Z. Application of nanoparticles in enhanced oil recovery: A critical review of recent progress. Energies 2017, 10, 345. [Google Scholar] [CrossRef] [Green Version]
- Nassar, N.N.; Hassan, A.; Pereira-Almao, P. Application of nanotechnology for heavy oil upgrading: Catalytic steam gasification/cracking of asphaltenes. Energy Fuels 2011, 25, 1566–1570. [Google Scholar] [CrossRef]
- Ogolo, N.; Olafuyi, O.; Onyekonwu, M. Enhanced oil recovery using nanoparticles. In Proceedings of the SPE Saudi Arabia Section Technical Symposium and Exhibition, Al Khobar, Saudi Arabia, 8–11 April 2012. [Google Scholar]
- Agista, M.N.; Guo, K.; Yu, Z. A State-of-the-Art Review of Nanoparticles Application in Petroleum with a Focus on Enhanced Oil Recovery. Appl. Sci. 2018, 8, 871. [Google Scholar] [CrossRef] [Green Version]
- Hashemi, R.; Nassar, N.N.; Almao, P.P. Nanoparticle technology for heavy oil in-situ upgrading and recovery enhancement: Opportunities and challenges. Appl. Energy 2014, 133, 374–387. [Google Scholar] [CrossRef]
- Cheraghian, G.; Hendraningrat, L. A review on applications of nanotechnology in the enhanced oil recovery part B: Effects of nanoparticles on flooding. Int. Nano Lett. 2016, 6, 1–10. [Google Scholar] [CrossRef] [Green Version]
- Saboorian-Jooybari, H.; Dejam, M.; Chen, Z. Heavy oil polymer flooding from laboratory core floods to pilot tests and field applications: Half-century studies. J. Pet. Sci. Eng. 2016, 142, 85–100. [Google Scholar] [CrossRef]
- Rampa, R.; Agogué, M. Developing radical innovation capabilities: Exploring the effects of training employees for creativity and innovation. Creat. Innov. Manag. 2021, 30, 211–227. [Google Scholar] [CrossRef]
- Medina, O.E.; Gallego, J.; Acevedo, S.; Riazi, M.; Ocampo-Pérez, R.; Cortés, F.B.; Franco, C.A. Catalytic Conversion of n-C7 Asphaltenes and Resins II into Hydrogen Using CeO2-Based Nanocatalysts. Nanomaterials 2021, 11, 1301. [Google Scholar] [CrossRef] [PubMed]
- Ariza, F.; Andrés, C. Synthesis and Application of Supported Metallic and Multi-Metallic Oxides Nanoparticles for In-Situ Upgrading and Inhibition of Formation Damage; Universidad Nacional de Colombia-Sede Medellín: Medellín, Colombia, 2015. [Google Scholar]
- Nassar, N.N.; Hassan, A.; Pereira-Almao, P. Metal oxide nanoparticles for asphaltene adsorption and oxidation. Energy Fuels 2011, 25, 1017–1023. [Google Scholar] [CrossRef]
- Hosseinpour, N.; Khodadadi, A.A.; Bahramian, A.; Mortazavi, Y. Asphaltene adsorption onto acidic/basic metal oxide nanoparticles toward in situ upgrading of reservoir oils by nanotechnology. Langmuir 2013, 29, 14135–14146. [Google Scholar] [CrossRef] [PubMed]
- Kazemzadeh, Y.; Eshraghi, S.E.; Kazemi, K.; Sourani, S.; Mehrabi, M.; Ahmadi, Y. Behavior of asphaltene adsorption onto the metal oxide nanoparticle surface and its effect on heavy oil recovery. Ind. Eng. Chem. Res. 2015, 54, 233–239. [Google Scholar] [CrossRef]
- Medina, O.E.; Caro-Vélez, C.; Gallego, J.; Cortés, F.B.; Lopera, S.H.; Franco, C.A. Upgrading of extra-heavy crude oils by dispersed injection of NiO–PdO/CeO2±δ nanocatalyst-based nanofluids in the steam. Nanomaterials 2019, 9, 1755. [Google Scholar] [CrossRef] [Green Version]
- Nassar, N.N. Asphaltene adsorption onto alumina nanoparticles: Kinetics and thermodynamic studies. Energy Fuels 2010, 24, 4116–4122. [Google Scholar] [CrossRef]
- Franco, C.A.; Nassar, N.N.; Ruiz, M.A.; Pereira-Almao, P.; Cortés, F.B. Nanoparticles for inhibition of asphaltenes damage: Adsorption study and displacement test on porous media. Energy Fuels 2013, 27, 2899–2907. [Google Scholar] [CrossRef]
- Vargas, V.; Castillo, J.; Ocampo-Torres, R.; Lienemann, C.-P.; Bouyssiere, B. Surface modification of SiO2 nanoparticles to increase asphaltene adsorption. Pet. Sci. Technol. 2018, 36, 618–624. [Google Scholar] [CrossRef] [Green Version]
- Setoodeh, N.; Darvishi, P.; Esmaeilzadeh, F. Adsorption of asphaltene from crude oil by applying polythiophene coating on Fe3O4 nanoparticles. J. Dispers. Sci. Technol. 2018, 39, 578–588. [Google Scholar] [CrossRef]
- Madhi, M.; Bemani, A.; Daryasafar, A.; Khosravi Nikou, M.R. Experimental and modeling studies of the effects of different nanoparticles on asphaltene adsorption. Pet. Sci. Technol. 2017, 35, 242–248. [Google Scholar] [CrossRef]
- Cortés, F.B.; Montoya, T.; Acevedo, S.; Nassar, N.N.; Franco, C.A. Adsorption-desorption of n-c7 asphaltenes over micro-and nanoparticles of silica and its impact on wettability alteration. CTF-Cienc. Tecnol. Futuro 2016, 6, 89–106. [Google Scholar] [CrossRef] [Green Version]
- Nassar, N.N.; Franco, C.A.; Montoya, T.; Cortés, F.B.; Hassan, A. Effect of oxide support on Ni–Pd bimetallic nanocatalysts for steam gasification of n-C7 asphaltenes. Fuel 2015, 156, 110–120. [Google Scholar] [CrossRef]
- Lei, Y.; Bin, Y.; Tao, Z. Gasification of n-C7 asphaltenes using Ni-based catalysts. Pet. Sci. Technol. 2017, 35, 2283–2286. [Google Scholar] [CrossRef]
- Medina, O.E.; Gallego, J.; Arias-Madrid, D.; Cortés, F.B.; Franco, C.A. Optimization of the Load of Transition Metal Oxides (Fe2O3, Co3O4, NiO and/or PdO) onto CeO2 Nanoparticles in Catalytic Steam Decomposition of n-C7 Asphaltenes at Low Temperatures. Nanomaterials 2019, 9, 401. [Google Scholar] [CrossRef] [PubMed] [Green Version]
- Hassan, A.; Lopez-Linares, F.; Nassar, N.N.; Carbognani-Arambarri, L.; Pereira-Almao, P. Development of a support for a NiO catalyst for selective adsorption and post-adsorption catalytic steam gasification of thermally converted asphaltenes. Catal. Today 2013, 207, 112–118. [Google Scholar] [CrossRef]
- Oladyshkin, S.; Panfilov, M. Hydrogen penetration in water through porous medium: Application to a radioactive waste storage site. Environ. Earth Sci. 2011, 64, 989–999. [Google Scholar] [CrossRef]
- Cardona, L.; Arias-Madrid, D.; Cortés, F.; Lopera, S.; Franco, C. Heavy oil upgrading and enhanced recovery in a steam injection process assisted by NiO-and PdO-Functionalized SiO2 nanoparticulated catalysts. Catalysts 2018, 8, 132. [Google Scholar] [CrossRef] [Green Version]
- Hosseinpour, M.; Fatemi, S.; Ahmadi, S.J. Catalytic cracking of petroleum vacuum residue in supercritical water media: Impact of α-Fe2O3 in the form of free nanoparticles and silica-supported granules. Fuel 2015, 159, 538–549. [Google Scholar] [CrossRef]
- Pinc, W.; Yu, P.; O’Keefe, M.; Fahrenholtz, W. Effect of gelatin additions on the corrosion resistance of cerium based conversion coatings spray deposited on Al 2024-T3. Surf. Coat. Technol. 2009, 23, 3533–3540. [Google Scholar] [CrossRef]
- Wang, X.; Chen, J.; Zeng, J.; Wang, Q.; Li, Z.; Qin, R.; Wu, C.; Xie, Z.; Zheng, L. The synergy between atomically dispersed Pd and cerium oxide for enhanced catalytic properties. Nanoscale 2017, 9, 6643–6648. [Google Scholar] [CrossRef] [PubMed] [Green Version]
- Lamonier, C.; Ponchel, A.; D’huysser, A.; Jalowiecki-Duhamel, L. Studies of the cerium-metal–oxygen–hydrogen system (metal= Cu, Ni). Catal. Today 1999, 50, 247–259. [Google Scholar] [CrossRef]
- Yamaguchi, T.; Ikeda, N.; Hattori, H.; Tanabe, K. Surface and catalytic properties of cerium oxide. J. Catal. 1981, 67, 324–330. [Google Scholar] [CrossRef]
- Chen, H.; Sholl, D.S. Predictions of selectivity and flux for CH4/H2 separations using single walled carbon nanotubes as membranes. J. Membr. Sci. 2006, 269, 152–160. [Google Scholar] [CrossRef]
- Redlich, O.; Kwong, J.N. On the thermodynamics of solutions. V. An equation of state. Fugacities of gaseous solutions. Chem. Rev. 1949, 44, 233–244. [Google Scholar] [CrossRef]
- Spycher, N.F.; Reed, M.H. Fugacity coefficients of H2, CO2, CH4, H2O and of H2O-CO2-CH4 mixtures: A virial equation treatment for moderate pressures and temperatures applicable to calculations of hydrothermal boiling. Geochim. Cosmochim. Acta 1988, 52, 739–749. [Google Scholar] [CrossRef]
- Smith, J.; Van Ness, H.; Abbot, M. Introduction to Thermodynamics in Chemical Engineering; McGraw-Hill: Madrid, Spain, 2005. [Google Scholar]
- Ancheyta, J.; Centeno, G.; Trejo, F.; Marroquin, G.; Garcia, J.; Tenorio, E.; Torres, A. Extraction and characterization of asphaltenes from different crude oils and solvents. Energy Fuels 2002, 16, 1121–1127. [Google Scholar] [CrossRef]
- López, D.; Giraldo, L.J.; Salazar, J.P.; Zapata, D.M.; Ortega, D.C.; Franco, C.A.; Cortés, F.B. Metal Oxide Nanoparticles Supported on Macro-Mesoporous Aluminosilicates for Catalytic Steam Gasification of Heavy Oil Fractions for On-Site Upgrading. Catalysts 2017, 7, 319. [Google Scholar] [CrossRef] [Green Version]
- Delannoy, L.; El Hassan, N.; Musi, A.; Le To, N.N.; Krafft, J.-M.; Louis, C. Preparation of supported gold nanoparticles by a modified incipient wetness impregnation method. J. Phys. Chem. B 2006, 110, 22471–22478. [Google Scholar] [CrossRef] [PubMed] [Green Version]
- Cardona, L.; Medina, O.E.; Céspedes, S.; Lopera, S.H.; Cortés, F.B.; Franco, C.A. Effect of Steam Quality on Extra-Heavy Crude Oil Upgrading and Oil Recovery Assisted with PdO and NiO-Functionalized Al2O3 Nanoparticles. Processes 2021, 9, 1009. [Google Scholar] [CrossRef]
- Medina, O.E.; Gallego, J.; Restrepo, L.G.; Cortés, F.B.; Franco, C.A. Influence of the Ce4+/Ce3+ Redox-couple on the cyclic regeneration for adsorptive and catalytic performance of NiO-PdO/CeO2±δ nanoparticles for n-C7 asphaltene steam gasification. Nanomaterials 2019, 9, 734. [Google Scholar] [CrossRef] [PubMed] [Green Version]
- Pérez-Robles, S.; Cortés, F.B.; Franco, C.A. Effect of the nanoparticles in the stability of hydrolyzed polyacrylamide/resorcinol/formaldehyde gel systems for water shut-off/conformance control applications. J. Appl. Polym. Sci. 2019, 136, 47568. [Google Scholar] [CrossRef]
- Socrates, G. Infrared and Raman Characteristic Group Frequencies: Tables and Charts; John Wiley & Sons: Hoboken, NJ, USA, 2004. [Google Scholar]
- Taborda-Acevedo, E.A.; Jurado, W.J.; Cortés, F.B. Efecto de la temperatura en el proceso de adsorción de agua en Carbón sub-bituminoso colombiano. Bol. Cienc. Tierra 2016, 39, 57–64. [Google Scholar]
- Medina, O.E.; Gallego, J.; Olmos, C.M.; Chen, X.; Cortés, F.B.; Franco, C.A. Effect of Multifunctional Nanocatalysts on n-C7 Asphaltene Adsorption and Subsequent Oxidation under High-Pressure Conditions. Energy Fuels 2020, 34, 6261–6278. [Google Scholar] [CrossRef]
- Franco, C.A.; Zabala, R.D.; Zapata, J.; Mora, E.; Botero, O.; Candela, C.; Castillo, A. Inhibited gas stimulation to mitigate condensate banking and maximize recovery in cupiagua field. SPE Prod. Oper. 2013, 28, 154–167. [Google Scholar] [CrossRef]
- Franco, C.A.; Montoya, T.; Nassar, N.N.; Cortés, F.B. Nioand pdo Supported on Fumed Silica Nanoparticles for Adsorption and Catalytic Steam Gasification of Colombian C7asphaltenes; Nova Science Publishers: Hauppauge, NY, USA, 2014. [Google Scholar]
- Bansal, V.; Krishna, G.; Chopra, A.; Sarpal, A. Detailed hydrocarbon characterization of RFCC feed stocks by NMR spectroscopic techniques. Energy Fuels 2007, 21, 1024–1029. [Google Scholar] [CrossRef]
- Holland, T.; Powell, R. A Compensated-Redlich-Kwong (CORK) equation for volumes and fugacities of CO2 and H2O in the range 1 bar to 50 kbar and 100–1600 C. Contrib. Mineral. Petrol. 1991, 109, 265–273. [Google Scholar] [CrossRef]
- Grevel, K.-D.; Chatterjee, N.D. A modified Redlich-Kwong equation of state for H2-H2O fluid mixtures at high pressures and at temperatures above 400 C. Eur. J. Mineral. 1992, 4, 1303–1310. [Google Scholar] [CrossRef]
- Hagelstein, P.L. Equation of State and Fugacity Models for H2 and for D2. J. Condens. Matter Nucl. Sci. 2015, 16, 23–45. [Google Scholar]
- Chiodini, G.; Marini, L. Hydrothermal gas equilibria: The H2O-H2-CO2-CO-CH4 system. Geochim. Cosmochim. Acta 1998, 62, 2673–2687. [Google Scholar] [CrossRef]
- Cengel, Y.A.; Boles, M.A.; Kanoğlu, M. Thermodynamics: An Engineering Approach; McGraw-hill: New York, NY, USA, 2011; Volume 5. [Google Scholar]
- Rice, S.A. On the Theorem of Corresponding States and Its Application to Mixtures. J. Chem. Phys. 1958, 29, 141–147. [Google Scholar] [CrossRef]


| Component | Without Nanoparticles | With Nanoparticles |
|---|---|---|
| H2 | 0.05 | 0.22 |
| C2H4 | 0.15 | 0.33 |
| CH4 | 0.22 | 0.27 |
| CO2 | 0.30 | 0.07 |
| CO | 0.27 | 0.11 |
| H2S | 0.01 | 0.00 |
| Component | Temperature (°C) | |
|---|---|---|
| Without Nanoparticles | With Nanoparticles | |
| 1 | 270 | 270 |
| 2 | 212 | 255 |
| 3 | 168 | 234 |
| 4 | 59 | 150 |
| Properties | NP1 | NP2 |
|---|---|---|
| Hydrodynamic diameter (nm) | 76.0 | 20.2 |
| BET surface area (m2·g−1) | 223.4 | 65.4 |
| Ni crystal size (nm) | 2.2 | 6.4 |
| Pd crystal size (nm) | 4.1 | 3.9 |
| Ni dispersion (%) | 5.4 | 12.7 |
| Pd dispersion (%) | 9.9 | 38.6 |
| Point of zero charge | 7.8 | 7.5 |
| Properties | HO1 | HO2 |
|---|---|---|
| API° | 12.4 | 12.1 |
| Viscosity 25 °C | 4000 | 3500 |
| Saturates (%) | 18.98 | 17.18 |
| Aromatic (%) | 48.24 | 47.16 |
| Resins (%) | 31.04 | 33.65 |
| Asphaltenes (%) | 1.76 | 2.01 |
| Properties | Carrier | Nanofluid |
|---|---|---|
| Density (g·mL−1) | 0.96 | 0.96 |
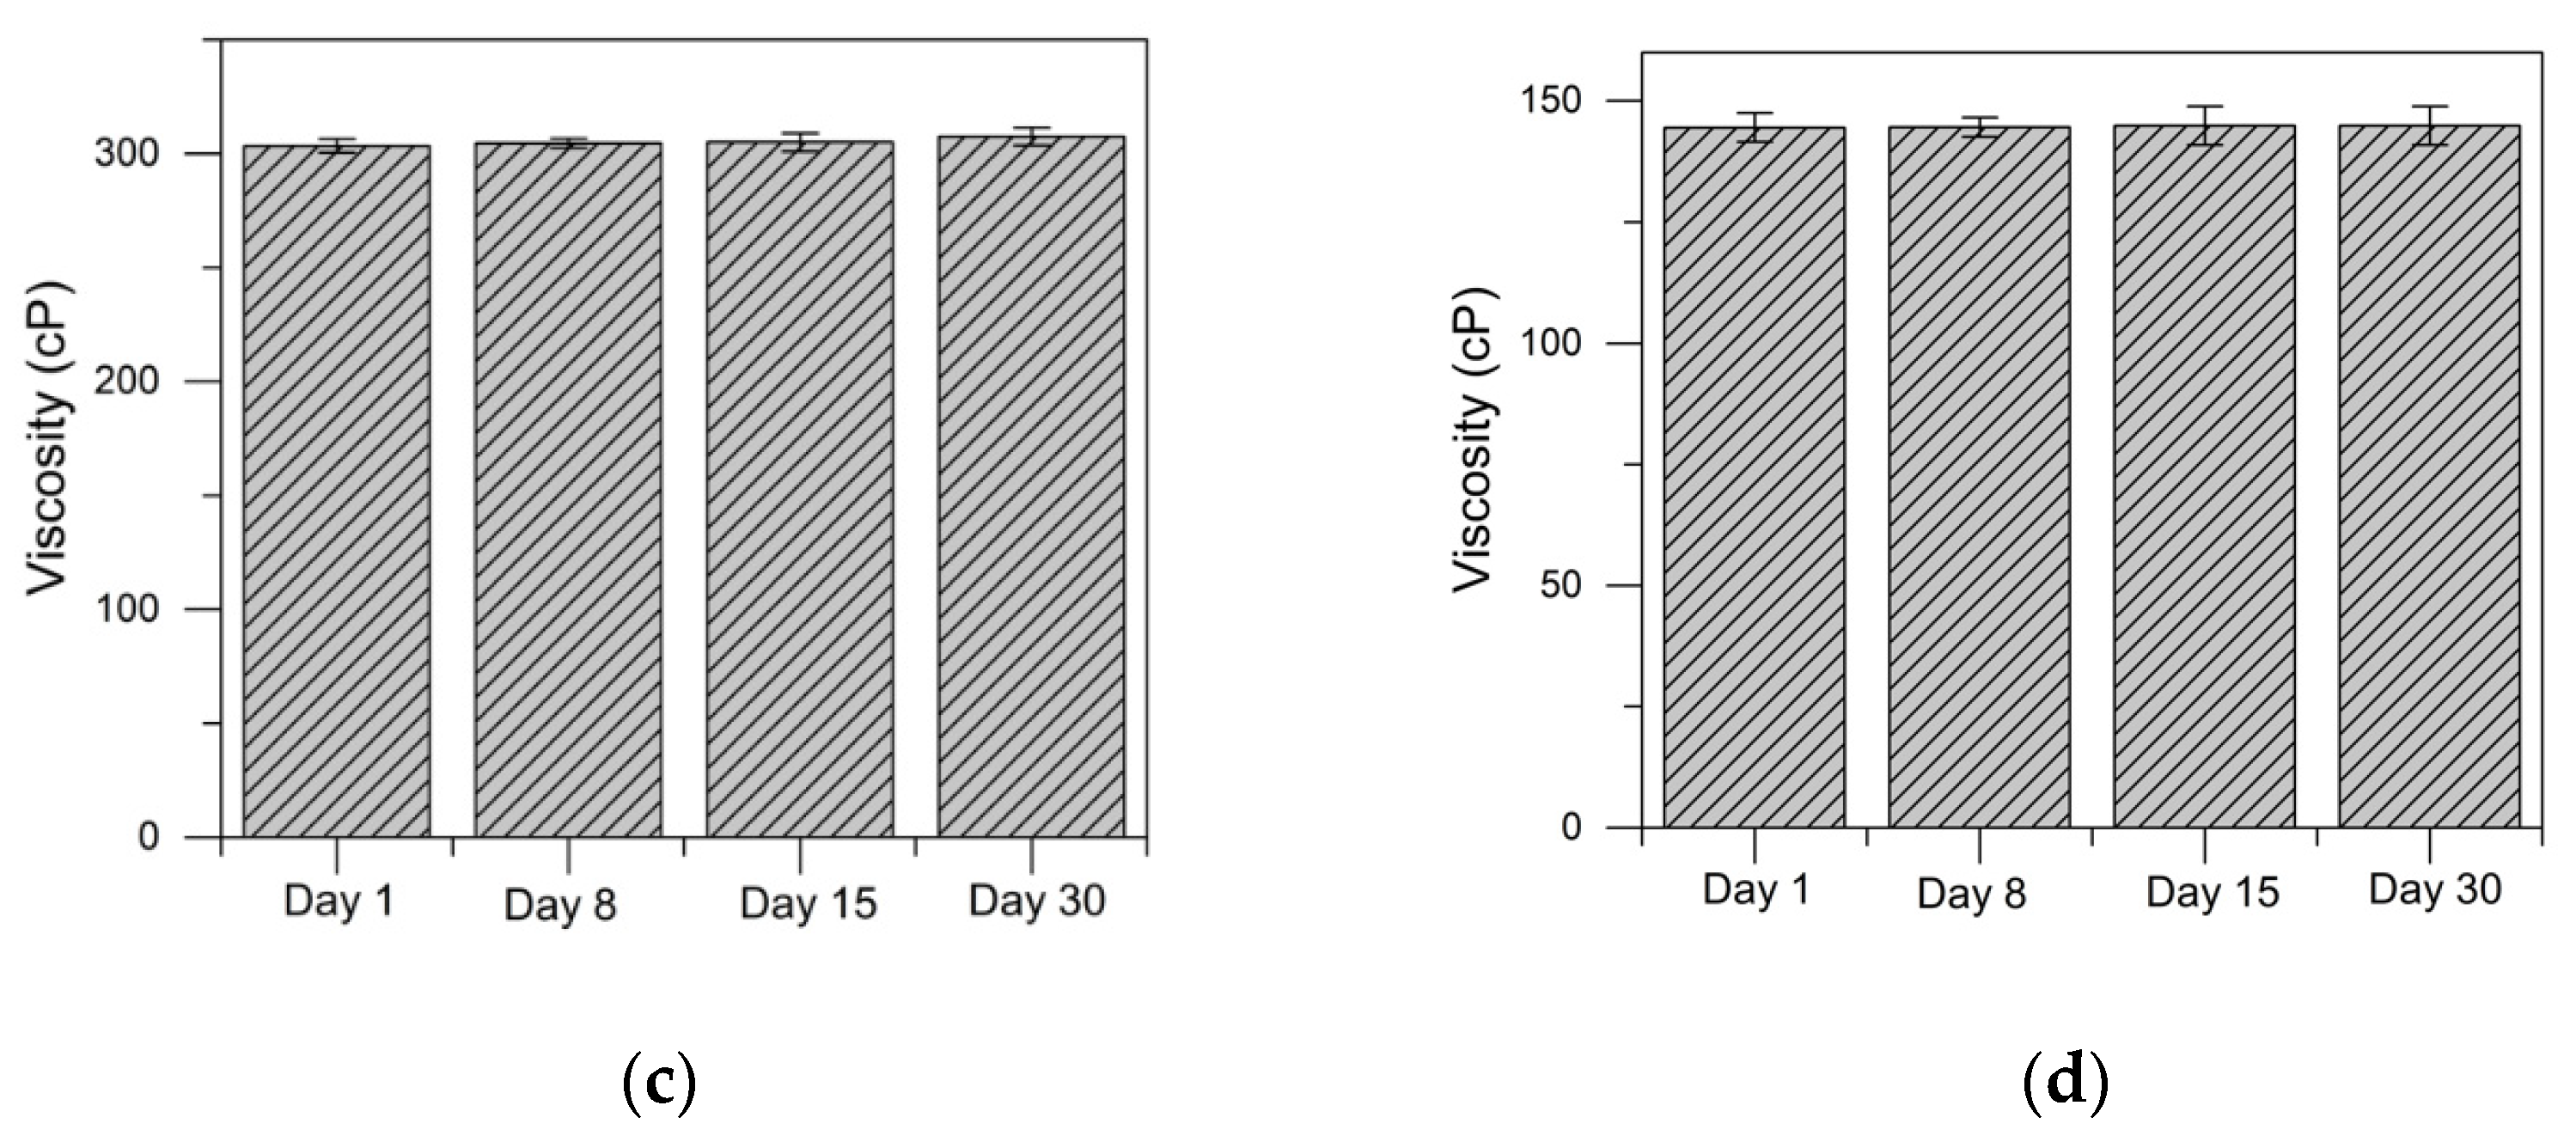
| Viscosity (cP) | 2.13 | 3.05 |
| Surface tension (mN·m−1) | 24.23 | 23.01 |
| Conductivity (mS·cm−1) | 4.9 | 5.7 |
| Thermal conductivity (W·mK−1) | 0.1502 | 0.1562 |
| Thermal resistivity (°C cm·W−1) | 660 | 640 |
| System | Porous Medium 1 | Porous Medium 2 |
|---|---|---|
| Mineralogy | Silica (99%) | Silica (99%) |
| Porosity (%) | 22.0 | 21.0 |
| Absolute permeability | 4331 | 2103 |
| Oil effective permeability | 3558 | 1887 |
| Component | Critical Temperature (K) | Critical Pressure (bar) | Critical Molar Volume (cm3∙mol−1) | Critical Compressibility Factor | Acentric Factor |
|---|---|---|---|---|---|
| H2 | 33.19 | 13.13 | 64.1 | 0.305 | −0.216 |
| C2H4 | 282.3 | 50.4 | 131 | 0.281 | 0.087 |
| CH4 | 190.6 | 45.99 | 98.6 | 0.286 | 0.012 |
| CO2 | 304.2 | 73.83 | 94 | 0.274 | 0.224 |
| CO | 132.9 | 34.99 | 93.4 | 0.299 | 0.048 |
| H2S | 373.5 | 89.63 | 98.5 | 0.284 | 0.094 |
Publisher’s Note: MDPI stays neutral with regard to jurisdictional claims in published maps and institutional affiliations. |
© 2022 by the authors. Licensee MDPI, Basel, Switzerland. This article is an open access article distributed under the terms and conditions of the Creative Commons Attribution (CC BY) license (https://creativecommons.org/licenses/by/4.0/).
Share and Cite
Medina, O.E.; Céspedes, S.; Zabala, R.D.; Franco, C.A.; Pérez-Cadenas, A.F.; Carrasco-Marín, F.; Lopera, S.H.; Cortés, F.B.; Franco, C.A. A Theoretical and Experimental Approach to the Analysis of Hydrogen Generation and Thermodynamic Behavior in an In Situ Heavy Oil Upgrading Process Using Oil-Based Nanofluids. Catalysts 2022, 12, 1349. https://doi.org/10.3390/catal12111349
Medina OE, Céspedes S, Zabala RD, Franco CA, Pérez-Cadenas AF, Carrasco-Marín F, Lopera SH, Cortés FB, Franco CA. A Theoretical and Experimental Approach to the Analysis of Hydrogen Generation and Thermodynamic Behavior in an In Situ Heavy Oil Upgrading Process Using Oil-Based Nanofluids. Catalysts. 2022; 12(11):1349. https://doi.org/10.3390/catal12111349
Chicago/Turabian StyleMedina, Oscar E., Santiago Céspedes, Richard D. Zabala, Carlos A. Franco, Agustín F. Pérez-Cadenas, Francisco Carrasco-Marín, Sergio H. Lopera, Farid B. Cortés, and Camilo A. Franco. 2022. "A Theoretical and Experimental Approach to the Analysis of Hydrogen Generation and Thermodynamic Behavior in an In Situ Heavy Oil Upgrading Process Using Oil-Based Nanofluids" Catalysts 12, no. 11: 1349. https://doi.org/10.3390/catal12111349