Article

Reaction Characteristics of Ni-Based Catalyst Supported by Al2O3 in a Fluidized Bed for CO2 Methanation

1
Climate Change Research Division, Korea Institute of Energy Research, 152 Gajeong-ro, Daejeon 34129, Korea
2
Center of Sustainable Process Engineering (CoSPE), Department of Chemical Engineering, Hankyong National University, 327 Jungang-ro, Anseong 17579, Korea
3
School of Environmental Engineering, University of Seoul, 163 Seoulsiripdae-ro, Seoul 02504, Korea
4
School of Mechanical Engineering, Kyungpook National University, 80 Daehak-ro, Daegu 41566, Korea
5
Department of Civil and Environmental Engineering, Hanbat National University, 125 Dongseo-Daero, Daejeon 34158, Korea
*
Authors to whom correspondence should be addressed.
These authors contributed equally to this work.
Catalysts 2022, 12(11), 1346; https://doi.org/10.3390/catal12111346
Submission received: 13 September 2022 / Revised: 23 October 2022 / Accepted: 24 October 2022 / Published: 2 November 2022
(This article belongs to the Special Issue Catalytic CO2 Methanation Reactors and Processes)

Abstract

:
CO2 methanation is a promising technology to store renewable energy by converting carbon dioxide with green hydrogen into methane, which is known as power to gas (PtG). In this study, CO2 methanation performance of a Ni/Al2O3 catalyst was investigated in a bubbling fluidized bed (BFB) and the axial gas concentration, temperature, and CO2 conversion were densely analyzed. Moreover, a modified reaction kinetic model was proposed, and the results were compared with experimental data. The bed temperature increased by 11 °C from 340 °C to 351 °C within the first 30 mm of the fluidized bed. The CO2 conversion was approximately 90% within 50 mm from the bottom of the reactor and was maintained above this height. The Ni/Al2O3 catalyst exhibited the highest CO2 conversion (95%) at 320 °C. Using a simple plug-flow reactor model, three optimized kinetic modification factors (1.5094, 0.0238, and 0.2466) were used to fit the experimental data. The hydrodynamic effects significantly influenced the chemical reaction kinetics of the BFB.

1. Introduction

Over the last decade, the demand for sustainable and energy-efficient systems has increased considerably. Many countries are increasing the share of renewable energy in their total energy use, toward targeting carbon neutrality by 2050. A total of 181 GW of renewable power was added in 2018 at a pace consistent with that of 2017. The number of countries integrating high shares of variable renewable energy (VRE), such as solar and wind power generation, continues to rise [1]. However, the amount of curtailment (unused power) is rapidly increasing because of difficulties in power transmission and distribution facilities, intermittency of renewable energy sources, and unbalanced demand and supply of renewable energy [2,3,4]. Therefore, energy storage systems (ESS) that can store curtailed electric energy and stabilize the power supply are required to increase the share of renewables in the global energy generation. In an ESS, unused power is converted to other forms of energy and stored, from which electrical energy can be extracted when required. Some ESS technologies include pumped hydroelectric storage (PHS), compressed air energy storage (CAES), supercapacitor and battery energy storage, thermal energy storage, and power-to-gas (P2G; power-to-H2 and power-to-CH4) [5,6,7,8]. Among these, P2G is the most suitable for the long-term and high-capacity storage of renewable energy [5,9,10,11]. In particular, CO2 methanation is a promising approach for storing renewable energy by converting carbon dioxide (CO2) to methane (CH4) using green hydrogen; this has an advantage in terms of the levelized cost of energy analysis (LCOE). Currently, most demonstration plants performing the CO2 methanation process are operating mainly in Europe; these plants function either by catalytic or biological methanation. Catalytic methanation has a higher reaction rate and throughput than biological methanation [12,13].
CO2 methanation:
CO 2 + 4 H 2     CH 4 + 2 H 2 O     H = 168   kJ   mol 1
However, for catalytic methanation, the catalyst must be thermally stable to sustain the hot spot caused by the strongly exothermic methanation reaction. Further, the heat of the reaction needs to be dissipated to enhance the conversion efficiency [14,15,16]. Therefore, the removal of reaction heat is a critical issue in CO2 methanation to avoid catalyst deactivation due to sintering and carbon deposition on the catalyst [17,18,19,20]. From a heat recovery point of view, a fluidized bed reactor with a high heat transfer capability is preferred to a fixed-bed reactor for exothermic reactions. So far, studies on CO2 methanation using a fluidized bed reactor have focused on the identification of an appropriate catalyst [21,22,23,24,25,26], characterization of fluidization [27,28,29], efficiency of heat exchange [30], and modeling of a fluidized bed reactor [28,31,32]. Xiao et al. [33] studied the effect of the pyroelectric materials for reduction of CO2 to chemical, and reported that the pyroelectric materials show excellent efficiency and great potential for CO2 reduction utilizing environmental heat energy. A NiO-based catalyst can be employed as a pyroelectric catalyst. In the present study, the reduced form of a catalyst was used; thus, it is considered that the catalyst does not play a role in pyroelectric material. Le et al. [23] reported that a high Ni dispersion and large surface area of the support are crucial factors for CO2 methanation. Italiano et al. [25] studied the effect of supports on catalytic deactivation, wherein the basic sites of the support had a positive effect on the catalytic activity, and the Ni-support interaction influenced the anti-coking and anti-sintering abilities. Unlike a fixed-bed reactor, the attrition of the catalyst and fluidization characterization are important factors in a fluidized bed reactor. This study aims (i) to fabricate durable Ni-based catalyst particles suitable for CO2 methanation in bubbling fluidized bed (BFB) reactors, (ii) to optimize the process operation targeting maximum CO2 conversion and CH4 production rate, and (iii) to identify a flexible chemical reaction kinetic model for CO2 methanation in BFB considering hydrodynamics effects. Herein, we prepared spherical Ni-based catalysts via a spray-drying method, and investigated the influence of temperature, pressure, feed gas ratio, and gas velocity conditions on the methanation performance of the as-prepared catalyst in a fluidized bed reactor. In addition, the gas concentration profiles were calculated using an intrinsic kinetic model and the results were compared with the experimental data. Based on this, a reaction kinetic model with modification factors was proposed for BFB.

2. Results

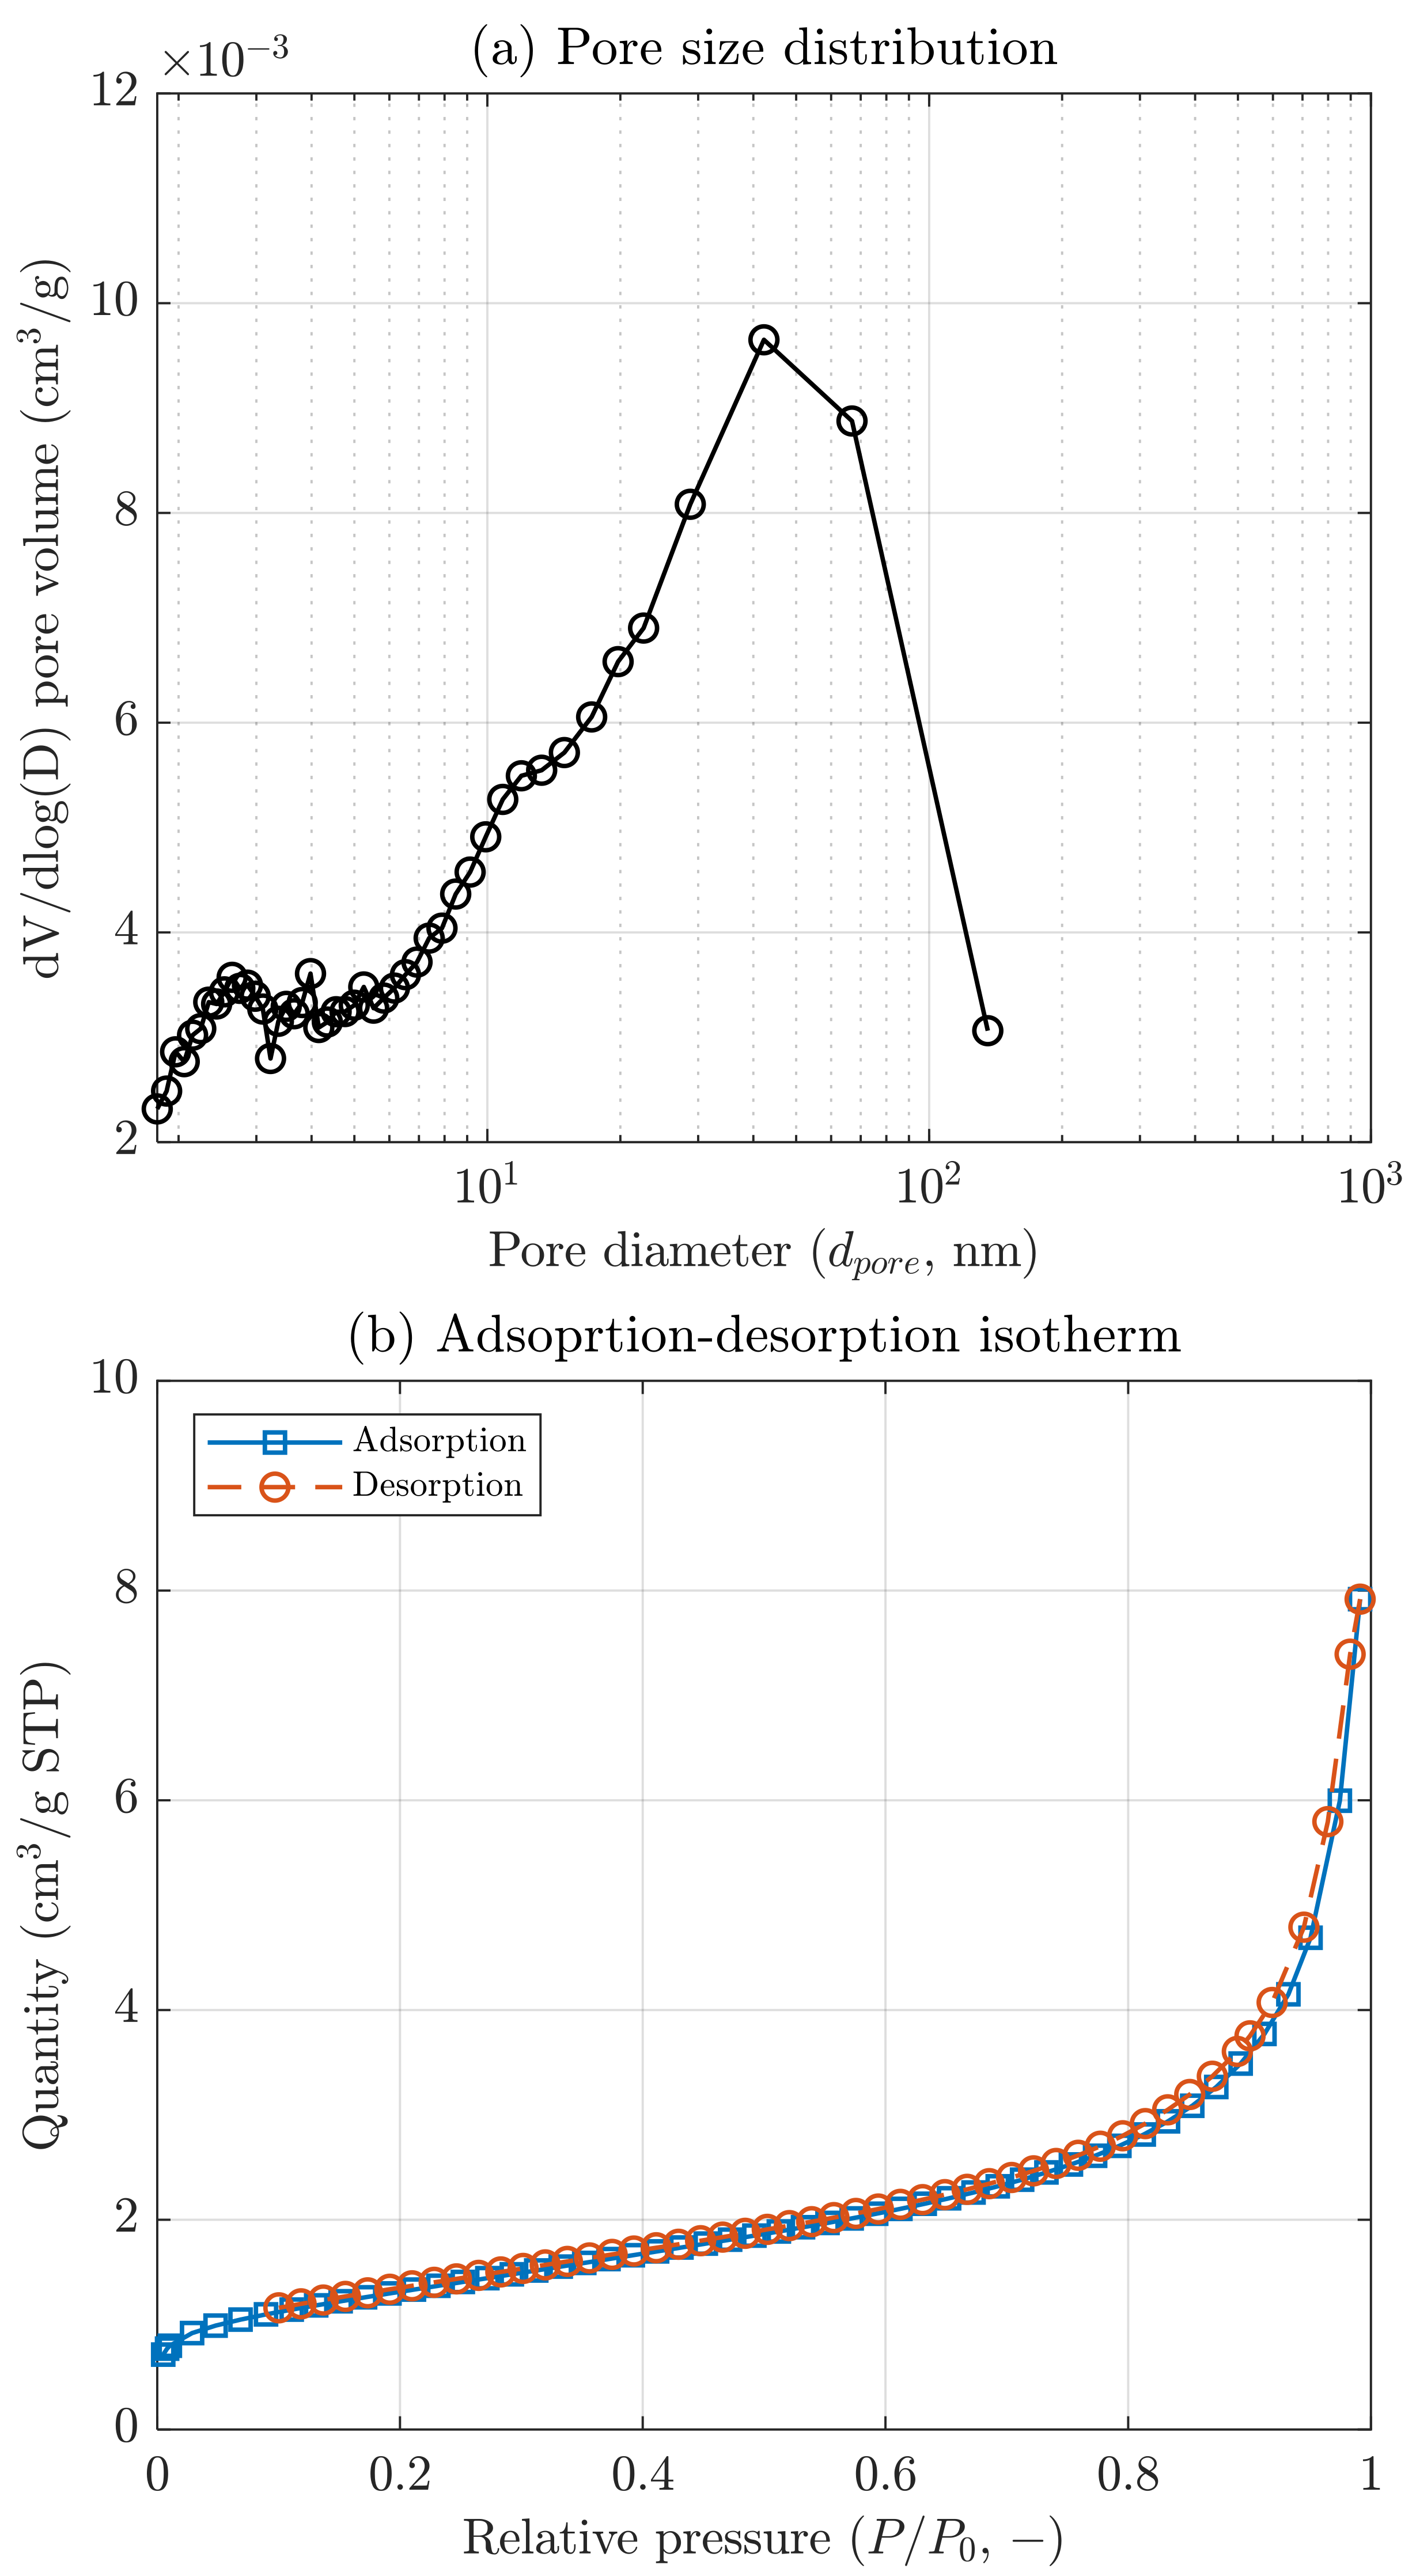
2.1. Characterization of Catalysts

Figure 1 shows the particle size distribution (PSD) and an image of the GMC-Y3 catalyst. The particle size of the catalyst and bulk density is ~100 μm and 1177 kg/m3, respectively. The GMC-Y3 catalyst was well formed into a spherical shape for use in a fluidized bed reactor. To determine the reducibility of NiO in the GMC-Y3 catalyst, H2-temperature programmed reduction (TPR) results were obtained for the Ni-based catalysts calcined in air at 800 °C (Figure 2). The reduction of NiO in the GMC-Y3 catalyst starts at ~300 °C and ends at ~750 °C. In this study, the reduction temperature was set at 600 °C and maintained for 2 h.
To confirm the composition and phase of the catalysts, X-ray diffraction (XRD) and inductively coupled plasma spectrometry (ICP) analyses were conducted. Figure 3 shows the XRD patterns of the GMC-Y3 catalysts. The catalyst is a composite of the active material and support. The active material is NiO, as indicated by the diffraction peaks at approximately 37°, 43°, and 62°, which are assigned to the (111), (200), and (220) planes of cubic NiO, respectively [34]. The support materials used for resisting attrition were Al2O3, TiO2, and NiTiO3. Figure 3b shows the XRD pattern of the reduced GMC-Y3 catalyst at 600 °C; most of the NiO peaks disappear and new Ni peaks are identified at 44°, 53°, and 78°.
Figure 4 shows the N2 adsorption-desorption isotherm and pore size distribution of the GMC-Y3 catalyst. The N2 adsorption-desorption profile of the GMC-Y3 catalyst exhibits a typical type-II behavior characteristic of non-porous materials [35]. The GMC-Y3 catalyst has a small surface area (Table 1). The surface area, pore volume, and average pore diameter are 4.7 m2/g, 0.012 cm3/g, and 12.5 nm, respectively. The specific surface area of the catalyst decreases due to the presence of promoters and binders, and also due to the high calcination temperatures used for hardening the catalyst; thus, catalyst attrition is an important factor affecting catalyst efficiency in fluidized bed reactors. The particle size of NiO is computed as 90 nm using the Scherrer equation, based on the NiO (111) diffraction peak obtained via XRD measurements.

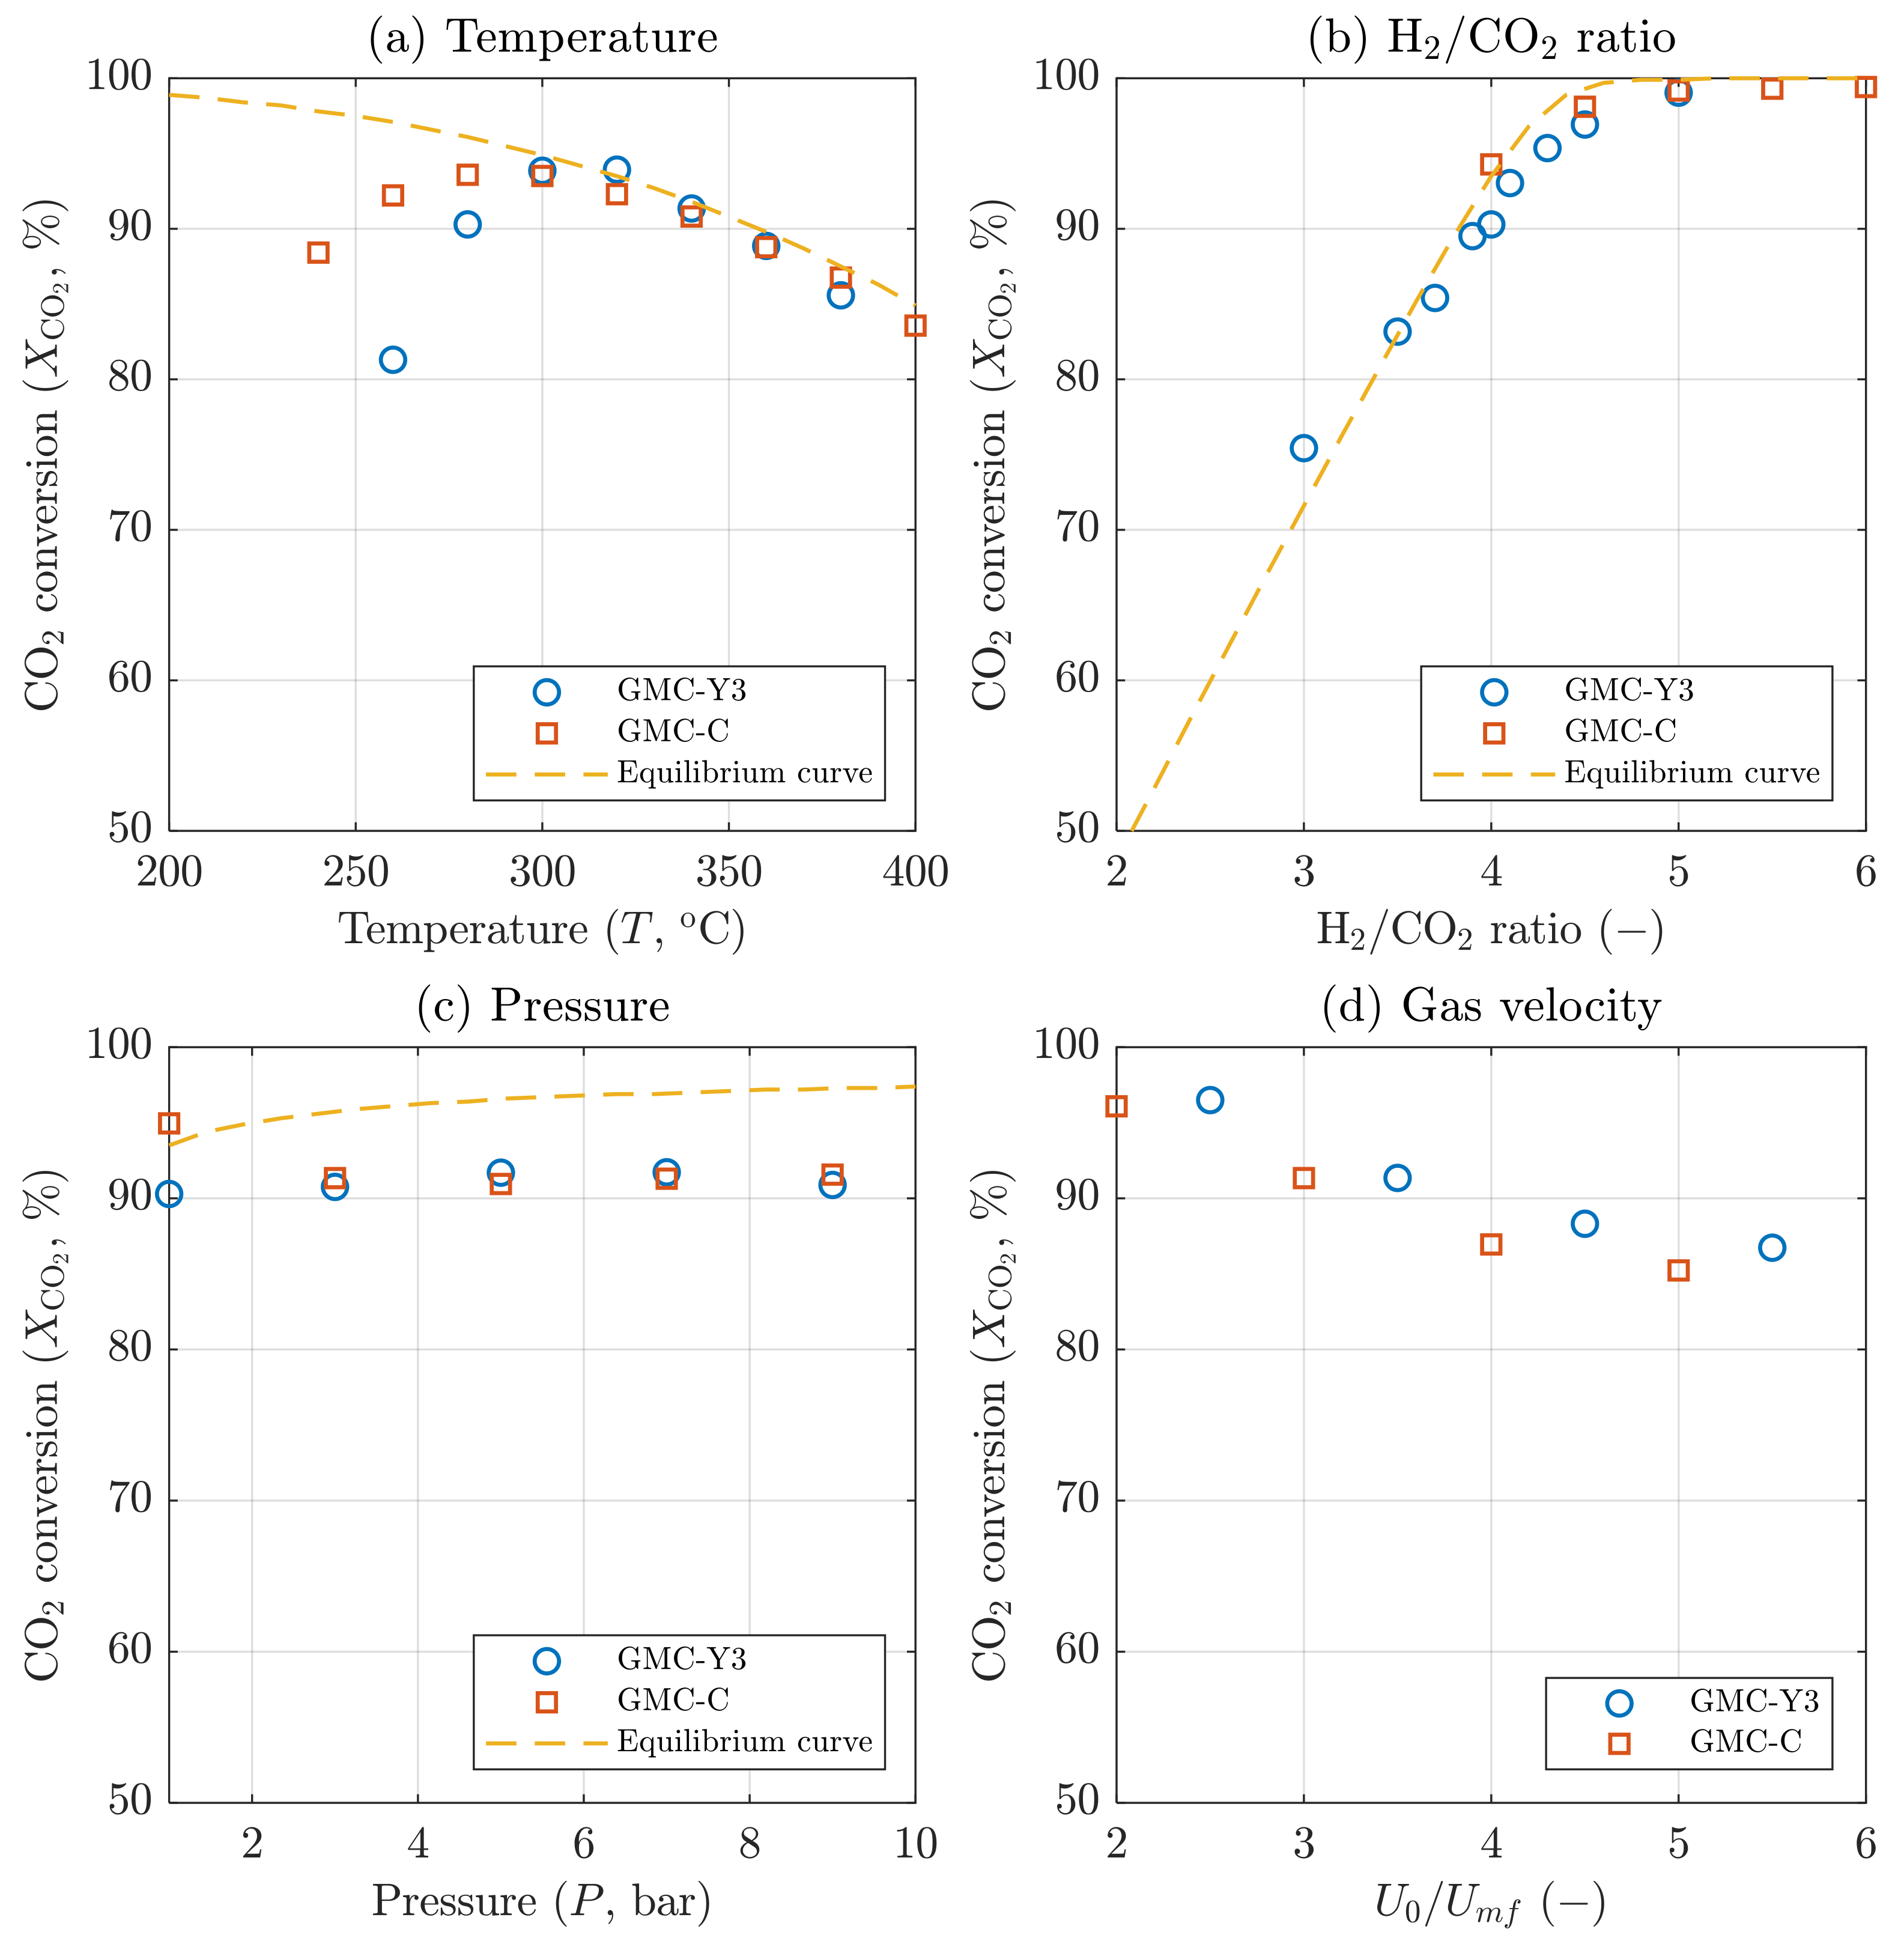
2.2. Reactivity of Catalyst

The methanation performance of the GMC-Y3 catalyst in terms of the CO2 conversion was evaluated under varying conditions of temperature, H2/CO2 ratio, pressure, and gas velocity, as shown in Table 2. Figure 5 shows the effects of multiple parameters on CO2 conversion of the GMC-Y3 and the commercial catalyst (GMC-C) along with the equilibrium curve calculated by HSC Chemistry software 5.1 ((Metso Outotec, Finland). All experimental results corresponded to the equilibrium curves. The CO2 conversion increased to 95% at 320 °C and then decreased at higher temperatures. Compared with the commercial catalyst, the conversion of GMC-Y3 was lower than that of GMC-C at a low temperature below 300 °C, while CO2 conversion was almost similar to each other at a high temperature above 300 °C. Higher temperatures above 400 °C accelerate catalyst deactivation and decrease the selectivity toward CH4, resulting in the production of CO gas. At a H2/CO2 ratio of 3, the CO2 conversion is 75%, and the conversion increases as the H2/CO2 ratio is raised; the conversion reaches ~99% when the H2/CO2 ratio is 5. There is no notable difference in the conversion as a function of the reaction pressure from 1–9 bar, and the conversion in the entire range is ~90–92%. The effect of gas velocity on CO2 conversion was confirmed at U0/Umf (ratio of the superficial gas velocity (U0) over the minimum fluidization velocity (Umf)) from 1.5 to 5.5. As shown in Figure 5d, the conversion decreases as U0/Umf increases. In a fluidized bed reactor, gas velocity is an important factor in CO2 conversion. The number and size of bubbles increase as the gas velocity increases; thus, they can pass through the reactor without contact with the catalyst. This phenomenon reduces the residence time in the reactor and decreases the contact efficiency between the gas and catalyst. Thus, a higher gas velocity decreases CO2 conversion (Figure 5d). However, the low gas velocity in the fluidized bed indicates that the throughput per unit volume of the reactor is low. Therefore, the optimal gas velocity should be determined by considering the CO2 conversion and methane production rates. In conclusion, when comparing the activity performance of the GMC-Y3 catalyst and the commercial catalyst, GMC-Y3 is considered to be more suitable for the CO2 methanation process.
Figure 6 shows the measured axial bed temperature, gas concentration, and conversion profiles at 1 bar, 340 °C, and 3.5 Umf. The flow rates of CO2, H2, and N2 gases were 90, 360, and 1550 mL/min, respectively. The feed gases (CO2 and H2) were diluted with N2 to enable temperature control for the strongly exothermic reaction. As shown in Figure 6a, the temperature at the center of the catalyst increases from 340 °C to 351 °C owing to the exothermic reaction. The minimum height required to reach the maximum temperature is ~30 mm. The methanation reaction is rapid and almost terminates at the beginning of the reactor. The maximum temperature is maintained until the end of the fluidized bed. Above a height of 250 mm, the temperature decreases, which indicates that this is the freeboard region of the BFB.

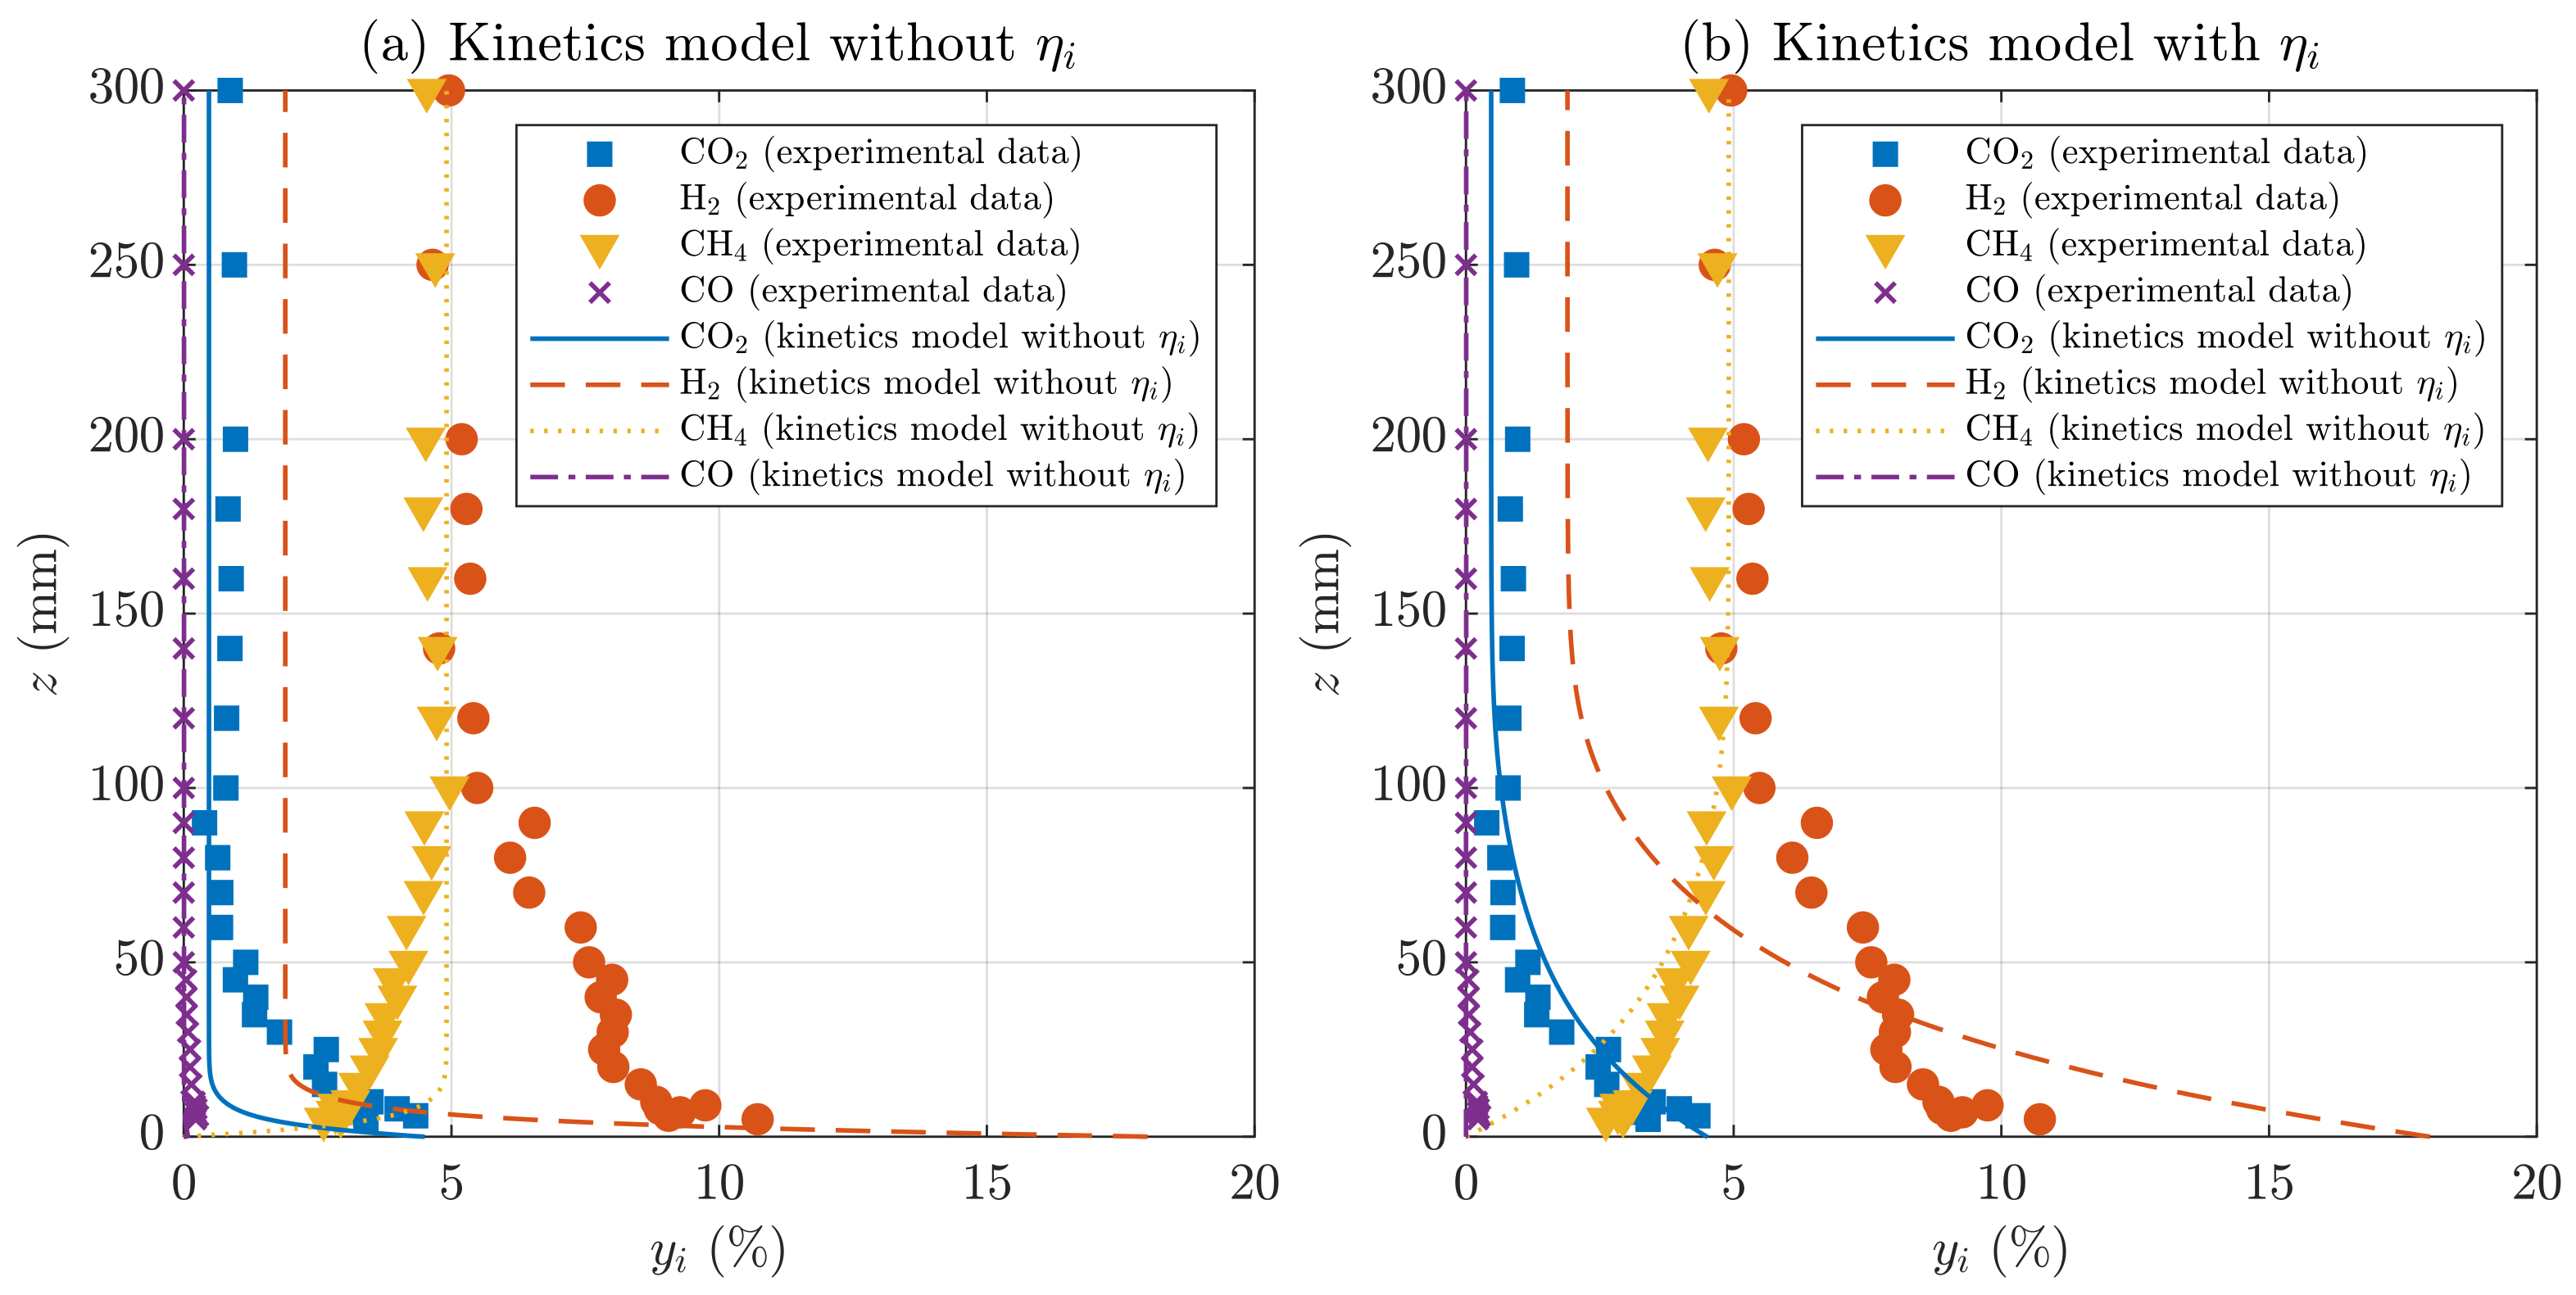
2.3. Reaction Kinetics

The axial mole fractions (yi) of H2, CO, CH4, and CO2 in Figure 7 were used to identify the chemical reaction kinetics and estimate the three factors, viz. η1, η2, and η3 in Equation (A1). η i represents the differences in catalyst characteristics to Xu and Froment [36] and hydrodynamics of BFB. Figure 7 compares the experimental data and kinetic model results for yi. When the intrinsic kinetics model [36] without the three factors (η1, η2, and η3) is used, the CO2 methanation reactions occur quickly at the bottom of the bed and reach thermodynamic equilibrium (Figure 6a). However, the intrinsic kinetics model deviates considerably from the experimental data. In particular, at the top of the bed, the mole fraction (0.014) of H2 obtained from the kinetic model is far from the experimental value (0.05). When the root mean square error (RMSE) is minimized using η1, η2, and η3 (see Equation (3)), this deviation is reduced, and the reaction progresses slowly at the bottom (Figure 6b). The mole fraction of H2 obtained from the modified kinetic model is 0.022 at the top of the bed (56% error between the experimental and model values). The reason for the larger error in the H2 mole fraction than those of other components is that even a small difference in the reaction extent leads to a large deviation in the H2 mole fraction, because four moles of H2 participate in CO2 methanation (see Equation (1)).
The optimized modification factors are 1.5094, 0.0238, and 0.2466, respectively, and the RMSE is 0.00118. The parity plot between the axial experimental data (yi,exp.) and model prediction (yi,model), including the error bound within ±30%, is shown in Figure 8. The mole fractions of CO, CO2, and CH4 are relatively well predicted, whereas those of H2 deviate substantially from the experimental data. The kinetics model modified with η1, η2, and η3 factors provides a similar tendency to that of the experiment in the BFB. However, a large discrepancy between the model and experimental results was observed at the bottom of the BFB, indicating a rapid temperature rise. The kinetic model does not adequately represent the hydrodynamics of solid particles, as mentioned in Section 3. A three-dimensional hydrodynamic model combined with reaction kinetics is appropriate for the BFB reaction. Nevertheless, the simple plug-flow model is a valuable tool for the rapid fitting of kinetic parameters with experimental data. Therefore, a hybrid kinetic model that considers hydrodynamic effects is suitable for BFB.

3. Materials and Methods

3.1. Preparation of CO2 Methanation Catalyst

Three types of catalysts for CO2 methanation were prepared; GMC-Y3 was identified as the optimal catalyst for the CO2 methanation reaction in the fluidized bed reactor. Thus, the subsequent experiments and analyses were performed with GMC-Y3 (see Appendix A), prepared using a spray dryer. The catalyst was composed of the active material (50% NiO, Daejung Chemicals & Metals, 99% Republic of Korea) and supports (98% Al2O3, 98% TiO2, and 25~32% CaSiO3·nH2O, Daejung Chemicals & Metals, Republic of Korea). The GMC-Y3 catalyst was mixed with 50 wt % NiO, 20 wt % TiO2, 20 wt % Al2O3, and 10 wt % CaSiO3 and then milled for 12 h. The prepared slurry was formed into spherical particles by spray-drying. The temperature of the air supplied to the spray dryer is about 260 °C, and the temperature of the spray dryer chamber is about 120 °C. In addition, the rotation speed of the atomizer (disc type) was fixed to about 6000 rpm. The dried catalysts were calcined at 800 °C in air for 4 h. The calcined catalyst was sieved to control the particle size from 106 to 212 μm.

3.2. Fluidized Bed Reactor for CO2 Methanation

Figure 9 shows the lab-scale fluidized bed reactor used in this study. The main reactor was made of stainless steel (SUS 310) with an inner diameter of 0.05 m, thickness of 0.003 m, and height of 0.68 m. The temperature of the reactor was controlled based on the internal temperature of the reactor (K-type thermocouple), using an electric furnace with a temperature indicator. The temperature was measured at a height of 0.05 m from the bottom of the reactor. In addition, a K-type thermocouple with an inner diameter of 0.25 inch was inserted into the tube, and the tube was set to move vertically by the stepping motor. The differential pressure of the fluidized bed was measured by installing a differential pressure transducer and pressure indicator at a height of 0.01 m and 0.58 m, respectively, from the reactor bottom. The reactant gases were introduced into the reactor using a mass flow controller (MFC), and the outlet gases from the reactor were automatically analyzed in real time using an online gas analyzer (Advance Optima, AO2020, ABB, Schwaebisch Hall, Germany). The thermodynamic equilibrium data for CO2 methanation were calculated using the HSC chemistry software.

3.3. Experimental Conditions and Procedure

The GMC-Y3 catalyst was loaded into the fluidized bed reactor at a height of 0.25 m, and the temperature was increased to a reduction temperature of 600 °C while maintaining a flow of N2 gas (0.076 m/s). When the reactor temperature reached 600 °C, H2 gas (20 vol %) was introduced. At this H2 concentration, the reduction is regarded as complete. Subsequently, the temperature was cooled to 300 °C while purging N2 gas. Next, CO2 and H2 gases were introduced into the reactor to initiate CO2 methanation. We have investigated the influence of four conditions: temperature, pressure, CO2/H2 ratio, and gas flow rate on CO2 conversion (Table 2). The mole fraction of CO2 conversion, X C O 2 , is defined as follows:
X CO 2 = C CH 4 + C CO C CH 4 + C CO 2 + C CO

4. Reaction Kinetics Model

The intrinsic reaction kinetics model proposed by Xu and Froment (1989) [36] for Ni-based catalysts supported by Al2O3 was used in this kinetic study. The detailed kinetic model is presented in Appendix B. Because the bubbling fluidized bed (BFB) shows complex particle hydrodynamics, and also axially and radially distributed temperatures, the intrinsic model derived under ideal conditions must be modified for the BFB. Three values of η for the three reactions were applied in Equation (A1) to consider the effects of catalyst material characteristics, hydrodynamics of BFB, diffusion limit inside the catalyst pellets, and uneven temperature, on the global reaction kinetics. The values of η were estimated by minimizing the RMSE of the CO2, H2, and CH4 mole fractions between the kinetic model and experimental data using the trust-region reflection algorithm [37].
min η 1 , η 2 , η 3 RMSE = 1 N i = 1 N y i , e x p . y i , m o d e l 2 ,
where N is the number of experimental data points (=104) and y i , e x p . and y i , m o d e l are the species mole fractions obtained from the experimental and kinetic models, respectively. The three modification factors were bound within 0 < η < 2 in this nonlinear optimization problem.

5. Conclusions

CO2 methanation is a promising technology to store the intermittent renewable energies via the power-to-gas (PtG) process. In the present study, CO2 methanation performance of the Ni/Al2O3 catalyst was evaluated in a bubbling fluidized bed (BFB) reactor to assess the effects of temperature, pressure, H2/CO2 ratio, and gas velocity on the methanation reactivity. A modified reaction kinetic model is also proposed, and the results were compared with experimental data. The temperature and gas concentration inside the fluidized bed reactor was investigated using a stepping motor, and the main reaction occurred within 50 mm of the bottom of the reactor. In the lower part of the reactor, the conversion was 90%, and the temperature increased by 11 °C from, 340 °C to 351 °C within the first 30 mm of the fluidized bed. The CO2 conversion was approximately 90% within 50 mm from the bottom of the reactor and was maintained above this height. The optimum temperature for methanation using the GMC-Y3 catalyst was 320 °C to achieve the highest CO2 conversion of 95%. Three kinetic modification factors, 1.5094, 0.0238, and 0.2466, were optimized to fit the experimental data using a simple plug-flow reactor model and the common intrinsic kinetic rate equations for Ni-based catalysts. Deviations between the fitted kinetic model and experimental data are attributed to hydrodynamic effects. Thus, a hybrid kinetic model that considers the hydrodynamic effects of BFB is necessary.

Author Contributions

Conceptualization, S.I.N.; methodology, M.W.S.; software, H.-J.R.; validation, S.J.P.; investigation, H.N.; writing—original draft preparation, B.H.; writing—review and editing, D.L.; supervision, Y.-I.L.; funding acquisition, D.L. All authors have read and agreed to the published version of the manuscript.

Funding

This research was supported by the research fund of Hanbat National University in 2021.

Data Availability Statement

The data presented in this study are available on request from the corresponding author.

Conflicts of Interest

The authors declare no conflict of interest.

Appendix A. Identification of Optimal Catalyst

Before the mass synthesis of the catalyst, the pre-test using a small BFB reactor and a small amount of catalyst was conducted to determine the optimum catalyst. The reactor has a diameter of 1 inch. The catalysts were prepared by co-precipitation and physical mixing method. Figure A1 shows the XRD results of the GMC-Y1, Y2, and commercial catalysts for methanation (GMC-C). As shown in Figure A1, GMC-Y1, Y2 catalysts show the sharper peaks compared to the GMC-C catalyst, and it could be inferred that GMC-C was calcined at a lower temperature to be activated at a low temperature, approximately 280 °C at a fixed bed reactor. Table A1 shows the information on three catalysts (GMC-Y1, Y2, and Y3). The CO2 conversion was improved by increasing the active material content (NiO) in the catalyst, and the attrition index was improved by adding promoters (TiO2 and CaSiO3). The compositions of catalysts analyzed by inductively coupled plasma (ICP) were shown in Table A2. The texture properties of catalysts analyzed using the Brunauer–Emmett–Teller (BET) were shown in Table A3. Based on these results, the GMC-Y3 catalyst was identified as the optimal catalyst that satisfied the attrition and reactivity.
Figure A1. X-ray diffraction patterns of GMC-Y1, Y2, and C catalysts.
Catalysts 12 01346 g0a1
Table A1. Information of the GMC-Y1,2,3 catalysts.
GMC-Y1GMC-Y2GMC-Y3
MethodCo-precipitationPhysical mixingPhysical mixing
CompositionNiO: 40 wt.%
MgO: 10 wt.%
Al2O3: 50wt.%
NiO: 40 wt.%
TiO2: 30 wt.%
Al2O3: 20 wt.%
CaSiO3: 10 wt.%
NiO: 50 wt.%
TiO2: 20 wt.%
Al2O3: 20 wt.%
CaSiO3: 10 wt.%
Phase 1NiAl2O4NiO, Al2O3, NiTiO3NiO, Al2O3, NiTiO3
AI(CAI) 255 (17%)7.35 (2.72%)5.70 (0.44)
CO2 conversion 355%72%80%
1: Analysis from XRD. 2: Attrition characteristics by ASTM-D-5757-95 test. 3. Results at 350 °C, 1 bar, 4 of H2/CO2 ratio, and 4 Umf in a 1-inch BFB.
Table A2. Compositions of the GMC-Y1, 2, 3 catalysts.
CatalystsNi (%)Al (%)Mg (%)Ca (%)Ti (%)Si (%)
GMC-Y135.236.13.01---
GMC-Y235.911.4-2.6717.74.05
GMC-Y346.313.0-2.938.382.93
Table A3. Physical properties of the GMC-Y1, 2, 3 catalysts.
CatalystsBET
[m2g−1]
Pore Volume
[m3g−1]
Bulk Density [kg/m3]True Density [kg/m3]
GMC-Y1146.40.0210943245
GMC-Y23.980.0210763794
GMC-Y34.70.01211773905

Appendix B. Reaction Kinetics Model

Xu and Froment (1989) [36] presented the intrinsic reaction kinetics of the steam methane reforming (SMR), water-gas shift (WGS), and CO2-H2 methanation (CHM) on a Ni-based catalyst supported by Al2O3. The reaction kinetics model involves three reversible reactions and five components (CO2, H2, CH4, H2O, and CO). Five ordinary differential equations were derived from the three reaction rates (rj, mol/kg/s) to calculate the concentration (Ci, mol/m3) of the five components [32,38,39]. The partial pressure (pi, bar) of the five components was obtained from Ci assuming an ideal gas behavior. The gas constant (R) is 8.314 J/mol/K, and the temperature (T) is in Kelvin in Table A4.
The reaction rate (Ri) of species i is expressed as:
R i = d C i d t = ρ j = 1 3 ν i , j r j η j ,   i = CO 2 , H 2 ,   CH 4 ,   H 2 O ,   and   CO
where ρ and ν, and η are the bed density, stoichiometric coefficient, and effectiveness factor, respectively. The temporal derivative for Ri can be converted into the spatial derivative using the chain rule
d C i d t = d C i d z d z d t = u d C i d z
where u and z are the interstitial gas velocity and reactor axial length, respectively. When the axial concentration was obtained from Equation (A2), u was assumed to be constant at an average bed voidage (αg = 0.58) and an inlet superficial gas velocity ( u g i n = 0.035 m/s) of the BFB.
u = u g i n α g
The reaction kinetics model was solved by using the ode15s solver in Matlab (MathWorks, Inc., Natick, MA, USA).
Table A4. Reaction kinetics model and parameters.
Reactions/ParametersExpressions
CH 4 +   H 2 O     CO   + 3 H 2 r 1 = k 1 p H 2 2.5 p CH 4 p H 2 O p H 2 3 p CO K 1   /   D E N 2
CO   +   H 2 O     CO 2 +   H 2 r 2 = k 2 p H 2 p CO p H 2 O p H 2 p CO K 2   /   D E N 2
CH 4 + 2 H 2 O     CO 2 + 4 H 2 r 3 = k 3 p H 2 3.5 p CH 4 p H 2 O 2 p H 2 4 p CO 2 K 3   /   D E N 2
Denominator (DEN) D E N = 1 + β H 2 O p H 2 O p H 2 + β CO p CO + β H 2 p H 2 + β CH 4 p CH 4
Equilibrium constants (Ki) K 1 = p H 2 3 p CO p CH 4 p H 2 O = exp 30.42 27 , 106 T
K 2 = p H 2 p CO 2 p CO p H 2 O = exp 3.798 + 4 , 160 T
K 3 = K 1 · K 2
Forward kinetic constant coefficients (ki) k 1 = 1.17 × 10 15 exp 240 , 100 R T ,
k 2 = 5.43 × 10 5 exp 67 , 130 R T
k 3 = 2.83 × 10 14 exp 243 , 900 R T
Adsorption constants (βi) β CH 4 = 6.65 × 10 4 exp 38 , 280 R T ,
β H 2 O = 1.77 × 10 5 exp 88 , 680 R T
β H 2 = 6.12 × 10 9 exp 82 , 900 R T ,
β CO = 8.23 × 10 5 exp 70 , 650 R T

References

  1. Murdock, H.E.; Gibb, D.; André, T.; Appavou, F.; Brown, A.; Epp, B.; Kondev, B.; McCrone, A.; Musolino, E.; Ranalder, L. Renewables 2019 Global Status Report. 2019. Available online: https://www.ren21.net/wp-content/uploads/2019/05/gsr_2019_full_report_en.pdf (accessed on 26 October 2022).
  2. Yan, X.; Zhang, X.; Gu, C.; Li, F. Power to gas: Addressing renewable curtailment by converting to hydrogen. Front. Energy 2018, 12, 560–568. [Google Scholar] [CrossRef]
  3. Lyseng, B.; Niet, T.; English, J.; Keller, V.; Palmer-Wilson, K.; Robertson, B.; Rowe, A.; Wild, P. System-level power-to-gas energy storage for high penetrations of variable renewables. Int. J. Hydrog. Energy 2018, 43, 1966–1979. [Google Scholar] [CrossRef]
  4. Qadrdan, M.; Abeysekera, M.; Chaudry, M.; Wu, J.; Jenkins, N. Role of power-to-gas in an integrated gas and electricity system in Great Britain. Int. J. Hydrog. Energy 2015, 40, 5763–5775. [Google Scholar] [CrossRef]
  5. Ferreira, H.L.; Garde, R.; Fulli, G.; Kling, W.; Lopes, J.P. Characterisation of electrical energy storage technologies. Energy 2013, 53, 288–298. [Google Scholar] [CrossRef] [Green Version]
  6. Hadjipaschalis, I.; Poullikkas, A.; Efthimiou, V. Overview of current and future energy storage technologies for electric power applications. Renew. Sustain. Energy Rev. 2009, 13, 1513–1522. [Google Scholar] [CrossRef]
  7. Luo, X.; Wang, J.; Dooner, M.; Clarke, J. Overview of current development in electrical energy storage technologies and the application potential in power system operation. Appl. Energy 2015, 137, 511–536. [Google Scholar] [CrossRef] [Green Version]
  8. Li, L.; Zeng, W.Q.; Song, M.X.; Wu, X.S.; Li, G.Y.; Hu, C.W. Research Progress and Reaction Mechanism of CO2 Methanation over Ni-Based Catalysts at Low Temperature: A Review. Catalysts 2022, 12, 244. [Google Scholar] [CrossRef]
  9. Götz, M.; Lefebvre, J.; Mörs, F.; Koch, A.M.; Graf, F.; Bajohr, S.; Reimert, R.; Kolb, T. Renewable Power-to-Gas: A technological and economic review. Renew. Energy 2016, 85, 1371–1390. [Google Scholar] [CrossRef] [Green Version]
  10. Tschiggerl, K.; Sledz, C.; Topic, M. Considering environmental impacts of energy storage technologies: A life cycle assessment of power-to-gas business models. Energy 2018, 160, 1091–1100. [Google Scholar] [CrossRef]
  11. Achkari, O.; El Fadar, A. Renewable Energy Storage Technologies-A. Proc. Eng. Technol.–PET 2018, 35, 69–79. [Google Scholar]
  12. Ghaib, K.; Nitz, K.; Ben-Fares, F.Z. Chemical methanation of CO2: A review. ChemBioEng Rev. 2016, 3, 266–275. [Google Scholar] [CrossRef]
  13. Wulf, C.; Linßen, J.; Zapp, P. Review of power-to-gas projects in Europe. Energy Procedia 2018, 155, 367–378. [Google Scholar] [CrossRef]
  14. Altass, H.M.; Morad, M.; Khder, A.R.S.; Mannaa, M.A.; Jassas, R.S.; Alsimaree, A.A.; Ahmed, S.A.; Salama, R.S. Enhanced Catalytic Activity for CO Oxidation by Highly Active Pd Nanoparticles Supported on Reduced Graphene Oxide/Copper Metal Organic Framework. J. Taiwan Inst. Chem. E 2021, 128, 194–208. [Google Scholar] [CrossRef]
  15. Altass, H.M.; Ahmed, S.A.; Salama, R.S.; Moussa, Z.; Jassas, R.S.; Alsantali, R.I.; Al-Rooqi, M.M.; Ibrahim, A.A.; Khder, M.A.; Morad, M.; et al. Low Temperature CO Oxidation Over Highly Active Gold Nanoparticles Supported on Reduced Graphene Oxide@Mg-BTC Nanocomposite. Catal. Lett. 2022, 1–11. [Google Scholar] [CrossRef]
  16. Salama, R.S.; Mannaa, M.A.; Altass, H.M.; Ibrahim, A.A.; Khder, A.R.S. Palladium supported on mixed-metal-organic framework (Co-Mn-MOF-74) for efficient catalytic oxidation of CO. RSC Adv. 2021, 11, 4318–4326. [Google Scholar] [CrossRef]
  17. Ngo, S.I.; Lim, Y.-I.; Lee, D.; Seo, M.W. Flow behavior and heat transfer in bubbling fluidized-bed with immersed heat exchange tubes for CO2 methanation. Powder Technol. 2020, 380, 462–474. [Google Scholar] [CrossRef]
  18. Nam, H.; Kim, J.H.; Kim, H.; Kim, M.J.; Jeon, S.-G.; Jin, G.-T.; Won, Y.; Hwang, B.W.; Lee, S.-Y.; Baek, J.-I. CO2 methanation in a bench-scale bubbling fluidized bed reactor using Ni-based catalyst and its exothermic heat transfer analysis. Energy 2021, 214, 118895. [Google Scholar] [CrossRef]
  19. Lefebvre, J.; Bajohr, S.; Kolb, T. A comparison of two-phase and three-phase CO2 methanation reaction kinetics. Fuel 2019, 239, 896–904. [Google Scholar] [CrossRef]
  20. Tan, C.H.; Nomanbhay, S.; Shamsuddin, A.; Park, Y.K.; Hernandez-Cocoletzi, H.; Show, P.L. Current Developments in Catalytic Methanation of Carbon Dioxide-A Review. Front. Energy Res. 2022, 9, 795423. [Google Scholar] [CrossRef]
  21. Frontera, P.; Macario, A.; Ferraro, M.; Antonucci, P. Supported catalysts for CO2 methanation: A review. Catalysts 2017, 7, 59. [Google Scholar] [CrossRef]
  22. Jia, C.; Dai, Y.; Yang, Y.; Chew, J.W. Nickelcobalt catalyst supported on TiO2-coated SiO2 spheres for CO2 methanation in a fluidized bed. Int. J. Hydrog. Energy 2019, 44, 13443–13455. [Google Scholar] [CrossRef]
  23. Le, T.A.; Kim, M.S.; Lee, S.H.; Kim, T.W.; Park, E.D. CO and CO2 methanation over supported Ni catalysts. Catal. Today 2017, 293, 89–96. [Google Scholar] [CrossRef]
  24. Ashok, J.; Pati, S.; Hongmanorom, P.; Tianxi, Z.; Junmei, C.; Kawi, S. A review of recent catalyst advances in CO2 methanation processes. Catal. Today 2020, 356, 471–489. [Google Scholar] [CrossRef]
  25. Italiano, C.; Llorca, J.; Pino, L.; Ferraro, M.; Antonucci, V.; Vita, A. CO and CO2 methanation over Ni catalysts supported on CeO2, Al2O3 and Y2O3 oxides. Appl. Catal. B Environ. 2020, 264, 118494. [Google Scholar] [CrossRef]
  26. Ridzuan, N.D.M.; Shaharun, M.S.; Anawar, M.A.; Ud-Din, I. Ni-Based Catalyst for Carbon Dioxide Methanation: A Review on Performance and Progress. Catalysts 2022, 12, 469. [Google Scholar] [CrossRef]
  27. Kopyscinski, J.; Schildhauer, T.J.; Biollaz, S.M. Fluidized-Bed methanation: Interaction between kinetics and mass transfer. Ind. Eng. Chem. Res. 2011, 50, 2781–2790. [Google Scholar] [CrossRef]
  28. Kopyscinski, J.; Schildhauer, T.J.; Biollaz, S.M. Methanation in a fluidized bed reactor with high initial CO partial pressure: Part I—Experimental investigation of hydrodynamics, mass transfer effects, and carbon deposition. Chem. Eng. Sci. 2011, 66, 924–934. [Google Scholar] [CrossRef]
  29. Li, J.; Yang, B. Bubbling fluidized bed methanation study with resolving the mesoscale structure effects. AIChE J. 2019, 65, e16561. [Google Scholar] [CrossRef]
  30. Frey, M.; Romero, T.; Roger, A.-C.; Edouard, D. Open cell foam catalysts for CO2 methanation: Presentation of coating procedures and in situ exothermicity reaction study by infrared thermography. Catal. Today 2016, 273, 83–90. [Google Scholar] [CrossRef]
  31. Liu, Y.; Hinrichsen, O. CFD simulation of hydrodynamics and methanation reactions in a fluidized-bed reactor for the production of synthetic natural gas. Ind. Eng. Chem. Res. 2014, 53, 9348–9356. [Google Scholar] [CrossRef]
  32. Ngo, S.I.; Lim, Y.-I.; Lee, D.; Go, K.S.; Seo, M.W. Flow behaviors, reaction kinetics, and optimal design of fixed-and fluidized-beds for CO2 methanation. Fuel 2020, 275, 117886. [Google Scholar] [CrossRef]
  33. Xiao, L.B.; Xu, X.L.; Jia, Y.M.; Hu, G.; Hu, J.; Yuan, B.A.; Yu, Y.; Zou, G.F. Pyroelectric nanoplates for reduction of CO2 to methanol driven by temperature-variation. Nat. Commun. 2021, 12, 318. [Google Scholar] [CrossRef]
  34. Cárdenas-Arenas, A.; Cortés, H.S.; Bailón-García, E.; Davó-Quiñonero, A.; Lozano-Castello, D.; Bueno-López, A. Active, selective and stable NiO-CeO2 nanoparticles for CO2 methanation. Fuel Processing Technol. 2021, 212, 106637. [Google Scholar] [CrossRef]
  35. Marconi, E.; Tuti, S.; Luisetto, I. Structure-sensitivity of CO2 methanation over nanostructured Ni supported on CeO2 nanorods. Catalysts 2019, 9, 375. [Google Scholar] [CrossRef] [Green Version]
  36. Xu, J.; Froment, G.F. Methane steam reforming, methanation and water-gas shift: I. Intrinsic kinetics. AIChE J. 1989, 35, 88–96. [Google Scholar] [CrossRef]
  37. Wu, S.; McAuley, K.B.; Harris, T.J. Selection of simplified models: II. Development of a model selection criterion based on mean squared error. Can. J. Chem. Eng. 2011, 89, 325–336. [Google Scholar] [CrossRef]
  38. Nguyen, D.D.; Ngo, S.I.; Lim, Y.-I.; Kim, W.; Lee, U.-D.; Seo, D.; Yoon, W.-L. Optimal design of a sleeve-type steam methane reforming reactor for hydrogen production from natural gas. Int. J. Hydrog. Energy 2019, 44, 1973–1987. [Google Scholar] [CrossRef]
  39. Ngo, S.I.; Lim, Y.-I.; Kim, W.; Seo, D.J.; Yoon, W.L. Computational fluid dynamics and experimental validation of a compact steam methane reformer for hydrogen production from natural gas. Appl. Energy 2019, 236, 340–353. [Google Scholar] [CrossRef]
Figure 1. Particle size distribution (a) and an image (b) of the GMC-Y3 catalyst.
Catalysts 12 01346 g001
Figure 2. Temperature-programmed reduction results of GMC-Y3 and commercial catalysts.
Catalysts 12 01346 g002
Figure 3. X-ray diffraction patterns of GMC-Y3 catalysts: (a) fresh, (b) after reduction and (c) reference peak.
Catalysts 12 01346 g003
Figure 4. N2 adsorption-desorption isotherm (a) and pore size distribution (b) of the GMC-Y3 catalyst.
Catalysts 12 01346 g004
Figure 5. Catalytic activity of GMC-Y3 and GMC-C at the different conditions: (a) temperature, (b) H2/CO2 ratio, (c) pressure, and (d) gas velocity.
Catalysts 12 01346 g005
Figure 6. (a) bed temperature, (b) gas concentration, and (c) CO2 conversion along the catalyst bed height in a bubbling fluidized bed at 1 bar and 340 °C.
Catalysts 12 01346 g006
Figure 7. Comparison of axial mole fractions (yi) of CO2, H2, CH4, and CO between the experiment and kinetics model with (a) and without (b) the modification factors, ηi.
Catalysts 12 01346 g007
Figure 8. Parity plot between the axial experimental data (yi,exp.) and model prediction (yi,model).
Catalysts 12 01346 g008
Figure 9. Schematic diagram of fluidized bed reactor for CO2 methanation.
Catalysts 12 01346 g009
Table 1. Textural properties and H2 consumption of the GMC-Y3 catalyst.
CatalystSBet
(m2/g)
Pore
Volume
(cm3/g)
Average Pore
Diameter (nm)
Crystallite Size of NiO (nm) 1H2
Consumption (mmol/gNi)
Dispersion of Ni (%)
GMC-Y34.70.01212.25900.003860.1
1 Calculated by the Scherrer equation using the D/Max-2500 diffraction and Jade 8 program (SmartLab High temp/Rigaku, Japan).
Table 2. Experimental conditions for CO2 methanation.
Temperature (°C)Pressure (Bar)H2/CO2 RatioUo/Umf
Case 1260–380142.5
Case 23401–942.5
Case 334013.0–5.02.5
Case 4340141.5–5.5
Publisher’s Note: MDPI stays neutral with regard to jurisdictional claims in published maps and institutional affiliations.

