1. Introduction
Depletion of fossil fuels, and the resulting negative environmental impacts of their high consumption levels, raise the global need for alternative fuel sources. This makes ethanol, which can be used as a synthetic fuel as well as a feed stock for industry, a highly desired product of syngas conversion [
1,
2]. The most conventional methods for ethanol production are biomass degradation, followed by fermentation of sugar to ethanol or hydration of petroleum-based ethylene [
3,
4]. However, the current production capacity is limited and cannot fulfill the high industrial demand [
5]. An alternative ethanol production path, which has been realized in China, involves the conversion of syngas to methanol, followed by the carbonylation of methanol to acetic acid and the eventual hydrogenation of acetic acid to ethanol [
6,
7]. Among other alternative routes, the direct conversion of syngas to ethanol (StE), which has a low capital and operating cost, has attracted substantial research towards the design of a well-performing catalyst for this route [
8].
Among the catalysts investigated, Rh-based catalysts have been one of the most promising, due to the ability of Rh to facilitate both dissociative and non-dissociative CO adsorption [
9,
10,
11]. Early reports of using Rh for StE reaction date back to 1975, where Union Carbide Corporation [
12] used 2.5% Rh supported on SiO
2, producing 31.4% ethanol and 9.1% acetic acid [
4]. However, this early work suffered a low production rate of 50 g/L.cat.h, which was far from economic feasibility. This work was followed by extensive promoter screening in the 1980s. The incorporation of promoters onto Rh-based catalysts can tune important performance criteria, such as the ability to facilitate simultaneous CO dissociation and insertion, which are crucial steps in the StE reaction network [
13,
14].
One of the frequently studied catalyst systems to this day is RhMn on silica support [
15,
16]. Experimental and DFT analyses have shown that Mn enhances CO insertion [
17,
18] and, additionally, increases activity via the formation of a tilted CO adsorption mode on Rh surface, which is more easily dissociated [
19]. While this catalyst system has gained huge attraction for the StE reaction, the industrial need for high ethanol yield has motivated considerable research towards the multi-promotion of different metal oxides onto RhMn/SiO
2 to accumulate the dominant impacts of each specific promoter in one catalyst [
20,
21,
22,
23,
24].
Despite the high number of promoters investigated, there is no commercially available process for the direct catalytic conversion of syngas to ethanol as of today, and designing a catalyst with high selectivity to ethanol at a high conversion level remains a challenge to be overcome. A central prerequisite for the development of such a catalyst is to unravel the interaction between all of the catalyst components and to comprehend how each component alters the structure function relations of the catalyst [
24]. However, the structural and electronic interplay of promoters increases the complexity of catalyst formulation dramatically [
25,
26]. Additionally, in heterogeneously catalyzed reactions and, in particular, in hydrogenation reactions, the observed effect of promoters can be unexpected [
27]. Therefore, the design of a multi-promoted catalyst with well-defined properties that is capable of delivering a promising performance requires the synthesis of numerous catalytic systems, considerable effort to test their performance, and extensive characterization for each individual system.
In view of the aforementioned complexities, a systematic design-of-experiment (DOE) will be capable of addressing certain challenges in the process of catalytic design. In the present study, we outline such a DOE scheme, focusing on data-driven knowledge discovery. We implement this DOE to investigate how the interplay of three target promoters—Ir, Li, Ti, which are known to enhance the performance of RhMn/SiO
2 catalyst—affect the eventual performance in the conversion of syngas to ethanol (see
Scheme 1). Various experimental studies have shown that all three promoters are capable of increasing selectivity towards C
2+ oxygenates [
13,
28,
29]. Additionally, the role of Ti has been associated with increasing activity and stability due to its interaction with silica support [
30,
31,
32,
33,
34,
35,
36], and Li has been reported to alter catalytic activity via the formation of oxygen vacancy sites and also to be capable of suppressing methane formation [
34,
35].
The DOE we used aims to obtain maximum knowledge on performance synergies while maintaining a minimum amount of catalysts required to be synthesized. In doing so, eight catalysts were synthesized in a systematic manner, which enabled the definition of twelve compositional twins (four for each target promoter). Aggregated analysis of these twins reveals the effect size for each target promoter on different levels of complexity. In parallel, the effect size of each promoter is evaluated via a building matrix of products. In the process, we develop a mechanistic understanding of how each promoter alters reaction pathways towards different product groups and identify general trends.
Furthermore, and in addition to obtaining enhanced ethanol yield in our study compared to reported values in the literature, it should be mentioned that the catalytic performance is obtained under industrially relevant conditions, making the findings of this study a helpful means for designing new improved catalysts for StE reaction.
We close the study by identifying statistically significant correlations between performance descriptors and property descriptors (obtained from TEM, ICP, and XRD analysis) and by proposing an overall reaction network. The robustness of the correlations detected is assessed under different conditions and analysis methods (see
Supplementary Materials S7–S9).
2. Design of Study
Scheme 1 summarizes the proposed overall approach. In the first step, a full factorial 2 × 2 × 2 design-of-experiment (DOE) is employed to define the nominal composition of eight catalysts that also suffice to analyze the binary and ternary promotor interactions. Starting out from RhMn/SiO
2 (~2.6 wt% Rh, 1.4 wt% Mn), the co-promoting elements Ir (~1.0 wt%), Li (~0.03 wt%), and Ti (~0.27 wt%) are added individually as well as in all possible combinations. Hereinafter, we use the term co-promoter to indicate elements that are added to a catalyst that has already been promoted.
2.1. Synthesis and Test
For the preparation of catalysts, a commercially available SiO
2 support with a surface area of 134 m
2/g was employed. The synthesis process was carried out via incipient wetness impregnation. The precursor for Rh, Mn, and Li was nitrate-based, and for Ir, acetate-based. For Ti, Titanium (IV) bis(ammonium lactato)-dihydroxide was used. The impregnation of Ti was achieved in a separate step prior to the impregnation of any other promoters. Following the impregnation, catalysts were dried for 3 h at 110 °C and then calcined at 450 °C for another 3 h (see
Supplementary Material S1 for details).
For obtaining catalytic performance data, a 16-fold parallel reactor setup (stainless steel, with 4.5 mm internal diameter and 290 mm length) was employed. Each reactor was filled with 0.25 mL catalyst with a sieve fraction of 250–315 μm. The pre- and post-bed of each reactor was filled with corundum (α-Al2O3). Before starting the catalytic testing for CO hydrogenation, catalysts were reduced in the same manner, prior to characterization, at 280 °C under a flow of H2, N2, and Ar (30:60:10). The same test condition and test procedure (catalyst test DOE) were applied to each catalyst. The reaction DOE comprised six different combinations (Exp 1–6) of pressure (40–60 bar), temperature (260–300 °C), flow (35–51 mL/min STP per channel), as well as a repetition of Exp 1 (Exp 7) with a total test duration of ca. 140 h time-on-stream (TOS).
2.2. Characterization
Prior to performing characterization, the samples were reduced at 280 °C under a 200 mL/min flow of H2 and N2 (30:70) for eight hours. The TEM analysis was conducted at TU Berlin on an FEI G 2 20 S-TWIN, operated at 200 kV. Samples were mortared to a fine powder and dispersed in ethanol using an ultrasonic bath. Afterwards, dispersed samples were transferred onto copper grids coated with a 2 nm carbon layer and dried for 5 min at 60 °C.
XRD diffractograms were recorded at TU Berlin on a PANalytical X’Pert Pro diffractometer in Bragg–Brentano geometry equipped with a Cu X-Ray radiation tube, emitting CuKα1-(λ = 1.54604 Å) and CuKα2-(λ = 1.54438 Å).
The ICP-OES analysis was obtained in collaboration with Mikroanalytisches Laboratium Kolbe in Oberhausen, Germany.
2.3. Data Analysis
The derived data were analyzed for the impact of promotor addition and interaction in terms of particle sizes, rates, conversion, and selectivity via statistical analysis, e.g., via twin-pairing of respective pairs (refer to
Supplementary Material S3 for details of the twin-pairing method). Hereinafter, we use the term “twin” to refer to each catalyst pair, which reflects the effect of a promoter addition. The respective 12 pairs (3 promoters × 4 twin pairs for each promoter) were assessed in terms of a reaction network matrix. The matrix groups all of the 15 feed species and reaction products considered by carbon number and functional group, resulting in the ability to assess the effects for 180 (12 × 15) systematic patterns and trends in a simple graphical and color-coded fashion. The assessment can be easily performed for each of the 7 tested conditions, or 28 (7 × 4) considered times-on-stream, in an individual or aggregated fashion to improve statistical quality, to validate findings, or to analyze for, e.g., catalyst aging. Correlations between different formed products and product groups revealed major features of the underlying reaction network.
4. Discussion
4.1. Twin-Pairing and Reaction Network Matrix
To quantify the effect of adding any single target promoter (Ir, Li, Ti) to a RhMn/SiO
2 catalyst, as well as its compositional variations derived from co-promotion with other target promoters, four different pairs of catalysts (“twins”) can be formed for each target promoter. All of the twin pairs discussed are shown with numbered arrows on three cubes at the top of
Figure 4. The four Ir twins are shown with numbered arrows 1–4, Li twins with numbered arrows 5–8, and Ti twins with numbered arrows 9–12. Each of the 12 arrows points in the direction of the added target promoter. As an example, the respective arrows for Ir twins point in the “Ir-direction”, i.e., A -> E, B -> F, C -> G, and D -> H. The performance descriptors are displayed in rows in
Figure 4, which show, from top to bottom, the rate of CO consumption, the production rate of alkanes, alkenes, alcohols, acetaldehyde, acetic acid, and methyl and ethyl acetate, and the cumulative sum of each aforementioned category. For each respective twin pair, e.g., A (RhMn/SiO
2) -> E (RhMn/SiO
2 + Ir), there are two columns showing the values of each performance descriptor. The first column lists descriptor values for the untreated catalyst (A) with a blue background. The second column lists the values of the same descriptors for the treated catalyst (E), with the background color reflecting the observed effect compared to the untreated catalyst (A). Small effects (between −10% and +10% relative change) are shown in a neutral gray color. Positive effects (increase in descriptor value) are colored green; negative effects (decrease in descriptor value) are colored red. Larger effect sizes are depicted in darker shades of green and red, representing an increase and decrease, respectively.
Additionally, for each target promoter, a reaction network matrix displays the results of twin-pairing in the form of cubes, with one cube for each performance descriptor (
Figure 4,
Figure 5 and
Figure 6). Colored arrows in each cube indicate the resulting effect of promoter addition (green: increase; red: decrease; gray: below 10% relative change). Similar to the twin-pairing results in
Figure 4, the shades of green and red in the reaction network matrices denote the effect size. The number on the arrow shows the relative change in the respective descriptor following promoter’s addition. The products depicted in the matrices are arranged from top to bottom by carbon number (C1–C4) and from left to right according to the functional group, i.e., alkenes, alkanes, aldehyde, alcohol, acid, and acetate. This arrangement allows for an assessment in terms of the StE reaction network.
The values depicted in this section correspond to the first experimental condition (Exp 1) of the test DOE. To test the robustness of the mechanistic trends observed, the reaction network matrices of
Figure 4,
Figure 5 and
Figure 6 and the twin-pairing results of
Figure 4 were recreated for the experimental condition with the lowest CO consumption rate (Exp 5) and also for the repetition of Exp 1 (Exp 7) (see
Supplementary Material S7).
4.1.1. The Influence of Adding Ir
As can be seen in
Figure 4, the addition of Ir to RhMn/SiO
2 (Twin Pair 1: A -> E) leads to lower rates of forming alkanes, alkenes, acetaldehyde, and acetic acid and higher rates of alcohols.
The resulting color pattern in
Figure 4 reveals clear trends for adding Ir. In all of the four compared pairs, adding Ir leads to lower rates of forming alkanes and alkenes, to higher rates of alcohols, lower rates of acetaldehyde and acetic acid, and to higher rates of methyl and ethyl acetate. Hence, clear trends can be established across all four pairs: in all studied combinations of RhMn/SiO
2 with Li and Ti, Ir leads to a lower rate of hydrocarbons and a higher rate of ethanol and acetates.
The shades of the red arrows in the alkene and alkane columns of
Figure 5 suggest that Ir suppresses the rate of alkene formation more severely than the rate of alkane formation. In contrast to hydrocarbons, the rate of methanol and ethanol increases for all Ir twins, which suggests a lower tendency of Ir-modified catalysts for complete CO dissociation and possibly a faster hydrogenation of acetaldehyde and acetic acid to the value product ethanol. Glezakou et al. have linked the increased rate of ethanol formation in RhMnIr/SiO
2 to direct CO hydrogenation on Ir sites and consequent HCO emergence, which is an important intermediate to ethanol formation [
37]. Judging from observations of the present study, it can be argued that Ir sites are also responsible for increased CO hydrogenation in compositional variations in RhMn/SiO
2 with Ti and Li.
Moreover, the increase in methyl and ethyl acetate is likely to be a consequence of the higher alcohol formation rates and subsequent esterification with acetic acid. Thus, based on aggregated, colored, and systematically sorted data, a clear mechanistic picture of the role of Ir evolves.
The upper right part of
Figure 5 shows changes in average particle size between compared Ir twins. It can be seen that in three of the four twins, a decrease in particle size is accompanied by a lower CO consumption rate. The implications of this correlation are discussed in more detail in
Section 4.3.
4.1.2. The Influence of Adding Li
Figure 6 and the middle part of
Figure 4 present the effect of adding Li for four different twin pairs in the same way as before, i.e., using a twin-pairing table as well as the reaction network matrix. Again, clear patterns arise in the product spectrum, but they are not as universal as for the addition of Ir. In general, added Li appears in most cases to lower the rates of alkane formation, and, in all four twins, it results in a lower formation rate of ethanol and ethyl acetate. Earlier studies have reported that similar effects are observed when Li is added to Rh/TiO
2 [
12]. It can, therefore, be argued that Li addition to Rh-based catalysts leads to a reduced hydrogenation ability, an effect that does not appear to change dramatically when tested on TiO
2 and SiO
2 support.
Other studies that have investigated the role of Li addition to RhMn/SiO
2 have concluded that Li promotion lowers the catalytic activity [
35]. Our results show that the same effect repeats itself not only for Li addition to RhMn/SiO
2 but also for its addition to RhMnTi/SiO
2 and RhMnIr/SiO
2 (Pairs 6 and 7 in
Figure 4, respectively). Only in Pair 8, which shows Li addition to RhMnTiIr/SiO
2, do we observe an increase in activity. This points to the complex interaction of the co-promoters with each other as well as their possible interaction with the support.
The effect of Li addition on the formation rate of acetates is more diverse than that of other products. For both methyl and ethyl acetate, Li addition to RhMnTiIr/SiO
2 (Pair 8) shows a relative change of less than 10%, and its addition to RhMn/SiO
2 (Pair 4) results in a decrease in the formation rate. It can be seen that the presence of other co-promoters affects the eventual role of Li. In a study by Li et al. [
30], the H2 and CO uptake on RhMn/SiO
2 and RhMnLi/SiO
2 was compared and found to be very similar. Based on these results, it was suggested that the observed effect of Li in reducing hydrogenation ability stems from its positioning mainly on the support rather than on Rh particles. It can be argued that the presence of other promoters together with Li on RhMn/SiO
2 can change the Li positioning and, hence, its effect on performance.
A closer look at the reaction network matrix (
Figure 6) provides a more detailed view of this behavior. In the second row (C2), the cubes for alkenes, alkanes, acetaldehyde, and acetic acid show an increased rate in the presence of Ti (green arrows); in the absence of Ti, either a much smaller effect size or even a decrease in the rate is observed. These observations suggest that Ti and Li interfere with each other in parts of the reaction network, and that this interference primarily concerns C2 products. Moreover, ethene, acetaldehyde, and acetic acid are affected in similar ways, suggesting a close relationship between them in the reaction network, as well. It becomes evident that the co-promotion effect of adding Li depends on the composition of the catalyst to which Li is added and, in particular, whether or not this catalyst contains Ti.
Similar to Ir twins, we can see from
Figure 6 that three out of the four Li twins show a correlation between particle size changes and the CO consumption rate. We discuss these changes for all of the compared twins in more detail in
Section 4.3.
4.1.3. The Influence of Adding Ti
The effect of adding Ti was assessed in a similar way to Ir and Li. Four Ti twins are shown with arrows numbered 9–12 on the top right part of
Figure 4. The results of twin-pairing are shown on the right side of
Figure 4; the reaction network matrix is depicted in
Figure 7.
Here, an even more complicated pattern arises than for Ir and Li. Only the formation of acetates increases consistently across all four pairs with the addition of Ti, whereas ethanol formation decreases for all pairs.
When Ti is added to A and E, i.e., catalysts that do not contain Li, the rate of most products is reduced (Pairs 9 and 11 in
Figure 4, cells with a red background). In contrast, there is an apparent difference in effect size of Ti when Li is present, i.e., for Pairs 10 and 12. The main effect of adding Ti in the presence of Li seems to be a higher rate of ethene, and when both Li and Ir are present, there is a higher activity, which consequently increases the formation rates of all products, with the exception of alcohols and C3+ alkanes.
The generally opposite effect of adding Ti in the absence vs. in the presence of Li is also evident from the reaction network matrix in
Figure 7. Whereas for alkenes, alkanes, acetaldehyde, and acetic acid, the two edges on the respective left side of the cube (absence of Li) are colored with red arrows (decrease in rates when Ti is added), the two edges on the respective right side (presence of Li) are colored green (increase in rates).
It has been reported that the incorporation of Ti oxide in the support helps to increase activity and CO insertion, the latter of which leads to higher selectivity to C2+ oxygenates [
18]. While our results show an increment in activity for only one of the Ti twins (Pair 12 in
Figure 4), we observed an increased selectivity to C2+ oxygenates for all four Ti twins with a different effect size on each (see
Supplementary Material S9c for selectivity changes).
4.2. Overall Multi-Promotion Effect on Reaction Network
As depicted in
Figure 4, CO hydrogenation results in a similar product spectrum for all of the tested catalysts. This is also shown via the stacked selectivity plot in
Figure 3, using catalysts A, B, C, and E (RhMn-, RhMnLi-, RhMnTi-, and RhMnIr/SiO
2, respectively) as an example. In other words, the effect of adding Ir, Li, and Ti and their combinations to RhMn/SiO
2 is not a change in the product spectrum but primarily a change in either CO conversion level or the formation rate of certain products; it is never the formation of new products.
It can, therefore, be argued that for the promoters tested in this study, the promoter addition to RhMn/SiO
2 does not change the overall StE reaction network. The major role of promoting elements is reflected in reinforcing certain pathways within the network. The complex interaction of Li and Ti is a good example of this. As it can be seen in
Figure 5 and
Figure 6, the effect of Ti and Li on the formation rate of most C2 products changes in the presence of the other co-promoter, indicating their interference in the reaction network. Yet even this complex interaction does not change the resulting product spectrum and the overall network.
Based on this argument, Ir increases the hydrogenation of aldehydes to alcohols, followed by esterification with acetic acid. Opposite to this effect, Li reduces the hydrogenation activity of the catalysts to which it is added. This effect is reflected in the increase in most of the not fully hydrogenated products such as olefins and acetaldehyde. The effect of Ti on boosting certain reaction pathways is more diverse, depending on the composition of the catalyst to which it is added. In the case of Ti addition to RhMn/SiO2 and RhMnIr/SiO2, the main effect is observed in increased hydrogenation, whereas its addition to RhMnLi/SiO2 and RhMnIrLi/SiO2 also boosts the acetaldehyde formation pathway.
4.3. Overall Correlations
Correlation analysis between descriptor pairs indicates the extent of their co-variation, which, in turn, is used to interpret how different product formations are linked to one another.
Figure 8 plots the formation rate of acetic acid and methanol vs. acetaldehyde. A fitted linear line shows the correlation extent via the regression coefficient (R
2), and the slope of the line is used as an indicator of the effect size. Additionally, for each fitted line, the
p-value indicates whether the regression obtained is statistically meaningful at a given significance. For both examples shown in
Figure 8, the
p-values obtained are equal to zero, which means that at any significance level, the statistical relation between descriptors is meaningful. The examples shown suggest a positive correlation between the formation rate of acetaldehyde and acetic acid and a negative correlation with that of methanol.
This result suggests that for the catalysts considered, acetaldehyde and acetic acid share a similar formation pathway, whereas the formation of methanol competes with that of acetaldehyde. Considering the wide range of products formed in CO hydrogenation, one could extend such a correlation to investigate how different product formations are correlated with one another as well as with the structure and property descriptors, i.e., average Rh particle size and Rh loading. To establish an integral perspective of such correlation, the rate and selectivity of products, the catalyst activity, measured in Exp 1, and the average particle size obtained from TEM imaging are selected as descriptors to build a correlation matrix (
Figure 9).
The matrix consists of two parts: the lower triangle depicts the correlation between any pair of rate descriptors, i.e., particle size and/or Rh loading. The upper triangle shows the same, except that rate descriptors are substituted with selectivity descriptors. The values shown in the matrix correspond to the slope of the best-fit linear line for the co-variation in the connected descriptor pair to that cell. For each slope value in the matrix cells, the independent variable is shown vertically (right and left axes) and the dependent variable is shown horizontally (upper and lower axes). The performance and property descriptors are sorted such that the rows from top to bottom and the columns from right to left show Rh loading and the average particle size and then, in order, the respective descriptor for C2+ oxygenates, acetaldehyde, acetic acid, acetates, alcohols, alkenes, alkanes, and activity. For the activity descriptor, the rate of CO consumption normalized to Rh loading is shown in the rate block (lower triangle), and, in the selectivity block (upper triangle), the CO conversion in percentage is selected.
The color coding of the cells shows green and red for a positive and negative slope, respectively. There are two shades for each color, indicating different significance levels reflected by the p-value. If, in a cell, the p-value obtained is smaller than the 0.05 significance level, it has a darker shade, and those cells with 0.10 < p-value < 0.05 have a lighter shade. If the p-value is larger than 0.1, the regression is considered insignificant and no color is attributed to that cell.
Robustness of the correlations obtained was additionally tested by generating the correlation matrix using two alternative methods, as described in
Supplementary Material S8. Both alternatives resulted in very similar conclusions to those in this section. In what follows, we initially discuss the correlation observed between average particle size with performance descriptors and then proceed to look into correlations between different performance descriptors.
4.3.1. Property Descriptors
We consider two property descriptors: Rh loading obtained from ICP-OES analysis, and the average particle size acquired from analyzing TEM images of fresh catalysts. In this section, we discuss the correlation of these two descriptors with performance descriptors, namely rate and selectivity of products. While the nominal Rh loading for all tested catalysts is the same, to ensure that small fluctuations in Rh real loading do not contribute to the observed effects, the values obtained from ICP-OES analysis for Rh were used to assess their correlation with performance descriptors. As can be seen from the matrix, differences obtained in Rh loading of catalysts show no strong correlation with either selectivity descriptors (top row) or rate descriptors (right side of column), with the exception of the ethanol rate. Considering the intrinsic character of Rh in facilitating both associative and dissociative CO adsorption [
16], both of which are needed for ethanol formation, it could be concluded that an increase in Rh loading favors a higher ethanol rate. However, the presence of other promoters should not be excluded. The catalysts with the highest and lowest Rh loading have the compositions RhMnIr/SiO
2 and RhMnLi/SiO
2, respectively. As discussed in
Section 4.1, Ir promotion increases the ethanol rate in all compared twins, whereas Li addition leads to a lower ethanol rate across all twins. Therefore, the correlation observed in the matrix of
Figure 9 cannot be solely attributed to changes in Rh loading.
The correlation matrix in
Figure 9 suggests that the average particle size depicts a strong positive correlation with the catalyst’s activity and the rate of hydrocarbons and shows a strong negative correlation with selectivity to C2+ oxygenates. It has been reported that in a <5 nm regime, larger Rh particles exhibit higher activity [
38]. Such behavior could be due to a shift of the entire surface to an inhibitory high CO coverage, as reported by Schumann [
39].
Other studies that have investigated the effect of Rh particle size in SiO
2 and Al
2O
3 supported systems [
40,
41] have concluded that in a <5 nm regime, larger Rh particles favor CO hydrogenation.
The correlations obtained in
Figure 9 are well in agreement with the results of the aforementioned studies. However, it should be noted that the effect of Rh particle size is not global, and this effect might change for different active sites that lead to the formation of different product groups. Moreover, one should bear in mind that correlation does not explain the causation entirely. It has been reported that the dependency of the electronic and geometric characteristics of the catalyst increases dramatically when the size distribution enters the nanoscale regime [
42], leading to complex behavior patterns. Therefore, while the particle size of the tested catalysts appears to be a key descriptor for performance, one would need additional property descriptors to fully understand the complex interplay of physicochemical properties.
4.3.2. Performance Descriptors
A collective evaluation of the lower and upper triangles of the correlation matrix shows a mirror-like reflection across the diagonal of the matrix, shown by gray cells, for most of the descriptor pairs. This shows a coherent correlation between selectivity and rate descriptors. However, this coherency is not followed for all of the assessed descriptor pairs. In what follows, we try to highlight and interpret the dominant correlations.
A strong positive correlation between selectivity and the rate of acetaldehyde and acetic acid is observed, highlighting the probability that acetaldehyde and acetic acid share the same formation pathway, as suggested by Bauer [
43]. Contrary to this positive correlation, acetic acid shows a solid negative dependence on methanol. Such strong co-variations, which are obtained based on the performance of catalysts with varying loadings of Ir, Li, and Ti promoted onto RhMn/SiO
2, suggest that the overall reaction network has not been affected by incorporating promoter elements. In other words, promoter elements accelerate or suppress individual pathways while retaining the same reaction network.
Among the hydrocarbons, a strong positive correlation between propene and n-butene with C1–C4 alkanes suggests a similar formation pathway, reflected in the catalyst’s CO splitting ability rather than its CO insertion ability. For both propene and n-butene, the effect size on the alkanes, reflected by the slope obtained, decreases as the carbon number of the respective alkane increases. Assuming the hydrogenation of alkenes to alkanes with same carbon number, it can be interpreted that changes in smaller alkenes have a larger effect size on the alkane formation rate. Only ethene shows a different correlation pattern than other alkenes, which can be due to the less prominent role of hydrogenation for ethene.
Additionally, the selectivity of the analyzed alcohols (C1–C3) shows a strong reverse correlation with that of propene and n-butene (upper triangle of
Figure 9). It can be assumed that propene and n-butene on the one side, and alcohols on the other, share a competitive formation pathway. This hypothesis is further supported by the positive correlation between CO conversion (X_CO) with propene and n-butene and a negative one with alcohols. In other words, a drop in selectivity in one product group is accompanied by an increase in selectivity in the other group. Moreover, for all alcohols, the slope in selectivity descriptor pairs is almost twice as steep when the counter descriptor changes from propene to n-butene. This shows that while selectivity of both n-butene and propene has a strong negative correlation with Salcohols, the negative effect size of n-butene on Salcohols is almost twice that of propene.
4.4. Mechanistic Interpretation of the Reaction Network
The correlation between the formation rate of different products obtained in
Figure 9 serves as an indicator of the interdependence of respective formation pathways. Based on these correlations,
Figure 10 shows the expected change in the rate of oxygenates following a decrease in the formation rate of acetaldehyde.
The correlations observed in
Figure 10 suggest that the hydrogenation ability of the catalyst plays a crucial role in the overall reaction network. It can be argued that acetaldehyde functions as one of the main intermediates for ethanol formation. Additionally, the formed alcohols appear to react further with acetic acid to form acetates.
These observations, based on data obtained from all eight tested catalysts, can serve as tools for connecting overall formation pathways of oxygenates in syngas conversion over Rh-based catalysts.
4.5. Performance Comparison to Similar Systems
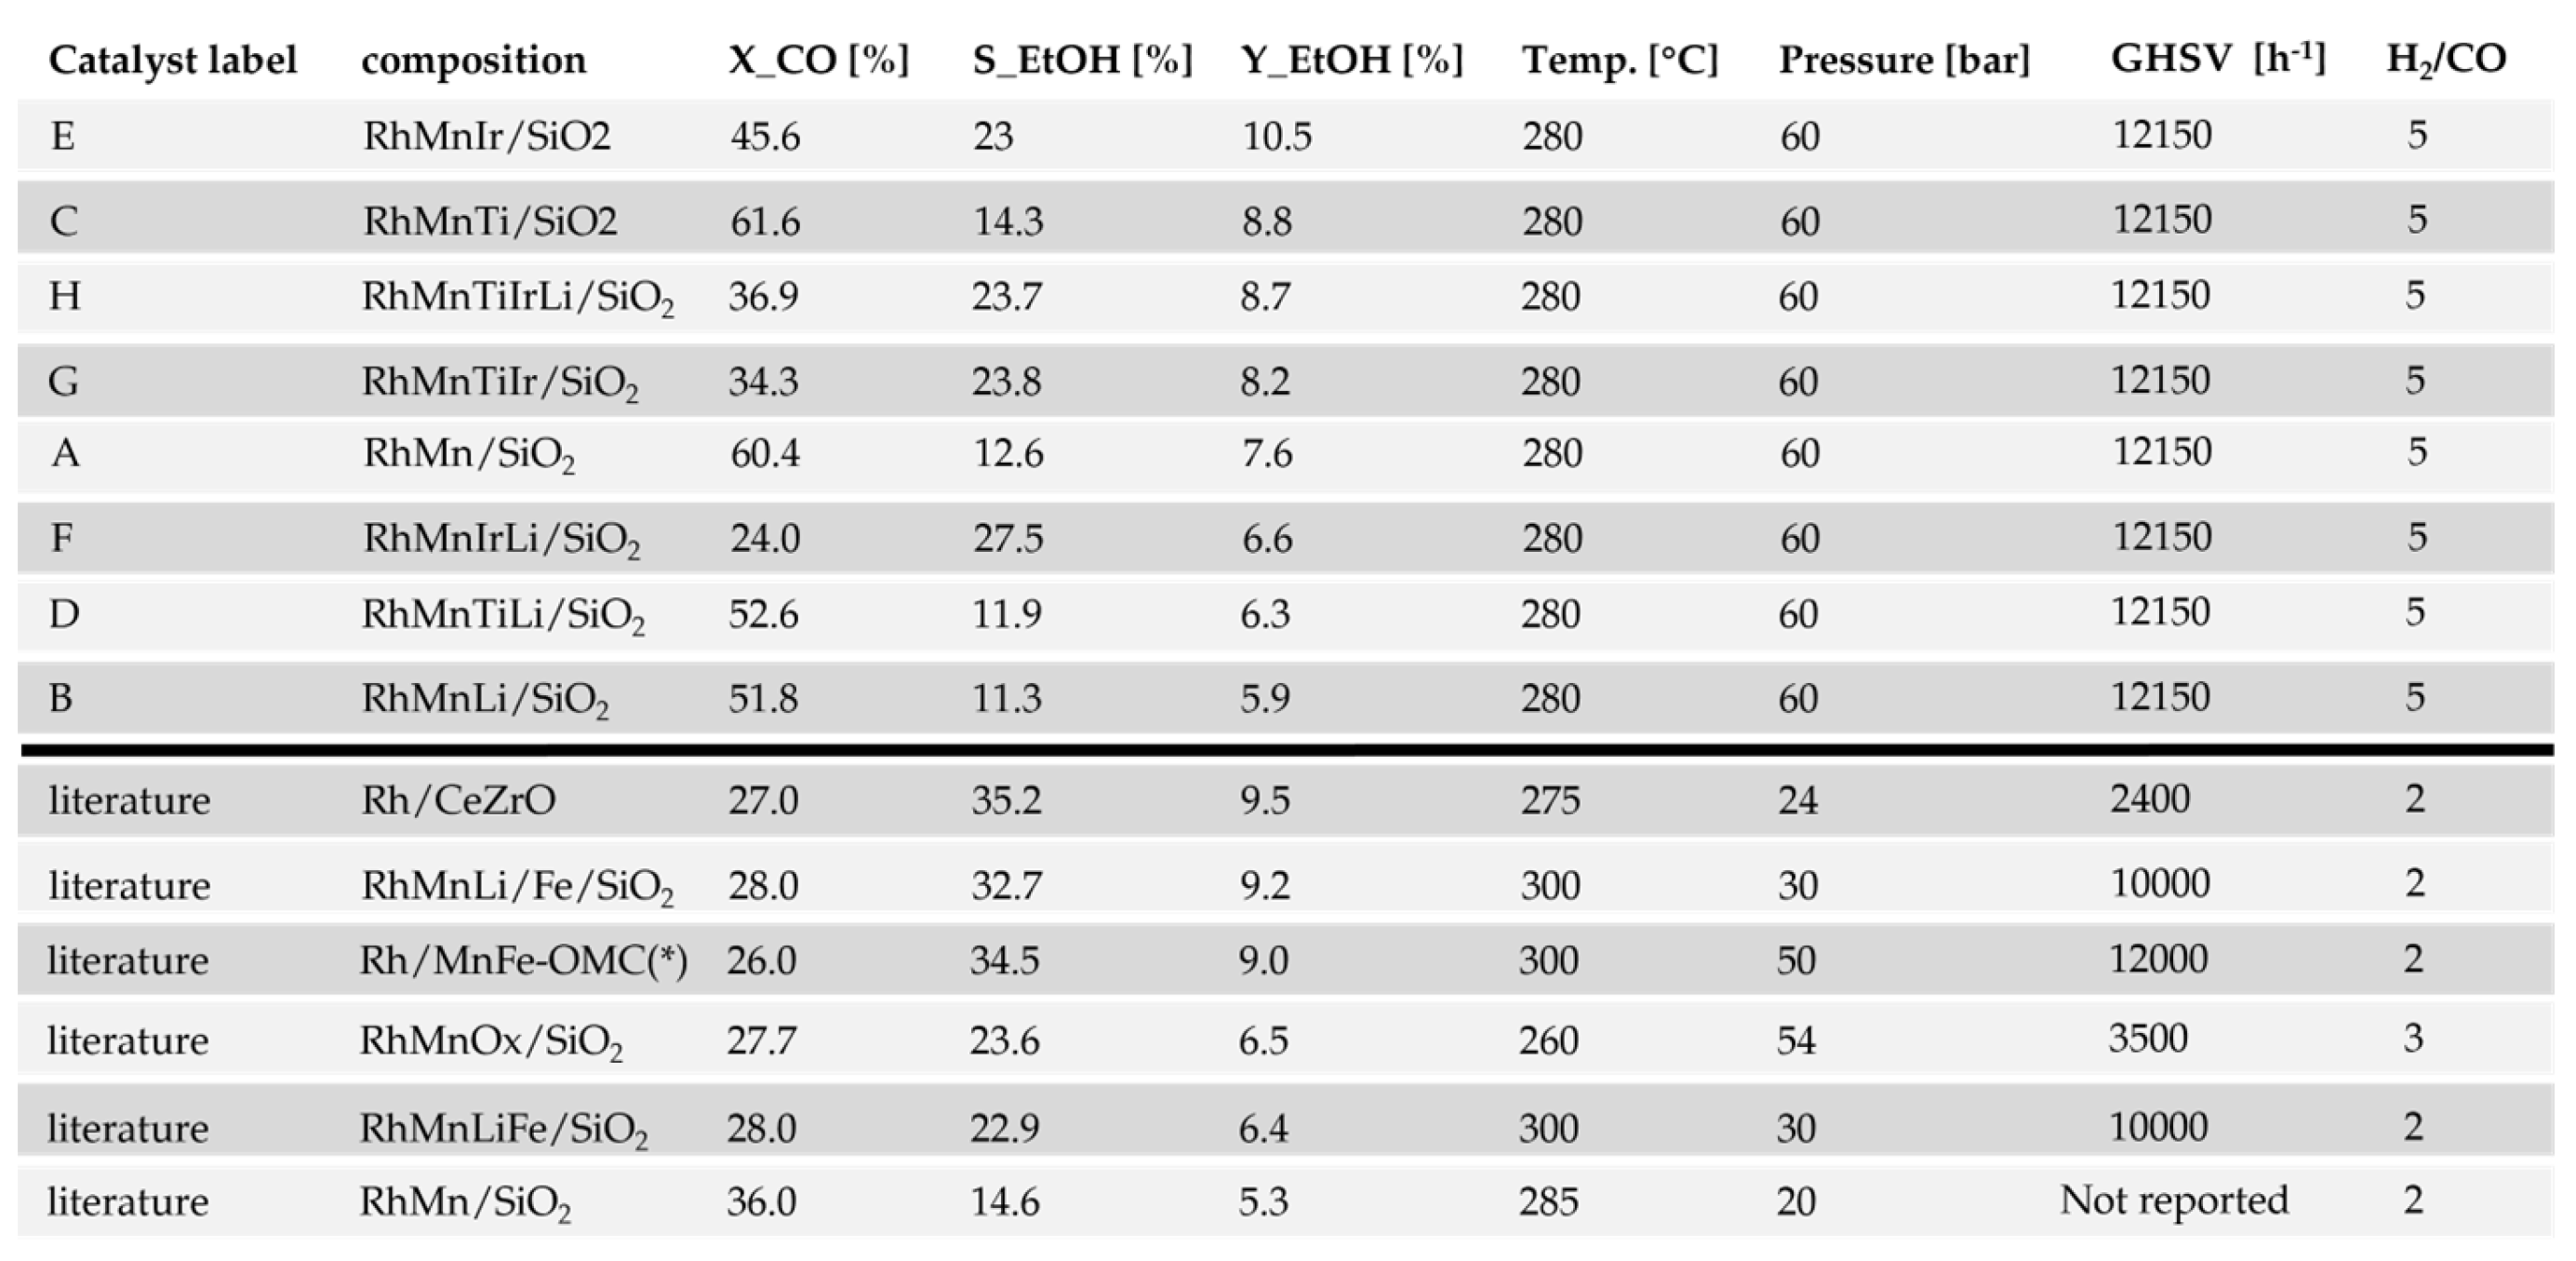
Figure 11 depicts performance details for catalysts from the current study (upper part) and the best reported values obtained from a recent review on higher alcohol synthesis, published in 2017 [
8]. The values from the literature (lower part of
Figure 11) are claimed to be the highest values for similar catalytic systems, i.e., Rh-based catalysts tested in similar reaction systems [
14,
37,
44,
45,
46,
47]. For each group, the catalysts are sorted from the highest to the lowest ethanol yield.
By comparing the two groups (literature values and those obtained in the present study), it can be seen that Catalyst E from the present study with composition RhMnIr/SiO2 has the highest ethanol yield of 10.5% amongst both groups, demonstrating the advantageous performance of the catalytic system developed. Additionally, the unpromoted RhMn/SiO2 catalyst (A) shows an ethanol yield of 7.6%, which is higher than the ethanol yield of 6.5% for similar systems (RhMnOx/SiO2) reported in the literature. The other seven catalysts from the current study show an ethanol yield ranging from 5.9% to 8.8%, which is comparable to the range of 5.3–9.5% obtained for catalysts reported in the literature.
It should be mentioned that the performance in the current study was obtained with sufficiently high GHSV for all catalysts, facilitating the incorporation of a low catalyst weight and, in turn, requiring a lower Rh weight and a reduced catalyst price. It should additionally be noted that the difference between the two groups’ feed composition reflects the implementation of industrially relevant test conditions, which was one of the focus points of the current study.
5. Conclusions and Outlook
In this study, we present a systematic approach to investigate the complex interplay between multiple co-promoters in supported catalysts. We use the example of the effect of Ir, Li, and Ti, and combinations thereof, added to RhMn/SiO2, to study syngas conversion under industrially relevant conditions. By employing a data-driven approach, a statistical and mechanistic understanding for each promoter was established, which, in turn, revealed the effects in terms of reactivity and the dependence on the promoter itself and respective co-promoters. The method applied in our study facilitates the investigation of hidden correlations in the data and the formation of hypothesis regarding the interaction between catalyst components, namely promoters. We showed, in our result, how these hypotheses can be further supported based on the correlations observed. The formation of more detailed hypotheses about structure–performance correlations needs further characterization of catalysts.
Ir shows a clear trend across all catalysts, i.e., increased acetate and alcohol production and, in particular, ethanol. The resulting effect size of Ir is largest when it is added to RhMn/SiO2. Among the analyzed twins for Li, a decrease in activity and the formation rate of alcohols and acetates is observed. However, the effects observed following Li addition appear to be affected by the co-promoter elements and, in particular, the presence of Ti, which appears to be a more determining factor than Ir. Similar to Li twins, the role of Ti is dependent on the presence of other promoters. The main effect of Ti in the presence of Li seems to be increased activity, while, in the absence of Li, a slight increase in acetate formation at a similar activity level is observed.
The correlation analysis showed a positive correlation between particle size and catalytic activity. While this finding is supported in similar works, it should be investigated further by assessing additional physicochemical properties such as textural properties and surface acidity and basicity.
In terms of performance, RhMnIr/SiO
2 (Catalyst E in
Figure 2) shows the highest ethanol formation rate. If the performance evaluation is built on the sum of formed C
2+ oxygenates, the multi-promotion of Ir, Li, and Ti onto RhMn/SiO
2 (Catalyst H in
Figure 2) yields the highest rate. The same catalyst also reduces the formation of methane, which is a desired effect in StE. Additionally, testing the catalysts under the same conditions and at two different times-on-stream (Exp 1 and Exp 7) depicts that RhMnIrLiTi/SiO
2 has the highest stability in terms of CO conversion as well as the rate of products produced.
The reaction network for CO hydrogenation is rather complex, and we have shown that the incorporation of Ir, Li, and Ti promoters onto RhMn/SiO2 does not decouple the formation pathway of different products from one another but only boosts certain pathways. This makes the optimization of Rh-based catalysts for improved ethanol production a challenging task. Given that certain promoter elements increase the formation rate of C2+ oxygenates while retaining the ethanol formation rate, a potential solution to improve catalytic performance would be to incorporate a tandem catalyst for the hydrogenation of C2 oxygenates to ethanol.
Another challenge for improving catalytic performance is to meet the industrial requirements for the design of a feasible operation. In our study, we have implemented experimental conditions that lie within today’s demanding industry and obtained an ethanol yield of 10.5% (for RhMnIr/SiO2) and a yield of C2+ oxygenates as high as 15% (for RhMnIrLiTi/SiO2), which places the performance of the tested catalyst among the top Rh-based catalysts.

 ,
, 


