1. Introduction
Over the years, the urbanization and globalization of the world have put immense pressure on the environment. This happens as a result of the changes that occur when various contaminants from anthropogenic activities reach the environment [
1]. Antibiotics were first discovered and identified as a contaminant in rivers, as well as in wastewater from densely populated areas [
2]. Antibiotic accumulation produced a variety of harmful effects on the organism and the natural ecosystem owing to its persistence in the environment [
3]. The growing threat posed by pollutants, especially organic species, is a major source of concern for research communities all over the world. Some of these pollutants such as polysubstituted aromatic hydrocarbons (PAHs) and antibiotics fall under a class of compounds called persistent organic pollutants (POPs), which have also been presenting in soils, the atmosphere, and bodies of water for a long period of time [
4]. Furthermore, these pollutants do not degrade in wastewater treatment plants or drinking water, posing health and environmental risks such as antibiotic resistance, hormonal disruption, and toxicity [
5]. Antibiotic pollution has become a matter of attention recently owing to the potential risk to human well-being. Antibiotics are regarded as widely accessible in developed and developing country, having a significant presence in the environment. Even in some countries, the usage and purchase of antibiotics can be put down to irrational excuses without a clear prescription [
6]. Antibiotics will reach surface water, groundwater, and even drinking water if they are not degraded or destroyed during sewage treatment. A recent study stated that drug residues, including antibiotics, have been found in a variety of aquatic habitats, including groundwater, surface water, and tap water [
7]. The discovery of photocatalysis by Honda and Fujishima in 1972 [
8] led to the development of many new applications, such as the reduction of greenhouse gas emissions. Owing to its economic and environmental benefits, photocatalysis has gained widespread popularity. It is considered an effective and green alternative to traditional waste disposal [
9]. The use of photocatalysis has been widely increased to treat various pollutants with a cost-effective and green technology [
10]. These radicals are known to convert complex organic species into simpler and less toxic compounds [
10]. They are also known to attack certain types of water and carbon dioxide. Secondary materials such as biochar have been used to improve the recoverability and transparency of photocatalytic nanoparticles.
Biochar is a pyrolysis product that is rich in carbon and has many pores, oxygen functional groups, and aromatic surfaces [
11]. Water, nutrient, and microbial growth are all aided by the porous structure of char particles, which can be used to remove harmful chemicals from wastewater or damaged soils by acting as an adsorbent [
12]. Biochar’s high matrix-bound carbon content, as well as its high porosity and huge surface area, help to adsorb heavy metals and other pollutants from polluted environments [
11]. It is a possible sorbent for organic and inorganic pollutants thanks to its high surface-to-volume ratio, which attracts non-polar chemicals such as dioxins, furans, polycyclic aromatic hydrocarbons (PAHs), and other molecules [
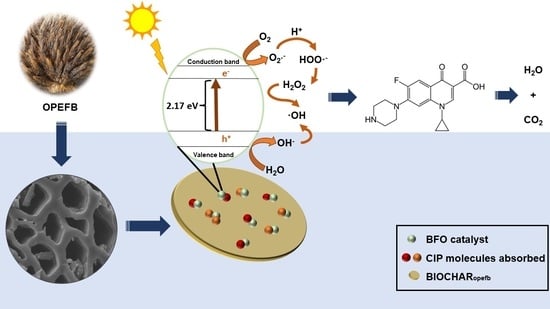
13]. As vast volumes of biowastes from oil palm mills are produced annually around the world, posing a substantial environmental concern, the raw material for biochar analyzed in this study is oil palm empty fruit bunches (OPEFBs). As a result, numerous scientists are striving to transform these wastes into high-value goods.
In facilitating photodegradation, carbon contains aromatic structures from biochar templates that have different hydrophobic and hydrophilic surface functional groups and can adsorb organic pollutants via electrostatic interactions, hydrogen bonding, or π–π stacking. Because of its role in increasing the number of catalytic nanoparticle active sites and surface area, supporting nanoparticles, and lowering band gap energy of semiconductor photocatalysts, mixing carbonaceous nanomaterials such as biochar with semiconductors has been continually explored. Photodegradation is a potential method for converting organic contaminants into innocuous products like water, carbon dioxide, and other inorganic species. Photocatalysts have been utilized to break down organic pollutants like medicines and dyes. Nevertheless, some of the conventional photocatalysts such as TiO
2, CuO, and ZnO exhibit some weaknesses, especially possessing a wide band gap that limits their potential under visible light application [
14,
15]. Photocatalysis reactions utilizing these materials are not cost-effective, as their performance improves solely when they are exposed to UV light. To overcome this problem, we propose a semiconductor photocatalyst known as bismuth ferrite, BiFeO
3, which has the features of a low band gap, non-toxic, and high stability. When compared with metal sulphides and other metal oxides, the proposed nanosized photocatalyst was shown to be a promising perovskite material with a stronger photo response to visible light irradiation [
15,
16,
17]. Therefore, in this study, a linear chain, such as the biopolymer chitosan, is employed as a carrier to compactly bind biochar to BiFeO
3 and their photocatalytic activity under sunlight illumination was studied. The influence of dye initial concentration and catalyst dose on the degradation performance was also systematically studied.
2. Results and Discussion
The BiFeO
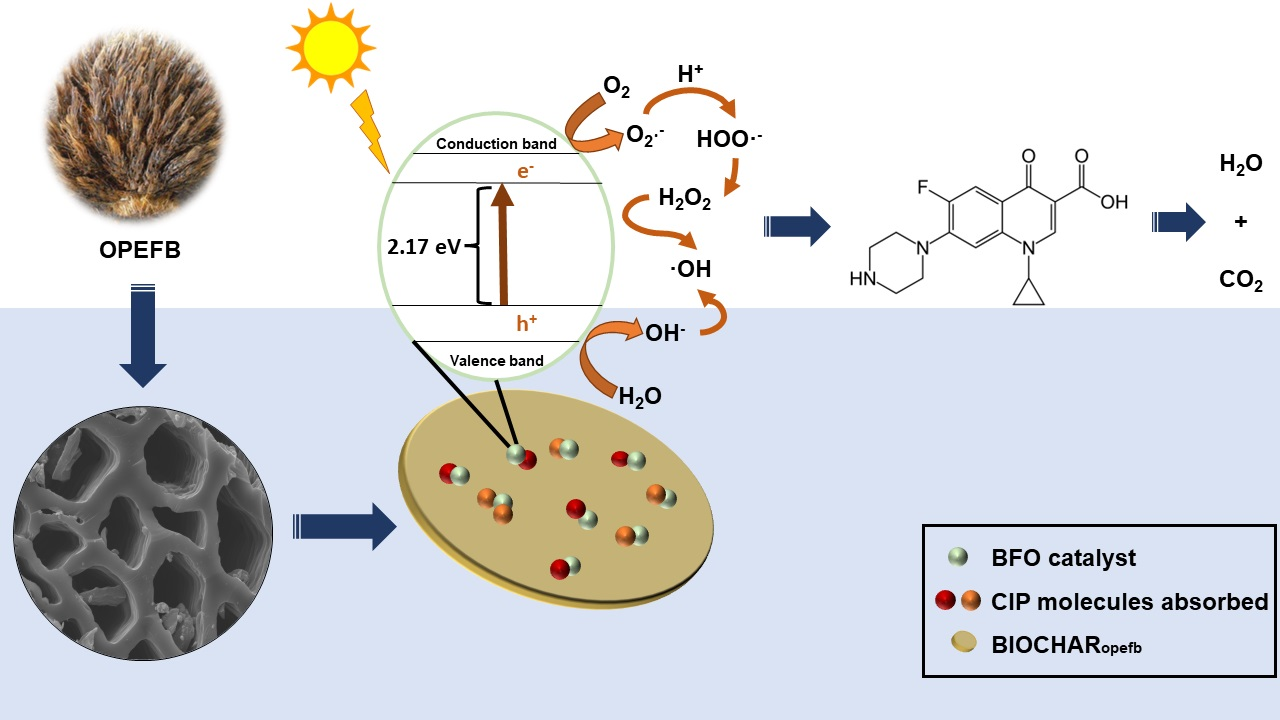
3 nanocatalysts were successfully produced via a biotemplating method with κ-carrageenan. The carrageenan plays a significant role to assemble, nucleate, and promote the inorganic structure for the formation of the desired nanocatalyst. It acts as a nanoreactor site for growth directing and stabilizing the metal oxide nanocatalyst. The Bi
3+ and Fe
3+ cations are firstly coordinated to the functional SO
4− group of the carrageenan before coordinating to the hydroxyl groups and enhancing the physical crosslinking of the biopolymer chains (
Figure 1). The carrageenan particles were self-capped when the sample was treated at high pH conditions and the Fe
3+ ions started to detach from SO
4− group and then migrated towards the nucleation sites. The cross-linked chains that occurred were able to protect the layer and stabilize the BiFeO
3 nanocatalyst in the basic solution. The calcination process would eliminate the biopolymer and retain the structure of produced nanocatalysts. In facilitating photodegradation, carbon has an aromatic structure from biochar templates with its role in increasing the number of catalytic nanoparticles active sites and surface area, supporting nanoparticles, and lowering band gap energy of semiconductor photocatalysts. By creating porous catalytic materials, these will help improve photocatalytic performance by allowing for greater mass transfer and adsorption of target pollutants, as well as increased photoexcited electron transfer and prevention of photocatalyst corrosion. Owing to their potential to form mesoporous for the supported catalysts, as well as enhance the charge separation and adsorption of target pollutants, biochar from biomass is a promising support material in heterogeneous catalysis. Furthermore, these low-cost carbon-based materials have larger specific surface areas and more plentiful functional groups. The addition of carbon in such composite materials has been discovered to have a synergistic impact, increasing the photocatalytic degradation rates of the photocatalysts.
2.1. FTIR Analysis
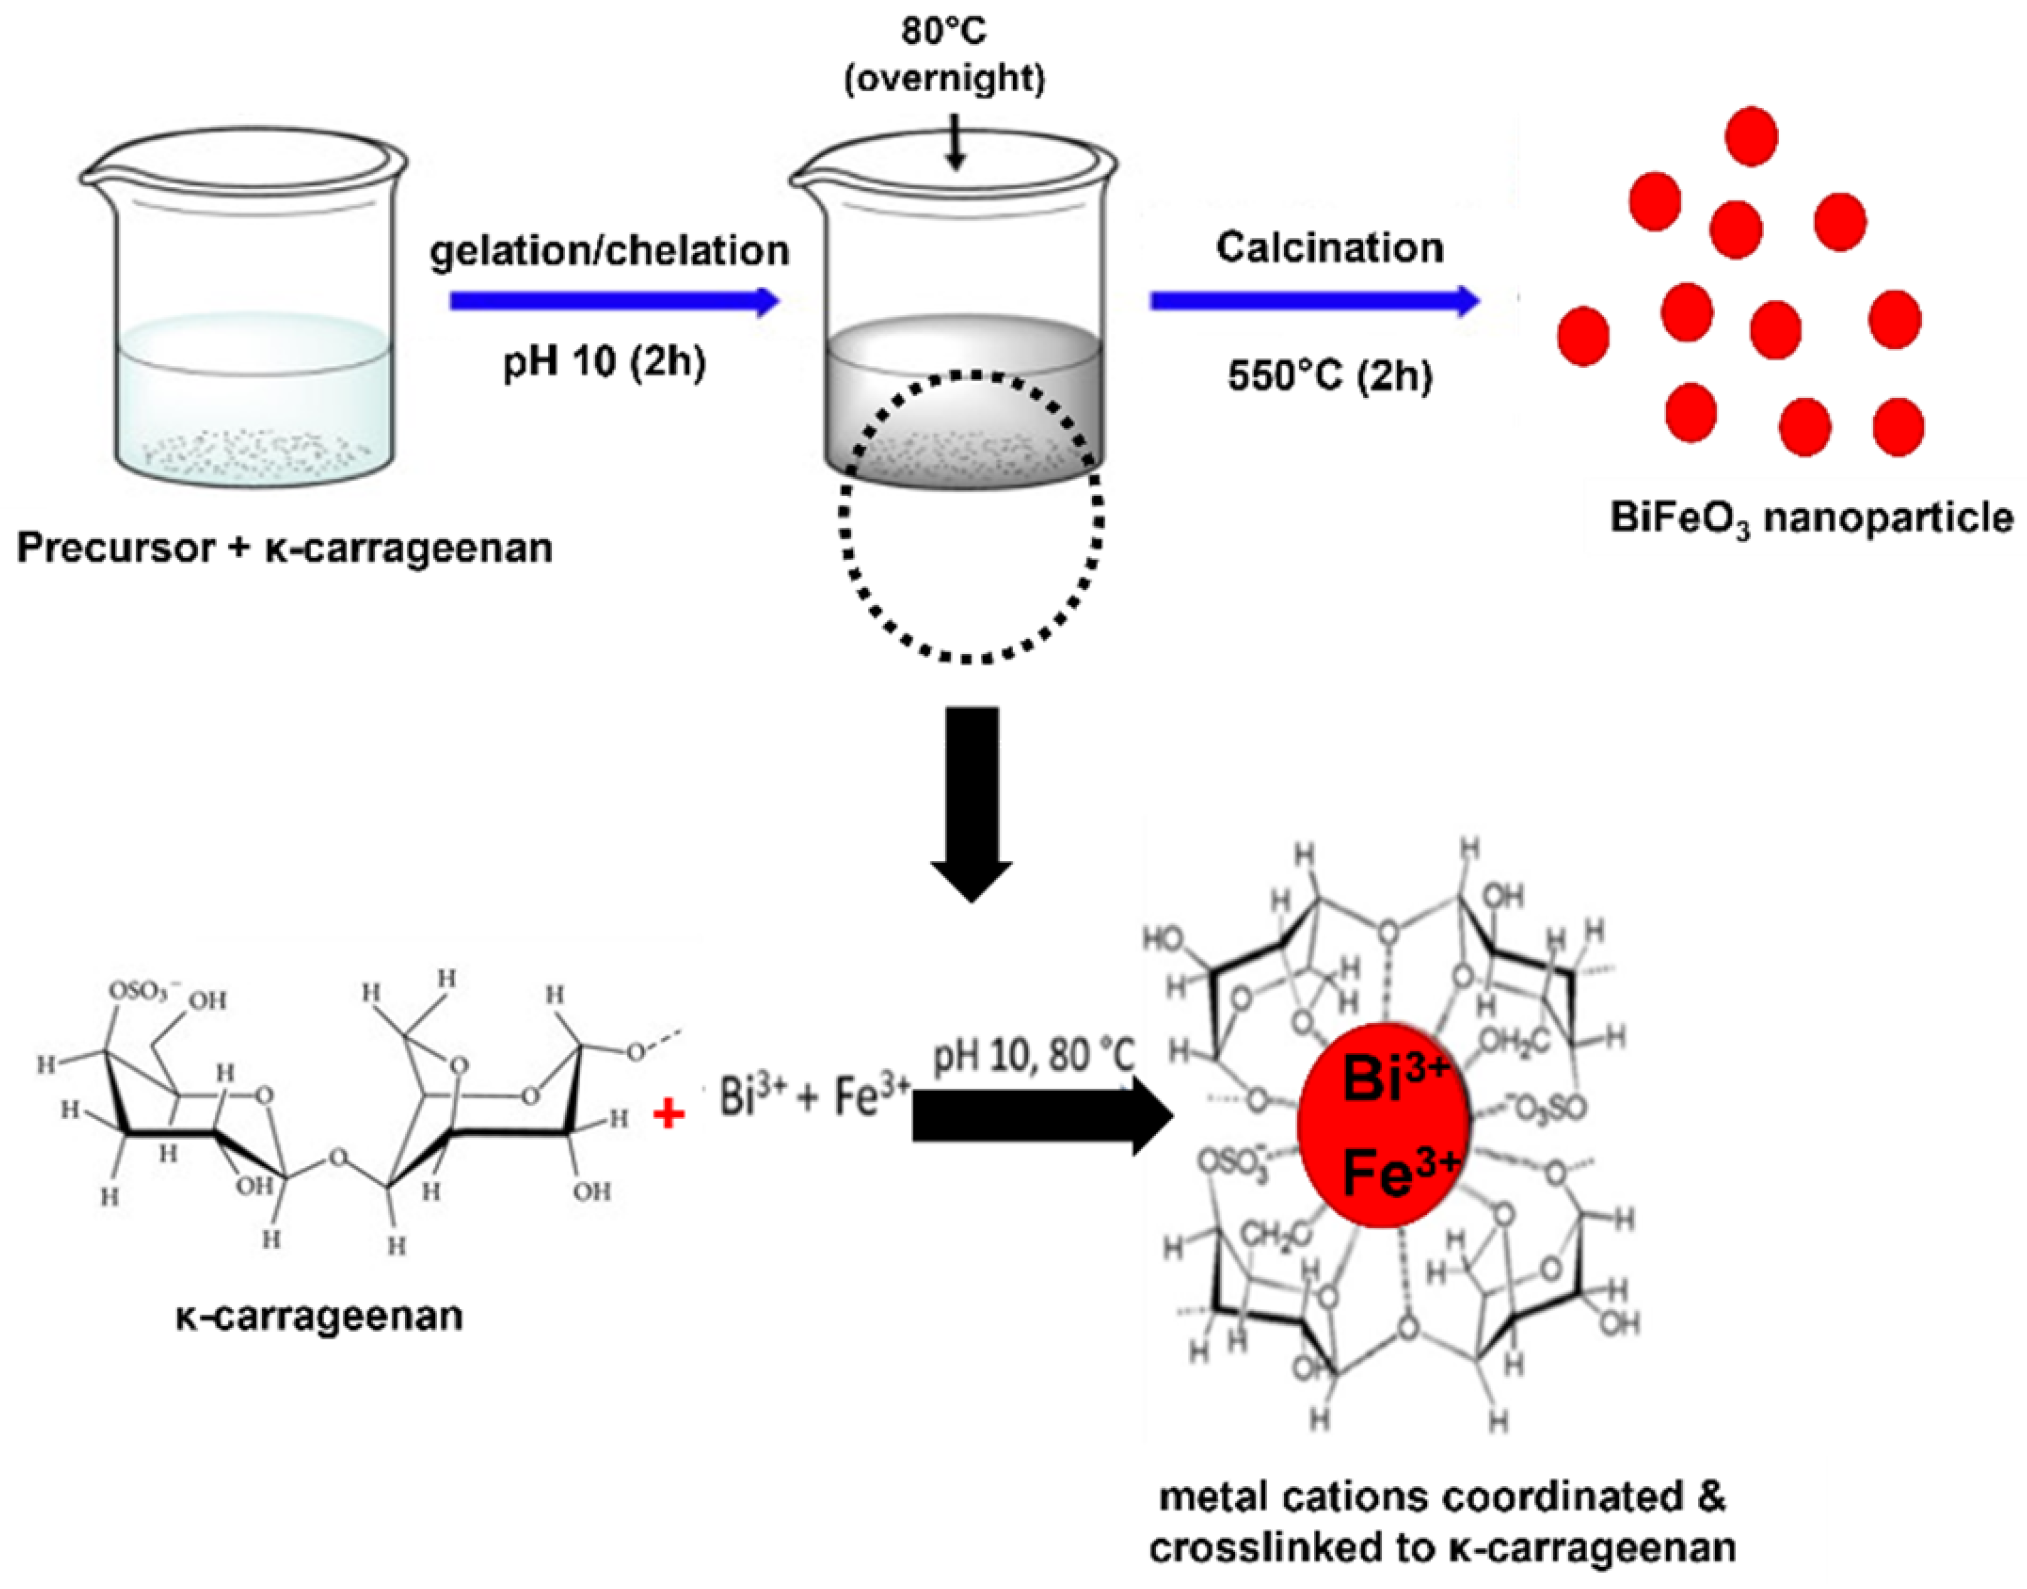
FTIR was used to understand the chemical composition of the prepared materials. The functional group produced in BFO nanoparticle and composite BFO/biochar (CBB) was confirmed by FTIR analysis. The FTIR spectrum of synthesized BFO and CBB composite is shown in
Figure 2a,b. Synthesized BFO shows a broad and strong absorption peak between 3000 and 3500 cm
−1, which is identified as a stretching vibration of the O-H group of the adsorbed water molecules, while the band at 1506 cm
−1 was assigned to be the bending of water molecules. Nitrate groups, NO
3−, are also present in the compound at the absorption band of 1384 and 1342 cm
−1. The strong absorption and medium peaks near 559 and 449 cm
−1 were attributed to the Fe-O and Bi-O bending vibration of BFO nanoparticles, respectively. These absorptions correspond to the features of the octahedral FeO
6 group present in the perovskite compounds that confirmed the existence of BiFeO
3. FTIR analysis of the CBB composite illustrated in
Figure 2b shows some prominent peaks at 580, 1031, 1061, 1413, and 1639 cm
−1. Specifically, the BiO
6 octahedral structure in BiFeO
3 leads to an adsorption peak at 580 cm
−1. The wide stretching at 1031 and 1061 cm
−1 refers to C-O stretching and the absorption detected at 1413 cm
−1 is responsible for C-N axial deformation of amino acid groups, which is primarily from chitosan. A peak at 1639 cm
−1 represents C=O stretching in amide formed in the glutaraldehyde crosslinking process of chitosan.
2.2. Optical Properties
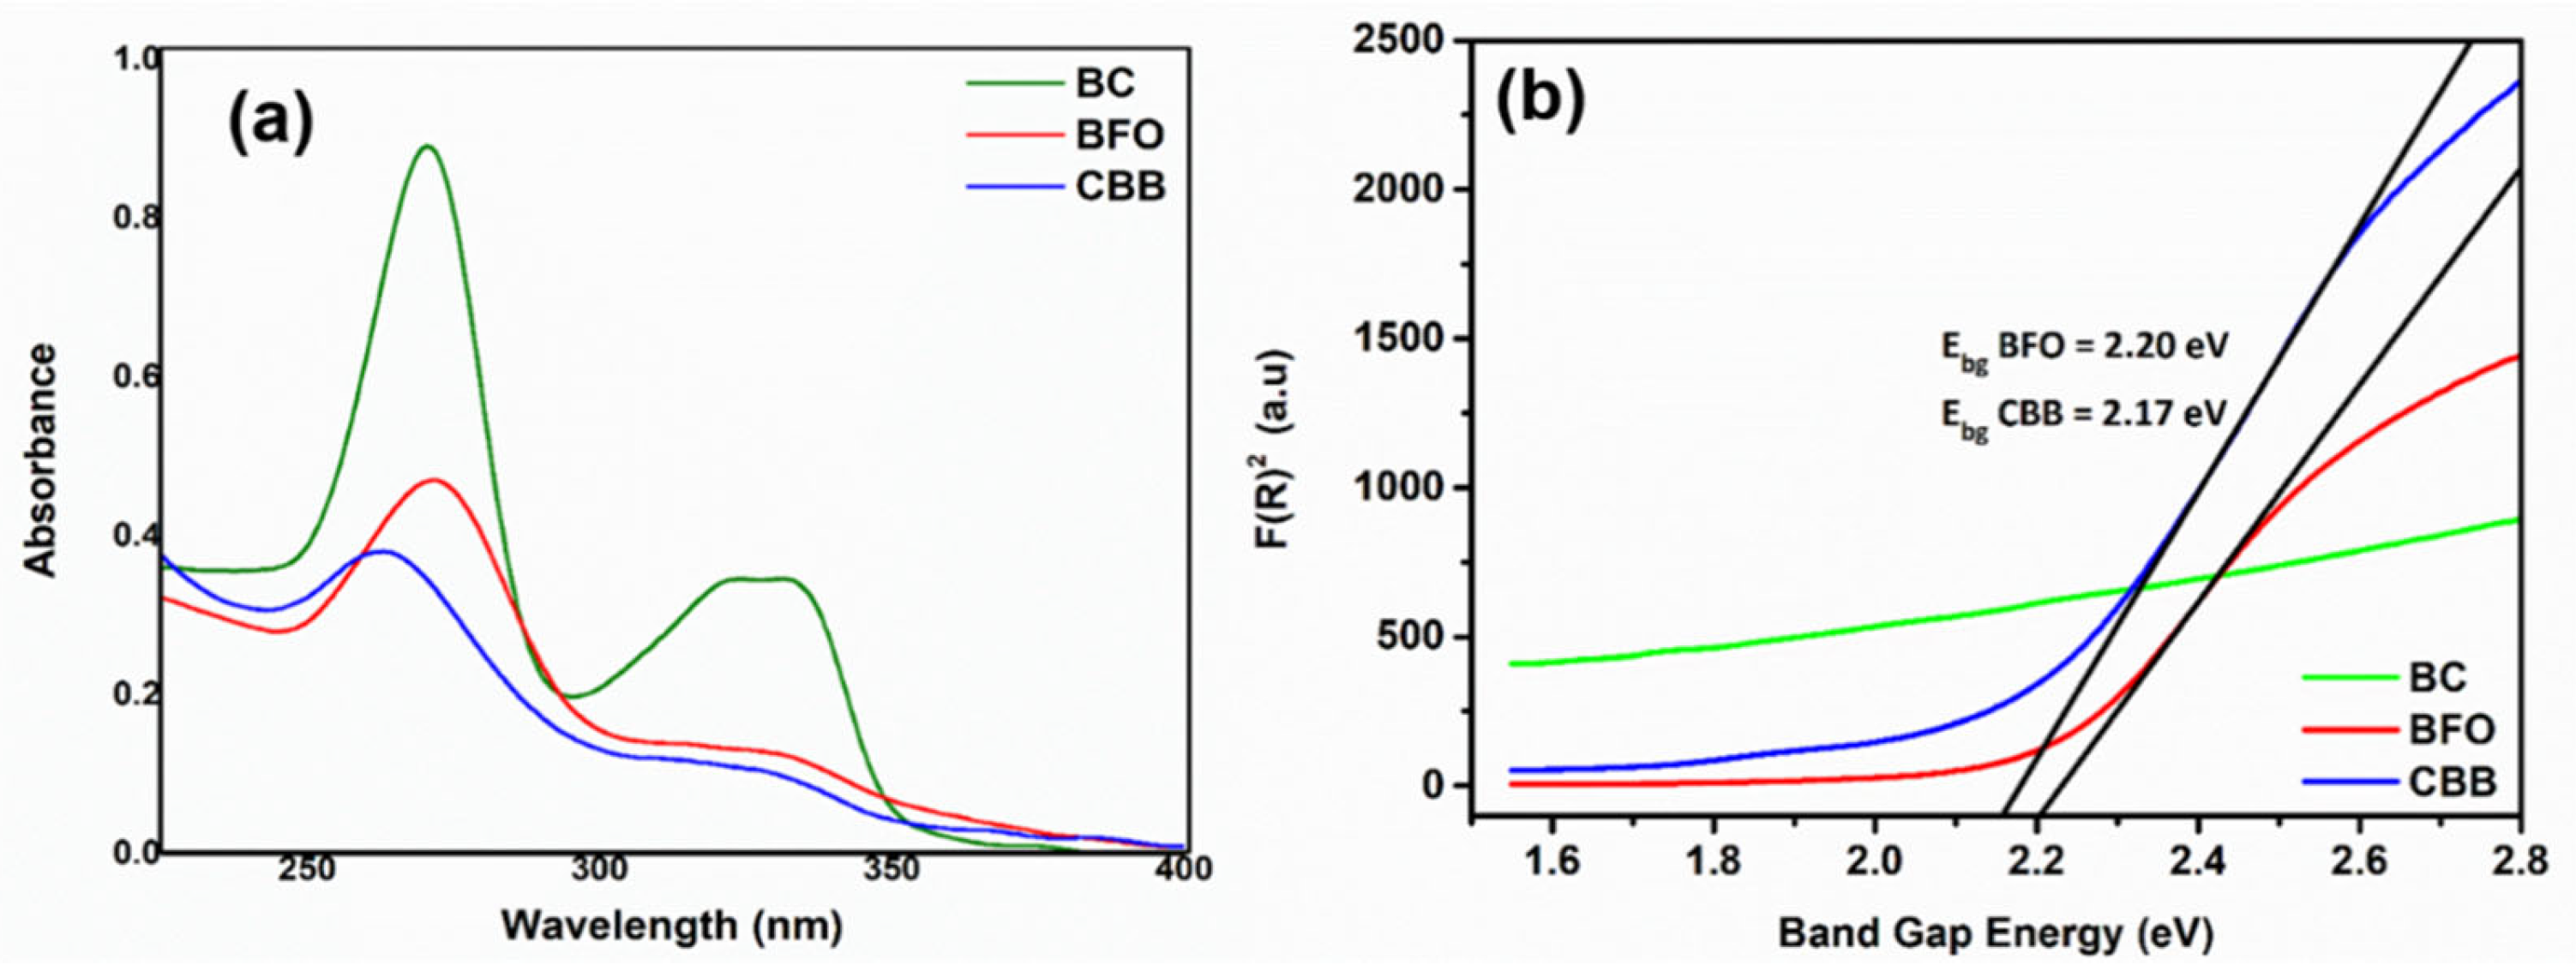
The optical properties of the synthesized BFO, biochar, and CBB were examined using UV-DRS measurement. The UV/Vis diffuse reflectance spectrophotometry technique was performed to evaluate the reflectance spectra of the samples and for band gap calculations;
Figure 3. The band gap of the photocatalysts was determined and calculated according to the Kubelka–Munk theory. The direct band gap energy was estimated from the tangent line in the plot of the squared Kubelka–Munk functions, F(R)2 against the photon energy of
E = hv. From the plot observed in
Figure 3b, extrapolation of the tangent line for BFO and CBB revealed that the direct band gap energy was at 2.20 eV and 2.17 eV, respectively. In this study, the direct band gap energy of BFO corresponds to the range reported by Sharma and Kumar (2020) [
18]. The carbon in biochar can act as a sensitizer when doped with photocatalytic nanoparticles, narrowing the light sensitivity of the synthesized composite [
19]. As a result, adding biochar to BFO reduces the band gap of CBB, thereby improving photocatalytic activity.
2.3. Morphological Analysis
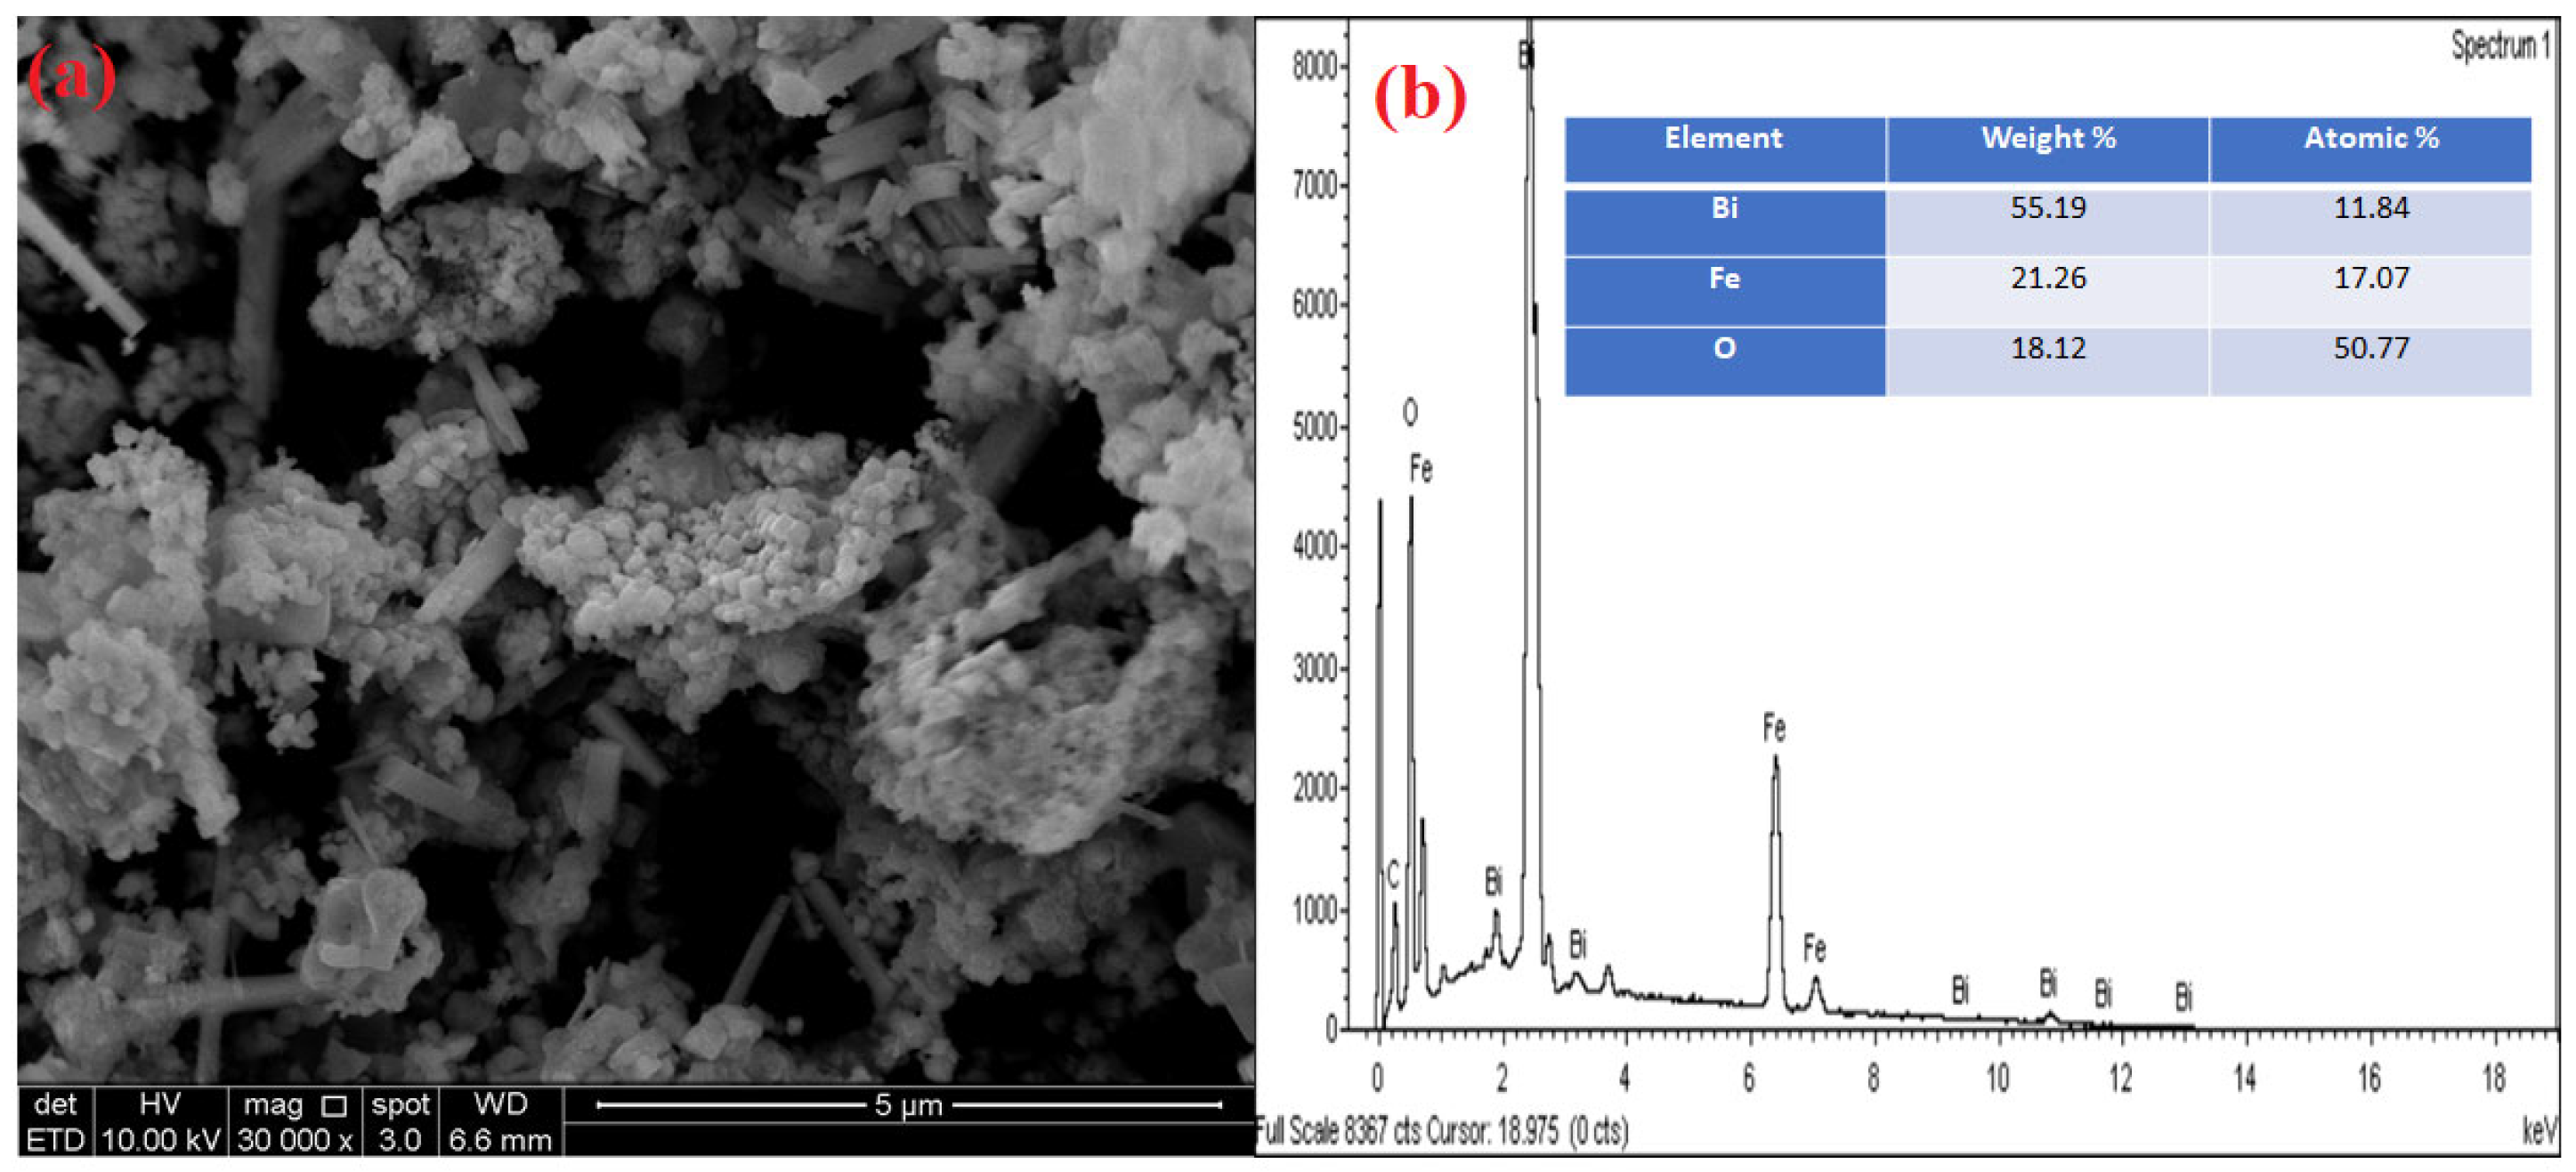
Scanning electron microscopy analysis was performed in equipment equipped with a field emission gun (FEG) and chemical analysis microprobe (EDS). This analysis was performed to evaluate the NPs’ morphology and verify the chemical composition;
Figure 4a. The surface topography and morphology of produced BFO, biochar, and CBB nanoparticles were examined using a scanning electron microscope (SEM).
Figure 4a shows the results of secondary electron images (SEIs), which confirmed the structure and morphology of the photocatalyst BFO nanoparticles. The topography images from the secondary electron detector revealed that the synthesized BFO nanoparticles have a deformed rhombohedral perovskite structure. From the SEM images, the morphology of the synthesized sample was found to be homogeneously distributed with the absence of the impurities phase. According to the image analysis performed using J-image software, the average particle size of the sample was calculated to be 170.5 nm. Energy dispersive X-ray microanalysis (EDX) was used to validate the existence of Bi, Fe, and O elements in the sample. The percentage weights of Bi, Fe, and O were determined to be 55.2%, 21.3%, and 18.1%, respectively, in the EDX spectrum in
Figure 4b. Bismuth and iron are also present in the photocatalyst in a 1:1 ratio, indicating that it is of high purity [
20].
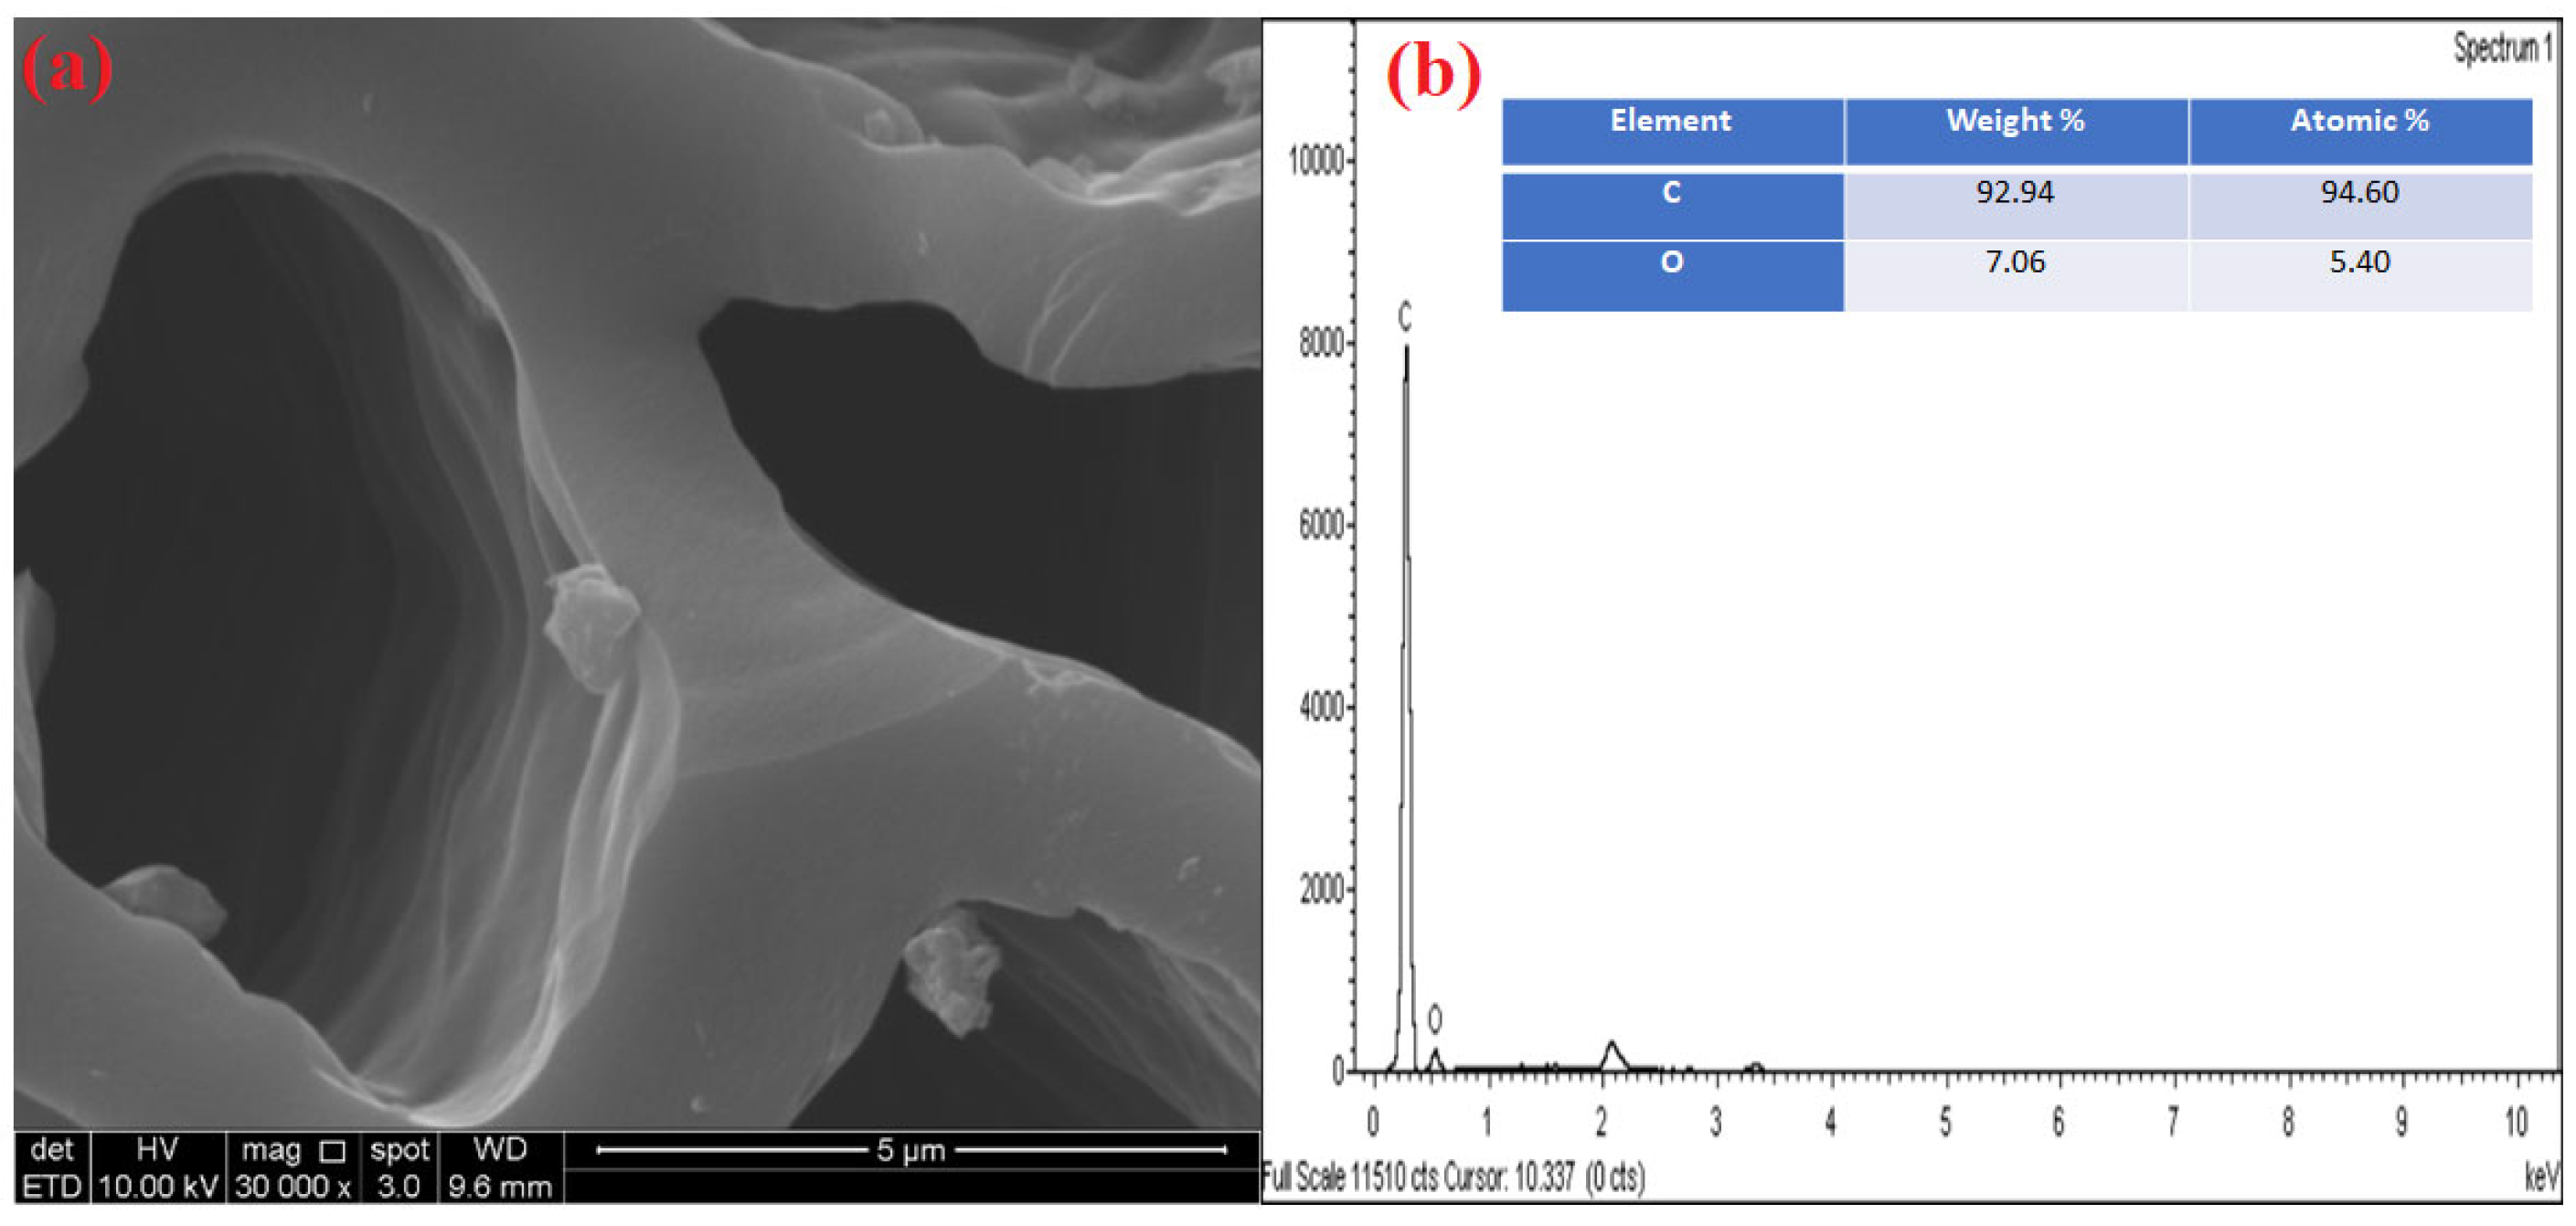
Figure 5a illustrates the scanning electron microscope images of the biochar obtained under optimum conditions, which are pyrolysis under a temperature of 700 °C for 1 h with a flow rate of 50 °C/min. As it is clear in the micrograph that the external surfaces of the biochar obtained under optimized conditions consist of cracks, crevices, and a significant amount of honeycomb-like pores of various sizes. In this study, the pyrolysis temperature is fixed at 700 °C. According to Zubbri et al. (2020) [
21], more pores with larger volumes formed at a higher temperature of pyrolysis are due to the destruction and deformation of the lignocellulosic structure of biomass. The presence of pores in the biochar structure will contribute to the improvement in the adsorption of organic molecules from the pollutant. EDX was also performed to validate only the existence of carbon (C) and oxygen (O) in the sample. According to the EDX spectrum in
Figure 5b, it is confirmed that the weight of biochar has 92.94% of C and 7.06% of O in the sample used.
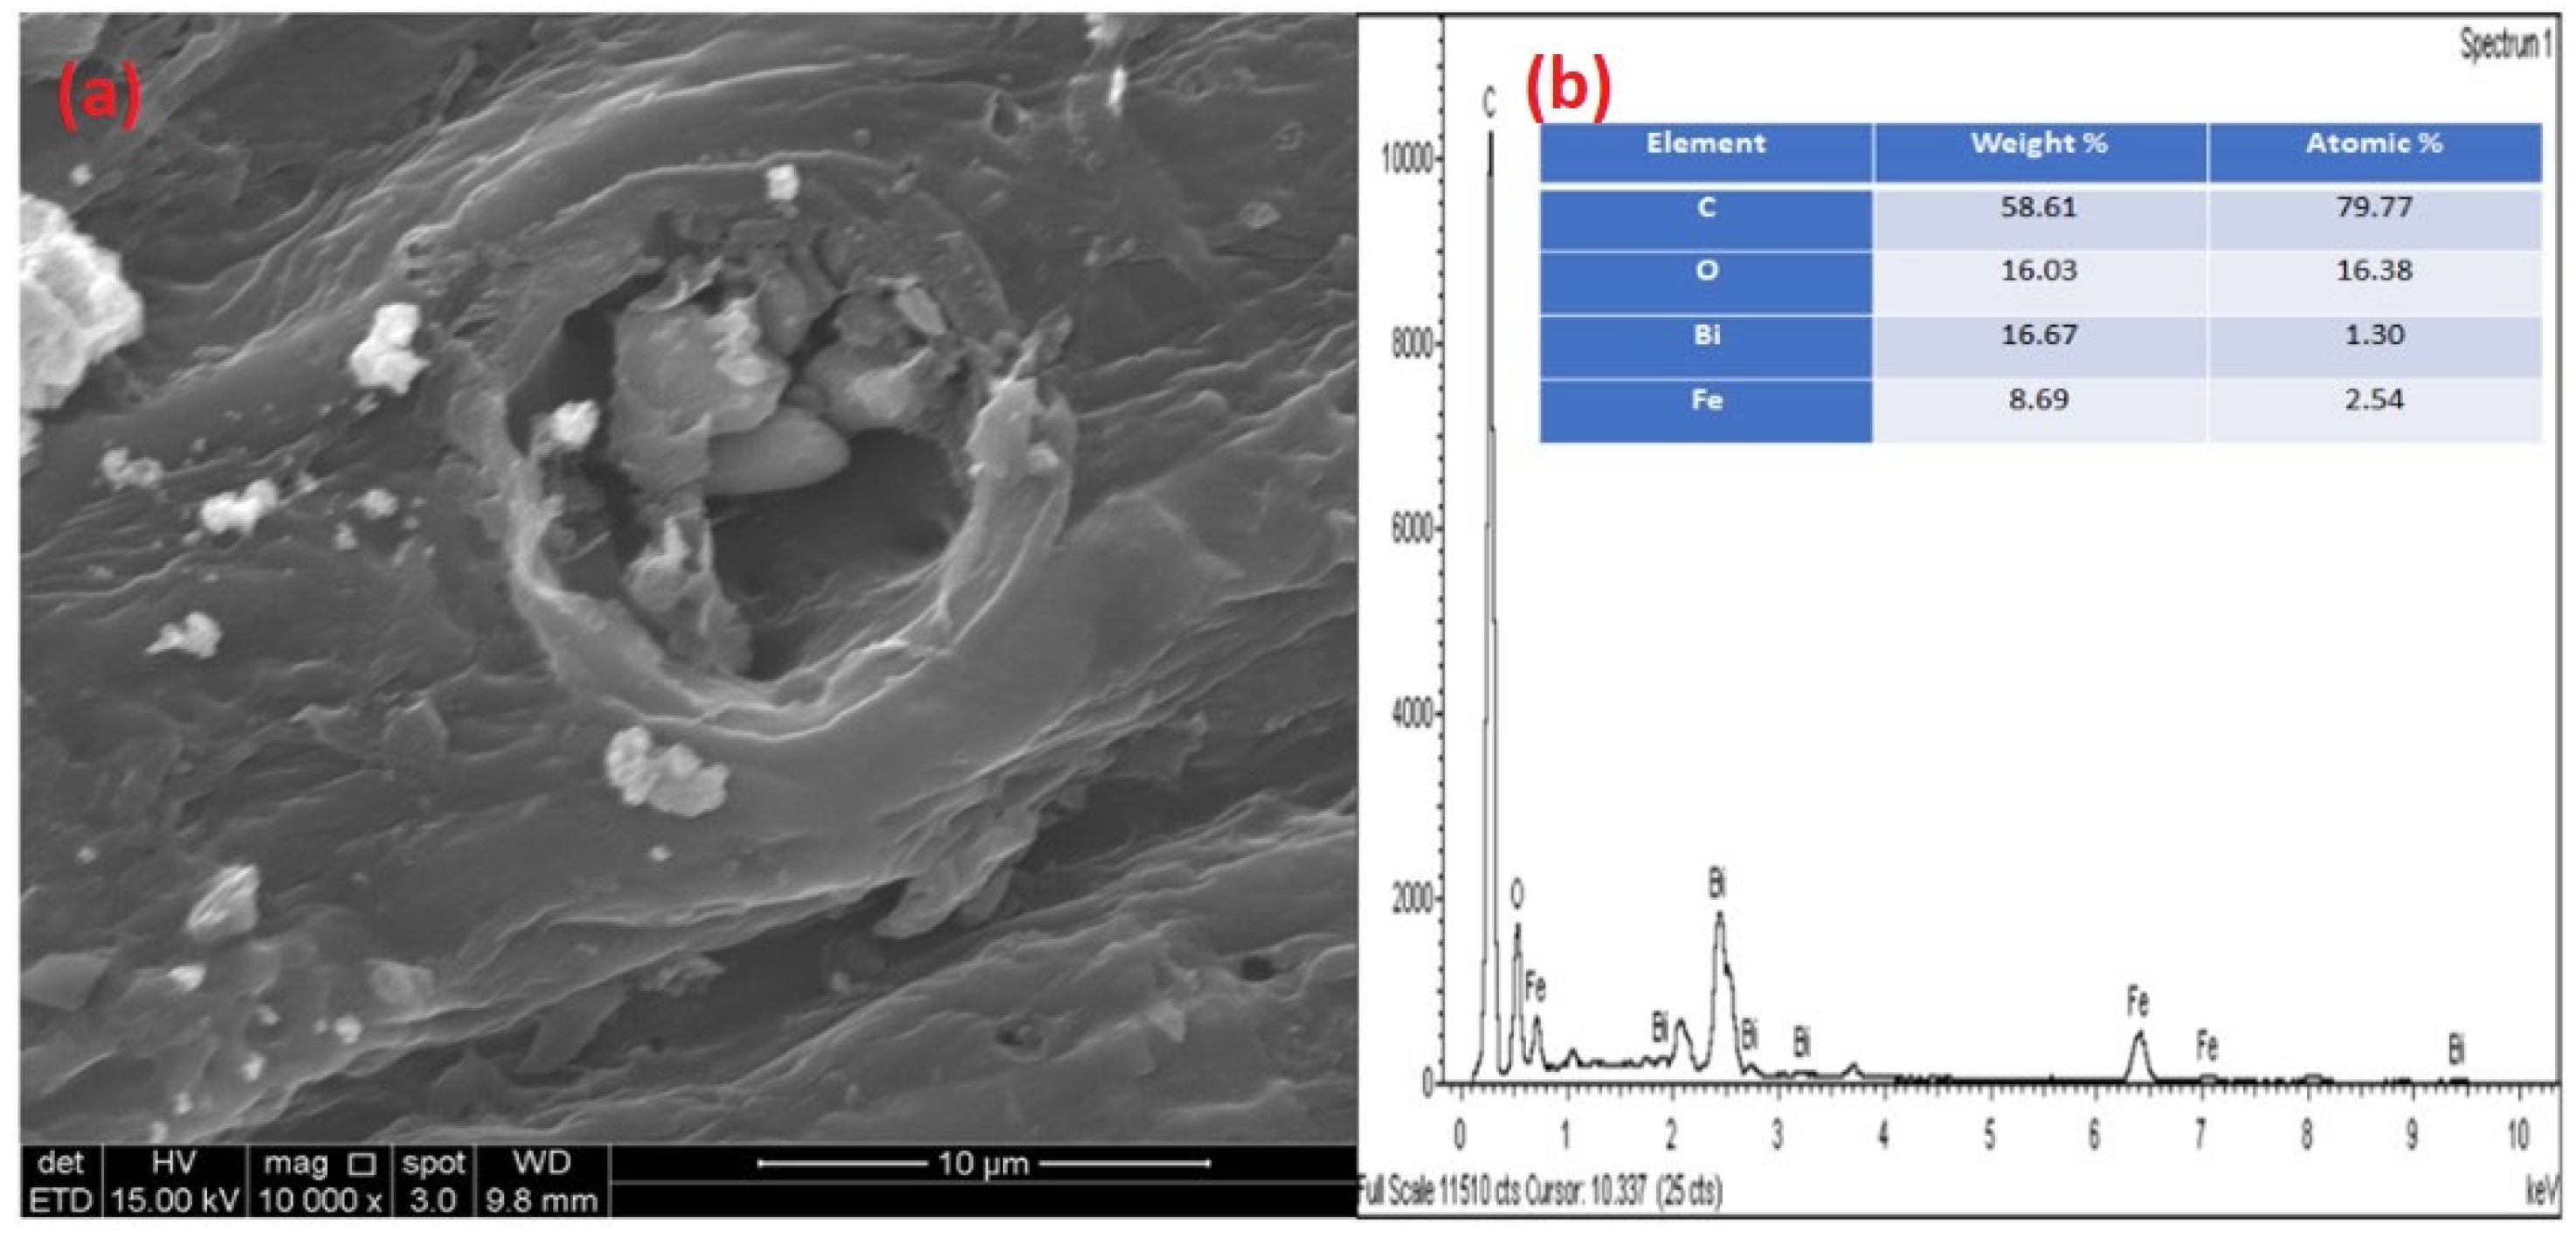
Figure 6a depicts the morphology of CBB nanoparticles. The addition of biochar resulted in the morphology of BiFeO
3, in which the BiFeO
3 nanoparticles were randomly distributed on the rough surface and multi-layered structure of chitosan along with biochar.
Figure 6a clearly shows the integration of multi-layered chitosan, the rhombohedral perovskite structure of BiFeO
3, and porous biochar. It appears that some tiny particles have agglomerated on the surface of chitosan because of the interaction between chitosan, biochar, and BiFeO
3. Chitosan changes the physiochemical properties of biochar and improves its impact on water quality [
22]. In addition, owing to the π–π interaction, chitosan was mostly covered on the biochar, giving it a larger specific surface area and higher thermal stability, while BiFeO
3 was widely dispersed in the combination. The presence of C, O, Bi, and Fe was also confirmed using EDX. The elemental percentage weight of the CBB photocatalyst was found to be 58.61% of C, 16.03% of O, 16.67% of Bi, and 8.69% Fe, as shown in
Figure 6b.
2.4. Structural Analysis
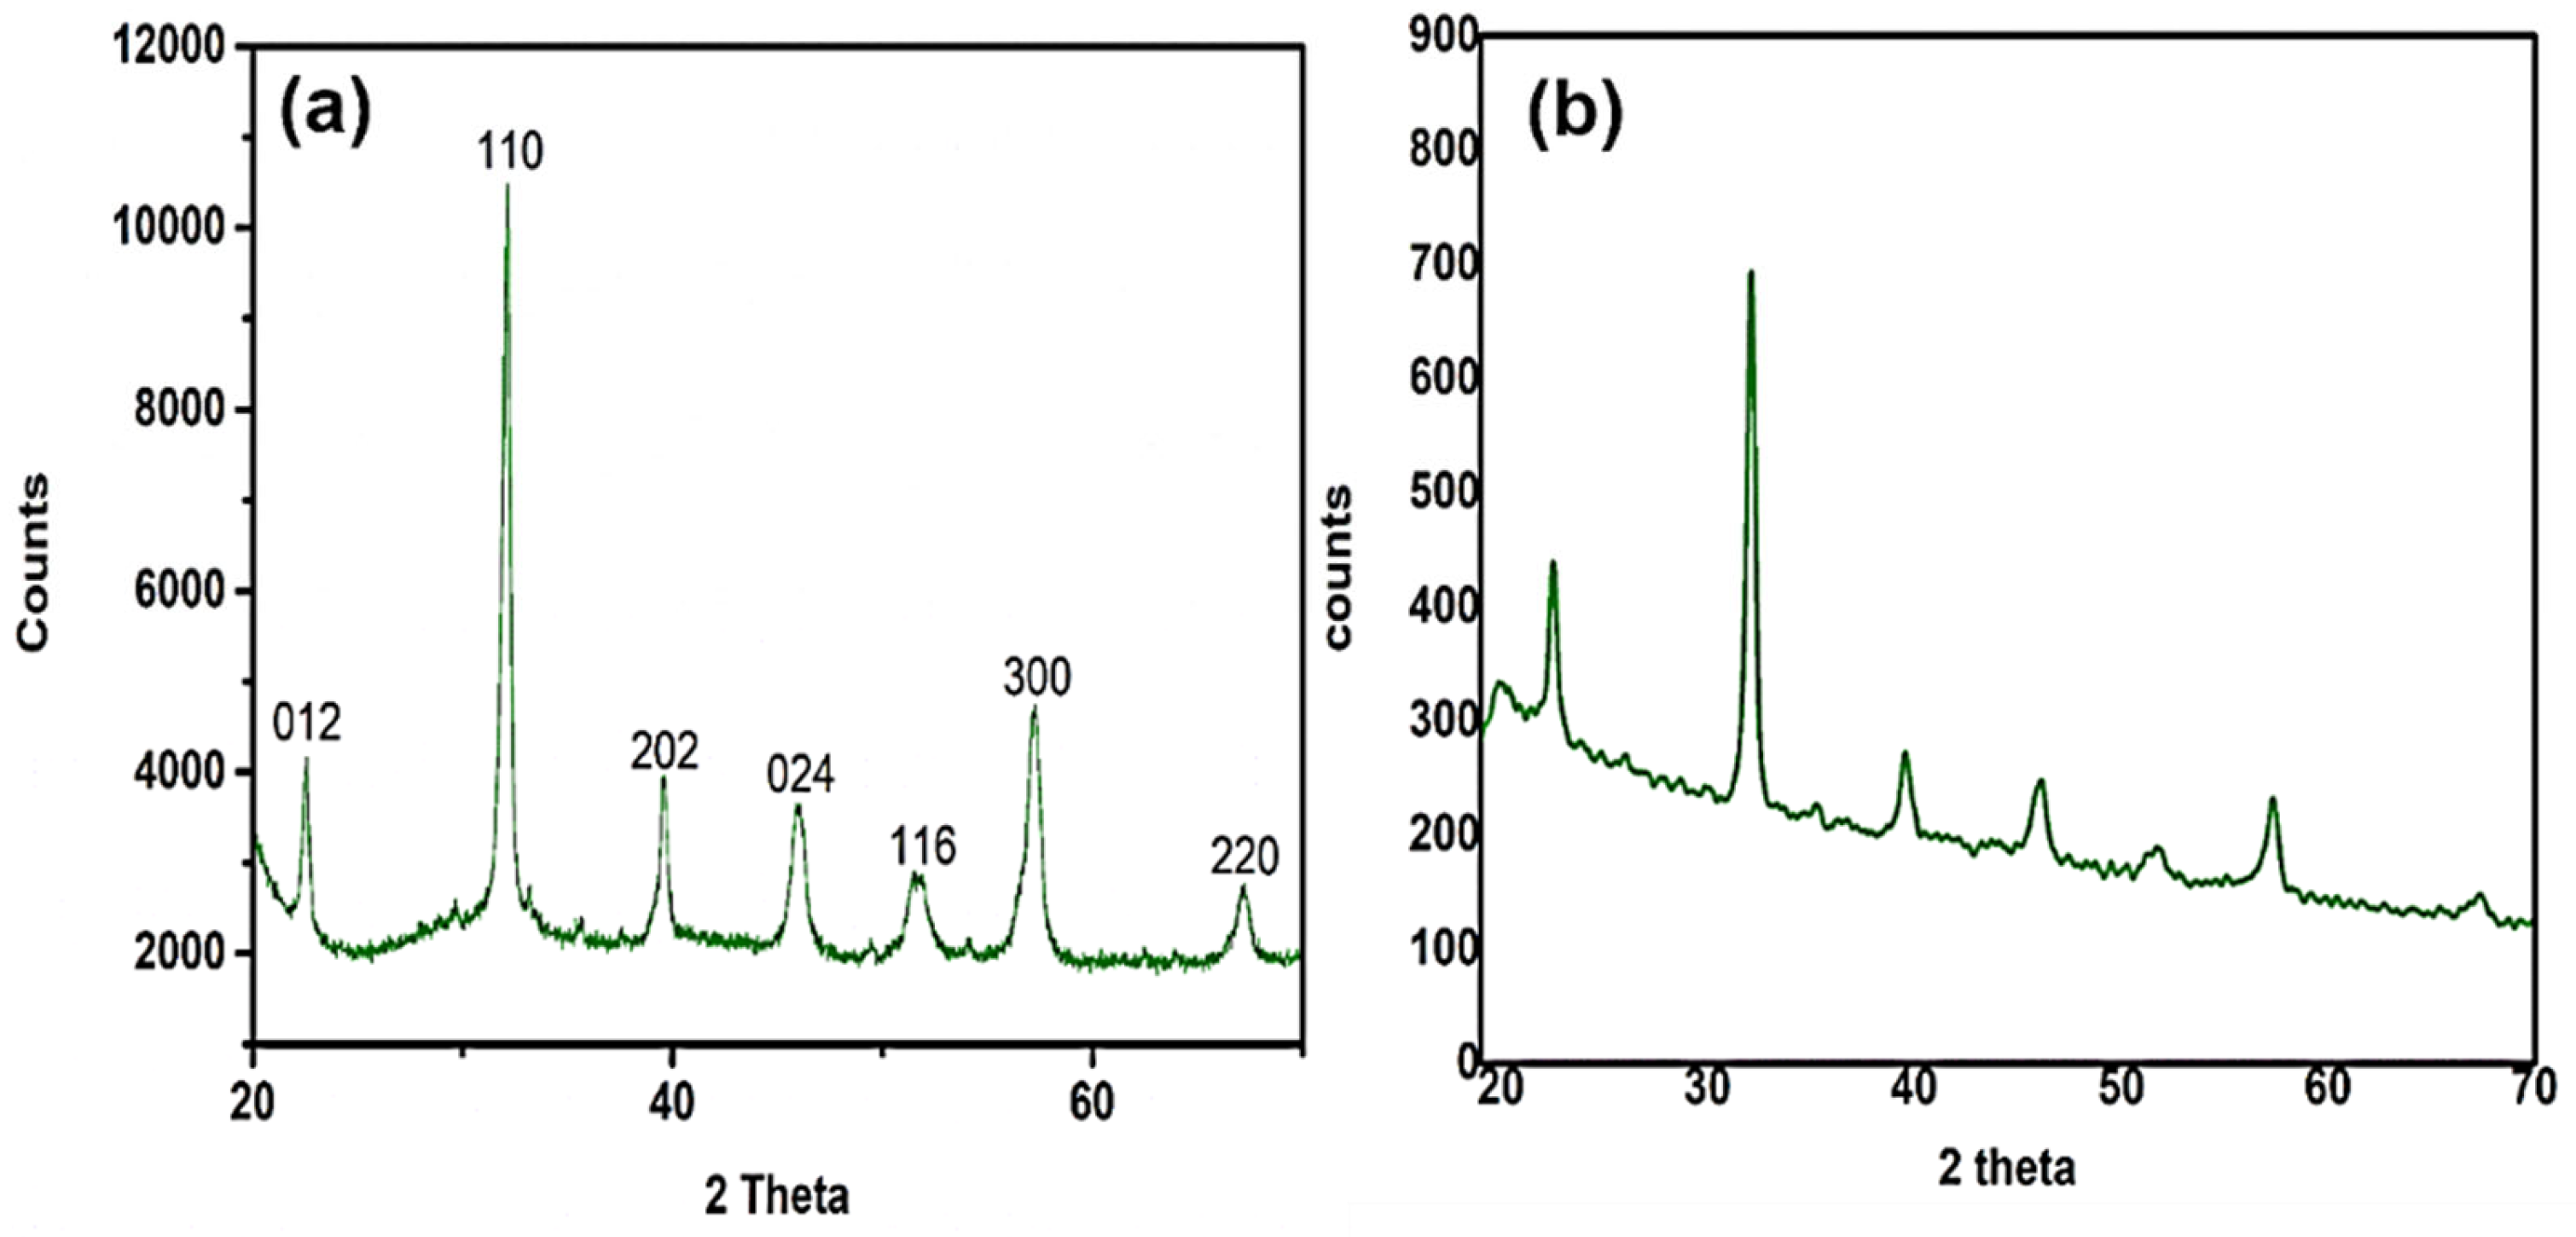
X-ray diffraction was also performed on the prepared samples to analyze the crystal structure, phase purity, and crystalline nature of the product. From the XRD analysis, BFO nanoparticles were found to have a highly crystalline deformed rhombohedral shape. From the XRD pattern obtained, the diffraction peaks of the photocatalyst existing at 2θ values of 22.48°, 32.12°, 39.56°, 45.89°, 51.67°, 57.12°, and 67.18° are in agreement with JCPDS 01-073-0548. According to Azmy et al. (2017) [
23], the peaks correspond to the pure rhombohedral phase BFO Miller’s indices of (0 1 2), (1 1 0), (2 0 2), (0 2 4), (1 1 6), (3 0 0), and (2 2 0) respectively. It is worth noting that the highest point is (1 1 0). No corresponding peak impurities were observed in the plot of counts against 2θ.
Figure 7a shows that the BFO nanoparticles created using the polysaccharide bio-templated technique are of high purity. The pattern of X-ray diffraction of CBB powder is shown in
Figure 7b. The diffraction peaks are observed at 2θ = 22.49°, 32.10°, 39.49°, 46.13°, 51.68°, 57.37°, and 67.40°, corresponding to major diffracted signals of the perovskite structure of BiFeO
3 in
Figure 7a. XRD pattern of CBB is similar to BFO nanoparticles as the synthesis does not change the crystal structure of BiFeO
3.
2.5. N2 Adsorption–Desorption Isotherm Analysis
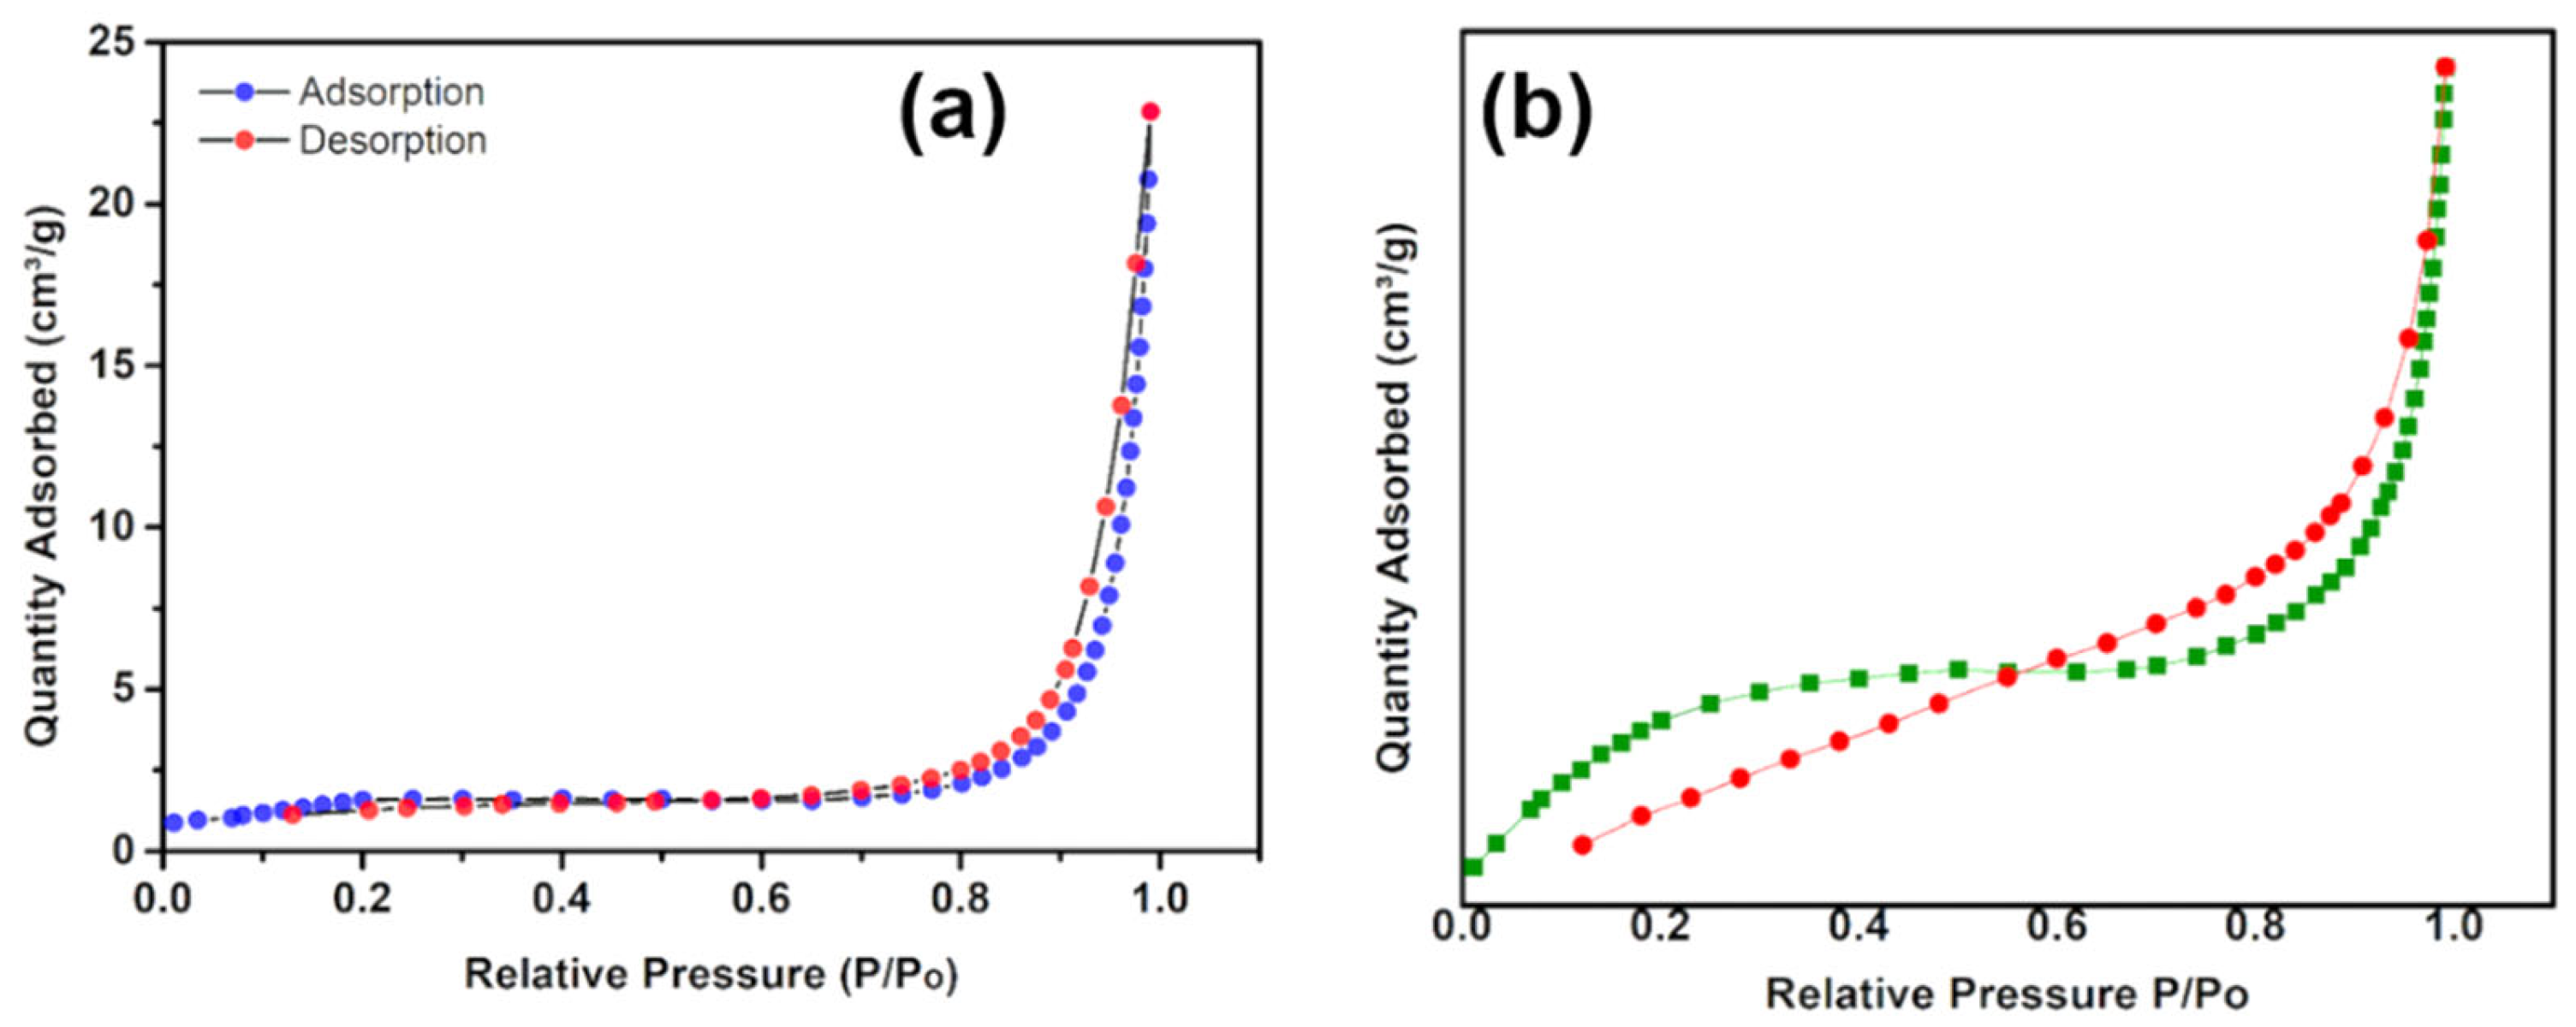
Figure 8a,b depicts the nitrogen sorption isotherm of BFO and CBB nanocomposite. According to Sepahvand et al. (2019) [
24], the isotherms exhibit type IV and possess H3 hysteresis loop classification, indicating the cylindrical pore geometries of mesoporous structure [
25]. We can deduct from the classification that the sample’s pore types are dominated by mesoporous within pores ranging in size from 2 to 50 nm. The H
3 loop hysteresis also emphasizes that the plate-like particles in BFO aggregate form slit-shape pores. When the relative pressure, P/P
o, is less than 0.1, evidence of the absence of micropores can be seen on the isotherm plot. The filling of the mesoporous pores is depicted by the significant increase in nitrogen adsorption value from P/P
o at 0.82 to 0.98.
Furthermore, the BET surface area of the materials was calculated and is presented in
Table 1. The surface area of the sample was determined using the BET method and the area covered by each adsorbed nitrogen gas molecule was known. From the range of relative pressure of 0.01 to 0.10, the linear plot of 1/[Q(P
o/P − 1)] against relative pressure is obtained and analyzed. Thus, the BET surface area (SBET) can be determined from the formula below:
2.6. Photocatalytic Degradation of Ciprofloxacin Using the CBB Composite
Photocatalysis is part of the advanced oxidative processes, widely used in the photodegradation of toxic products. It is a process in which a chemical reaction is accelerated that can absorb ‘quanta’ of light with specific wavelengths. The photocatalysis mechanism occurs when it is exposed to an energy greater than its band gap energy, causing the excitation of electrons, which are conducted from the valence band to the conduction band. As a result, electrons are formed in the conduction band, as a good reducing agent, and holes in the valence band, as a strong oxidizing agent.
2.6.1. Ratio of BFO/Biochar
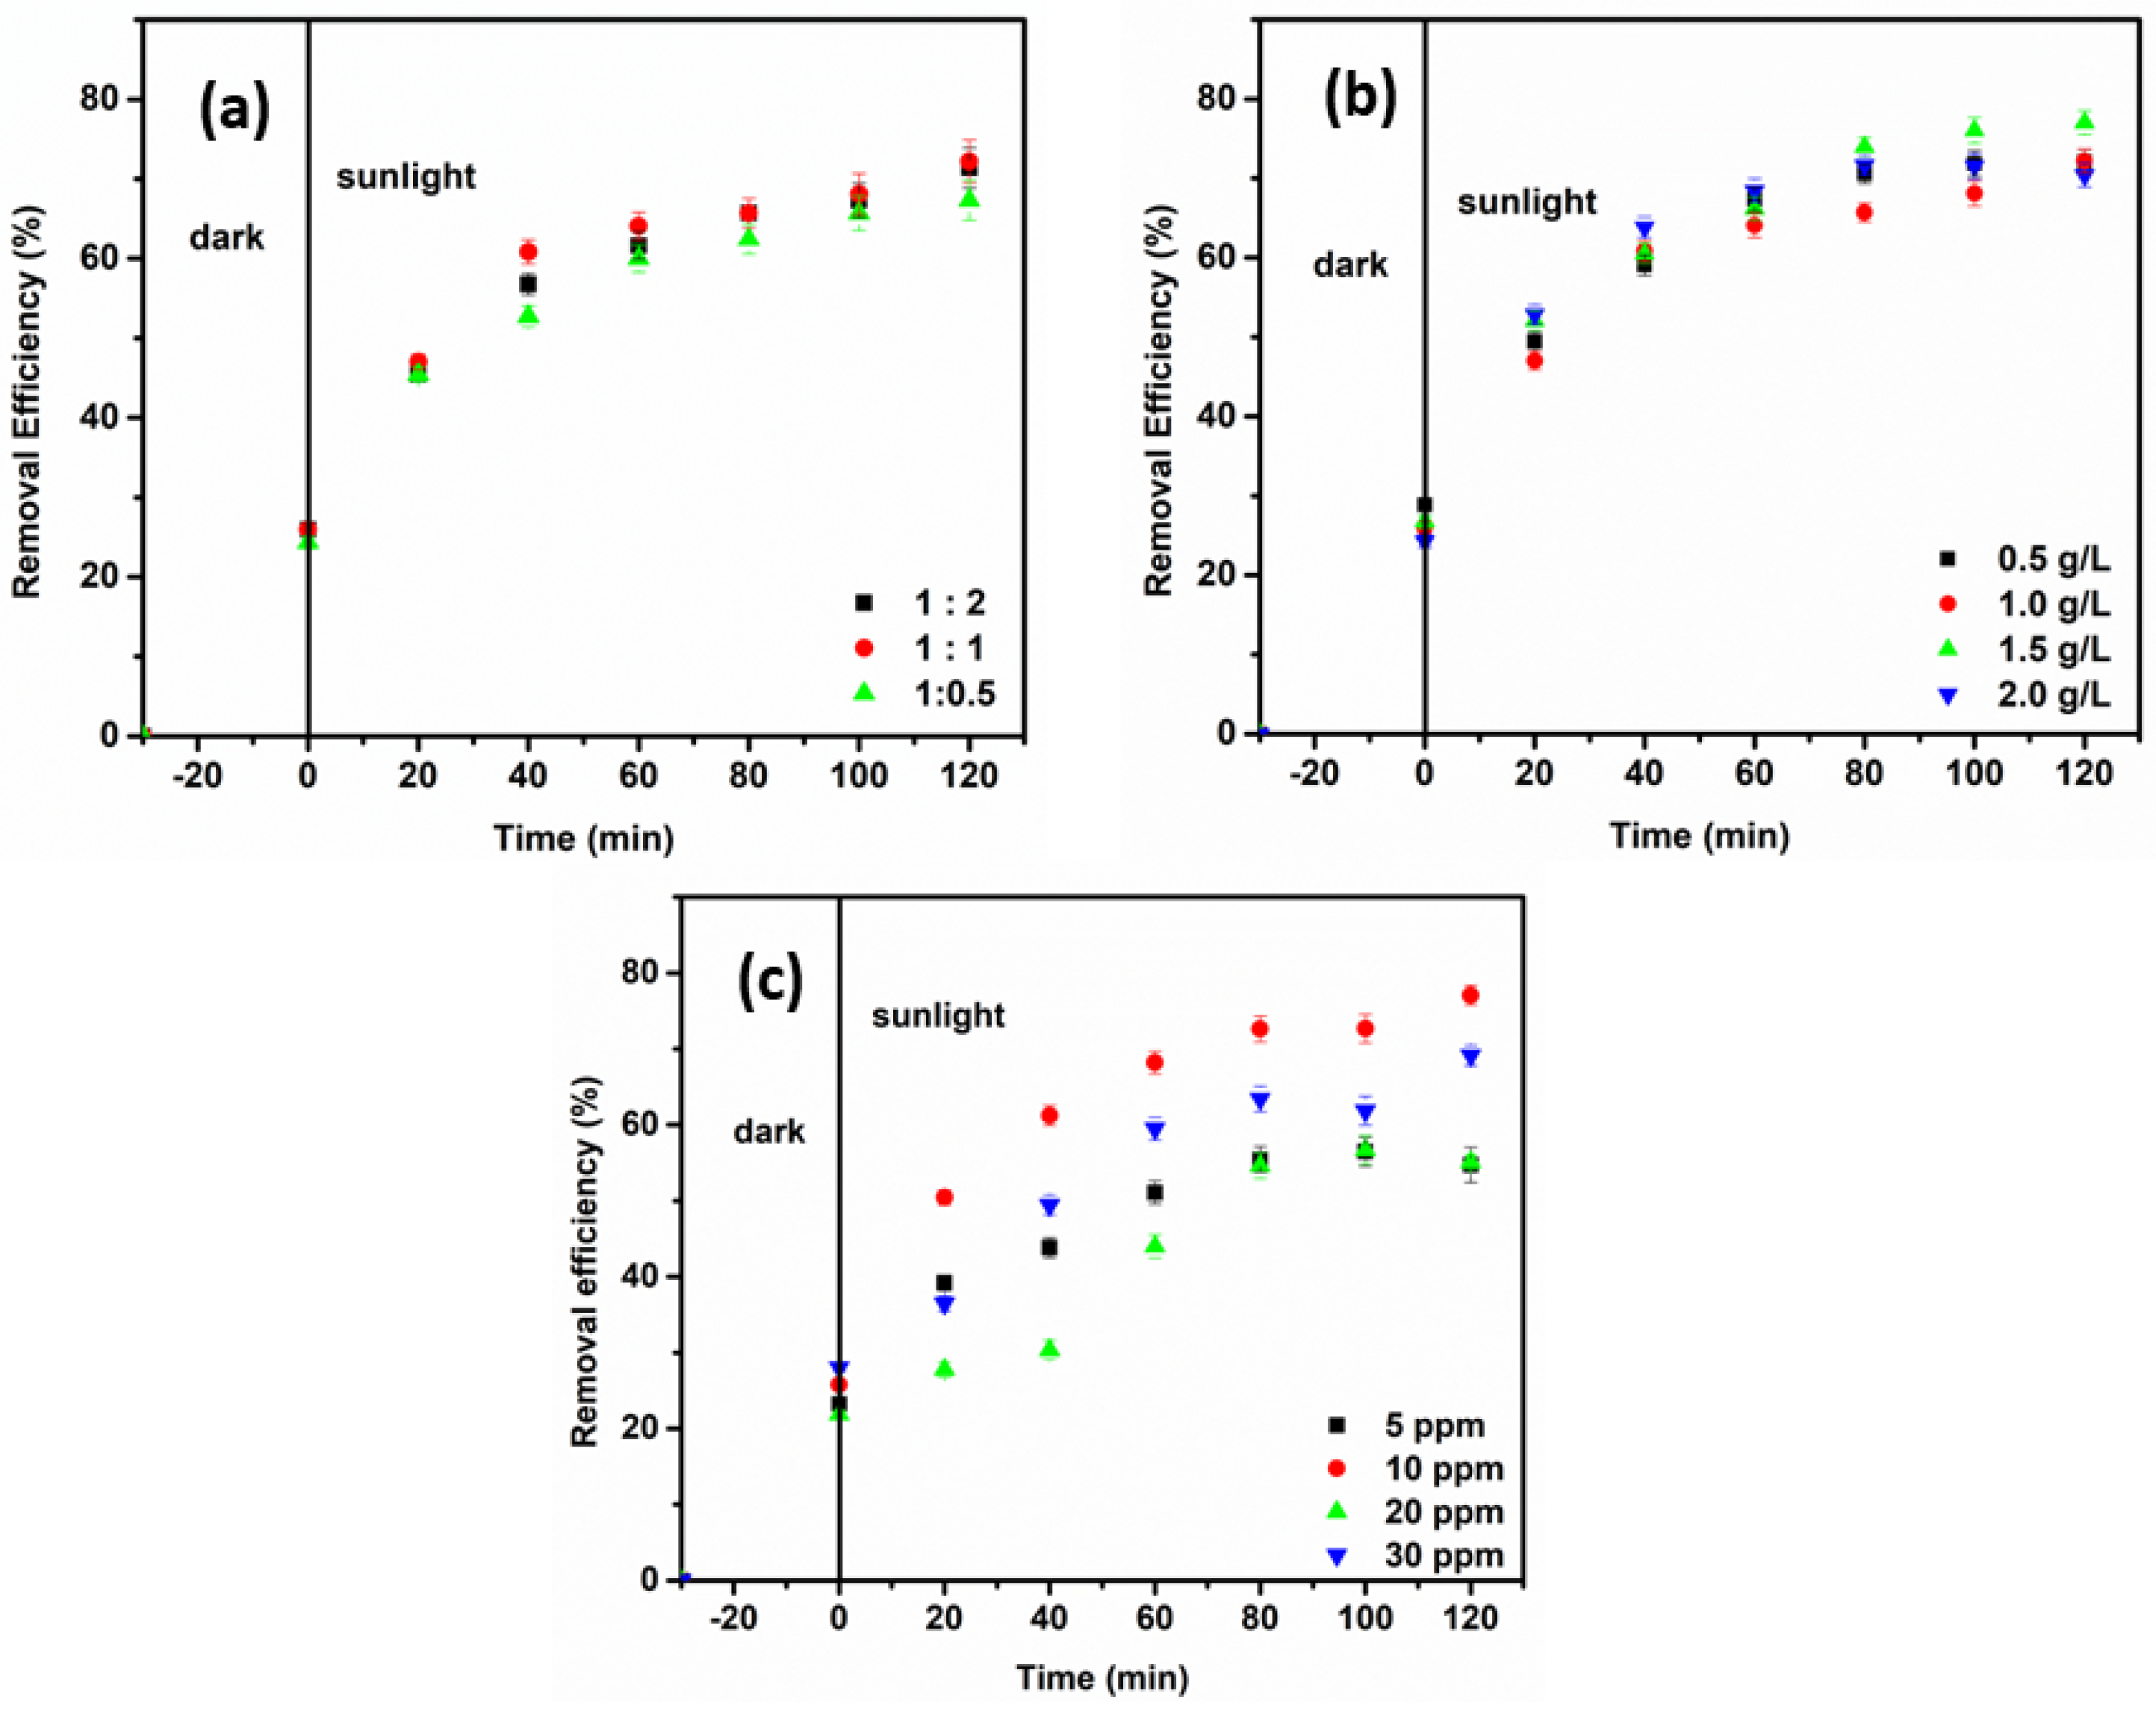
The performance of composite BFO/biochar (CBB) photocatalyst on the degradation of ciprofloxacin (CIP) was tested under different parameters, as shown in
Figure 9a–c. The first parameter investigates how the composite ratio of BFO to biochar works in a 10 ppm CIP solution for 2 h and 30 min. This parameter is very essential as it determines which ratio works best for the removal of CIP. In this study, the amount of BFO remained unchanged, while the amount of biochar increased steadily with the different ratios of 1:0.5, 1:1, and 1:2, respectively, as shown in
Figure 9a. According to Zhou et al. (2020) [
26], the synthesis of biochar-based nanocomposites enhances the level of surface functional groups, increases pore properties, and imparts magnetic separation capabilities and catalytic properties for the degradation and treatment of wastewater. From the results tabulated in
Table 2, the increase in biochar composition from 0.5 to 1.0 shows an increase in the removal efficiency of CIP from 67.32% to 72.19%. However, for the composite CBB of 1:2, the removal efficiency of CIP decreased slightly to 71.38%. The study shows that the dark reaction boosted approximately 25% of the removal efficiency of CIP at different ratios of BFO to biochar. This occurrence could be explained by the fact that the presence of biochar contributed to the adsorption of CIP, whereas BFO had a low adsorption ability to CIP without sunlight and synergized better when expose to visible light. The best composite ratio of CBB for the photocatalytic degradation of CIP was determined to be 1:1.
2.6.2. Effect of Catalyst Dosage
The second parameter evaluated during the study is the catalyst dosage, as shown in
Figure 9b. In this parameter, the optimum amount of catalyst for the removal of the antibiotic was determined from 0.5, 1.0, 1.5, and 2.0 g/L. The previous parameter showed that the best ratio of BFO to biochar is 1:1. Thus, in this parameter, CBB with a ratio of 1:1 is used. At the lowest CBB dosage of 0.5 g/L, the removal efficiency of CIP is 72.23%. However, from the results tabulated in
Table 3, the increase in CBB dosage from 1.0 to 1.5 g/L increased the removal efficiency of CIP from 72.19 to 77.19%. The increasing trend is due to the sufficient and suitable amount of catalyst present for which more electrons can be excited from the valence to the conduction band as they absorb photons from sunlight. Consequently, more radicals necessary for CIP breakdown emerge, causing the reaction rate to increase. On the contrary, the removal efficiency starts to decrease to 70.40% as the catalyst dosage increases to 2.0 g/L. Thus, the CIP solution that contains the highest dosage of CBB photocatalyst shows the lowest removal efficiency. The possible explanation for this phenomenon is that, when the dosage of CBB is increased gradually from its optimal value, the turbidity of the solution will also increase. As a result, the light cannot penetrate the solution effectively, thus halting the photocatalytic degradation. The best dosage of CBB for the photocatalytic degradation of CIP was determined to be 1.5 g/L. The removal of CIP after 120 min of sunlight exposure was 77% using this CBB dosage.
2.6.3. Effect of the Initial Concentration of Ciprofloxacin
The third parameter evaluated during the study is the initial concentration of CIP, as shown in
Figure 9c. The previous parameter was tested using CIP with a concentration of 10 ppm. In this parameter study, the optimal ratio of BFO to biochar and catalyst dosage is used with a total reaction time of 2 h and 30 min. The initial concentration of pollutants will affect the ability of the photocatalyst to function optimally. From the data in
Table 4, the removal efficiency of CIP increases from 54.72% to 77.08% as the initial concentration of the antibiotic solution increases from 5 ppm to 10 ppm. CIP with a concentration of 10 ppm shows 77% removal efficiency after 2 h of irradiation under the sunlight. Contrarily, when the initial concentration of the antibiotic increases to 20 ppm and 30 ppm, the removal efficiency of CIP decreases to 55.11% and 69.13%, respectively. The reason for this decreasing trend of removal efficiency is probably the higher number of CIP molecules present when a higher concentration of CIP is used. However, the anomalous result, as demonstrated by the CIP concentration of 30 ppm, was expected to result in a removal efficiency of less than 55%. In theory, more CIP molecules adsorb on the surface of the photocatalyst when the initial concentration of CIP increases, as there is a higher ratio of pollutant molecules present compared with the active photocatalyst sites available at any time during the reaction progress. As a result, light scattering occurs, reducing light transmission.
2.6.4. Kinetic Study
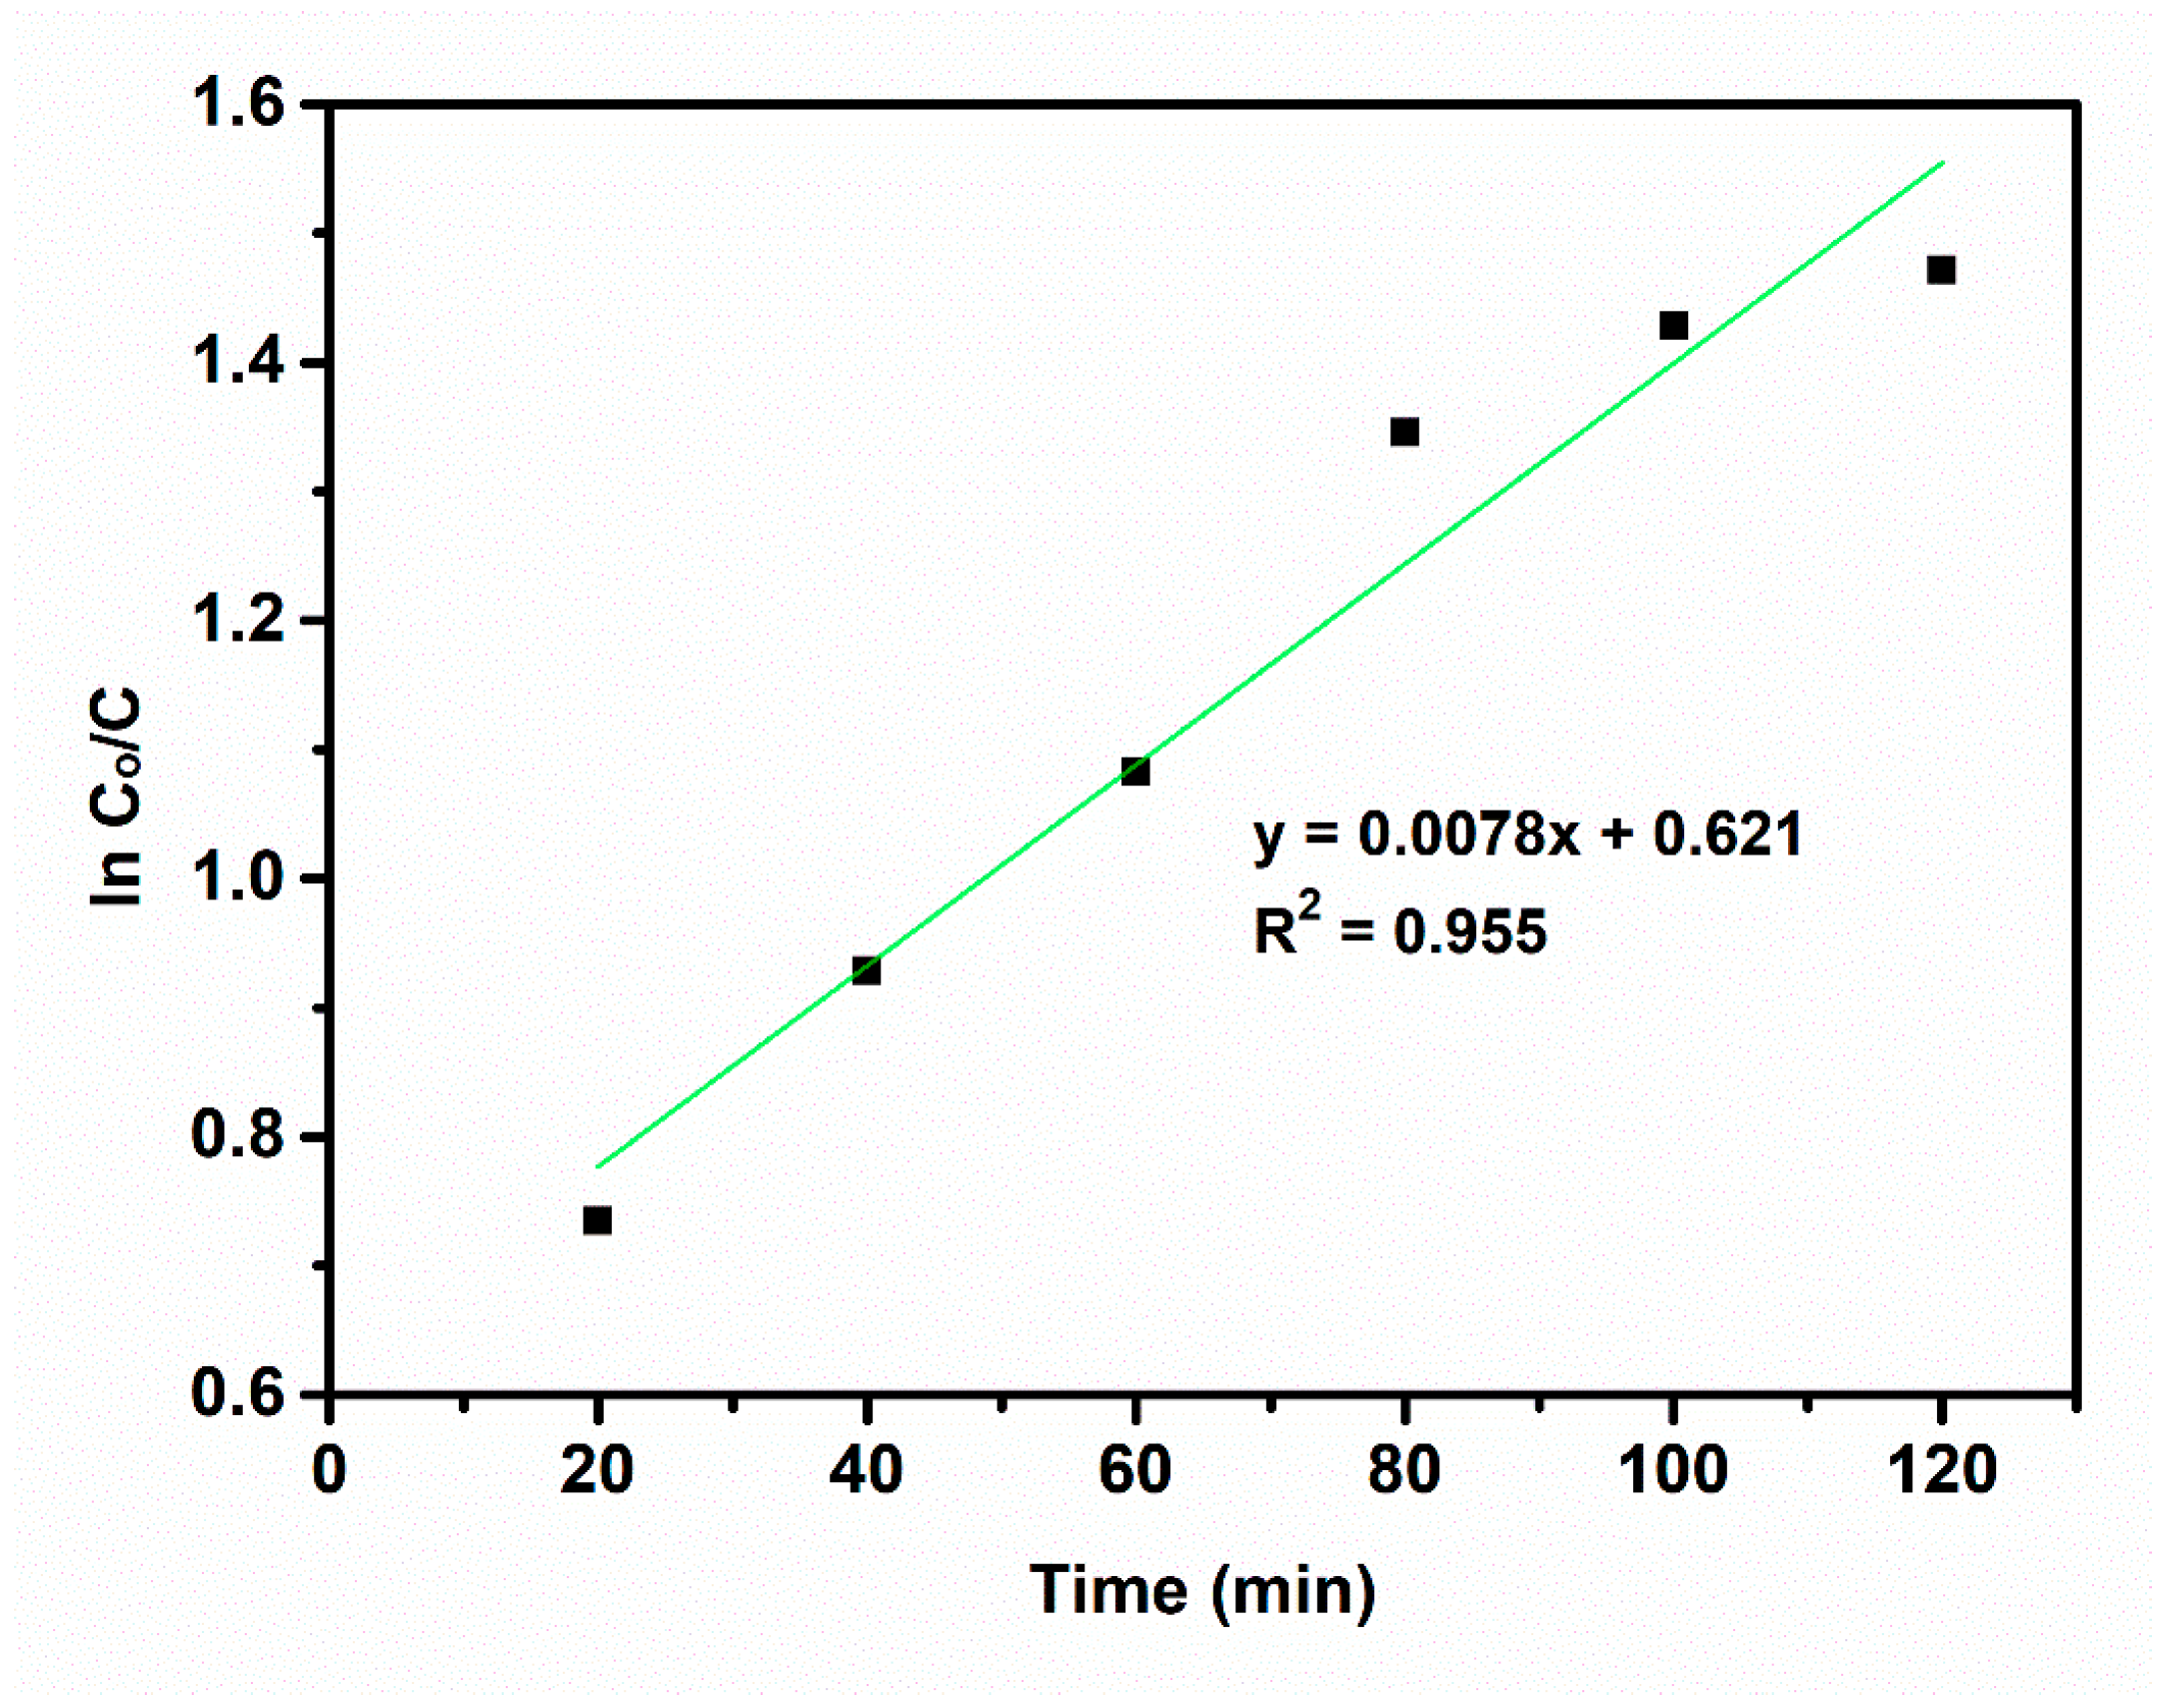
The Langmuir–Hinshelwood model was used to investigate the reaction kinetics for photocatalytic degradation of CIP. Many researchers approximated the model to the first-order expression to explain the elimination of antibiotic pollutants under direct sunlight. Profoundly, heterogeneous catalyst reactions can include a variety of complex steps such as physical adsorption of the pollutant on the photocatalysts’ surface, a surface reaction that progresses to antibiotic degradation in the presence of sunlight, and the formation of additional by-products [
27]. The plot of the LH model is shown in
Figure 10. The value of the rate constant, k, for the model can be obtained directly from the slope of the plot as follows:
where C
0 is the initial CIP concentration, C
t is the CIP concentration at time, and t is the time taken for photodegradation in minutes. According to the LH model plot and value achieved, the removal of CIP antibiotics best fits the first order of the LH model perfectly with a linear correlation of 0.955. As an outcome, we can deduce that the photocatalytic degradation pathway is dominant in the elimination of CIP antibiotics (k
app = 0.0078 min
−1).
2.6.5. Mineralization Study
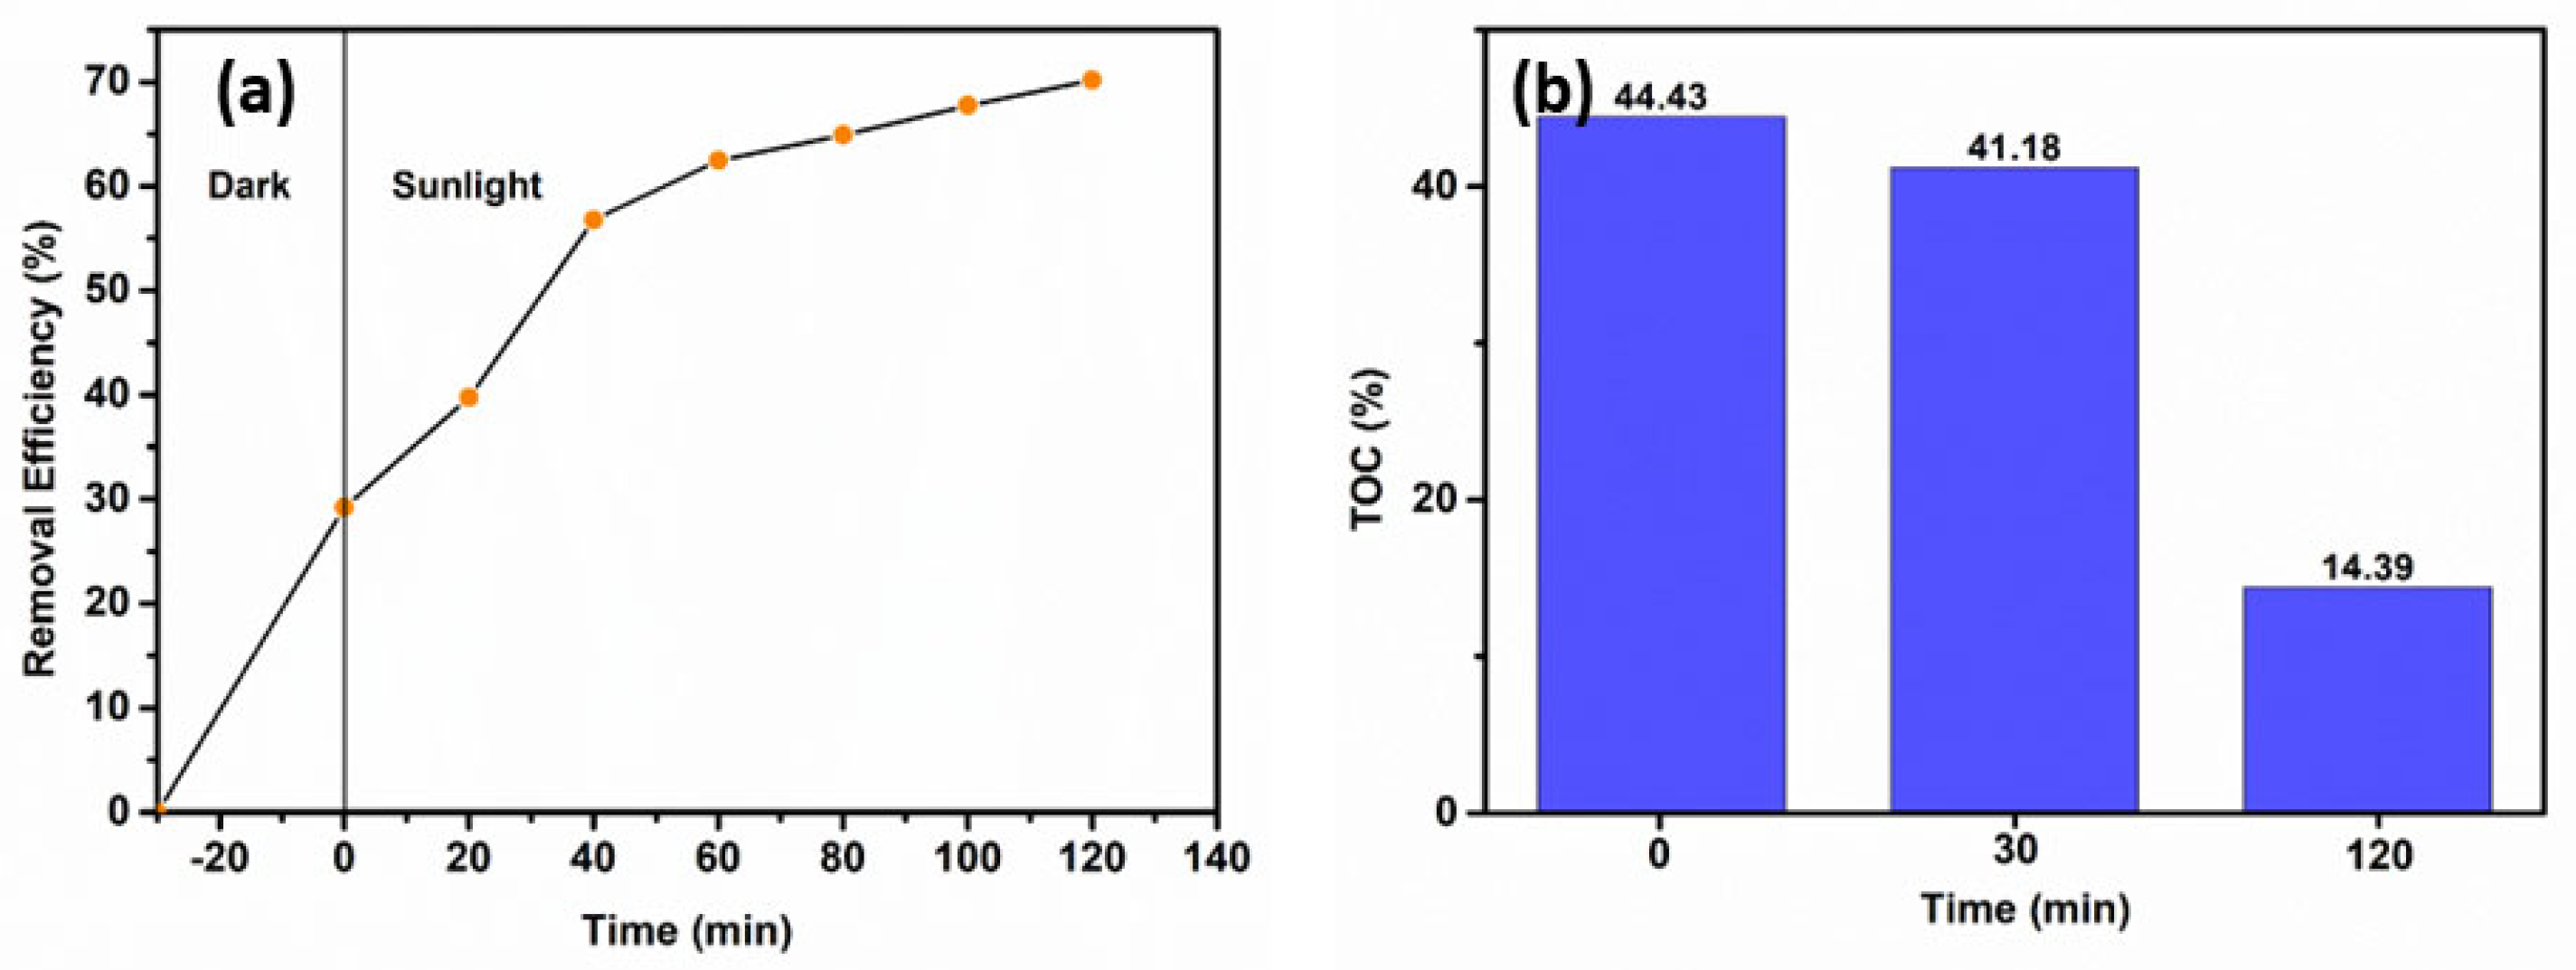
The total organic carbon in CIP solution was examined after irradiation under sunlight for 2 h. From the plot in
Figure 11a,b, after exposure of sunlight for 120 min, 70.16% of CIP was degraded by CBB. In contrast, the removal efficiency of organic carbon reduced to 14.39% from 44.43% before treatment, as shown in
Figure 11b. A low percentage of total organic content after treatment by CBB confirmed the efficiency of composites to degrade the pollutants and it underwent mineralization and the formation of organic intermediates after the photocatalysis reaction.
3. Materials and Methods
3.1. Materials
Bismuth nitrate pentahydrate, Bi (NO3)3.5H2O (molar mass = 485.07 g/mol), and iron (III) nitrate pentahydrate, Fe (NO3)3.9H2O (molar mass = 403.999 g/mol), from Sigma Aldrich (St. Louis, MO, USA), as well as carrageenan powder, were used without further purification. Sodium hydroxide, NaOH, used for pH adjusting was of analytical grade. Deionized water was used for dissolving the bismuth nitrate and iron (III) nitrate powder. Carrageenan powder was dissolved using distilled water. Chitosan ((C6H11NO4) N, Fluka BioChemika, Buchs, Switzerland), glutaraldehyde (C5H8O2, AR grade 65% solution), and acetone (C3H6O, Sigma Aldrich, St. Louis, MO, USA) were used in the preparation of composite BFO/biochar. Axial acetic acid (CH3COOH) was diluted with deionized water to form a 1% acetic acid solution.
3.2. Synthesis of Bismuth Ferrite Nanoparticles
The synthesis of BFO nanoparticles followed the bio-templated method, as proposed by Satar et al. (2016) [
28]. Firstly, 2.8 g of bismuth nitrate pentahydrate, (Bi (NO
3)
3·5H
2O), and 4.04 g of iron (III) nitrate nonahydrate, (Fe (NO
3)
3·9H
2O), were added and dissolved in a beaker with deionized water. Next, about 2.0 g of carrageenan powder was dissolved in a beaker with distilled water and homogenized with a magnetic stirrer. After that, 10 mL of (Bi (NO
3)
3·5H
2O and (Fe (NO
3)
3·9H
2O) standard solution was mixed with 40 mL of carrageenan solution. Then, 8 mL of sodium hydroxide solution was added into the mixture. To achieve pH 10, another 1 mL of NaOH was added dropwise. Next, the resulting solution was dried in the oven at 80 °C overnight after 2 h of stirring. The dried sample was then calcined in the furnace for 2 h at 550 °C. Lastly, the remaining solid was washed several times with deionized water and then dried at 80 °C for 2 h.
3.3. Synthesis of Biochar
Biochar was prepared from an oil palm empty fruit bunch (OPEFB). The OPEFBs were washed, cut into small pieces, and dried at 105 °C for 24 h in the oven. Then, the dried OPEFBs were loaded into a vertical reactor and heated in a tube furnace under N2 to 700 °C of pyrolysis temperature with a ramp of 50 °C/min for 1 h. The isothermal condition was maintained for 90 min until the sample was then cooled down to room temperature. Then, the obtained biochar was ground and sieved. The sample was stored in a sealed storage container before further analysis.
3.4. Synthesis of Coupled BFO/Biochar Nanomaterial (CBB)
Synthesis of CBB was achieved by crosslinking chitosan via glutaraldehyde [
25]. First, 0.6 g chitosan was magnetically stirred at 300 rpm and dissolved in 60 mL of 1% acetic acid in a 100 mL beaker. Then, the obtained BFO and biochar were added in different ratios of 1: 2, 1: 1, and 1: 0.5 into the dissolved chitosan solution and magnetically stirred at 300 rpm. After that, 6 mL of 1% glutaraldehyde was added and stirred at 50 °C until gel precipitation. Then, gel precipitation followed for 12 h at 25 °C to complete the reaction. The pH of the gel solution was adjusted to 9.0 with 1M NaOH solution. Then, the gel was heated in a water bath for 2 h at 50 °C and 1.2 mL of acetone was added. Finally, the solution was rinsed and the supernatant was removed. The precipitate was dried and ground to obtain CBB.
3.5. Photocatalytic Degradation of Ciprofloxacin
The photocatalytic degradation of ciprofloxacin (CIP) in an aqueous solution was investigated using BFO nanoparticles. The volume of CIP used in each parameter study was fixed at 50 mL. Before exposing the apparatus to sunlight irradiation, the CIP-containing solution was stirred in the dark room for 30 min to achieve adsorption–desorption equilibrium. After mixing, the suspension was exposed to sunlight irradiation (~120 kLux illuminance) under standard ambient conditions. The experimental study was performed for a 2 h period, excluding the ‘dark’ reaction. The removal of CIP was observed at a maximum wavelength of λ = 275 nm. Sampling was performed in 20 min intervals and the samples were analyzed with a Shimadzu UV-2600 UV/Vis spectrophotometer (Kyoto, Japan). The test was repeated three times for each parameter to obtain an average value. The following equation was used to calculate the percentage removal of CIP antibiotics:
3.5.1. Ratio of BFO/Biochar
The first parameter implicates the determination of the ratio of BFO to biochar for optimum efficiency of CBB in photocatalytic degradation. BFO to biochar ratios of 1:0.5, 1:1, and 1:2 were investigated. CIP with a concentration of 10 ppm was used in this experiment without any pH adjustments.
3.5.2. Catalytic Dosage
The second parameter study was the determination of the optimal CBB photocatalyst dosage. The amount of CBB used was 0.5, 1.0, 1.5, and 2.0 g/L. In this parameter study, a CIP solution of 10 ppm concentration was used without any pH adjustment. The optimum CBB ratio was used in this study.
3.5.3. Initial Concentration of Ciprofloxacin
The third parameter was to investigate the effect of the initial concentration of CIP antibiotic on the removal efficiency by CBB photocatalyst. The concentrations used at the start of the photocatalytic test were 5, 10, 20, and 30 ppm. The optimum CBB ratio and dosage of CIP solution were applied in this study.
3.6. Characterization of BiFeO3 Nanocatalyst and CBB Composite
The characterization of the synthesized BiFeO3 (BFO) nanoparticles and CBB composite were carried out using various instruments techniques. The powdered BFO and CBB composite were analyzed for X-ray diffraction patterns (XRD) using a PANalytical X’Pert PRO θ–2θ (Malvern, UK) using a Cu source (Kα, λ = 0.15406 Å). The morphology and topographic features of the photocatalysts were examined with FEI-QUANTA FEG 650 (Hillsboro, OR, USA) at accelerating voltages of 10 and 30 kV. The energy dispersive X-ray system Oxford instrument X-MAX (EDX) (Abingdon, UK) analysis was used to identify the elemental composition of the synthesized BFO and CBB composite. The measurement of electronic absorption spectra using diffuse reflectance spectroscopy was performed with a UV/Vis spectrophotometer (LAMBDA 25) (PerkinElmer, Waltham, MA, USA). Furthermore, the functional group present in BFO was examined using Perkin Elmer’s System 2000 IR (Waltham, MA, USA). The sample was placed on the sample holder and analyzed under a wavenumber range of 4000 to 400 cm−1. Finally, the surface features and porosity of synthesized BFO were studied with the aid of Micromeritics ASAP 2020 Surface Area (Norcross, GA, USA) and Porosity Analyser with nitrogen gas as an adsorbate.
4. Conclusions
In summary, this study was performed in a series of experimental studies that included the preparation and instrumental characterizations of BiFeO3, biochar, and BFO/biochar coupled magnetic (CBB) nanomaterial aimed at the mineralization of ciprofloxacin (CIP) antibiotic under sunlight. A facile and cost-effective BFO photocatalyst, biochar, and CBB composite were successfully prepared using the polysaccharide bio-templated method, pyrolysis, and cross-linking method, respectively. FTIR, UV-DRS, SEM-EDX XRD, and BET analysis were used to investigate the purity as well as the significant chemical and physical properties of the materials. According to the UV-DRS analysis, the band gap energies of BFO and CBB photocatalysts are 2.20 and 2.17 eV, respectively. Thus, it has been demonstrated that combining semiconductor photocatalysts with biochar reduces the band gap of semiconductor photocatalysts. The photocatalytic activity of CBB is greatly enhanced because of the unique physicochemical properties of biochar. Biochar can support many nanoparticles, increase the number of active sites on the photocatalyst, and lower the band gap energy by cross-linking carbon with BiFeO3.

 ,
, 


