Article

Surface Modification of GdMn2O5 for Catalytic Oxidation of Benzene via a Mild A-Site Sacrificial Strategy

1
School of Environmental Science and Engineering, Tianjin University, Tianjin 300350, China
2
National Engineering Laboratory for Mobile Source Emission Control Technology, Tianjin 300300, China
*
Author to whom correspondence should be addressed.
Catalysts 2022, 12(10), 1267; https://doi.org/10.3390/catal12101267
Submission received: 20 September 2022 / Revised: 13 October 2022 / Accepted: 14 October 2022 / Published: 18 October 2022
(This article belongs to the Section Environmental Catalysis)

Abstract

:
Thermal catalytic oxidation technology is an effective way to eliminate refractory volatile organic pollutants, such as Benzene. Nevertheless, a high reaction temperature is usually an obstacle to practical application. Here, GdMn2O5 mullite (GMO-H) catalyst with disordered surface Gd-deficient and oxygen-vacancy-rich concentrations was synthesized via a controllable low-temperature acid-etching route. Results show that the preferentially broken Gd-O bond is conducive to exposing more Mn-Mn active sites, which Gd species covered. The affluent surface oxygen vacancies supply sufficient adsorption sites for oxygen molecules, facilitating the oxygen cycles during Benzene catalytic oxidation. Furthermore, surface exposed Mn3+ species were oxidized to Mn4+, which is beneficial to increase catalytic activity at a lower temperature. Compared with the conventional GdMn2O5, the reaction temperature for removing 90% Benzene over GMO-H was dropped from 405 to 310 °C with WHSV of 30,000 mL g−1 h−1. Significantly, during a 72 h catalytic test, the catalytic activity remains constant at 90% of the Benzene removal at 300 °C, indicating excellent activity stability. This work reported an efficient approach to preparing manganese-base mullite thermal catalyst, providing insight into the catalytic oxidation of Benzene.

Graphical Abstract

1. Introduction

The prosperity of global industry has inevitably brought about energy crises and environmental pollution, which are issues that demand close attention in order to be resolved [1,2,3,4]. Volatile organic compounds (VOCs) emitted from industrial processes and residential activities are one of the precursors to haze [5,6,7]. Generally, there are two main strategies for the consumption of VOCs: recovery technologies (such as adsorption technology [8,9,10], condensation recovery [11], and membrane separation [12,13]) and destruction technologies (such as catalytic combustion [14,15], biological methods [3,16], and photocatalysis [17,18]). Among them, catalytic oxidation is a promising option due to the advantages of high efficiency, low energy consumption, and no secondary pollution [19]. The critical issue of this technology is to design efficient and stable catalysts. Currently, nanocatalytic materials for pollutants degradation can be mainly divided into noble metal-supported and metal oxide-based catalysts. Generally, noble metal (such as Pt, Pd, and Rh)-supported catalysts are widely used due to their excellent catalytic activity [19], which achieves complete conversion of Benzene at lower temperatures [20,21,22,23]. However, their industrial applications are limited due to their high cost and highly toxic nature. Transition metal oxides (such as Mn, Co, and Ce) catalysts are lower cost and possess better anti-poisoning ability than noble metals, and have attracted considerable attention in recent years [24]. In order to ensure that transition metal oxide catalysts provide a good substitute for noble metal catalysts, more researchers have focused on improving their performance and stability [1].
Aromatic hydrocarbons, a class of volatile organic compounds commonly produced in industrial processes, are considered to be a severe threat to human health and the atmospheric environment. Benzene, Toluene, Ethylbenzene, and Xylene (BTEX) are the most common among them, and are highly toxic and carcinogenic. However, to degrade them requires high temperature because of the stable Benzene ring structure. Although widely reported transition metal oxide catalysts such as spinels, layered double hydroxides (LDHs), perovskites, and other metal oxide-based catalysts can reduce degradation temperature, they are less durable and less resistant to water than noble metal catalysts [1]. In the presence of 7.2% water vapor, the Benzene conversion of the CoMn2AlO-550 catalyst dropped sharply by 16.3% within 8 h at 190 °C [25]. The SSI-LaCoCe catalyst catalyzed the oxidation of Benzene at 500 °C, and the Benzene conversion showed a decreasing trend within 48 h [26]. The ZnCo2O4 catalyst maintained its catalytic activity for 48 h at 500 °C [27]. Therefore, developing highly activated and stable transition metal oxide catalysts remains a great challenge.
Recently, manganese-based mullite-type oxides, such as SmMn2O5 and GdMn2O5, have been considered one potential substitute for noble metal catalysts due to their low cost, good thermal stability, and high efficiency. Mullite has been demonstrated to exhibit remarkable NO oxidation performance at the Mn-Mn dimer active sites, compared with commercial noble metal catalysts [28]. Mn-based mullite, AMn2O5 (A = lanthanide), includes two Mn-centered ligand fields, which are octahedral and pyramidal [1]. This feature satisfies the requirement to be an efficient oxidation catalyst material. The p-d electron hybridization between lattice Mn-O leads to the optimization of the bond strength between Mn and adsorbed O*, which enables the active oxygen on the surface to participate effectively in the reaction [1]. At the same time, studies have shown that in addition to surface active oxygen species, deeper oxygen atoms in GdMn2O5 are relatively stable, which helps to maintain the structure of the catalyst and transform it into a long-life stable catalyst [1]. Therefore, mullite materials show high potential in VOC catalytic oxidation. However, many rare-earth elements tend to cover the manganese sites on the surface of manganese-based mullite, which limits the number of active oxygen species [29]. Therefore, the key to improving mullite catalytic activity is to increase the number of exposed manganese active sites. Since the bond length and energy of the Gd-O bond is longer and lower, respectively, than those of the Mn-O bond, the Gd-O bond will be preferentially attacked during acid etching. Therefore, the selective dissolution strategy of acid etching can remove rare-earth elements to increase the exposure of Mn. Guo et al. [30] obtained GdMnO3/GdMn2O5 catalysts by acid etching of perovskite GdMnO3 at room temperature. Yang et al. [24] obtained rod-like MnO2 by acid etching of YMn2O5 at 90 °C. We chose to surface-modify GdMn2O5 at 40 °C, and the obtained GMO-H catalysts retained the mullite crystalline phase.
In this work, stable GdMn2O5 mullite was surface-modified by a low-temperature acid-etching and selective-dissolution strategy. Characterization by XRD, SEM, TEM, ICP, BET, XPS, H2-TPR, and O2-TPD demonstrated that the acid-etched catalyst was missing part of Gd on the surface and possessed more oxygen vacancies. Compared with the conventional GdMn2O5, the reaction temperature for removing 90% Benzene by using the GMO-H catalyst was reduced by 95 °C, while maintaining the 90% Benzene conversion at 300 °C for 72 h. This was attributed to the exposure of the Mn-Mn active site, accelerated oxygen cycling, and low-temperature reducibility.

2. Results and Discussion

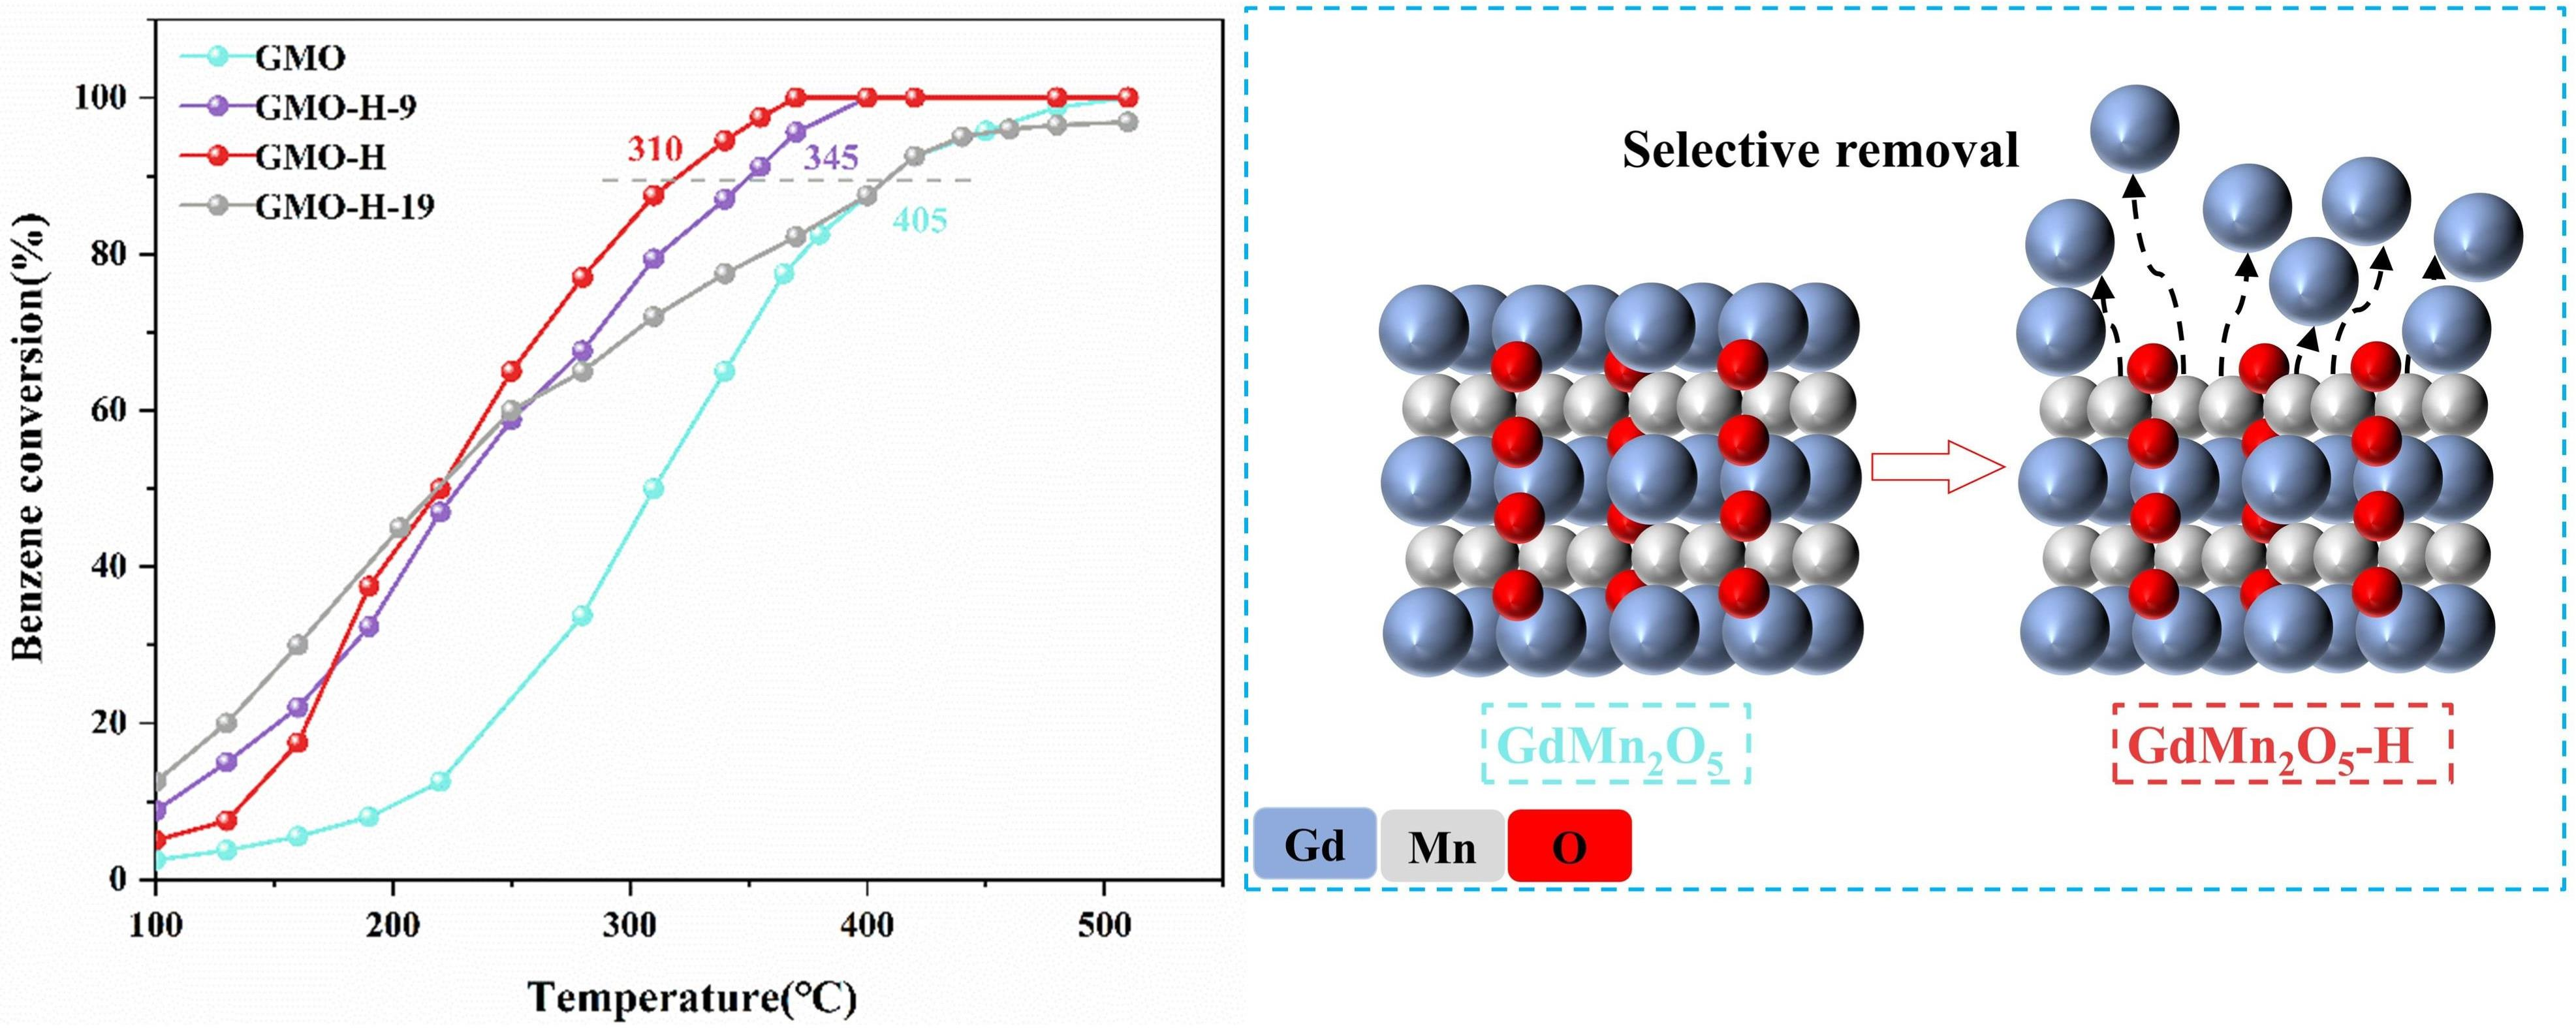
2.1. Crystal Structure

Figure 1 shows the XRD data of GMO, GMO-H-9, and GMO-H. The diffraction peaks of most of the samples can be indexed to the XRD pattern of the standard GdMn2O5 card (JCPDS No. 52-0301). For the three samples, the diffraction peaks around 28° correspond to the (201] crystal plane and the (121] crystal plane of GdMn2O5, the diffraction peak around 31° corresponds to the (211] crystal plane, the diffraction peak around 33° corresponds to the (012] crystal plane, and the 54° diffraction peak corresponds to the (203] crystal plane. The XRD peaks of the acid-etched GMO-H sample do not change significantly compared with the XRD pattern of the original GMO sample, indicating that the sample still maintained mullite phase after acid etching. It is worth noting that the diffraction peaks around 41° and 60° (which were highlighted by rhombus in Figure 1) are slightly shifted for GMO-H, and it is generally considered that lattice distortion has occurred [31,32,33]. Simultaneously, lattice distortion can also be observed from HRTEM images. In addition, the half-widths of the diffraction peaks around 54°, 56°, and 60° are significantly broadened. According to the Scherrer formula [34], the smaller the grain size, the larger the bandwidth, indicating that the grain size of the GMO-H sample became smaller after acid etching.
Interestingly, the mullite structure (AB2O5) cannot be dissolved in HNO3 solution at 40 °C, while the perovskite (ABO3) can be dissolved at room temperature [24]. The main reason may be that the mullite structure is more difficult to form, so the mullite structure is more stable than the perovskite structure. In order not to destroy the stable structure of mullite and to expose more Mn-Mn active sites, acid etching was performed on the samples at a mild condition of 40 °C.
The ICP results (Table 1) showed that the molar ratio of Gd/Mn for GMO-H decreased compared with that of the original sample GMO, indicating that the content of Gd elements in GMO-H decreased and the content of Mn elements increased after acid etching. Combined with the TEM-EDS mapping (Table 1), the molar ratio of Gd/Mn decreased from 0.46 to 0.40 after acid etching. Observing the XPS results (Table 1), the molar ratio of Gd/Mn decreased by 0.4 after acid etching. The results of the trends of the elemental proportions obtained by the three techniques of ICP, TEM-EDS, and XPS are consistent, and their results all indicate an increase in the proportion of Mn elements and a decrease in the proportion of Gd elements in the samples after acid etching. The XRD pattern shows that the mullite structure of the whole sample is almost unchanged after acid etching at 40 °C for 14 h, although the grain size of the sample becomes smaller and the lattice is deformed. It indicates that acid etching can slightly surface-modify the GMO samples and effectively remove the Gd atoms with larger grain size on the surface of GMO samples; thus, more Mn-Mn active sites blocked by Gd atoms are exposed.

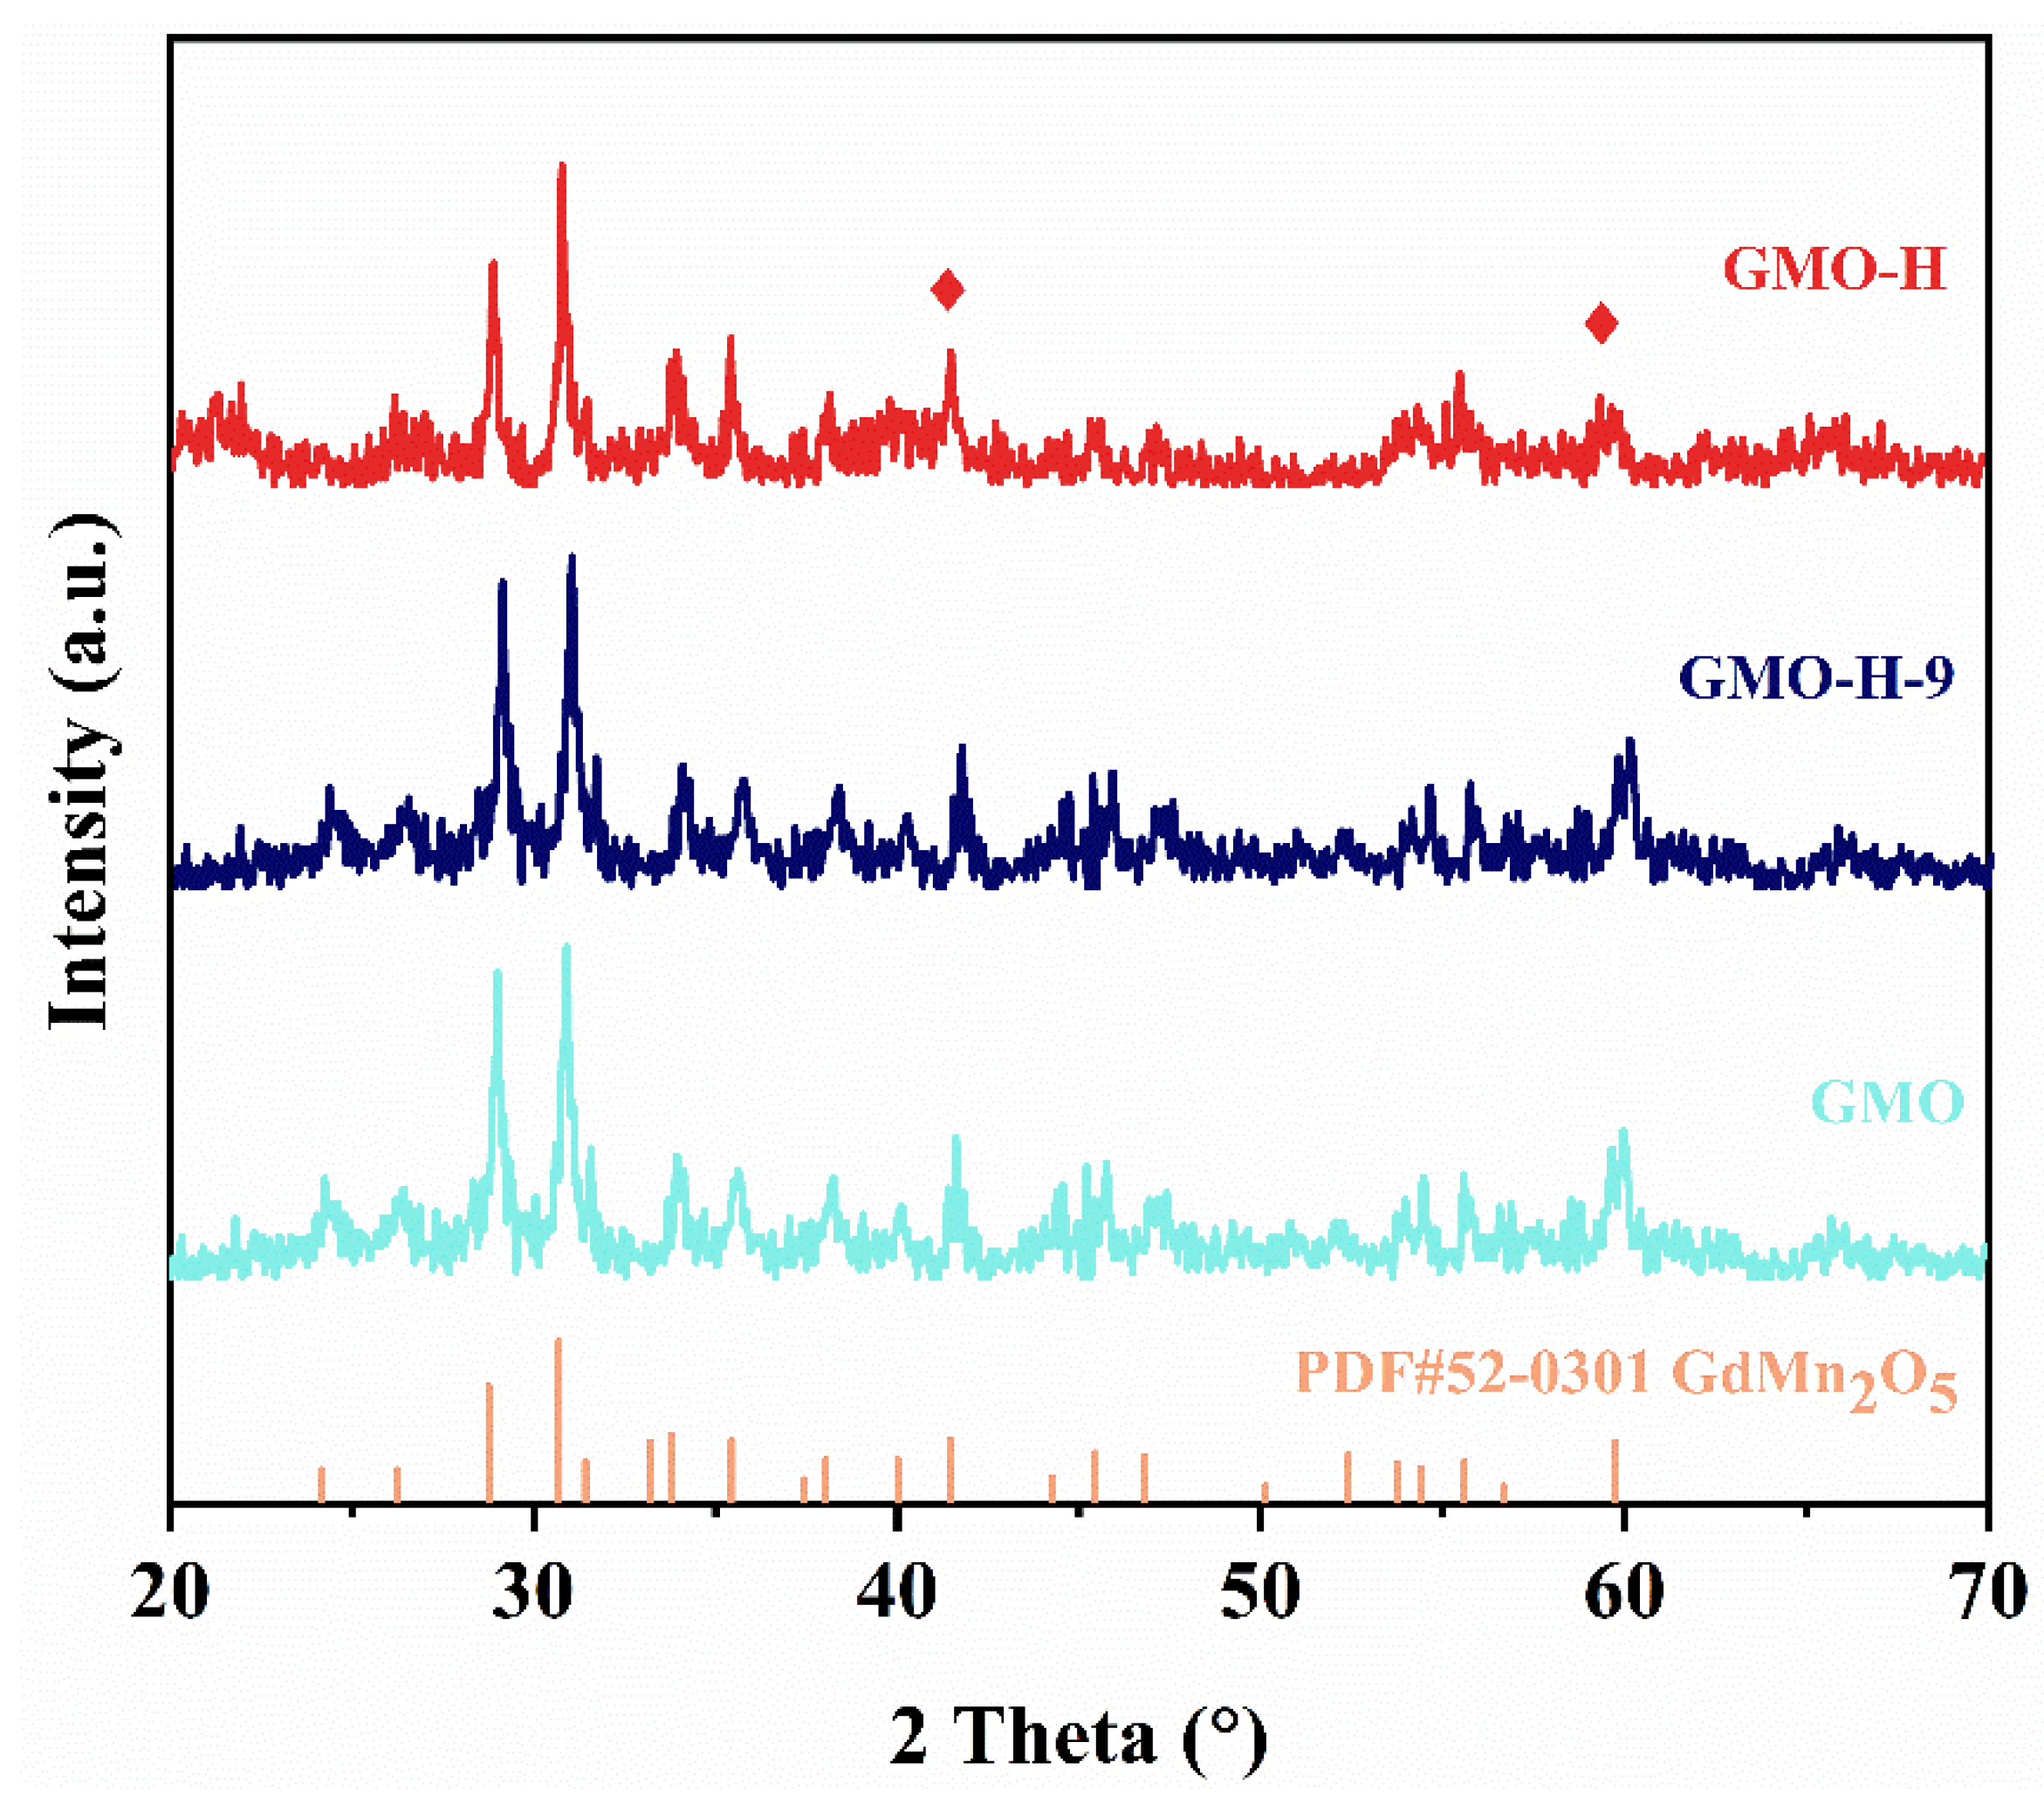
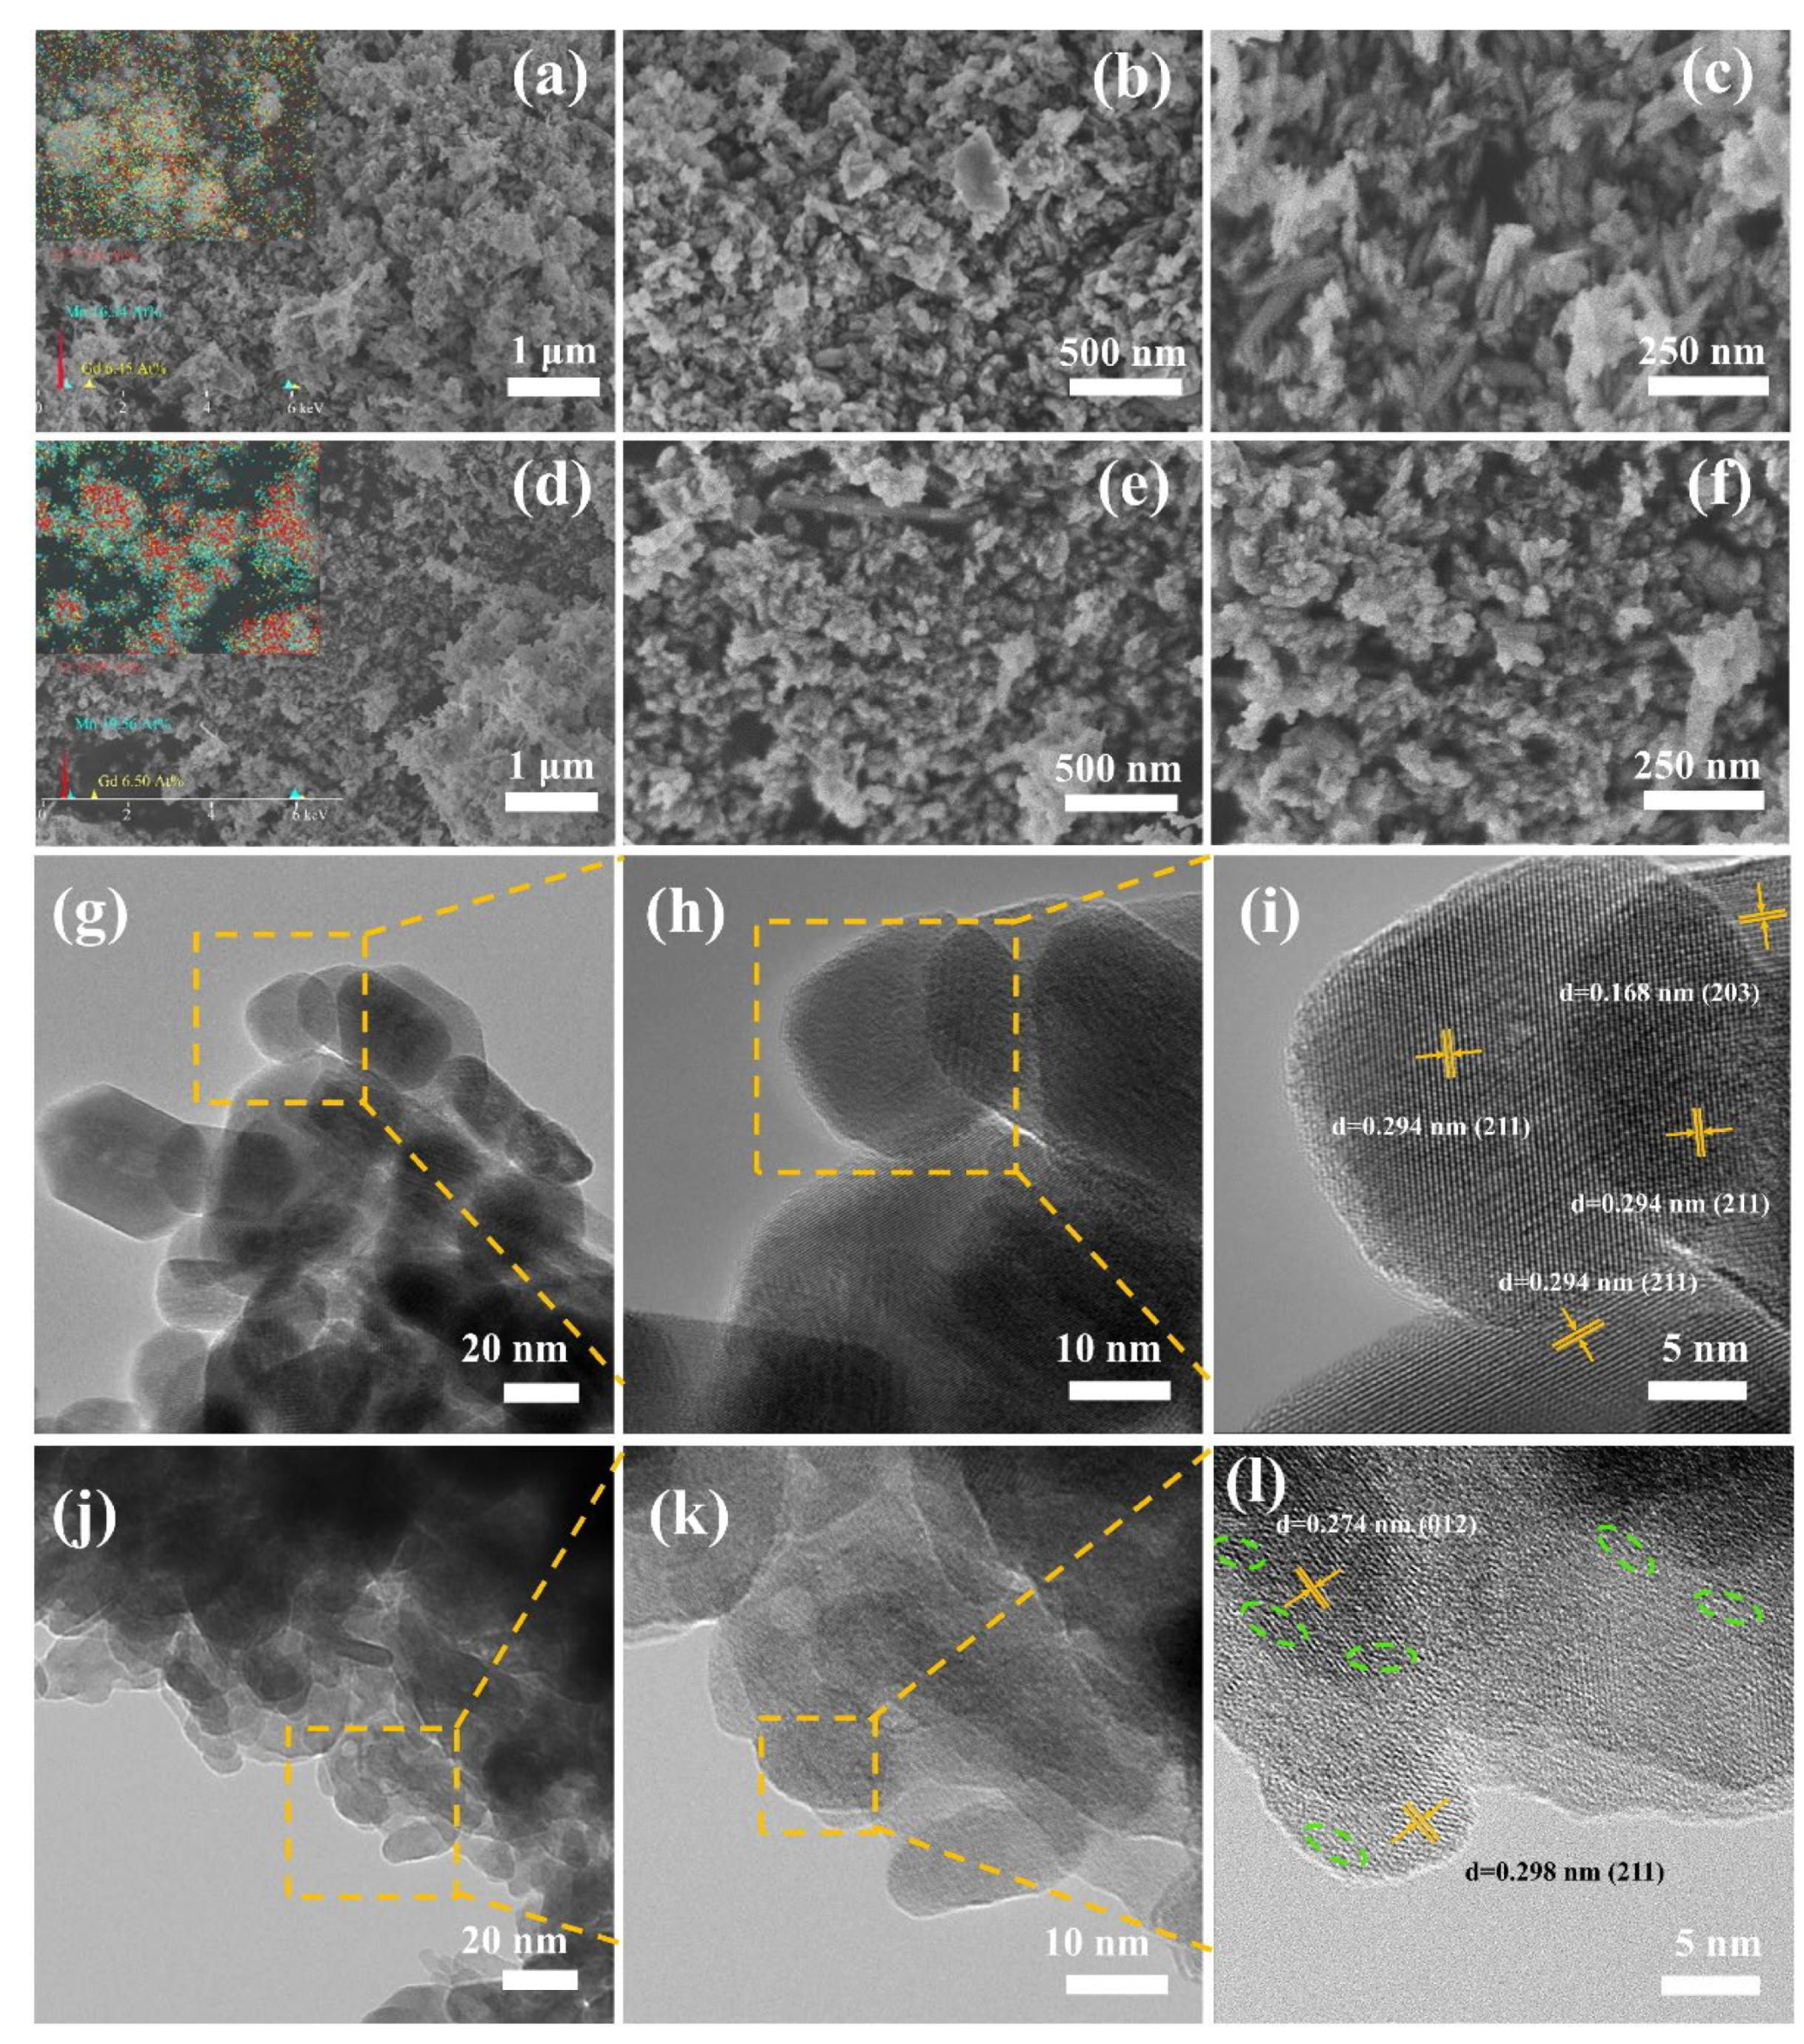
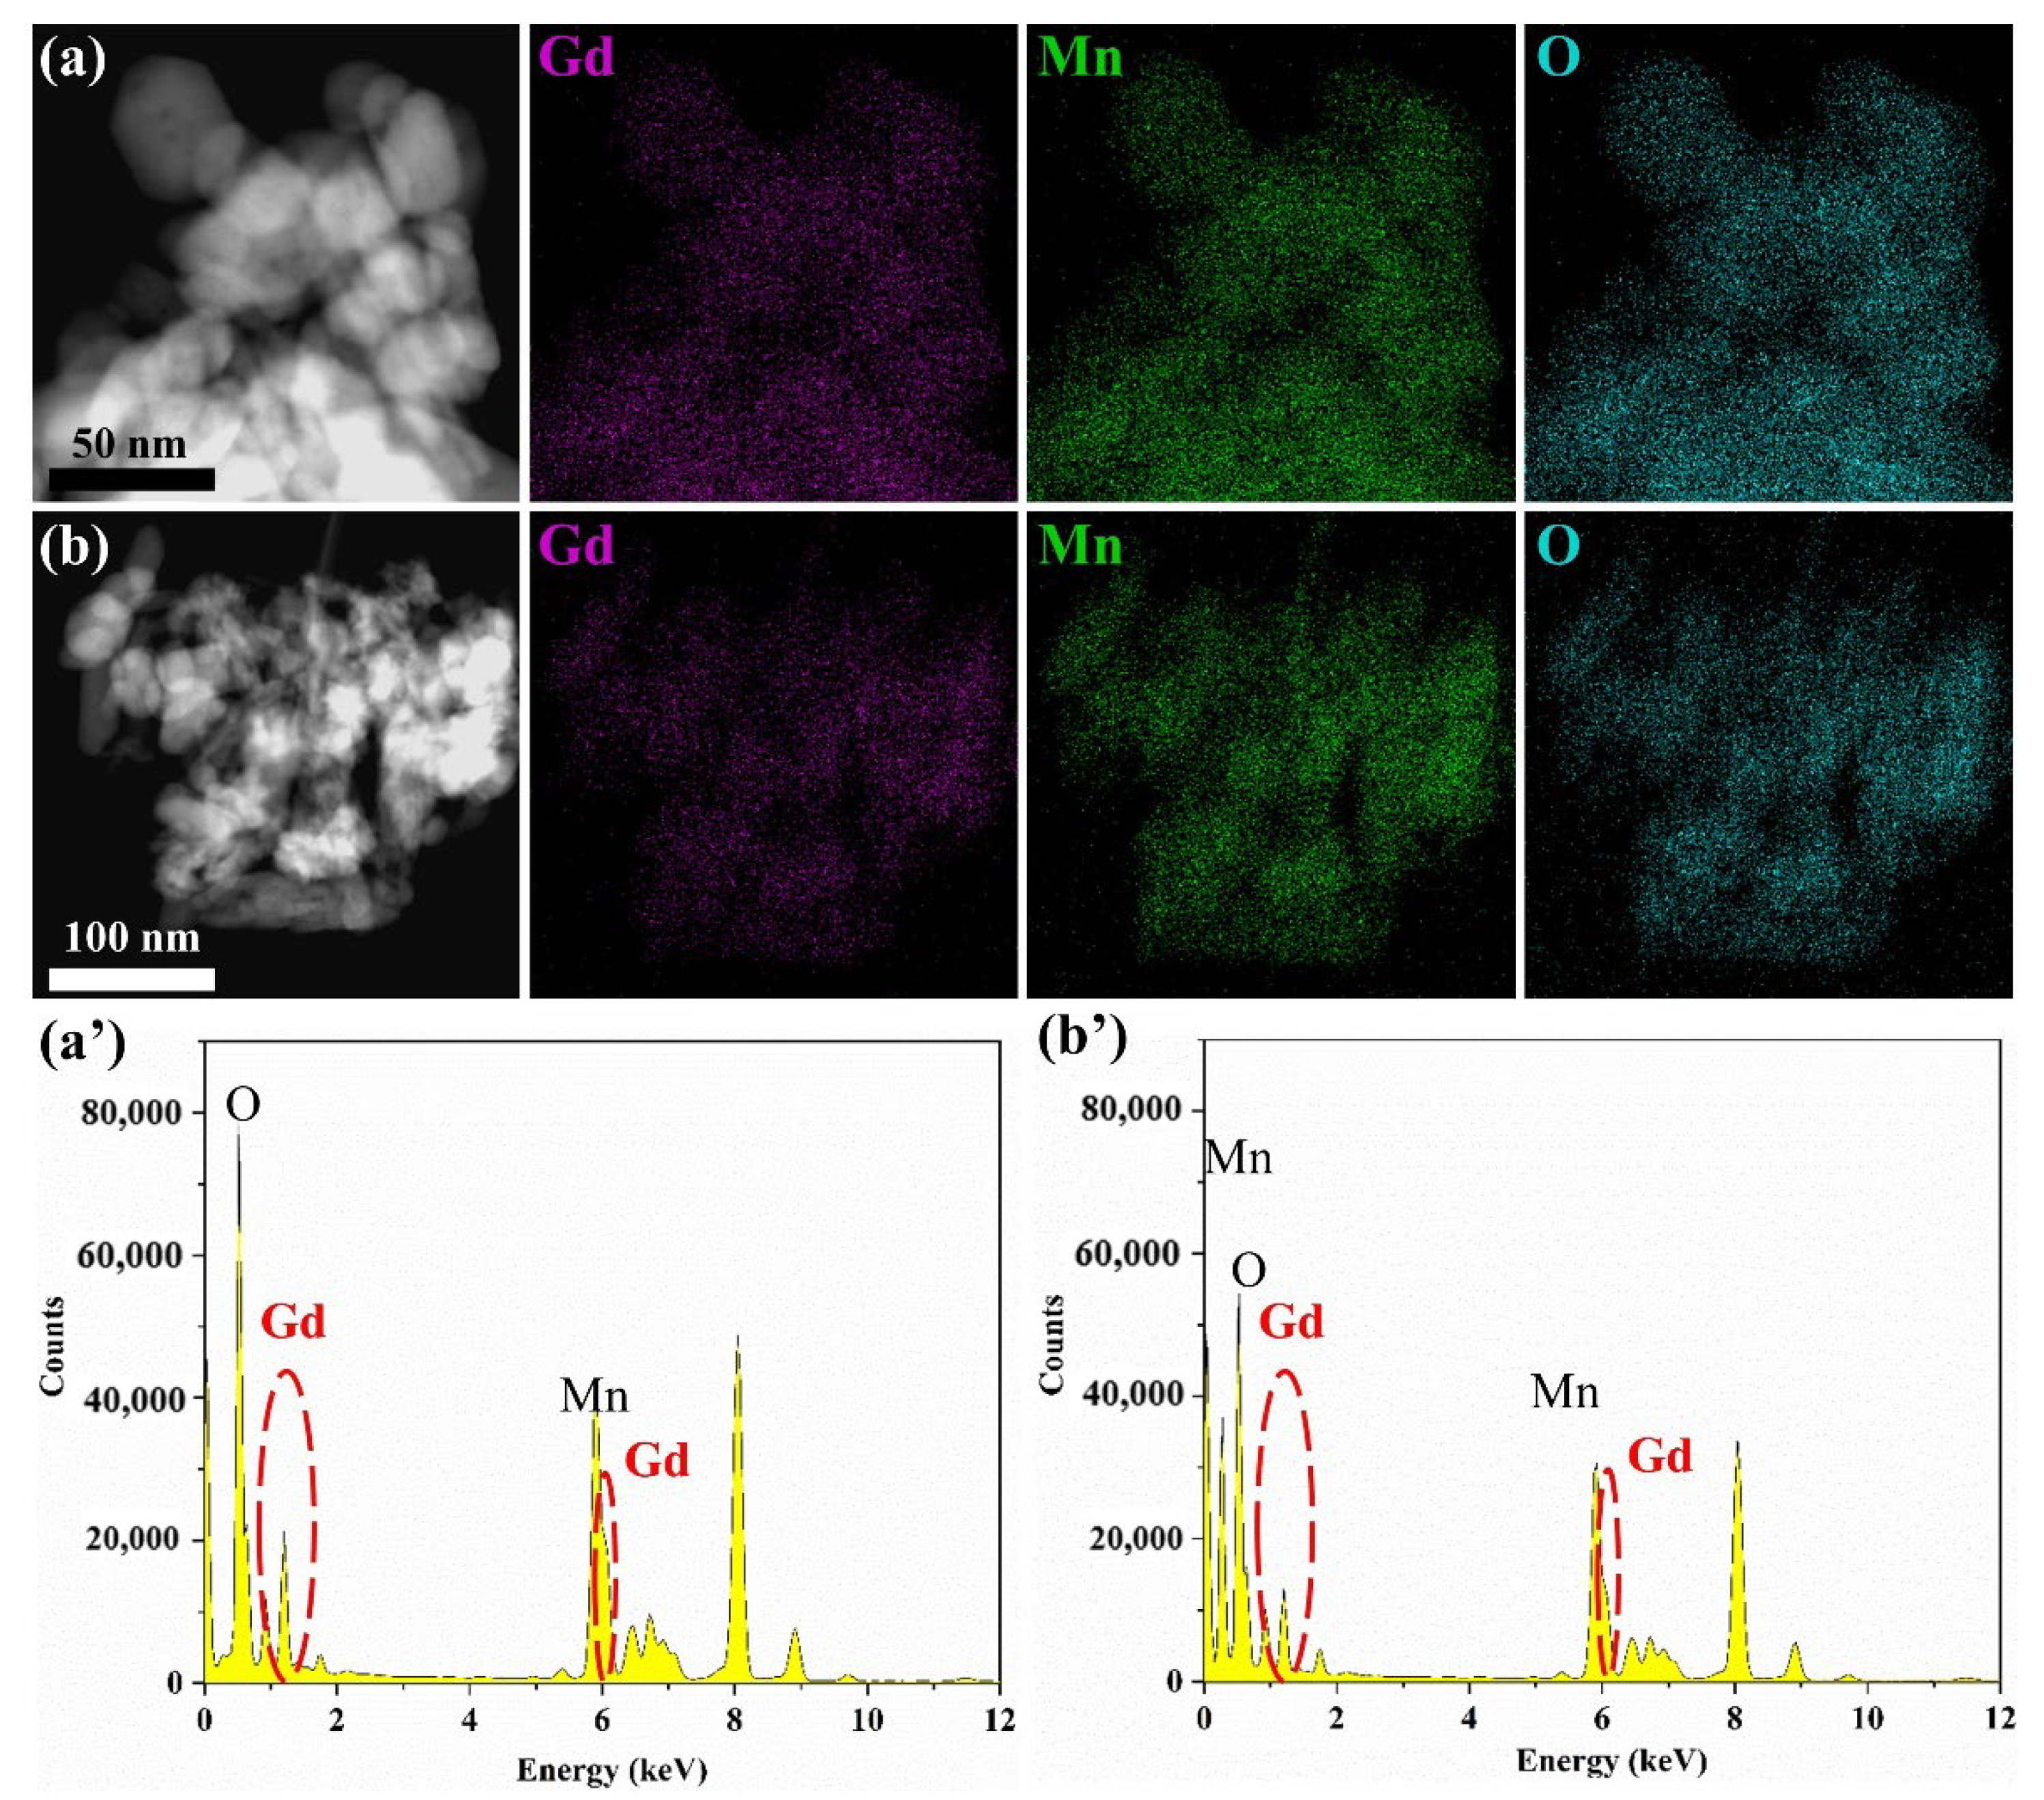
2.2. Morphology and Surface Area

SEM (Figure 2a–f) and TEM (Figure 2g–l) images illustrate the morphological changes of GMO and GMO-H. The morphology of GMO (Figure 2a–c,g–i) includes nanoparticles with a diameter of about 60 nm, nanorods with a length of about 200–250 nm, and nanosheets with a width of about 200–500 nm. This means that there are three morphologies in GMO. Firstly, the XRD pattern (Figure 1) shows that the GMO phase is GdMn2O5, and no peaks of other phases are detected. In addition, TEM-EDS elemental mapping characterization of the sample containing the three morphologies (Figure 3a,b) shows that Gd, Mn, and O show the same profile, implying that the three elements have good binding properties. This is because GdMn2O5 is an orthorhombic phase structure with a high anisotropic structure [35]. It has been found that the NaOH concentration in the synthesis system has a great influence on the shape and size of the final product, and as the alkali concentration in the hydrothermal treatment system increases, the dissolution rate of the amorphous precursor increases, accelerating the dissolution–crystallization process. Once the solution is supersaturated, nucleation and crystallization occur in the solution, and finally self-organize into nanostructures with high aspect ratios [35]. This leads to anisotropic growth behavior of GMO particles under suitable synthesis conditions. After acid treatment at 40 °C for 14 h, most of the nanorod morphology in the GMO disappeared and the diameter of nanoparticles became significantly smaller, which is about 10–20 nm (Figure 2d–f,j–l). SEM mapping roughly measured the percentage of Mn atoms on the GMO surface as 16.34% (Figure 2a) and 19.56% in GMO-H (Figure 2d), indicating an increase in the exposure of Mn-Mn active sites on the sample surface after acid etching. The lattice spacings (d values) of 0.294 nm and 0.168 nm correspond to the (211] and (203] crystal planes of GMO, respectively (Figure 2i). The lattice spacings of 0.298 nm and 0.274 nm correspond to the (211] and (012] crystal planes of GMO-H, respectively (Figure 2l). In Figure 2l, some lattice stripe distortions can be observed (highlighted by green ovals), which indicates the occurrence of lattice distortion. These results are in agreement with the XRD results.
The nitrogen adsorption–desorption isotherms and pore size distributions for GMO, GMO-H-9, GMO-H, and GMO-H-19 catalysts are shown in Figures S1 and S2. All curves show the same type-IV isotherm and have H3 hysteresis loops at higher relative pressures (0.7–1.0), which indicates the presence of irregular mesoporous structures for these four catalysts [36,37]. The BET surface areas and pore diameters of all catalysts are listed in Table 2. Compared to raw GMO, the surface area of GMO-H increased from 30.4 m2 g−1 to 52.9 m2 g−1 and the pore size decreased from 16.4 nm to 10.9 nm. The high surface areas of GMO-H could cause Benzene to fully contact the surface of the catalyst, thus improving its catalytic performance. Interestingly, when the samples were acid etched for 9 and 14 h, the surface areas tended to increase and the pore size tended to decrease. When the acid etching time was increased to 19 h, the surface areas of the sample no longer increased but started to decrease and the pore size also started to increase. From this, we can see that the surface areas of the samples tend to increase and then decrease, and the pore size tends to decrease and then increase as the time of acid etching increases, which may be because the mullite structure of the sample is damaged by the acid etching for too long. According to the principle of selective dissolution of Mn-based oxides [24], when the acid-etching time was too long, the exposed Mn3+ were disproportionated to Mn4+ and Mn2+ in situ, generating trace amounts of MnO2 in GMO-H-19. Research indicates that the pore size of rod-like MnO2 prepared by acid etching using mullite as precursor is 29.4 nm [24], which is larger than that of GMO (16.4 nm). The average pore size of the sample increases with the generation of rod-like MnO2 in GMO, which resulted in an increase in the pore size of GMO-H-19 compared to that of GMO-H. Therefore, choosing a suitable acid-etching time is important to enhance the surface area of the catalyst.

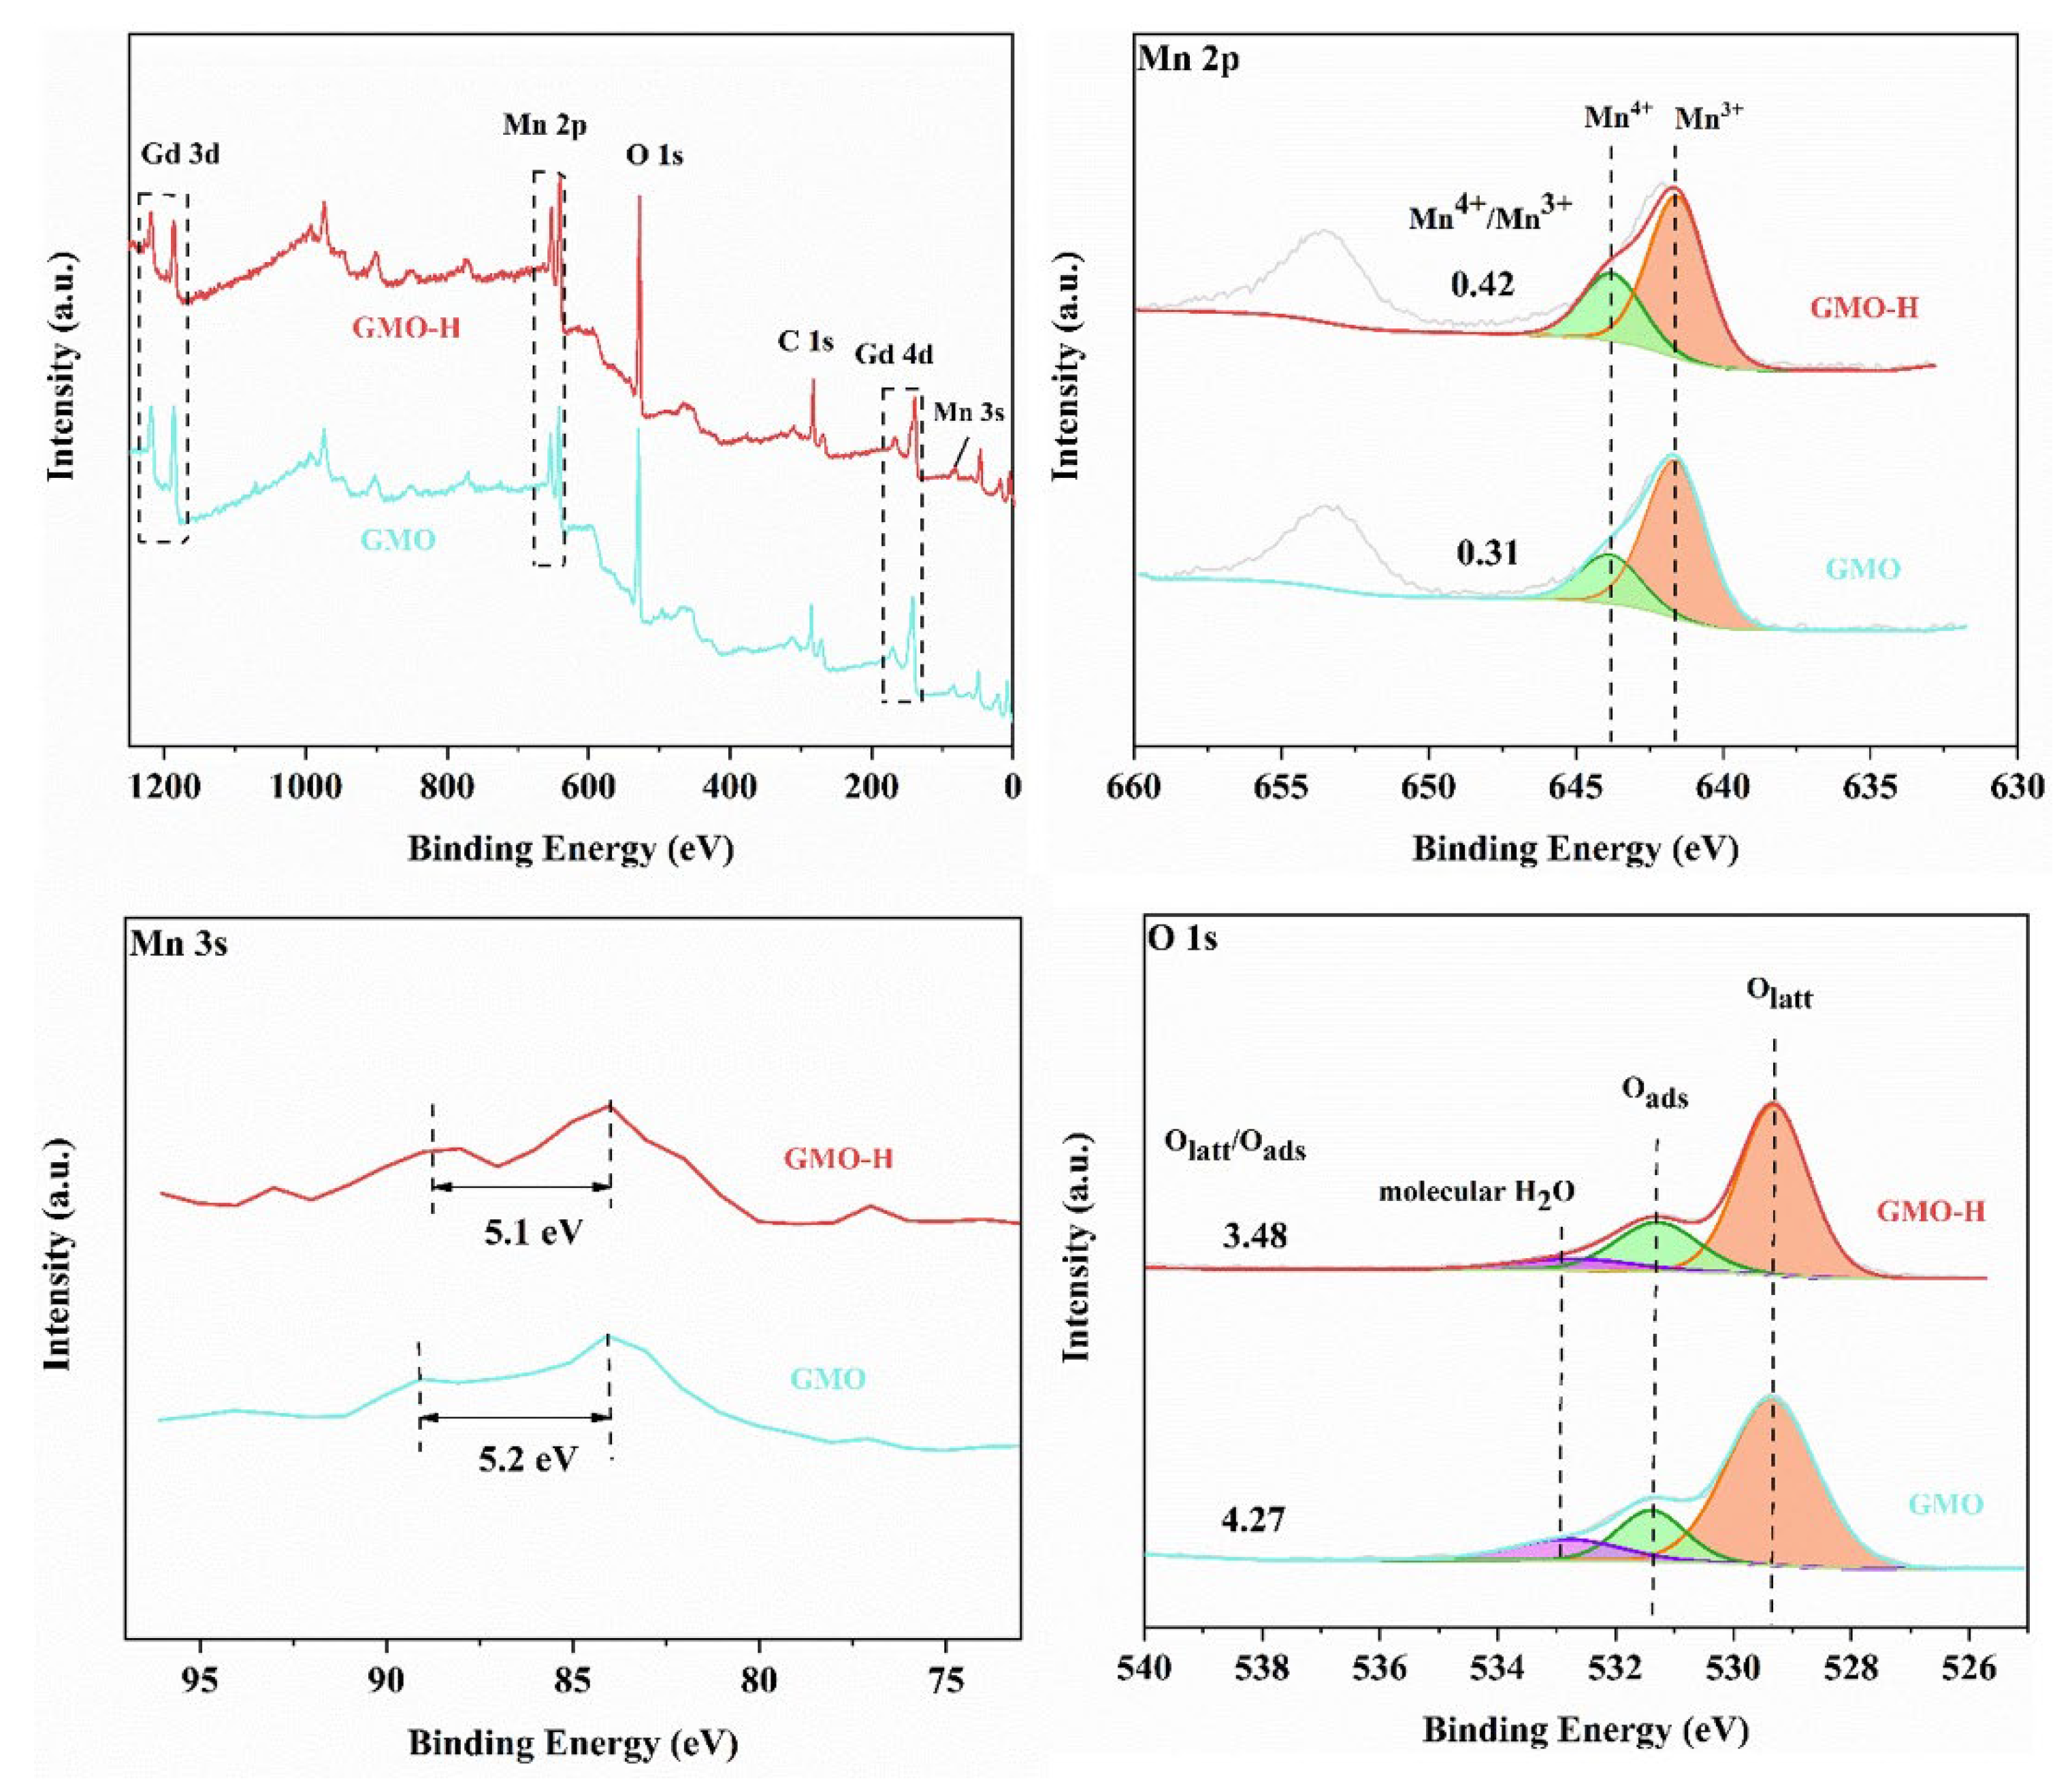
2.3. Surface Composition

TEM-EDS elemental mapping was used to study the surface composition and elemental distributions of the samples. The elemental composition of GMO and GMO-H, derived from TEM-EDS, is shown in Table 1. All elements in GMO were distributed evenly (Figure 3a,a’), and the percentages of Gd, Mn, and O were 10.48%, 22.63%, and 66.89%, respectively (the errors were 0.2, 0.2, and 0.2, respectively). These elements were still uniformly distributed in the GMO-H sample after acid etching (Figure 3b,b’), and the percentages of Gd, Mn, and O were 9.28%, 23.47%, and 67.25%, respectively (the errors were 0.3, 0.2, and 0.2, respectively). The Gd element was significantly reduced after acid etching. These findings indicate that the acid etching only removed the Gd atoms from the surface of the sample and did not change the binding of the elements, implying that the overall mullite structure was not altered by the acid etching, which is in agreement with the XRD, SEM, and TEM results.
XPS was used to detect the surface elemental composition, chemical states, and surface elemental content of a solid material. In Figure 4, the measured spectra show the Gd, Mn, and O signals for GMO and GMO-H. It is clear that the peaks of Mn, Gd, and O are similar for GMO and GMO-H, while the Gd peak decreases after acid etching at 40 °C for 14 h. The calculated Gd atomic percentage from XPS is 7.35%, compared to the atomic percentage of Gd from the ICP result (10%) and EDS result (9.28%). The reason for the deviation in values is that ICP is a bulk characterization technique, while XPS and EDS are surface characterization techniques, having different detection depths at the same time [38]. All results from the three techniques are below the theoretical value (12.5%), indicating that acid etching is able to remove some of the Gd elements. Comparing the overall characterization results of ICP with the surface characterization results of XPS and EDS, it was found that the atomic percentage of Gd on the sample surface was lower than that of the overall sample, which indicates that acid etching only removes part of the surface Gd from the GMO structure without disconnecting the Gd-O bond in its internal structure.
Figure 4 shows the XPS spectra of Mn 2p, Mn 3s, and O 1s for GMO and GMO-H. The energy (ΔE) of Mn 3s is related to its average oxidation state (AOS). The ΔE of MnO (Mn2+), Mn2O3 (Mn3+), and MnO2 (Mn4+) is 6.0, 5.3, and 4.7 eV, respectively [24]. When the concentration of Mn3+ in the compound is equal to that of Mn4+, ΔE is 5.0 eV [24]. ΔE for GMO and GMO-H is 5.2 and 5.1 eV, respectively, which is higher than 5.0 eV, indicating that the concentration of Mn3+ in the samples is higher than that of Mn4+. The AOS was roughly calculated using the equation A O S = 9.27 1.18 × Δ E [24], and the results showed an increase in the average oxidation state of Mn in GMO-H compared to GMO (Table 1), indicating an increase in the ratio of Mn4+/Mn3+ in GMO-H. In addition, the results for Mn 2p can be used to estimate the molar ratio of Mn4+/Mn3+. The peak of Mn 2p was deconvoluted into two peaks with binding energies at 643.9 and 641.9 eV, which are attributed to surface Mn4+ and Mn3+ species, respectively. Table 1 summarizes the quantitative analysis of the Mn 2p XPS spectra and the surface Mn4+/Mn3+ molar ratio of the samples. The surface Mn4+/Mn3+ molar ratio of GMO (0.31) was lower than that of GMO-H (0.42). Both pathways suggest that acid etching increases the ratio of surface Mn4+ of the samples. The increase in Mn4+/Mn3+ ratio facilitates the reduction of Mn4+ to Mn3+ [38,39], which is beneficial for catalytic oxidation. According to the principle of electroneutrality, the more Gd dissolved in the solution, the more Mn3+ is oxidized to Mn4+. The XPS results are consistent with this.
The peaks at 529.4, 531.4, and 533.0 eV can be attributed to lattice oxygen (Olatt), surface adsorbed oxygen (Oads), and hydroxyl oxygen (OO-H), respectively. As shown in Table 1, the ratio of Olatt/Oads decreases from 4.27 (GMO) to 3.48 (GMO-H), implying that the surface adsorbed oxygen of the GMO-H sample increases and the lattice oxygen decreases after acid etching. The decrease of lattice oxygen implies the increase of surface oxygen vacancy concentration, which can provide adsorption sites for oxygen molecules, and the increase in oxygen vacancy concentration is beneficial for the increase in surface adsorbed oxygen. It can be concluded that acid etching can promote the oxygen circulation on the surface of the sample, thus facilitating the catalytic oxidation reaction.

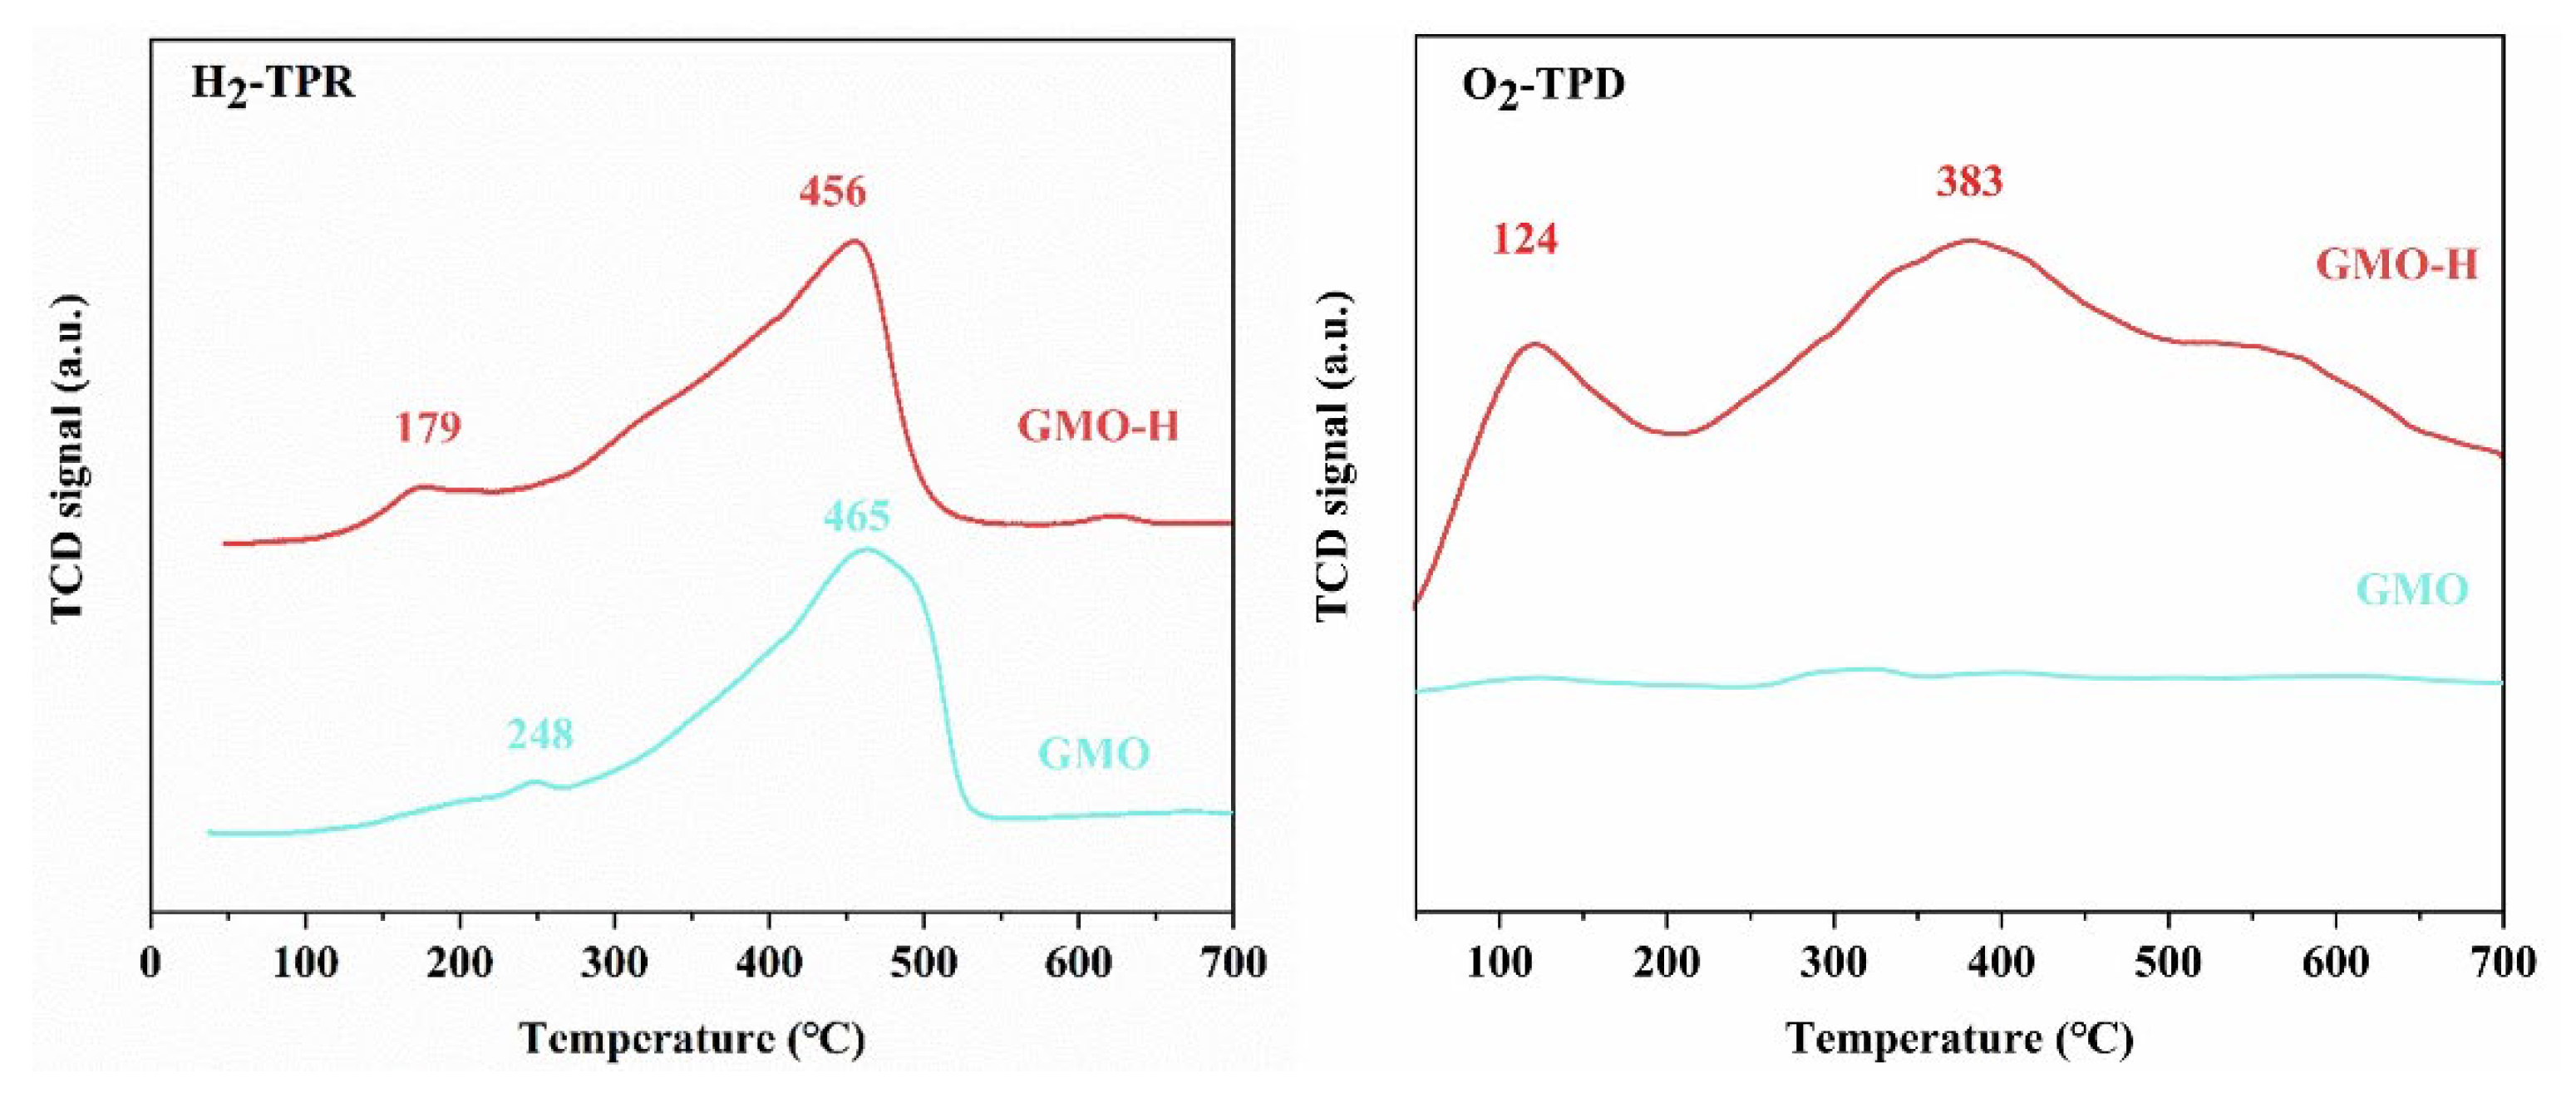
2.4. Oxidation-Reduction Property

The H2-TPR techniques were used to further investigate the redox properties of the catalysts (experimental conditions was shown in Table S1). As shown in Figure 5, GMO has two reduction peaks at approximately 465 °C and 248 °C, while GMO-H has two reduction peaks at 456 °C and 179 °C. The peaks at lower temperatures correspond to the removal of some of the surface adsorbed oxygen and the reduction of Mn4+ to Mn3+, and the peaks at higher temperatures are associated with the reduction of Mn3+ to Mn2+. The maximum temperature of the two peaks for GMO-H is lower than that of GMO, indicating that GMO-H is more reducible at lower temperatures. The H2 consumption for GMO-H (4.20 mmol g−1) at lower temperatures is larger than that of GMO (3.74 mmol g−1) (Table 2), indicating that acid etching caused more Mn4+ to be reduced to Mn3+, which improved the low-temperature reducibility of the sample. The favorable low-temperature reducibility of GMO-H after acid treatment is beneficial for the improvement of the catalytic activity in Benzene oxidation.
The O2-TPD data were used to detect differences in oxygen species and to estimate oxygen mobility. As shown in Figure 5, oxygen desorption peaks that appear at low temperatures and around 400 °C are attributed to the release of Oads and Olatt [24], respectively. The TCD signal curve of GMO is flat with no prominent peaks, suggesting that oxygen species in GMO samples are difficult to release. However, two distinct peaks were observed for GMO-H at 124 °C and 383 °C, implying that GMO-H exhibits excellent activation and migration of oxygen species. As shown in Table 2, the peak area of GMO-H (626.02) was much larger than that of GMO (0.5). The larger desorption peak area at low temperature compared to GMO indicates that GMO-H possesses more oxygen vacancies, which are the sites of oxygen molecule adsorption during the reaction. According to previous theoretical studies, the adsorbed oxygen can easily decompose into atomic oxygen (O*) by chemical bonding with oxygen vacancies [40]. Therefore, the high concentration of Oads facilitates the conversion of O2 to O*, which plays a crucial role in the catalytic oxidation process to improve the catalytic activity of the catalyst.

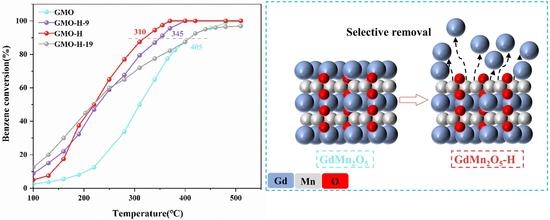
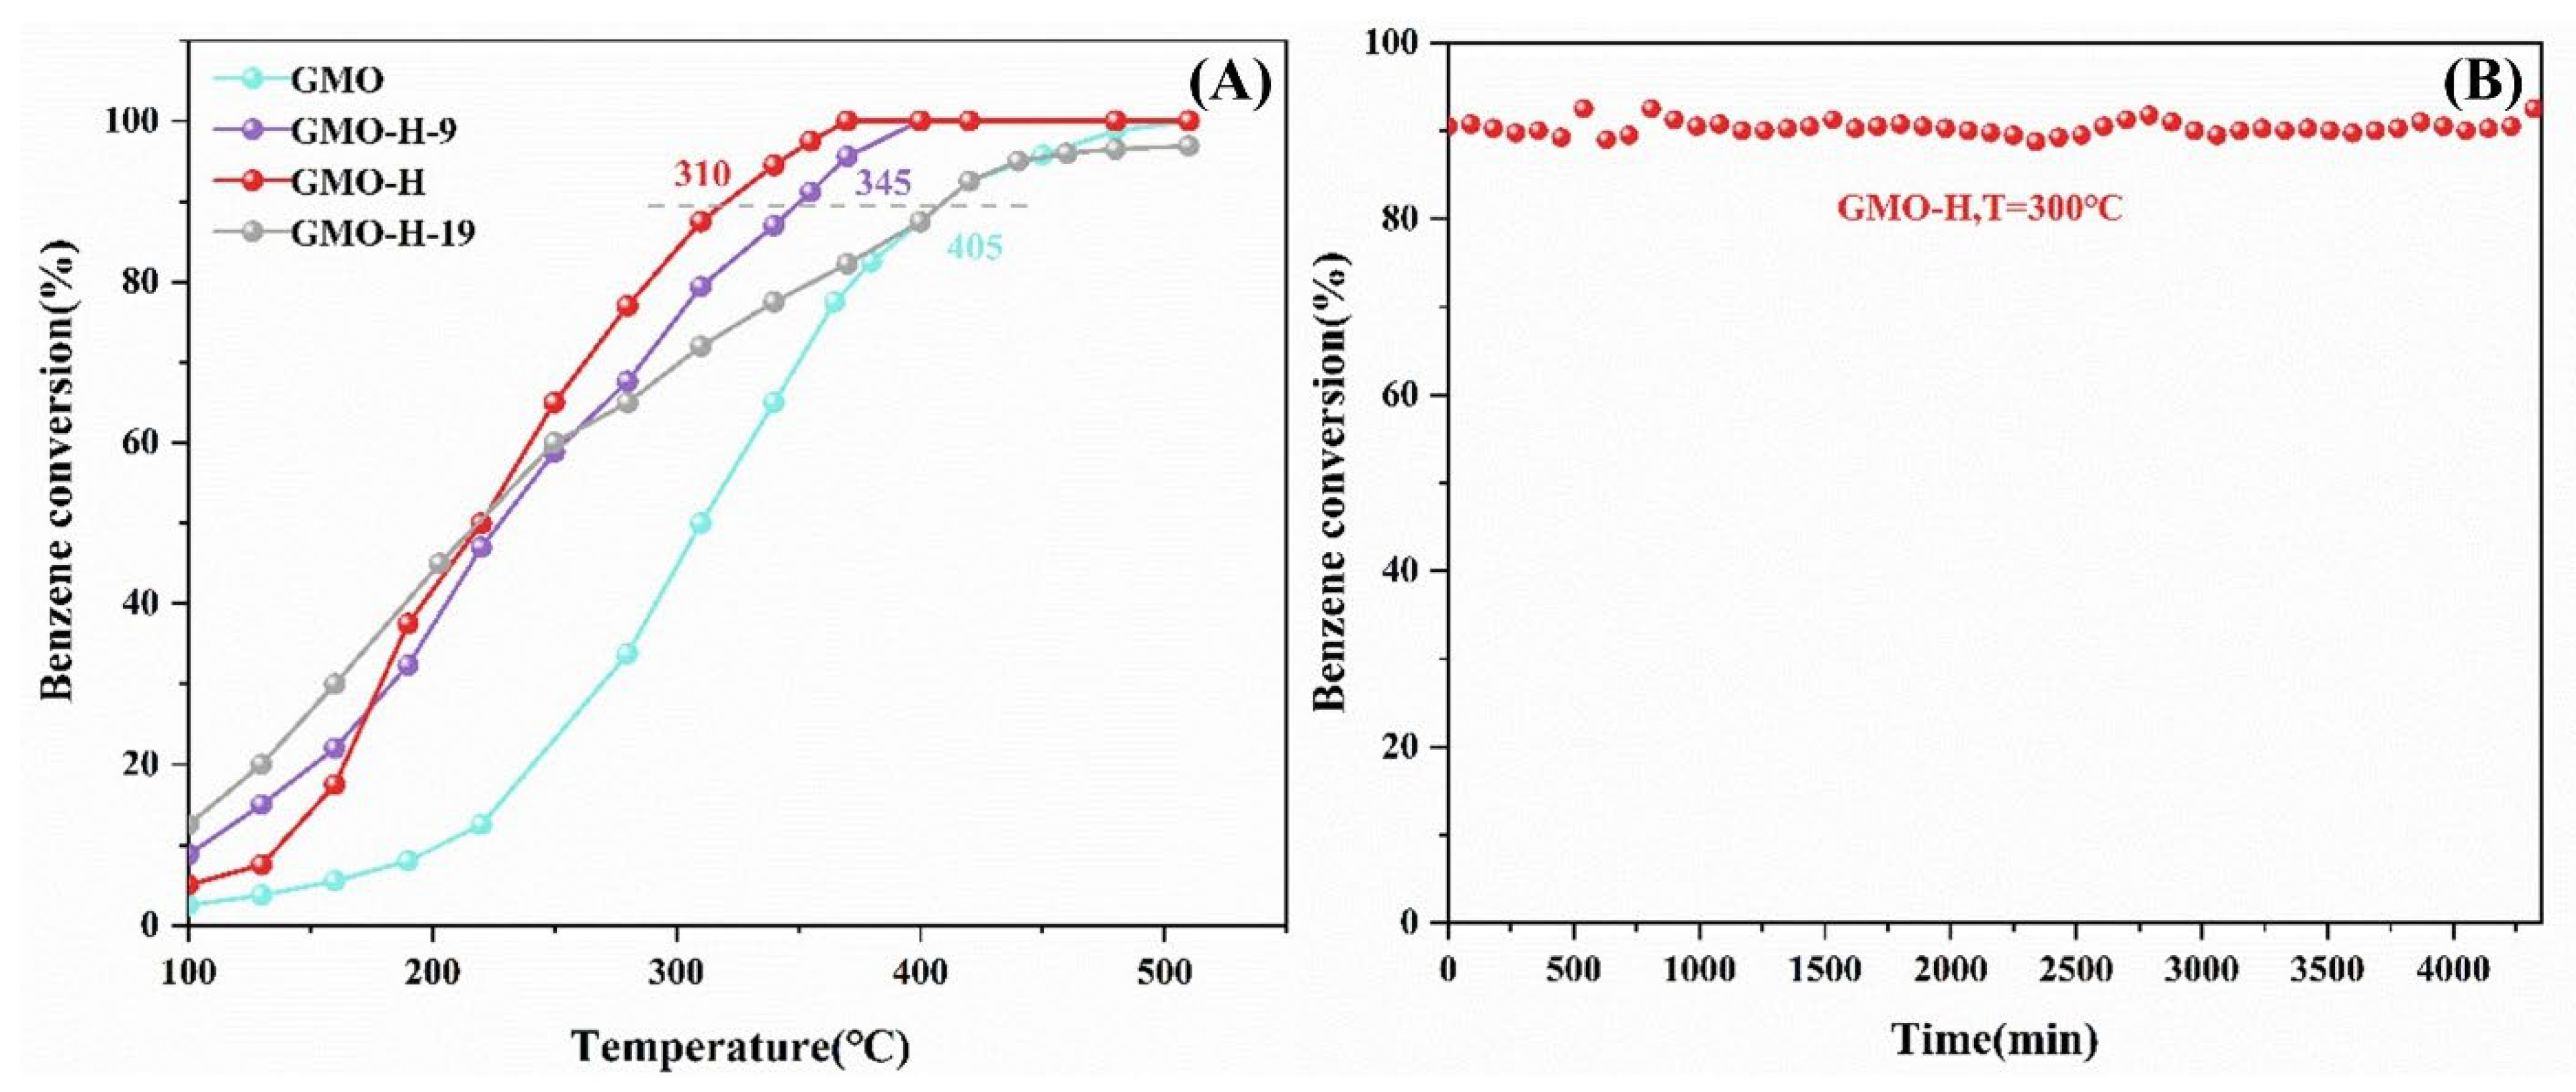
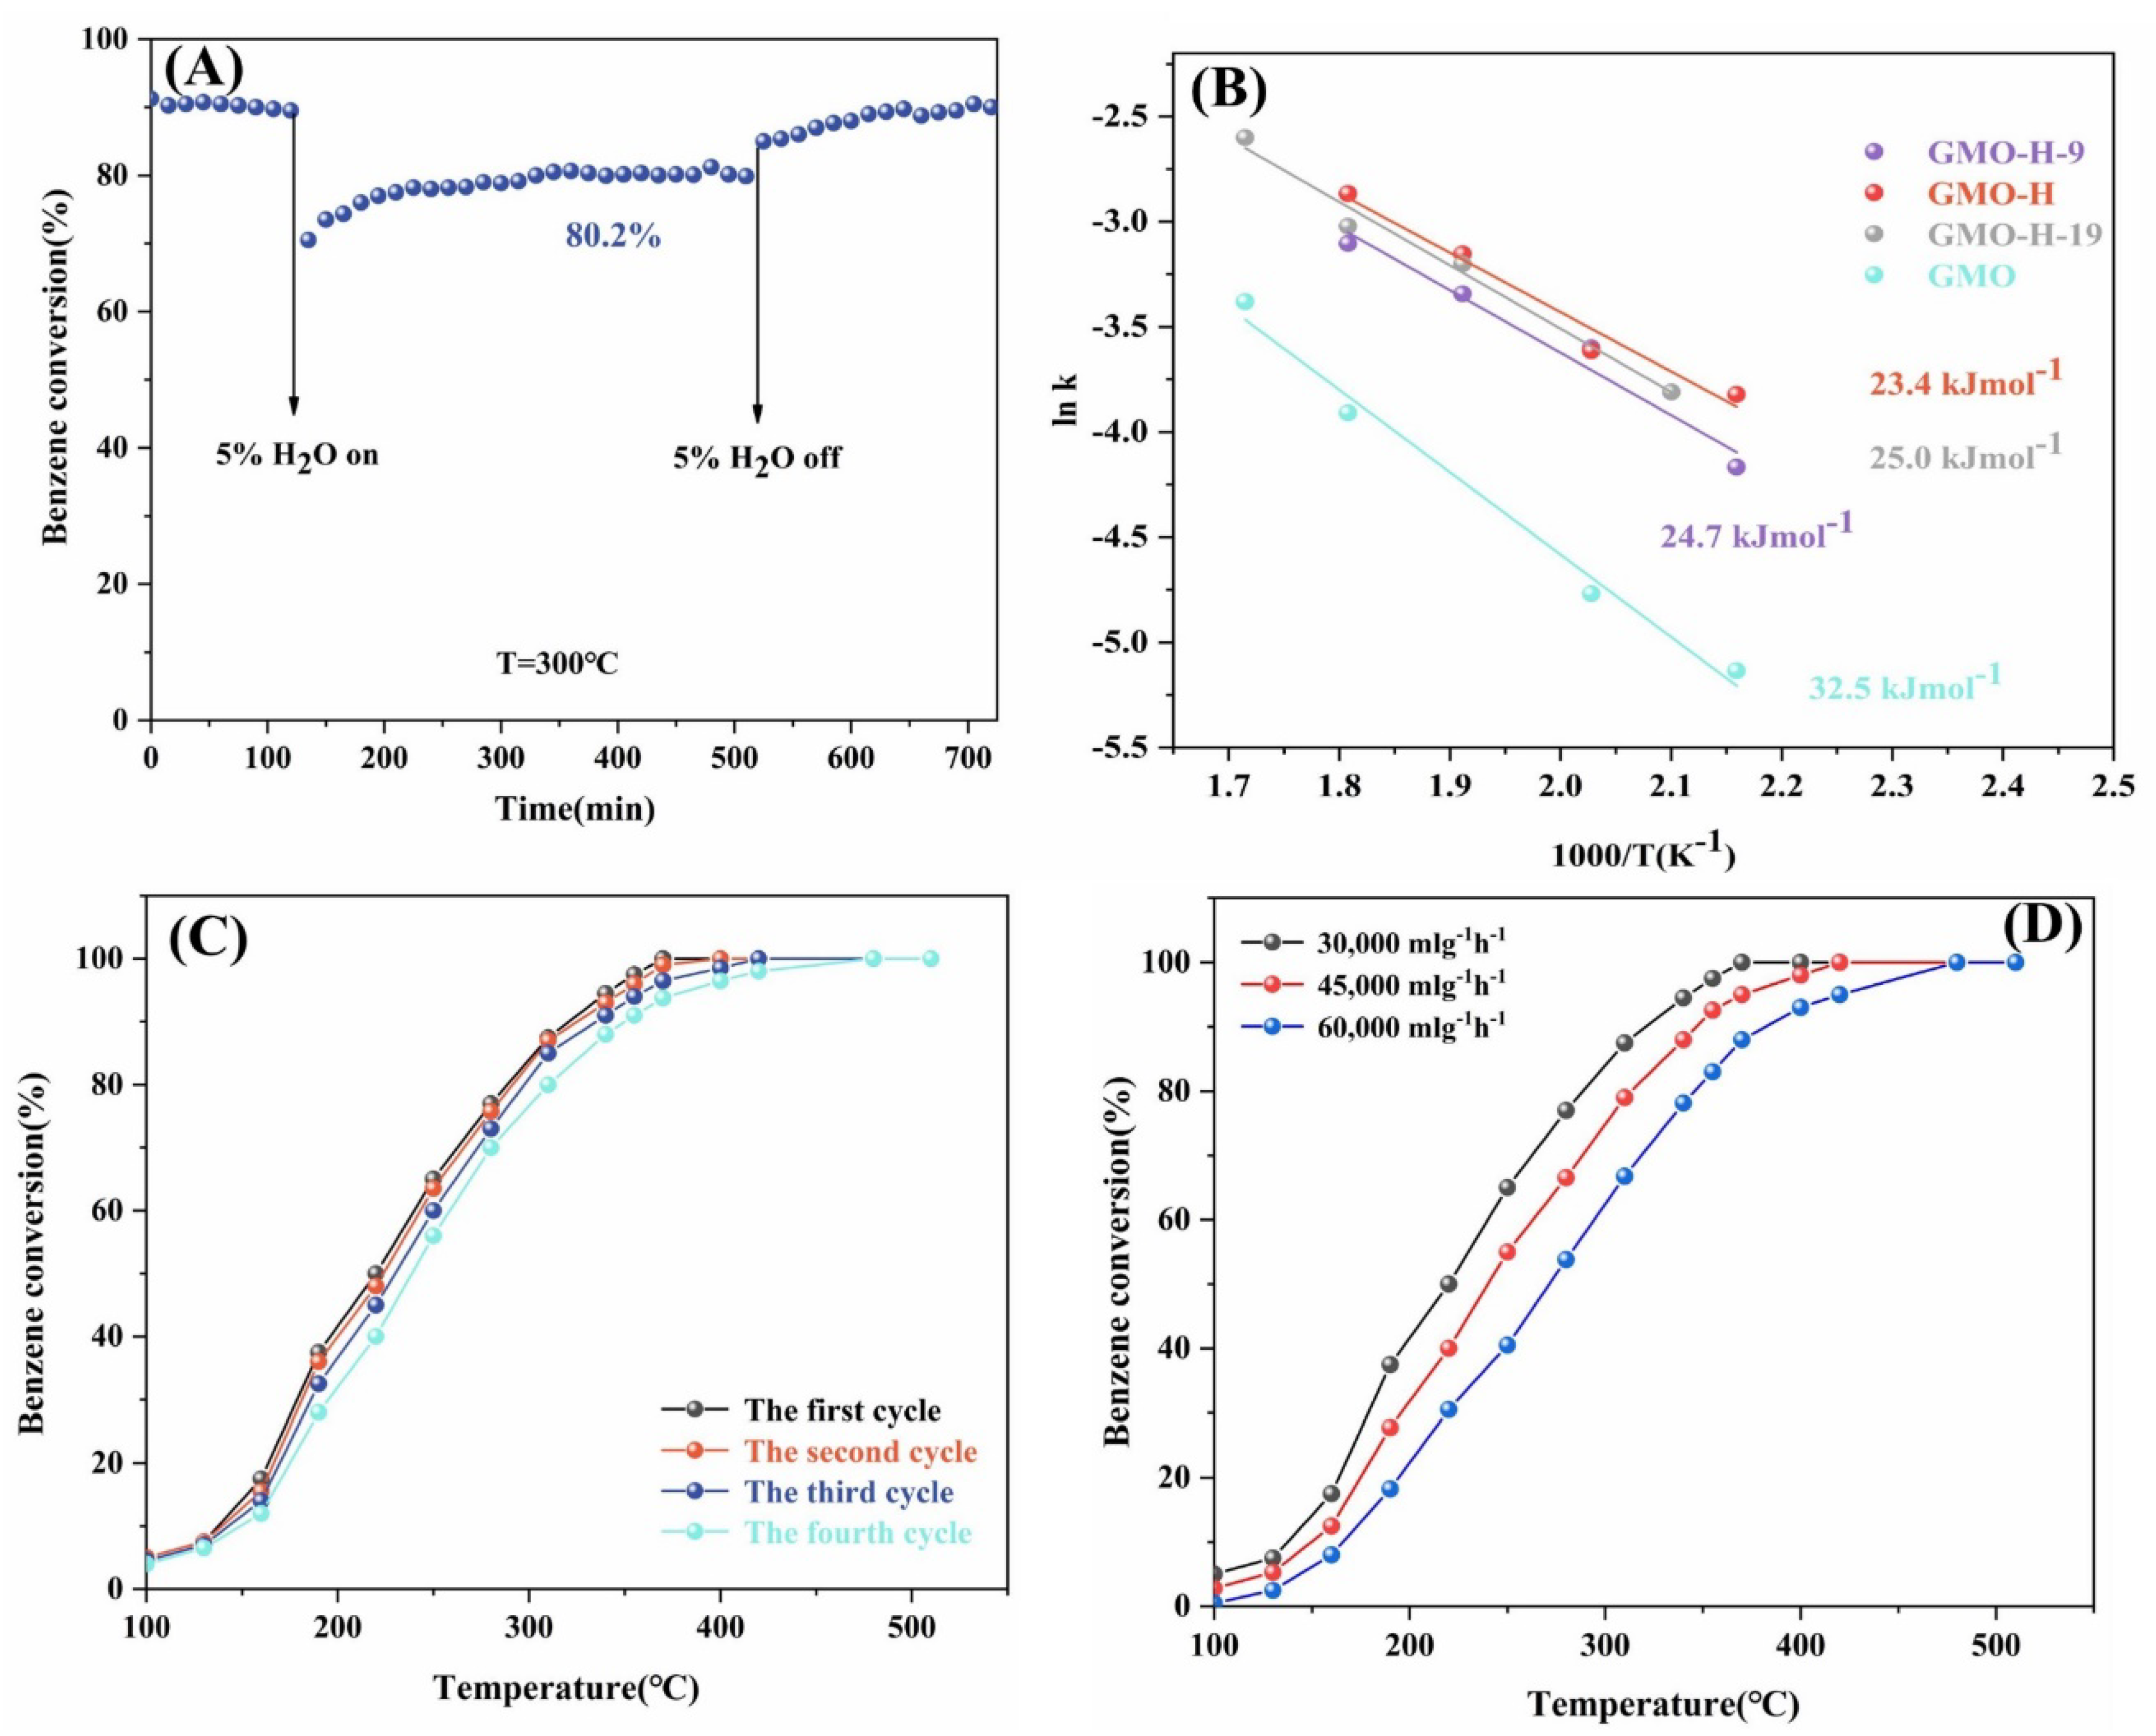
2.5. Catalytic Performance

The catalytic oxidation of Benzene by GMO, GMO-H-9, GMO-H, and GMO-H-19 catalysts is shown in Figure 6A. The reaction gases included 600 ppm Benzene and 20% O2 balanced with N2, with a total flow of 50 mL/min. The calculated weight hourly space velocity (WHSV) was 30,000 mLg1 h−1. Benzene was not degraded at 500 °C in the blank experiment. It is obvious that the degradation rate of Benzene by the catalysts increased with the increase in temperature. When the reaction temperature was around 220 °C, GMO, GMO-H-9, and GMO-H-19 showed low catalytic activity and the Benzene conversion was below 50%. When the temperature was higher than 220 °C, GMO-H showed significant catalytic activity compared to the other catalysts. Notably, Benzene was completely oxidized to carbon dioxide and water over all catalysts and no partial oxidation products were detected, which was confirmed by the carbon balance of each run. For GMO-H, almost all of the Benzene was removed at 340 °C. In the present study, T50% and T90%, representing the temperatures at Benzene conversion of 50% and 90%, respectively, are used to indicate the catalytic activity (Table 2). The results reveal that catalytic efficiency is in the order of GMO-H > GMO-H-9 > GMO-H-19 > GMO in the range of 250–400 °C.
In addition, the stability test results of the GMO-H catalyst are shown in Figure 6B. The catalytic activity of GMO-H remained unchanged at 300 °C for 72 h, which indicates its excellent thermal stability. Combined with the XRD results, it shows that moderate acid etching does not change the original stable structure of mullite, and mild and simple surface modification can significantly improve the catalytic oxidation effect of mullite while maintaining long-term activity stability.
Further studies on the effects of H2O on the activity of the best catalyst, GMO-H, under conditions of additional water vapor at a concentration of 5% at 300 °C were conducted, and the results are shown in Figure 7A. When water vapor was introduced, a decrease in Benzene conversion from 90% to 75% was observed. After stabilizing for 4 h, the conversion of Benzene was stable at 80.2%. Finally, once the water vapor supply was cut off, the Benzene conversion almost recovered to its original value (89%). These results show that the deactivation by water vapor is reversible and GMO-H has satisfactory water resistance. The Arrhenius curves of all samples at 190–310 °C are shown in Figure 7B, and the Ea of all samples can be calculated according to the Arrhenius formula:
r = k c = A e x p E a R T c
where r is the reaction rate, mol L−1 s−1; k is the rate constant, s−1; A is preexponential factor; Ea is apparent activation energy, kJ mol−1.
The lower Ea represented the easier catalytic oxidation of Benzene. The results show that GMO (32.5 kJ mol−1) > GMO-H-19 (25.0 kJ mol−1) > GMO-H-9 (24.7 kJ mol−1) > GMO-H (23.4 kJ mol−1), which coincided with the catalytic activity test results. After four-cycle test performance of GMO-H, the Benzene catalytic activity of GMO-H did not change significantly (Figure 7C), and no significant changes were observed in its XRD (Figure S3) diffraction peaks, suggesting that GMO-H has good cycling stability. The catalytic activity of GMO-H decreased with increasing WHSV (Figure 7D). The contact time between Benzene and the catalyst becomes longer at lower WHSV, which is the main reason for the better catalytic performance of GMO-H at lower WHSV.
It can be clearly seen that the catalytic performance of GMO-H-9 and GMO-H was significantly improved when the GMO samples were acid etched at 40 °C for 9 h and 14 h. With the increase in acid etching time, the catalytic oxidation performance of the catalysts improved, but when the acid etching time increased to 19 h, the performance of GMO-H-19 catalyst decreased significantly. This trend of change is consistent with the trend of change of BET results. However, it was still better than the original GMO sample at low temperature. The main reasons for this result are its excellent low-temperature reducibility and the high concentration of oxygen species adsorbed onto the surface. Ultimately, this is mainly due to the fact that Gd on the sample surface is dissolved after acid etching, more Mn-Mn active sites are exposed, and contaminants are more easily and effectively adsorbed onto the catalyst surface. Moreover, the production of more Mn4+ facilitates the low temperature reduction of the catalyst and the increase in the concentration of oxygen vacancies on the surface facilitates the adsorption of more O2, which can produce O*.
According to the Mars–van Krevelen mechanism, the appearance and disappearance of oxygen vacancies is a key step in Benzene oxidation [41]. The focus of the Mars–van Krevelen mechanism is on the function of lattice oxygen during Benzene oxidation [24]. In the Mars–van Krevelen redox cycle, gaseous Benzene molecules are firstly adsorbed onto the catalyst surface and then activated at the Mn-Mn active site, followed by efficient oxidation with the help of adjacent lattice oxygen (Olatt) species. The depleted lattice oxygen species are replenished by feedstock O2, which is adsorbed onto the surface oxygen vacancies, then lattice oxygen species continue to participate in subsequent cyclic reactions. The absorbed oxygen species are also widely considered to be involved in the overall oxidation of VOCs. As revealed by XPS, O2-TPD, and H2-TPR studies, higher oxygen vacancy concentrations, which promote oxygen activation to form active oxygen adsorbed species, and better reducibility are associated with better catalytic activity [42]. Therefore, it can be concluded that the catalytic activity of GMO-H catalysts in Benzene combustion is mainly attributed to their abundant adsorbed oxygen species and good low-temperature reducibility.

3. Materials and Methods

3.1. Materials

The primary chemicals were used without further purification. Gadolinium nitrate hexahydrate (Gd(NO3)3∙6H2O) was purchased from Aladdin (Shanghai) Reagent Co., Ltd., Shanghai, China. Potassium permanganate (KMnO4) and nitric acid (HNO3) were purchased from Tianjin Damao Chemical Reagent Factory, Tianjin, China. Manganese acetate ((C2H3O2)2Mn∙4H2O) was purchased from Tianjin Fengchuan Chemical Reagent Technology Co., Ltd. Sodium hydroxide was purchased from Tianjin Comeo Chemical Reagent Technology Co., Ltd., Tianjin, China.

3.2. Methods

GdMn2O5 (GMO) was prepared by hydrothermal method. Firstly, 2.5 mmol of Gd(NO3)3∙6H2O, 1.5 mmol of KMnO4, and 3.5 mmol of (C2H3O2)2Mn∙4H2O were successively dissolved in 20 mL of deionized water with stirring for 30 min. Then, 10 mL of 4 M NaOH was slowly dropped into this solution under stirring for another 30 min. Afterward, the mixture was transferred to a 50 mL Teflon-lined stainless-steel autoclave and heated at 250 °C for 24 h. After naturally cooling to room temperature, the product was washed with deionized water and dried at 80 °C for 12 h.
The GMO powder was soaked in 5M HNO3 solution at 40 °C for 9, 14, and 19 h under magnetic stirring for surface modification, and the products were filtered, washed three times with deionized water, and dried at 80 °C for 12 h to remove acid ions (H+ and NO3) from the catalyst surface. The obtained powders were denoted as GMO-H-9, GMO-H, and GMO-H-19, respectively.

3.3. Catalyst Characterization

X-ray diffraction was performed using an X-ray diffractometer (D8-Focus) equipped with a copper target (λ = 0.15406 nm, 40 mA, 40 kV). ICP-OES was performed on an iCAP 7000 series spectrometer. Nitrogen adsorption–desorption curves were obtained on an ASAP2020 instrument using liquid nitrogen at −196 °C, from which the BET surface area was calculated. H2-TPR and O2-TPD were both tested with an AUTO CHEM 2920 instrument, all samples were pretreated in helium at 300 °C. XPS tests were performed using an X-ray spectrometer (ESCALAB Xi+) with Al Ka as the X-ray source, and the binding energy of the contaminated carbon C1s was calibrated under vacuum at 5* × 10−8 Pa (284.80 was used as the calibration value). SEM images were obtained with a Regulus 8100 field emission scanning electron microscope at an accelerating voltage of 3 kV. TEM, HRTEM, and EDS measurements were performed using a JEM-2100F field emission transmission electron microscope at an accelerating voltage of 200 kV.

3.4. Evaluation of Catalytic Performance

The catalytic oxidation performance of the catalyst for Benzene was tested in a continuous flow microreactor. Firstly, 0.1 g of catalyst (40–60 mesh) was packed in a quartz tube with an inner diameter of 4 mm and a length of 400 mm. The inner diameter of the catalytic bed is 4 mm and the length is 8 mm. The reaction mixture consisted of 600 ppm Benzene and 20% O2 and N2 (balance) at a total flow rate of 50 mL min−1 and a WHSV of 30,000 mL g−1 h−1. The molar ratio of O2/N2 was 0.25. The flow rate of 600 ppm Benzene is 38 mL min−1. The temperature range tested was from 100 to 510 °C with a heating rate of 2 °C min−1. The concentrations of reactants and products were measured using a gas chromatograph–mass spectrometer thermal desorption analyzer (7890BGC-5977B/MSD-TD-100). Both Benzene and carbon dioxide were calibrated using the external standard method. The standard curve was plotted with the standard sample concentration as the x-axis and the measured peak area as the y-axis. The conversion of Benzene (XBenzene, %) was calculated using the following equation:
X B e n z e n e = C i n C o u t C i n × 100 %
where Cin and Cout are the inlet and outlet concentrations of Benzene, respectively.
The WHSV formula is as follows:
W H S V = T o t a l   f l o w   r a t e   m l h 1 c a t a l y s t   q u a l i t y   g

4. Conclusions

Here, we designed and synthesized GMO-H catalysts applied to the catalytic oxidation of Benzene and surface-modified the samples in a simple and mild manner under acid-etching conditions at 40 °C. The results showed that the reaction temperature of the GMO-H catalyst for the removal of 90% Benzene decreased from 405 to 310 °C at 30,000 mL g−1 h−1 of GHSV compared to the conventional GdMn2O5. During a 72 h catalytic test, the catalyst maintained 90% Benzene removal constant at 300 °C, indicating its excellent activity stability. Various characterization techniques demonstrated that the surface of the acid-etched samples had Gd defects and abundant oxygen vacancies, which led to the exposure of more Mn-Mn active sites on the catalyst surface, a large amount of superficial oxygen concentration, and better low-temperature reducibility. This work provides a solution for the development of transition metal oxide-based catalysts with excellent activity and activity stability to replace noble metal-based catalysts.

Supplementary Materials

The following supporting information can be downloaded at: https://www.mdpi.com/article/10.3390/catal12101267/s1, Figure S1: Nitrogen adsorption–desorption isotherms; Figure S2: Pore size distribution; Figure S3: XRD patterns of fresh GMO-H and used GMO-H; Figure S4: Benzene conversion versus time on-stream curves at different temperatures; Table S1: Experimental conditions of temperature programmed experiments.

Author Contributions

Conceptualization, J.G.; data curation, J.G. and X.D.; formal analysis, J.G. and X.D.; funding acquisition, Y.L.; investigation, J.G.; methodology, J.G. and X.D.; project administration, Y.L.; resources, Y.L., Z.L. and Y.S.; Supervision, Y.L., Z.L. and Y.S.; validation, J.G. and X.D.; visualization, J.G.; writing—original draft preparation, J.G. and X.D.; writing—review and editing, J.G., X.D., X.R., K.L. and Y.L. All authors have read and agreed to the published version of the manuscript.

Funding

This research was funded by Tianjin Science and Technology Commission, grant number 19YFZCSF00830.

Data Availability Statement

Not applicable.

Acknowledgments

The authors acknowledge the funding for the key research and development plan.

Conflicts of Interest

The authors declare no conflict of interest.

References

  1. Dong, A.Q.; Gao, S.; Wan, X.; Wang, L.X.; Zhang, T.; Wang, L.; Lang, X.Y.; Wang, W.C. Labile oxygen promotion of the catalytic oxidation of acetone over a robust ternary Mn-based mullite GdMn2O5. Appl. Catal. B-Environ. 2020, 271, 10. [Google Scholar] [CrossRef]
  2. Chu, S.; Majumdar, A. Opportunities and challenges for a sustainable energy future. Nature 2012, 488, 294–303. [Google Scholar] [CrossRef] [PubMed]
  3. Wantz, E.; Kane, A.; Lhuissier, M.; Amrane, A.; Audic, J.L.; Couvert, A. A mathematical model for VOCs removal in a treatment process coupling absorption and biodegradation. Chem. Eng. J. 2021, 423, 8. [Google Scholar] [CrossRef]
  4. Dong, X.; Tian, Q.; Lu, Y.; Liu, X.; Tong, Y.; Li, K.; Li, Z. Controllable crystallization engineering on amorphous tungsten oxide nanoparticles for highly efficient photochromic response. Sol. Energy Mater. Sol. Cells 2022, 245, 111892. [Google Scholar] [CrossRef]
  5. Li, W.B.; Wang, J.X.; Gong, H. Catalytic combustion of VOCs on non-noble metal catalysts. Catal. Today 2009, 148, 81–87. [Google Scholar] [CrossRef]
  6. Chaudary, A.; Mubasher, M.M.; Ul Qounain, S.W. Modeling the Strategies to Control the Impact of Photochemical Smog on Human Health. In Proceedings of the 4th International Conference on Innovative Computing (ICIC), Univ Management & Technol, Lahore, Pakistan, 9–10 November 2021; pp. 36–44. [Google Scholar]
  7. Javed, A.; Aamir, F.; Gohar, U.F.; Mukhtar, H.; Zia-Ui-Haq, M.; Alotaibi, M.O.; Bin-Jumah, M.N.; Marc, R.A.; Pop, O.L. The Potential Impact of Smog Spell on Humans’ Health Amid COVID-19 Rages. Int. J. Environ. Res. Public Health 2021, 18, 11408. [Google Scholar] [CrossRef]
  8. Li, X.Q.; Zhang, L.; Yang, Z.Q.; Wang, P.; Yan, Y.F.; Ran, J.Y. Adsorption materials for volatile organic compounds (VOCs) and the key factors for VOCs adsorption process: A review. Sep. Purif. Technol. 2020, 235, 16. [Google Scholar] [CrossRef]
  9. Yang, C.T.; Miao, G.; Pi, Y.H.; Xia, Q.B.; Wu, J.L.; Li, Z.; Xiao, J. Abatement of various types of VOCs by adsorption/catalytic oxidation: A review. Chem. Eng. J. 2019, 370, 1128–1153. [Google Scholar] [CrossRef]
  10. Zhu, L.L.; Shen, D.K.; Luo, K.H. A critical review on VOCs adsorption by different porous materials: Species, mechanisms and modification methods. J. Hazard. Mater. 2020, 389, 27. [Google Scholar] [CrossRef]
  11. Wang, H.C.; Guo, H.; Zhao, Y.X.; Dong, X.Q.; Gong, M.Q. Thermodynamic analysis of a petroleum volatile organic compounds (VOCs) condensation recovery system combined with mixed-refrigerant refrigeration. Int. J. Refrig. 2020, 116, 23–35. [Google Scholar] [CrossRef]
  12. Ozturk, B.; Kuru, C.; Aykac, H.; Kaya, S. VOC separation using immobilized liquid membranes impregnated with oils. Sep. Purif. Technol. 2015, 153, 1–6. [Google Scholar] [CrossRef]
  13. Kujawa, J.; Kujawski, W.; Cyganiuk, A.; Dumee, L.F.; Al-Gharabli, S. Upgrading of zirconia membrane performance in removal of hazardous VOCs from water by surface functionalization. Chem. Eng. J. 2019, 374, 155–169. [Google Scholar] [CrossRef]
  14. Yang, P.; Fan, S.K.; Chen, Z.Y.; Bao, G.F.; Zuo, S.F.; Qi, C.Z. Synthesis of Nb2O5 based solid superacid materials for catalytic combustion of chlorinated VOCs. Appl. Catal. B-Environ. 2018, 239, 114–124. [Google Scholar] [CrossRef]
  15. Zhou, L.L.; Zhang, B.J.; Li, Z.J.; Zhang, X.J.; Liu, R.J.; Yun, J. Amorphous-microcrystal combined manganese oxides for efficiently catalytic combustion of VOCs. Mol. Catal. 2020, 489, 8. [Google Scholar] [CrossRef]
  16. Meena, M.; Sonigra, P.; Yadav, G. Biological-based methods for the removal of volatile organic compounds (VOCs) and heavy metals. Environ. Sci. Pollut. Res. 2021, 28, 2485–2508. [Google Scholar] [CrossRef]
  17. Talaiekhozani, A.; Rezania, S.; Kim, K.H.; Sanaye, R.; Amani, A.M. Recent advances in photocatalytic removal of organic and inorganic pollutants in air. J. Clean Prod. 2021, 278, 23. [Google Scholar] [CrossRef]
  18. Tobaldi, D.M.; Dvoranova, D.; Lajaunie, L.; Rozman, N.; Figueiredo, B.; Seabra, M.P.; Skapin, A.S.; Calvino, J.J.; Brezova, V.; Labrincha, J.A. Graphene-TiO2 hybrids for photocatalytic aided removal of VOCs and nitrogen oxides from outdoor environment. Chem. Eng. J. 2021, 405, 14. [Google Scholar] [CrossRef]
  19. Guo, Y.L.; Wen, M.C.; Li, G.Y.; An, T.C. Recent advances in VOC elimination by catalytic oxidation technology onto various nanoparticles catalysts: A critical review. Appl. Catal. B-Environ. 2021, 281, 19. [Google Scholar] [CrossRef]
  20. Chen, Z.Y.; Mao, J.X.; Zhou, R.X. Preparation of size-controlled Pt supported on Al2O3 nanocatalysts for deep catalytic oxidation of benzene at lower temperature. Appl. Surf. Sci. 2019, 465, 15–22. [Google Scholar] [CrossRef]
  21. Guo, Y.L.; Gao, Y.J.; Li, X.; Zhuang, G.L.; Wang, K.C.; Zheng, Y.; Sun, D.H.; Huang, J.L.; Li, Q.B. Catalytic benzene oxidation by biogenic Pd nanoparticles over 3D-ordered mesoporous CeO2. Chem. Eng. J. 2019, 362, 41–52. [Google Scholar] [CrossRef]
  22. Liu, Y.X.; Dai, H.X.; Deng, J.G.; Xie, S.H.; Yang, H.G.; Tan, W.; Han, W.; Jiang, Y.; Guo, G.S. Mesoporous Co3O4-supported gold nanocatalysts: Highly active for the oxidation of carbon monoxide, benzene, toluene, and o-xylene. J. Catal. 2014, 309, 408–418. [Google Scholar] [CrossRef]
  23. Yang, K.; Liu, Y.X.; Deng, J.G.; Zhao, X.T.; Yang, J.; Han, Z.; Hou, Z.Q.; Dai, H.X. Three-dimensionally ordered mesoporous iron oxide-supported single-atom platinum: Highly active catalysts for benzene combustion. Appl. Catal. B-Environ. 2019, 244, 650–659. [Google Scholar] [CrossRef]
  24. Yang, Q.; Li, Q.; Li, L.; Peng, Y.; Wang, D.; Ma, Y.; Li, J. Synthesis of alpha-MnO2-like rod catalyst using YMn2O5 A-site sacrificial strategy for efficient benzene oxidation. J. Hazard. Mater. 2021, 403, 123811. [Google Scholar] [CrossRef] [PubMed]
  25. Mo, S.P.; Li, S.D.; Li, W.H.; Li, J.Q.; Chen, J.Y.; Chen, Y.F. Excellent low temperature performance for total benzene oxidation over mesoporous CoMnAl composited oxides from hydrotalcites. J. Mater. Chem. A 2016, 4, 8113–8122. [Google Scholar] [CrossRef]
  26. Wang, X.Y.; Zuo, J.C.; Luo, Y.J.; Jiang, L.L. New route to CeO2/LaCoO3 with high oxygen mobility for total benzene oxidation. Appl. Surf. Sci. 2017, 396, 95–101. [Google Scholar] [CrossRef] [Green Version]
  27. Wang, X.Y.; Liu, Y.; Zhang, T.H.; Luo, Y.J.; Lan, Z.X.; Zhang, K.; Zuo, J.C.; Jiang, L.L.; Wang, R.H. Geometrical-Site-Dependent Catalytic Activity of Ordered Mesoporous Co-Based Spinel for Benzene Oxidation: In Situ DRIFTS Study Coupled with Raman and XAFS Spectroscopy. ACS Catal. 2017, 7, 1626–1636. [Google Scholar] [CrossRef]
  28. Yang, Q.; Wang, X.; Wang, X.; Li, Q.; Li, L.; Yang, W.; Chu, X.; Liu, H.; Men, J.; Peng, Y.; et al. Surface Reconstruction of a Mullite-Type Catalyst via Selective Dissolution for NO Oxidation. ACS Catal. 2021, 11, 14507–14520. [Google Scholar] [CrossRef]
  29. Liu, R.Y.; Zhou, B.; Liu, L.Z.; Zhang, Y.; Chen, Y.; Zhang, Q.L.; Yang, M.L.; Hu, L.P.; Wang, M.; Tang, Y.F. Enhanced catalytic oxidation of VOCs over porous Mn-based mullite synthesized by in-situ dismutation. J. Colloid Interface Sci. 2021, 585, 302–311. [Google Scholar] [CrossRef]
  30. Guo, M.; Li, K.; Zhang, H.; Min, X.; Hu, X.; Guo, W.; Jia, J.; Sun, T. Enhanced catalytic activity of oxygenated VOC deep oxidation on highly active in-situ generated GdMn2O5/GdMnO3 catalysts. J. Colloid Interface Sci. 2020, 578, 229–241. [Google Scholar] [CrossRef]
  31. Khatun, N.; Rini, E.G.; Shirage, P.; Rajput, P.; Jha, S.N.; Sen, S. Effect of lattice distortion on bandgap decrement due to vanadium substitution in TiO2 nanoparticles. Mater. Sci. Semicond. Process 2016, 50, 7–13. [Google Scholar] [CrossRef]
  32. Li, S.D.; Zhao, G.X.; Bi, H.; Huang, Z.G.; Lai, H.; Gai, R.Q.; Du, Y.W. Synthesis and anomalous magnetic properties of CoCr2O4 nanocrystallites with lattice distortion. J. Magn. Magn. Mater. 2006, 305, 448–451. [Google Scholar] [CrossRef]
  33. Lin, T.G.; Wang, L.P.; Wang, X.F.; Zhang, Y.F.; Yu, Y.H. Influence of lattice distortion on phase transition properties of polycrystalline VO2 thin film. Appl. Surf. Sci. 2016, 379, 179–185. [Google Scholar] [CrossRef]
  34. O’Connell, J.H.; Lee, M.E.; Yagoub, M.Y.A.; Swart, H.C.; Coetsee, E. Characterization of crystallite morphology for doped strontium fluoride nanophosphors by TEM and XRD. Phys. B 2016, 480, 169–173. [Google Scholar] [CrossRef]
  35. Zhua, G.; Liu, P.; Hojamberdiev, M.; Ge, B.; Liu, Y.; Miao, H.; Tan, G. Synthesis RMn2O5 (R = Gd and Sm) nano- and microstructures by a simple hydrothermal method. Mater. Chem. Phys. 2009, 118, 467–472. [Google Scholar] [CrossRef]
  36. Gorzalski, A.S.; Donley, C.; Coronell, O. Elemental composition of membrane foulant layers using EDS, XPS, and RBS. J. Membr. Sci. 2017, 522, 31–44. [Google Scholar] [CrossRef] [Green Version]
  37. Seo, S.; Chaikittisilp, W.; Koike, N.; Yokoi, T.; Okubo, T. Porous inorganic-organic hybrid polymers derived from cyclic siloxane building blocks: Effects of substituting groups on mesoporous structures. Microporous Mesoporous Mater. 2019, 278, 212–218. [Google Scholar] [CrossRef]
  38. Chen, J.H.; Shen, M.Q.; Wang, X.Q.; Qi, G.S.; Wang, J.; Li, W. The influence of nonstoichiometry on LaMnO3 perovskite for catalytic NO oxidation. Appl. Catal. B-Environ. 2013, 134, 251–257. [Google Scholar] [CrossRef]
  39. Wu, Y.S.; Lu, Y.; Song, C.J.; Ma, Z.C.; Xing, S.T.; Gao, Y.Z. A novel redox-precipitation method for the preparation of alpha-MnO2 with a high surface Mn4+ concentration and its activity toward complete catalytic oxidation of o-xylene. Catal. Today 2013, 201, 32–39. [Google Scholar] [CrossRef]
  40. Yang, J.; Hu, S.Y.; Fang, Y.R.; Hoang, S.; Li, L.; Yang, W.W.; Liang, Z.F.; Wu, J.; Hu, J.P.; Xiao, W.; et al. Oxygen Vacancy Promoted O-2 Activation over Perovskite Oxide for Low-Temperature CO Oxidation. ACS Catal. 2019, 9, 9751–9763. [Google Scholar] [CrossRef]
  41. Mo, S.P.; Zhang, Q.; Li, J.Q.; Sun, Y.H.; Ren, Q.M.; Zou, S.B.; Zhang, Q.; Lu, J.H.; Fu, M.L.; Mo, D.Q.; et al. Highly efficient mesoporous MnO2 catalysts for the total toluene oxidation: Oxygen-Vacancy defect engineering and involved intermediates using in situ DRIFTS. Appl. Catal. B-Environ. 2020, 264, 16. [Google Scholar] [CrossRef]
  42. Wu, M.D.; Chen, S.Y.; Xiang, W.G. Oxygen vacancy induced performance enhancement of toluene catalytic oxidation using LaFeO3 perovskite oxides. Chem. Eng. J. 2020, 387, 12. [Google Scholar] [CrossRef]
Figure 1. XRD patterns of GMO, GMO-H-9, and GMO-H.
Catalysts 12 01267 g001
Figure 2. SEM images of GMO (ac) and GMO-H (df), and TEM images of GMO (gi) and GMO-H (jl).
Catalysts 12 01267 g002
Figure 3. TEM-EDS elemental mapping images of GMO (a) and GMO-H (b), GMO (a’), and GMO-H (b’).
Catalysts 12 01267 g003
Figure 4. XPS spectra of GMO and GMO-H.
Catalysts 12 01267 g004
Figure 5. H2-TPR and O2-TPD of GMO, GMO-H.
Catalysts 12 01267 g005
Figure 6. (A) Effect of conversion of Benzene on GMO, GMO-H-9, GMO-H, and GMO-H-19; (B) 72 h stability of GMO-H at 300 °C. (Reaction conditions: 0.10 g catalyst, 600 ppm C6H6, 20% O2, balance N2, total flow = 50 mL min−1, WHSV = 30,000 mL g−1 h−1, each point corresponds to steady-state conditions.)
Catalysts 12 01267 g006
Figure 7. (A) Water resistance of GMO-H at 300 °C.; (B) Arrhenius plots of catalysts for the catalytic combustion of Benzene; (C) Four-cycle test performance of GMO-H (reaction conditions: 0.10 g catalyst, 600 ppm C6H6, 20% O2, N2 balance, total flow = 50 mL min−1, WHSV = 30,000 mL g−1 h−1; each point corresponds to steady-state conditions); (D) Benzene catalytic activity of GMO-H at different WHSV.
Catalysts 12 01267 g007
Table 1. ICP results, TEM-EDS mapping, and surface elemental composition (XPS) of GMO, GMO-H.
CatalystICP
(ppm)
Atomic%
(TEM-EDS Mapping)
Surface Element Molar Ratio (XPS)
Gd/MnGd/MnGd/MnOlatt/OadsMn4+/Mn3+AOS
GMO0.470.460.734.270.313.1
GMO-H0.390.400.333.480.423.3
Table 2. BET results, H2 consumption, O2 relative consumption, and Benzene conversions for GMO, GMO-H-9, GMO-H, and GMO-H-19.
CatalystSurface Area
(m2 g−1)
Pore Size(nm)Ea
(kJ mol−1)
H2 Consumption (mmol g−1)O2-TPD
Peak Area
Benzene Conversions a (°C)
TotalαβT50%T90%T100%
GMO30.416.432.53.740.500.160.34310405490
GMO-H-948.611.724.7 235345395
GMO-H52.910.923.44.20626.02221.22404.80220310340
GMO-H-1946.511.432.5 225405
a The temperatures of Benzene conversions were obtained from Figure 6A.
Publisher’s Note: MDPI stays neutral with regard to jurisdictional claims in published maps and institutional affiliations.

