
A Highly Active NiMoAl Catalyst Prepared by a Solvothermal Method for the Hydrogenation of Methyl Acrylate

Abstract
:1. Introduction
2. Results and Discussion
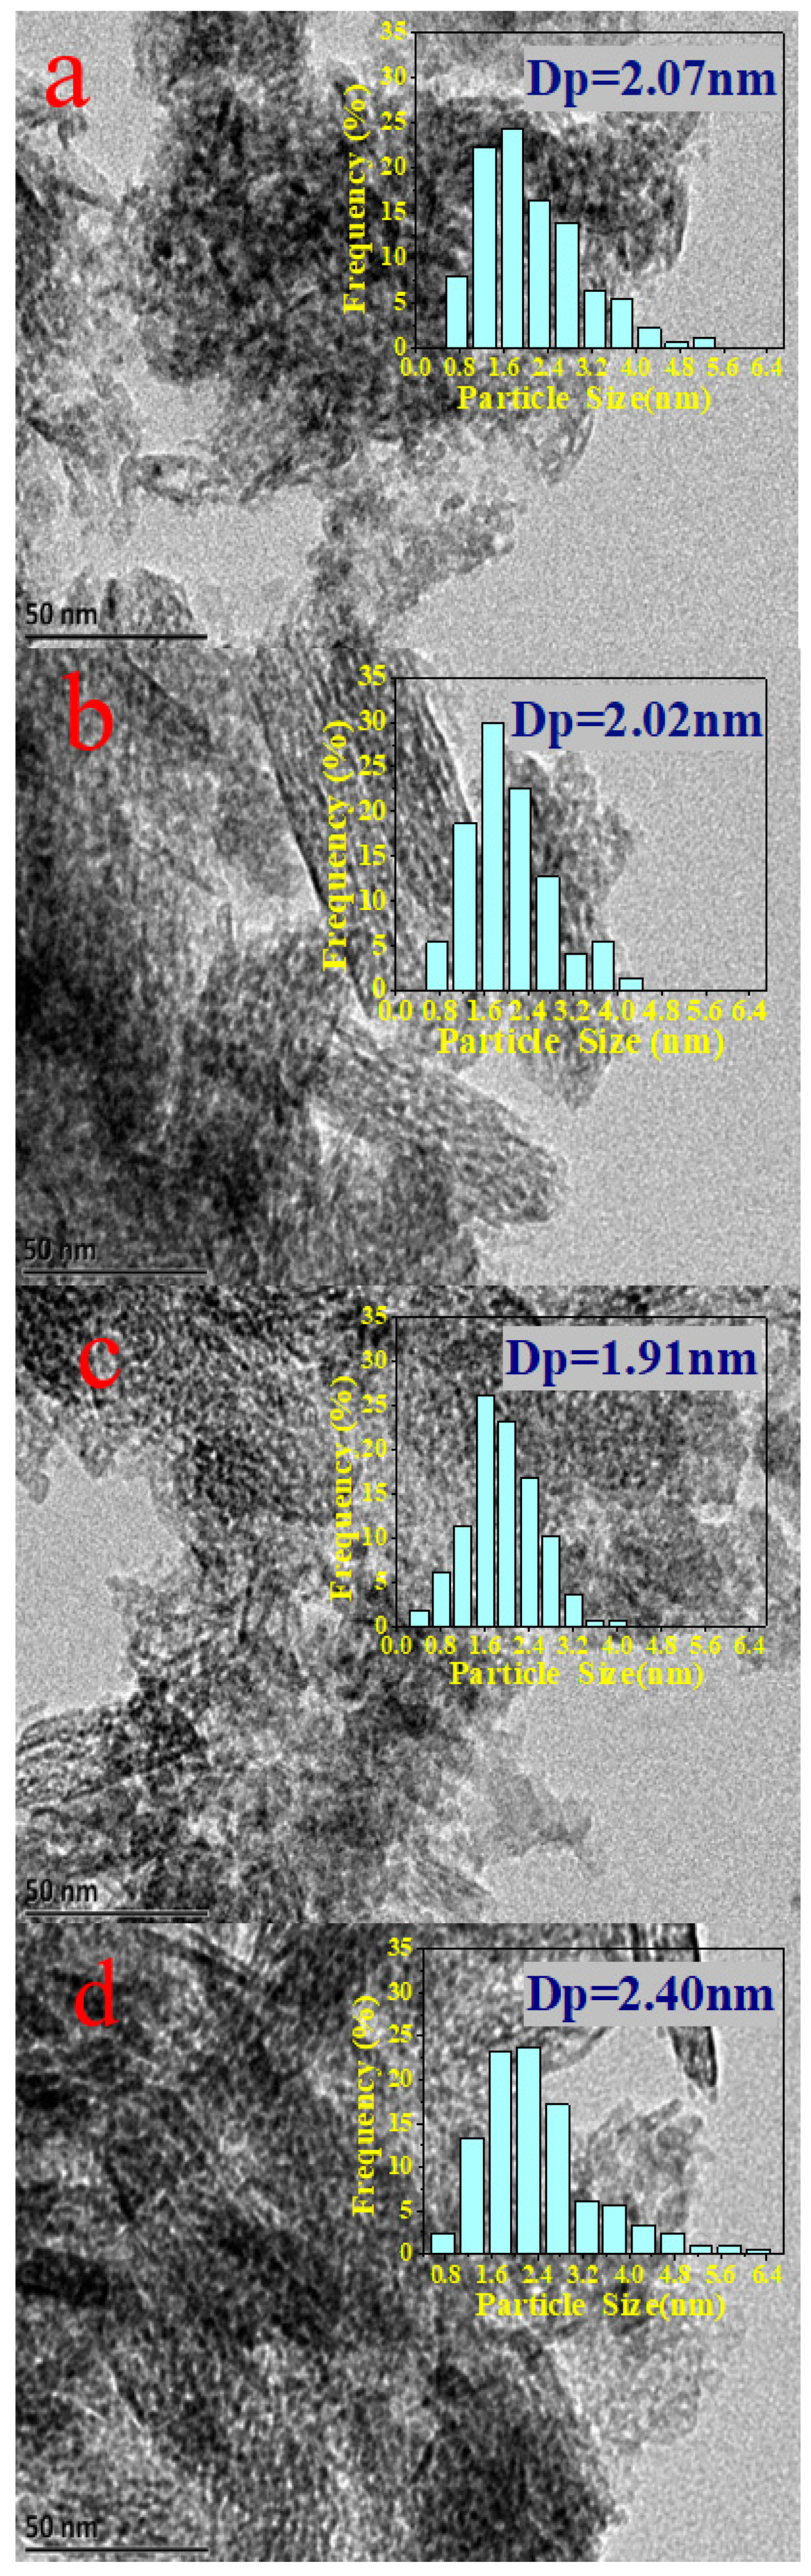
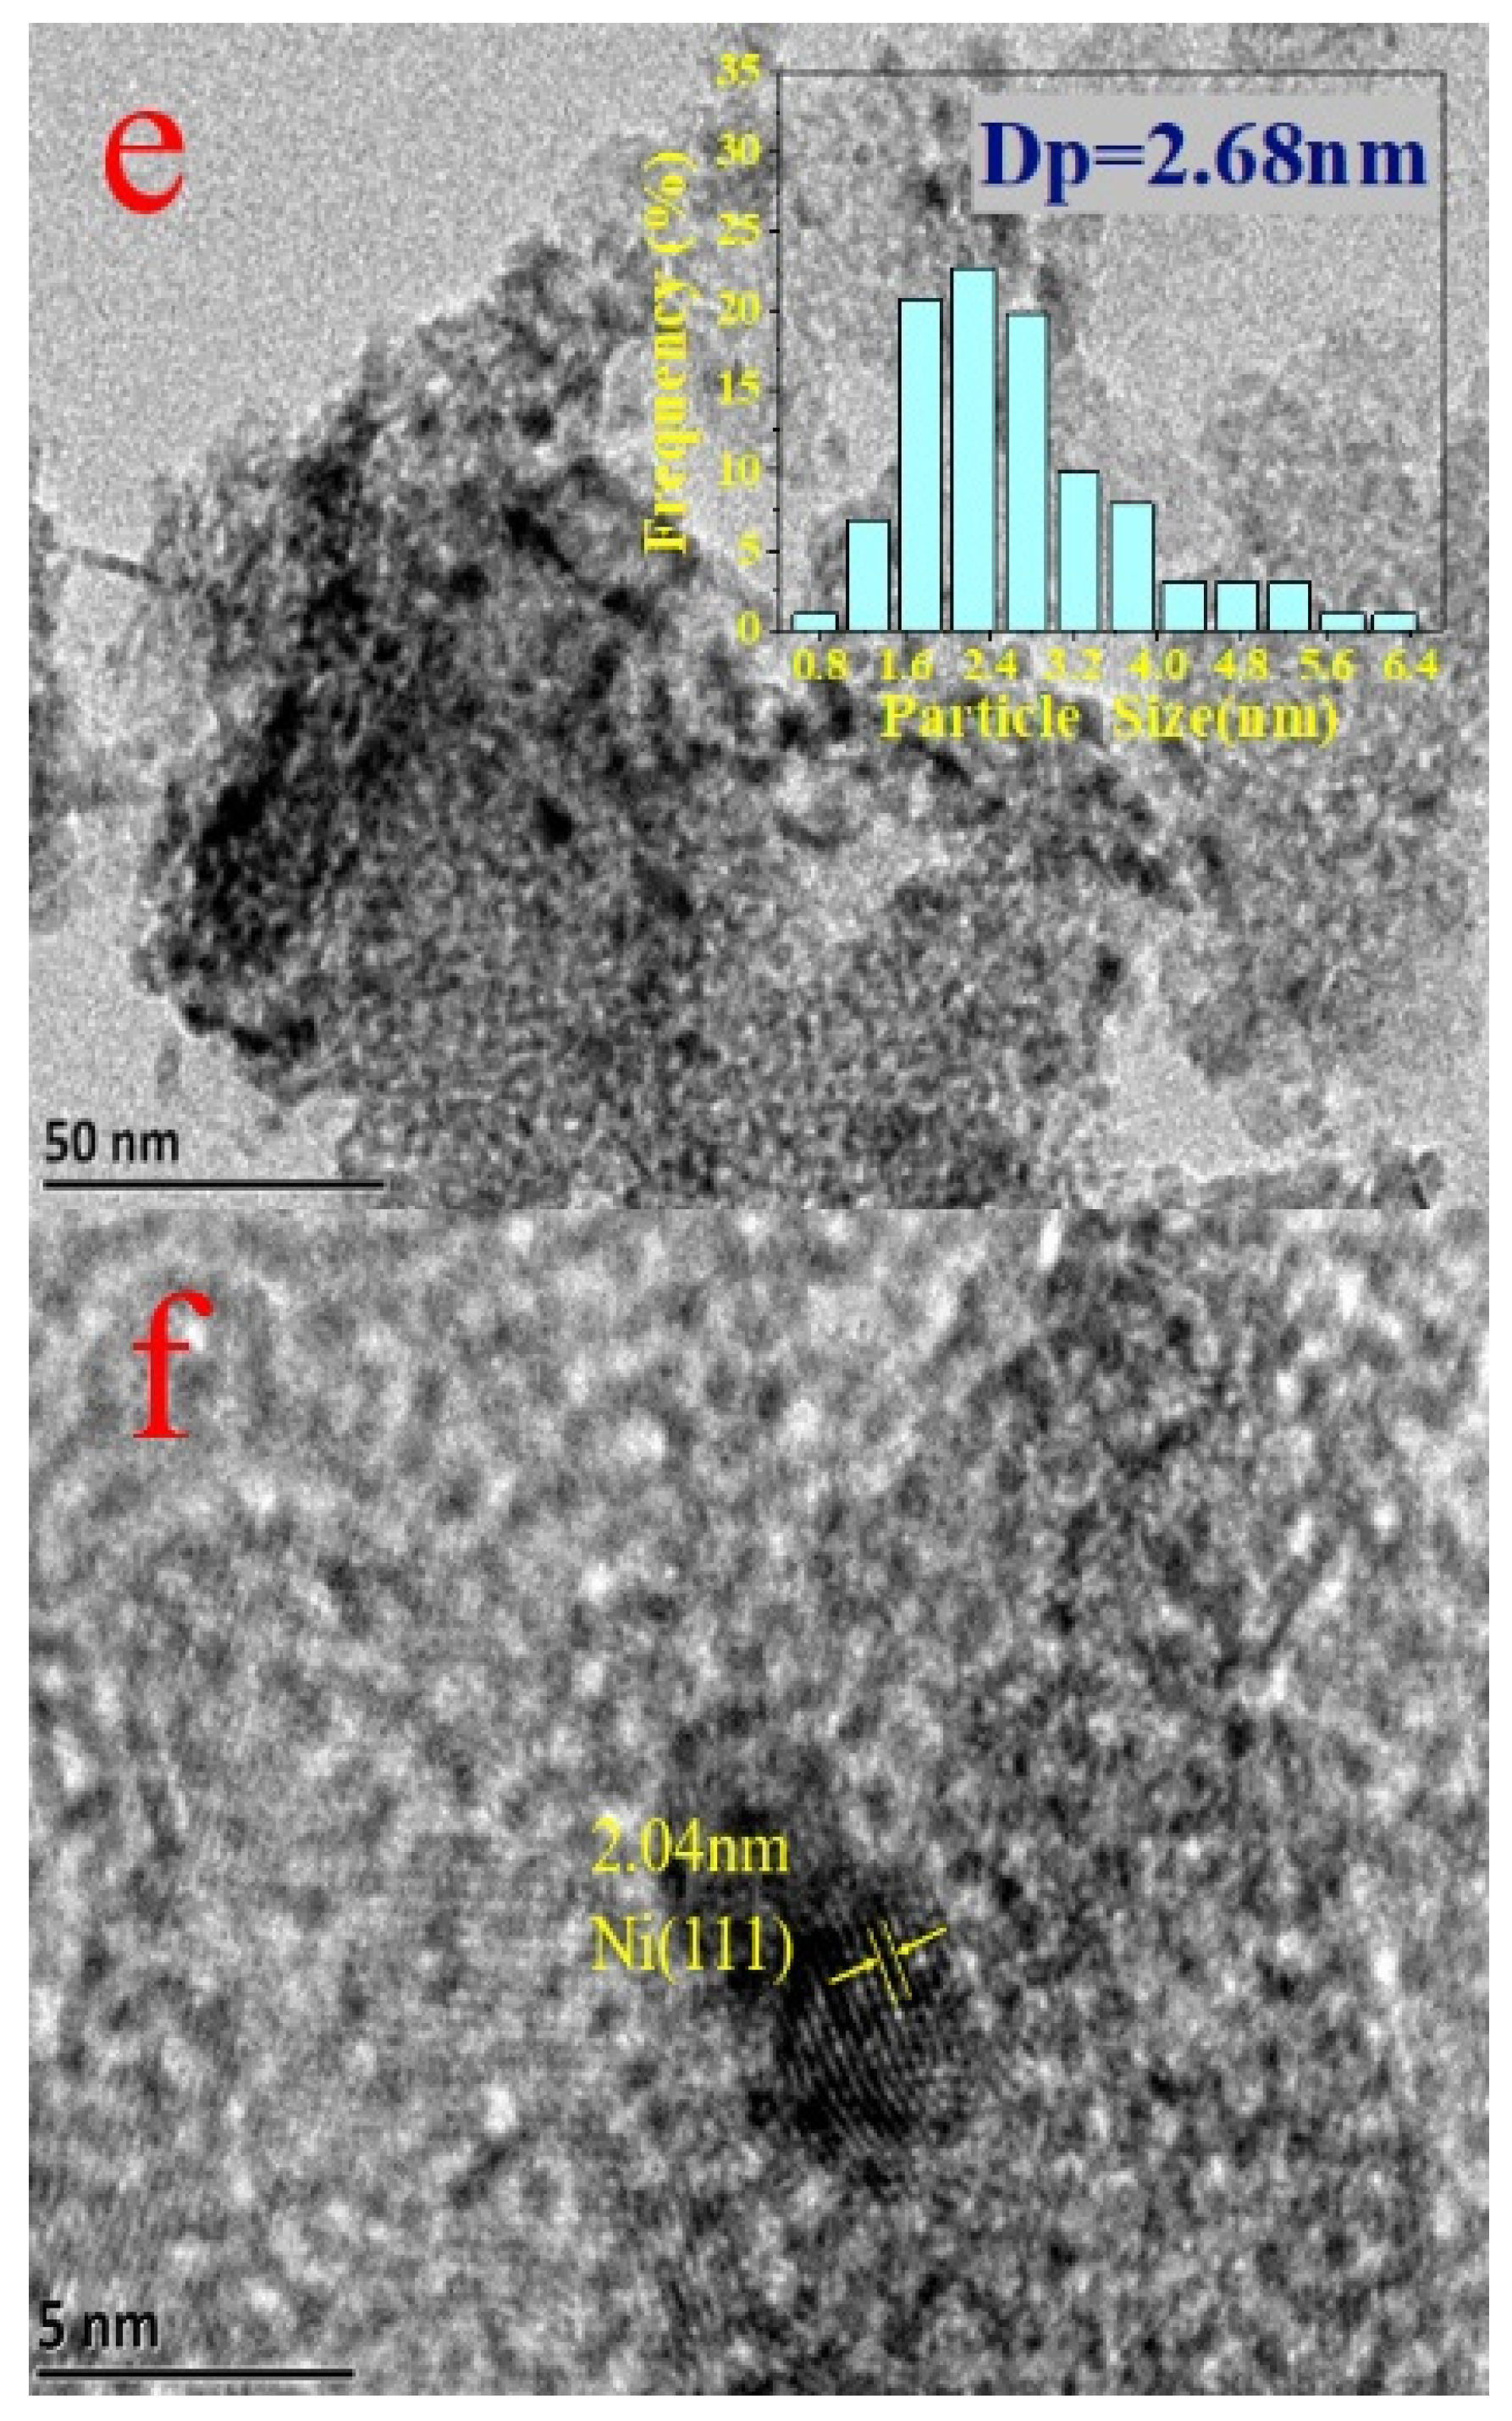
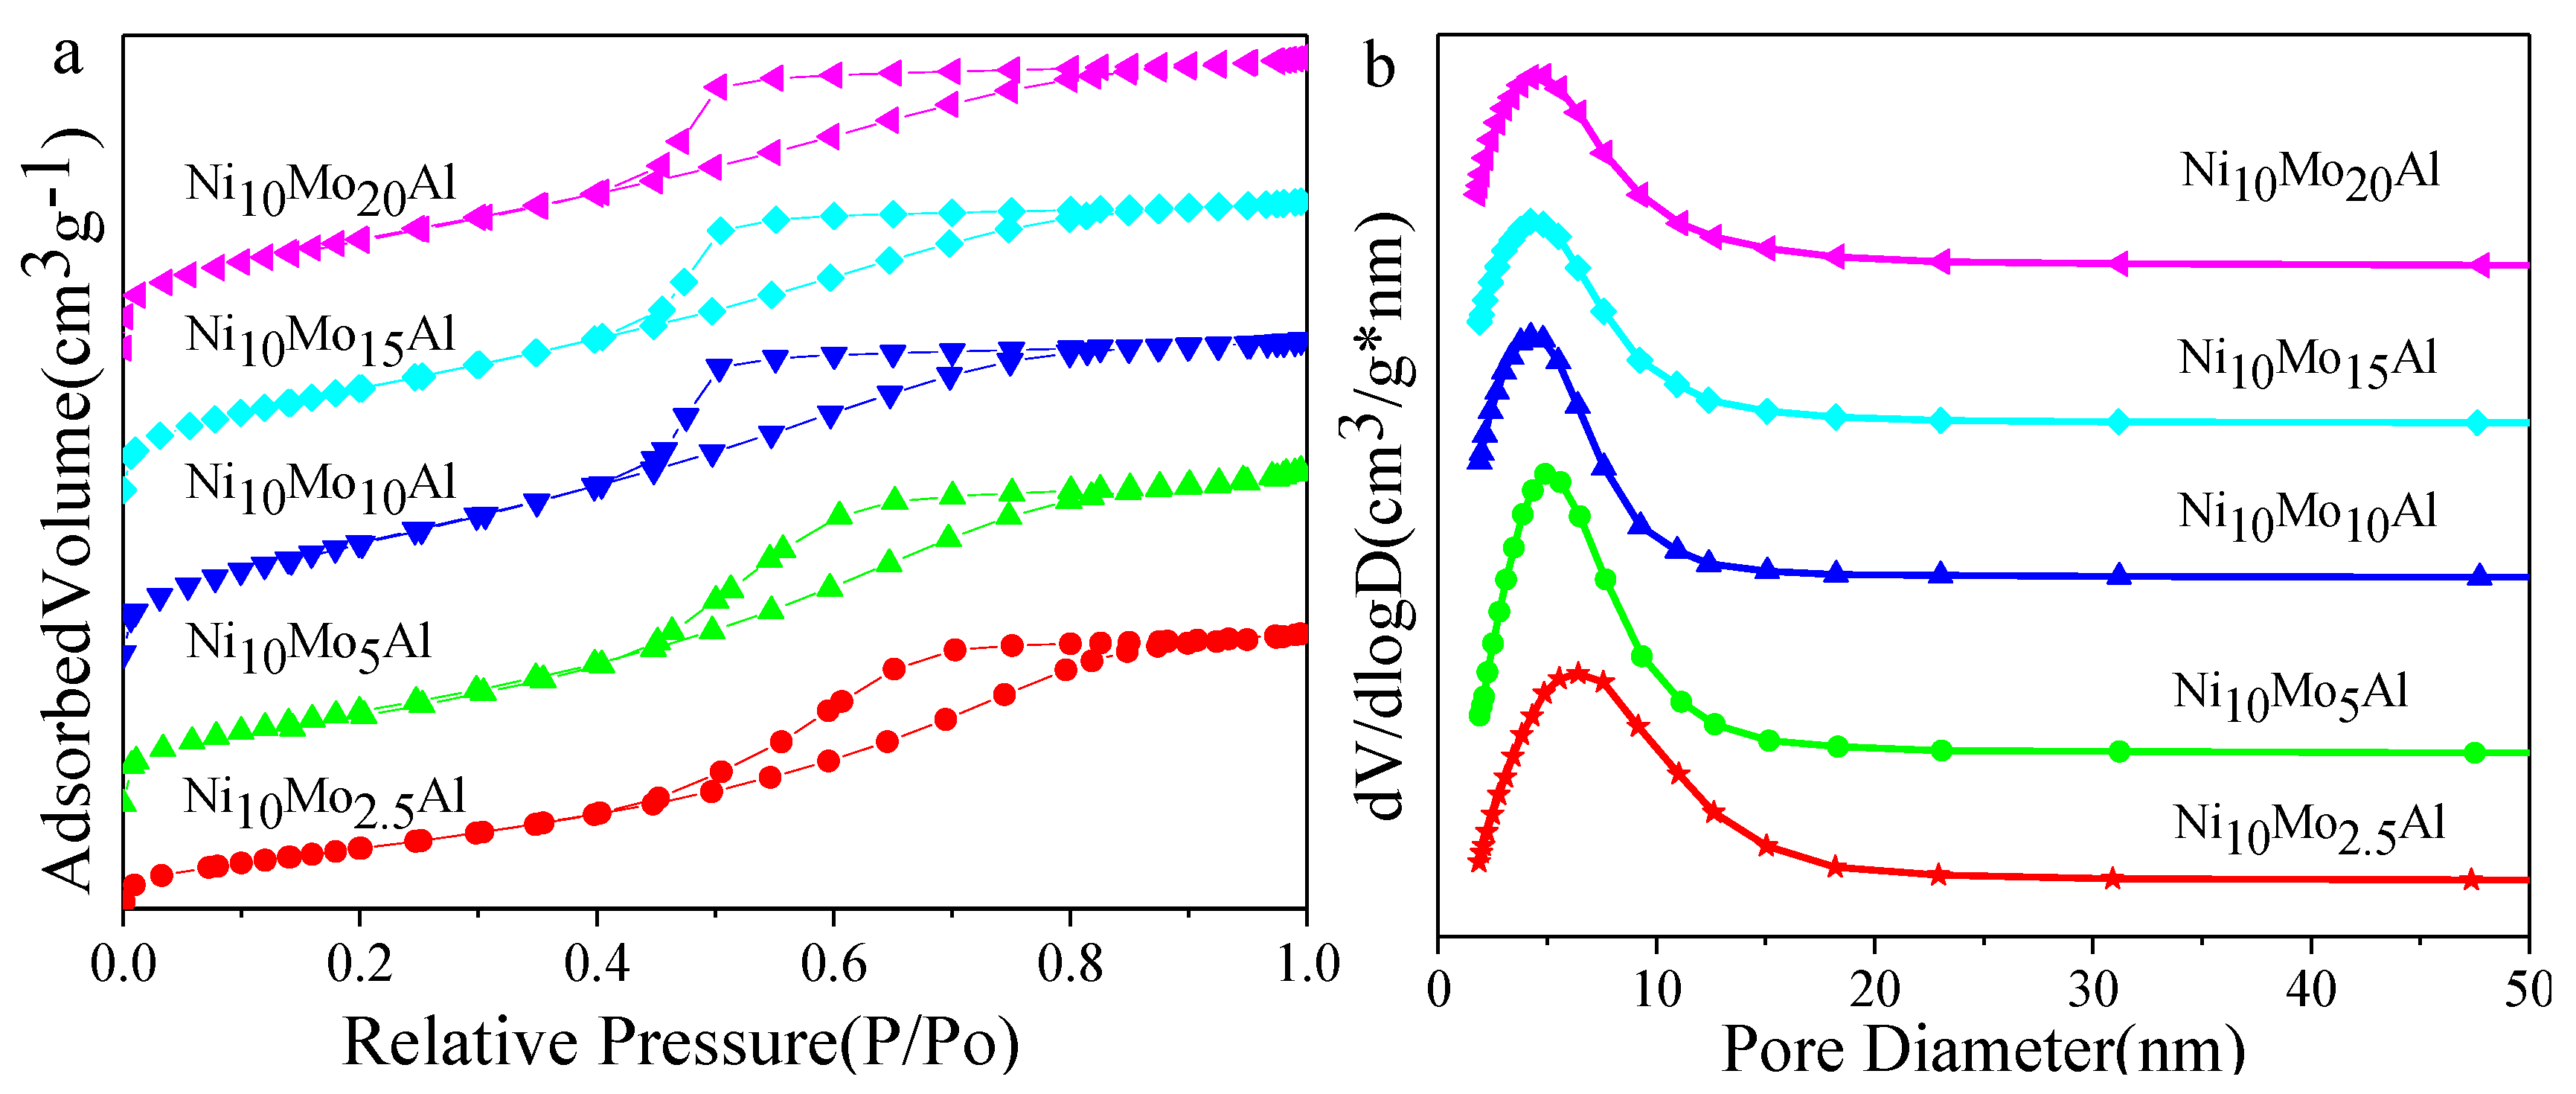
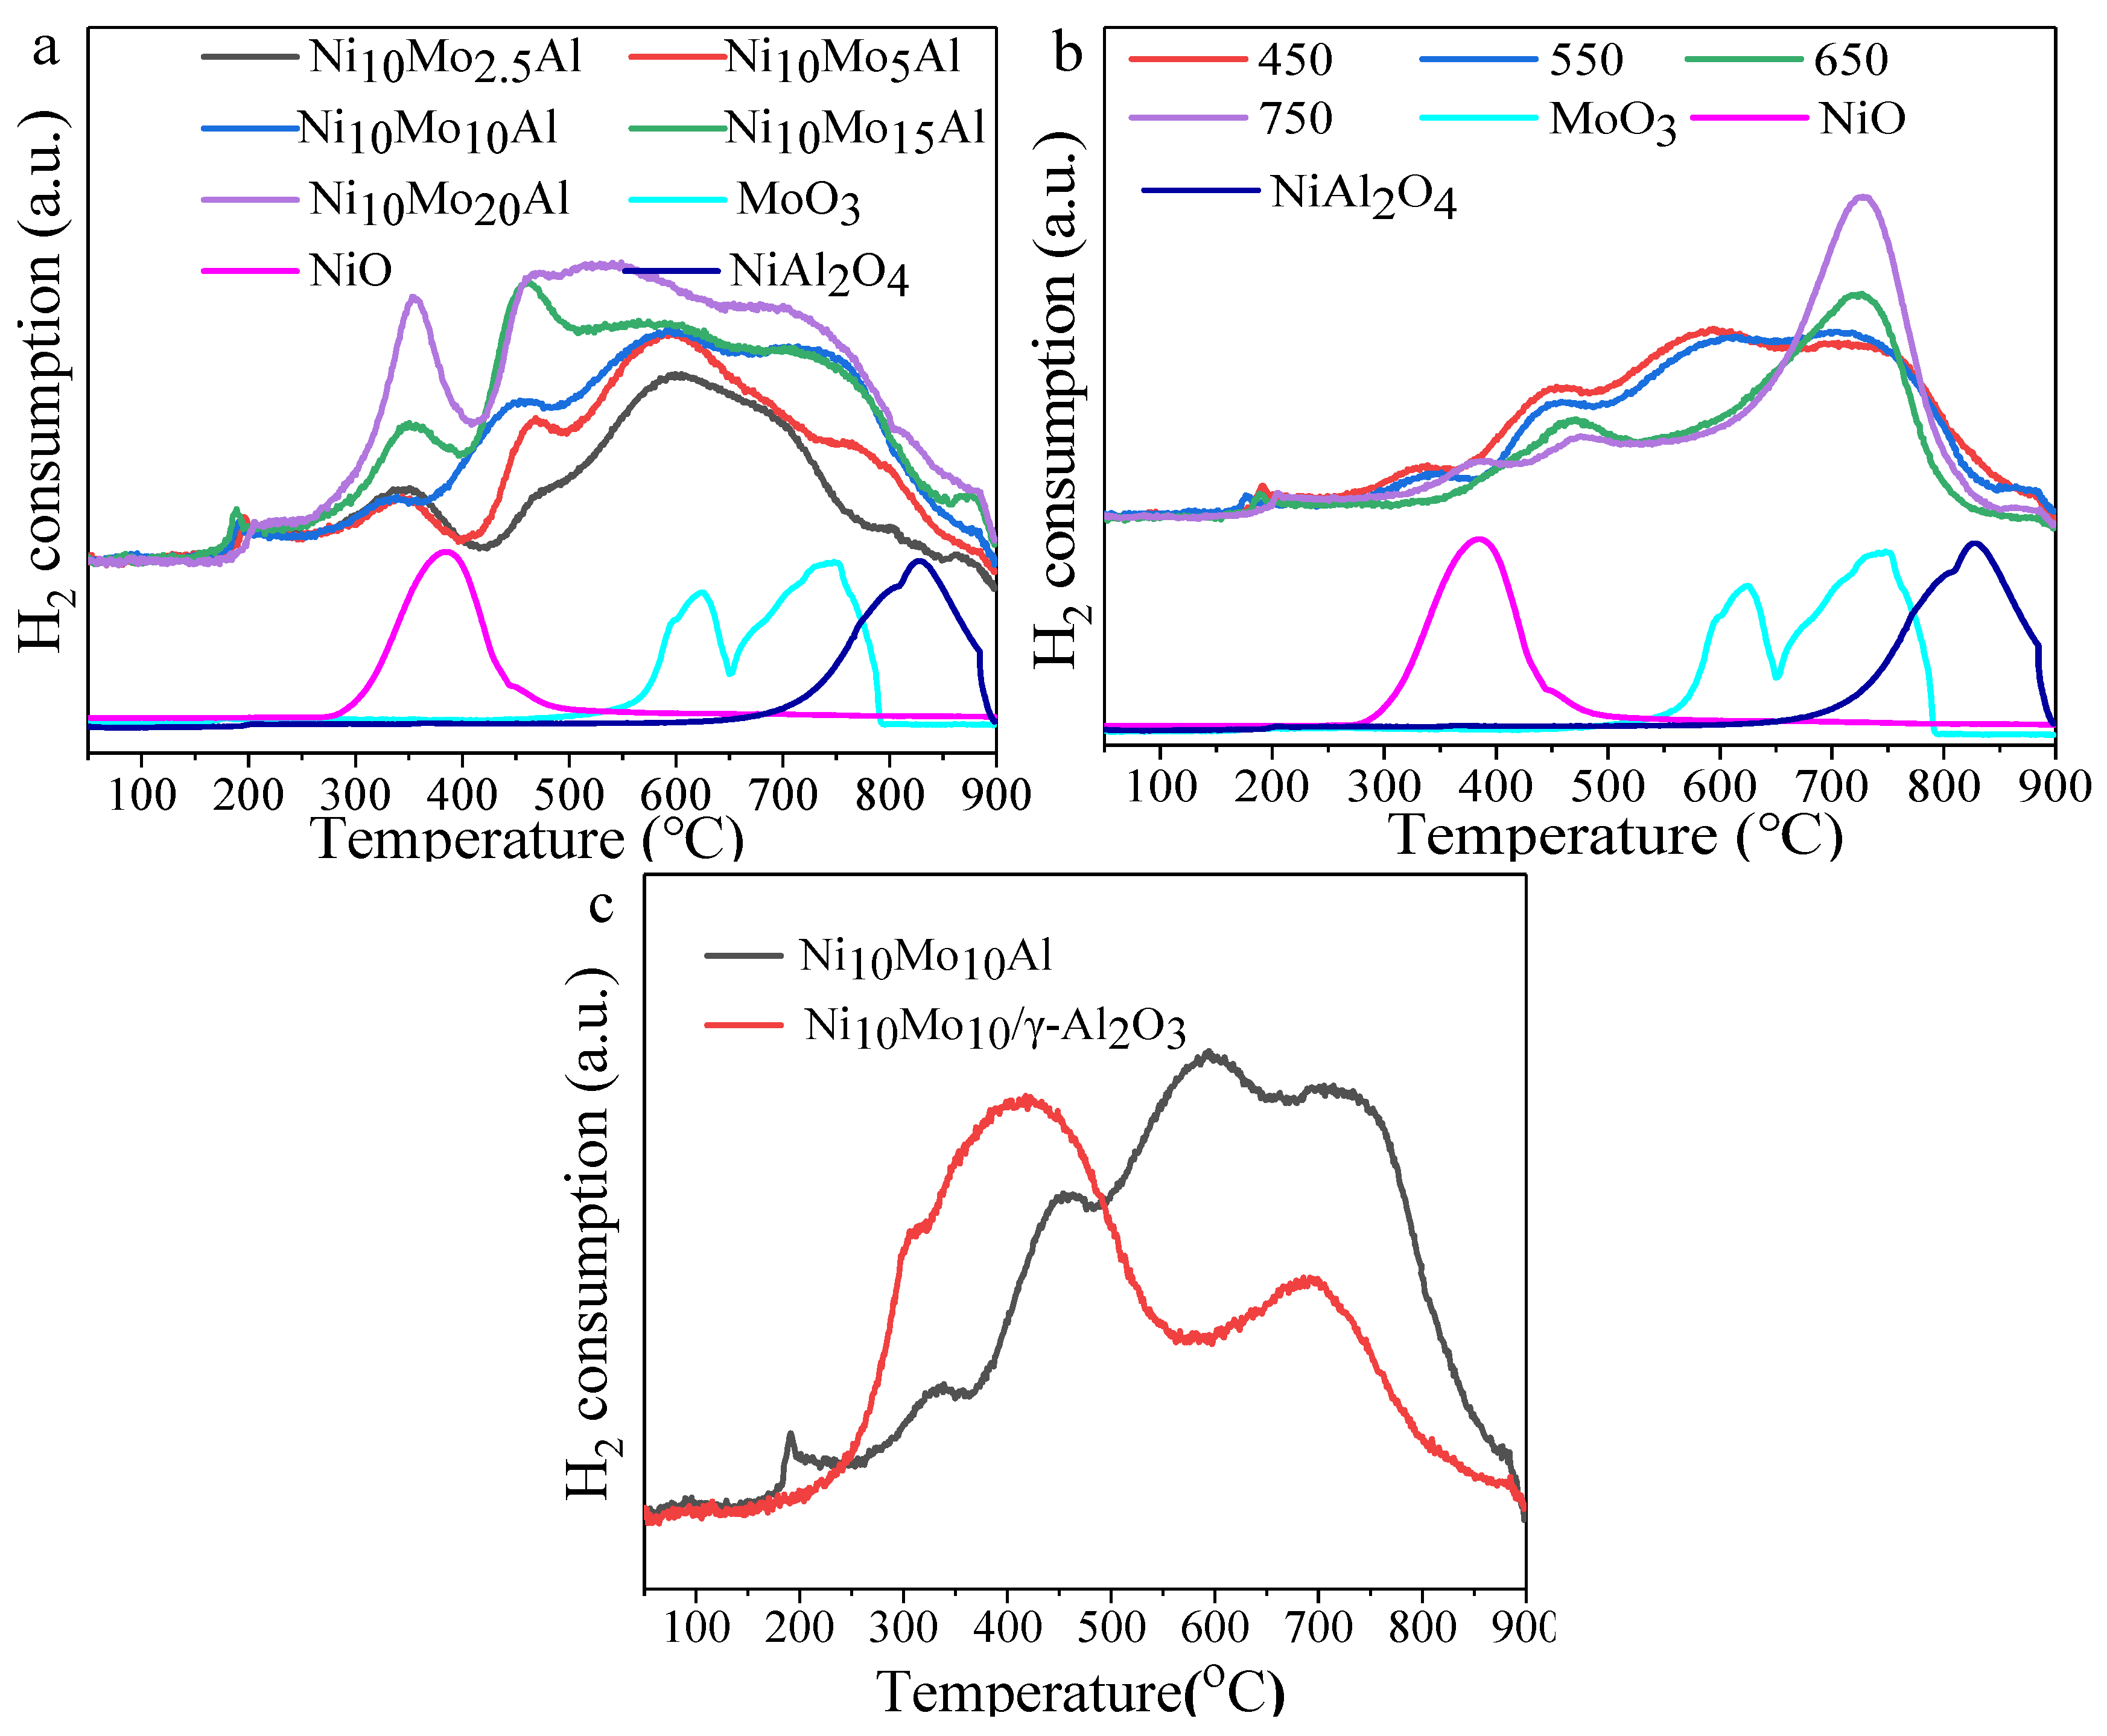
2.1. Characterization of Catalysts
2.2. Catalytic Evaluation
3. Experimental Section
3.1. Catalyst Preparation
3.2. Catalyst Characterization
3.3. Catalytic Testing
4. Conclusions
Supplementary Materials
Author Contributions
Funding
Data Availability Statement
Conflicts of Interest
References
- Chen, Z.; Wu, D. Novel Route for the Synthesis of Methyl Propionate from 3-Pentanone with Dimethyl Carbonate over Solid Bases. Ind. Eng. Chem. Res. 2011, 50, 12343–12348. [Google Scholar] [CrossRef]
- Ai, M. Formation of methyl methacrylate from methyl propionate and methanol. Catal. Today 2006, 111, 398–402. [Google Scholar] [CrossRef]
- Dudu, W.; Zhi, C.; Shangde, L.; Zhenbin, J. Synthesis of Methyl Propionate from Dimethyl Carbonate and 3-Pentanone over Solid Base Catalyst. Petrochem. Technol. 2009, 38, 423–427. [Google Scholar]
- Breysse, E.; Fajula, F.; Finiels, A.; Frémy, G.; Lamotte, J.; Maugé, F.; Lavalley, J.-C.; Moreau, C. Kinetic and FT-IR study for the mechanism of addition of hydrogen sulfide to methyl acrylate over solid basic catalysts. J. Mol. Catal. A Chem. 2003, 198, 185–194. [Google Scholar] [CrossRef]
- Matsushita, T.; Shiraishi, Y.; Horiuchi, S.; Toshima, N. Synthesis and Catalysis of Polymer-Protected Pd/Ag/Rh Trimetallic Nanoparticles with a Core–Shell Structure. Bull. Chem. Soc. Jpn. 2007, 80, 1217–1225. [Google Scholar] [CrossRef]
- Girvin, Z.C.; Lampkin, P.P.; Liu, X.; Gellman, S.H. Catalytic Intramolecular Conjugate Additions of Aldehyde-Derived Enamines to α,β-Unsaturated Esters. Org. Lett. 2020, 22, 4568–4573. [Google Scholar] [CrossRef]
- Trzeciak, A.M.; Ziółkowski, J.J. New insight into role of ortho-metallation in rhodium triphenylphosphite complexes. Hydrogen mobility in hydrogenation and isomerization of unsaturated substrates. J. Organomet. Chem. 2000, 597, 69–76. [Google Scholar] [CrossRef]
- Shiraishi, Y.; Nakayama, M.; Takagi, E.; Tominaga, T.; Toshima, N. Effect of quantity of polymer on catalysis and superstructure size of polymer-protected Pt nanoclusters. Inorg. Chim. Acta 2000, 300, 964–969. [Google Scholar] [CrossRef]
- Chen, X.; Zuo, H.; Qing, L.U.; Liu, A. Studies on Catalyzed Hydrogenation of Olef ins by Palladium (II) Complexes with Polyfunctional(P,N,O) Phosphine Ligands. J. Mol. Catal. 2001, 15, 451–453. [Google Scholar]
- Chunfu, C.; Juntan, S.; Hong, L.; Binglin, H. Study on The Hydrogenation of Methyl Acrylate Catalyzed by Pd/dvb Crosslinked Poly-(N-Vinyl Pyrrolidone). Chin. J. Poly. Sci. 1990, 8, 295–301. [Google Scholar]
- Kuhaudomlap, S.; Praserthdam, P.; Shirai, M.; Panpranot, J. Highly active and stable Ni-incorporated spherical silica catalysts for CO2 methanation. Catal. Today 2020, 358, 30–36. [Google Scholar] [CrossRef]
- Zhang, H.; Dong, J.; Qiao, X.; Qin, J.; Sun, H.; Wang, A.; Niu, L.; Bai, G. In-Situ generated highly dispersed nickel nanoclusters confined in MgAl mixed metal oxide platelets for benzoic acid hydrogenation. J. Catal. 2019, 372, 258–265. [Google Scholar] [CrossRef]
- Prins, R. Catalytic Hydrodenitrogenation. Adv. Catal. 2000, 46, 399–464. [Google Scholar]
- Furimsky, E.; Massoth, F.E. Hydrodenitrogenation of Petroleum. Catal. Rev. 2005, 47, 297–489. [Google Scholar] [CrossRef]
- Zhang, R.; Wei, A.; Zhu, M.; Wu, X.; Wang, H.; Zhu, X.; Ge, Q. Tuning reverse water gas shift and methanation reactions during CO2 reduction on Ni catalysts via surface modification by MoOx. J. CO2 Util. 2021, 52, 101678. [Google Scholar] [CrossRef]
- Kordouli, E.; Pawelec, B.; Bourikas, K.; Kordulis, C.; Fierro, J.L.G.; Lycourghiotis, A. Mo promoted Ni–Al2O3 co-precipitated catalysts for green diesel production. Appl. Catal. B 2018, 229, 139–154. [Google Scholar] [CrossRef]
- Lv, L.; Bo, Y.; Ji, D.; Han, W.; Liu, H.; Gao, X.; Xu, C.; Liu, H. Layered Double Hydroxide Method for Preparing Ni–Mo/γ–Al2O Ultradeep Hydrodesulfurization Catalysts. Ind. Eng. Chem. Res. 2018, 57, 13889–13894. [Google Scholar] [CrossRef]
- Sun, T.; Wu, Z.; Wang, G.; Li, Z.; Li, C.; Wang, E. Efficient Promotional Effects of Mo on the Catalytic Hydrogenation of Methyl Acrylate over Ni-Based Catalysts under Mild Conditions. Ind. Eng. Chem. Res. 2021, 61, 152–163. [Google Scholar] [CrossRef]
- Wei, Q.; Gao, X.; Liu, G.; Yang, R.; Zhang, H.; Yang, G.; Yoneyama, Y.; Tsubaki, N. Facile one-step synthesis of mesoporous Ni–Mg–Al catalyst for syngas production using coupled methane reforming process. Fuel 2018, 211, 1–10. [Google Scholar] [CrossRef]
- Gao, L.; Luo, Y.; Wan, P.; Liu, Z. Theoretical and experimental investigations on mechanical properties of (Fe,Ni)Sn2 intermetallic compounds formed in SnAgCu/Fe-Ni solder joints. Mater. Charact. 2021, 178, 111195. [Google Scholar] [CrossRef]
- Miao, R.; Yu, X.; Zeng, W. Novel NiO flower-like microspheres with abundant nanoparticles adhering to the petals: Hydrothermal synthesis and their gas sensing properties. Mater. Lett. 2016, 173, 107–110. [Google Scholar] [CrossRef]
- Miao, R.; Zeng, W.; Gao, Q. SDS-assisted hydrothermal synthesis of NiO flake-flower architectures with enhanced gas-sensing properties. Appl. Surf. Sci. 2016, 384, 304–310. [Google Scholar] [CrossRef]
- Wang, J.; Zeng, W.; Wang, Z. Assembly of 2D nanosheets into 3D flower-like NiO: Synthesis and the influence of petal thickness on gas-sensing properties. Ceram. Int. 2016, 42, 4567–4573. [Google Scholar] [CrossRef]
- Li, J.; Li, J.; Yu, T.; Ding, F.; Xu, G.; Li, Z.; Zhao, Y.; Kang, F. Stabilizing the structure and suppressing the voltage decay of Li[Li0.2Mn0.54Co0.13Ni0.13]O2 cathode materials for Li-ion batteries via multifunctional Pr oxide surface modification. Ceram. Int. 2016, 42, 18620–18630. [Google Scholar] [CrossRef]
- Shen, Z.; Ke, M.; Yu, P.; Liu, S.; Song, Z.; Jiang, Q. Catalytic activities of Mo-modified Ni/Al2O3 catalysts for thioetherification of mercaptans and di-olefins in fluid catalytic cracking naphtha. Transit. Met. Chem. 2012, 37, 587–593. [Google Scholar] [CrossRef]
- Yang, F.; Libretto, N.J.; Komarneni, M.R.; Zhou, W.; Miller, J.T.; Zhu, X.; Resasco, D.E. Enhancement of m-Cresol Hydrodeoxygenation Selectivity on Ni Catalysts by Surface Decoration of MoOx Species. ACS Catal. 2019, 9, 7791–7800. [Google Scholar] [CrossRef]
- Ortega-Domínguez, R.A.; Vargas-Villagrán, H.; Peñaloza-Orta, C.; Saavedra-Rubio, K.; Bokhimi, X.; Klimova, T.E. A facile method to increase metal dispersion and hydrogenation activity of Ni/SBA-15 catalysts. Fuel 2017, 198, 110–122. [Google Scholar] [CrossRef]
- Yang, R.; Li, X.; Wu, J.; Zhang, X.; Zhang, Z.; Cheng, Y.; Guo, J. Hydrotreating of crude 2-ethylhexanol over Ni/Al2O3 catalysts: Surface Ni species-catalytic activity correlation. Appl. Catal. A Gen. 2009, 368, 105–112. [Google Scholar] [CrossRef]
- He, D.; Zhang, Y.; Wang, Z.; Mei, Y.; Jiang, Y. Bi-reforming of Methane with Carbon Dioxide and Steam on Nickel-Supported Binary Mg–Al Metal Oxide Catalysts. Energ Fuels 2020, 34, 4822–4827. [Google Scholar] [CrossRef]
- Fan, X.; Liu, D.; Zhao, Z.; Li, J.; Liu, J. Influence of Ni/Mo ratio on the structure-performance of ordered mesoporous Ni–Mo–O catalysts for oxidative dehydrogenation of propane. Catal. Today 2020, 339, 67–78. [Google Scholar] [CrossRef]
- Liu, Z.; Han, W.; Hu, D.; Sun, S.; Hu, A.; Wang, Z.; Jia, Y.; Zhao, X.; Yang, Q. Effects of Ni–Al2O3 interaction on NiMo/Al2O3 hydrodesulfurization catalysts. J. Catal. 2020, 387, 62–72. [Google Scholar] [CrossRef]
- Cheng, D.; Wang, Z.; Xia, Y.; Wang, Y.; Zhang, W.; Zhu, W. Catalytic amination of diethylene glycol with tertiarybutylamine over Ni–Al2O3 catalysts with different Ni/Al ratios. RSC Adv. 2016, 6, 102373–102380. [Google Scholar] [CrossRef]
- Kim, P.; Kim, Y.; Kim, H.; Song, I.K.; Yi, J. Synthesis and characterization of mesoporous alumina with nickel incorporated for use in the partial oxidation of methane into synthesis gas. Appl. Catal. A Gen. 2004, 272, 157–166. [Google Scholar] [CrossRef]
- Cárdenas-Lizana, F.; Gómez-Quero, S.; Baddeley, C.J.; Keane, M.A. Tunable gas phase hydrogenation of m-dinitrobenzene over alumina supported Au and Au–Ni. Appl. Catal. A Gen. 2010, 387, 155–165. [Google Scholar] [CrossRef]
- Sarbak, Z.; Jozwiak, W.K. Thermal characterisation of molybdenum and platinum-molybdenum catalysts. J. Therm. Anal. Calorim. 2007, 87, 229–232. [Google Scholar] [CrossRef]
- Kukushkin, R.G.; Bulavchenko, O.A.; Kaichev, V.V.; Yakovlev, V.A. Influence of Mo on catalytic activity of Ni-based catalysts in hydrodeoxygenation of esters. Appl. Catal. B 2015, 163, 531–538. [Google Scholar] [CrossRef]
- Fang, D.; He, F.; Xie, J.; Xue, L. Calibration of Binding Energy Positions with C1s for XPS Results. J. Wuhan Univ. Technol. 2020, 35, 711–718. [Google Scholar] [CrossRef]
- Ohana, T.; Nakamura, T.; Goto, A.; Tsugawa, K.; Tanaka, A.; Koga, Y. The characterization of nanocrystal graphite films deposited by ECR plasma sputtering. Diam. Relat. Mater. 2003, 12, 2011–2015. [Google Scholar] [CrossRef]
- Wang, X.; Ozkan, U.S. Effect of pre-treatment conditions on the performance of sulfided Ni–Mo/γ–Al2O3 catalysts for hydrogenation of linear aldehydes. J. Mol. Catal. A Chem. 2005, 232, 101–112. [Google Scholar] [CrossRef]
- Ameen, M.; Azizan, M.T.; Ramli, A.; Yusup, S.; Alnarabiji, M.S. Catalytic hydrodeoxygenation of rubber seed oil over sonochemically synthesized Ni–Mo/γ–Al2O3 catalyst for green diesel production. Ultrason. Sonochem. 2019, 51, 90–102. [Google Scholar] [CrossRef]
- Pillay, B.; Mathebula, M.R.; Friedrich, H.B. The oxidative dehydrogenation of n-hexane over Ni–Mo–O catalysts. Appl. Catal. A Gen. 2009, 361, 57–64. [Google Scholar] [CrossRef]


| Catalyst | Ni Content a (wt%) | Mo Content a (wt%) |
|---|---|---|
| Ni10Mo2.5Al | 6.85 | 1.29 |
| Ni10Mo5Al | 6.59 | 2.90 |
| Ni10Mo10Al | 6.58 | 6.07 |
| Ni10Mo15Al | 6.55 | 8.42 |
| Ni10Mo20Al | 6.59 | 11.15 |
| Catalyst | SBET a (m2/g) | Pore Volume b (cm3/g) | Average Pore Diameter b (nm) |
|---|---|---|---|
| Ni10Mo2.5Al | 335 | 0.48 | 4.81 |
| Ni10Mo5Al | 345 | 0.36 | 4.15 |
| Ni10Mo10Al | 341 | 0.34 | 3.74 |
| Ni10Mo15Al | 319 | 0.30 | 3.71 |
| Ni10Mo20Al | 314 | 0.29 | 3.17 |
| Sample | Percentage of Surface Mo and Ni Species Detected by XPS (%) | |||||
|---|---|---|---|---|---|---|
| Mo6+ | Mo5+ | Mo4+ | Ni0 | NiO | NiAl2O4 | |
| Ni10Mo2.5Al | 17.2 | 46.3 | 37.5 | 5.5 | 68.6 | 25.9 |
| Ni10Mo5Al | 21.2 | 44.8 | 34.0 | 10.9 | 67.9 | 21.2 |
| Ni10Mo10Al | 27.6 | 41.0 | 31.4 | 14.8 | 65.7 | 19.5 |
| Ni10Mo15Al | 33.3 | 37.8 | 28.9 | 17.7 | 64.4 | 17.9 |
| Ni10Mo20Al | 45.4 | 28.1 | 26.5 | 21.3 | 62.9 | 15.8 |
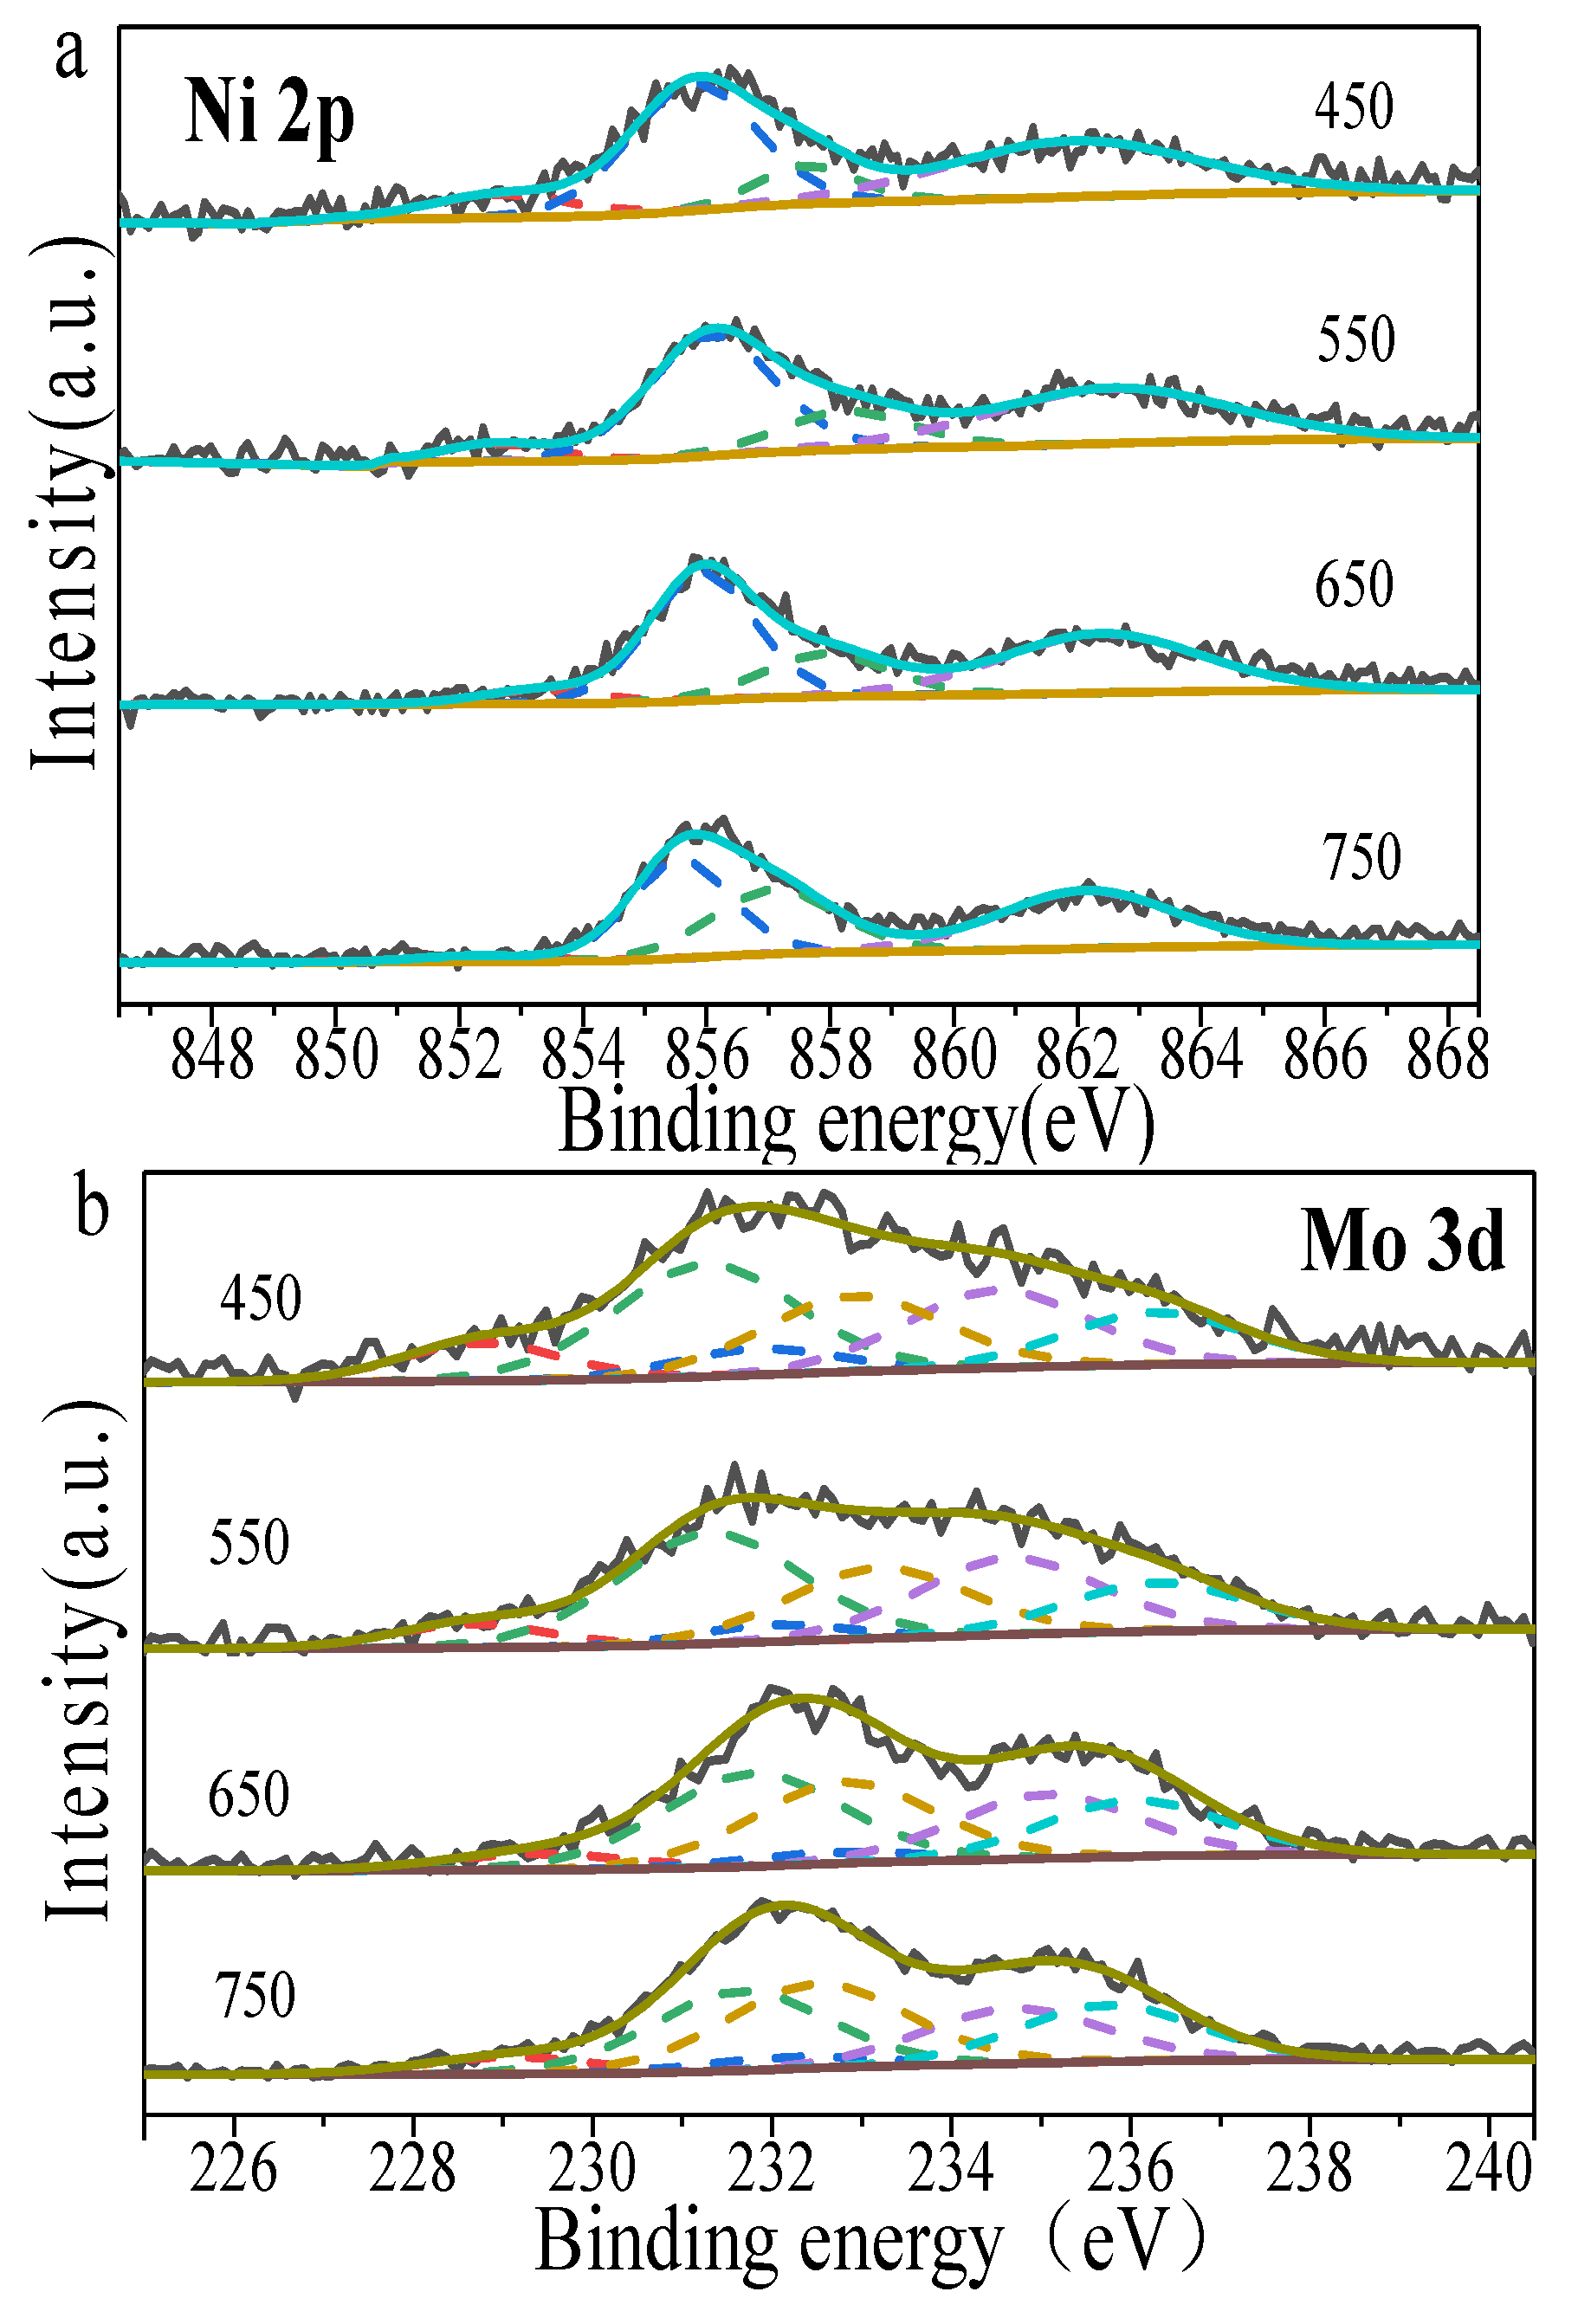
| Sample | Percentage of Surface Mo and Ni Species Detected by XPS (%) | |||||
|---|---|---|---|---|---|---|
| Mo6+ | Mo5+ | Mo4+ | Ni0 | NiO | NiAl2O4 | |
| O-450 | 27.6 | 41.0 | 31.4 | 14.8 | 65.7 | 19.5 |
| O-550 | 31.7 | 39.8 | 28.5 | 11.0 | 63.3 | 25.7 |
| O-650 | 36.8 | 37.0 | 26.2 | 9.2 | 61.4 | 29.4 |
| O-750 | 38.6 | 36.0 | 25.4 | 3.8 | 52.8 | 43.4 |
Publisher’s Note: MDPI stays neutral with regard to jurisdictional claims in published maps and institutional affiliations. |
© 2022 by the authors. Licensee MDPI, Basel, Switzerland. This article is an open access article distributed under the terms and conditions of the Creative Commons Attribution (CC BY) license (https://creativecommons.org/licenses/by/4.0/).
Share and Cite
Sun, T.; Wang, G.; Guo, X.; Li, Z.; Wang, E.; Li, C. A Highly Active NiMoAl Catalyst Prepared by a Solvothermal Method for the Hydrogenation of Methyl Acrylate. Catalysts 2022, 12, 1118. https://doi.org/10.3390/catal12101118
Sun T, Wang G, Guo X, Li Z, Wang E, Li C. A Highly Active NiMoAl Catalyst Prepared by a Solvothermal Method for the Hydrogenation of Methyl Acrylate. Catalysts. 2022; 12(10):1118. https://doi.org/10.3390/catal12101118
Chicago/Turabian StyleSun, Taolue, Gang Wang, Xinpeng Guo, Zengxi Li, Erqiang Wang, and Chunshan Li. 2022. "A Highly Active NiMoAl Catalyst Prepared by a Solvothermal Method for the Hydrogenation of Methyl Acrylate" Catalysts 12, no. 10: 1118. https://doi.org/10.3390/catal12101118