Article

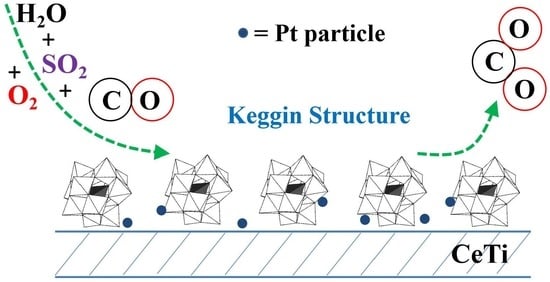
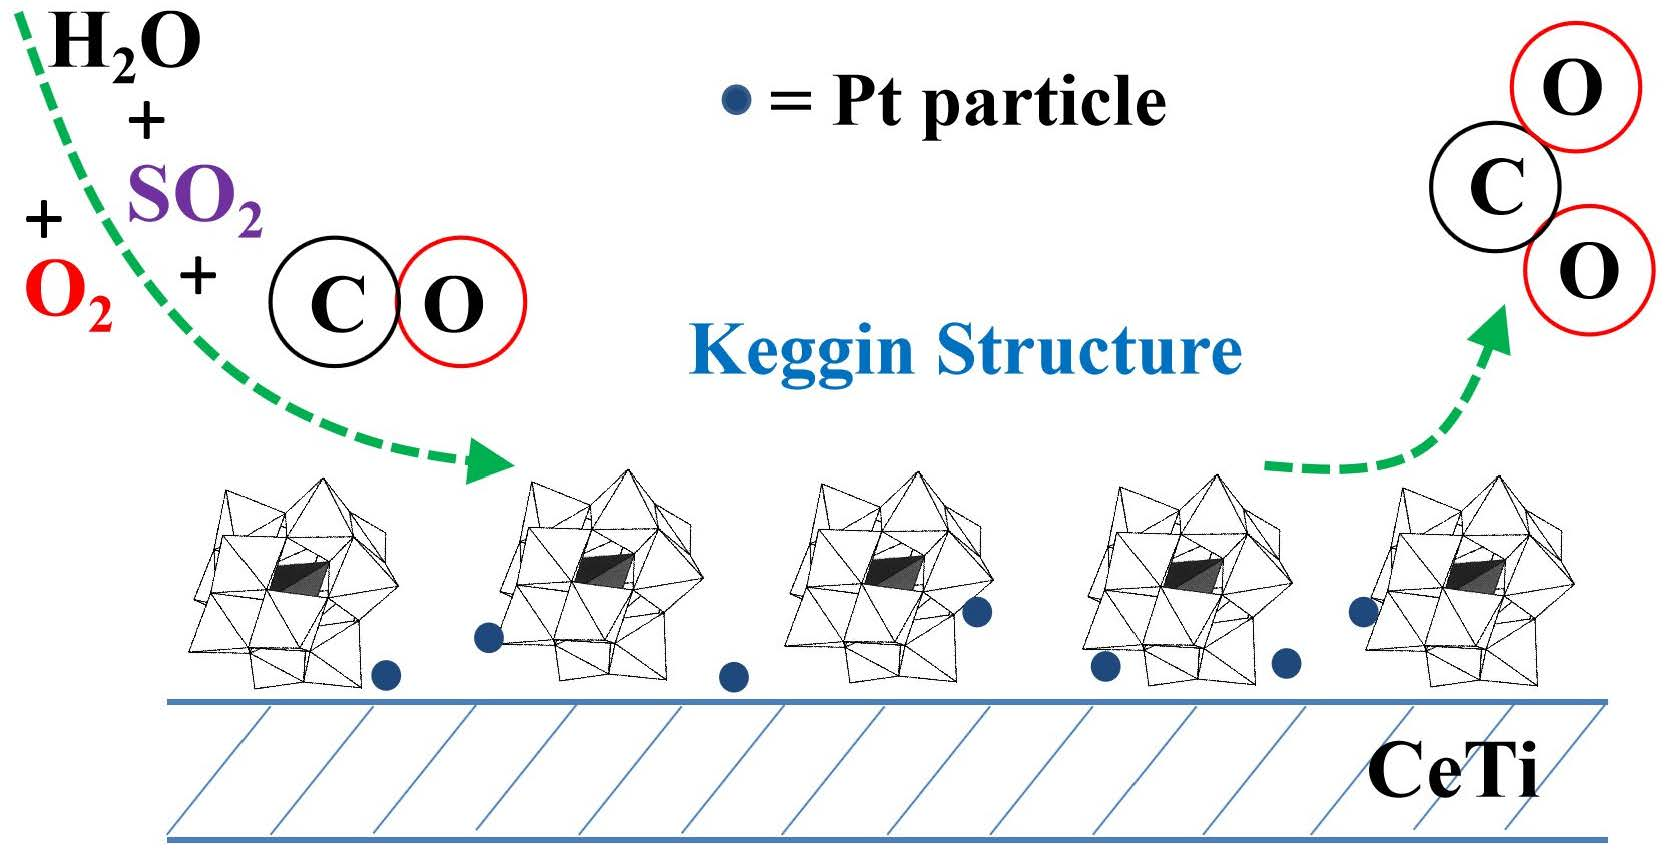
Promotion Effect of the Keggin Structure on the Sulfur and Water Resistance of Pt/CeTi Catalysts for CO Oxidation

1
Beijing Key Laboratory for Green Catalysis and Separation, Faculty of Environmental and Life, Beijing University of Technology, Beijing 100124, China
2
Beijing Fangxinlihua Science and Technology Ltd., Beijing 100025, China
*
Author to whom correspondence should be addressed.
Catalysts 2022, 12(1), 4; https://doi.org/10.3390/catal12010004
Submission received: 25 November 2021 / Revised: 14 December 2021 / Accepted: 16 December 2021 / Published: 22 December 2021
(This article belongs to the Special Issue Effect of the Modification of Catalysts on the Catalytic Performance)

Abstract

:
Developing a catalyst with high SO2 and H2O resistance to achieve high-performance CO oxidation for specific industrial applications is highly desirable. Here, three catalysts were prepared using cerium titanium composite oxide (CeTi), molybdophosphate with Keggin structure-modified CeTi (Keg-CeTi), and molybdophosphate without Keggin structure-modified CeTi (MoP-CeTi) as supports, and their sulfur and water resistance in CO oxidation were tested. The characterization of XRD, BET, SO2/H2O-DRIFTS, XPS, TEM, SEM, NH3/SO2-TPD, H2-TPR, and ICP techniques revealed that the high SO2 and H2O resistance of Pt/Keg-CeTi in CO oxidation was related to its stronger surface acidity, better reduction of surface cerium and molybdenum species, and lower SO2 adsorption and transformation compared to Pt/CeTi and Pt/MoP-CeTi.

Graphical Abstract

1. Introduction

Carbon monoxide (CO) is one of the major air pollutants mainly originating from the incomplete combustion of fossil fuels (e.g., coal and oil) or from industrial production. It not only affects the atmospheric chemistry and climate but also the health of human beings and animals [1]. Different approaches have been developed to reduce CO emissions, including adsorption [2], CO methanation [3,4], and catalytic oxidation [5,6,7,8,9]. Among them, the catalytic oxidation of CO has proven to be one of the most effective techniques for removing this pollutant. In this process, the catalyst preparation is a key step. In the past century, much research has been devoted to the development of CO oxidation catalysts with high activity and high selectivity, including Pt-group-metal (PGMs: Pt, Pd, Ir, Rh, Ru) catalysts [9,10,11], gold catalysts [12,13,14], transition metal oxides (Fe2O3 [15], MnOx [16,17], CuO [18], V2O5 [19], CeO2 [20], Co3O4 [21], etc.), metal coordination polymers [2], and metal composite oxides [8] with spinel or perovskite structure catalysts. The gold catalysts and a few transition metal oxide catalysts (such as Co3O4) commonly show a higher performance in CO oxidation at low temperature compared to the PGM ones, but the two former types of catalysts suffer from the easy deactivation in the presence of sulfur and moisture. The PGM catalysts, particularly platinum, have been investigated for nearly a century since Langmuir’s pioneering work [22], which showed high activities for CO oxidation in the temperature range of 150 to 250 °C with high resistance to sintering and water tolerance [23,24]. In the past several decades, three-way catalysts (TWCs) have been demonstrated as an effective approach to purify vehicle exhaust, which can remove 99% of CO emissions [25,26]. However, the pollutants emitted from separable means of transport are generally low compared to the image of the industrial chimney. Coke oven smoke is a big source of CO emission, in which the CO concentration is even more than 2000 mg/m3. However, the coexistence of SO2 and H2O in the flue gas with CO may reduce the active sites and change the catalyst chemical structure, leading to the diminishing of the catalytic activity of CO oxidation due to the absorption and transformation of the SO2 and H2O molecules on the catalyst surface. Therefore, developing a catalyst with high sulfur and water resistance to achieve high-performance CO oxidation, rendering it useful for specific industrial applications, is highly desirable. It was demonstrated that the introduction of a helper component [27] and protective shell [28] in the catalyst, as well as using an optimal catalyst preparation method [29], were beneficial to the improvement of CO oxidation activity and sulfur resistance. Very recently, Jiang [30] investigated the CO oxidation on a Pt single-atom catalyst supported by graphene with a single carbon vacancy (Pt-SG) and double carbon vacancy (Pt-DG) by using first-principles calculations, and they found that Pt-DG possessed a higher sulfur and water resistance due to the fact that carbon divacancy makes Pt less attractive toward SO2 and H2O molecules compared to Pt-SG, revealing the effect of the support structure to catalyst performance.
Heteropolyacids (HPAs) are useful molecular metal oxide acids, which have served as catalysts for a number of processes due to their good acidity and high-performance oxidation–reduction [31]. Early research results of Golodov [32] and Zhizhina [33,34] showed that HPAs could oxidize CO with H2O in the presence of O2 and Pd or Pt. The presence of HPAs with a Keggin structure could also significantly improve the CO tolerance of a Pt/C catalyst in PEMFCs [35]. Recently, Yoshida [36] reported that the Keggin-type polyoxometalate-supported gold catalyst exhibited a high catalytic activity for CO oxidation at low temperature and extremely high stability. In previous work, we found that the V2O5-MoO3/TiO2 catalyst with the Keggin structure had more surface Brönsted and Lewis acid sites, which was beneficial to improve significantly the activity and SO2 resistance in the NH3-SCR reaction [37]. The above results inspired us to investigate the promotion of the Keggin structure to the sulfur and water resistance of Pt/CeTi catalysts for CO oxidation. Herein, three Pt catalysts using cerium titanium composite oxide (CeTi), ammonium molybdophosphate with Keggin structure-modified CeTi (Keg-CeTi), and molybdophosphate without Keggin structure-modified CeTi (MoP-CeTi) as supports were prepared by an impregnation method under similar conditions. We observed that the Pt/Keg-CeTi catalyst showed a higher SO2 and H2O tolerance in CO oxidation compared to the Pt/CeTi and Pt/MoP-CeTi catalysts, revealing the remarkable promotion effect of the Keggin structure.

2. Results and Discussion

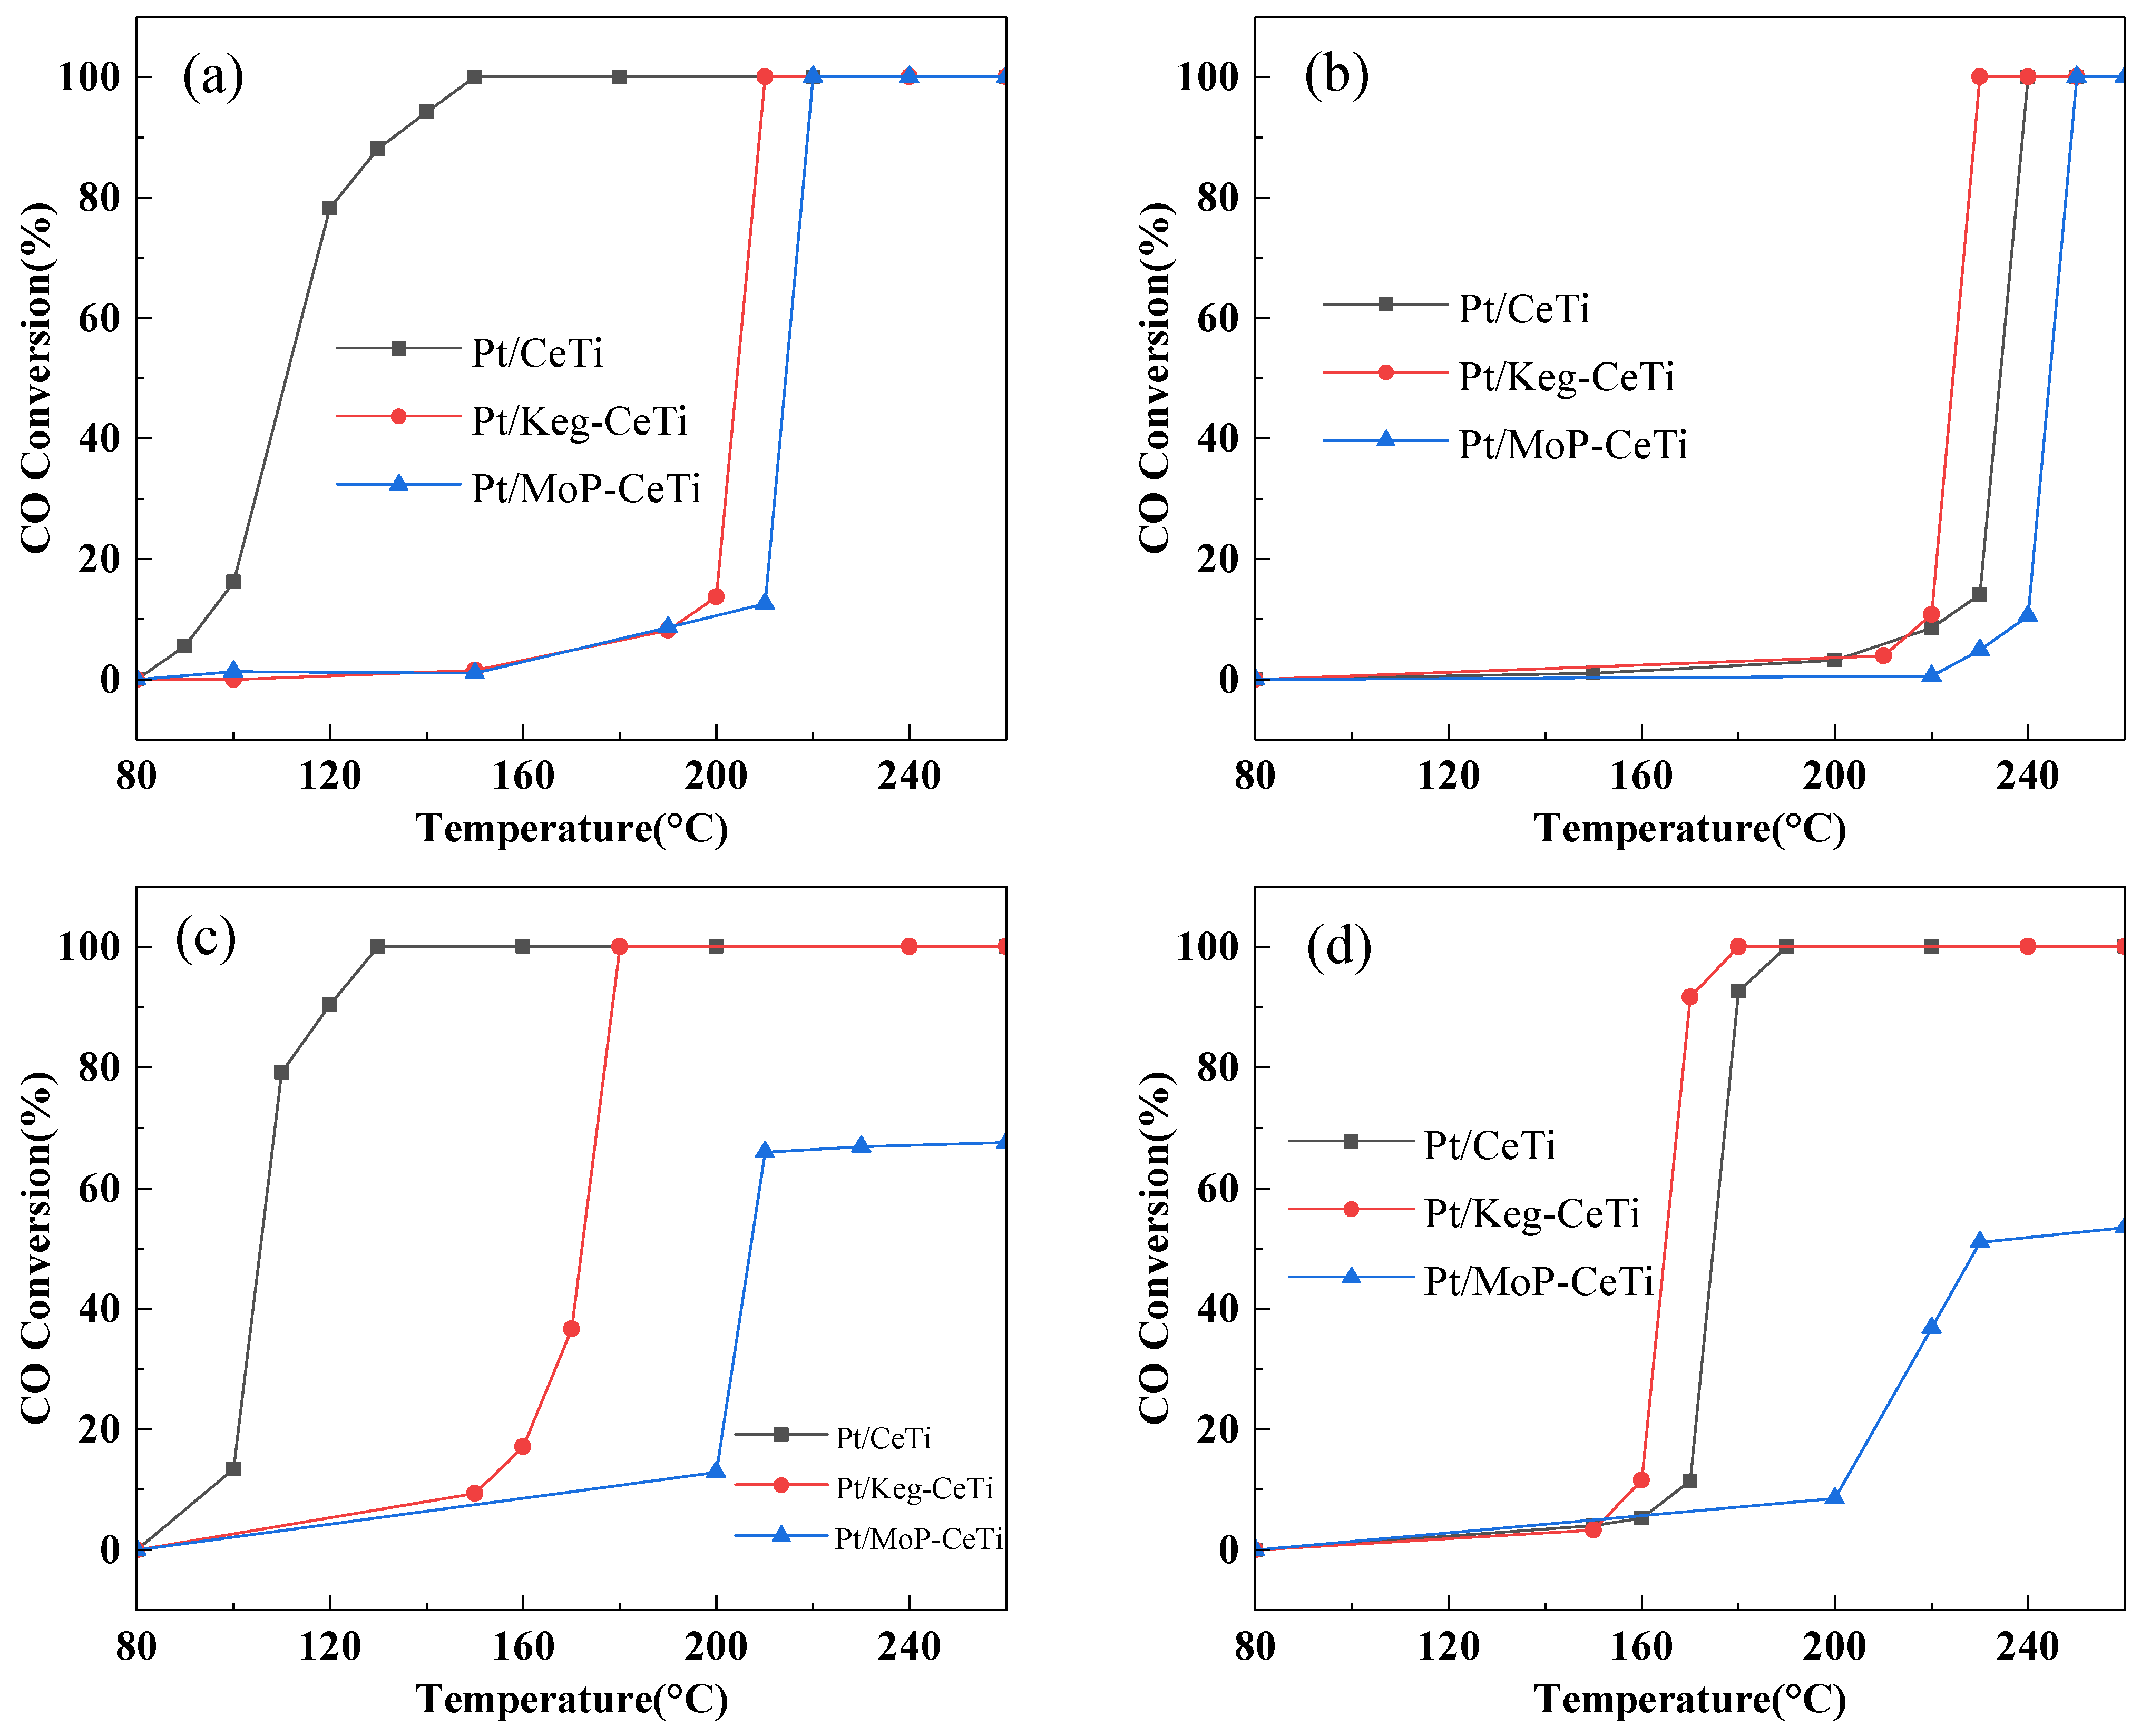
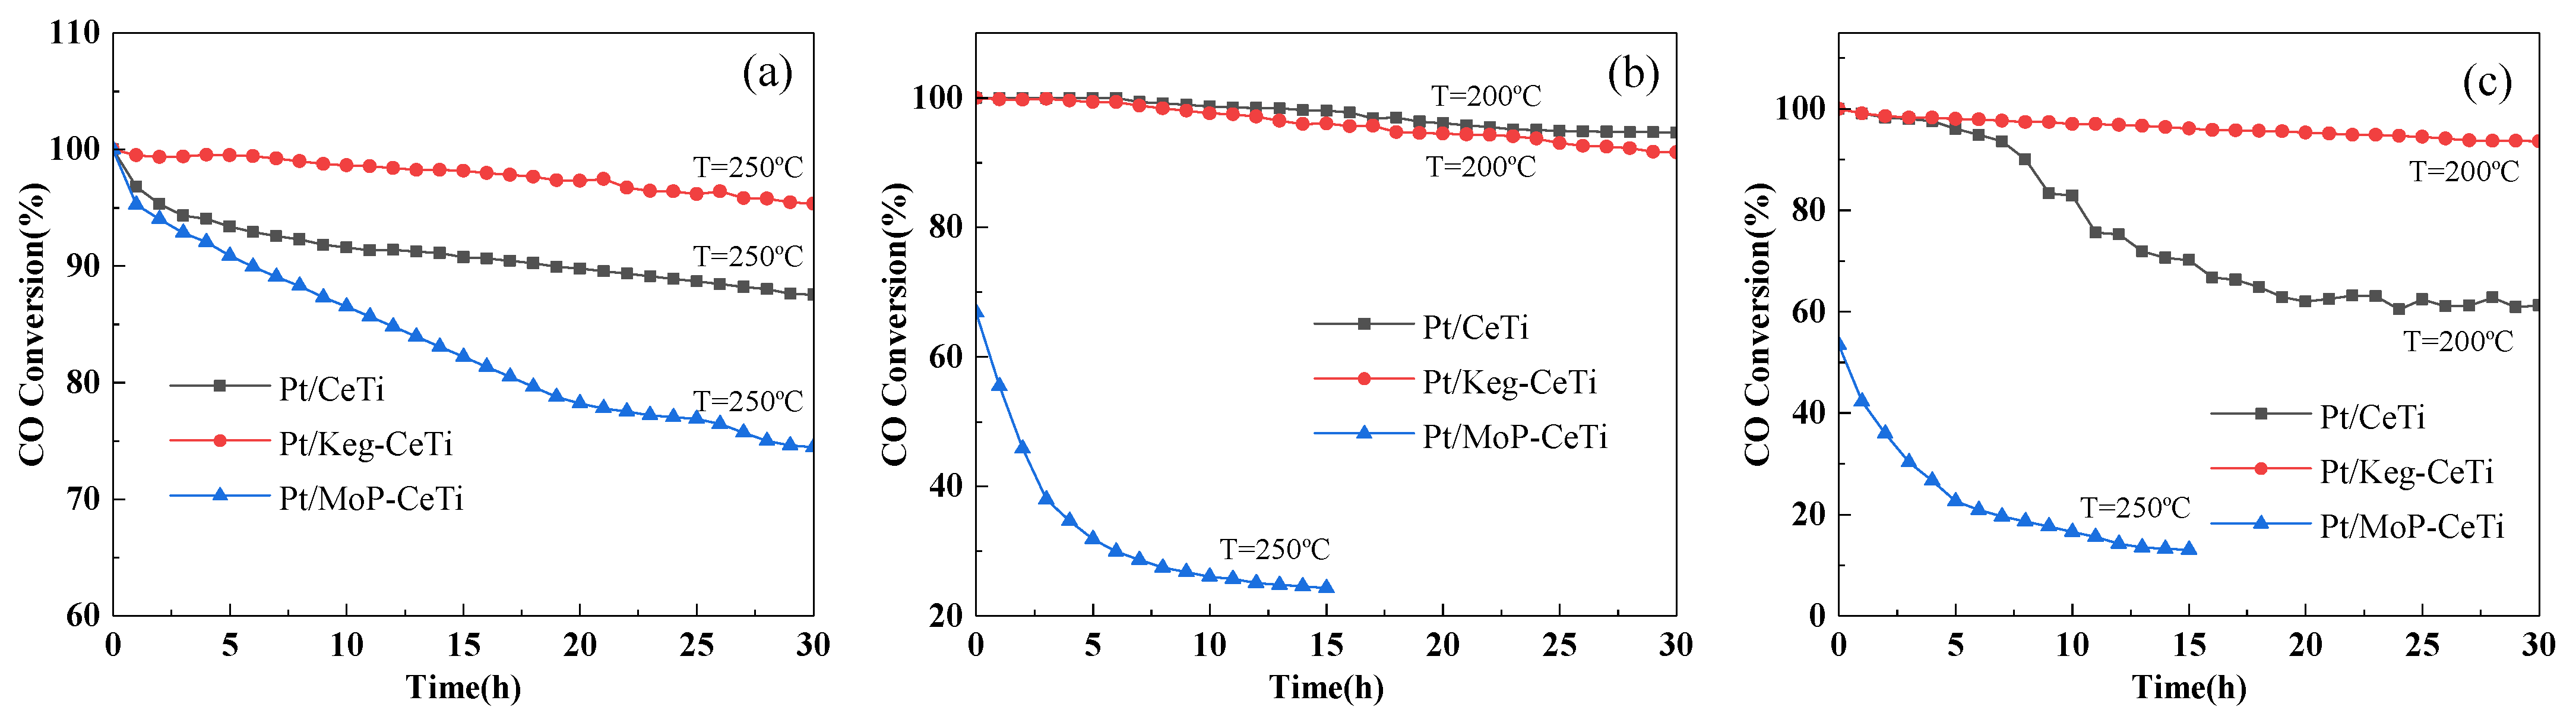
2.1. Catalytic Activity and SO2/H2O Durability

The catalytic performances of the Pt/CeTi, Pt/Keg-CeTi, and Pt/MoP-CeTi catalysts in the absence and presence of H2O or SO2, or both, are displayed in Figure 1. It was found that Pt/CeTi showed a much higher CO oxidation activity in the absence of H2O and SO2, and the CO conversion was up to 100% at 150 °C, which is consistent with the literature result [38]. Meanwhile, the intrinsic activities of Pt/Keg-CeTi and Pt/MoP-CeTi were much lower compared to Pt/CeTi (Figure 1a), and their CO complete conversion temperatures were 210 °C and 220 °C, respectively. It is known that the presence of ceria in the support can improve the catalytic performance of noble metal catalysts for CO oxidation by storing oxygen during oxidation and releasing it during reduction [39]. The introduction of molybdophosphate led to the partial covering of the CeTi surface, which restrained the synergism between Pt and cerium species. When a small amount of SO2 was introduced into the feed mixture, obvious decreases in the activities of the three samples were observed, particularly for Pt/CeTi, due to the significantly detrimental effect of SO2. In the presence of SO2 and O2, Ce(IV) ions could transform into Ce(III) ions according to the following reaction [40,41]: 2CeO2 + 3SO2 + O2 → Ce2(SO4)3, which caused the redox cycle between Ce (IV) and Ce (III) to be terminated. The Pt/Keg-CeTi showed the highest activity in the presence of SO2 compared to the two others (Figure 1b). On the other hand, the introduction of H2O had, to a certain extent, a positive effect on the activities of the Pt/CeTi and Pt/Keg-CeTi catalysts (Figure 1c), and their CO complete conversion temperatures decreased to 130 °C and 180 °C, respectively. However, the activity of Pt/MoP-CeTi declined significantly, and the CO could not convert completely even under high temperature. This might be explained by the adsorption of H2O molecules on the active centers, inhibiting the catalytic process due to the structure change of the support used. In the presence of both H2O and SO2, the activity of Pt/Keg-CeTi was also slightly higher than that of Pt/CeTi and was much better than that of Pt/MoP-CeTi (Figure 1d), revealing the better sulfur and water resistance.
The SO2/H2O durability of the three catalysts was also tested (Figure 2). The activities of the Pt/CeTi and Pt/MoP-CeTi catalysts at 250 °C in the presence of SO2 decreased rapidly from 100% to 95% within the first two hours, and then decreased gradually (Figure 2a). Moreover, the deactivation rate of Pt/MoP-CeTi was faster than that of Pt/CeTi. The CO conversions over Pt/CeTi and Pt/MoP-CeTi after continuing the test on the reaction stream for 30 h were 87% and 74%, respectively. However, the durability of Pt/Keg-CeTi was much better than those of the two others, and its activity data after 30 h were still maintained at above 95%. In the presence of 10% H2O only, the Pt/CeTi and Pt/Keg-CeTi catalysts showed a high stability, and their CO oxidation activities at 200 °C only showed a slightly decrease when the reaction time extended to 30 h. Nevertheless, the Pt/MoP-CeTi catalyst deactivated much faster under similar conditions, and its CO conversion decreased quickly from 67% to 31% in the first 5 h on stream (Figure 2b). When both H2O and SO2 were added, a similar deactivation phenomenon for Pt/MoP-CeTi was also observed. The CO conversion dropped rapidly to less than 30% in the first 5 h (Figure 2c). The Pt/CeTi catalyst showed a middle stability. Its CO conversion was maintained at above 95% within the first 5 h, and then decreased gradually to 61%. However, for Pt/Keg-CeTi, no obvious deactivation was observed within the test time, and the activity data were maintained at above 93% after 30 h. The results further showed that Pt/Keg-CeTi had a higher resistance to SO2 and H2O poisoning than the two others.

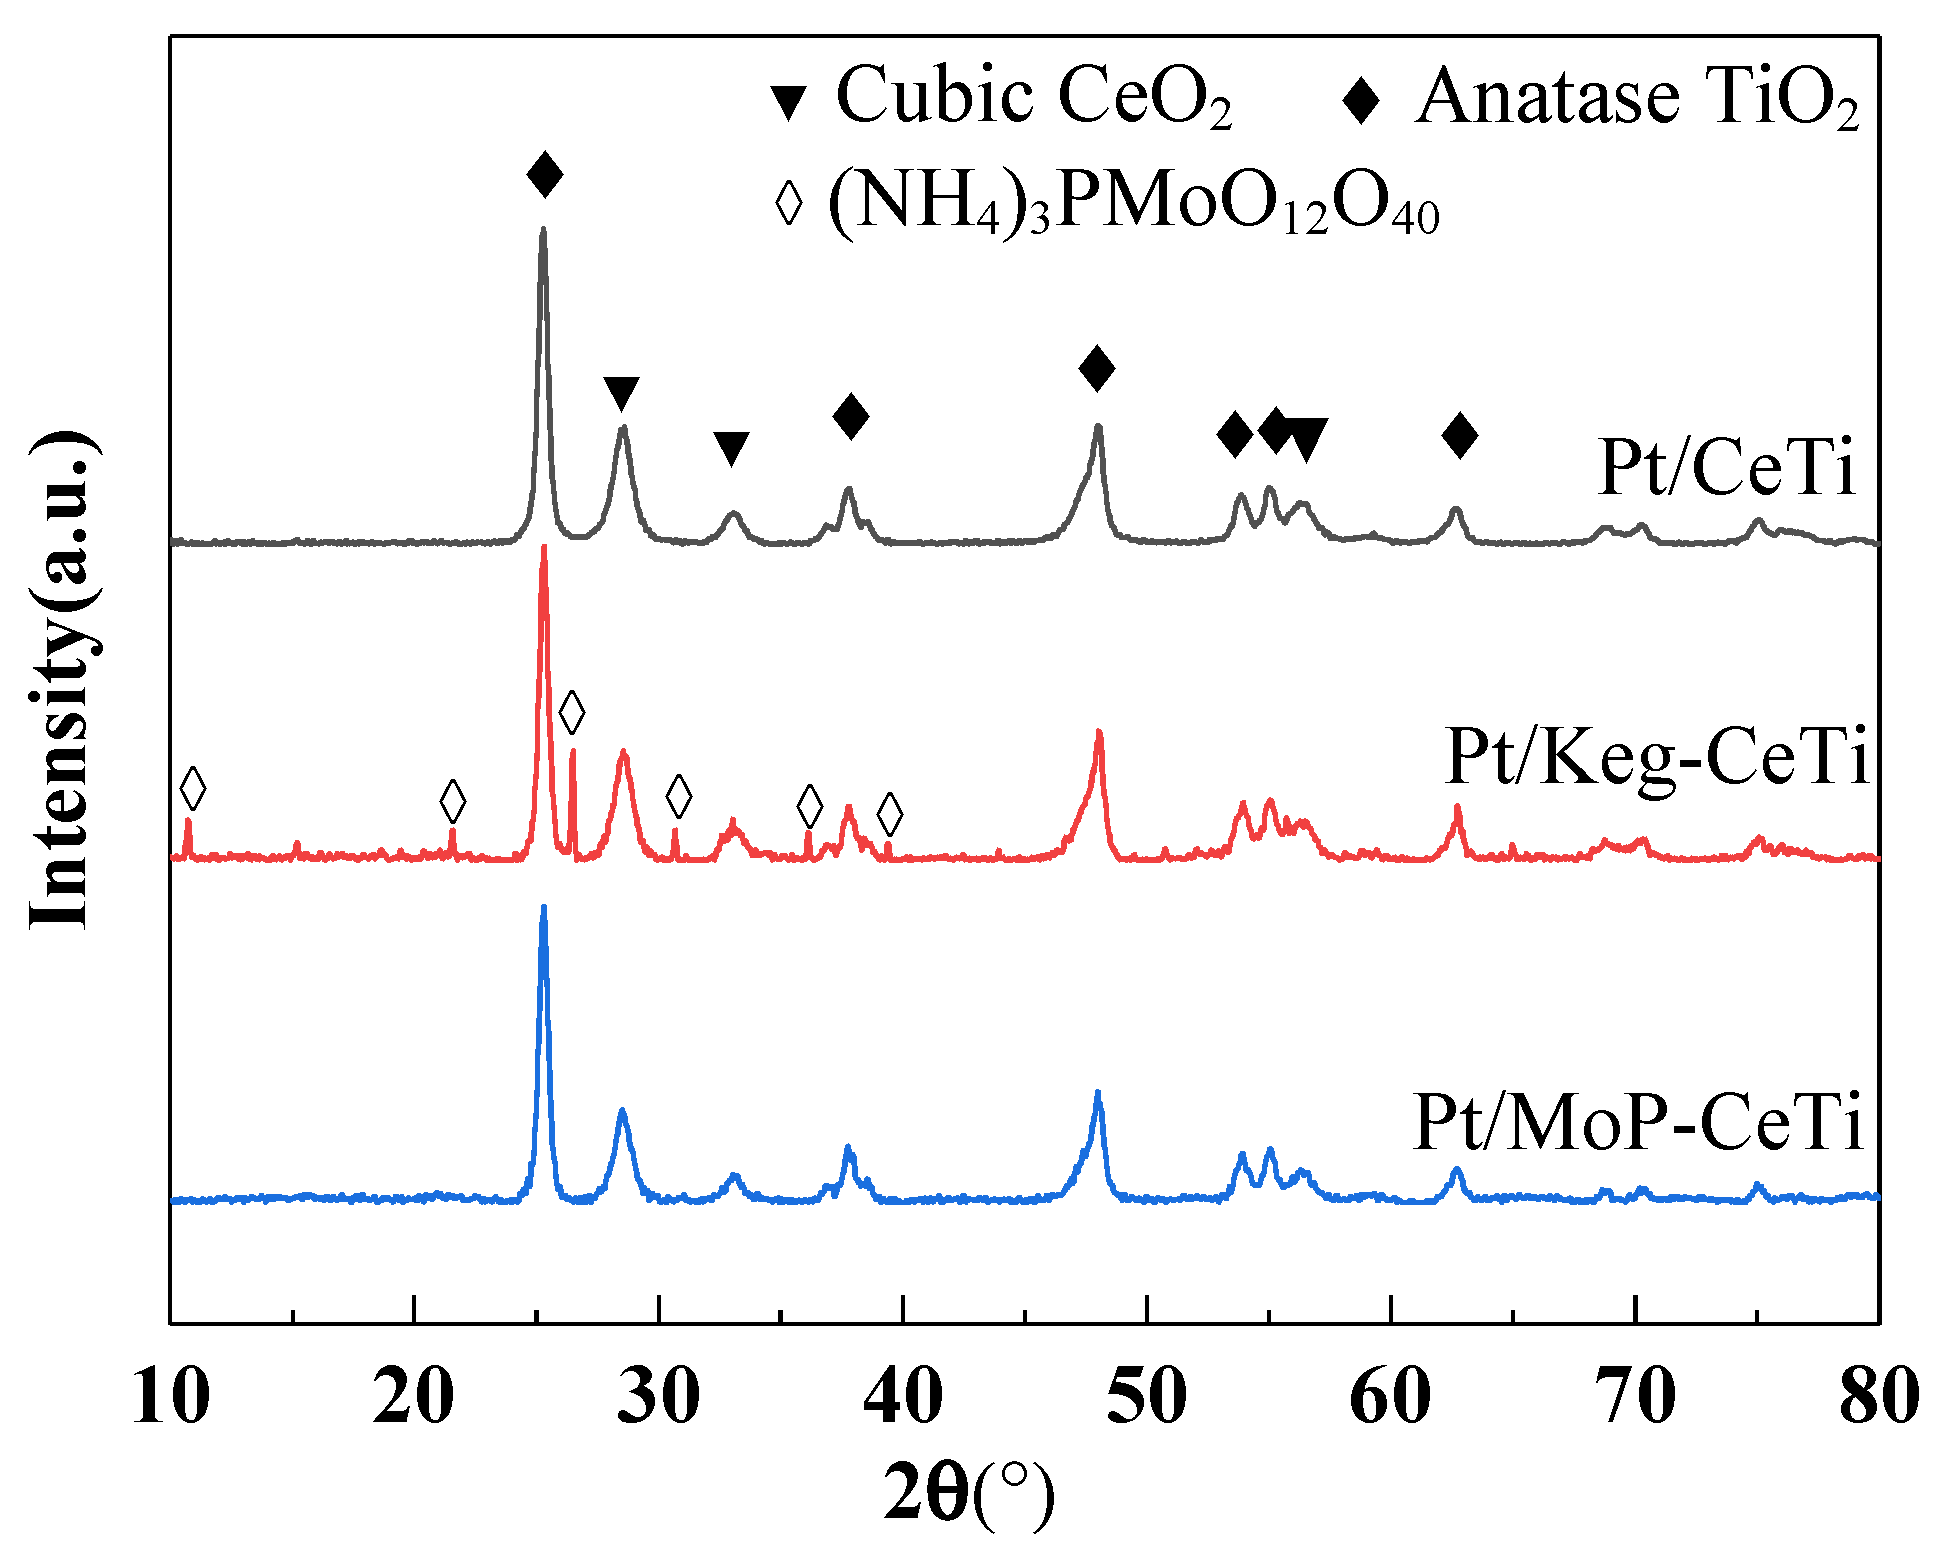
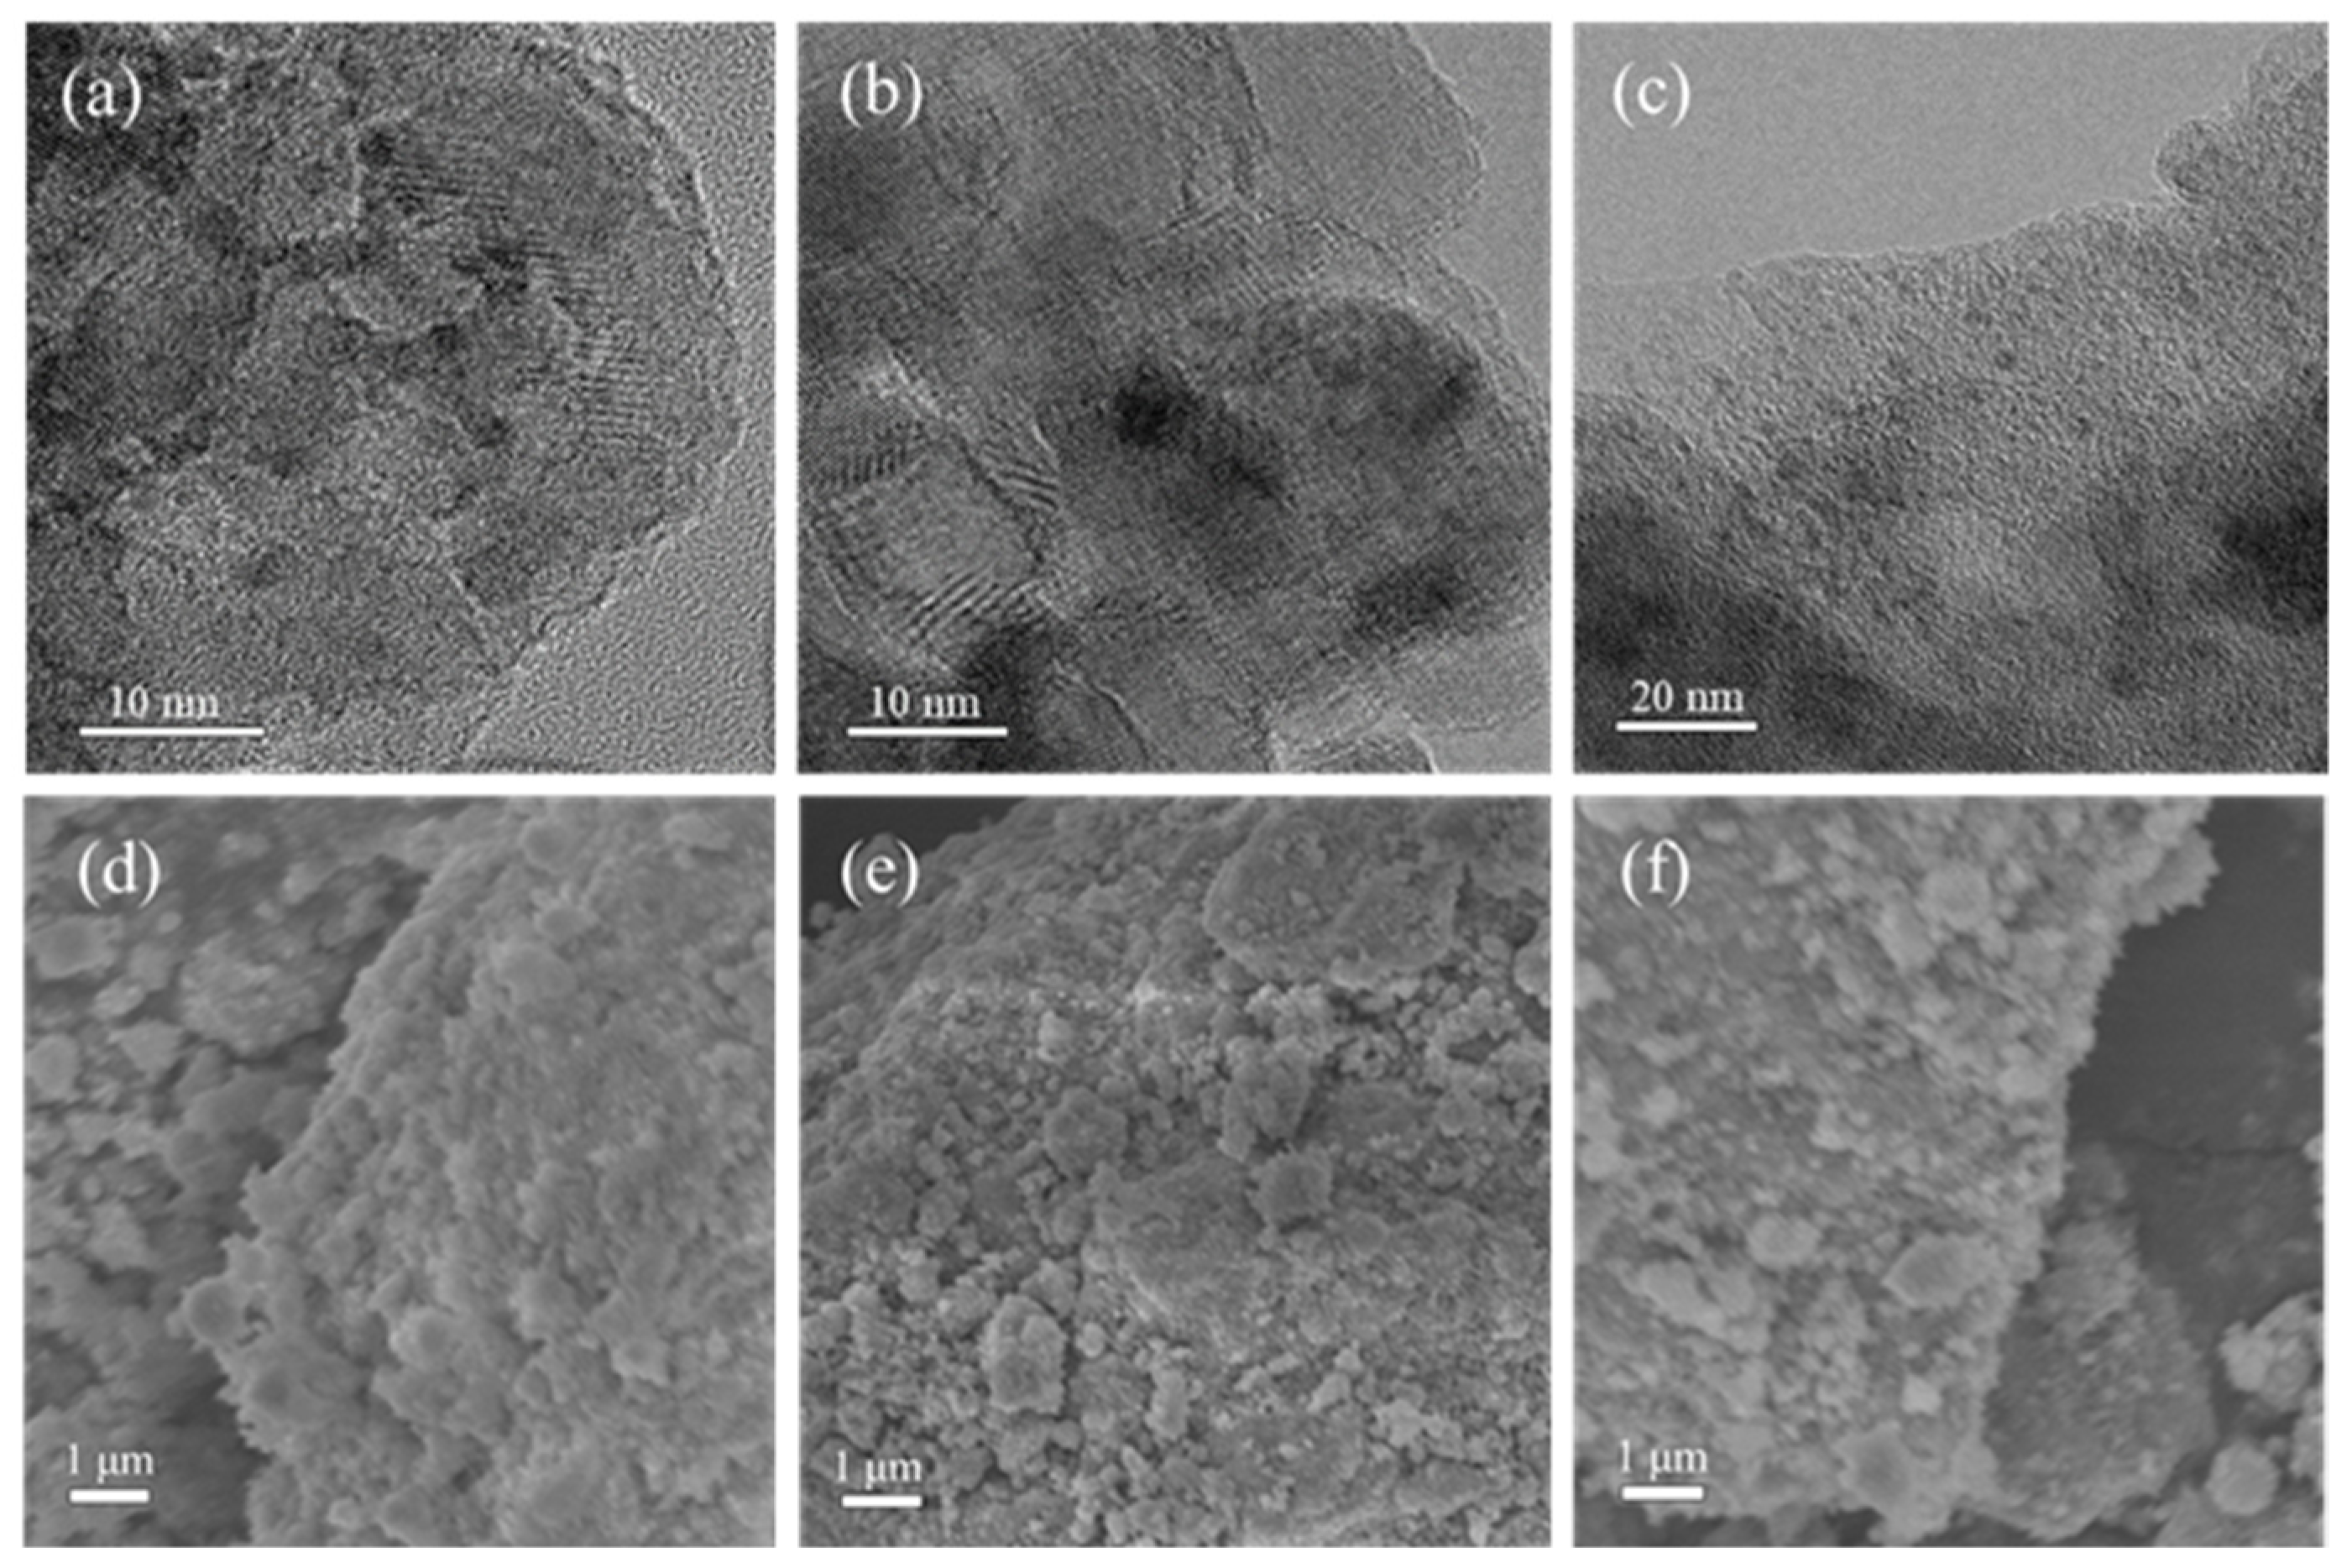
2.2. Structure and Morphology

The XRD patterns of the three samples are illustrated in Figure 3. The diffraction peaks at 2θ = 25.2, 37.7, 47.8, 53.7, 55.9, and 62.5° were attributed to anatase TiO2, and the peaks at 28.5, 33.0, and 56.3° were assigned to the cubic fluorite-type CeO2. Moreover, the intensities of the corresponding peaks for the three catalysts were similar, implying that the addition of molybdophosphate with the Keggin structure or molybdophosphate without the Keggin structure had no obvious effect on the structure of cerium and titanium composite oxide. For the Pt/Keg-CeTi sample, several additional sharp peaks at 2θ = 10.5, 15.5, 26.5, 30.5, 36.1, and 40.0° were also detected, demonstrating the formation of a Keggin structure. Meanwhile no similar diffraction peaks were observed on the Pt/MoP-CeTi catalyst, indicating the destruction of the Keggin structure after the high-temperature treatment. In addition, no peak that could be assigned to metallic platinum or its oxides was observed in the XRD curves of the three samples, implying the high dispersion of Pt. This was also corroborated by the TEM data (Figure 4).
The porosities of the Pt/CeTi, Pt/Keg-CeTi, and Pt/MoP-CeTi catalysts were characterized by N2 adsorption-desorption isotherms (Figure S1). The three samples all showed typical type II isotherms and type H3 hysteresis loops in a high relative pressure range of P/P0 > 0.5, indicating the existence of stacking channels and the sorption behavior of mesopores. Meanwhile, there was no obvious saturated adsorption platform in the low-pressure range, revealing that there were few micropores on the catalyst surface (Figure S1). This was in agreement with their relatively low specific surface area (41–63 m2/g) (Table 1). The pore volumes of Pt/Keg-CeTi and Pt/MoP-CeTi were comparatively smaller than that of Pt/CeTi possibly due to the blocking of partial pores of CeTi by the molybdophosphate, and the pore diameter of Pt/Keg-CeTi was slightly larger than those of the two others, which might be related to the difference in particles’ size.
The SEM images clearly showed that the three catalysts had a similar morphology, which were comprised of an irregular conglomeration of particles that were formed by many fine particles with different diameters (Figure 4d–f). TEM images of the Pt/CeTi and Pt/MoP-CeTi catalysts showed that the platinum species were well dispersed on the surface of the support (Figure 4a,c), and most of the Pt particle sizes were in the ranges of <5 nm. Meanwhile, on the Pt/Keg-CeTi sample, few clear Pt particles could be observed, indicating a better dispersion of platinum species on the Keggin structure-modified CeTi composite oxide.

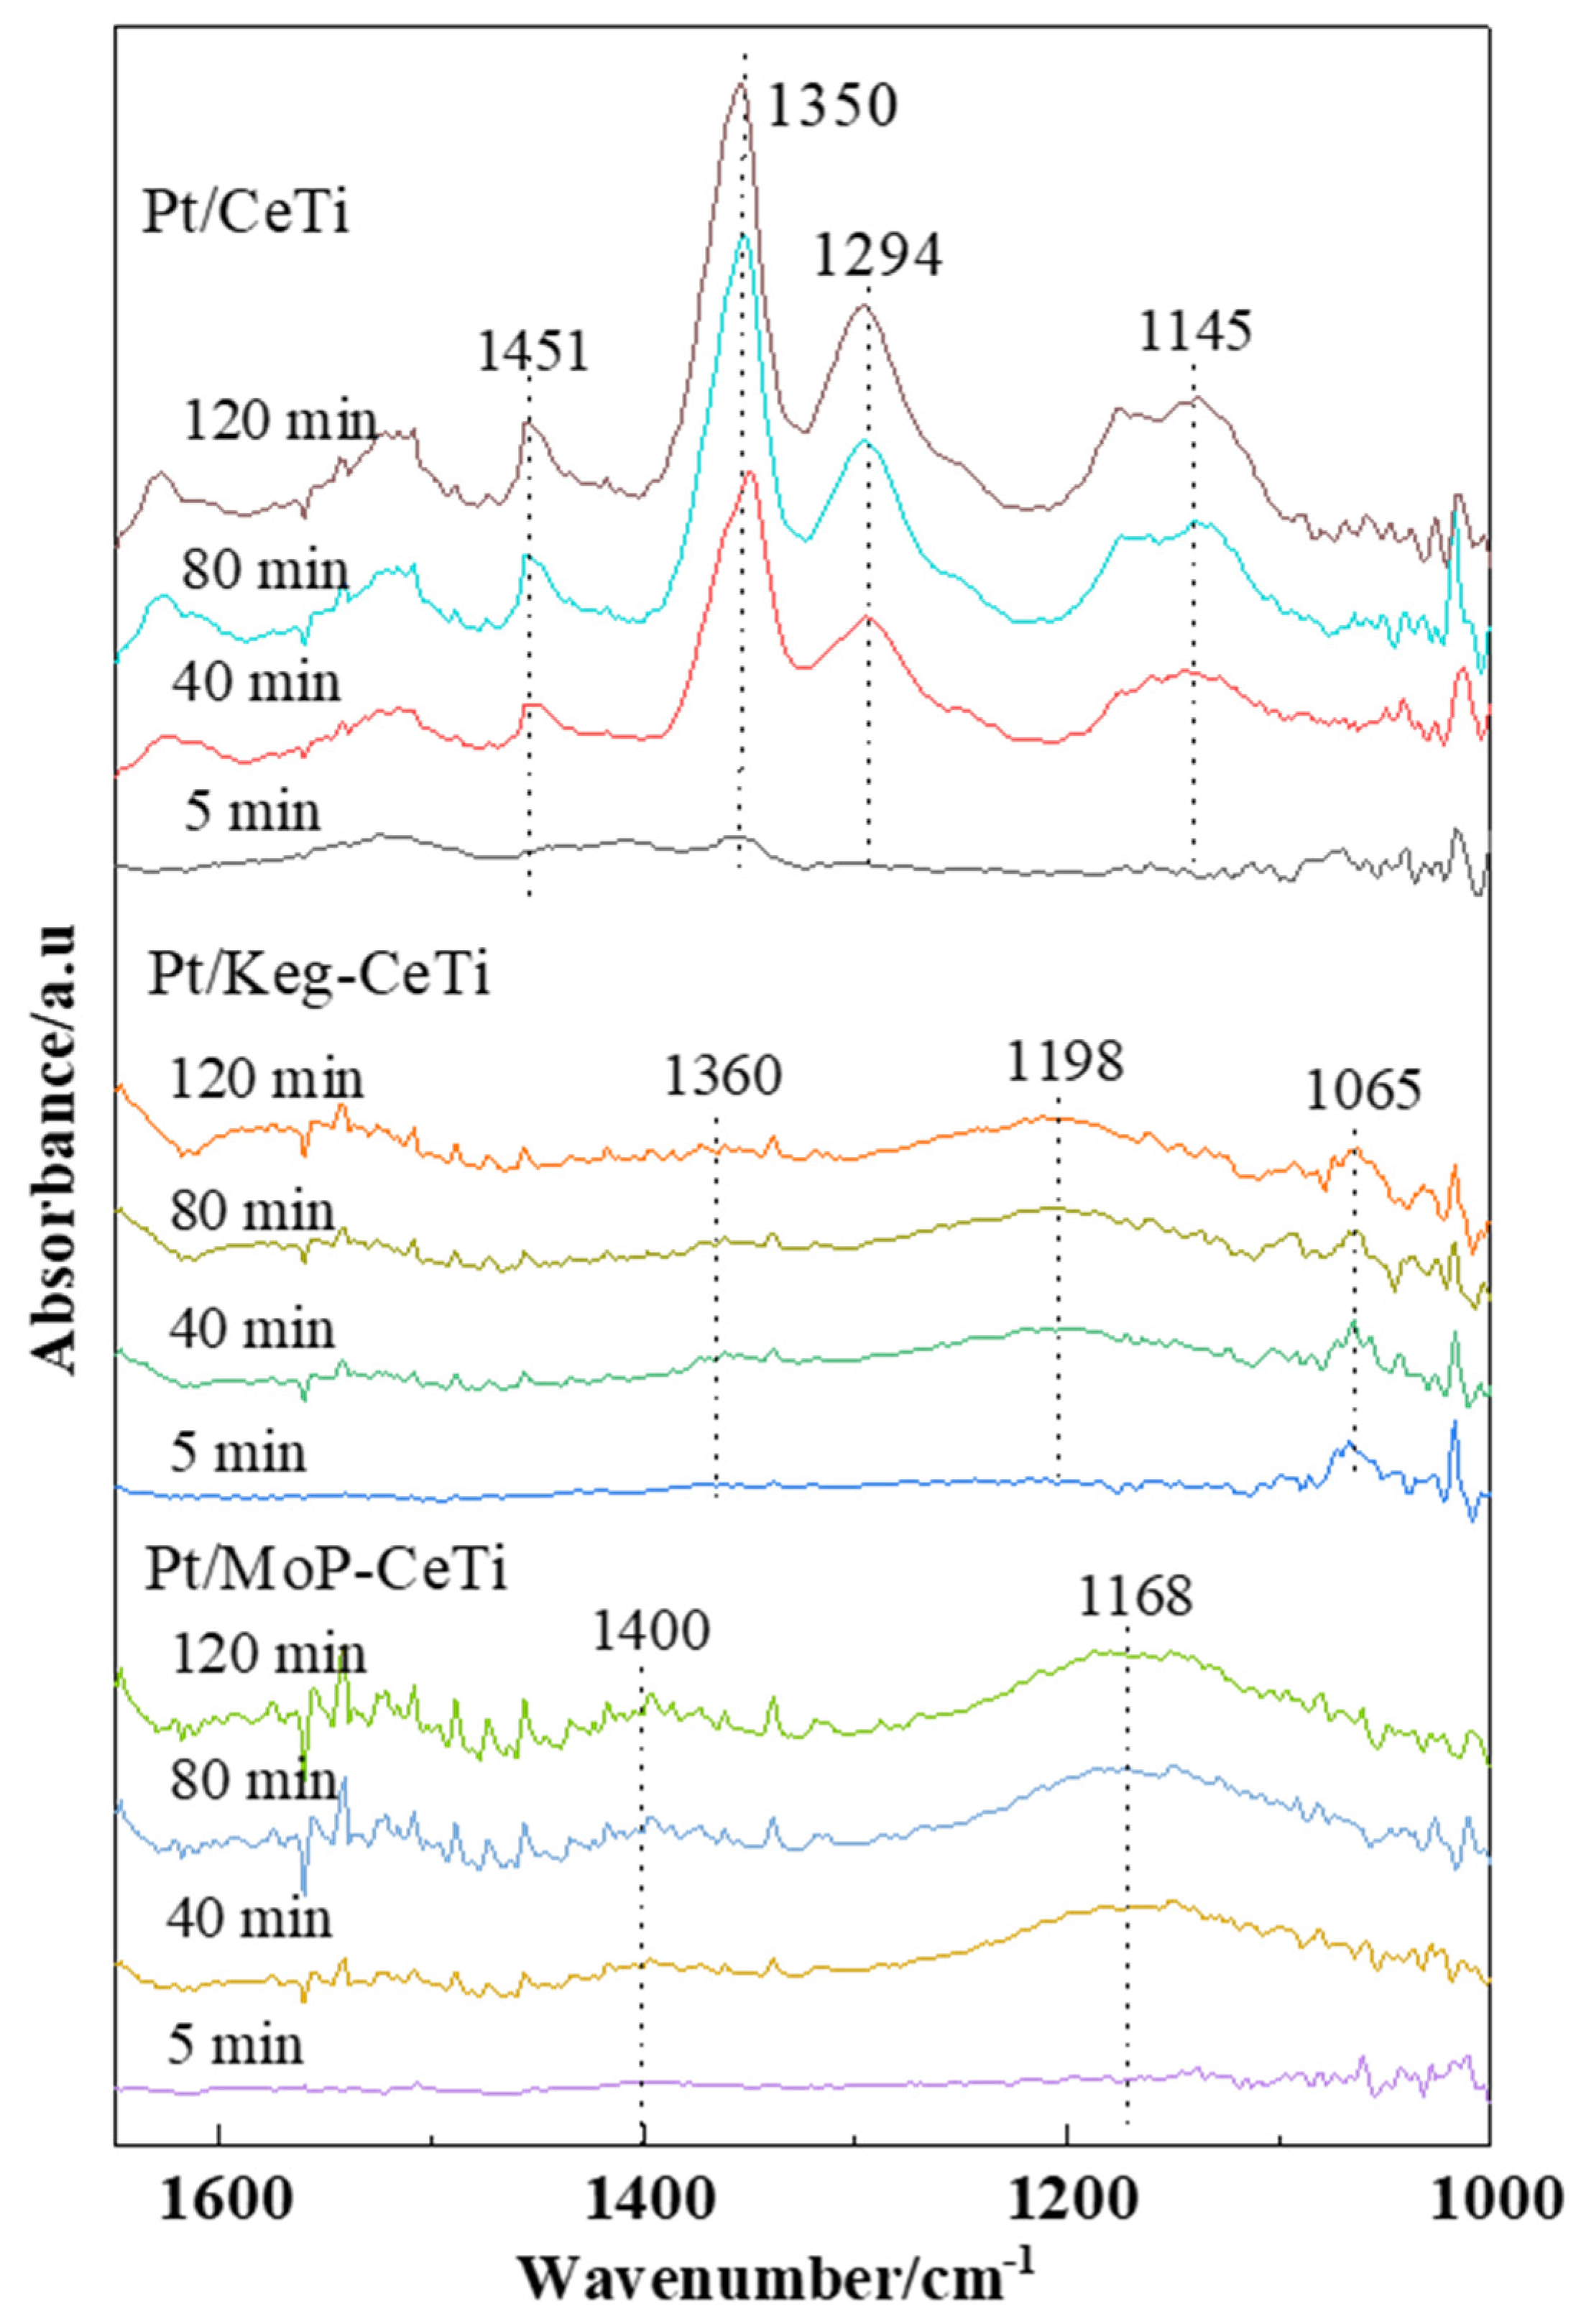
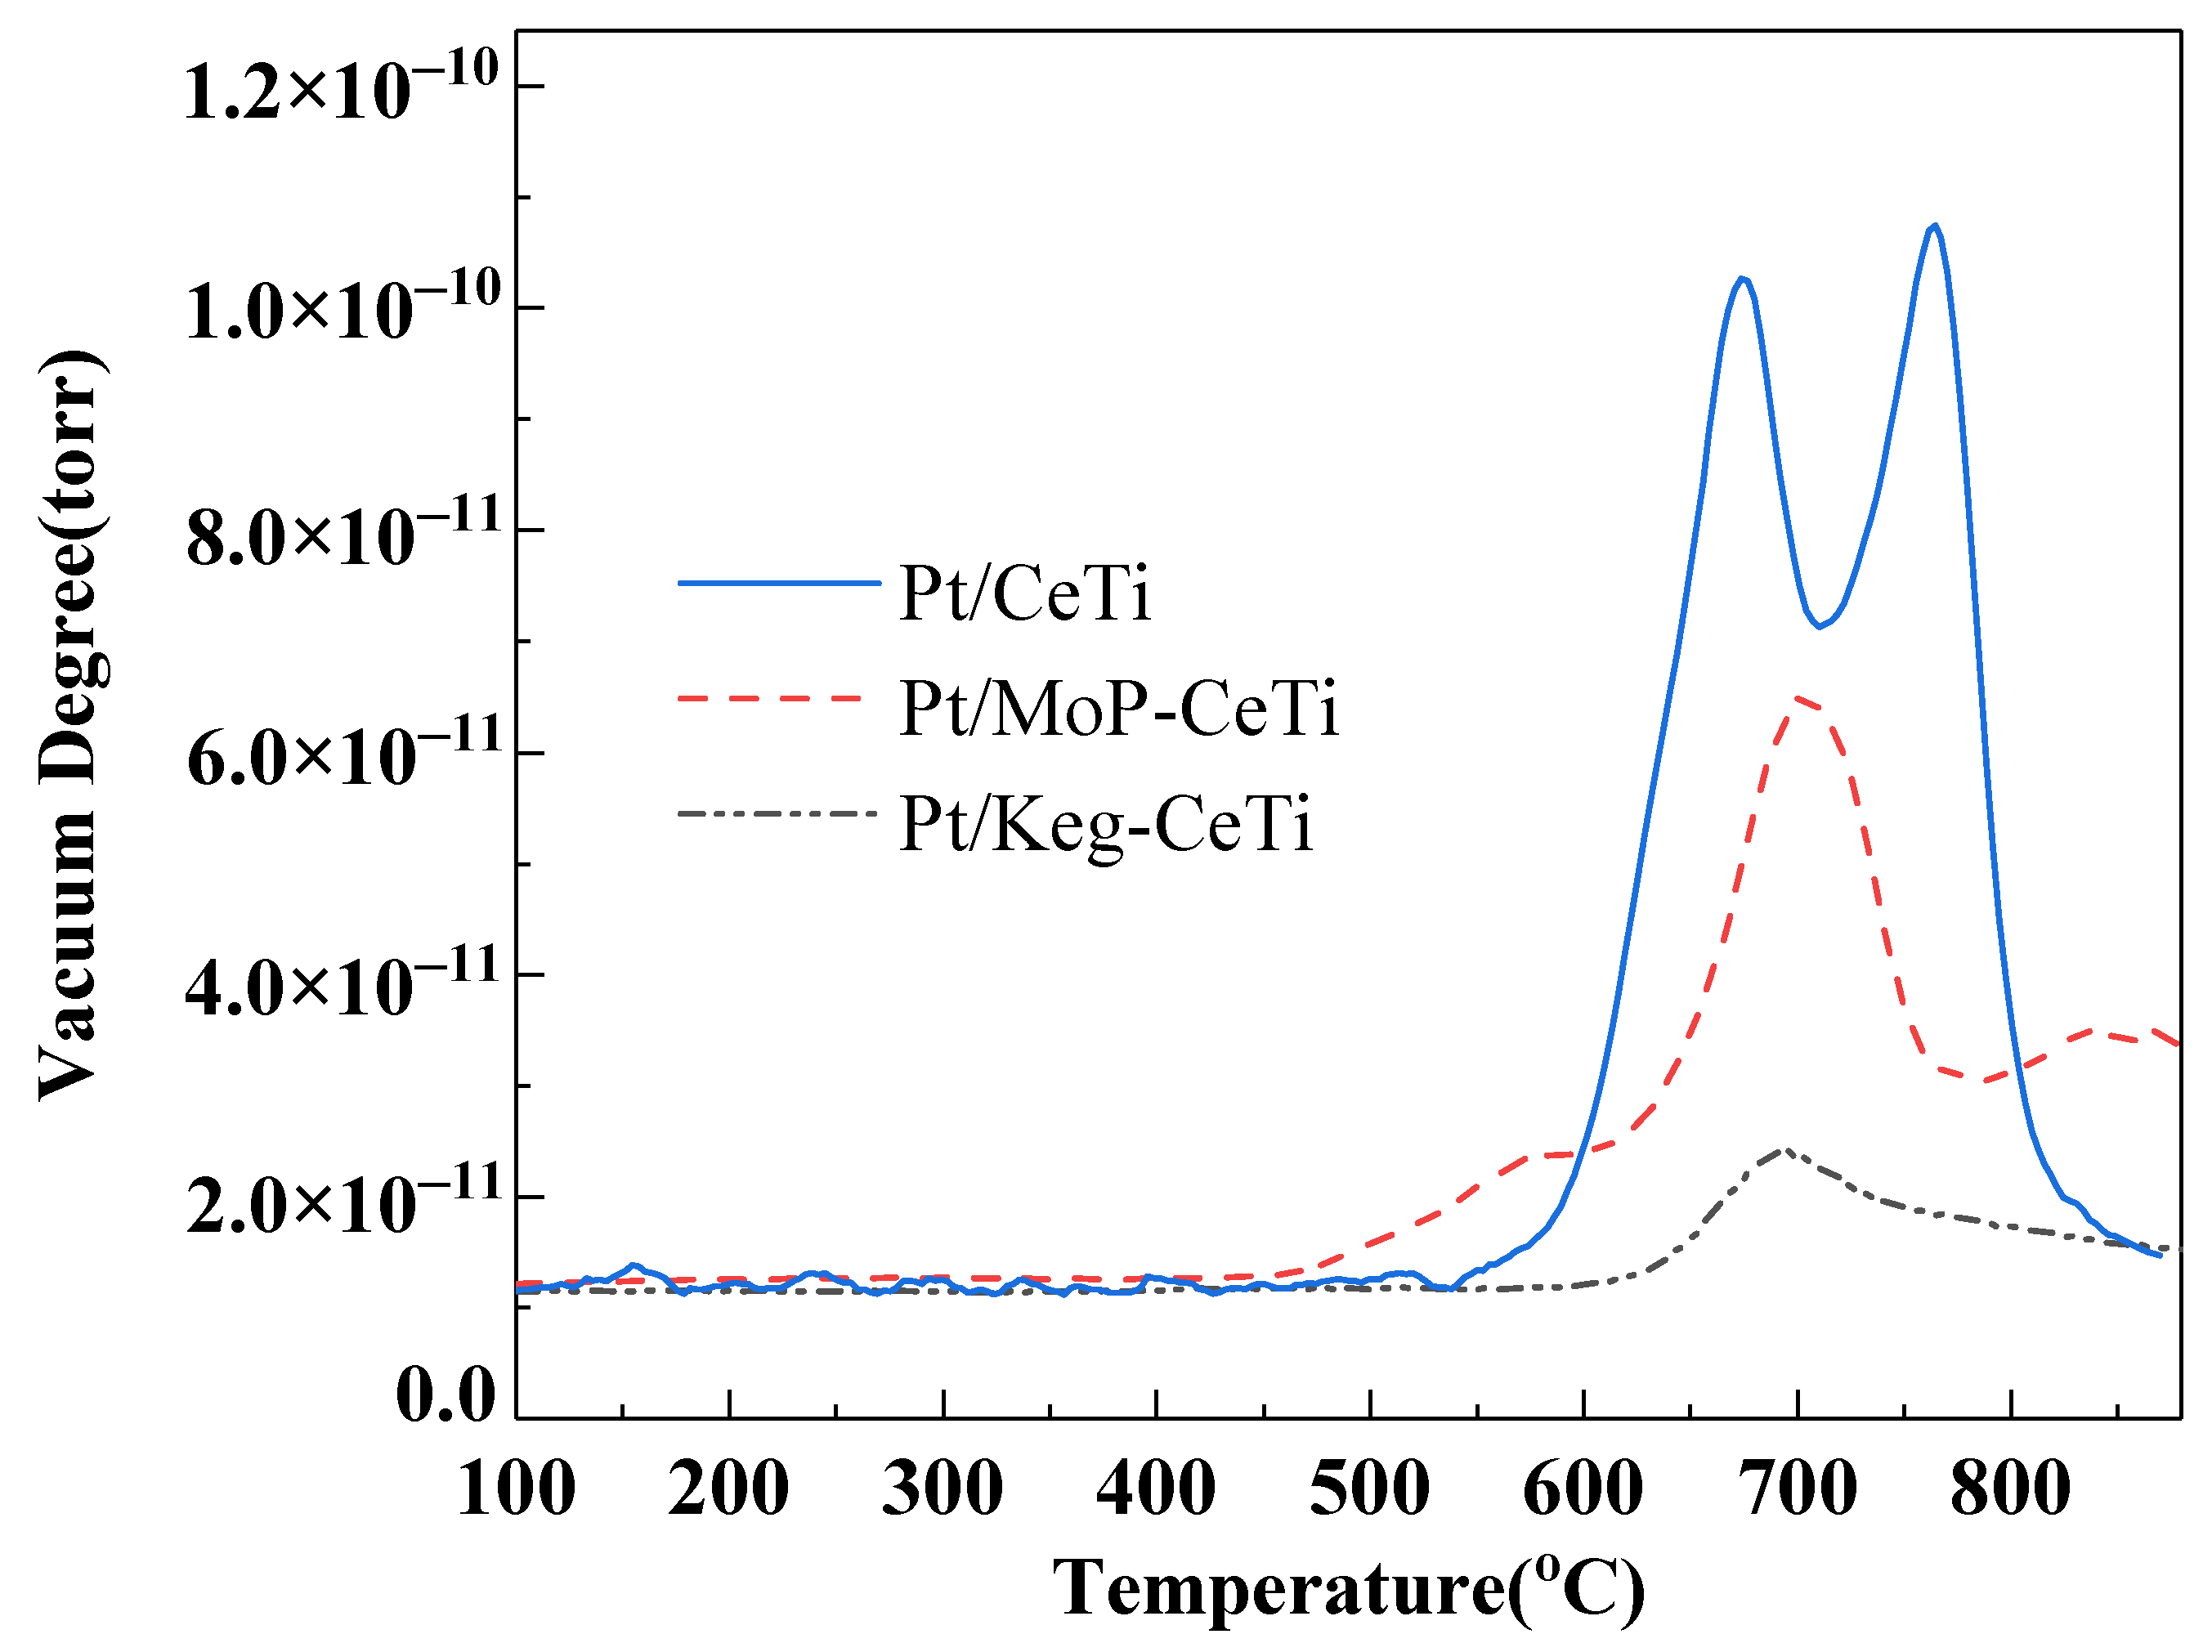
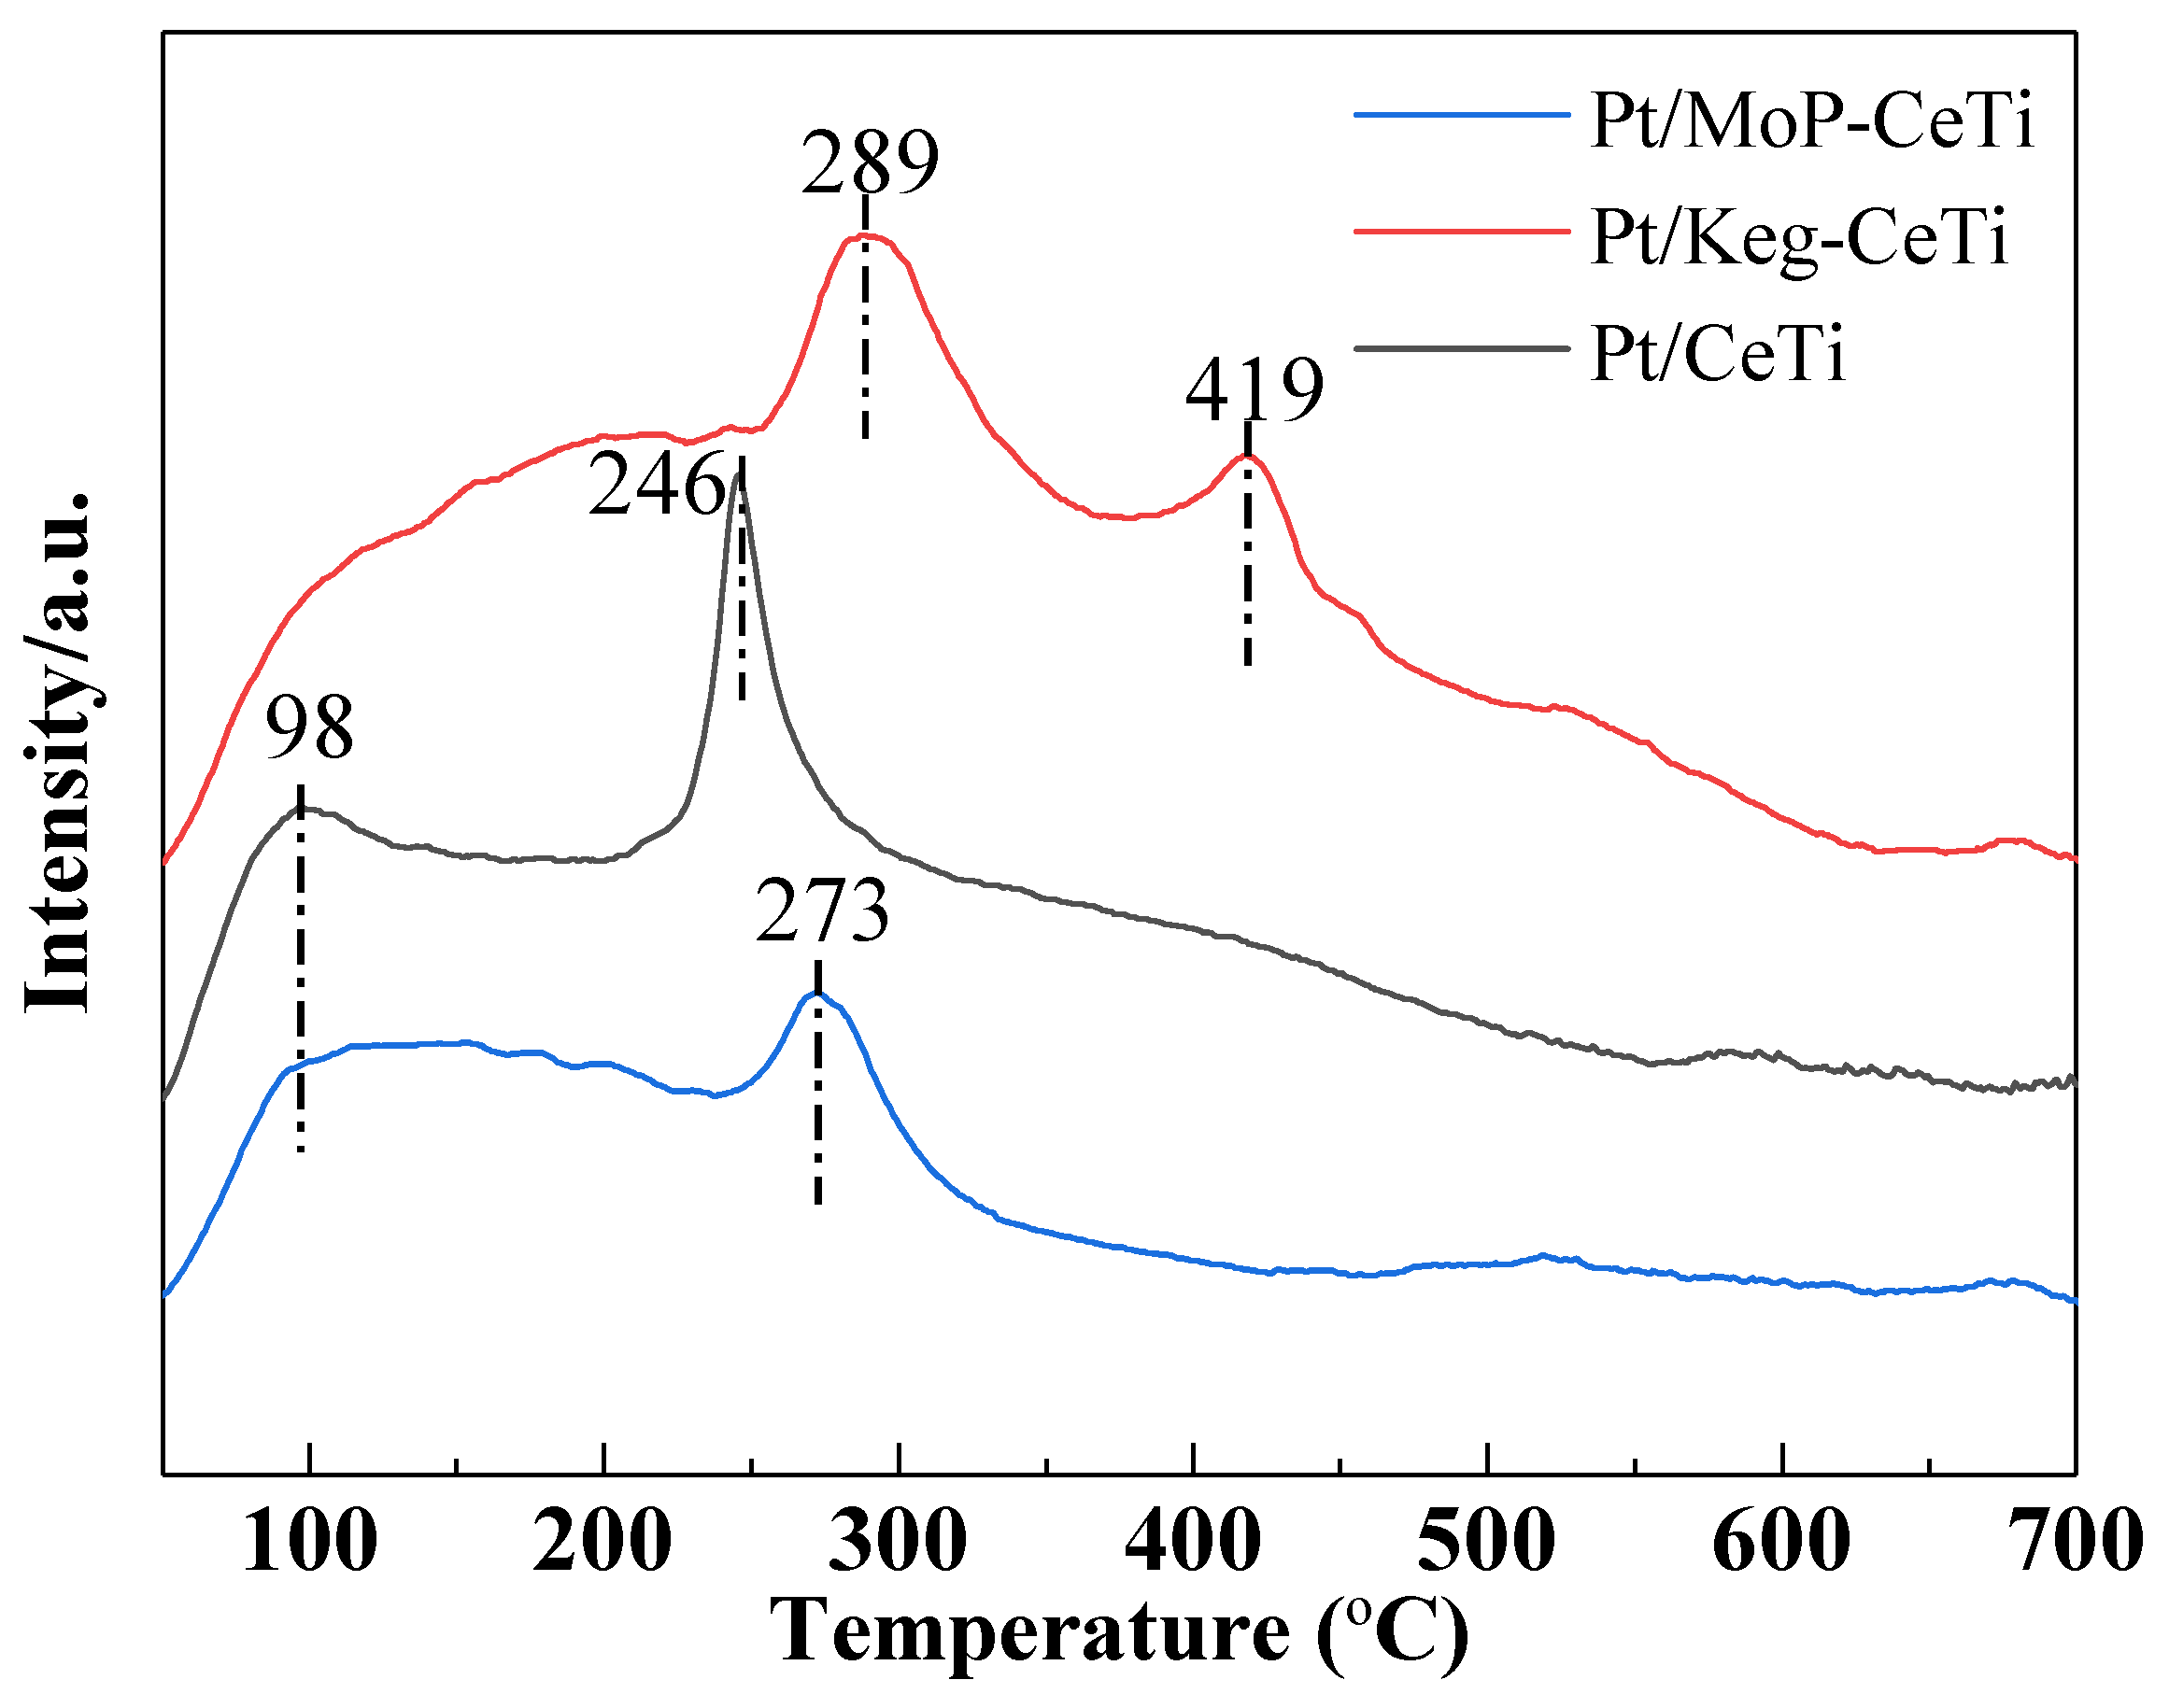
2.3. Adsorption and Desorption of SO2 on the Catalysts

In order to understand the difference in sulfur resistance of the Pt/CeTi, Pt/Keg-CeTi, and Pt/MoP-CeTi catalysts, the adsorption of SO2 on the three catalysts under the same conditions was investigated in detail by in situ IR spectroscopy and temperature-programmed desorption experiments. The DRIFTS results of SO2 adsorption experiments in the presence of 150 ppm of SO2 and a large excess of O2 at 250 °C are shown in Figure 5. For the Pt/CeTi sample, after the introduction of SO2, four adsorption bands at 1451, 1350, 1294, and 1145 cm−1 were observed and their intensities increased with time. According to other studies [42,43,44,45,46], the peaks at 1451, 1350, and 1294 cm−1 were attributed to the surface sulfate species. The band centered at 1145 cm−1 was assigned to the bulk-like sulfate, revealing that the surface and bulk sulfate species were formed nearly simultaneously on the Pt/CeTi surface. For the Pt/Keg-CeTi sample, a peak at 1065 cm−1 was detected in the first 5 min, which was attributed to symmetrical oscillations of sulfites [47], which could be detected in the whole experimental time. The signals attributed to the surface and bulk sulfates were much weaker, implying that the accumulation of sulfate species on the catalyst was inhibited significantly due to the modification of the Keggin structure. For the Pt/MoP-CeTi sample, two wide and weak peaks at 1400 and 1168 cm−1 were detected, which were assigned to surface sulfate and bulk sulfate species [48], respectively. It can be seen that both surface sulfate and bulk sulfate species were detected on the three catalysts, but the corresponding peak intensities were quite different. Obviously, the amount of sulfate species on Pt/Keg-CeTi was much lower than those of Pt/CeTi and Pt/MoP-CeTi.
To further understand the nature and content of sulfate species formed on the poisoned samples better, TPD analysis was examined (Figure 6). It clearly showed that two peaks at 675 and 765 °C were observed for Pt/CeTi, which were attributed to the decomposition of Ce(SO4)2 and Ce2(SO4)3 [49], respectively. There was one main SO2 desorption peak at 705 °C for Pt/MoP-CeTi, while the peak that appeared at 695 °C for Pt/Keg-CeTi was much weaker compared to the two others. It was clear that the amount of sulfate species accumulated on Pt/Keg-CeTi was much lower than that on Pt/MoP-CeTi and Pt/CeTi, which was also in agreement with the ICP data (Table S1) and the DRIFTS spectra (Figure 5). The results revealed that the SO2 adsorption and transformation on Pt/Keg-CeTi were highly inhibited, which might be one main reason why it showed good sulfur resistance. However, the low activity and sulfur resistance of Pt/MoP-CeTi may also relate to the low surface Pt concentrations (see Table 2) except its moderate SO2 adsorption and transformation.

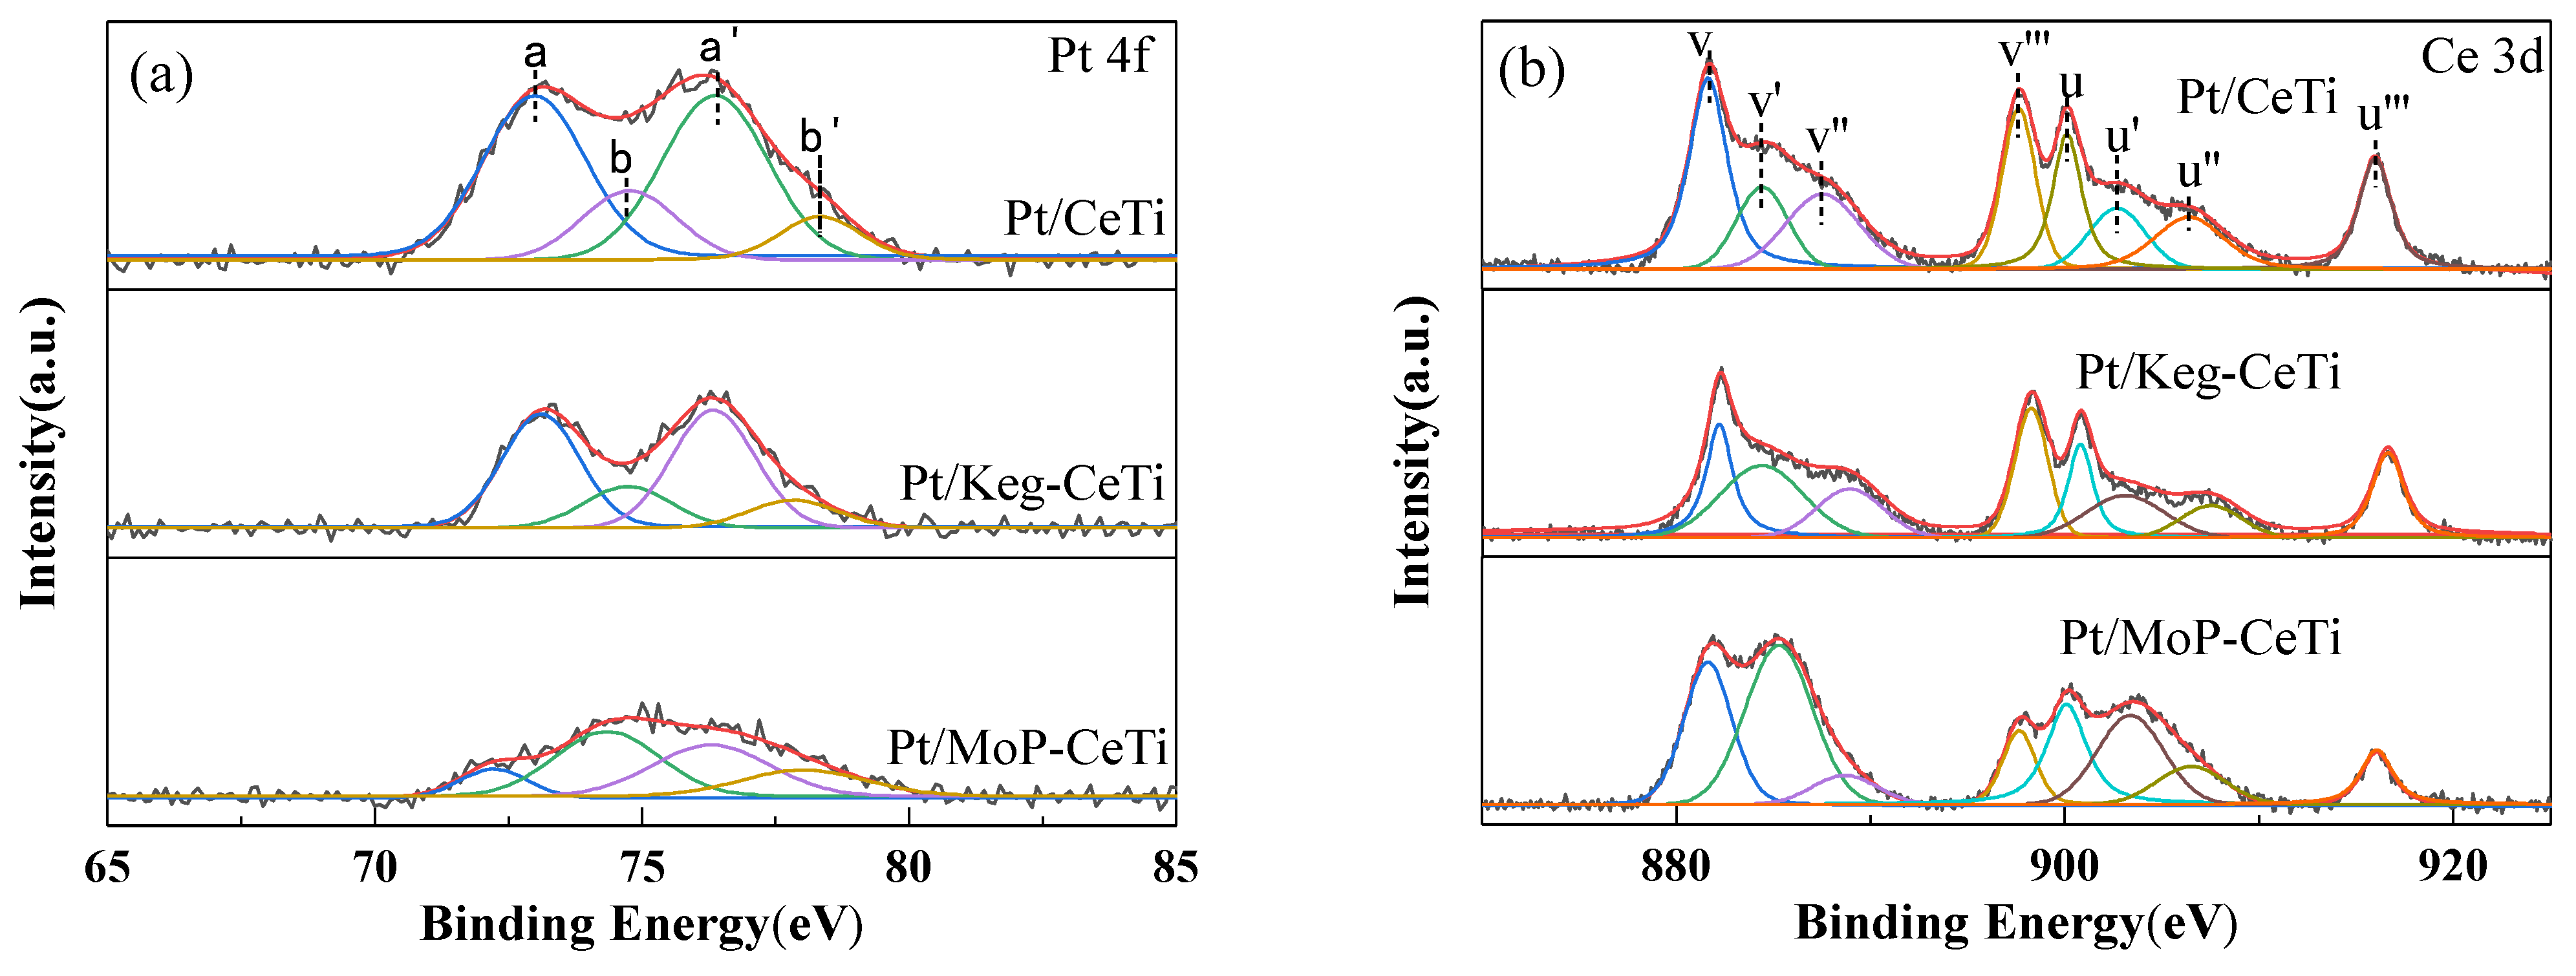
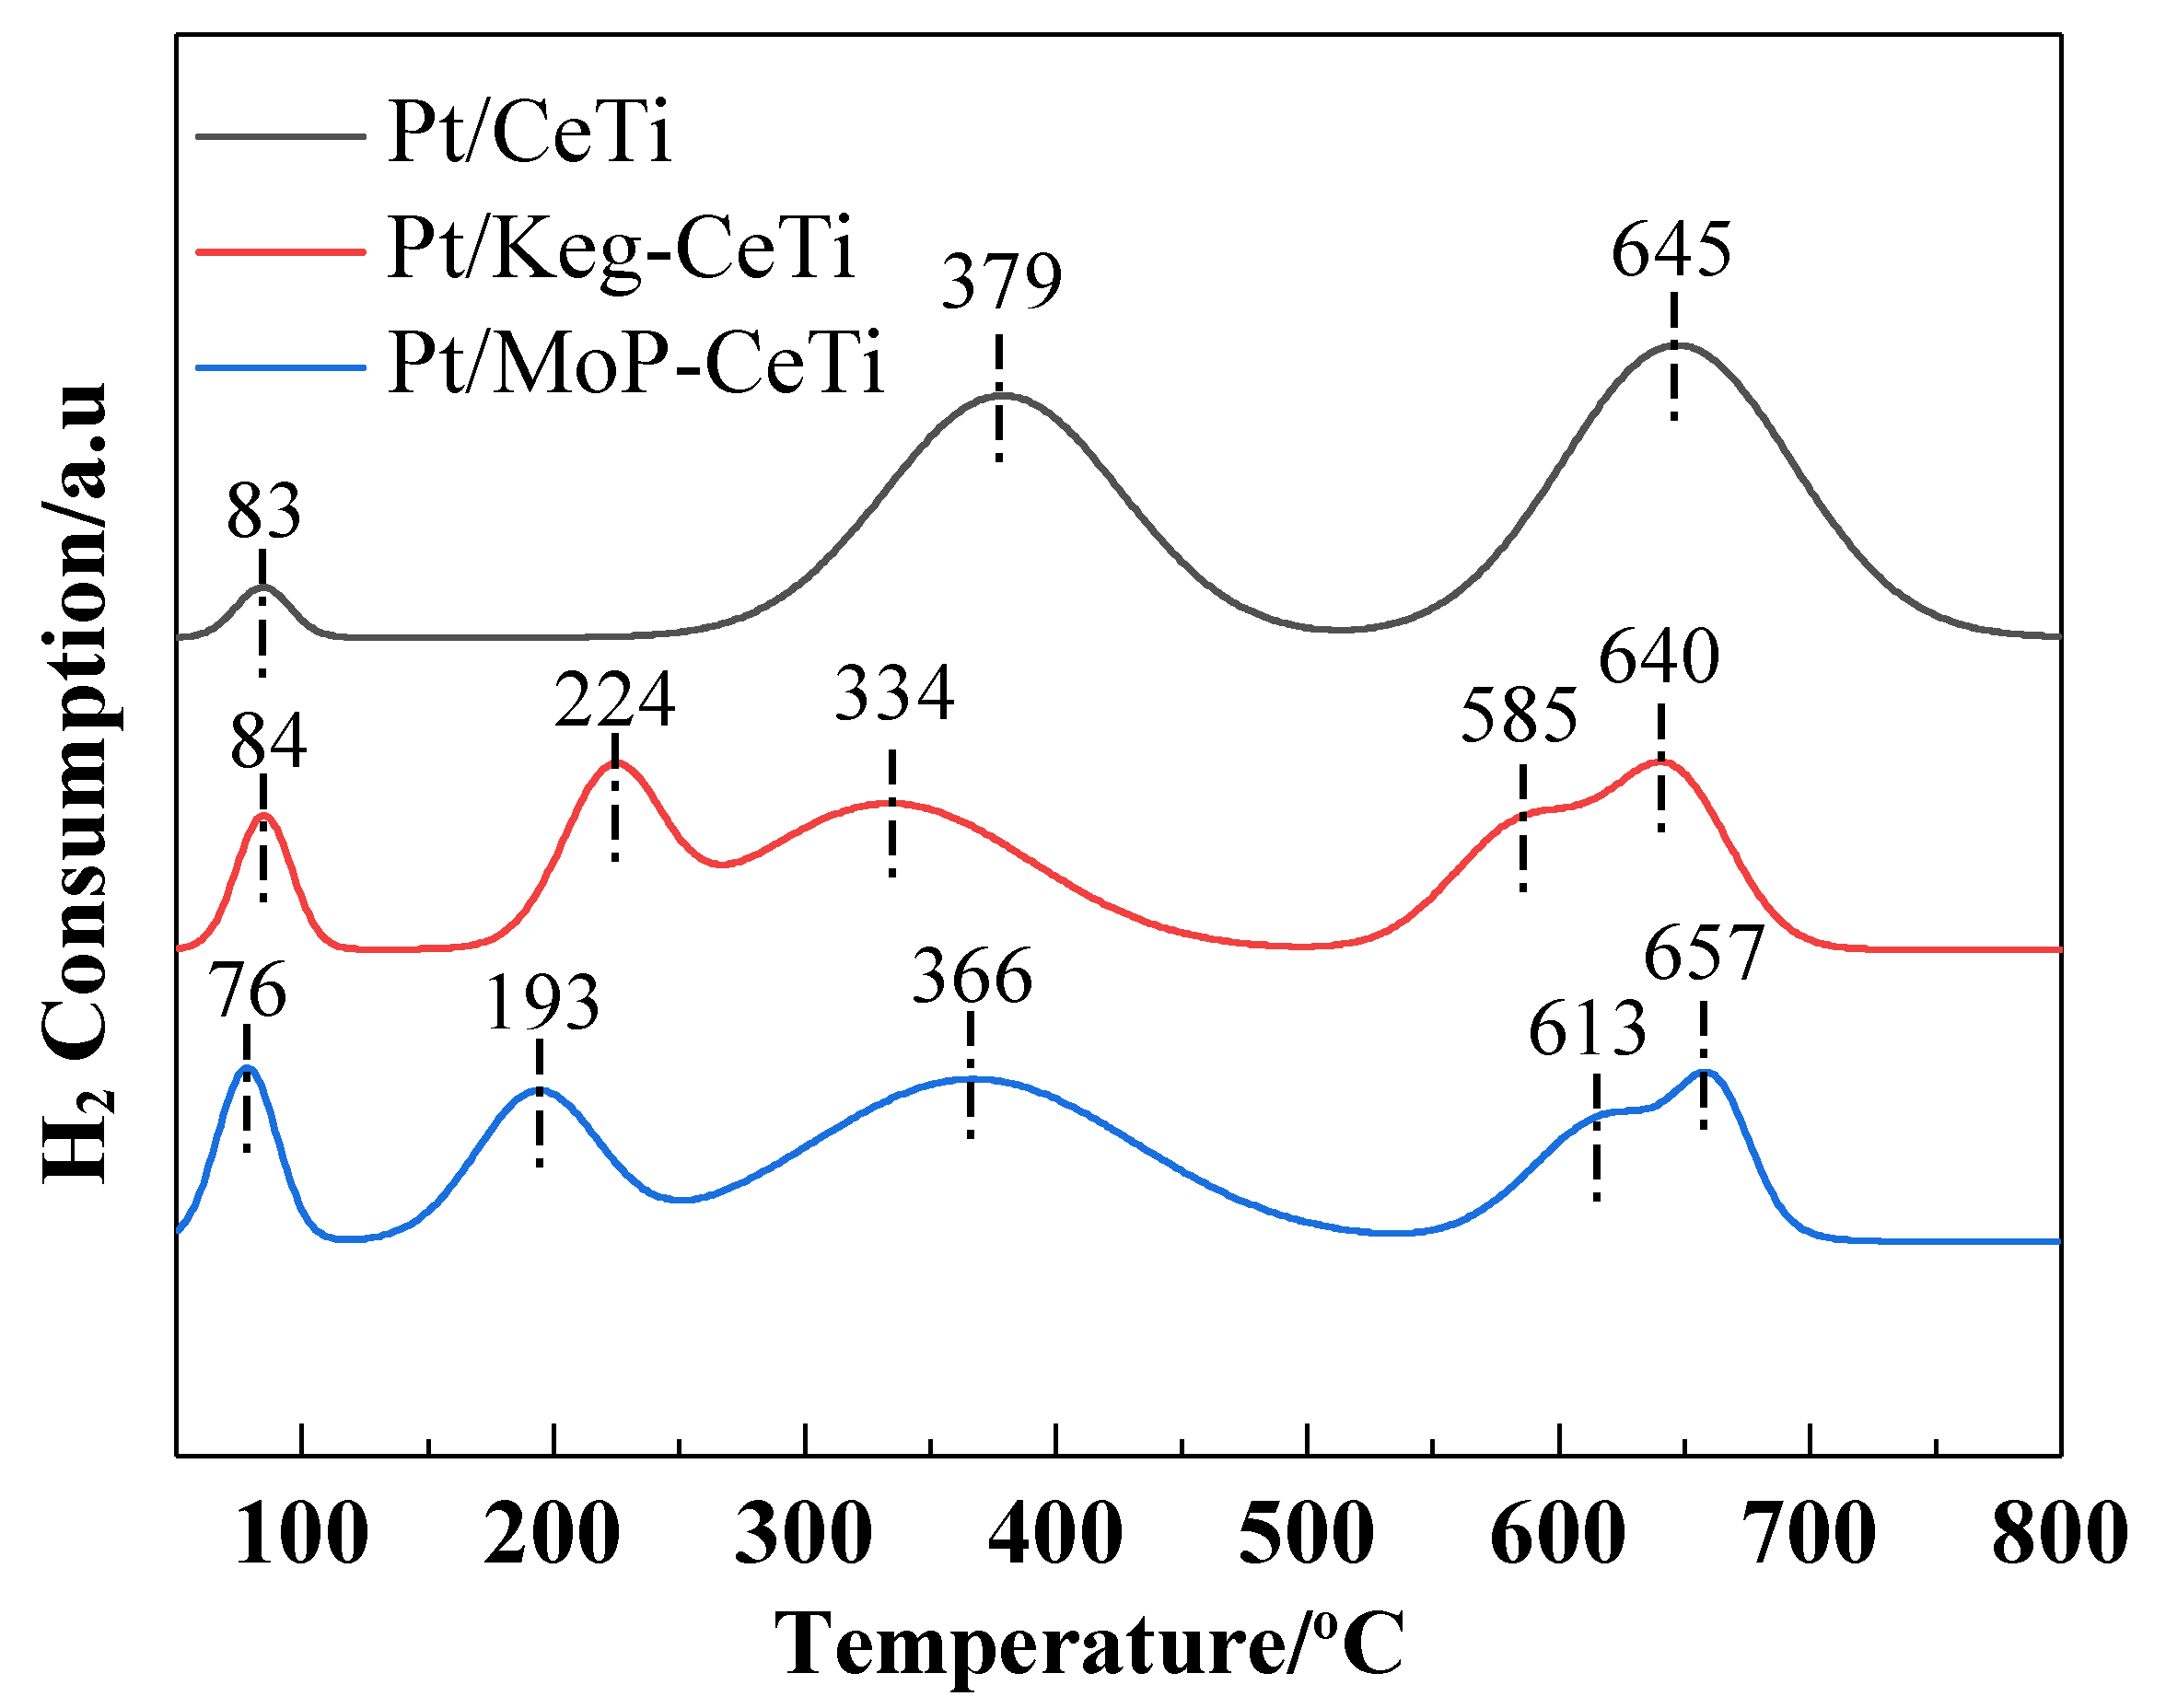
2.4. Surface Properties and Redox Property

The Pt 4f and Ce 3d XPS spectra of the three samples are illustrated in Figure 7, and the surface atomic compositions, Pt4+/(Pt2+ + Pt4+), Ce3+/(Ce3+ + Ce4+), and Oads/(Oads + Olatt) molar ratios, and binding energies are summarized in Table 2 and Table S2.
It was observed that the binding energy values of Pt 4f in the three samples were different (Figure 7a). The peaks were labeled as “a” and “b,” representing Pt2+ and Pt4+ [50], respectively. This suggested that Pt2+ and Pt4+ coexisted on the three catalysts’ surface with different surface atomic concentrations and atomic ratios, and no Pt0 species were detected. The surface atomic concentrations of Pt for Pt/CeTi, Pt/Keg-CeTi, and Pt/MoP-CeTi were 0.23%, 0.16%, and 0.11% (Table 2), respectively, revealing that the addition of molybdophosphate with or without the Keggin structure resulted in a decrease in the surface active sites. This might be one reason why Pt/CeTi has the best catalytic activity in the absence of H2O and SO2. The atomic ratios of Pt4+/(Pt2+ + Pt4+) for Pt/CeTi, Pt/Keg-CeTi, and Pt/MoP-CeTi were 23.3%, 24.7%, and 55.7% (Table 2), indicating that the introduction of molybdophosphate with the Keggin structure had no obvious effect on the Pt valence state. However, the Pt valence state of Pt/MoP-CeTi changed a lot. During the destruction of the Keggin structure under high temperature, more Ce3+ species were generated, resulting in more adsorbed oxygen species on the catalyst surface compared to Pt/CeTi, which might oxidize partial Pt2+ to Pt4+. The XPS spectra of Pt 4f in the recovered Pt/CeTi, Pt/Keg-CeTi, and Pt/MoP-CeTi catalysts indicated that the valence state distribution of Pt species changed significantly during the reaction (Figure S2), and the Pt4+ species in the used Pt/Keg-CeTi and Pt/MoP-CeTi samples disappeared, unlike the corresponding Pt/CeTi. The photoelectron spectrum of Ce 3d is also given in Figure 7b, in which the peaks labeled “u” represented Ce 3d3/2 contribution, and those labeled “v” were assigned to 3d5/2 [51]. The spectral lines denoted as v, v’’, v’’’ and u, u’’, u’’’ were characteristic of the Ce4+, while v’ and u’ were assigned to the Ce3+, suggesting the coexistence of Ce3+ and Ce4+ on the three catalyst samples. It is known that oxygen vacancies and unsaturated chemical bonds are related to the presence of Ce3+ and benefit the formation of chemisorbed oxygen on the surface [52]. The atomic ratios of Ce3+/(Ce3+ + Ce4+) for Pt/CeTi, Pt/Keg-CeTi, and Pt/MoP-CeTi were 18.0%, 31.0%, and 42.3%, respectively (Table 2). The relatively high Ce3+ ratio of Pt/Keg-CeTi might be attributed to the interaction between CeO2 and molybdophosphate, while the highest Ce3+ ratio of Pt/MoP-CeTi was possibly also related to the high-temperature treatment, except the interaction of CeO2 and molybdophosphate. The O 1s XPS (Figure S3) signals of the three catalysts could be fitted into two groups referred to the lattice oxygen (Olatt) at around 529.8 eV and the surface chemisorbed oxygen (Oads) in the range of 530.9–531.8 eV [53]. Compared to Pt/CeTi, the concentrations of chemisorbed oxygen species in Pt/Keg-CeTi and Pt/MoP-CeTi were higher due to the existence of more oxygen vacancies on their surface (Table 2). The difference in binding energy of oxygen species also revealed the diversity of the surface microenvironment of the catalysts.
The surface acidity of the catalysts was characterized using the NH3-TPD technique. From the TPD profile (Figure 8), two broad NH3 desorption peaks centered at 98 and 273 °C, 98 and 246 °C, and 289 and 419 °C could be observed, respectively, for the Pt/MoP-CeTi, Pt/CeTi, and Pt/Keg-CeTi samples between 50 °C and 600 °C. The signal in the low-temperature range (50–200 °C) was assigned to the desorption of physiosorbed NH3 on the weak acid sites, and the signal in the high-temperature range (200–600 °C) was ascribed to the desorption of chemisorbed NH3 on the strong acid sites [54]. It was known that the high surface acidity could inhibit the adsorption of SO2 on the catalyst surface [55]. It could be seen that there were many more acid sites, particularly for strong acid sites on the surface of Pt/Keg-CeTi. The calculated data showed that the number of total acid sites was in the order of Pt/Keg-CeTi > Pt/CeTi > Pt/MoP-CeTi (Table S3), which was consistent with their sulfur resistance, implying that the surface acidity of the catalyst might be one factor influencing its sulfur resistance in CO oxidation.
The H2-TPR technique was employed to investigate the reduction property of the catalysts. Figure 9 illustrates the H2-TPR profiles of the three catalysts performed under an Ar atmosphere (Table S4). One could see that there were five reduction peaks at 84, 224, 334, 585, and 640 °C for Pt/Keg-CeTi, as well as five peaks at 76, 193, 366, 613, and 657 °C for Pt/MoP-CeTi. For Pt/CeTi, only three reduction peaks at 83, 379, and 645 °C could be observed. As a result of the hard reduction of titanium oxides below 700 °C, all the signals of the various catalysts were attributed to the reduction of corresponding platinum, cerium, and molybdenum species. The reduction peak below 100 °C could be assigned to the reduction of Pt oxides. The Pt reduction temperatures of Pt/CeTi (83 °C), Pt/Keg-CeTi (84 °C), and Pt/MoP-CeTi (76 °C) are comparably higher than the data of bulk Pt oxides’ reduction, which is normally below room temperature, possibly due to the strong interaction between Pt and CeO2 and the formation of Pt−O−Ce species [56]. The reduction peaks in the ranges of 150–500 °C and 550–700 °C originated from the reduction of the surface and bulk of CeO2, respectively [57,58]. For the Pt/Keg-CeTi and Pt/MoP-CeTi catalysts, there were two reduction peaks of surface cerium species between 150 and 500 °C, and their position moved to a lower temperature range compared to the data of Pt/CeTi, possibly due to the modification of molybdophosphate and the interaction between Pt and CeO2. In addition, the shoulder peaks at 585 and 613 °C were attributed to the reduction of molybdenum species in Pt/Keg-CeTi and Pt/MoP-CeTi [59], respectively, implying that it was easier to reduce the molybdenum species within the Keggin structure compared to the MoO3 in Pt/MoP-CeTi. The better reduction of surface cerium and molybdenum species for Pt/Keg-CeTi was beneficial to improve its catalytic performance for CO oxidation.

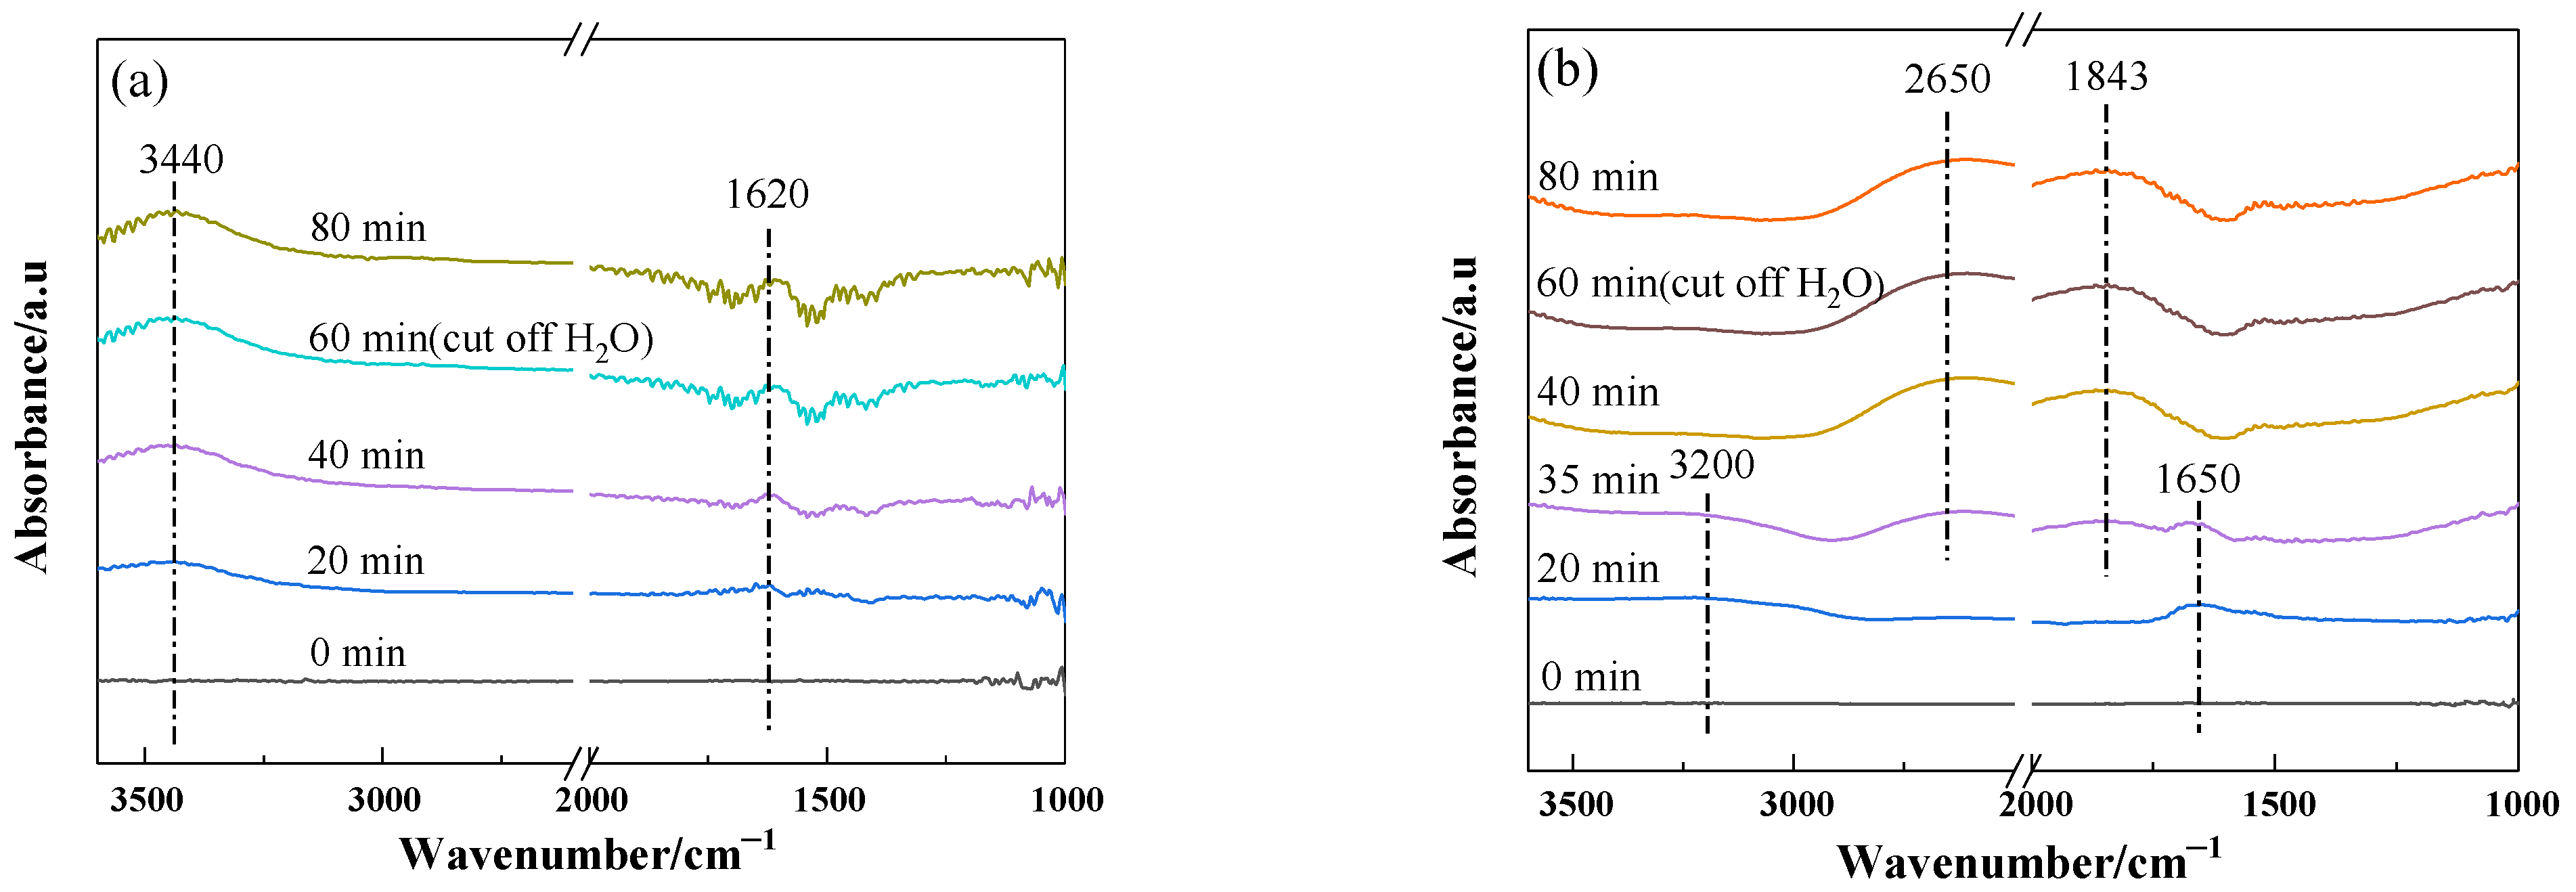
2.5. Water Adsorption on the Catalysts

According to Feng’s study [60], H2O could enhance the catalytic oxidation of CO, and the promoting effect of H2O was greater than the inhibiting effect of SO2 when H2O and SO2 coexisted in the atmosphere. Similar phenomena were observed over Pt/CeTi and Pt/Keg-CeTi, but it was different for Pt/MoP-CeTi (Figure 1 and Figure 2). In order to explain the phenomena, H2O-DRIFTS experiments over Pt/Keg-CeTi and Pt/MoP-CeTi were conducted at 250 °C with 3% H2O (Figure 10). During the experiment, 3% H2O was supplied in the first 60 min, and then it was cut off. For the Pt/Keg-CeTi sample, with H2O exposure, two peaks at 1620 and 3440 cm−1 grew in intensity with time (Figure 10a). Moreover, their intensities remained after H2O was cut off, indicating a stable adsorption of H2O molecules on the Pt/Keg-CeTi surface at 250 °C. For the Pt/MoP-CeTi sample, two peaks 1650 and 3200 cm−1 were detected in the first 35 min. However, after that, the H2O adsorption peaks almost disappeared and two new peaks centered at 1843 and 2650 cm−1 appeared, which remained even after cutting off the water. The bands at 1843 and 2650 cm−1 could be attributed to the PO-H stretching vibration of hydrogen phosphate and dihydrogen phosphate, revealing the change in the support chemical structure. The formation of hydrogen phosphate and dihydrogen phosphate on the Pt/MoP-CeTi surface in the presence of moisture at 250 °C could lead to the inhibition of H2O adsorption and inaccessibility of active sites, which might be the main reason for the deactivation of Pt/MoP-CeTi in the presence of H2O.

3. Experimental

3.1. Chemicals

All chemical reagents were from commercial sources and were used directly without any further purification. The CeO2, (NH4)6Mo7O24 (99%), and NH4H2PO4 (99%) were of analytical grade and were purchased from Fuchen (Tianjin, China). Platinum nitrate solution (14.99%) was from Helishi, (Shanghai, China). TiO2 was an industrial product from Xinhua, (Chongqing, China).

3.2. Catalyst Preparation

The CeTi composite oxide support was prepared by the ball milling method. Commercial anatase TiO2 (16.0 g) and CeO2 (4.0 g) were placed into a 500 cm3 sintered zirconium oxide grinding jar with agate balls (20, 15, and 10 mm in diameter). The ball-to-powder mass ratio was 10:1, and the rotation speed and time were 500 rpm and 1 h, respectively. The received powder was calcined at 500 °C for 2 h, giving the CeTi support. The Pt/CeTi catalyst was fabricated by an impregnation method. In a typical procedure, a 4 g CeTi support was mixed with a calculated amount of platinum nitrate solution of 0.02 mol/L according to the Pt loading (1 wt%), stirred at 80 °C for 2 h, and then dried at 80 °C for 6 h. The resulting solid was ground into powder and calcined at 350 °C for 2 h, giving the Pt/CeTi catalyst. Certain amounts of CeTi support, (NH4)6Mo7O24, and NH4H2PO4 were added to 200 mL of distilled water, stirred, and then nitric acid solution was added dropwise to adjust the system pH = 1 at room temperature, leading to the formation of (NH4)3PMo12O40 with the Keggin structure. After 2 h, the mixture was dried at 80 °C for 6 h and calcined at 350 °C for 2 h, giving the molybdophosphate with Keggin structure-modified CeTi (Keg-CeTi), in which the (NH4)3PMo12O40 loading was 10 wt%. The corresponding catalyst, denoted as Pt/Keg-CeTi, was prepared using a similar impregnation method as above. In addition, the Keg-CeTi support was calcinated at 500 °C for 2 h to fully destroy the Keggin structure, and then the active Pt species was loaded by a similar impregnation method. The received catalyst was denoted as Pt/MoP-CeTi.

3.3. Catalyst Characterization

The X-ray diffraction (XRD) instrument was a Bruker D8 ADVANCE (Karlsruhe, Germany). The X-ray radiation source was Cu Kα (λ = 1.54 A), and the voltage between the cathode and anode and the current were 50 kV and 35 mA, respectively. The 2θ angle was in the range of 10~80°, and the scanning speed was 8 s/step with a step of 0.02°. The N2 adsorption was detected by using Autosorb iQ automatic physical adsorption made by Quantachrome Instruments (Boynton Beach, FL, USA). The sample was pretreated at 200 °C for 4 h under vacuum conditions, and the N2 adsorption isotherms were performed at 77 K. The BET (Brunauer–Emmett–Teller) method was used to calculate the specific surface area of the catalyst, and the Barrett–Joyner–Halenda (BJH) method was used to calculate the pore size distribution and pore volume of the catalyst. The profiles of H2-temperature programmed reduction (H2-TPR) was performed on an Autochem II 2920, Micromeritics (Norcross, PA, USA) chemisorption apparatus. Before experiments, 50 mg of catalyst powder was pretreated in pure N2 at 200 °C for 60 min. After cooling to room temperature, a 10% H2/Ar mixture was introduced to purge the sample. When the baseline was stable, the temperature was programmed to 900 °C with a heating rate of 10 °C/min; meanwhile, the H2 signal was analyzed with a TCD detector. Temperature-programmed desorption of ammonia (NH3-TPD) was used to investigate the surface acidities of the catalysts by a ChemBET Pulsar TPR/TPD, Quantachrome company (Boynton Beach, FL, USA). First, 100 mg of catalyst powder was pretreated at 200 °C for 1 h in a helium atmosphere. After that, when it was cooled to 30 °C, 2% NH3/He gas was switched on for purging for 1 h, and then it was purged with helium gas for 1 h. After the baseline was stable, the desorbed NH3 signal was detected by a thermal conductivity detector (TCD) under a heating rate of 10 °C/min. The total gas flow was 20 mL/min in each step. The temperature-programmed desorption of sulfur dioxide (SO2-TPD) was performed on the same apparatus as for NH3-TPD. An amount of 50 mg of catalyst powder was pretreated at 200 °C for 1 h in an Ar atmosphere. After that, 1000 ppm SO2 + 16 vol% O2 was switched on for 1 h at 250 °C. When it was cooled to 30 °C, Ar gas was used to purge for 1 h. After the baseline was stable, the desorbed SO2 signal was detected under a heating rate of 10 °C/min. The total gas flow was 50 mL/min in each step. Transmission electron microscopy (TEM) images were recorded over a JEM 2100, JEOL (Tokyo, Japan) microscope and operated at an acceleration voltage of 200 kV and an electric current of 20 mA. Scanning electron microscopy (SEM) images were collected with a JEOL JSM-35C (Tokyo, Japan) instrument and operated at 20 kV acceleration voltages. X-ray photoelectron spectra (XPS) were carried out on an X-ray photoelectron spectrometer (Thermo Scientific K-Alpha, Waltham, MA, USA), using monochromatic Al Kα radiation (1486.6 eV). Inductively coupled plasma–atomic emission spectrometry (ICP–AES) was used to accurately determine the accumulation of sulfur on the catalysts by ICP-AES: Aglient 7800 (Palo Alto, CA, USA). Certain amounts of Pt/CeTi, Pt/Keg-CeTi, and Pt/MoP-CeTi were treated with SO2 (1000 ppm) + O2 (16%) at 250 °C for 1 h. After cooling, one part of the samples was used to measure the content of sulfur, and another part of the samples was treated at 900 °C for 1 h before the sulfur measurement. The adsorption and transformation of sulfur species and water on the catalysts under different conditions were investigated by in situ DRIFTS experiments using a FTIR spectrometer (Nicolet 6700, Madison WI, USA) with a diffuse reflectance chamber and a KBr window. The high-sensitivity mercury-cadmium-telluride (MCT) detector was cooled by liquid nitrogen. The sample (about 120 mg) was pretreated in an N2 flow (50 mL/min) at 300 °C for 1 h. All the IR spectra were recorded in 32 accumulative scans with a resolution of 4 cm−1 in the range of 4000–400 cm−1. The background spectra were collected at corresponding temperatures after pretreatment. For SO2-DRIFTS, 150 ppm SO2 and 16 vol% O2 were introduced, and the balance gas was N2. For H2O-DRIFTS, 3% H2O was introduced and balanced with N2 too. The total flow rate was 50 mL/min.

3.4. Catalytic Activity Test

CO oxidation activity was measured in a fixed-bed quartz tube reactor (10 mm internal diameter) containing 1 mL of catalyst (40–60 mesh). The FTIR data of the three catalysts at 250 °C in the presence of CO and oxygen revealed that CO2 was the only product of CO oxidation, and there were few or no carbonate species on the catalysts’ surface (Figure S4). In order to demonstrate the reproducibility of the preparation method, three parallel samples were prepared and tested (Figure S5). The activity was detected from 80 °C to 300 °C under a heating rate of 10 °C/min. The typical composition of reactant gas was as follows: [CO] = 1%, [O2] = 6%, [SO2] = 100 ppm (when used), [H2O] = 10% (when used), and He as balance. The total flow rate was 667 mL/min, which corresponded to an hourly space velocity (GHSV) of approximately 4 × 10⁵ h−1. The SO2/H2O durability experiment was evaluated at 200 or 250 °C under similar conditions. The reaction was carried out under atmospheric pressure, and the CO conversion was calculated as follows:
X = [ CO ] in [ CO ] out [ CO ] in × 100 %

4. Conclusions

In this work, three catalysts, Pt/CeTi, Pt/Keg-CeTi, and Pt/MoP-CeTi, were prepared by similar impregnation methods and used for CO oxidation. It was found that the Pt/Keg-CeTi catalyst showed a higher resistance to SO2 and H2O compared to Pt/CeTi and Pt/MoP-CeTi, which could be associated with its stronger surface acidity, better reduction of surface cerium and molybdenum species, and much lower SO2 adsorption and transformation than the two others due to the modification of molybdophosphate with the Keggin structure. However, the Pt/MoP-CeTi catalyst displayed a much lower resistance to SO2 and H2O, which might be attributed to the low stability of molybdophosphate without the Keggin structure as a result of the formation of hydrogen phosphate and dihydrogen phosphate in the presence of H2O under the reaction temperature, as well as the low surface Pt concentrations and moderate SO2 adsorption and transformation. This work may offer a simple strategy to improve the catalyst performance for CO oxidation.

Supplementary Materials

The following are available online at https://www.mdpi.com/article/10.3390/catal12010004/s1, Figure S1: Nitrogen adsorption/desorption isotherms of the Pt/CeTi, Pt/Keg-CeTi, and Pt/MoP-CeTi catalysts, Figure S2: Results of XPS of O 1s, Ti 2p, and Mo 3d in the Pt/CeTi, Pt/Keg-CeTi, and Pt/MoP-CeTi catalysts, Figure S3: Results of XPS of O 1s, Ti 2p and Mo 3d in the Pt/CeTi, Pt/Keg-CeTi and Pt/MoP-CeTi catalysts, Figure S4: Changes of FTIR spectra of Pt/CeTi, Pt/Keg-CeTi and Pt/MoP-CeTi with time under the following conditions: [CO] = 2%, [O2] = 10 vol %, balance N2, total flow rate = 50mL/min, T=250 °C, Figure S5: CO conversions as a function of reaction temperature over the three parallel samples of Pt/CeTi (a), Pt/Keg-CeTi (b) and Pt/MoP-CeTi (c), respectively. Reaction conditions: [CO]= 1%, [O2] = 6 vol %, balance He, total flow rate = 667 ml/min, GHSV = 4 × 10⁵ h−1, Table S1: ICP results of Pt/CeTi, Pt/Keg-CeTi, and Pt/MoP-CeTi after being poisoned by SO2 and the poisoned samples treated at 900 °C, Table S2: XPS binding energies (eV) of Pt/CeTi, Pt/Keg-CeTi, and Pt/MoP-CeTi, Table S3: Relative area of NH3-TPD desorption peak of Pt/CeTi, Pt/Keg-CeTi, and Pt/MoP-CeTi, Table S4: H2 consumption of Pt/CeTi, Pt/Keg-CeTi, and Pt/MoP-CeTi calculated from the H2-TPR curves.

Author Contributions

Conceptualization, T.Z., H.H. and W.Q.; methodology, T.Z. and W.Q.; validation, T.Z. and H.Z.; formal analysis, T.Z., H.Z. and R.W.; investigation, T.Z., X.D. and W.Q.; resources, W.Q.; data curation, T.Z. and W.Q.; writing—original draft preparation, T.Z.; writing—review and editing, W.Q.; visualization, T.Z. and W.Q.; supervision, W.Q. and H.H.; project administration, W.Q.; funding acquisition, W.Q. All authors have read and agreed to the published version of the manuscript.

Funding

This research was funded by the National Natural Science Foundation of China (21577005; 22075005).

Data Availability Statement

Not applicable.

Conflicts of Interest

The authors declare no conflict of interest.

References

  1. Kumar, G.M.; Sampath, S.; Jeena, V.S.; Anjali, R. Carbon monoxide pollution levels at environmentally different sites. J. Ind. Geophys. Union. 2008, 12, 31–40. [Google Scholar]
  2. DeCoste, J.B.; Peterson, G.W. Metal-organic frameworks for air purification of toxic chemicals. Chem. Rev. 2014, 114, 5695–5727. [Google Scholar] [CrossRef]
  3. Wang, W.; Gong, J.L. Methanation of carbon dioxide: An overview. Front. Chem. Sci. Eng. 2011, 5, 2–10. [Google Scholar]
  4. Park, E.D.; Lee, D.; Lee, H.C. Recent progress in selective CO removal in a H2-rich stream. Catal. Today 2009, 139, 280–290. [Google Scholar] [CrossRef]
  5. Patel, D.M.; Kodgire, P.; Dwivedi, A.H. Low temperature oxidation of carbon monoxide for heat recuperation: A green approach for energy production and a catalytic review. J. Clean Prod. 2020, 245, 118838. [Google Scholar] [CrossRef]
  6. Soubaihi, R.M.A.; Saoud, K.M.; Dutta, J. Critical review of low-temperature CO oxidation and hysteresis phenomenon on heterogeneous catalysts. Catalysts 2018, 8, 660. [Google Scholar] [CrossRef] [Green Version]
  7. Dobrosz-Gomez, I.; Gomez-Garcia, M.-A.; Rynkowski, J.M. The origin of Au/Ce1-xZrxO2 catalyst’s active sites in low-temperature CO oxidation. Catalysts 2020, 10, 1312. [Google Scholar] [CrossRef]
  8. Prasad, R.; Singh, P. A review on CO oxidation over copper chromite catalyst. Catal. Rev. Sci. Eng. 2012, 54, 224–279. [Google Scholar] [CrossRef]
  9. Lin, J.; Wang, X.D.; Zhang, T. Recent progress in CO oxidation over Pt-group-metal catalysts at low temperatures. Chin. J. Catal. 2016, 37, 1805–1813. [Google Scholar] [CrossRef]
  10. Dey, S.; Dhal, G.C. Property and structure of various platinum catalysts for low temperature carbon monoxide oxidations. Mater. Today Chem. 2020, 16, 100228. [Google Scholar] [CrossRef]
  11. Beniya, A.; Higashi, S.; Ohba, N.; Jinnouchi, R.; Hirata, H.; Watanabe, Y. CO oxidation activity of non-reducible oxide-supported mass-selected few-atom Pt single-clusters. Nat. Commun. 2020, 11, 1888. [Google Scholar] [CrossRef]
  12. Haruta, M.; Kobayashi, T.; Sano, H.; Yamada, N. Novel gold catalysts for the oxidation of carbon monoxide at a temperature far below 0 °C. Chem. Lett. 1987, 16, 405–408. [Google Scholar] [CrossRef]
  13. Haruta, M.; Yamada, N.; Kobayahsi, T.; Iijima, S. Gold catalysts prepared by coprecipitation for low-temperature oxidation of hydrogen and of Carbon Monoxide. J. Catal. 1989, 115, 301–309. [Google Scholar] [CrossRef]
  14. Haruta, M. Gold rush. Nature 2005, 437, 1098–1099. [Google Scholar] [CrossRef]
  15. Liu, G.; Walsh, A.G.; Zhang, P. Synergism of iron and platinum species for low-temperature CO oxidation: From two-dimensional surface to nanoparticle and single-atom catalysts. J. Phys. Chem. Lett. 2020, 11, 2219–2229. [Google Scholar] [CrossRef]
  16. Lamb, A.B.; Bray, W.C.; Frazer, J. The removal of carbon monoxide from air. Ind. Eng. Chem. 1920, 12, 13–221. [Google Scholar] [CrossRef]
  17. Dey, S.; Dhal, G.C. Deactivation and regeneration of hopcalite catalyst for carbon monoxide oxidation: A review. Mater. Today Chem. 2019, 14, 100180. [Google Scholar] [CrossRef]
  18. Pillai, U.R.; Deevi, S. Room temperature oxidation of carbon monoxide over copper oxide catalyst. Appl. Catal. B Environ. 2006, 64, 146–151. [Google Scholar] [CrossRef]
  19. Abdul-Kareem, H.K.; Hudgins, R.R.; Silveston, P.L. Forced cycling of the catalytic oxidation of CO over a V2O5 catalyst II Temperature cycling. Chem. Eng. Sci. 1980, 35, 2085–2088. [Google Scholar] [CrossRef]
  20. Dey, S.; Dhal, G.C. Cerium catalysts applications in carbon monoxide oxidations. Mat. Sci. Energy Technol. 2020, 3, 6–24. [Google Scholar] [CrossRef]
  21. Xie, X.W.; Li, Y.; Liu, Z.Q.; Haruta, M.; Shen, W.J. Low-temperature oxidation of CO catalysed by Co3O4 nanorods. Nature 2009, 458, 746–749. [Google Scholar] [CrossRef] [PubMed]
  22. Langmuir, I. The mechanism of the catalytic action of platinum in the reactions 2CO + O2= 2CO2 and 2H2+ O2= 2H2O. Trans. Faraday Soc. 1922, 17, 621–654. [Google Scholar] [CrossRef]
  23. Kummer, J. Use of noble metals in automobile exhaust catalysts. J. Phys. Chem. 1986, 90, 4747–4752. [Google Scholar] [CrossRef]
  24. Gandh, H.S.; Graham, G.W.; McCabe, R.W. Automotive exhaust catalysis. J. Catal. 2003, 216, 433–442. [Google Scholar] [CrossRef]
  25. Bartholomew, C.H.; Farrauto, R.J. Fundamentals of Industrial Catalytic Processes, 2nd ed.; John Wiley & Sons, Inc.: Hoboken, NJ, USA, 2005. [Google Scholar]
  26. Ramalingam, S.; Rajendran, S.; Ganesan, P. Performance improvement and exhaust emissions reduction in biodiesel operated diesel engine through the use of operating parameters and catalytic converter: A review. Renew. Sustain. Energy Rev. 2018, 81, 3215–3222. [Google Scholar] [CrossRef]
  27. Shin, H.; Baek, M.; Kim, D.H. Sulfur resistance of Ca-substituted LaCoO3 catalysts in CO oxidation. Mol. Catal. 2019, 468, 148–153. [Google Scholar] [CrossRef]
  28. Yan, D.; Li, Q.; Zhang, H.; Zhou, X.; Chen, H. A highly dispersed mesoporous zeolite@TiO2-supported Pt for enhanced sulfur-resistance catalytic CO oxidation. Catal. Commun. 2020, 142, 106042. [Google Scholar] [CrossRef]
  29. Shin, H.; Baek, M.; Ro, Y.; Song, C.; Lee, K.-Y.; Song, I.K. Improvement of sulfur resistance of Pd/Ce-Zr-Al-O catalysts for CO oxidation. Appl. Surf. Sci. 2018, 429, 102–107. [Google Scholar] [CrossRef]
  30. Jiang, Q.; Huang, M.; Qian, Y.; Miao, Y.; Ao, Z. Excellent sulfur and water resistance for CO oxidation on Pt single-atom-catalyst supported by defective graphene: The effect of vacancy type. Appl. Surf. Sci. 2021, 566, 150624. [Google Scholar] [CrossRef]
  31. Hu, J.; Burns, R.C. Homogeneous-phase catalytic H2O2 oxidation of isobutyraldehyde using Keggin, Dawson and transition metal-substituted lacunary heteropolyanions. J. Mol. Catal. A Chem. 2002, 184, 451–464. [Google Scholar] [CrossRef]
  32. Golodov, V.A.; Jumakaeva, B.S. Catalytic oxidation of CO by heteropolyacids (HPA) and dioxygen in the presence of Pd(II) salt-HPA-H2O system. J. Mol. Catal. 1986, 35, 309–315. [Google Scholar] [CrossRef]
  33. Zhizhina, E.G.; Kuznetsova, L.I.; Maksimovskaya, R.I.; Pavlova, S.N.; Maweev, K.I. Oxidation of CO to CO2 by heteropolyacids in the presence of Palladium. J. Mol. Catal. 1986, 38, 345–353. [Google Scholar] [CrossRef]
  34. Zhizhina, E.G.; Matveev, K.I. Low-temperature oxidation of CO to CO2 in solutions of halide complexes of Pt and heteropolyacids (HPA). React. Kinet. Catal. Lett. 1992, 47, 255–262. [Google Scholar] [CrossRef]
  35. Stanis, R.J.; Kuo, M.-C.; Turner, J.A.; Herring, A.M. Use of W, Mo, and V substituted heteropolyacids for CO mitigation in PEMFCs. J. Electrochem. Soc. 2008, 155, B155–B162. [Google Scholar] [CrossRef]
  36. Yoshida, T.; Murayama, T.; Sakaguchi, N.; Okumura, M.; Ishida, T.; Haruta, M. Carbon monoxide oxidation by polyoxometalate-supported gold nanoparticulate catalysts: Activity, stability, and temperature dependent activation properties. Angew. Chem. Int. Ed. 2018, 130, 1539–1543. [Google Scholar] [CrossRef]
  37. Wu, R.; Zhang, N.Q.; Liu, X.J.; Li, L.C.; Song, L.Y.; Qiu, W.G.; He, H. The Keggin structure: An important factor in governing NH3-SCR activity over the V2O5-MoO3/TiO2 catalyst. Catal. Lett. 2018, 148, 1228–1235. [Google Scholar] [CrossRef]
  38. Simsek, E.; Ozkara, S.; Aksoylu, A.E.; Onsan, Z.I. Preferential CO oxidation over activated carbon supported catalysts in H2-rich gas streams containing CO2 and H2O. Appl. Catal. A 2007, 316, 169–174. [Google Scholar] [CrossRef]
  39. Trimm, D.L. Minimisation of carbon monoxide in a hydrogen stream for fuel cell application. Appl. Catal. A 2005, 296, 1–11. [Google Scholar] [CrossRef]
  40. Gao, S.; Wang, P.L.; Yu, F.X.; Wang, H.Q.; Wu, Z.B. Dual resistance to alkali metals and SO2: Vanadium and cerium supported on sulfated zirconia as an efficient catalyst for NH3-SCR. Catal. Sci. Technol. 2016, 6, 8148–8157. [Google Scholar] [CrossRef]
  41. Smirnov, M.Y.; Kalinkin, A.V.; Pashis, A.V.; Sorokin, A.M.; Noskov, A.S.; Bukhtiyarov, V.I.; Kharas, K.C.; Rodkin, M.A. Comparative XPS study of Al2O3 and CeO2 sulfation in reactions with SO2, SO2 + O2, SO2 + H2O, and SO2 + O2 + H2O. Kinet. Catal. 2003, 44, 575–583. [Google Scholar] [CrossRef]
  42. Luo, T.; Gorte, R. Characterization of SO2-poisoned ceria-zirconia mixed oxides. Appl. Catal. B 2004, 53, 77–85. [Google Scholar] [CrossRef] [Green Version]
  43. Waqif, M.; Bazin, P.; Saur, O.; Lavalley, J.C.; Blanchard, G.; Touret, O. Study of ceria sulfation. Appl. Catal. B 1997, 11, 193–205. [Google Scholar] [CrossRef]
  44. Kwon, D.W.; Park, K.H.; Hong, S.C. Enhancement of SCR activity and SO2 resistance on VOx/TiO2 catalyst by addition of molybdenum. Chem. Eng. J. 2016, 284, 315–324. [Google Scholar] [CrossRef]
  45. Tumuluri, U.; Li, M.J.; Cook, B.G.; Sumpter, B.; Dai, S.; Wu, Z.L. Surface structure dependence of SO2 interaction with ceria nanocrystals with well-defined surface facets. J. Phys. Chem. C 2015, 119, 28895–28905. [Google Scholar] [CrossRef]
  46. Goodman, A.L.; Bernard, E.T.; Grassian, V.H. Spectroscopic study of nitric acid and water adsorption on oxide particles: Enhanced nitric acid uptake kinetics in the presence of adsorbed water. J. Phys. Chem. A 2001, 105, 6443–6457. [Google Scholar] [CrossRef]
  47. Tan, W.; Wang, J.M.; Yu, S.H.; Liu, A.N.; Li, L.L.; Guo, K.; Luo, Y.D.; Xie, S.H.; Gao, F.; Liu, F.D.; et al. Morphology-Sensitive sulfation effect on ceria catalysts for NH3-SCR. Top. Catal. 2020, 63, 932–943. [Google Scholar] [CrossRef]
  48. Bazin, P.; Sauf, O.; Lavalley, J.C.; Blanchard, G.; Visciglio, V.; Touret, O. Influence of platinum on ceria sulfation. Appl. Catal. B 1997, 13, 265–274. [Google Scholar] [CrossRef]
  49. Xu, W.Q.; He, H.; Yu, Y.B. Deactivation of a Ce/TiO2 Catalyst by SO2 in the Selective Catalytic Reduction of NO by NH3. J. Phys. Chem. C 2009, 113, 4426–4432. [Google Scholar] [CrossRef]
  50. Pei, W.B.; Liu, Y.X.; Deng, J.G.; Zhang, K.F.; Hou, Z.Q.; Zhao, X.T.; Dai, H.X. Partially embedding Pt nanoparticles in the skeleton of 3DOM Mn2O3: An effective strategy for enhancing catalytic stability in toluene combustion. Appl. Catal. B 2019, 256, 117814. [Google Scholar] [CrossRef]
  51. Tsunekawa, S.; Fukuda, T.; Kasuya, A. X-ray photoelectron spectroscopy of monodisperse CeO2−x nanoparticles. Surf. Sci. 2000, 457, L437–L440. [Google Scholar] [CrossRef]
  52. Liu, C.; Chen, L.; Li, J.; Ma, L.; Arandiyan, H.; Du, Y.; Xu, J.; Hao, J. Enhancement of activity and sulfur resistance of CeO2 supported on TiO2-SiO2 for the selective catalytic reduction of NO by NH3. Environ. Sci. Technol. 2012, 46, 6182–6189. [Google Scholar] [CrossRef] [PubMed]
  53. Sellick, D.R.; Aranda, A.; Garcia, T.; Lopez, J.M.; Solsona, B.; Mastral, A.M.; Morgan, D.J.; Carley, A.F.; Taylor, S.H. Influence of the preparation method on the activity of ceria zirconia mixed oxides for naphthalene total oxidation. Appl. Catal. B 2013, 132–133, 98–106. [Google Scholar] [CrossRef]
  54. Chmielarz, L.; Dziembaj, R.; Grzybek, T.; Klinik, J.; Lojewski, T.; Olszewska, D.; Wegrzyn, A. Pillared smectite modified with carbon and manganese as catalyst for SCR of NOx with NH3. Catal. Lett. 2000, 70, 51–56. [Google Scholar] [CrossRef]
  55. Wu, J.; Jin, S.; Wei, X.; Gu, F.; Han, Q.; Lan, Y.; Qian, C.; Li, J.; Wang, X.; Zhang, R.; et al. Enhanced sulfur resistance of H3PW12O40-modifed Fe2O3 catalyst for NH3-SCR: Synergistic effect of surface acidity and oxidation ability. Chem. Eng. J. 2021, 412, 128712. [Google Scholar] [CrossRef]
  56. Lee, J.; Ryou, Y.S.; Chan, X.J.; Kim, T.J.; Kim, D.H. How Pt interacts with CeO2 under the reducing and oxidizing environments at elevated temperature: The origin of improved thermal stability of Pt/CeO2 compared to CeO2. J. Phys. Chem. C 2016, 120, 25870–25879. [Google Scholar] [CrossRef]
  57. Damyanova, S.; Perez, C.A.; Schmal, M.; Bueno, J.M.C. Characterization of ceria-coated alumina carrier. Appl. Catal. A 2002, 234, 271–282. [Google Scholar] [CrossRef]
  58. Cheng, K.; Song, W.Y.; Cheng, Y.; Liu, J.; Zhao, Z.; Wei, Y.C. Selective catalytic reduction over size-tunable rutile TiO2 nanorod microsphere-supported CeO2 catalysts. Catal. Sci. Technol. 2016, 6, 4478–4490. [Google Scholar] [CrossRef]
  59. North, J.; Poole, O.; Alotaibi, A.; Bayahia, H.; Kozhevnikova, E.F.; Alsalme, A.; Siddiqui, M.R.H.; Kozhevnikov, I.V. Efficient hydrodesulfurization catalysts based on Keggin polyoxometalates. Appl. Catal. A 2015, 508, 16–24. [Google Scholar] [CrossRef]
  60. Feng, C.L.; Liu, X.L.; Zhu, T.Y.; Hu, Y.T.; Tian, M.K. Catalytic oxidation of CO over Pt/TiO2 with low Pt loading: The effect of H2O and SO2. Appl. Catal. A 2021, 622, 118218. [Google Scholar] [CrossRef]
Figure 1. CO conversions as a function of reaction temperature over the Pt/CeTi, Pt/Keg-CeTi, and Pt/MoP-CeTi catalysts in the absence of H2O and SO2 (a), and in the presence of SO2 (b), H2O, (c) or both H2O and SO2 (d), respectively. Reaction conditions: [CO] = 1%, [O2] = 6 vol%, [H2O] = 10% (when used), [SO2] = 100 ppm (when used), balance He, total flow rate = 667 mL/min, GHSV = 4 × 10⁵ h−1.
Catalysts 12 00004 g001
Figure 2. Durability of the Pt/CeTi, Pt/Keg-CeTi, and Pt/MoP-CeTi catalysts at constant temperatures in the presence of SO2 (a), H2O (b), and both of them (c). Reaction conditions: [CO] = 1%, [O2] = 6 vol%, [H2O] = 10% (when used), [SO2] = 100 ppm (when used), balance He, total flow rate = 667 mL/min, GHSV = 4 × 10⁵ h−1.
Catalysts 12 00004 g002
Figure 3. X-ray diffraction patterns of the Pt/CeTi, Pt/Keg-CeTi, and Pt/MoP-CeTi catalysts.
Catalysts 12 00004 g003
Figure 4. TEM and SEM images of the Pt/CeTi (a,d), Pt/Keg-CeTi (b,e), and Pt/MoP-CeTi (c,f) catalysts.
Catalysts 12 00004 g004
Figure 5. Changes in DRIFTS spectra of Pt/CeTi, Pt/Keg-CeTi, and Pt/MoP-CeTi with time. Conditions: [O2] = 16 vol%, [SO2] = 150 ppm, balance N2, total flow rate = 50 mL/min, at 250 °C.
Catalysts 12 00004 g005
Figure 6. SO2-TPD of Pt/MoP-CeTi, Pt/Keg-CeTi, and Pt/CeTi after exposure to 1000 ppm of SO2 with 16% O2 in Ar atmosphere for 1 h at 250 °C.
Catalysts 12 00004 g006
Figure 7. XPS spectra of Pt 4f (a) and Ce 3d (b) in the Pt/CeTi, Pt/Keg-CeTi, and Pt/MoP-CeTi catalysts.
Catalysts 12 00004 g007
Figure 8. NH3-TPD profiles of the Pt/CeTi, Pt/Keg-CeTi, and Pt/MoP-CeTi catalysts.
Catalysts 12 00004 g008
Figure 9. H2-TPR profiles of the Pt/CeTi, Pt/Keg-CeTi, and Pt/MoP-CeTi catalysts.
Catalysts 12 00004 g009
Figure 10. Changes in H2O-DRIFTS spectra of Pt/Keg-CeTi (a) and Pt/MoP-CeTi (b) with time. Conditions: [H2O] = 3 vol%, balance N2, total flow rate = 50 mL/min, at 250 °C.
Catalysts 12 00004 g010
Table 1. Textural and structural properties of the catalyst samples.
SamplesSBET (m2/g)Smic (m2/g)Vtot (cm3/g)Pore Size (nm)
Pt/CeTi630.00.2109.6
Pt/Keg-CeTi537.40.15212.3
Pt/MoP-CeTi413.50.1529.6
Table 2. Surface atomic concentration and atomic ratio of Pt/CeTi, Pt/Keg-CeTi, and Pt/MoP-CeTi catalysts.
SamplesSurface Atomic
Concentration (Atom%)
Atomic Ratio (%)
PtCeOPt4+/(Pt2+ + Pt4+)Ce3+/(Ce3+ + Ce4+)Oads/(Oads + Olatt)
Pt/CeTi0.231.7854.3923.318.010.1
Pt/Keg-CeTi0.161.3345.8624.731.022.2
Pt/MoP-CeTi0.111.6144.5455.742.320.1
Publisher’s Note: MDPI stays neutral with regard to jurisdictional claims in published maps and institutional affiliations.

