Article

A Novel Machine Learning Model to Predict the Photo-Degradation Performance of Different Photocatalysts on a Variety of Water Contaminants

1
Department of Civil and Environmental Engineering, Case Western Reserve University, Cleveland, OH 44106, USA
2
Department of Electrical Engineering and Computer Science, Case Western Reserve University, Cleveland, OH 44106, USA
3
Department of Mechanical Engineering, Case Western Reserve University, Cleveland, OH 44106, USA
4
Department of Chemistry, Case Western Reserve University, Cleveland, OH 44106, USA
*
Author to whom correspondence should be addressed.
These authors contributed equally to this work.
Catalysts 2021, 11(9), 1107; https://doi.org/10.3390/catal11091107
Submission received: 27 August 2021 / Revised: 14 September 2021 / Accepted: 14 September 2021 / Published: 15 September 2021
(This article belongs to the Special Issue 10th Anniversary of Catalysts—Feature Papers in Photocatalysis)

Abstract

:
This paper describes an innovative machine learning (ML) model to predict the performance of different metal oxide photocatalysts on a wide range of contaminants. The molecular structures of metal oxide photocatalysts are encoded with a crystal graph convolution neural network (CGCNN). The structure of organic compounds is encoded via digital molecular fingerprints (MF). The encoded features of the photocatalysts and contaminants are input to an artificial neural network (ANN), named as CGCNN-MF-ANN model. The CGCNN-MF-ANN model has achieved a very good prediction of the photocatalytic degradation rate constants by different photocatalysts over a wide range of organic contaminants. The effects of the data training strategy on the ML model performance are compared. The effects of different factors on photocatalytic degradation performance are further evaluated by feature importance analyses. Examples are illustrated on the use of this novel ML model for optimal photocatalyst selection and for assessing other types of photocatalysts for different environmental applications.

Graphical Abstract

1. Introduction

Water pollution associated with the increasing amount of human and industrial activities has become an emerging environmental issue that threatens the health of people and animals [1]. Organic chemicals, such as pesticides, herbicides, and polycyclic aromatic hydrocarbons (PAHs), are major types of pollutants present in the wastewater [2]. Catalysts are important to supplement the conventional biological treatment [3] to effectively and efficiently remove organic water contaminants, including semiconducting oxide photocatalysts used in practice [4,5,6]. The photocatalyst-assisted contaminant removal process is sustainable and environmental-friendly for wastewater treatment [7].
In the past decades, tremendous efforts have been devoted to developing photocatalysts and evaluating their performance in municipal water treatment operations [8,9,10,11]. However, it is challenging to quantify the efficiency of photocatalysts to a range of water-borne contaminants. The photo-degradation performance of contaminants is dependent on the properties of photocatalysts, including the crystalline structure, the size and shape of the grain, the specific surface area, pore structure, etc. [12,13]. Besides, the experimental setups, such as photocatalyst dosage, medium pH, contaminant concentration, light wavelength and intensity, etc., also affect the photocatalytic activity [14,15]. A fully factorized experimental design to optimize the photocatalyst performance with multiple variables requires a significant amount of time and cost, if not impossible to implement. The feasibility of the conventional experimental approach is further compromised due to the wide range of water-borne contaminants.
Metal-oxide semiconductor photocatalysts are capable of degrading organic compounds in contaminated water. Methods to assess their performance via conventional experimental approach incur tremendous efforts and investments, particularly in light of the complex structure of photocatalysts and the wide range of contaminants. The recent progress in machine learning (ML) allows a data-driven approach that leads to much more efficient investigation and prediction of the performance features of different photocatalysts. ML model allows to fully utilize experimental data in published literature and can generate results that guide subsequent experimental designs. These significantly save time and labor compared with the conventional experimental approach.
Data-driven ML is emerging as a new solution for photocatalyst performance assessment. ML approach is faster, cheaper, and more flexible than experiments. An artificial neural network (ANN) is an ML model that has been widely used to predict the properties of materials, ranging from polymers, metals, ceramics to composite materials [16,17,18,19,20,21]. It has also been explored to assist the accelerated discovery and design of novel photocatalysts [22,23] and to predict the photocatalytic performance of a photocatalyst [24,25,26,27,28]. However, the scope of these models is limited to organic contaminants with a similar chemical structure since they only consider a limited number of contaminants and a single photocatalyst [29]. Different types of photocatalysts, which are a major factor that affects the photo-degradation performance of the water contaminants, are not included. A challenge that prevents a comprehensive set of experimental variables is the transformation of non-numerical variables into machine-readable language.
This work introduced an innovative ML model, CGCNN-MF-ANN, applicable for a variety of photocatalysts and contaminants. Data from published research were collected to generate a database of photocatalysis matrix, including the experimental variables. The features of common semiconductor photocatalysts were extracted with Crystal Graph Convolutional Neural Network (CGCNN). The features of contaminants were represented with a digital molecular fingerprint (MF). The features of photocatalysts and contaminants, together with experimental conditions, were inputs to an optimized artificial neural network (ANN). The CGCNN-MF-ANN model achieved satisfactory consistent performance by learning from the connections between experimental variables (the types of photocatalysts, contaminants, experimental conditions) and the photocatalytic activities. As a generalized mode, it allowed to predict the performance of new photocatalysts as well as to select the best photocatalyst for degradation of a range of contaminants.

2. Results and Discussion

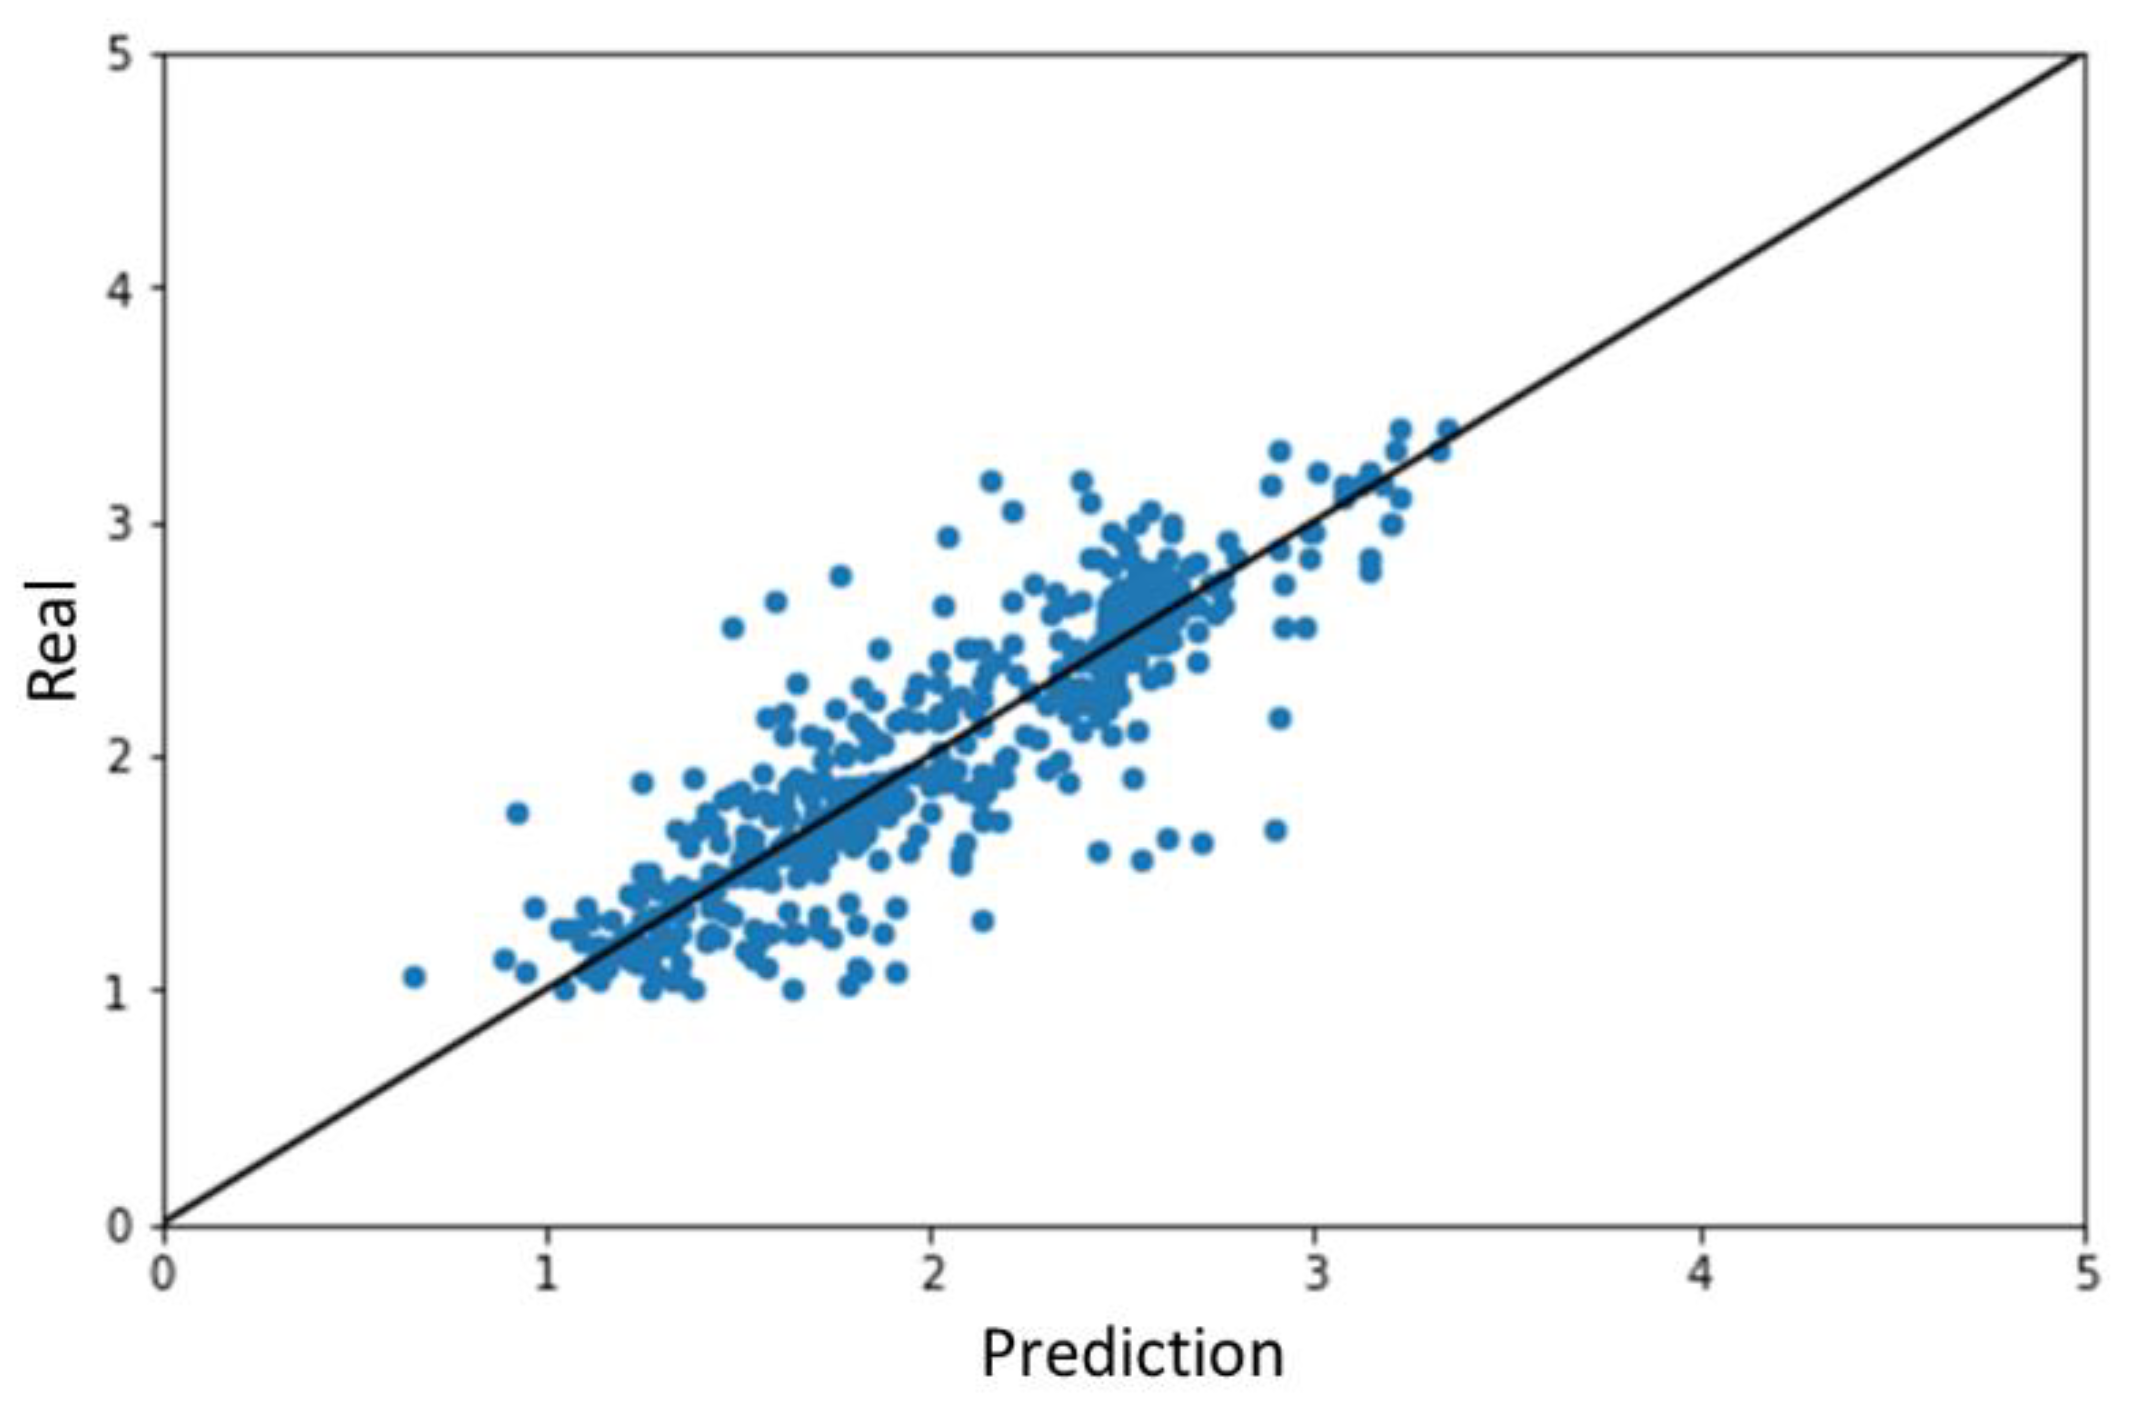
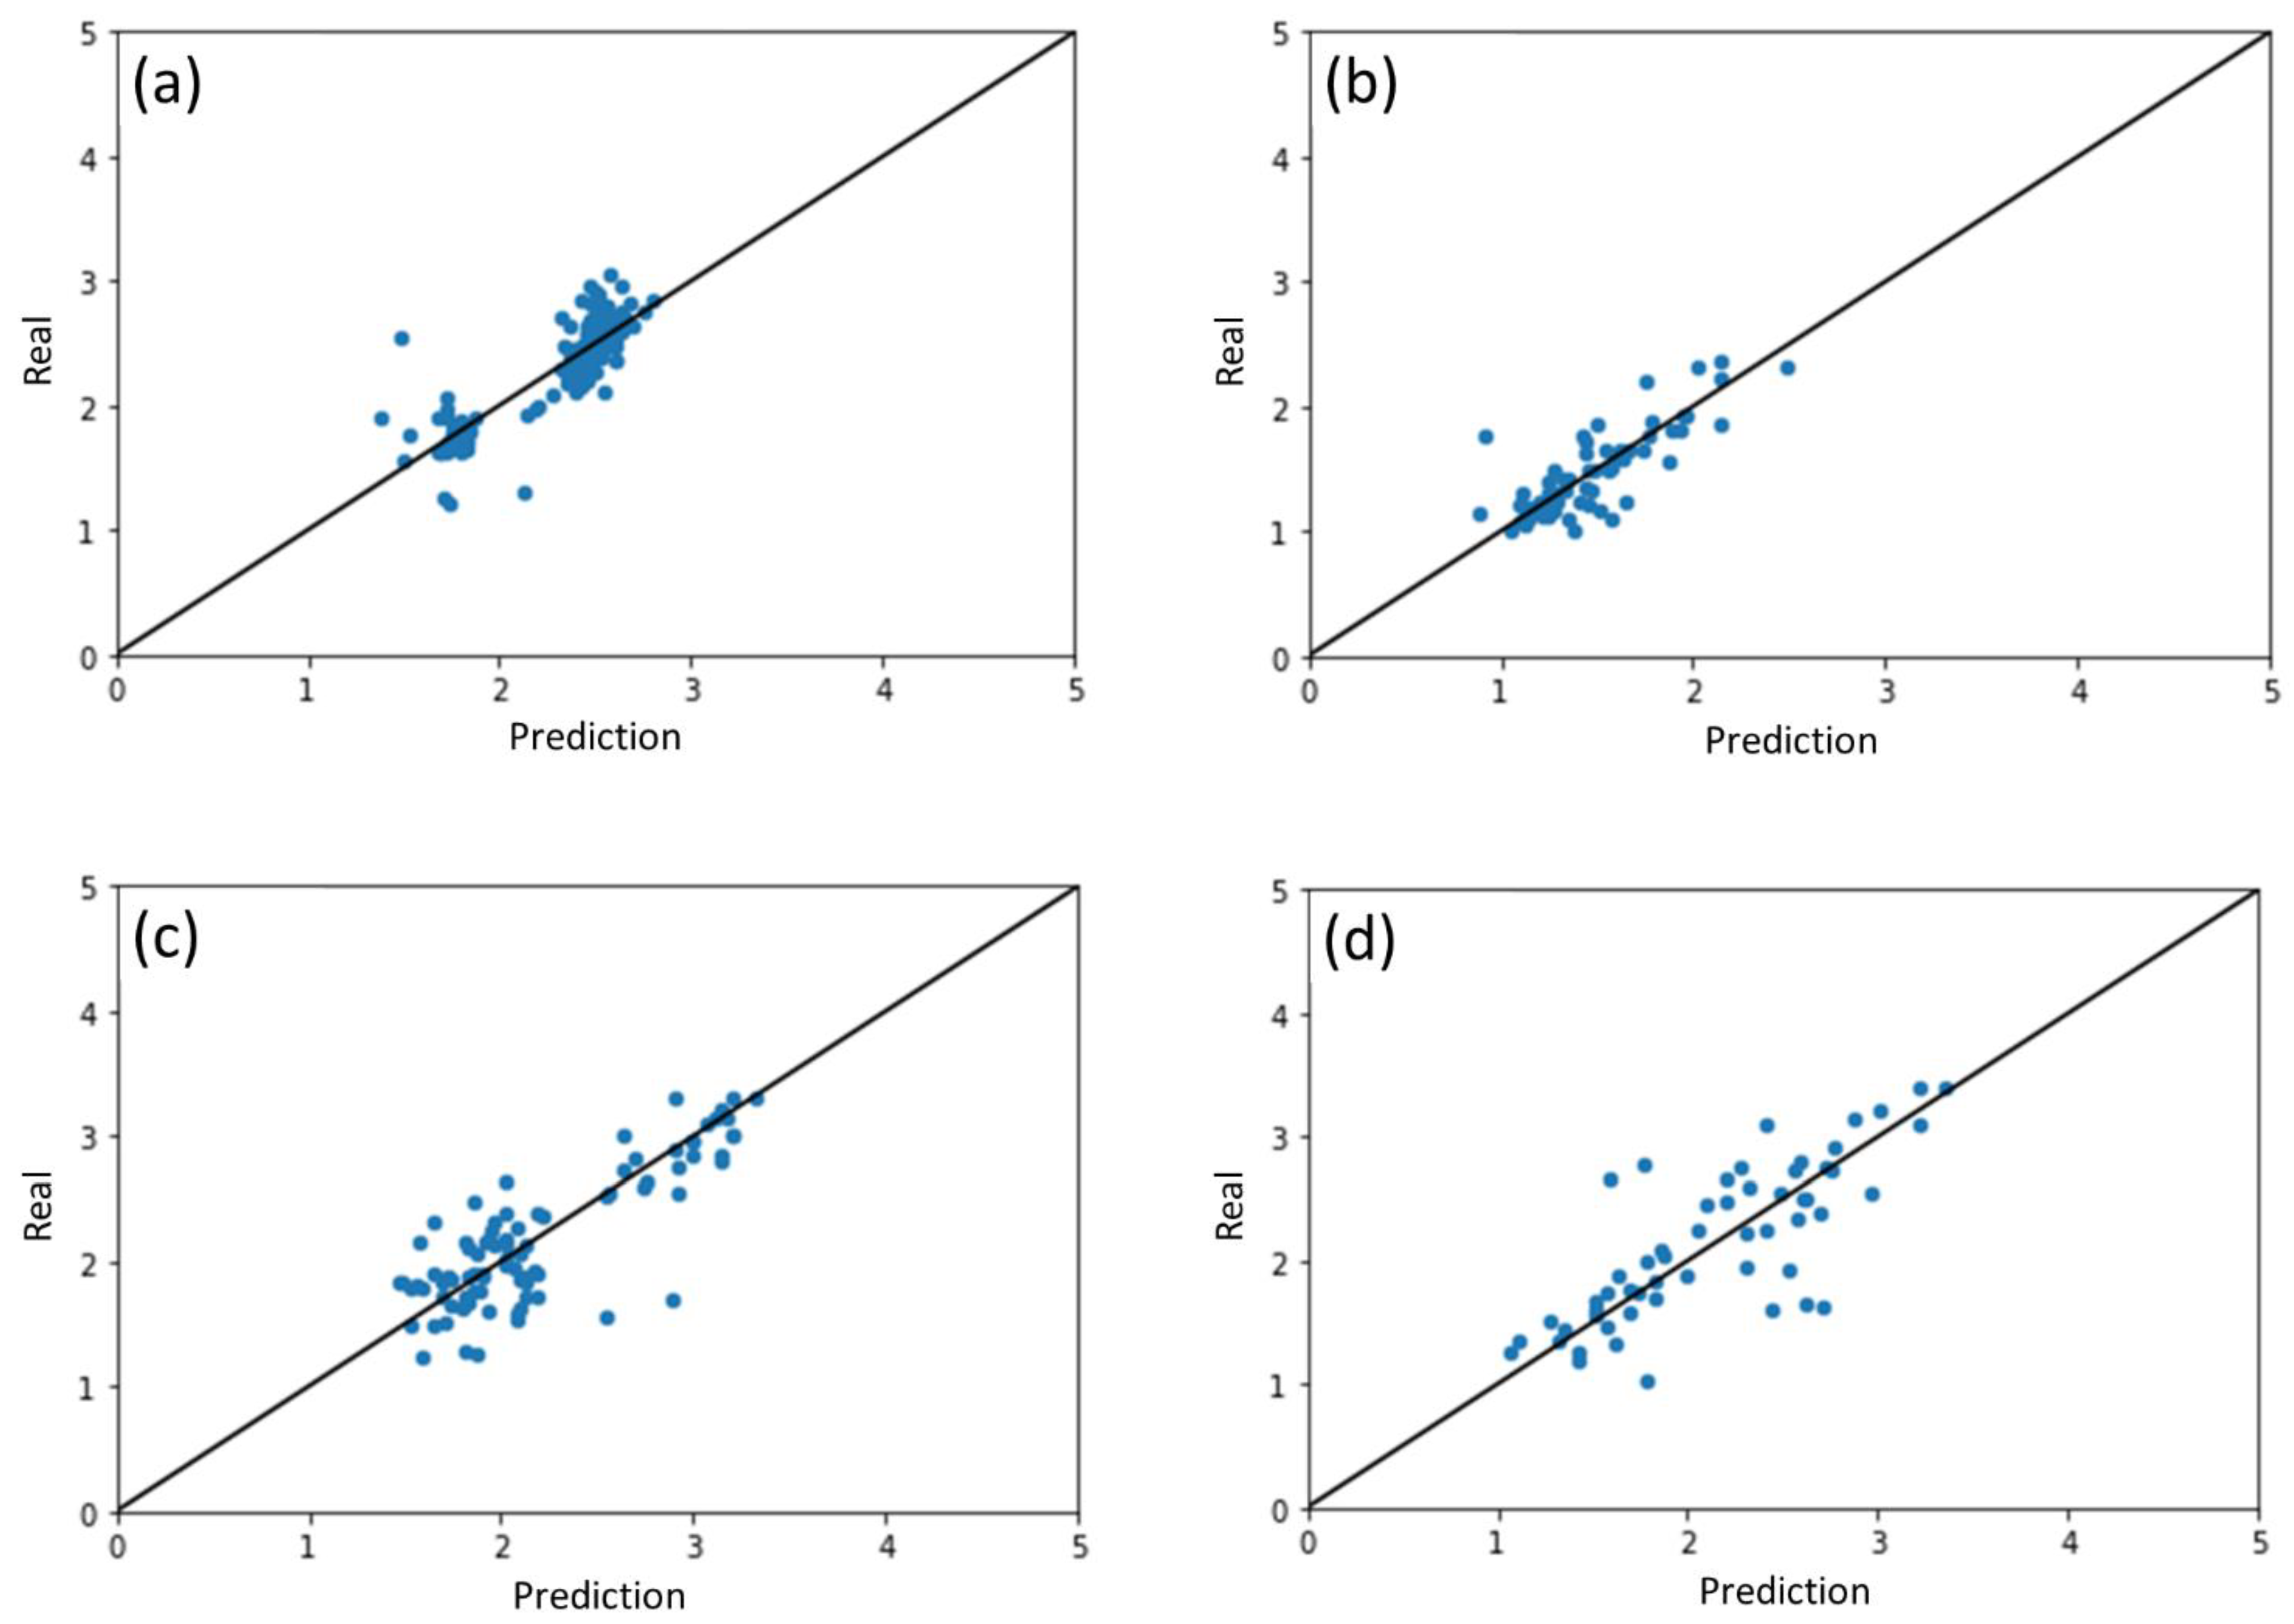
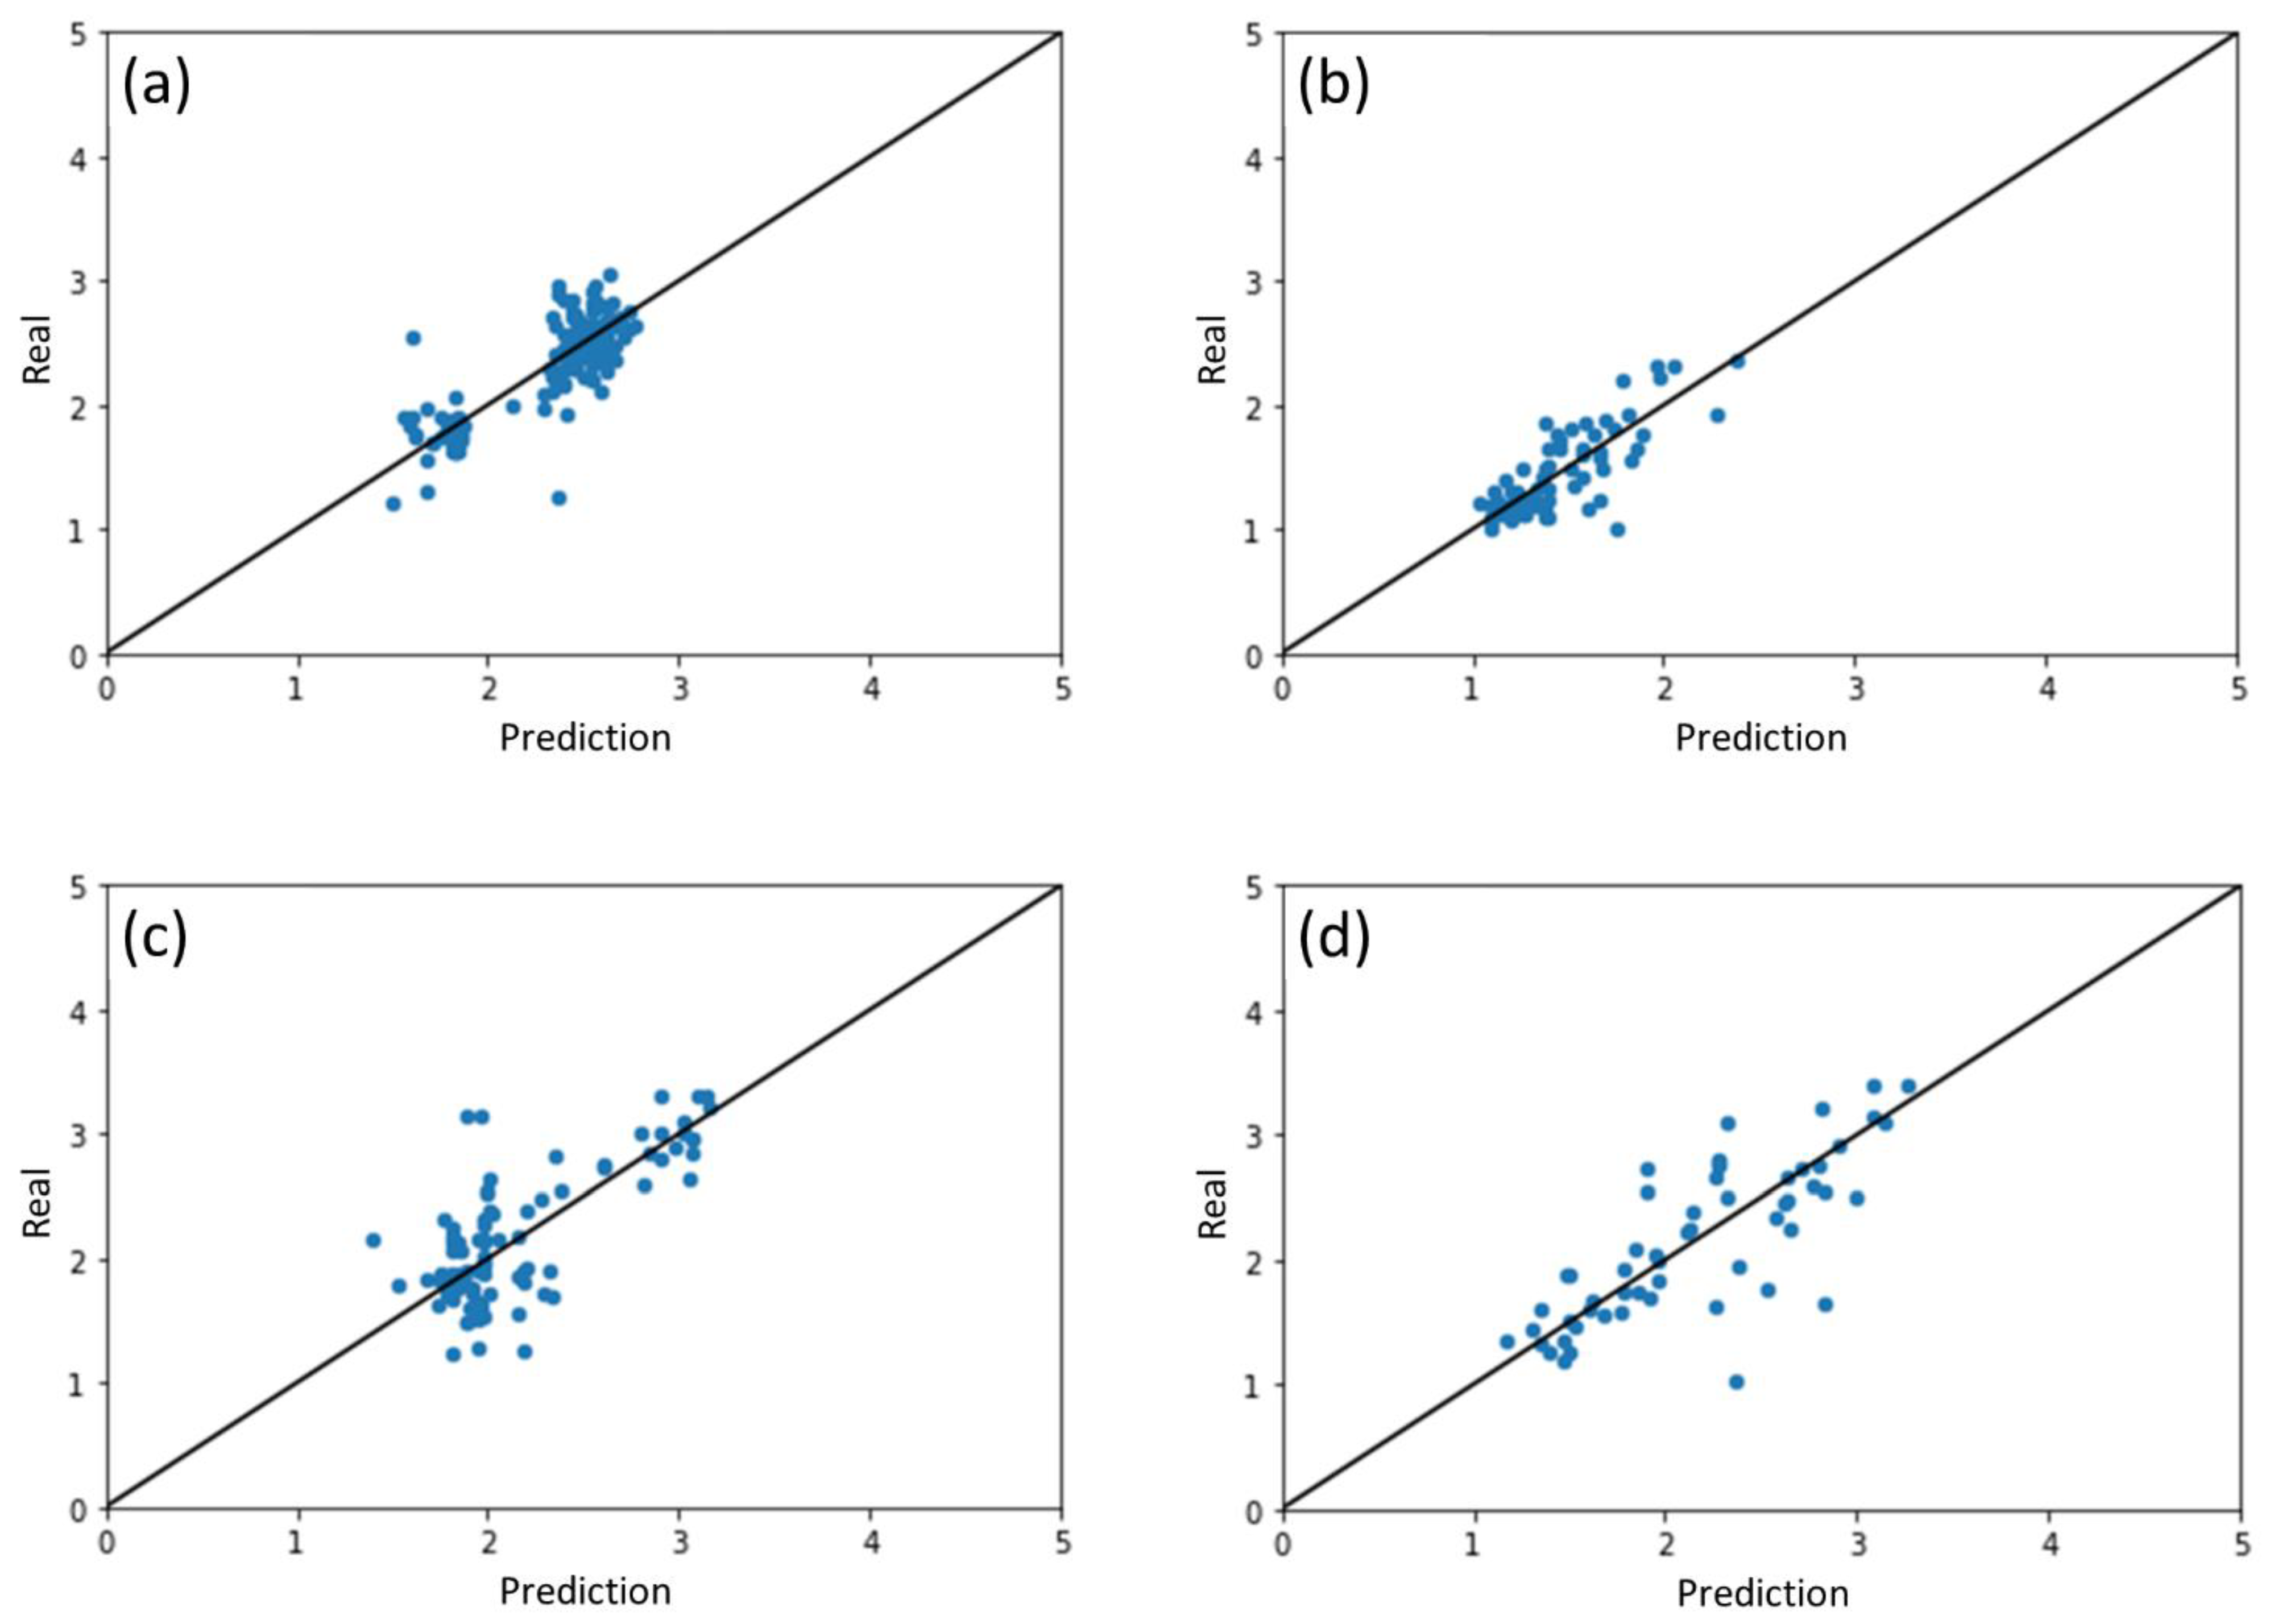
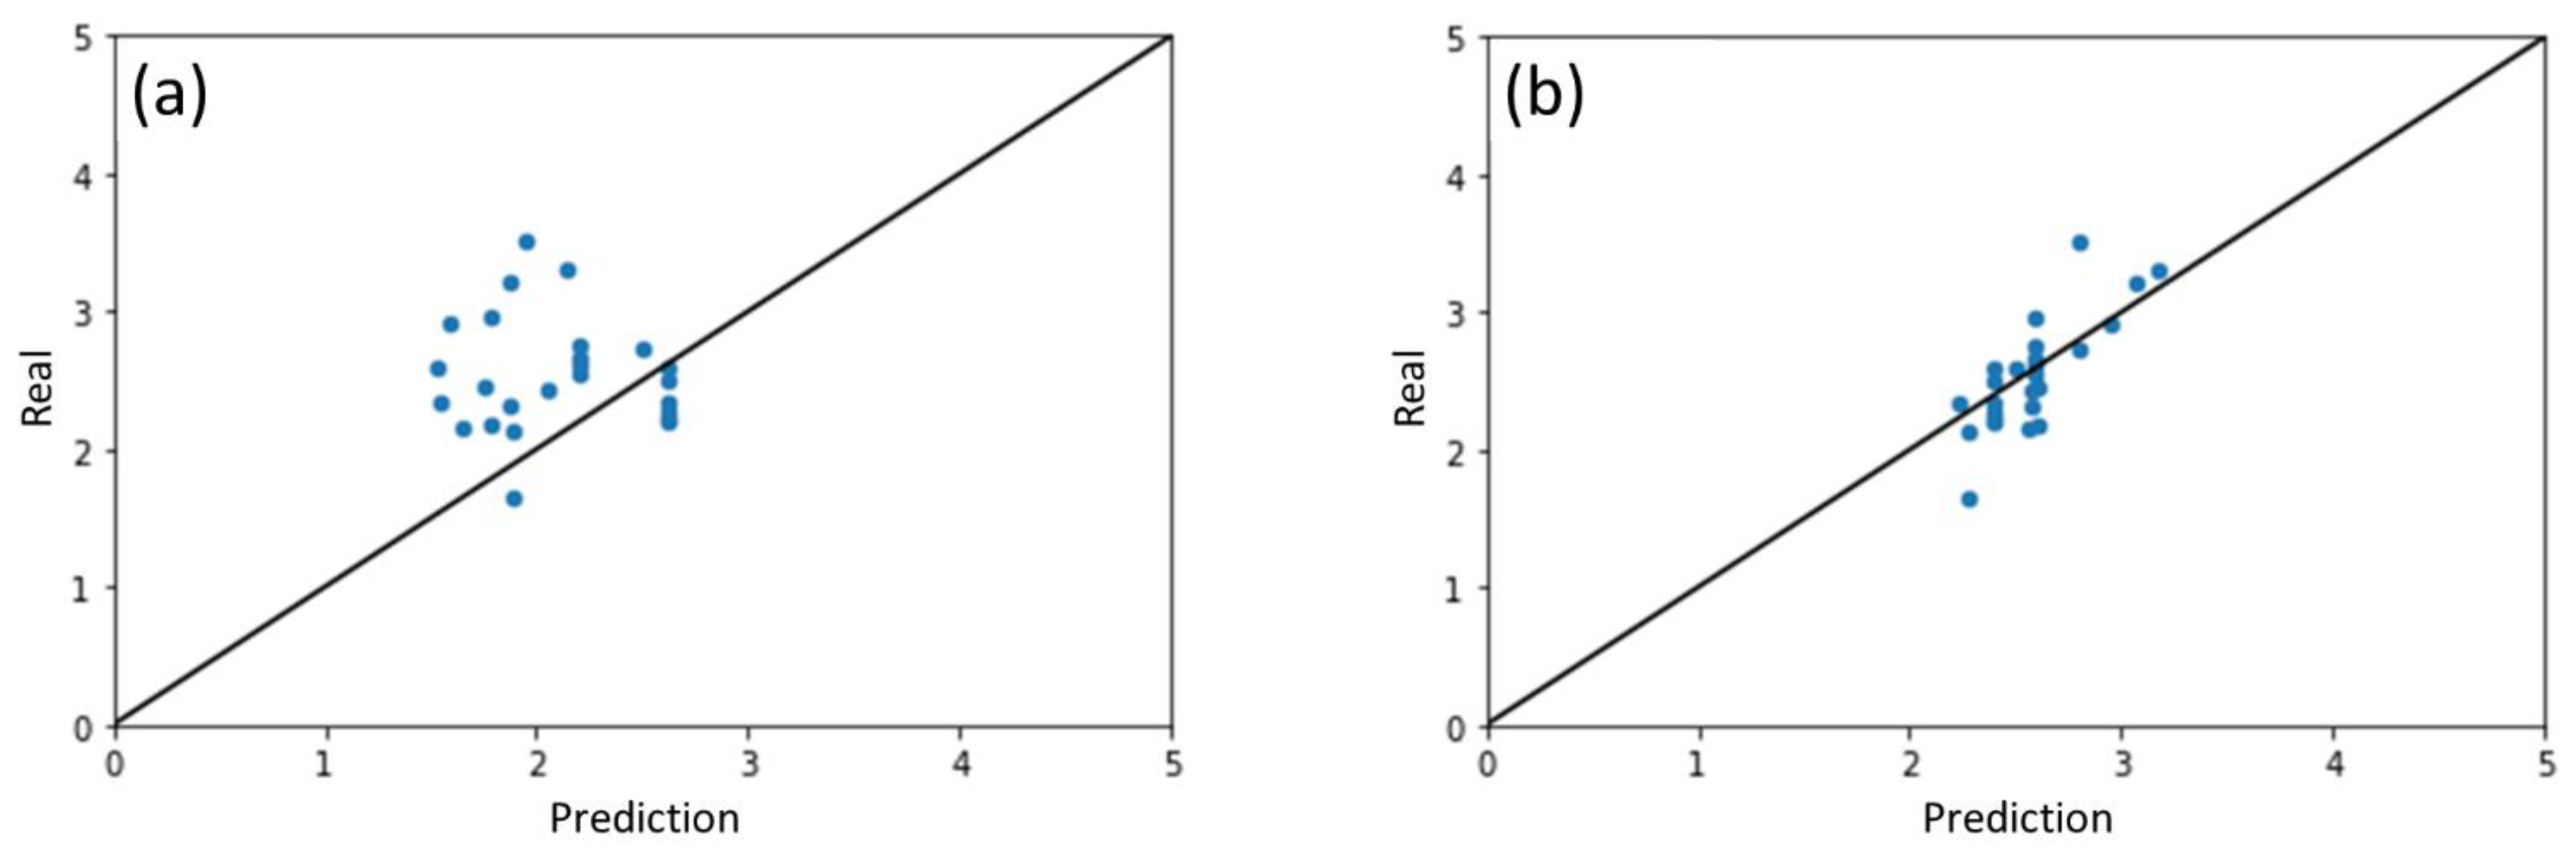
2.1. Results of ML Model Prediction

The CGCNN-MF-ANN ML model with optimal hyperparameters was trained with a three-fold cross-validation method. The three-fold cross-validation method is a re-sampling procedure and can reduce the bias of the model prediction. With this method, the complete dataset was randomly split into three subgroups, with any of the two subgroups used for model training and the rest used for testing. This process was repeated three times until each subgroup was used as the testing data.
The scatter plot in Figure 1 summarizes the results of the CGCNN-MF-ANN model prediction versus the experimental measured photocatalytic performance. A perfect prediction would lay along the 1:1 line. Overall, the predicted rate constants by the ML model were in a consistent trend with the experimental results. The overall R2 of the ML prediction versus measured results was 0.746, which was a promising performance, given the complex factors involved and the amount of data used for model training. Coefficient of determination (R2), mean absolute error (MAE), and root mean square error (RMSE) were used to evaluate the ML prediction performance. The evaluation scores of the ML model prediction performance on the three testing subgroups and the overall dataset are listed in Table 1. There were only small variations in the evaluation scores of the ML model performance among each subgroup, which indicated the CGCNN-MF-ANN model achieved consistent and reliable prediction.

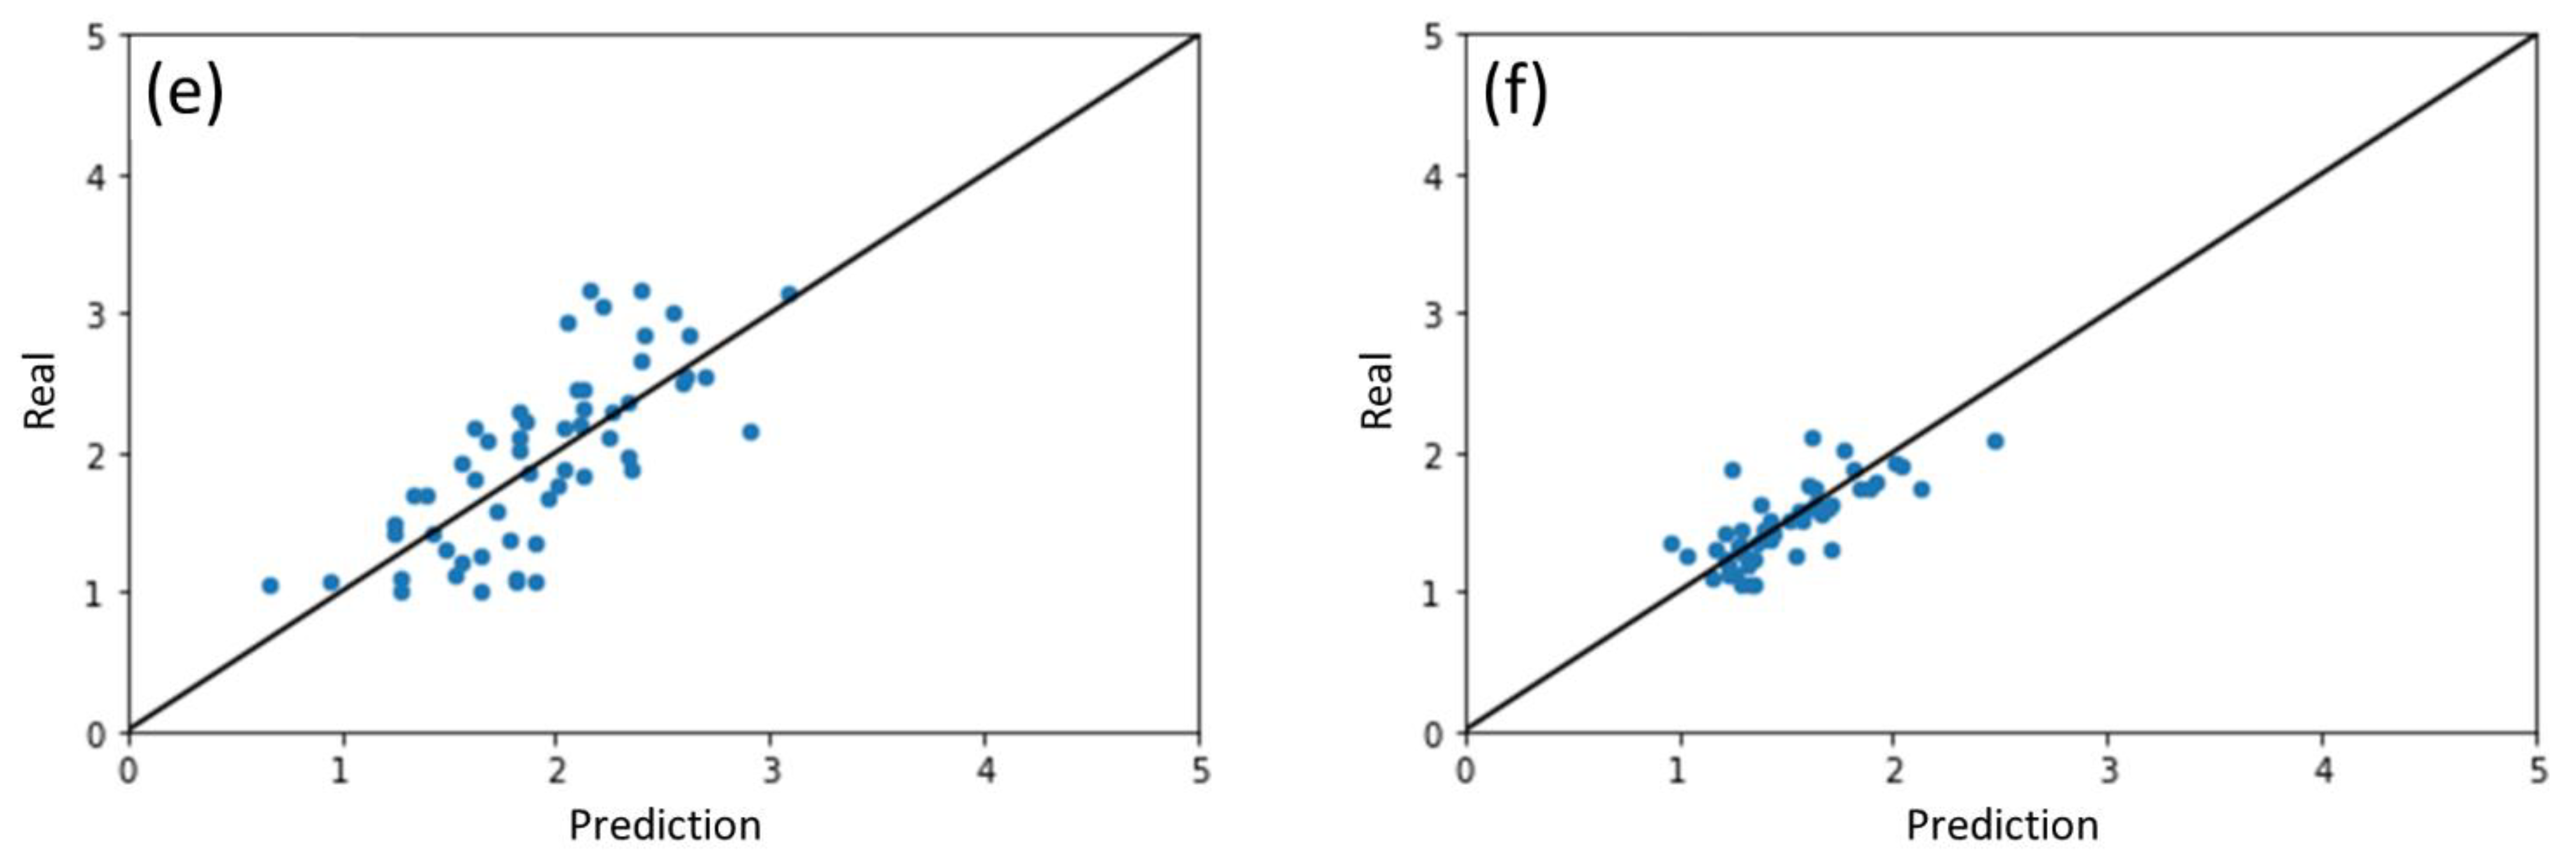
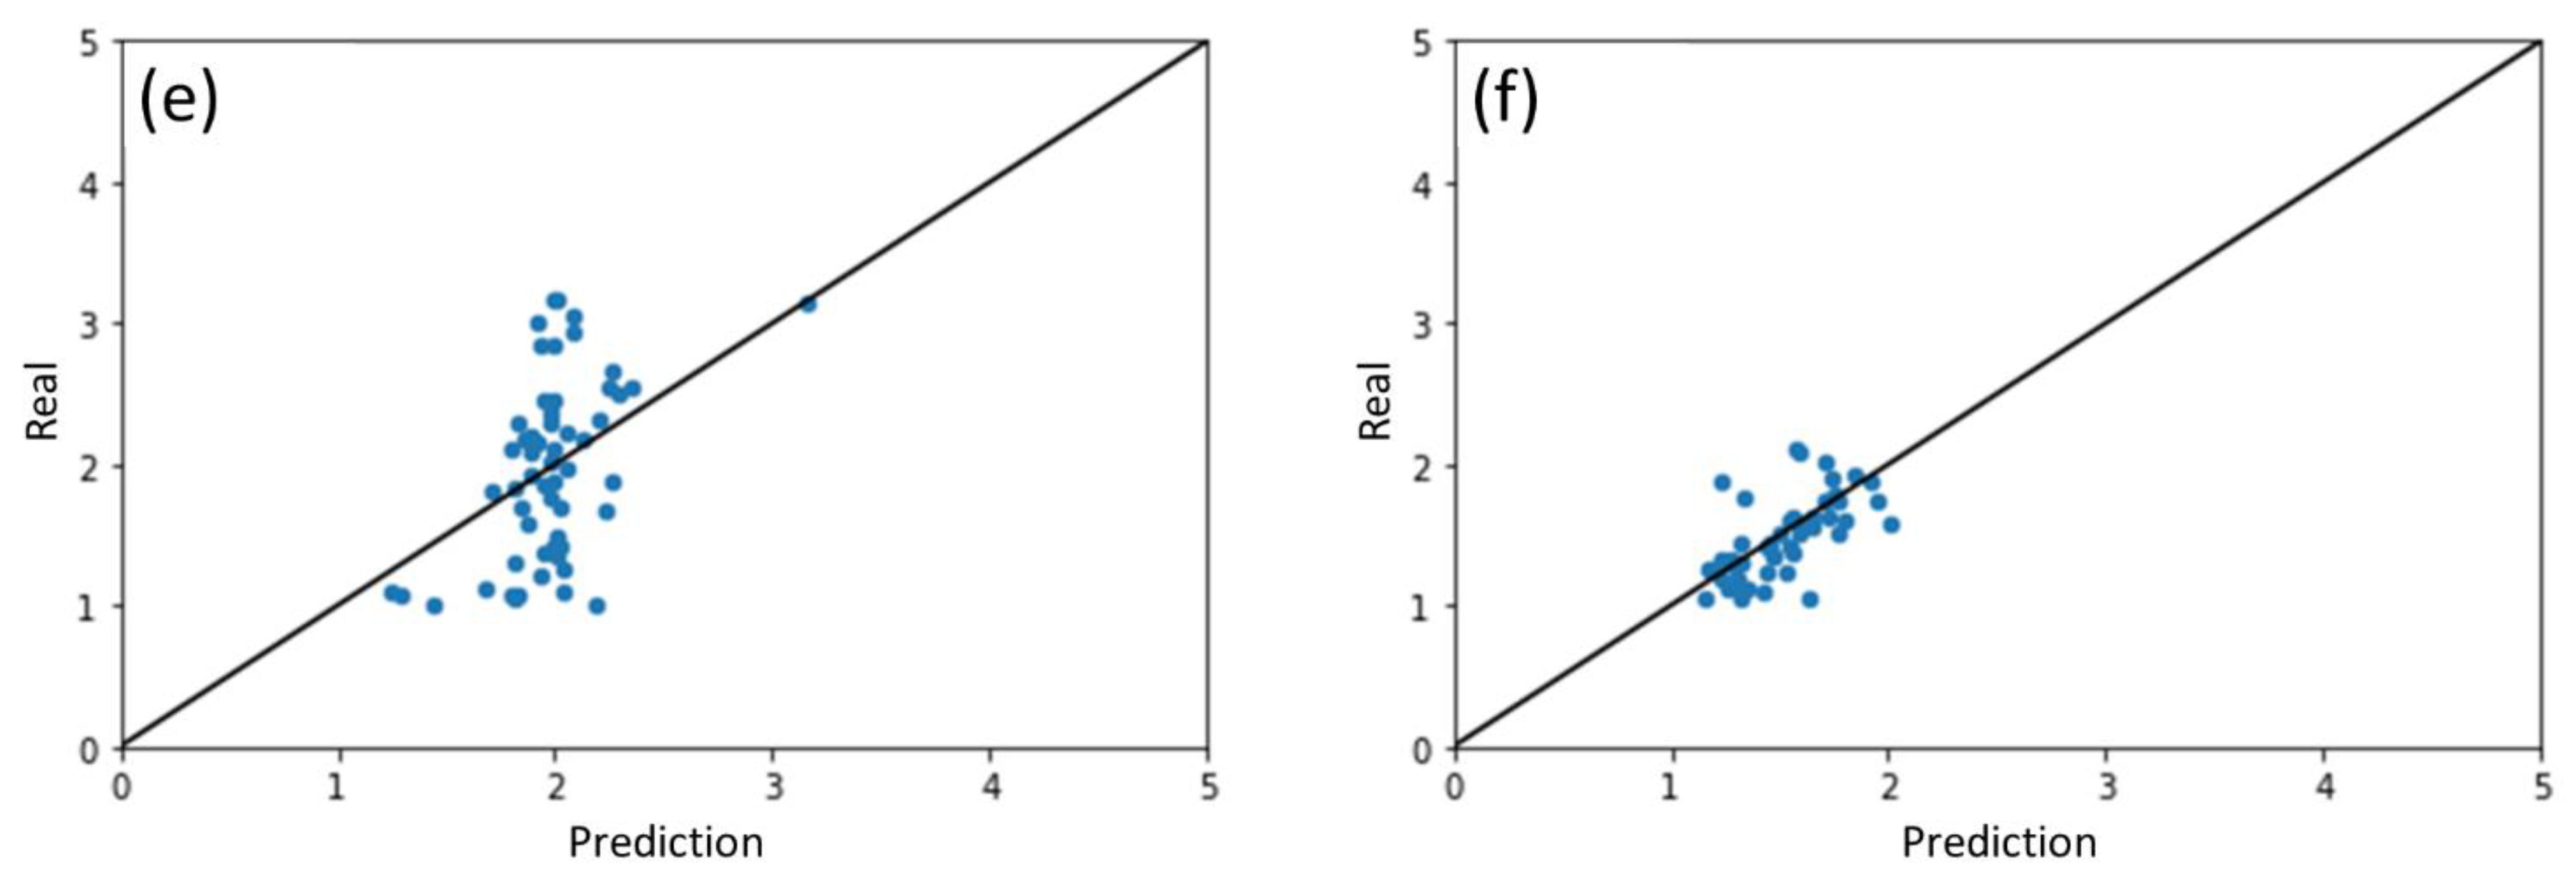
2.2. Performance of ML Model for Different Photocatalysts

Further analyses were conducted to investigate how well the CGCNN-MF-ANN ML model predicts photocatalytic degradation by different photocatalysts. Two different groups of analyses were conducted for this purpose. The first analysis aimed to investigate the generality of the ML model in predicting photocatalytic activities for different photocatalysts. All data collected for different photocatalysts were used for training and testing of the ML model via the three-fold cross-validation method described. The second group of analyses aimed to determine if there are benefits with individualized training of the ML model only with data for a specific photocatalyst. For this purpose, the data were divided into subsets according to different photocatalysts; each subset was then used to train and validate the CGCNN-MF-ANN ML model for that type of photocatalyst.
Figure 2 shows the scatter plots of the prediction results grouped by different photocatalysts with the CGCNN-MF-ANN ML model trained and validated using all the data. Figure 3 shows the results for different photocatalysts with the CGCNN-MF-ANN ML model trained separately with corresponding data by those photocatalysts. Table 2 summarizes the performance of model prediction for different photocatalysts using these two different ML model training and testing procedures. For the ML model trained with all datasets (Figure 2), its prediction performance, such as MAE, RMSE of ML model trained with the overall dataset (Table 1), lied in between those predicted for individual photocatalyst (Table 2). This was consistent with the expectation. Additionally, as seen from Table 2, for an individual photocatalyst, the ML model trained with all datasets achieved a better prediction performance than if the model was trained separately only with the data for that photocatalyst. This is counter-intuitive for a physics-based model, where data with no direct relevance (i.e., use all data) tend to lead to a larger error than if only relevant data are used (i.e., photocatalyst-specific data). Two reasons might explain the better performance for the ML model trained with more data. Firstly, the amount of data for ML model training was significantly reduced when split by individual photocatalysts for individualized training. Secondly, fewer types of organic contaminants were included in the training dataset for an individual photocatalyst, which means the diversity of the organic contaminants was reduced. This interesting observation demonstrated the essentials of a data-driven approach, i.e., the amount as well as the diversity of data. The presence of more data for model training usually leads to more accurate ML models due to more diversity of data. In general, ML models can learn more patterns and relationships from a more comprehensive dataset; they might even bring in ‘noise’ in the conventional sense. The observation in Table 2 is a vindication of the effects of data on the ML model performance.

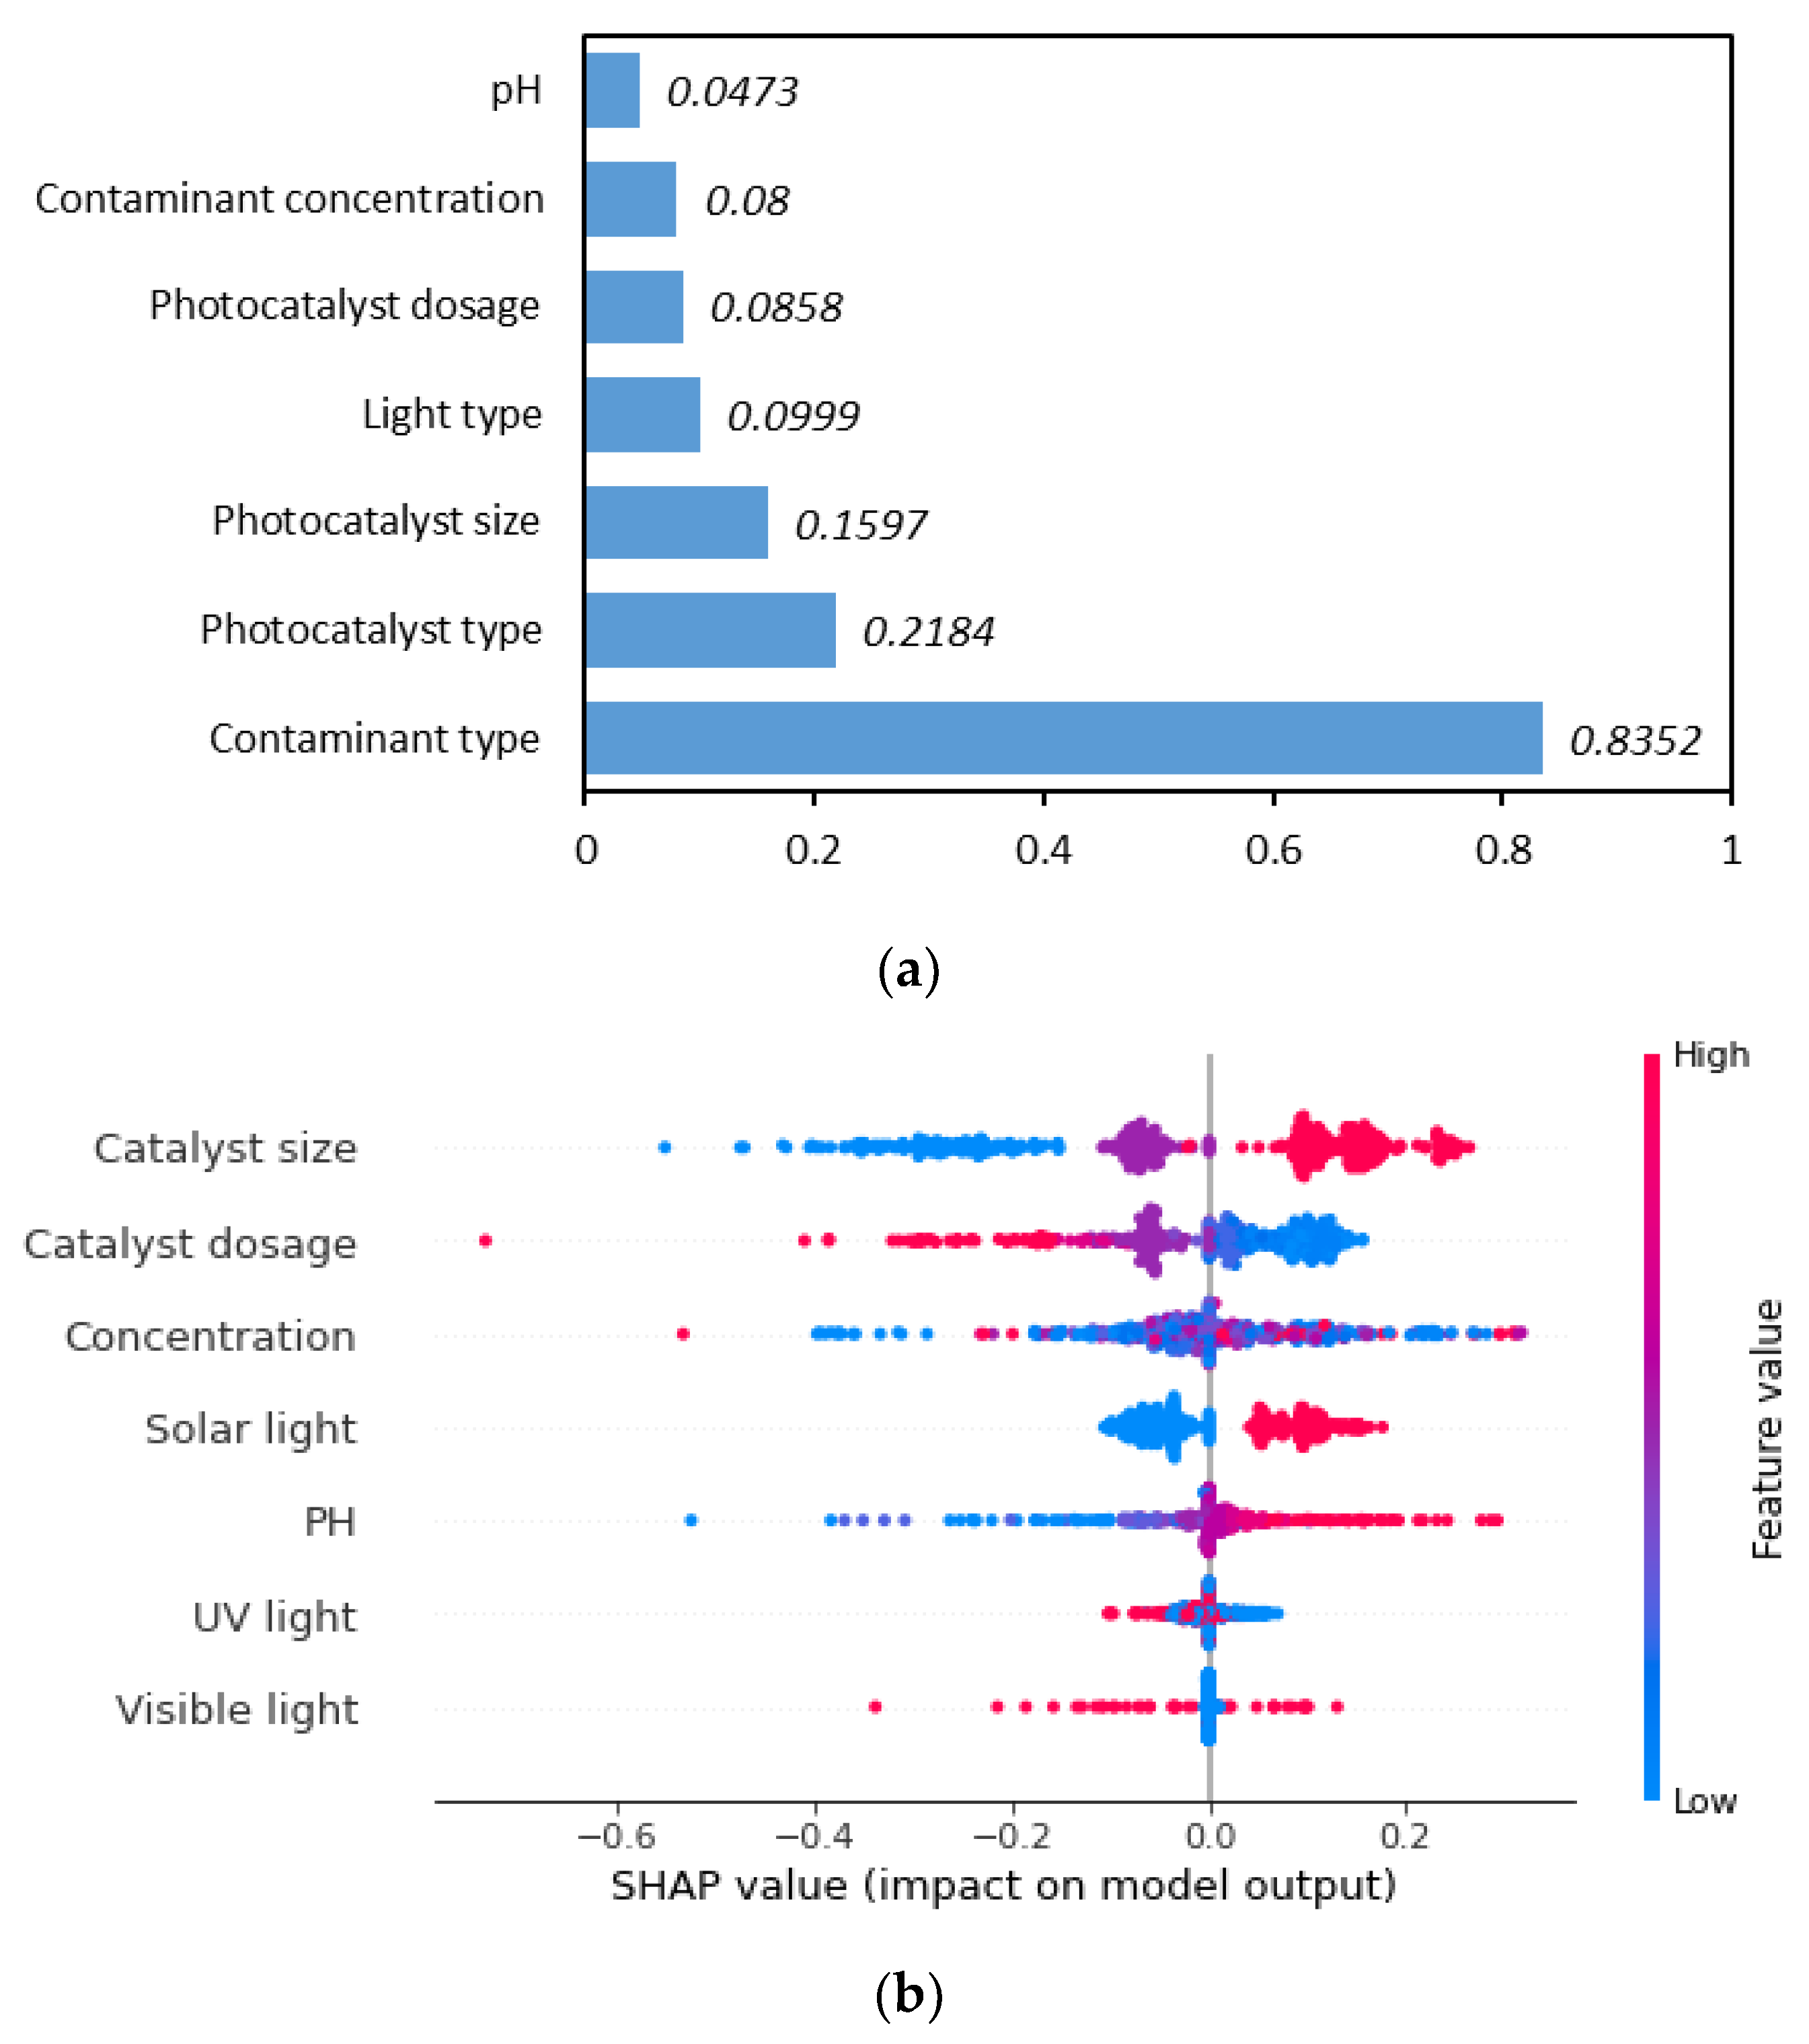
2.3. Model Interpretability via Feature Importance

The previous results indicated that the CGCNN-MF-ANN ML model achieved decent performance in predicting the photocatalytic degradation rate constant by different photocatalysts over a wide range of contaminants. Compared with the conventional physics-based model, data-driven ML models generally are limited in the area of interpretability. To interpret the ML results, feature importance was analyzed for the interpretability of the ML model. The feature importance was determined by calculating the SHapley Additive exPlanations (SHAP) value of each variable [30]. SHAP value assesses the impacts of having a certain feature by making the prediction with and without the feature. The mean SHAP values of the seven experimental variables are shown in Figure 4a, and SHAP values of individual data points are shown in Figure 4b. From Figure 4a, among the seven experimental variables, the type of water contaminant was the most important factor for the photo-degradation rate constant, with its SHAP value accounting for more than 50% of the total SHAP value. This indicated that with a certain photocatalyst, the capability in degrading different organic contaminants could vary significantly by the types of contaminants. Therefore, for the wastewater treatment application, it is suggested that the major contaminant types be analyzed before the selection of the most effective photocatalyst and treatment conditions. Moreover, from the SHAP values, the type of photocatalyst and its size also had a relatively high impact on its photo-degradation performance, while the initial concentration of the contaminants and the pH did not have as much influence on the photo-degradation performance.
Figure 4b summarizes the distribution of the feature importance of each training data on the ML model prediction. Each point represented the SHAP value of the experimental variable, with the horizontal coordinate indicating the SHAP value. The color code of the point represented the magnitude of variable (normalized value of over its range in the training data), with red color indicating maximum and blue color indicating a minimum. As the color changed from blue to red, the magnitude of the variable increased. With this protocol in representing the feature importance, the distribution of data points along the horizontal axis was related to its impacts on model prediction. A negative value of feature importance of a data point meant this input feature point had a negative impact on ML model predicted values (or reduced the ML model predicted values), while the positive value of feature importance meant the positive impact on ML model prediction (or increased the ML model predicted values). The larger the absolute value along the horizontal axis, the larger the data point affected the final ML model prediction (either positive or negative).
For example, for the photocatalyst particle size, photocatalysts large in size (indicated with red points) were clustered on the right side far from the centerline, while photocatalysts small in size (indicated with blue points) were clustered on the left side far from the centerline. This meant the photocatalyst size feature had a strong positive effect on model output, −log(k); or since the negative sign was used for −log(k), this meant photocatalyst size was negatively related to the predicted photocatalytic reaction rate constant. That is, a photocatalyst with a smaller size would result in a higher photo-degradation rate constant. This was consistent with experimental evidence.
Following the similar assessment of the data, photocatalyst dosage had a strong negative effect on model output, −log(k). This indicated the photo-degradation rate constant predicted by the ML model increased with an increased amount of photocatalyst dosage. The initial concentration did not have an obvious trend since data points were widely distributed on both sides of the centerline. The pH had a positive effect on model output, −log(k), which implied the lower pH value could result in the higher photo-degradation rate constant. However, most of the pH data points were concentrated near the centerline, which implied the impacts of pH on the ML model output was small. For the characteristics of light, since it is converted to categorical data with three categories (solar light, visible light, UV light), the impacts of each light type on the ML model output were analyzed separately. For each of the light types, the red color code indicated that this type of light was used in the experiment, while the blue color code indicated that it was not used. The SHAP values for solar light clustered to the right of the centerline (or negatively affected the reaction rate constant k). Data points for UV light clustered to the left of the centerline (or positively affected the reaction rate constant k). The SHAP values for regular visible light were scattered on both sides of the centerline. From these observations, the effects of different lights on improving photo-degradation rate constant followed the sequence solar light (the whole spectrum) < visible light (400–700 nm nominal range) < UV light.

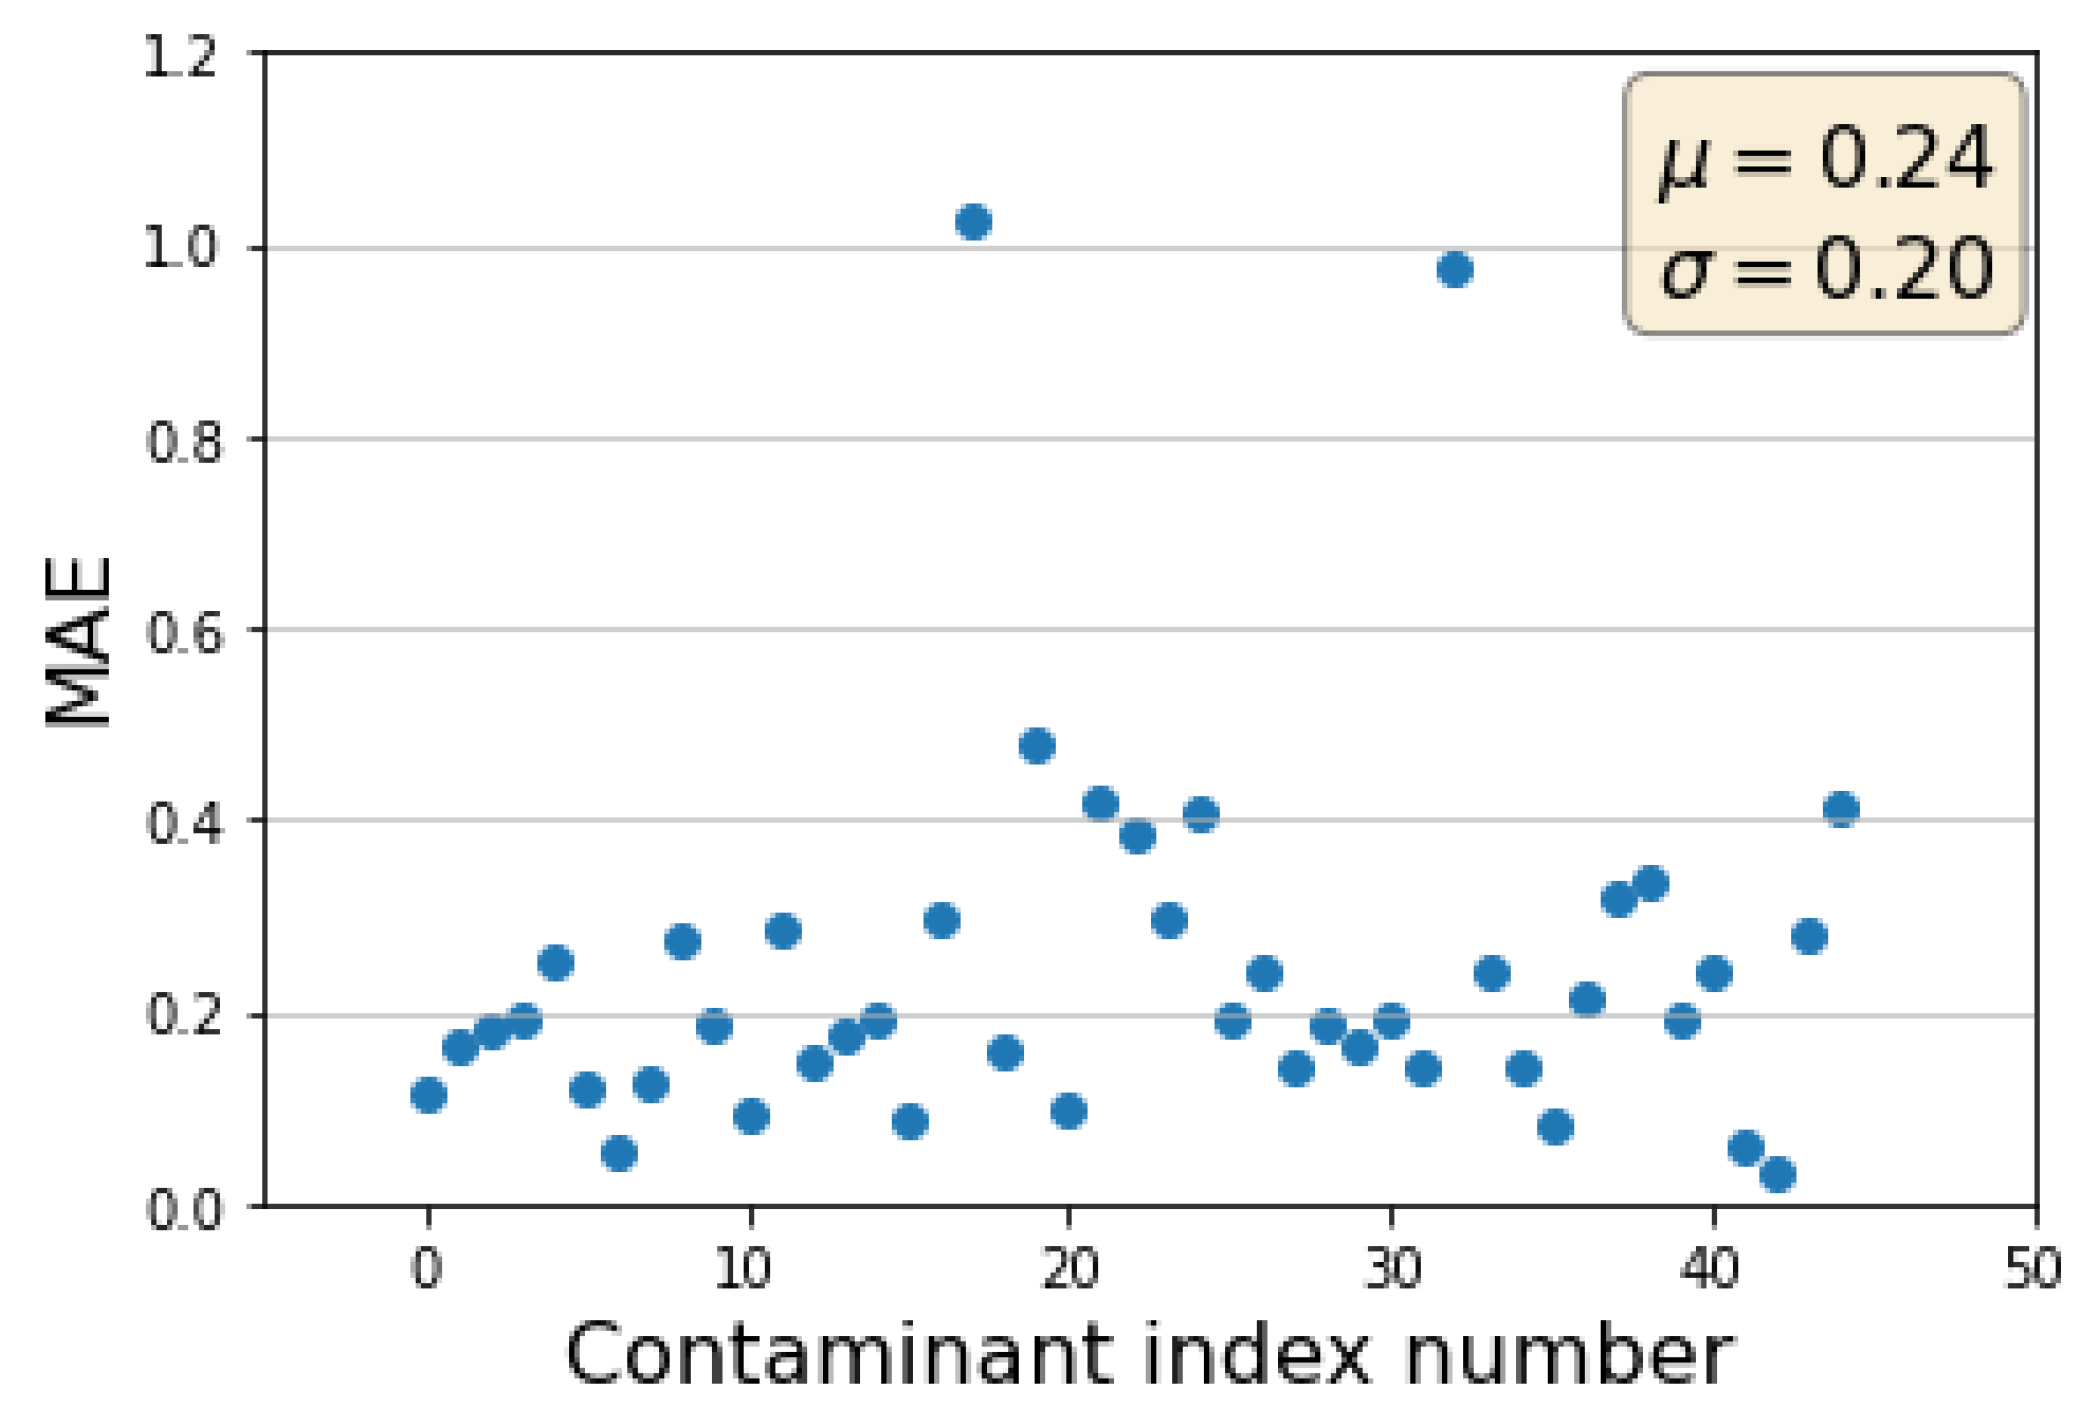
2.4. Performance of CGCNN-MF-ANN ML Model for Different Types of Contaminants

To further interpret the performance of the ML model, we also analyzed its performance for different types of contaminants. In total, 45 types of water contaminants were included in the dataset to train the ML model and were labeled from 1 to 45. Figure 5 summarizes the MAE for each type of contaminant. Most of them were reasonably accurate (with MAE values below 0.5), except for two types of contaminants, which were 2-chlorophenol and 2-nitrophenol. After carefully revisiting the data, it was found that there were only two data points involving 2-chlorophenol and only one data point involving 2-nitrophenol. The lack of data might be the reason for the larger prediction errors. To confirm this assumption, we also investigated contaminants with more than 20 data points each. The statistics of the ML model prediction results on these groups are given in Table 3. The ML model achieved decent prediction performance on all of these seven types of contaminants, as indicated by the small MAE and RMSE values. These observations verified that inclusion of a sufficient amount of data for a contaminant to train the ML model was crucial for the ML model to achieve good prediction accuracy on that contaminant.

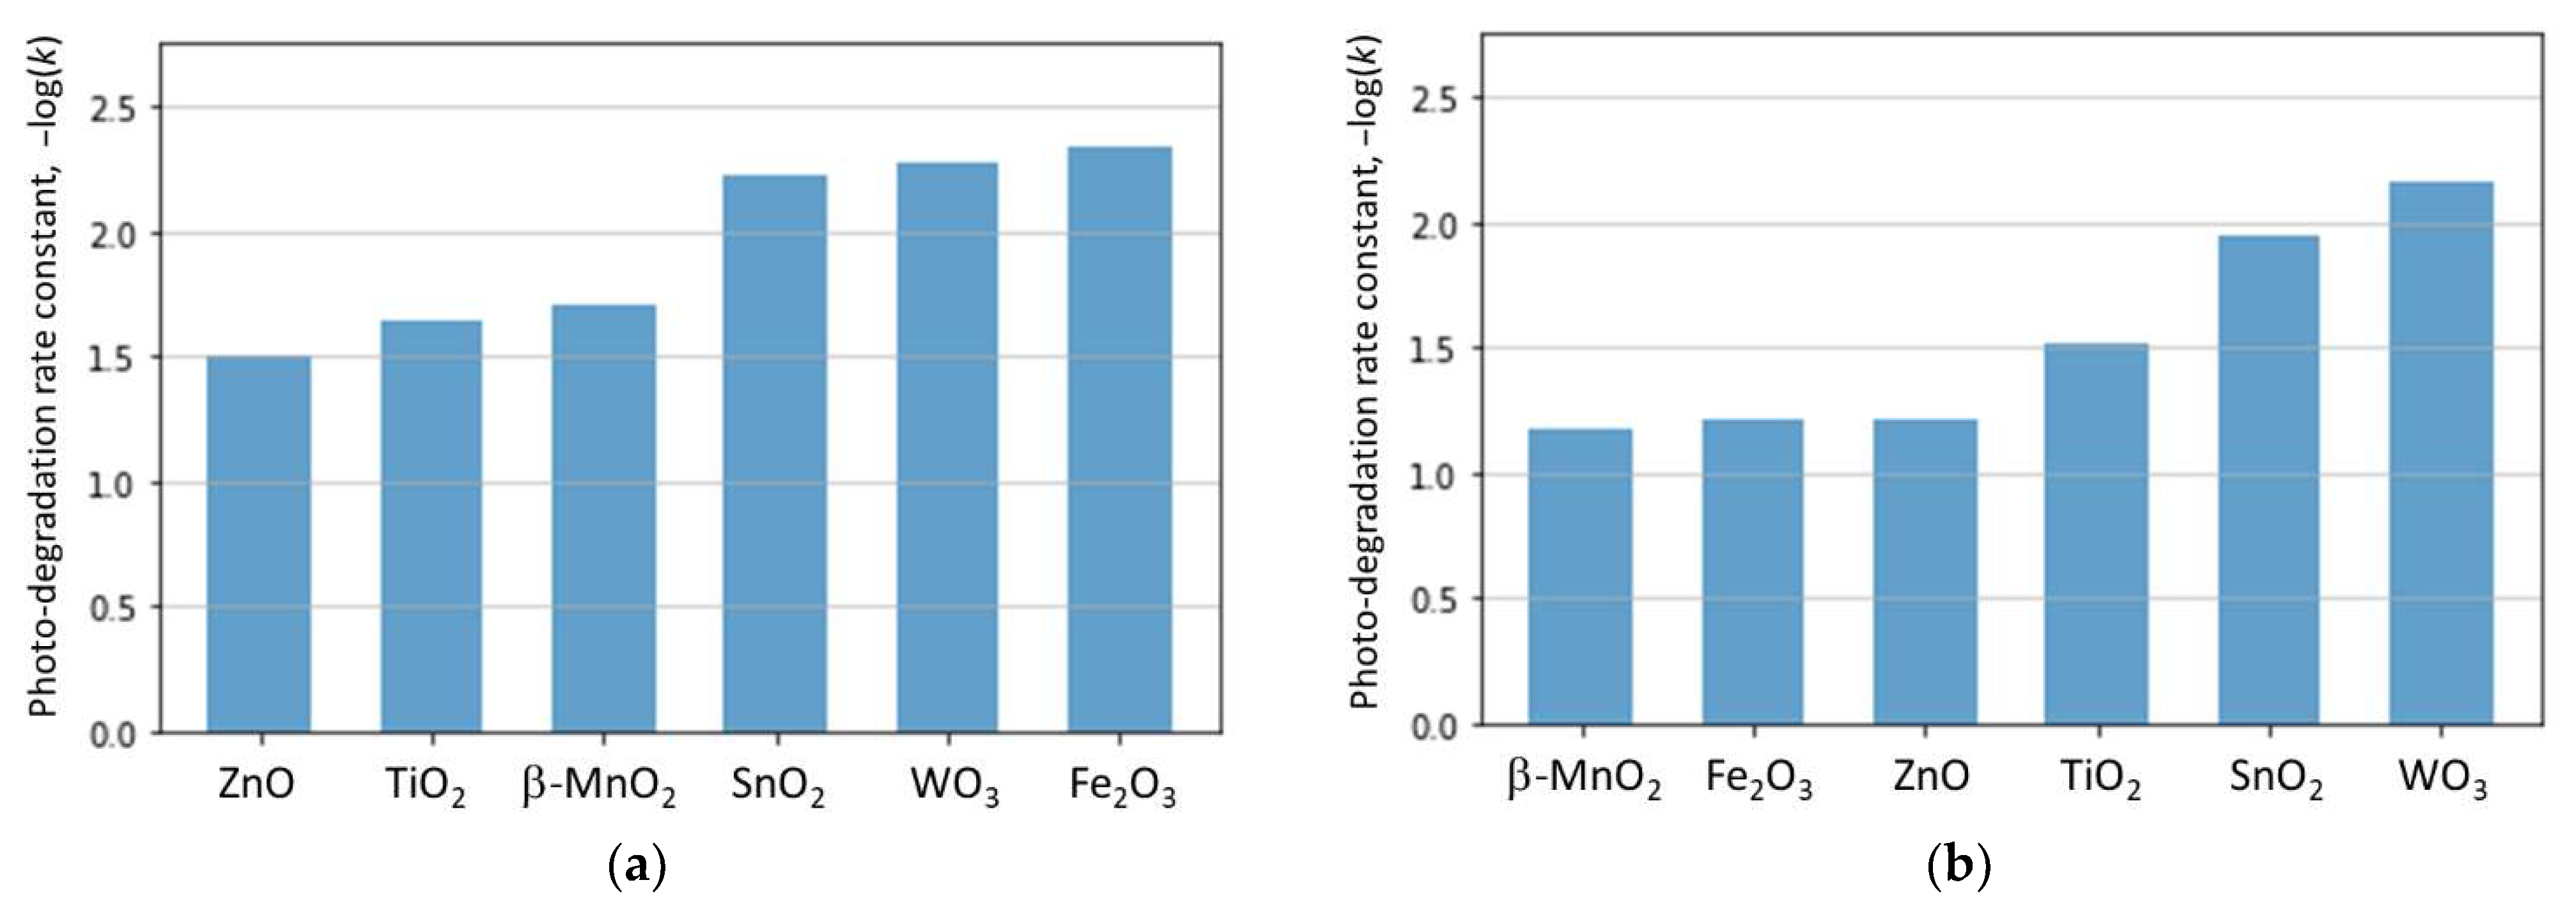
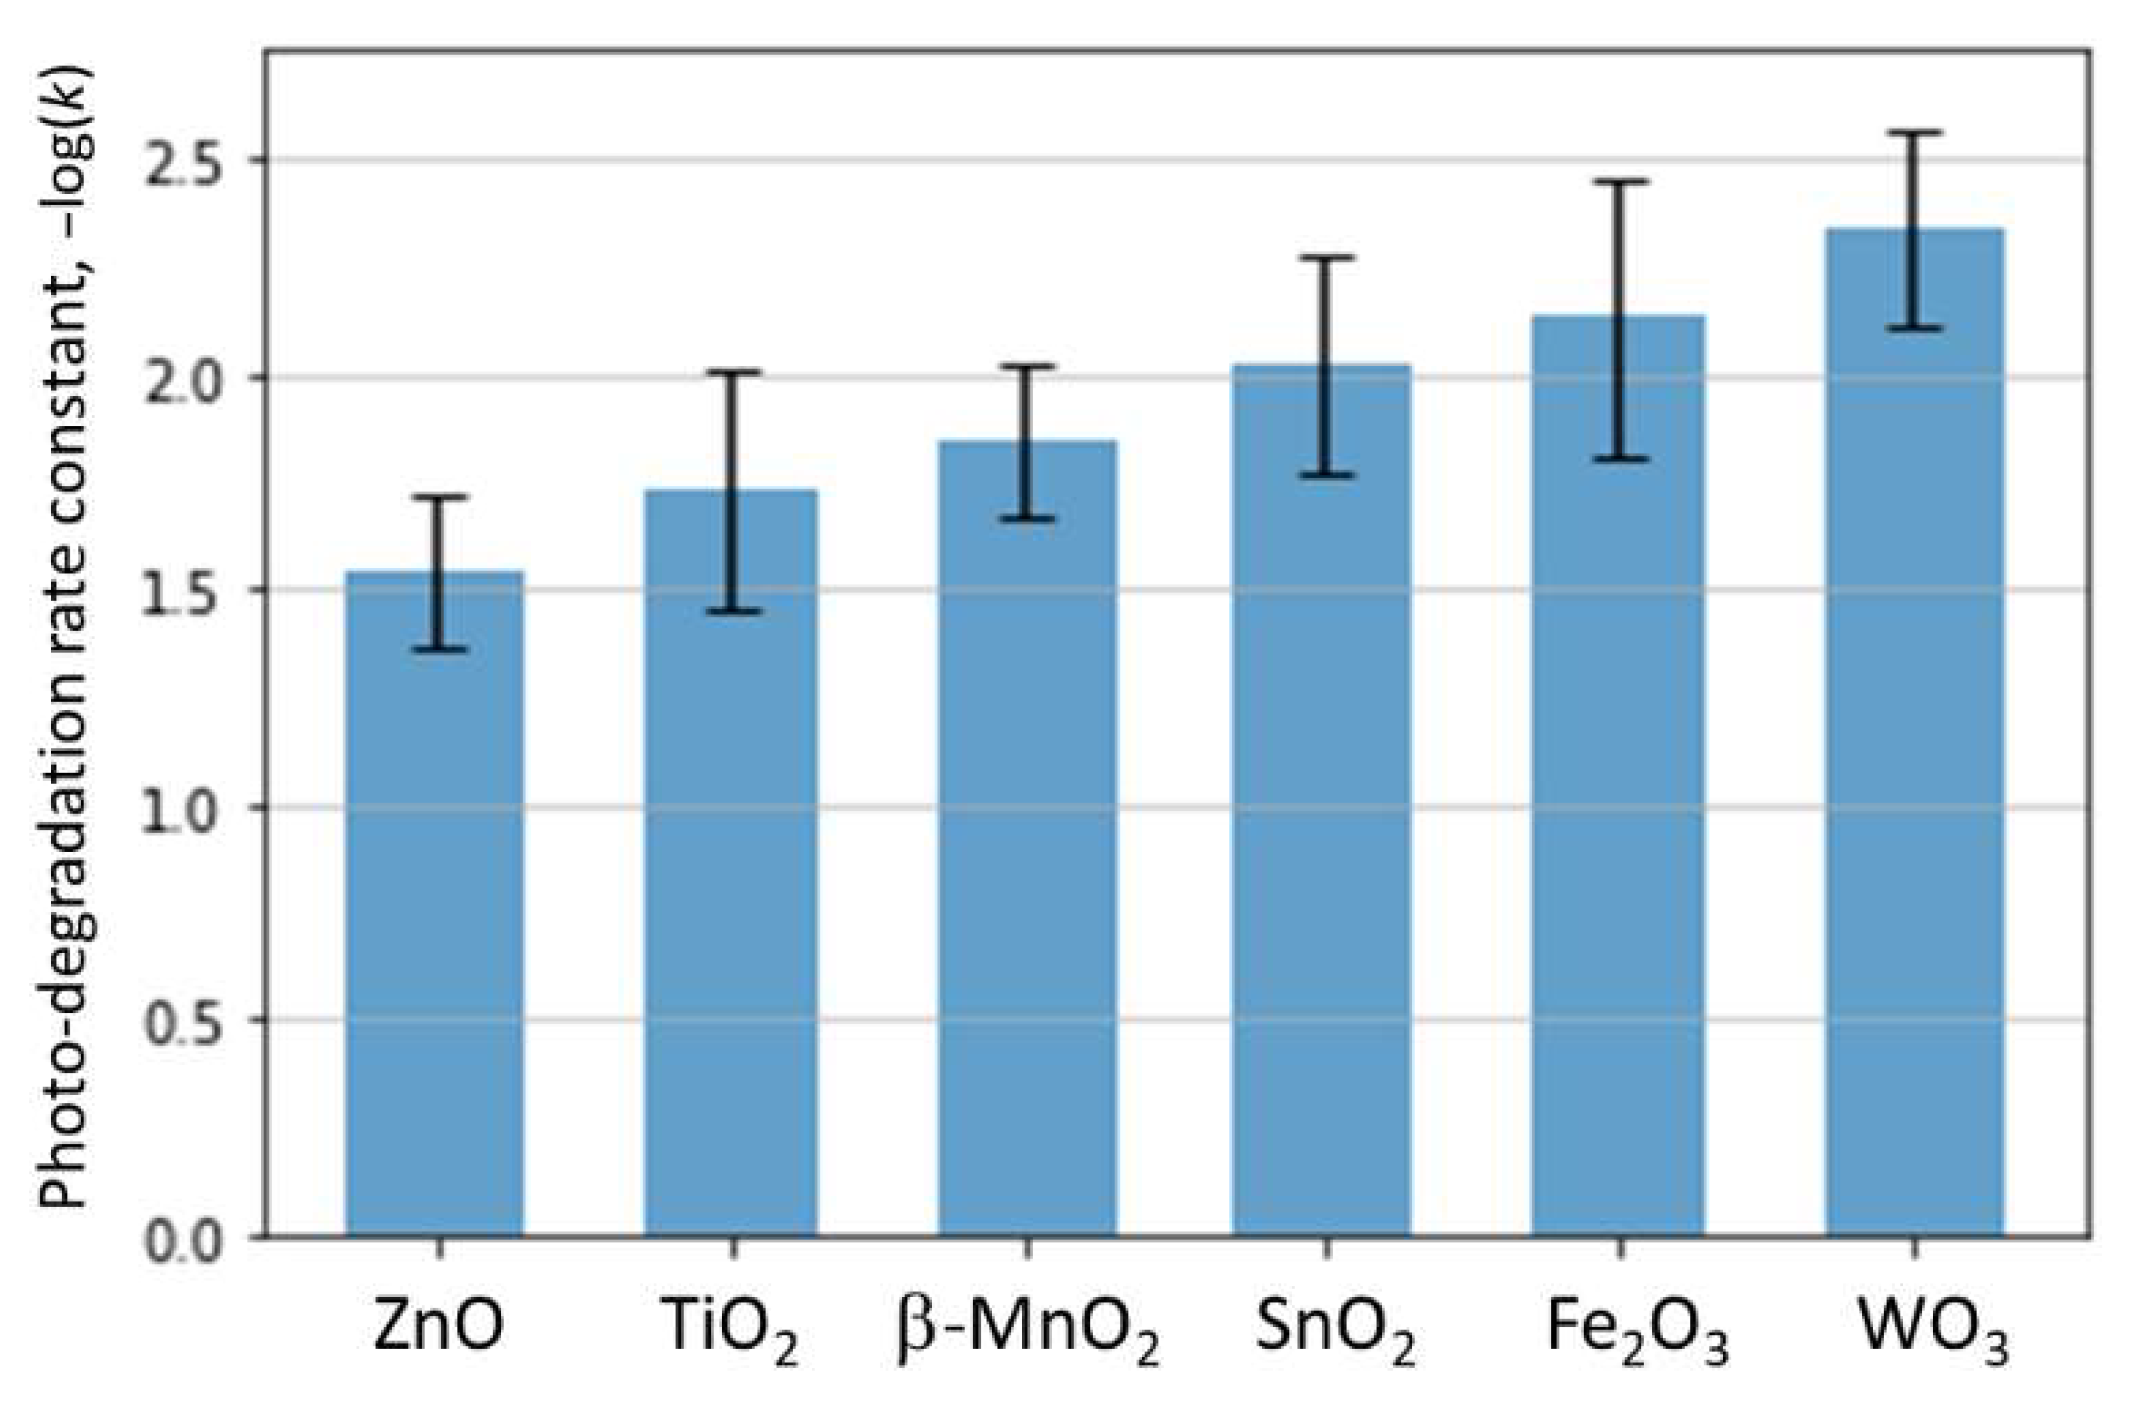
2.5. Application of the CGCNN-MF-ANN ML Model in Selecting the Best Photocatalyst for Contaminant Removal

With its capability to predict the performance of different photocatalysts over a range of contaminants, an important application of the CGCNN-MF-ANN model was to select the optimal photocatalyst for removal of a certain group of contaminants, such as in wastewater treatment. As an example, the photo-degradation rate constants by different photocatalysts on two contaminates, i.e., methylene blue and rhodamine B, were predicted. The other experimental variables were set based on typical values (using the average values in the training data for that contaminant). Figure 6 shows the ML predicted −log(k) for these two contaminants by different photocatalysts. The smaller predicted value indicated a higher rate constant since the predicted −log(k) had a negative sign. The overall predicted −log(k) was higher for methylene blue than rhodamine B, which implied methylene blue was more difficult to be decomposed than rhodamine B under those specified experimental conditions. For methylene blue, the efficiency of the six types of photocatalysts followed the sequence Fe2O3 < WO3 < SnO2 < β-MnO2 < TiO2 < ZnO, while for rhodamine B, the efficiency of the photocatalysts ranked as WO3 < SnO2 < TiO2 < ZnO < Fe2O3 < β-MnO2. Therefore, ZnO and β-MnO2 were the most efficient photocatalysts for the removal of methylene blue and rhodamine B, respectively. For photodegradation of both types of contaminants, ZnO photocatalyst appeared to be the best option.
Another example is given on the use of the CGCNN-MF-ANN model to select appropriate photocatalysts for the fast degradation of a combination of various contaminants. Seven contaminants with the most training data were selected, i.e., methylene blue, rhodamine B, rose Bengal, toluidine blue, azure B, carmine indigo, phenoxyacetic acid. The other inputs variables for the ML model were set based on the average values of the overall training dataset. With these inputs, the photo-degradation rate constants of each contaminant data by different photocatalysts were predicted with the CGCNN-MF-ANN model. The results were assembled to determine the average photodegradation rates and their ranges. Figure 7 shows the average and ranges of predicted −log(k) of the seven contaminants degraded by each type of photocatalyst. Overall, the efficiency of the six types of photocatalysts to degrade the combination of these seven contaminants followed the sequence WO3 < Fe2O3 < SnO2 < β-MnO2 < TiO2 < ZnO. Among these, ZnO appeared to achieve the best photocatalytic reaction rates and was the best candidate for the removal of the combination of these seven contaminants.

2.6. Predicting the Performance of Other Photocatalysts

Analyses were conducted to further assess the generality of the pre-trained CGCNN-MF-ANN model on other types of photocatalysts that were not included in model training. The pre-trained model was used to predict the performance of another photocatalyst tetragonal Mn3O4. Twenty-five additional data points of tetragonal Mn3O4 were collected. Two alternative predictions were compared, i.e., (1) predictions with the pre-trained CGCNN-MF-ANN model only with data from the six other types of photocatalysts, (2) the CGCNN-MF-ANN model re-trained with all data, including those for tetragonal Mn3O4. Figure 8 shows the scatter plot of the predicted vs. experimental −log(k) for Mn3O4. using these two different methods (i.e., Figure 8a for method 1, Figure 8b for method 2). The re-trained model outperformed the pre-trained CGCNN-MF-ANN model with R2 improved from −2.259 to 0.572, MAE reduced from 0.597 to 0.199, and RMSE reduced from 0.73 to 0.265. The findings showed that the ML model could be extended to other photocatalysts by incorporating additional training data. This observation pointed to strategies to improve the reliability and generality of the ML model to predict the performance of a wide range of photocatalysts.

3. Materials and Methods

3.1. Data Collection, Preparation, and Encoding

A database was created by an extensive collection of experimental data in published literature, which included 449 data points and is listed in the Supplementary Material Table S1. The typical experimental procedures to measure the photocatalytic degradation rate included firstly preparing water with designed contaminant concentration and adjusting the pH value of the solution. A certain amount of photocatalyst was then added and mixed. The suspension was placed in a dark environment for a period of time to reach the equilibrium between adsorption and desorption. This procedure was to exclude the adsorption effects in measuring the photocatalytic degradation performance. After that, the suspension was stirred and shone under light. At a given time interval, a small portion of the suspension was extracted, filtered, and the residual contaminant concentration was measured by ways, such as the UV-vis spectrometer. From the measured contaminant concentration versus time, the photocatalytic degradation rate constant was obtained.
A variety of experimental variables affected the photocatalytic degradation performance, which could be classified into three major categories: factors related to photocatalysts (type, crystalline structure, size, dosage, etc.), the type of organic contaminant, and the type of light used to activate the photocatalytic reaction. A brief summary of data sets collected:
  • Six common types of photocatalysts were included in this study, i.e., wurtzite ZnO, rutile SnO2, rhombohedral Fe2O3, anatase TiO2, monoclinic WO3, and tetragonal β-MnO2.
  • Forty-five different organic compounds, i.e., the names of an organic compound, their initial concentrations, and the pH value if available.
  • The properties of light, including a range of wavelengths and intensities. Seventy percent of the light intensity data was missing in the published papers, and only the range of light wavelength was provided. Therefore, the only wavelength of light was used in the ML model.
Other experimental conditions, such as the temperature, could also affect the photocatalytic performance. However, since most experiments were conducted close to the room temperature, it was not included as an experimental variable for the ML model.
From data completeness, seven experimental variables were selected as inputs to the ML model, i.e., the photocatalyst types, photocatalyst particle sizes, photocatalyst dosages, organic compounds, initial concentrations of organic contaminants, pH of the solution, and light property category. The output was the photocatalytic degradation rate constant (k, min−1), and it was converted into base-10 logarithm −log (k) because the range of the rate constants k is over several orders of magnitude.
Among those seven model inputs, the variables, including the type of photocatalysts, dosages, and initial concentrations of contaminant and pH, were quantitative continuous data. The particles sizes typically covered a wide range and were converted to categorical data with three levels: particles < 100 nm labeled as 1; particles between 100 and 1 um labeled as 2; particles > 1 um labeled as 3. The type of light was also represented in categorical data at three levels: i.e., UV light with a wavelength less than 400 nm was labeled as 1, visible light with a wavelength between 400 nm and 700 nm was labeled as 2, and the light with full-spectrum, including sunlight, was labeled as 3.
The photocatalysts and organic contaminant are non-numerical variables, which needs to be converted to digital representation or be encoded. Photocatalysts can be either crystalline or amorphous. For this study, only crystalline photocatalysts were included in study with data extracted from literature and analyzed. Crystal graph convolutional neural network (CGCNN) algorithm was utilized to encode the crystalline materials and extract important features [31]. The CGCNN model preserves all essential information of crystalline materials (i.e., atoms and bonds between atoms) by a crystal graph. It is capable of representing the crystal structures of inorganic materials and has been successfully applied to predict the material intrinsic properties, such as the formation energy and band gap [31,32].
The organic contaminant compounds were encoded with molecular fingerprints (MF), which converted the organic compounds into a bit string. Molecular fingerprints were originally created for the structural similarity search of small molecules [33]. It stores the atomic and structural information of molecules in a binary digit vector, where “1” represents presence and “0” represents the absence of a particular substructure. It has shown the potentials to encode organic materials for machine learning models [34,35,36,37]. The advantages of MF representation include that the properties of small molecules can be predicted at high accuracy and with low computational time at the same time [36]. Besides, the length and radius of the molecular fingerprints are adjustable based on the needs of the ML model.

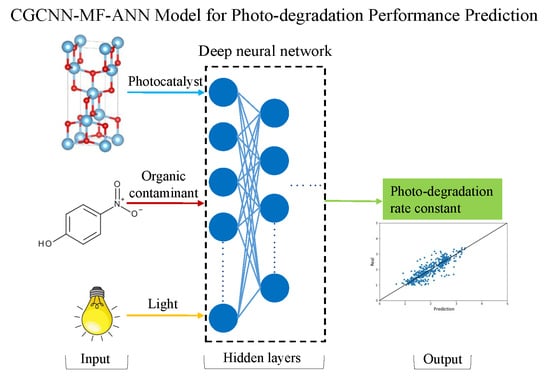
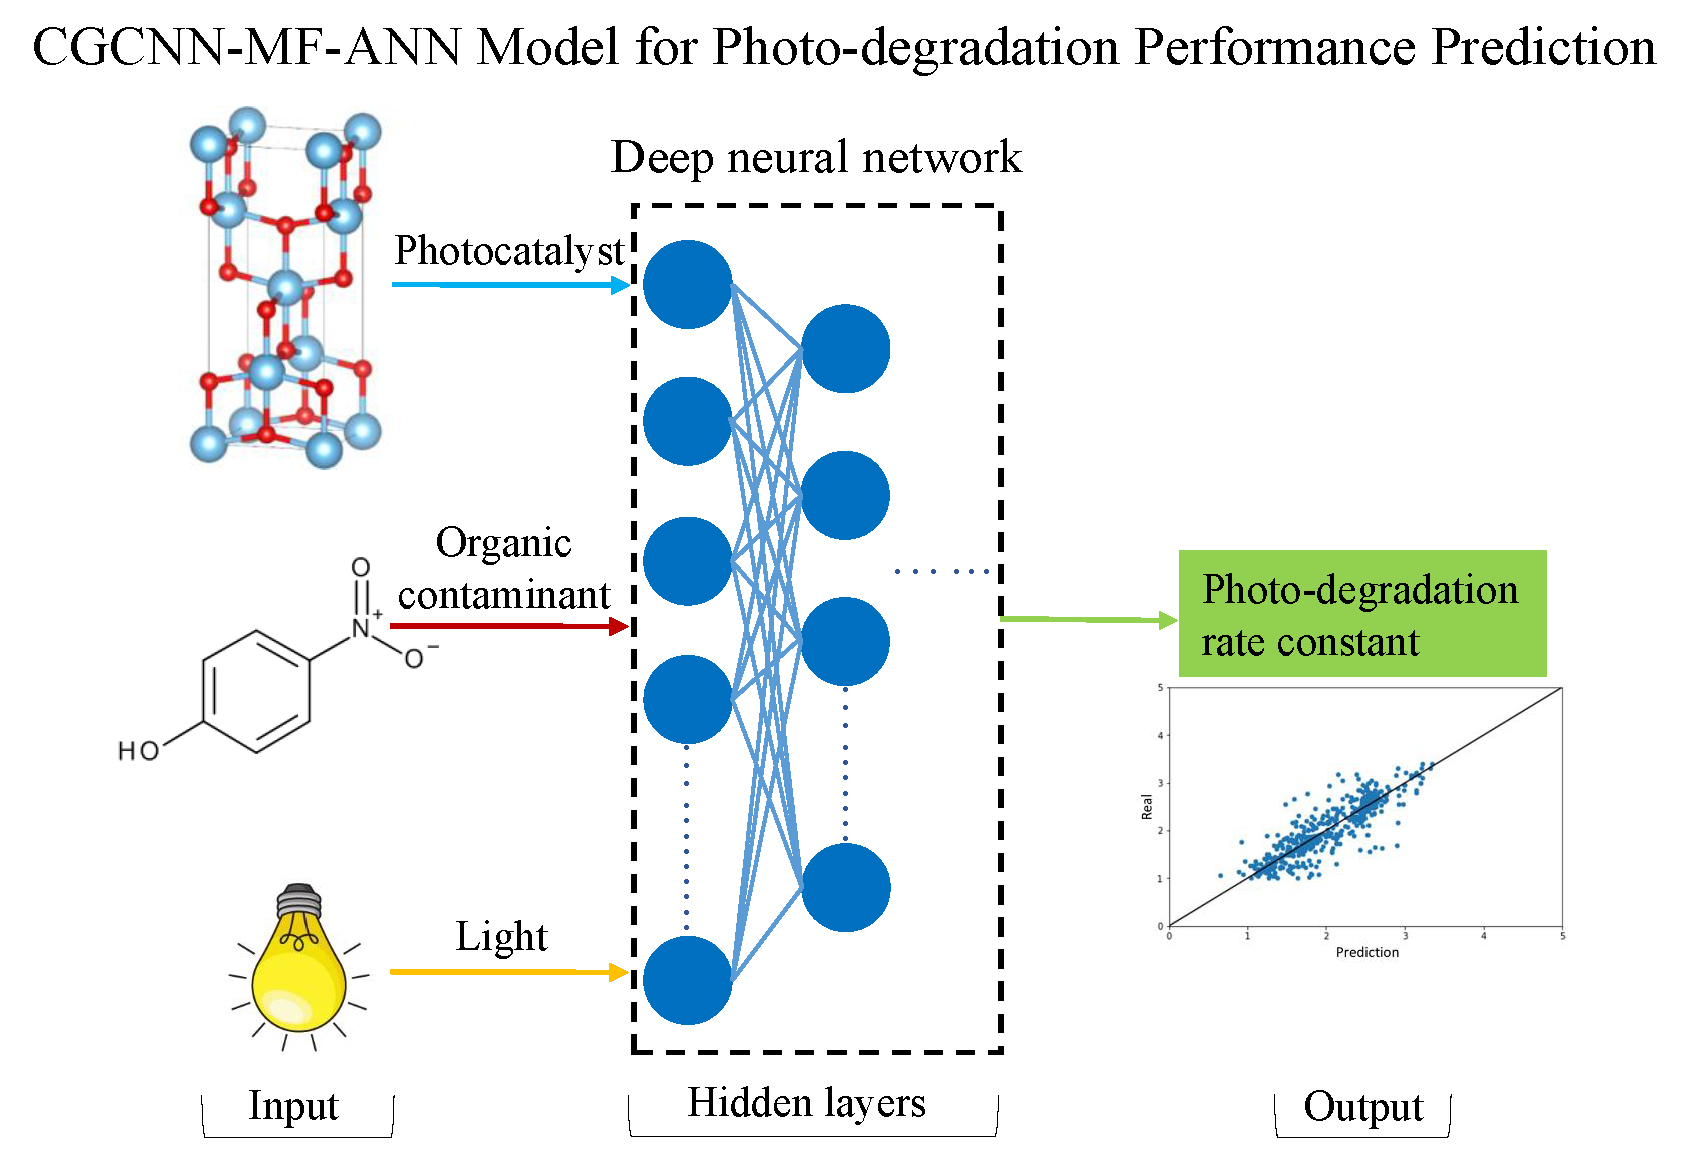
3.2. Machine Learning Model Structure and Optimization

Figure 9 shows the configuration of the machine learning (ML) model, referred to as the CGCNN-MF-ANN model. The ANN component of the model consisted of the input layer, hidden layers, and output layer. Seven experimental variables that capture the information of photocatalysts and organic contaminants were fed into the input layer. As discussed in the previous section, the photocatalysts and organic compounds were firstly encoded and converted by CGCNN and MF, respectively. After conversion, each of them was connected to a neuron in the input layer. Each of the other five variables (which are quantitative data or categorical data) occupied one input neuron. The output layer was the photocatalytic degradation rate constant in −log scale. Hidden layers of the artificial neural network provided connections between input and output layers with activation functions that were fine-tuned from the training data.
The hyperparameters of the ANN (i.e., the number of the hidden layers and the number of neurons in each hidden layer) had significant effects on the model prediction accuracy. Bayesian optimization was used to optimize the hyperparameters of the model [38]. The optimized hyperparameters included the length and radius of the molecular fingerprints, the number of the hidden layers, and the number of neurons in each hidden layer. It was noted that the hyperparameters for the CGCNN referred to the typical settings and were not included in the hyperparameter optimization process. By use of Bayesian optimization, the optimized hyperparameters of the ANN model were obtained, which included two hidden layers with 512 neurons in the first layer and 256 neurons in the second layer. The optimal length and radius of the molecular fingerprints were 128 and 1, respectively. The input layer of the ANN model had 517 neurons, with 384 occupied by the representation of photocatalyst crystals via CGCNN, 128 occupied by encoded contaminants via MF, and 5 by other experimental factors (i.e., particle size, dosage, concentration, initial pH, and light).

4. Conclusions

A novel machine learning model, CGCNN-MF-ANN, was developed to predict the performance of different metal oxide photocatalysts in degrading a wide range of contaminants. The structures and features of photocatalysts were represented with a crystal graphic convolutional neural network (CGCNN). The structures of contaminants were encoded with molecular fingerprint (MF). The encoded information of the photocatalysts and contaminants were combined with experimental variables and fed into an artificial neuron network (ANN) model. The hyperparameters of the ANN were optimized with the Bayesian optimization process. A dataset was assembled that included six different types of photocatalysts and 45 different types of organic contaminants, which were used for the training and validation of the CGCCN-MF-ANN model. The results of the predicted photo-degradation rate constants by the ML model matched reasonably well with the experimental results with the R2 of 0.746 and RMSE of 0.293. The interpretability of the ML model was evaluated by analyzing the importance of different variables on the ML model performance by calculating their SHAP values and distributions. The feature importance analyses unveiled the influence of experimental variables on the ML model predictions that were consistent with experimental observations. Examples were given to demonstrate the applications of the CGCCN-MF-ANN model for the selection of optimal catalysts for contaminants removal. The pre-trained ML model was extended to predict other photocatalysts, and a re-training strategy was proposed to augment the generality of the model in its performance.

Supplementary Materials

The following are available online at https://www.mdpi.com/article/10.3390/catal11091107/s1, Table S1: The photocatalysis data used for the CGCNN-MF-ANN model.

Author Contributions

Conceptualization, X.Y. and A.C.S.; methodology, X.Y. and H.Z.; software, J.H. and Z.J.; validation, J.H., Z.J. and M.T.; formal analysis, J.H., Z.J. and X.Y.; investigation, Z.J. and J.H.; resources, X.Y.; data curation, Z.J. and M.T.; writing—original draft preparation, Z.J. and J.H.; writing—review and editing, X.Y.; visualization, J.H. and Z.J.; supervision, X.Y.; project administration, X.Y.; funding acquisition, X.Y. and A.C.S. All authors have read and agreed to the published version of the manuscript.

Funding

This work is supported by the US National Science Foundation with an award number: 1563238.

Data Availability Statement

Data is provided in the supplementary materials.

Conflicts of Interest

The authors declare no conflict of interest.

References

  1. Orebiyi, O.; Awomeso, A. Water and pollution agents in the 21st century. Nat. Sci. 2008, 6, 16–24. [Google Scholar]
  2. Mandal, S.; Kunhikrishnan, A.; Bolan, N.S.; Wijesekara, H.; Naidu, R. Application of biochar produced from biowaste materials for environmental protection and sustainable agriculture production. Environ. Mater. Waste 2016, 73–89. [Google Scholar] [CrossRef]
  3. Poulopoulos, S.G.; Yerkinova, A.; Ulykbanova, G.; Inglezakis, V.J. Photocatalytic treatment of organic pollutants in a synthetic wastewater using UV light and combinations of TiO2, H2O2 and Fe (III). PLoS ONE 2019, 14, e0216745. [Google Scholar] [CrossRef] [PubMed]
  4. Koe, W.S.; Lee, J.W.; Chong, W.C.; Pang, Y.L.; Sim, L.C. An overview of photocatalytic degradation: Photocatalysts, mechanisms, and development of photocatalytic membrane. Environ. Sci. Pollut. Res. 2019, 27, 2522–2565. [Google Scholar] [CrossRef]
  5. Zhang, F.; Wang, X.; Liu, H.; Liu, C.; Wan, Y.; Long, Y.; Cai, Z. Recent advances and applications of semiconductor photocatalytic technology. Appl. Sci. 2019, 9, 2489. [Google Scholar] [CrossRef] [Green Version]
  6. Mahlambi, M.M.; Ngila, C.J.; Mamba, B.B. Recent developments in environmental photocatalytic degradation of organic pollutants: The case of titanium dioxide nanoparticles—A review. J. Nanomater. 2015, 2015, 5. [Google Scholar] [CrossRef] [Green Version]
  7. Sudha, D.; Sivakumar, P. Review on the photocatalytic activity of various composite catalysts. Chem. Eng. Process. Process Intensif. 2015, 97, 112–133. [Google Scholar] [CrossRef]
  8. Sobczyński, A.; Dobosz, A. Water purification by photocatalysis on semiconductors. Pol. J. Environ. Stud. 2001, 10, 195–205. [Google Scholar]
  9. Chong, M.N.; Jin, B.; Chow, C.W.; Saint, C. Recent developments in photocatalytic water treatment technology: A review. Water Res. 2010, 44, 2997–3027. [Google Scholar] [CrossRef]
  10. Ahmed, S.N.; Haider, W. Heterogeneous photocatalysis and its potential applications in water and wastewater treatment: A review. Nanotechnology 2018, 29, 342001. [Google Scholar] [CrossRef] [Green Version]
  11. Loeb, S.K.; Alvarez, P.J.; Brame, J.A.; Cates, E.L.; Choi, W.; Crittenden, J.; Dionysiou, D.D.; Li, Q.; Li-Puma, G.; Quan, X.; et al. The technology horizon for photocatalytic water treatment: Sunrise or sunset? Environ. Sci. Technol. 2018, 53, 2937–2947. [Google Scholar] [CrossRef] [PubMed]
  12. Kucio, K.; Charmas, B.; Pasieczna-Patkowska, S. Structural, thermal and photocatalytic properties of composite materials SiO2/TiO2/C. Adsorption 2019, 25, 501–511. [Google Scholar] [CrossRef] [Green Version]
  13. Chen, C.; Jian, H.; Mai, K.; Ren, Z.; Wang, J.; Fu, X.; Fan, C.; Sun, C.; Qian, G.; Wang, Z. Shape-and Size-Controlled Synthesis of Mn3O4 Nanocrystals at Room Temperature. Eur. J. Inorg. Chem. 2014, 2014, 3023–3029. [Google Scholar] [CrossRef]
  14. Kumar, A.; Pandey, G. A review on the factors affecting the photocatalytic degradation of hazardous materials. Mater. Sci. Eng. Int. J. 2017, 1, 1–10. [Google Scholar] [CrossRef] [Green Version]
  15. Qamar, M.; Muneer, M. Comparative photocatalytic study of two selected pesticide derivatives, indole-3-acetic acid and indole-3-butyric acid in aqueous suspensions of titanium dioxide. J. Hazard. Mater. 2005, 120, 219–227. [Google Scholar] [CrossRef]
  16. Fidan, S.; Oktay, H.; Polat, S.; Ozturk, S. An Artificial Neural Network Model to Predict the Thermal Properties of Concrete Using Different Neurons and Activation Functions. Adv. Mater. Sci. Eng. 2019, 2019, 3831813. [Google Scholar] [CrossRef] [Green Version]
  17. Swaidani, A.M.; Khwies, W.T. Applicability of artificial neural networks to predict mechanical and permeability properties of volcanic scoria-based concrete. Adv. Civ. Eng. 2018, 2018, 5207962. [Google Scholar]
  18. Zhang, Z.; Barkoula, N.M.; Karger-Kocsis, J.; Friedrich, K. Artificial neural network predictions on erosive wear of polymers. Wear 2003, 255, 708–713. [Google Scholar] [CrossRef]
  19. Roy, N.K.; Potter, W.D.; Landau, D.P. Polymer property prediction and optimization using neural networks. IEEE Trans. Neural Netw. 2006, 17, 1001–1014. [Google Scholar] [CrossRef] [Green Version]
  20. Kumar, G.V.; Pramod, R.; Rao, C.S.P.; Gouda, P.S. Artificial Neural Network Prediction on Wear of Al6061 Alloy Metal Matrix Composites Reinforced with-Al2O3. Mater. Today Proc. 2018, 5, 11268–11276. [Google Scholar] [CrossRef]
  21. Scott, D.J.; Coveney, P.V.; Kilner, J.A.; Rossiny, J.C.H.; Alford, N.M.N. Prediction of the functional properties of ceramic materials from composition using artificial neural networks. J. Eur. Ceram. Soc. 2007, 27, 4425–4435. [Google Scholar] [CrossRef] [Green Version]
  22. Zhu, Z.; Dong, B.; Guo, H.; Yang, T.; Zhang, Z. Fundamental band gap and alignment of two-dimensional semiconductors explored by machine learning. Chin. Phys. B 2020, 29, 046101. [Google Scholar] [CrossRef] [Green Version]
  23. Masood, H.; Toe, C.Y.; Teoh, W.Y.; Sethu, V.; Amal, R. Machine Learning for Accelerated Discovery of Solar Photocatalysts. ACS Catal. 2019, 9, 11774–11787. [Google Scholar] [CrossRef]
  24. Emilio, C.A.; Magallanes, J.F.; Litter, M.I. Chemometric study on the TiO2-photocatalytic degradation of nitrilotriacetic acid. Anal. Chim. Acta 2007, 595, 89–97. [Google Scholar] [CrossRef] [PubMed]
  25. Toma, F.L.; Guessasma, S.; Klein, D.; Montavon, G.; Bertrand, G.; Coddet, C. Neural computation to predict TiO2 photocatalytic efficiency for nitrogen oxides removal. J. Photochem. Photobiol. A Chem. 2004, 165, 91–96. [Google Scholar] [CrossRef]
  26. Oliveros, E.; Benoit-Marquie, F.; Puech-Costes, E.; Maurette, M.T.; Nascimento, C.A.O. Neural network modeling of the photocatalytic degradation of 2,4-dihydroxybenzoic acid in aqueous solution. Analusis 1998, 26, 326–332. [Google Scholar] [CrossRef]
  27. Emilio, C.A.; Litter, M.I.; Magallanes, J.F. Semiempirical modeling with application of artificial neural networks for the photocatalytic reaction of ethylenediaminetetraacetic acid (EDTA) over titanium oxide (TiO2). Helv. Chim. Acta 2002, 85, 799–813. [Google Scholar] [CrossRef]
  28. Hassani, A.; Khataee, A.; Karaca, S. Photocatalytic degradation of ciprofloxacin by synthesized TiO2 nanoparticles on montmorillonite: Effect of operation parameters and artificial neural network modeling. J. Mol. Catal. A Chem. 2015, 409, 149–161. [Google Scholar] [CrossRef]
  29. Guimarães, O.L.C.; Silva, M.B. Hybrid neural model for decoloration by UV/H2O2 involving process variables and structural parameters characteristics to azo dyes. Chem. Eng. Process. Process Intensif. 2007, 46, 45–51. [Google Scholar] [CrossRef]
  30. Lundberg, S.M.; Lee, S.I. A unified approach to interpreting model predictions. In Proceedings of the 31st International Conference on Neural Information Processing Systems, Long Beach, CA, USA, 4–9 December 2017; pp. 4768–4777. [Google Scholar]
  31. Xie, T.; Grossman, J.C. Crystal graph convolutional neural networks for an accurate and interpretable prediction of material properties. Phys. Rev. Lett. 2018, 120, 145301. [Google Scholar] [CrossRef] [Green Version]
  32. CGCNN Website. Available online: https://github.com/txie-93/cgcnn (accessed on 14 September 2021).
  33. Muegge, I.; Mukherjee, P. An overview of molecular fingerprint similarity search in virtual screening. Expert Opin. Drug Discov. 2016, 11, 137–148. [Google Scholar] [CrossRef]
  34. Yin, Z.; Ai, H.; Zhang, L.; Ren, G.; Wang, Y.; Zhao, Q.; Liu, H. Predicting the cytotoxicity of chemicals using ensemble learning methods and molecular fingerprints. J. Appl. Toxicol. 2019, 39, 1366–1377. [Google Scholar] [CrossRef]
  35. Zhong, S.; Hu, J.; Fan, X.; Yu, X.; Zhang, H. A deep neural network combined with molecular fingerprints (DNN-MF) to develop predictive models for hydroxyl radical rate constants of water contaminants. J. Hazard. Mater. 2020, 383, 121141. [Google Scholar] [CrossRef] [PubMed]
  36. Chan, H.S.; Shan, H.; Dahoun, T.; Vogel, H.; Yuan, S. Advancing drug discovery via artificial intelligence. Trends Pharmacol. Sci. 2019, 40, 592–604. [Google Scholar] [CrossRef]
  37. Jiang, Z.; Hu, J.; Zhang, X.; Zhao, Y.; Fan, X.; Zhong, S.; Zhang, H.; Yu, X. A Generalized Predictive Model for TiO2–Catalyzed Photo-degradation Rate Constants of Water Contaminants through Artificial Neural Network. Environ. Res. 2020, 187, 109697. [Google Scholar] [CrossRef] [PubMed]
  38. Snoek, J.; Larochelle, H.; Adams, R.P. Practical bayesian optimization of machine learning algorithms. Adv. Neural Inf. Process. Syst. 2012, 2, 25. [Google Scholar]
Figure 1. Summary of the ML model predicted vs. experimental results of the photocatalytic degradation rate constants, −log (k).
Catalysts 11 01107 g001
Figure 2. The CGCNN-MF-ANN model predicted results vs. experimental results of different contaminants with the model trained with all the data together and the results split into those for different photocatalysts: (a) β-MnO2, (b) ZnO, (c) WO3, (d) SnO2, (e) Fe2O3, and (f) TiO2.
Catalysts 11 01107 g002aCatalysts 11 01107 g002b
Figure 3. The CGCNN-MF-ANN model predicted results vs. experimental results of different contaminants with ML model trained separately by used data for (a) β-MnO2, (b) ZnO, (c) WO3, (d) SnO2, (e) Fe2O3, and (f) TiO2.
Catalysts 11 01107 g003aCatalysts 11 01107 g003b
Figure 4. (a) The mean SHAP values indicating the relative importance of the experimental variable on the ML model performance (variables with larger SHAP values have a more important influence on the ML model); (b) The distribution of SHAP values indicating the positive or negative influence of the variable on ML model prediction.
Catalysts 11 01107 g004
Figure 5. The MAE of ML model prediction for each type of contaminant.
Catalysts 11 01107 g005
Figure 6. The predicted −log(k) with different photocatalysts for (a) Methylene blue (assumed initial concentration is 9.42, photocatalyst dosage is 0.48, photocatalyst size is 2, pH = 7, and light type of 2), and (b) rhodamine B (assumed initial concentration is 8.54, photocatalyst dosage is 0.90, photocatalyst size is 1, pH = 6, and light type is 1).
Catalysts 11 01107 g006
Figure 7. The average predicted −log(k) of seven contaminants degraded by different photocatalysts. (Initial concentration is 15.79, photocatalyst dosage is 0.54, photocatalyst size is 2, pH = 7, and light is 3).
Catalysts 11 01107 g007
Figure 8. The average predicted −log(k) of the contaminants degraded by Mn3O4. (a) predictions with the pre-trained CGCNN-MF-ANN model only with data from the six other types of photocatalysts; (b) the CGCNN-MF-ANN model re-trained with all data, including those for tetragonal Mn3O4.
Catalysts 11 01107 g008
Figure 9. Schematic of the configurations of the CGCNN-MF-ANN model. Note: the photocatalyst crystals are represented via Crystal Graphic Convolutional Neural Network (CGCNN); the contaminants are encoded via Molecular Fingerprint (MF).
Catalysts 11 01107 g009
Table 1. The performance of ML model in three cross-validation subgroups and overall prediction.
Subgroup123Overall
R20.7770.6810.7680.746
MAE0.2120.2130.1930.206
RMSE0.2990.3110.2660.293
Table 2. Summary of performance measurements of the CGCNN-MF-ANN model for individual photocatalysts with a different training strategy.
Photocatalyst Groupβ-MnO2ZnOWO3SnO2Fe2O3TiO2
ML model trained with all datasets and results split by photocatalystsR20.7210.6580.6480.6070.5550.490
MAE0.1520.1370.2360.2790.3470.148
RMSE0.2190.2030.3160.3890.4230.202
ML models trained for individual photocatalystR20.6620.6210.5240.5930.2060.374
MAE0.1780.1630.2770.2810.4520.156
RMSE0.2410.2140.3680.3960.5650.224
Table 3. The performance of ML prediction on the seven contaminant groups with the most data points in ML training.
Water ContaminantNo. of DataMean Absolute ErrorStandard Deviation of Error
Methylene Blue670.2860.233
Rhodamine B500.3380.301
Rose Bengal330.0950.077
Toluidine Blue310.1270.101
Azure B310.1420.100
Carmine Indigo220.2750.194
Phenoxyacetic Acid200.1130.086
Publisher’s Note: MDPI stays neutral with regard to jurisdictional claims in published maps and institutional affiliations.

