Article

Momentum Transfer in Short-Channel Structures of Hexagonal Channel Cross-Section Shape: Experiments vs. CFD

by
Katarzyna Sindera
1,*,
Marzena Iwaniszyn
1 and
Przemysław J. Jodłowski
2
1
Institute of Chemical Engineering, Polish Academy of Sciences, 44-100 Gliwice, Poland
2
Faculty of Chemical Engineering and Technology, Cracow University of Technology, 31-155 Kraków, Poland
*
Author to whom correspondence should be addressed.
Catalysts 2021, 11(9), 1036; https://doi.org/10.3390/catal11091036
Submission received: 12 July 2021 / Revised: 16 August 2021 / Accepted: 23 August 2021 / Published: 27 August 2021
(This article belongs to the Special Issue Modern Catalytic Reactor: From Active Center to Application Tests)

Abstract

:
Short-channel structures are promising catalyst carriers because it is easy to control the heat/mass transfer and fluid flow characteristics by changing their lengths. In this work, the flow resistance of hexagonal structures was investigated experimentally and numerically. The structure tested (6 mm long) was manufactured from AISI 316 steel using the selective laser melting technique. Due to some differences between theoretical approaches and practical results, two types of computational models were applied to analyze the pressure distribution in a short hexagonal duct. It was shown that although experimental results agree with some theoretical solutions, the channel wall thickness should not be omitted from the overall flow resistance. A comparison of short structures differing in channel length with widely used long monoliths was performed as well.

Graphical Abstract

1. Introduction

Nowadays, many harmful substances are still released into the atmosphere. Examples of such emissions are: methane, nitrogen oxides, sulfur oxides, volatile organic compounds and particulate matter (PM2.5 and PM10). The effects of such emissions are significant both for the environment and for the organisms living in it. The IARC (International Agency for Research on Cancer) has classified air pollution in the first, most harmful group of carcinogenicity [1]. It has been estimated that around 3.22 million people died globally as a result of diseases caused by air pollution in 2010 alone [2].
Catalytic processes are able to effectively remove dangerous substances. Heterogeneous catalysts are of particular importance here [3]. Structured reactors are manufactured and used on a large scale in the treatment of emissions from gasoline and diesel engines to steam reforming of natural gas. However, in view of the growing needs and still-developing industry, there is an increasing necessity to search for new, more effective types of catalysts. Taking into account the annual global production of cars (50 million units) and the estimated increase in the number of used cars in the world (which will reach about 1.3 billion units in 2030 [4]), it seems particularly important to address this problem.
In the case of structured reactors, catalytic filling consists of the active phase and the support. The active phase is responsible for the course of the reaction. However, it often consists of expensive noble metals such as platinum, palladium or rhodium. For this reason, only a thin active phase layer is applied to the surface of the carrier. The geometry of the carrier is therefore particularly important. Effective catalyst support should provide intensive heat/mass transport and adequate availability of active centers for fluid molecules without generating high diffusional resistance. In order to deposit a significant amount of the active phase on the carrier surface, a large specific surface area Sv is desirable. High porosity ε of the support will lower the flow resistance, which leads to a reduction in pumping costs. Currently, the most commonly used industrial carriers are monoliths and packed beds. Monoliths, used in exhaust gas treatment of vehicles, may provide an eligible porosity (about 0.83) and a large specific surface area (up to about 4000 m2∙m−3) [5]. They ensure a very low flow resistance but they also have very poor transport properties. This is especially problematic for fast catalytic reactions, where the diffusion resistances limit the overall process rate. Packed beds can be used in the form of granules, spheres, rings, etc. A grain size of 2–10 mm is most commonly used. Packed beds allow the achievement of much more favorable values of transport coefficients than monoliths, but they also cause a significantly larger flow resistance, resulting from their low porosity.
Both of these types of carriers have many drawbacks that may be overcome by using new ones. The research described in this paper focuses on a new type of catalytic carriers called short-channel structures, which was proposed by Kołodziej et al. [6,7]. The idea of the support is based on the theory of developing laminar flow [8]. When the gas enters the long monolithic channels, the flow quickly develops within a very short distance from the channel’s inlet. Therefore, the fully developed laminar flow exists over most of the channel’s length, resulting in a weak heat/mass transfer and a low pressure drop. Shortening the monolith length is desirable due to the existence of the developing laminar flow at a longer distance from the channel inlet. Therefore, the heat transfer is more intense [9], but on the other hand, the flow resistance is enhanced as well. The validity of this approach has been confirmed by many subsequent works [10,11,12,13,14]. Short-channel structures combine much more intense heat transfer properties than monoliths with a slight increase in flow resistance. Although short-channel structures do not ensure both the heat/mass transport intensity of packed beds and a flow resistance similar to the one generated by monoliths, these properties can be largely adjusted to the required parameters of a specific process.
Not only is the length of the structure important, but also the shape of the channel cross-section [9]. Comparison of the values of transport and flow parameters (such as Nusselt number Nu and f∙Re-Fanning friction factor multiplied by Reynolds number) for fully developed flow indicates the more favorable properties of hexagonal shapes than of square and triangular ones [8,15,16,17,18,19,20]. There are few publications concerning hexagonal channels, and most of them are based on CFD (computational fluid dynamics) [16,17]. Typically, the flow through the catalytic support itself is modeled. Recently, works have been appearing that investigate the behavior of the fluid when it flows into the channels of the monolith, as well as when it flows out of the channels. Cornejo et al. [21] studied the pressure drop through a honeycomb substrate for several channel shapes, including a hexagonal one. As the authors suggested, the reduction in the flow area entering the substrate produces a non-flat velocity profile at the channel’s inlet.
Therefore, this paper presents the experimental and numerical results of the flow resistance of short-channel structures of hexagonal cross-section shape. A comparison of the obtained results with the literature dealing with such reactor internals is also carried out.

2. Theoretical Background

The flow resistance can be expressed as the Fanning friction factor f calculated with the use of the Darcy–Weisbach equation:
P L = 2 · f ρ · u 0 2 ε 2 · D h
where Dh is the hydraulic diameter (m), defined as:
D h = 4 · ε S v
The Fanning friction factor f can be determined in terms of the hydrodynamically dimensionless channel length L+:
L + = L D h · R e
Table 1 contains the literature solutions describing the flow resistance in a hexagonal duct. Although Hawthorn [22] developed a semi-empirical equation for a circular duct, as the author suggested, the proposed equation can also be valid for channels of different cross-sections by substituting the appropriate (f·Re)fd value for the duct under consideration. The values of (f·Re)fd presented in the literature on hexagonal channels differ slightly (15.054 [8], 15.065 [16], 15.077 [17], 14.974 [18]); therefore, (f·Re)fd = 15.054 was introduced to Hawthorn’s [22] equation.

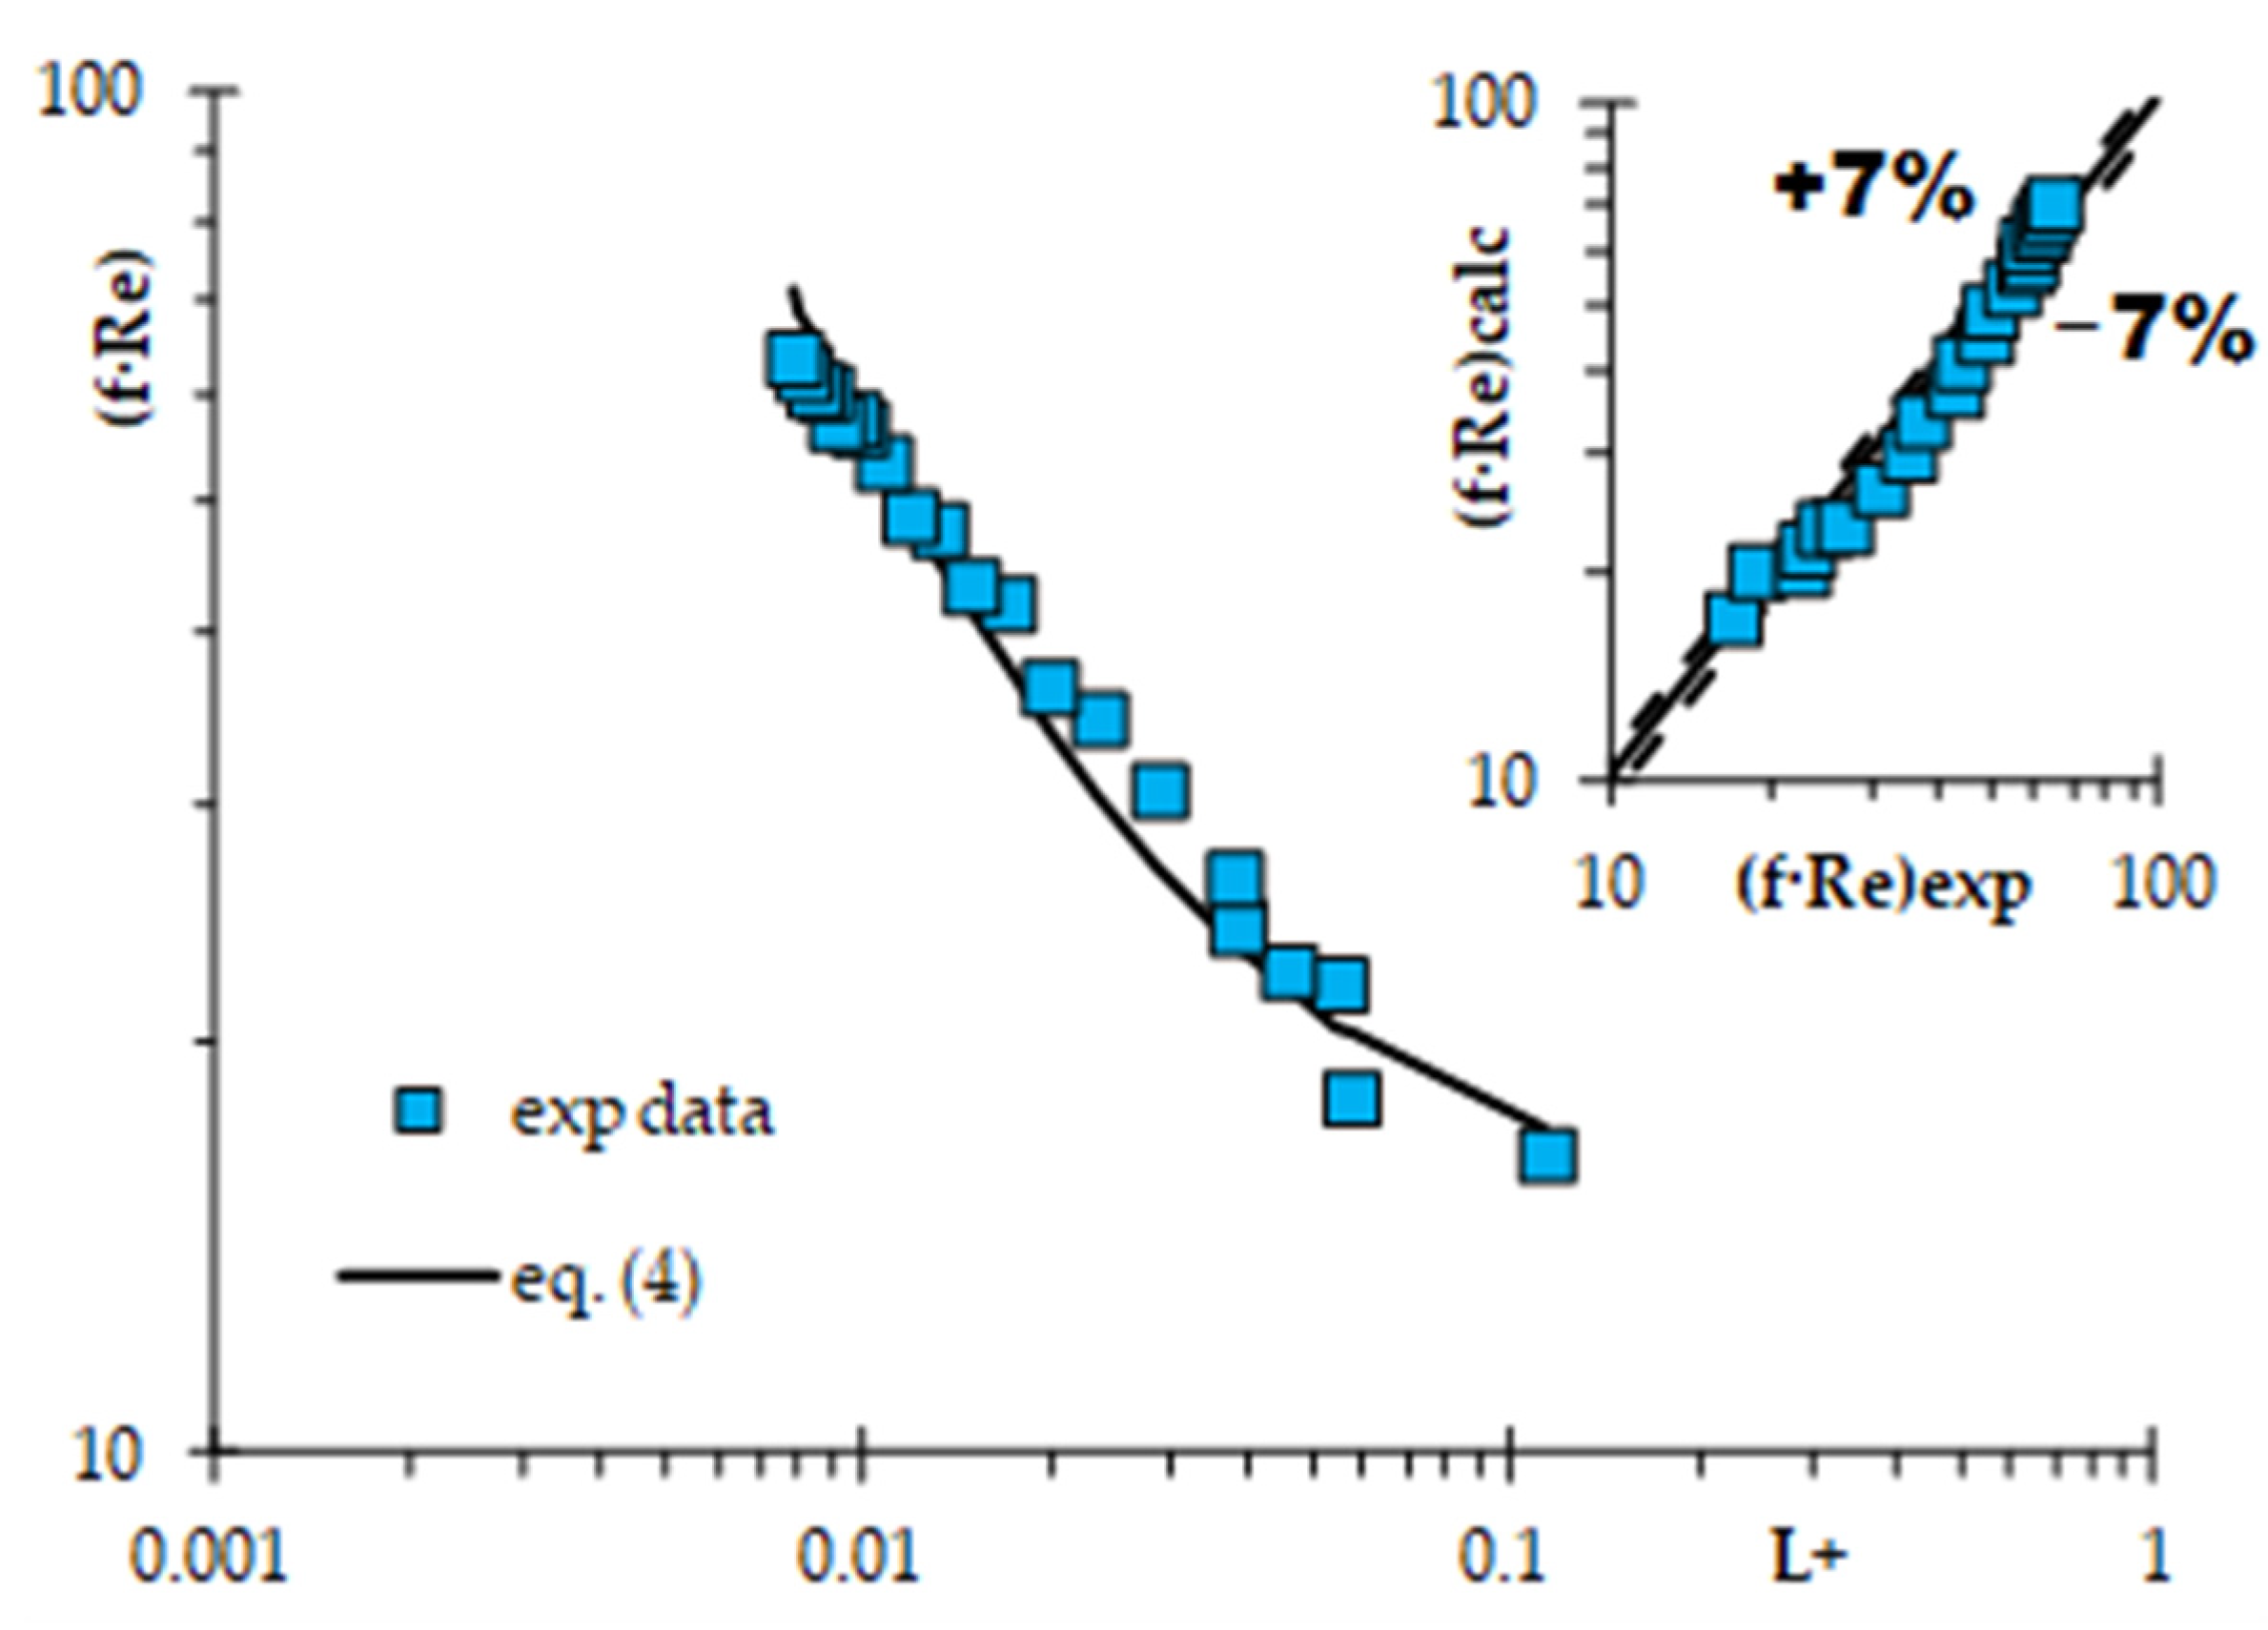
3. Results and Discussion

Figure 1 shows the comparison of experimental results with literature models for 6 mm long short-channel structures of hexagonal channel cross-section shape.
When comparing the experimental flow resistance values obtained for the structure tested with those in literature models, it is noticeable that they are in quite good agreement with Asako et al. [16] (relative error ey = 11.3%). Additionally, Turgut [17] found that L+limit = 0.062 is the limit value required to achieve a fully developed flow in a hexagonal duct (depicted in Figure 1). As can be seen, after exceeding this value the flow resistance changes only slightly. Therefore, it can be assumed that the developing laminar flow exists in 6 mm long hexagonal channels in the tested range of L+.
It should be noted, however, that theoretical models (Table 1) consider simplified geometry: only the channel, without the regions before and behind it, is considered, hence only the viscous friction in the duct is taken into account. In practice, the drag resistance caused by the frontal surface of the wall thickness also exists, resulting in differences between the real flow and its theoretical predictions [9] (see Section 4, Materials and Methods). Therefore, the following equation was developed for hexagonal channels, assuming the viscous friction and the drag resistance:
( f · R e ) = 15.054 + 0.175 · ( L + ) ( 1.19 )
which describes experimental results with relative error ey ≈ 7%, as presented in Figure 2. The proposed correlation (4) has the same scheme as solutions for ducts with other cross-section shapes [10].
Figure 3 shows the comparison of experimental and numerical results for two variants of channel geometry: ideal and real. Comparison of numerical approaches indicates the discrepancies between them, especially for higher values of Re. However, the real model (with non-zero wall thickness) displays good agreement with experimental data; the relative error of which is ey < 7%.
Additional results of numerical modeling are presented in Figure 4, Figure 5 and Figure 6 as static pressure distribution along the computational domains of simplified and real models.
As can be seen in Figure 4, static pressure in front of the channel entrance is more than twice as large for real model than for simplified one. It can be seen that near the wall there is a little rise in pressure directly before entering the channel. Next, pressure values decrease at the channel entrance, especially in real model. This pressure drop is more significant near the wall, resulting in negative values of pressure (see Figure 4a). At the channel end, the pressure values are also negative, more so in the case of real model. When comparing the distribution of static pressure presented in Figure 5 and Figure 6, it is noticeable that higher values of static pressure are obtained in real model before the channel inlet in the wall region than in simplified ones. At the channel entrance in real model, the highest pressure is located in the core of the channel, while the region close to the wall indicates some underpressure due to flow disturbances caused by vortices. In simplified model, this phenomenon is not observed because the gas enters the channel without changing the flow passage (due to a lack of frontal surface area of wall), thus the highest pressure occurs near the channel wall. Moreover, a longer distance from the channel inlet is required in simplified models to stabilize the flow and hence the pressure (see Figure 5).
The computational simulations of flow resistance were also carried out for 1, 2 and 4 mm long hexagonal structures (Figure 7). Numerical modeling for these channels was performed only for the real models, due to the better agreement between the experimental data and the simulated real model for 6 mm long ducts. Figure 8 shows the comparison of the Fanning friction factor f obtained for different channel lengths with a long monolith (L = 0.2 m). Flow resistance in the monolith was described using the semi-empirical equation developed by Hawthorn [22].
As was expected, the shorter the channel length, the higher the flow resistance. The differences in pressure drop between structures decrease with the increasing channel length; the smallest difference is between the structures of L = 4 mm and L = 6 mm (Figure 7). As can be seen in Figure 7, hexagonal structures of 6 mm length lie the closest to the long monolith and are closer for low fluid velocities. The discrepancies between the long monolith and structures of different lengths rise up with u0. However, for all modeled lengths of the structure, the dependence of f·Re vs. L+ follows one line, which is shown in Figure 8.

4. Materials and Methods

4.1. Experimental Set-Up

The pressure drop was determined for a 6 mm short-channel structure of hexagonal cross-section shape, with Sv = 1743.66 m2∙m−3 and porosity ε = 0.73. Images together with the dimensions are shown in Figure 9. It was manufactured from 316 stainless steel using the SLM (selective laser melting) method. The experimental setup is shown in Figure 10.
Reactor with rectangular test section of 30 × 45 mm was used to carry out the pressure drop measurement. The sample was placed in the reactor perpendicular to the flow direction. All experiments were conducted in ambient air conditions; fluid velocity was changed in the range from 0.2 to 3.2 m∙s−1 (which corresponds to Reynolds numbers Re from 30 to 450). Air temperature was measured by three thermocouples at the inlet and outlet sides. Recknagel micromanometer was used for pressure drop measurements.

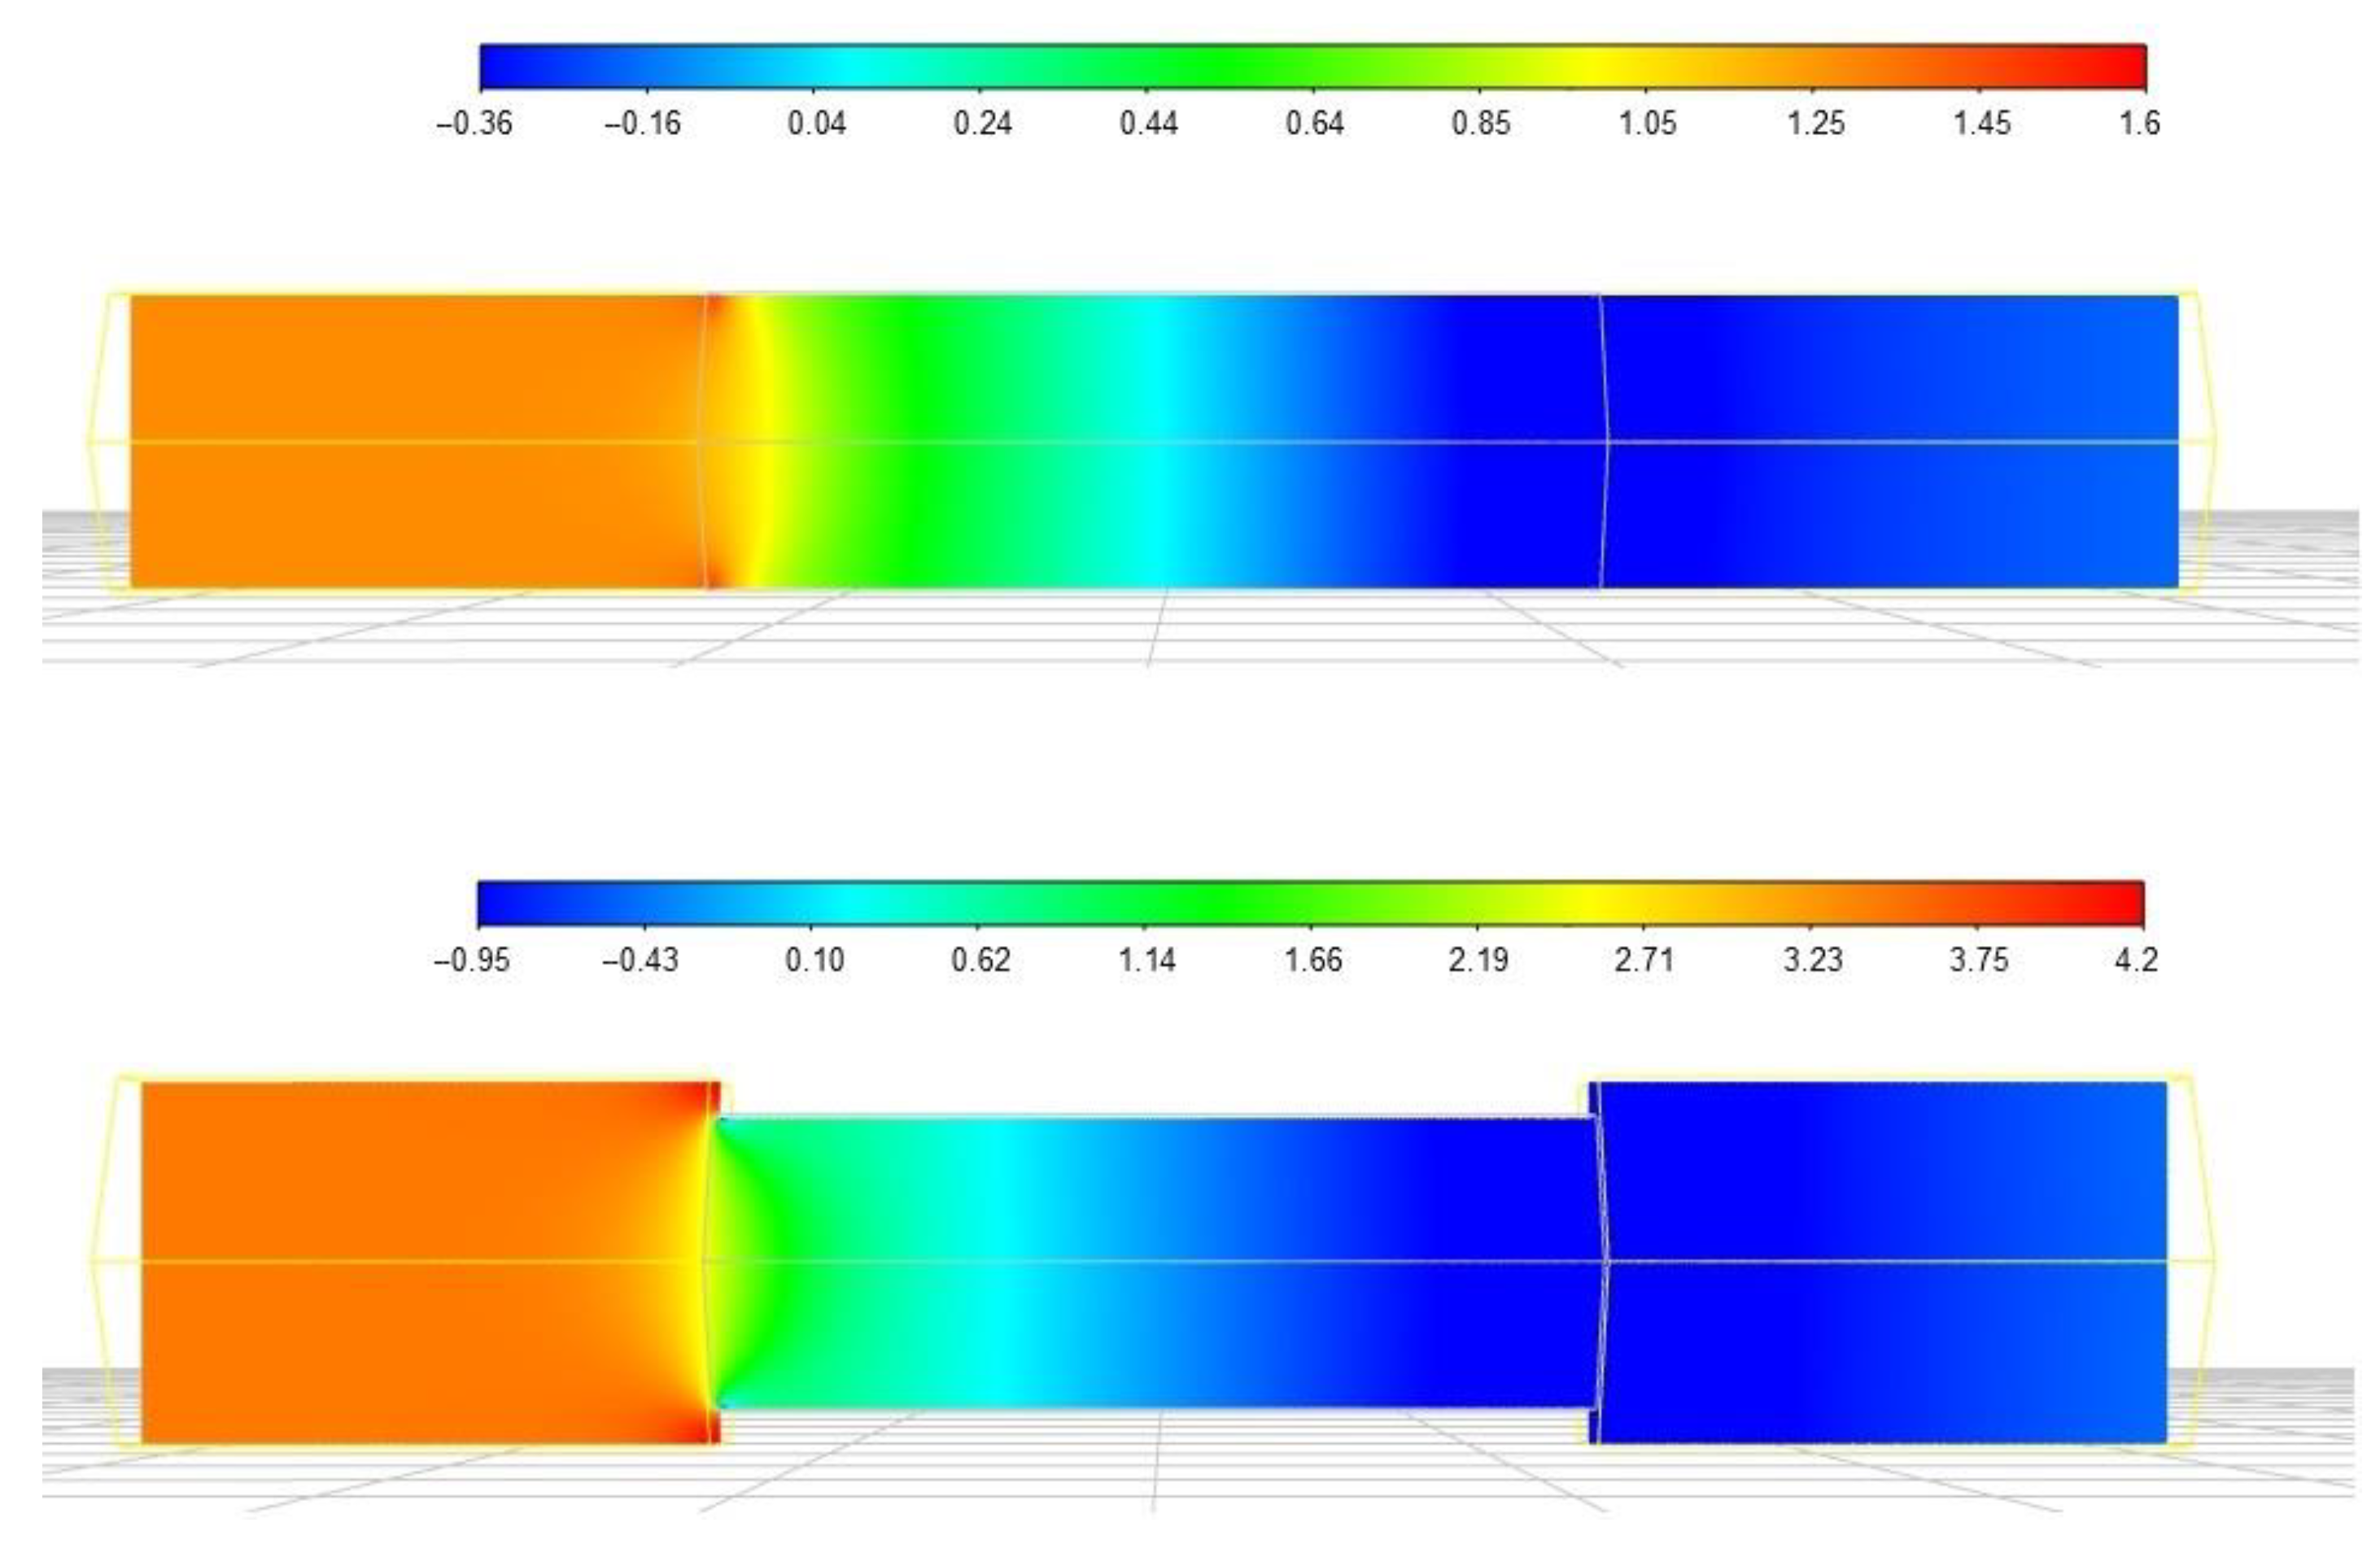
4.2. Numerical Method

CFD analysis was carried out using ANSYS Fluent 20.2 software. A single channel of 6 mm length (Figure 11) was modeled to reduce the CPU usage and simulation time. Laminar flow was chosen according to Reynolds numbers evaluation (below 500). The pressure–velocity coupling formulation of the SIMPLE algorithm was adopted using a second-order upwind scheme. Velocity-inlet and pressure-outlet boundary conditions were employed at the inlet and outlet, respectively. To attain convergence, the continuity and momentum equations were iterated until the residuals fell below 1 × 10⁻³.
The continuity and momentum equations are as follows, respectively:
· u 0 = 0
ρ u 0 · u 0 = p + μ 2 u 0
Pressure drop ΔP was calculated as a mass-weighted average over the cross-sections referred to as Pin and Pout (Figure 11). From the boundary condition imposed at the outlet, the static pressure (Pout) is always zero. Therefore, the pressure drop through the channel corresponds to the pressure value measured at the inlet section. As was stated earlier (see Section 3, Results), the theoretical models (Table 2) consider only flow through the channel, omitting the drag force resulting from frontal surface area of channel wall; thus, pressure drop should be calculated as a mass-weighted average over the cross-sections referred to as P1 and P2 (see Figure 3). Therefore, during the numerical modeling, the pressure drop was analyzed in two ways: (1) containing only viscous friction, referred to as the “simplified” model, and (2) including also drag force, referred to as the “real” model; more details about both models can be found in [9].
The computational domain consisted of hexahedral elements; the procedure for grid preparation and its distribution is described in detail in [9]. The mesh independence study was performed by changing the cell size inside the computational domain until the variation in pressure drop was less than 0.1%. The results obtained with different mesh sizes are given in Table 2 and Figure 12 for u0 = 3 (m∙s−1).

5. Conclusions

The comparison of results obtained for hexagonal structures tested with theoretical solutions indicated some differences resulting from the approach of neglecting the channel wall thickness. Numerical analyses allowed the identification of the differences in pressure distribution in the two models considered (simplified and real). It is highly recommended to take under consideration the frontal surface area (real model) in overall flow resistance. The channel wall thickness contributes the drag force, and thus the gas flow is disturbed [9]. For this reason, the static pressure at the channel entrance reaches higher values than in the case of the simplified model, and the occurrence of negative pressure near the wall causes the high pressure drop.
While some theoretical models reflect the experimental data, it seems more accurate to include the channel wall thickness in modeling and describing the flow resistance. Only the real model provides a detailed analysis of fluid flow phenomena.

Author Contributions

Conceptualization, M.I.; experimental analysis, K.S.; CFD analysis, M.I.; writing—original draft preparation, M.I. and K.S.; writing—review and editing, P.J.J.; funding acquisition, P.J.J. All authors have read and agreed to the published version of the manuscript.

Funding

This research was funded by National Centre for Research and Development (Project LIDER/204/L-6/14/ NCBR/2015).

Conflicts of Interest

The authors declare no conflict of interest.

List of Symbols

Kaccording to [16] or [23]
Lsample thickness. m
ReReynolds number = u0∙Dh∙ρ∙μ−1 ε−1
R e A according to [24]
Svspecific surface area. m2∙m−3
u0superficial fluid velocity. m∙s−1
ΔPpressure drop. Pa
εporosity
μdynamic viscosity, Pa∙s
ρdensity. kg∙m−3
Ψaccording to [23]
Subscripts
fdfully developed
appapparent

References

  1. Loomis, D.; Grosse, Y.; Lauby-Secretan, B.; El Ghissassi, F.; Bouvard, V.; Benbrahim-Tallaa, L.; Guha, N.; Baan, R.; Mattock, H.; Straif, K. The carcinogenicity of outdoor air pollution. Lancet Oncol. 2013, 14, 1262–1263. [Google Scholar] [CrossRef]
  2. Hamra, G.B.; Guha, N.; Cohen, A.; Laden, F.; Raaschou-Nielsen, O.; Samet, J.M.; Vineis, P.; Forastiere, F.; Saldiva, P.; Yorifuji, T.; et al. Outdoor Particulate Matter Exposure and Lung Cancer: A Systematic Review and Meta-Analysis. Environ. Health Perspect. 2014, 122, 906–911. [Google Scholar] [CrossRef] [PubMed] [Green Version]
  3. Dumesic, J.A.; Huber, G.W.; Boudart, M. Principles of Heterogeneous Catalysis. In Handbook of Heterogeneous Catalysis; Wiley: Hoboken, NJ, USA, 2008. [Google Scholar]
  4. Pardiwala, J.; Patel, F.; Patel, S. Review paper on Catalytic Converter for Automotive Exhaust Emission. In Proceedings of the International Conference on Current Trends in Techology, Ahmedabad, India, 8–10 December 2011. [Google Scholar]
  5. Williams, J.L. Monolith structures, materials, properties and uses. Catal. Today 2001, 69, 3–9. [Google Scholar] [CrossRef]
  6. Kołodziej, A.; Łojewska, J. Short-channel structured reactor for catalytic combustion: Design and evaluation. Chem. Eng. Process. Process. Intensif. 2007, 46, 637–648. [Google Scholar] [CrossRef]
  7. Kołodziej, A.; Łojewska, J.; Ochońska, J.; Łojewski, T. Short-channel structured reactor: Experiments versus previous theoretical design. Chem. Eng. Process. Process. Intensif. 2011, 50, 869–876. [Google Scholar] [CrossRef]
  8. Shah, R.K.; London, A.L. Laminar Flow Forced Convection in Ducts; Academic Press: New York, NY, USA, 1978. [Google Scholar]
  9. Iwaniszyn, M.; Jodłowski, P.J.; Sindera, K.; Gancarczyk, A.; Korpyś, M.; Jędrzejczyk, R.J.; Kołodziej, A. Entrance effects on forced convective heat transfer in laminar flow through short hexagonal channels: Experimental and CFD study. Chem. Eng. J. 2021, 405, 126635. [Google Scholar] [CrossRef]
  10. Iwaniszyn, M.; Piątek, M.; Gancarczyk, A.; Jodlowski, P.; Łojewska, J.; Kołodziej, A. Flow resistance and heat transfer in short channels of metallic monoliths: Experiments versus CFD. Int. J. Heat Mass Transf. 2017, 109, 778–785. [Google Scholar] [CrossRef]
  11. Iwaniszyn, M.; Kryca, J.; Jodłowski, P.J.; Piątek, M.; Gancarczyk, A.; Łojewska, J.; Kołodziej, A. Novel intense metallic monolith for automotive applications: Experimental versus numerical studies. C. R. Chim. 2015, 18, 1030–1035. [Google Scholar] [CrossRef]
  12. Iwaniszyn, M.; Ochońska, J.; Gancarczyk, A.; Jodlowski, P.; Knapik, A.; Łojewska, J.; Janowska-Renkas, E.; Kołodziej, A. Short-Channel Structured Reactor as a Catalytic Afterburner. Top. Catal. 2013, 56, 273–278. [Google Scholar] [CrossRef] [Green Version]
  13. Iwaniszyn, M.; Ochońska, J.; Jodlowski, P.; Łojewska, J.; Kolodziej, A. Very short monoliths of triangular cross-sectional channel shape for fast catalytic reactions. Przem. Chem. 2012, 91, 1435–1438. [Google Scholar]
  14. Kolodziej, A.; Lojewska, J.; Iwaniszyn, M.; Jodlowski, P.; Ochonska, J.; Rogulska, A.; Gancarczyk, A.; Matuszek-Chmurowska, A. Mass transfer and flow resistance for sinusoidal short-channel catalytic internals. Przem. Chem. 2012, 91, 2074–2078. [Google Scholar]
  15. Shah, R. Laminar flow friction and forced convection heat transfer in ducts of arbitrary geometry. Int. J. Heat Mass Transf. 1975, 18, 849–862. [Google Scholar] [CrossRef]
  16. Asako, Y.; Nakamura, H.; Faghri, M. Developing laminar-flow and heat-transfer in the entrance region of regular polygonal ducts. Int. J. Heat Mass Transf. 1988, 31, 2590–2593. [Google Scholar]
  17. Turgut, O. Numerical investigation of laminar flow and heat transfer in hexagonal ducts under isothermal and constant heat flux boundary conditions. Iran. J. Sci. Technol. Trans. Mechan. Eng. 2014, 38, 45–56. [Google Scholar]
  18. Sadasivam, R.; Manglik, R.M.; Jog, M.A. Fully developed forced convection through trapezoidal and hexagonal ducts. Int. J. Heat Mass Transf. 1999, 42, 4321–4331. [Google Scholar] [CrossRef]
  19. Gu, S.; Lu, T.; Evans, A. On the design of two-dimensional cellular metals for combined heat dissipation and structural load capacity. Int. J. Heat Mass Transf. 2001, 44, 2163–2175. [Google Scholar] [CrossRef]
  20. Othman, M.Y.H.; Hussain, F.; Sopian, K.; Yatim, B.; Ruslan, H. Performance Study of Air-based Photovoltaic-thermal (PV/T) Collector with Different Designs of Heat Exchanger. Sains Malays. 2013, 42, 1319–1325. [Google Scholar]
  21. Cornejo, I.; Nikrityuk, P.; Hayes, R.E. The influence of channel geometry on the pressure drop in automotive catalytic converters: Model development and validation. Chem. Eng. Sci. 2020, 212, 115317. [Google Scholar] [CrossRef]
  22. Hawthorn, R.D. Afterburner Catalysis-Effects of Heat and Mass Transfer between Gas and Catalyst Surface. In Proceedings of the AIChE Symposium Series; American Institute of Chemical Engineers: New York, NY, USA, 1974; pp. 428–438. [Google Scholar]
  23. Yilmaz, T. General Equations for Pressure Drop for Laminar Flow in Ducts of Arbitrary Cross Sections. J. Energy Resour. Technol. 1990, 112, 220–223. [Google Scholar] [CrossRef]
  24. Muzychka, Y.S.; Yovanovich, M.M. Laminar Forced Convection Heat Transfer in the Combined Entry Region of Non-Circular Ducts. J. Heat Transf. 2004, 126, 54–61. [Google Scholar] [CrossRef] [Green Version]
Figure 1. Comparison of experimental results with literature solutions for tested structure.
Catalysts 11 01036 g001
Figure 2. Flow resistance for hexagonal channel tested. Inset: parity plot for Equation (4).
Catalysts 11 01036 g002
Figure 3. Comparison of numerical and experimental results for tested structure.
Catalysts 11 01036 g003
Figure 4. Comparison of static pressure along the computational domain between simplified and real models (u0 = 1 m∙s−1): (a) near the wall; (b) in the core.
Catalysts 11 01036 g004
Figure 5. Distribution of static pressure along the computational domain for simplified (top) and real (bottom) models (u0 = 1 m∙s−1).
Catalysts 11 01036 g005
Figure 6. Distribution of static pressure at the channel entrance for simplified (top) and real (bottom) models (u0 = 1 m∙s−1).
Catalysts 11 01036 g006
Figure 7. Comparison of numerical results for different channel lengths.
Catalysts 11 01036 g007
Figure 8. f·Re vs. L+ for different channel lengths.
Catalysts 11 01036 g008
Figure 9. Sample’s characteristic dimensions.
Catalysts 11 01036 g009
Figure 10. Experimental setup: 1-blower, 2-rotameter, 3-reactor, 4-sample, T-thermocouples.
Catalysts 11 01036 g010
Figure 11. Computational domain of real model with boundary conditions for pressure drop calculation.
Catalysts 11 01036 g011
Figure 12. Mesh convergence for simplified (a) and real (b) models.
Catalysts 11 01036 g012
Table 1. Literature models describing the fluid flow through a hexagonal duct.
Ref.CorrelationNotations
Hawthorn [22] ( f · R e ) = ( f · R e ) f d · ( 1 + 0.045 L + ) 0.5 (f·Re)fd = 15.054
Asako et al. [16] Δ P ρ · u 2 2 = ( f · R e ) f d · 4 · L + D h · R e + K (f·Re)fd = 15.065
K = 1.324
Turgut [17] 1 ( f · R e ) = ( f · R e ) f d + 0.03 · ( L + ) 1.01 (f·Re)fd = 15.077
Yilmaz [23] Δ P ρ · u 2 2 = 64 · ψ · L + +
+ 13.766 · L + 0.5 [ 1 + 13.95 · ψ · L + 0.5 + ( 13.766 K 13.766 ) 3 · L + 1.5 ] 1 3
Ψ = 0.94
K = 1.426
Muzychka and Yovanovich [24] f a p p · R e A = 12 ε ( 1 ε ) 1 192 ε π 5 · t a n h · π 2 ε 2 + 3.44 L + 2 1 / 2 Є = b/a = 0.885
1 Correlation equation based on Figure 4b in [17].
Table 2. Mesh convergence.
Model No ElementsPin, Paey
Simplified1538,7207.257222.3604788
2621,6005.93670.09610521
3704,4805.931-
Real11,168,09021.9260.19192104
21,432,27021.8870.01370865
31,701,77021.884-
Publisher’s Note: MDPI stays neutral with regard to jurisdictional claims in published maps and institutional affiliations.

