
Identifying Energy Extraction Optimisation Strategies of Actinobacillus succinogenes


Abstract
:1. Introduction
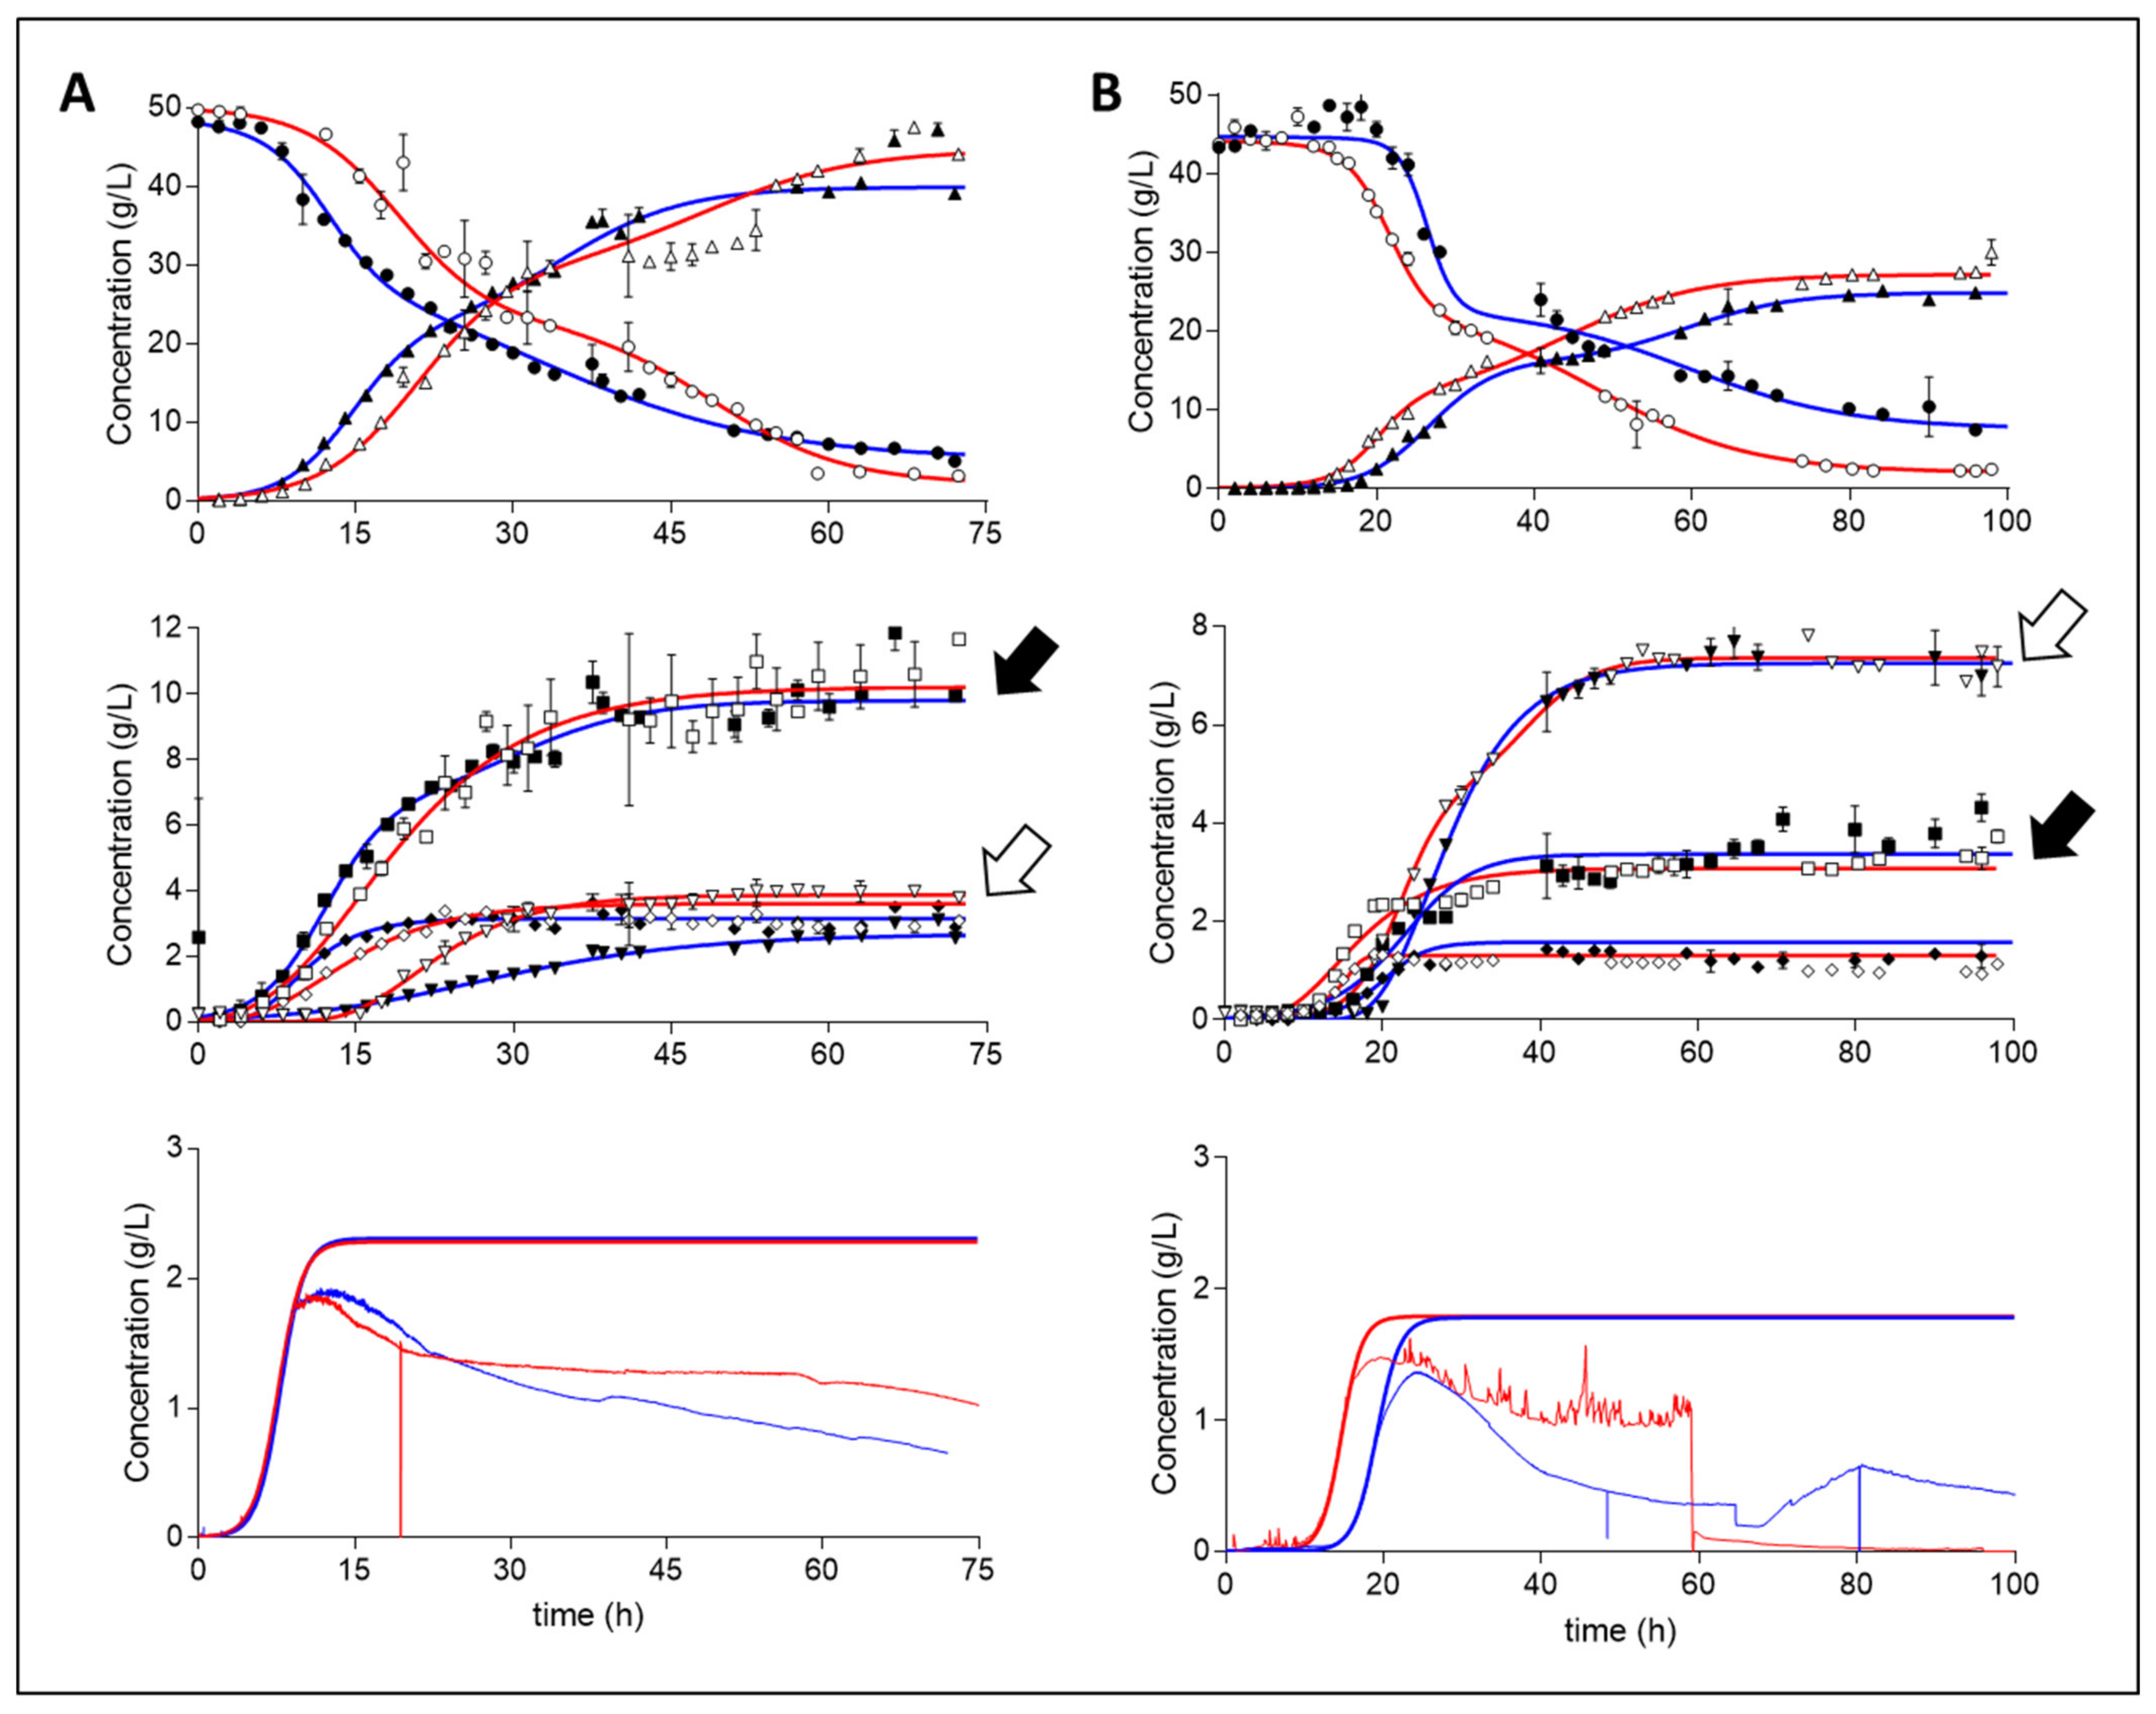
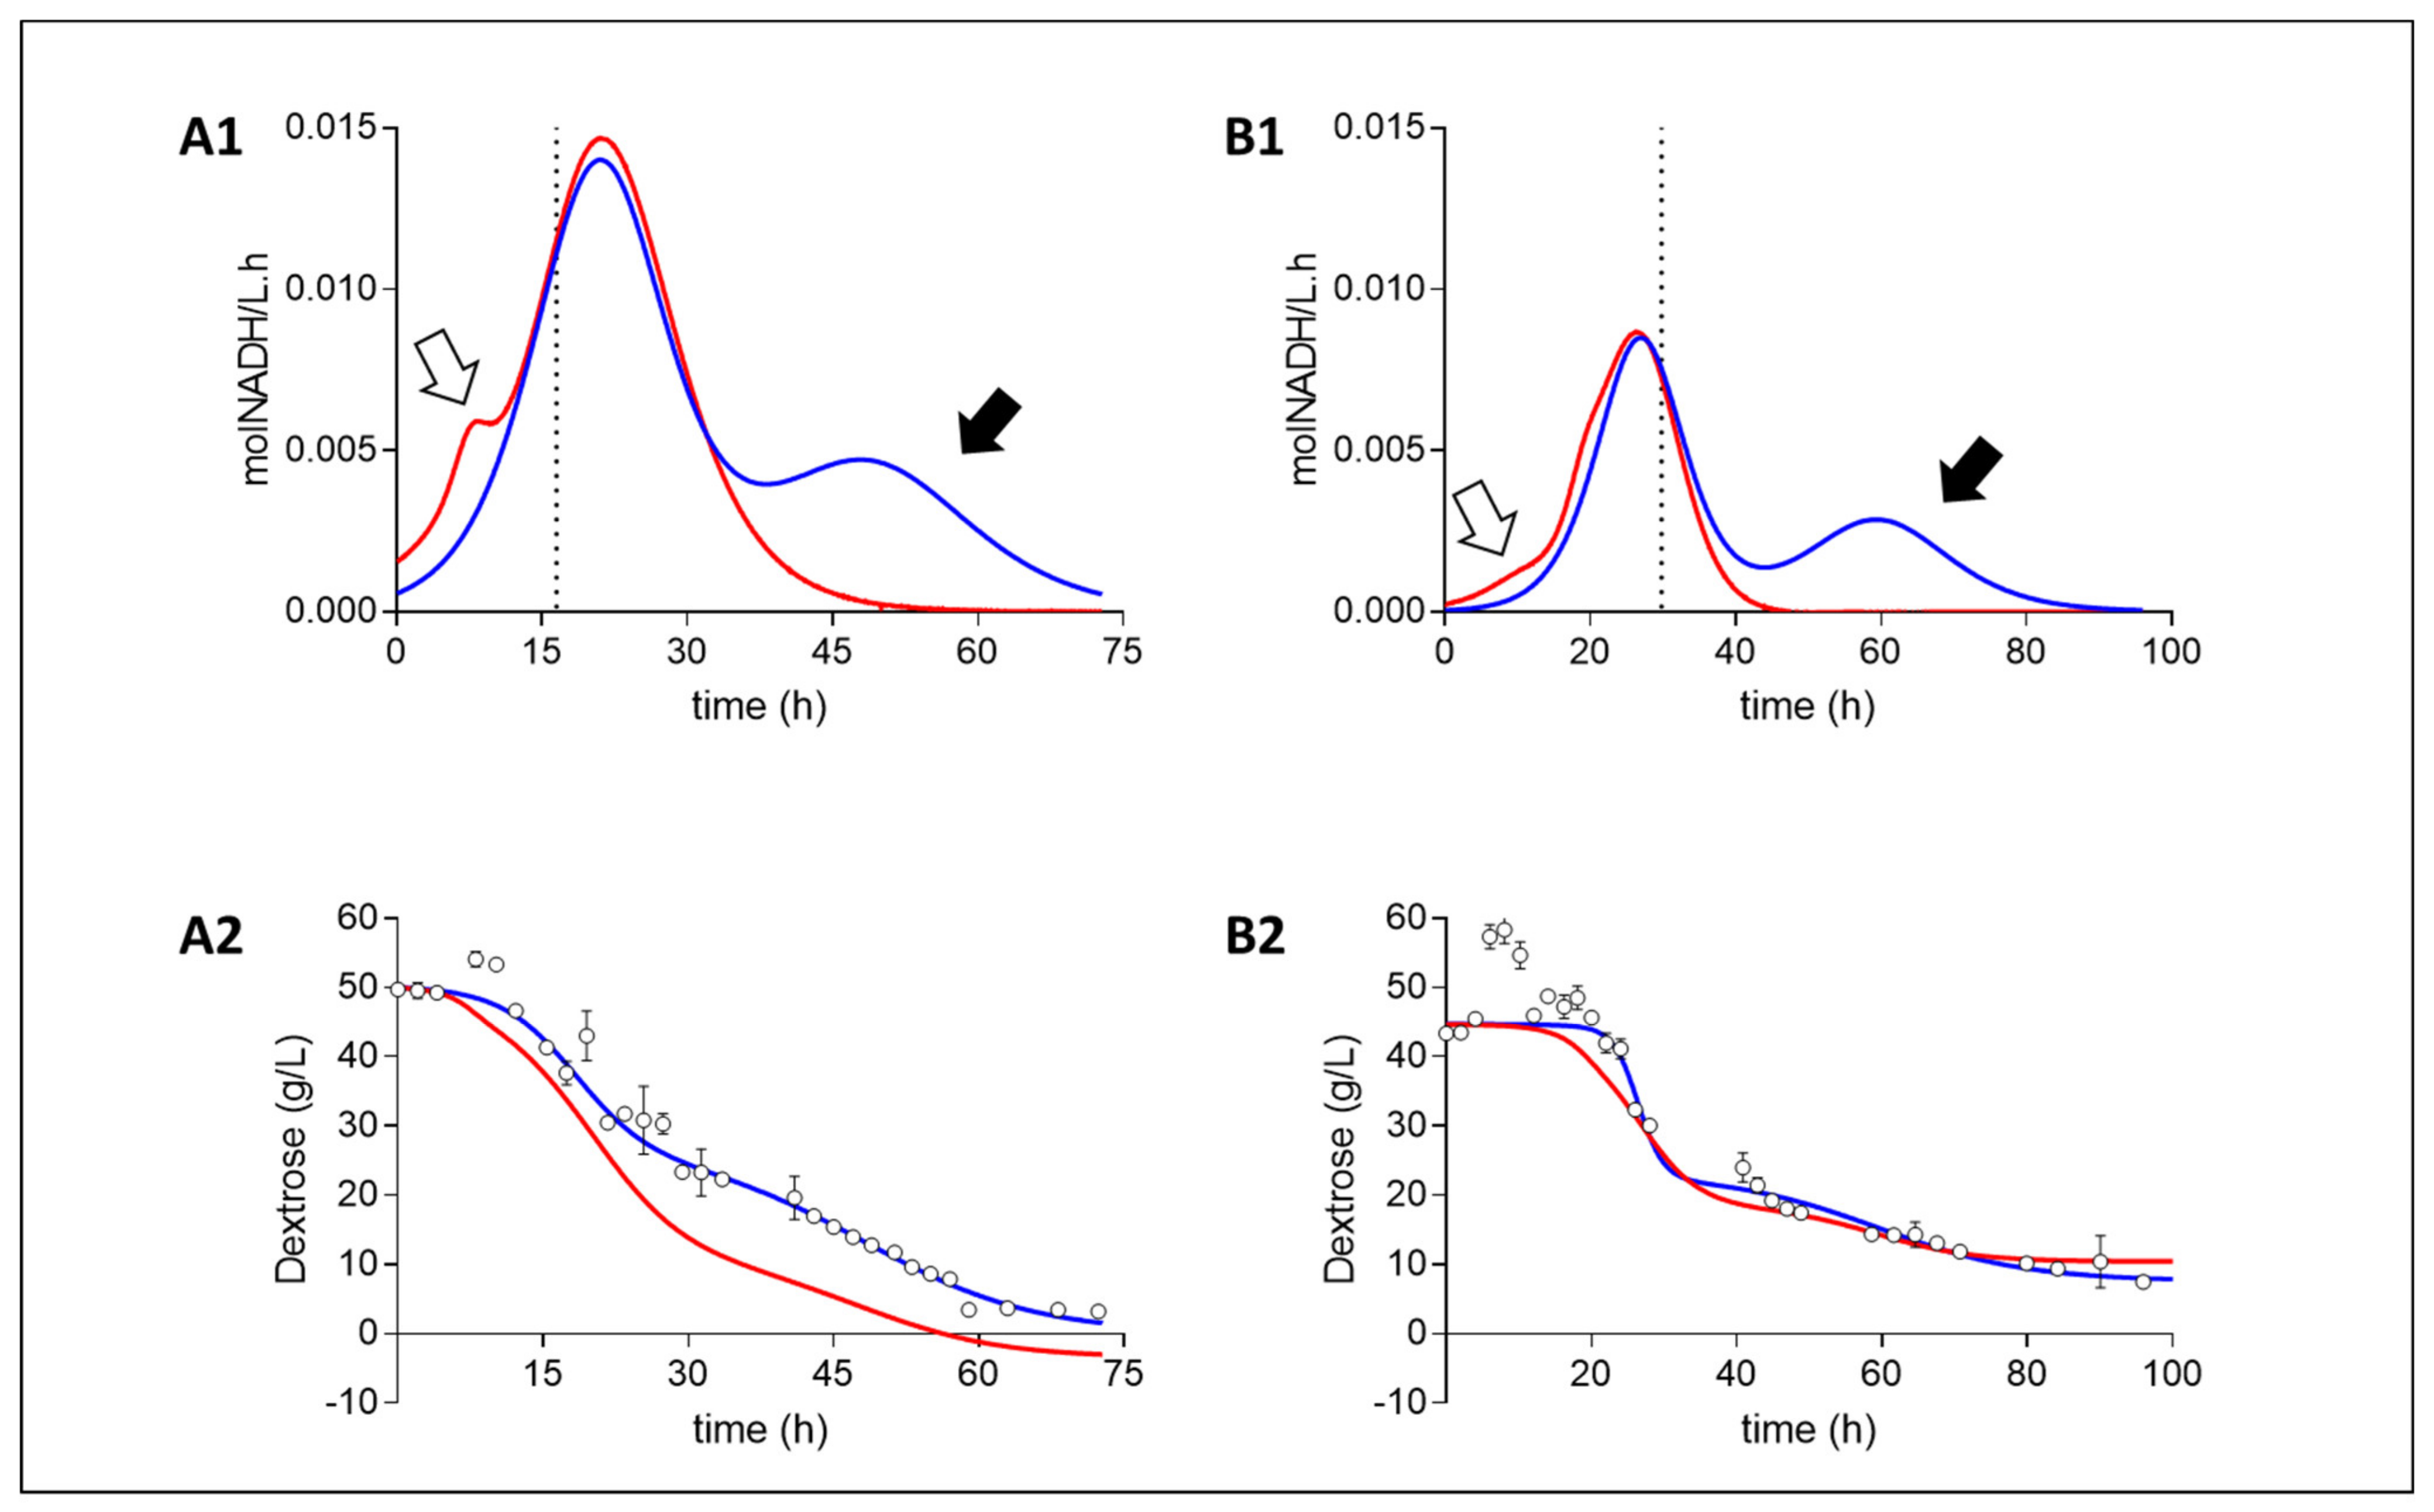
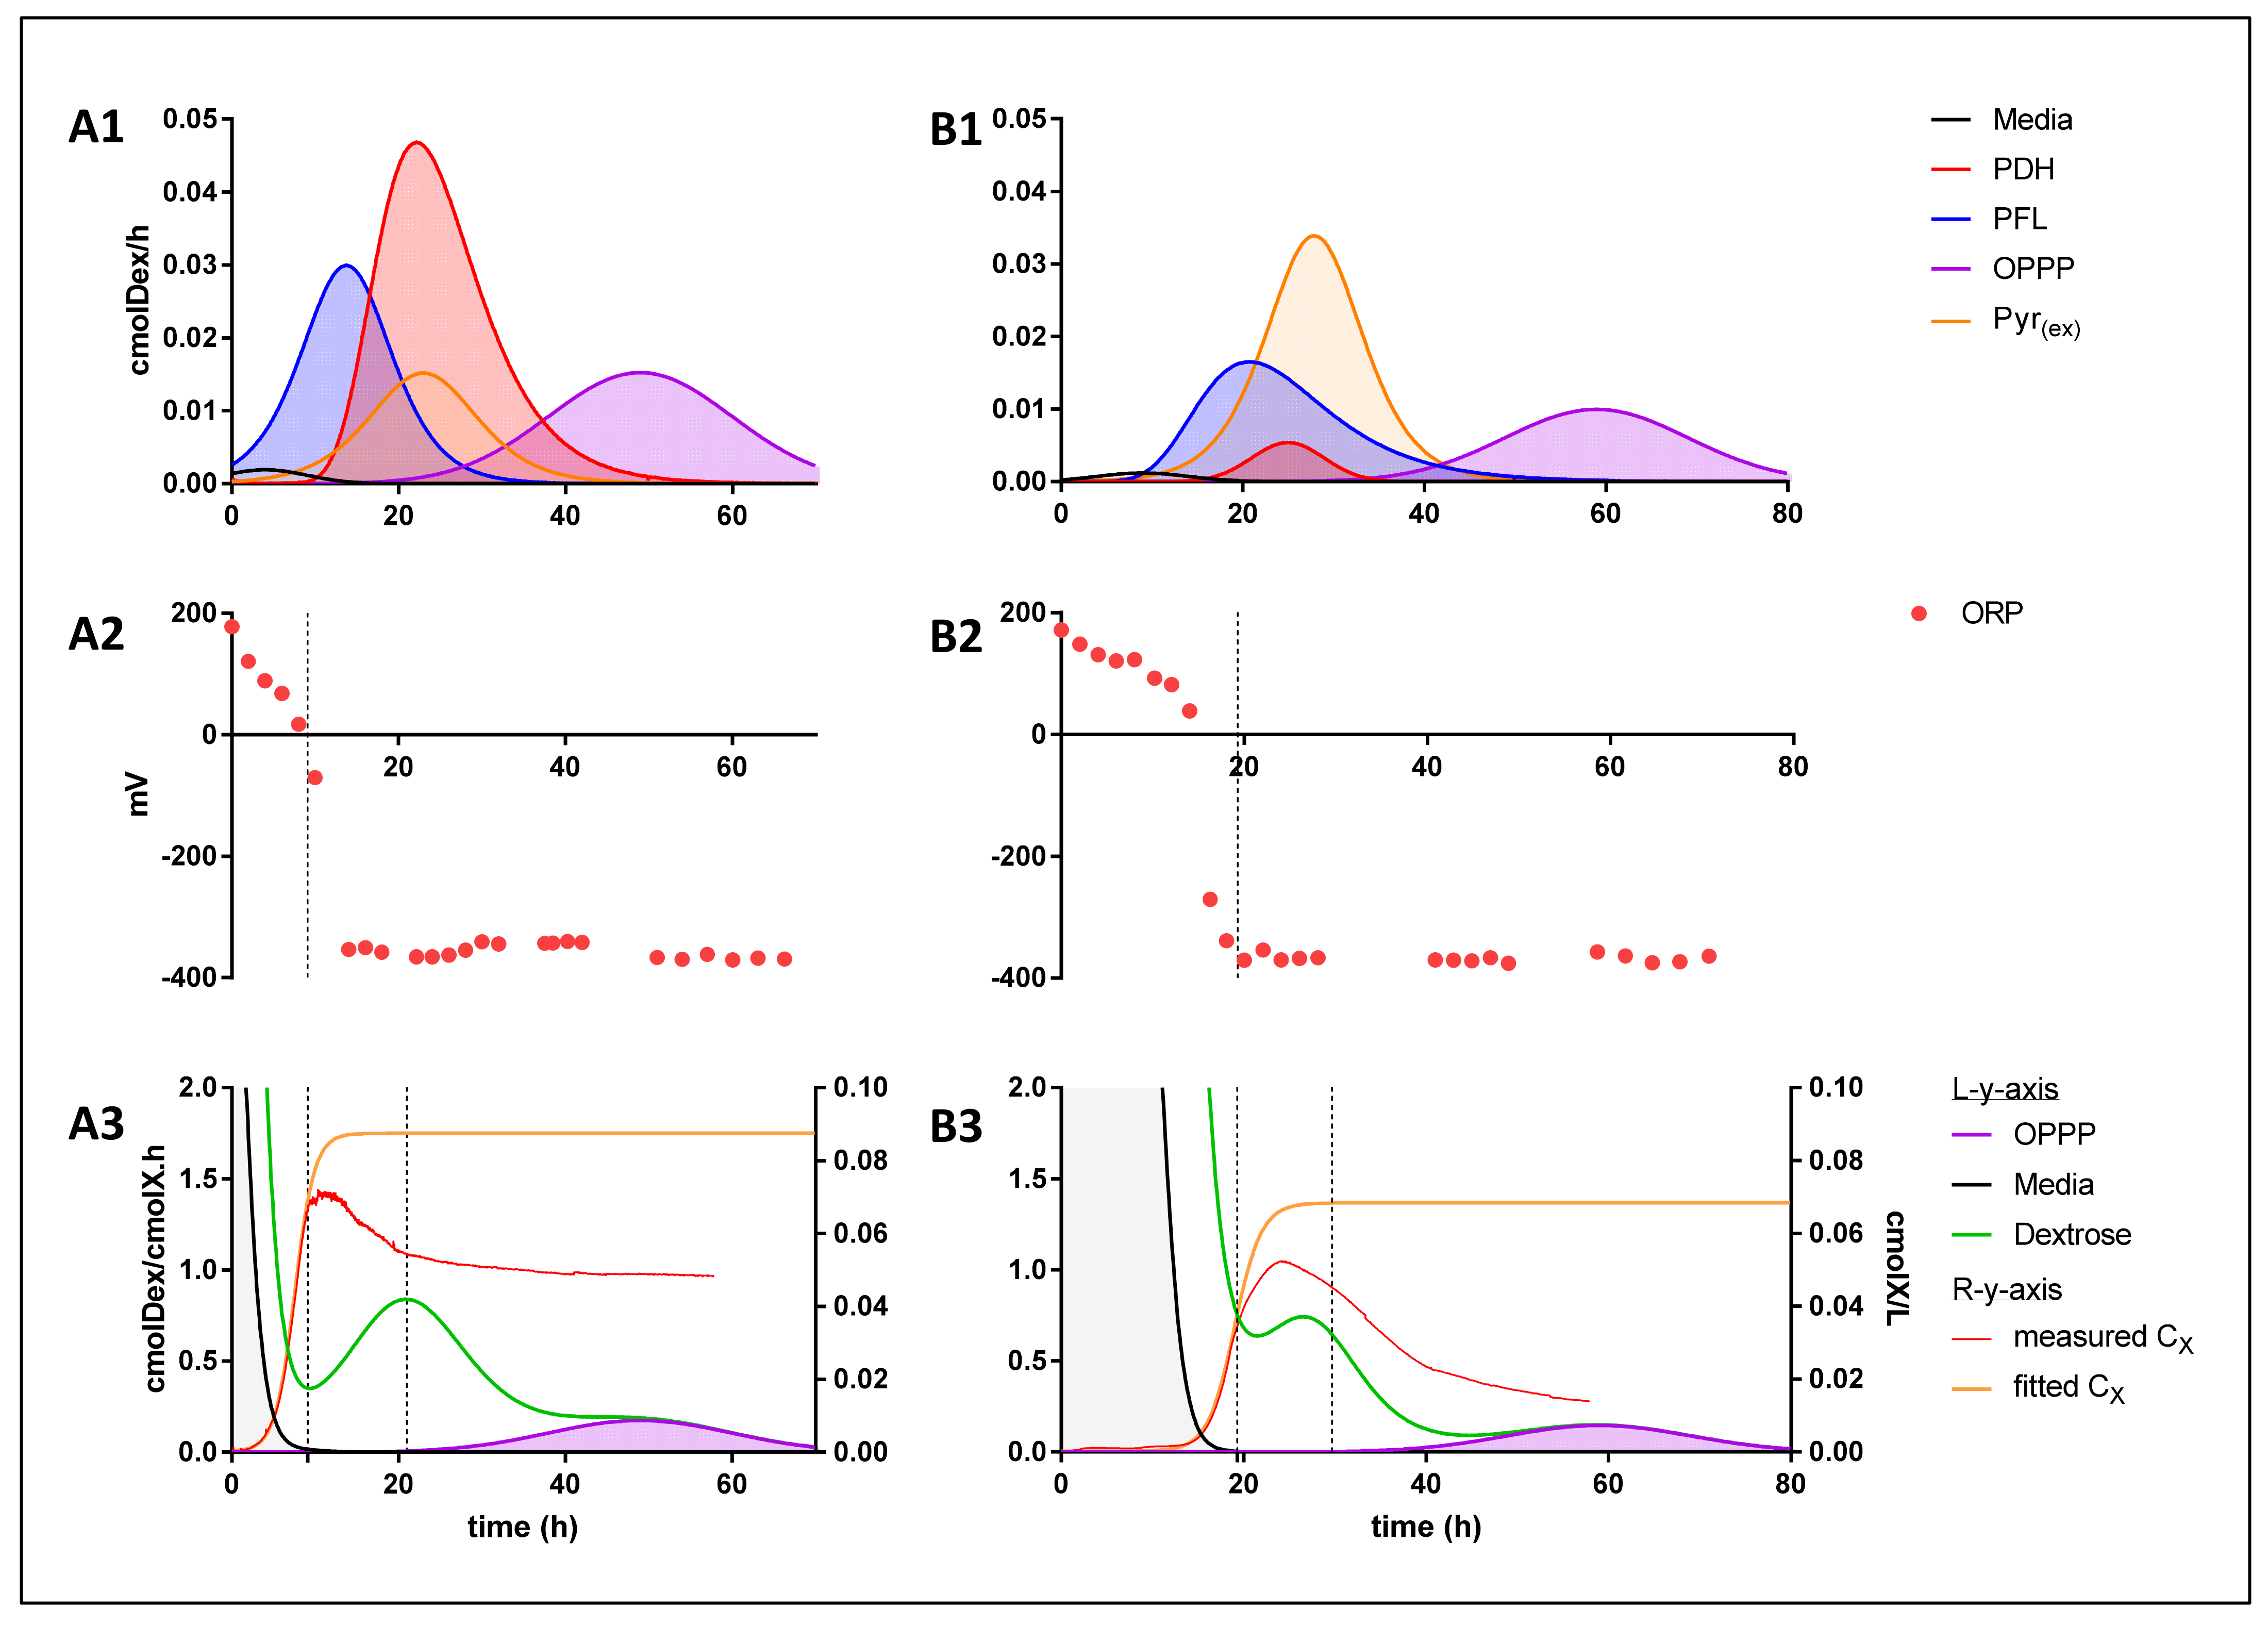
2. Results
3. Discussion
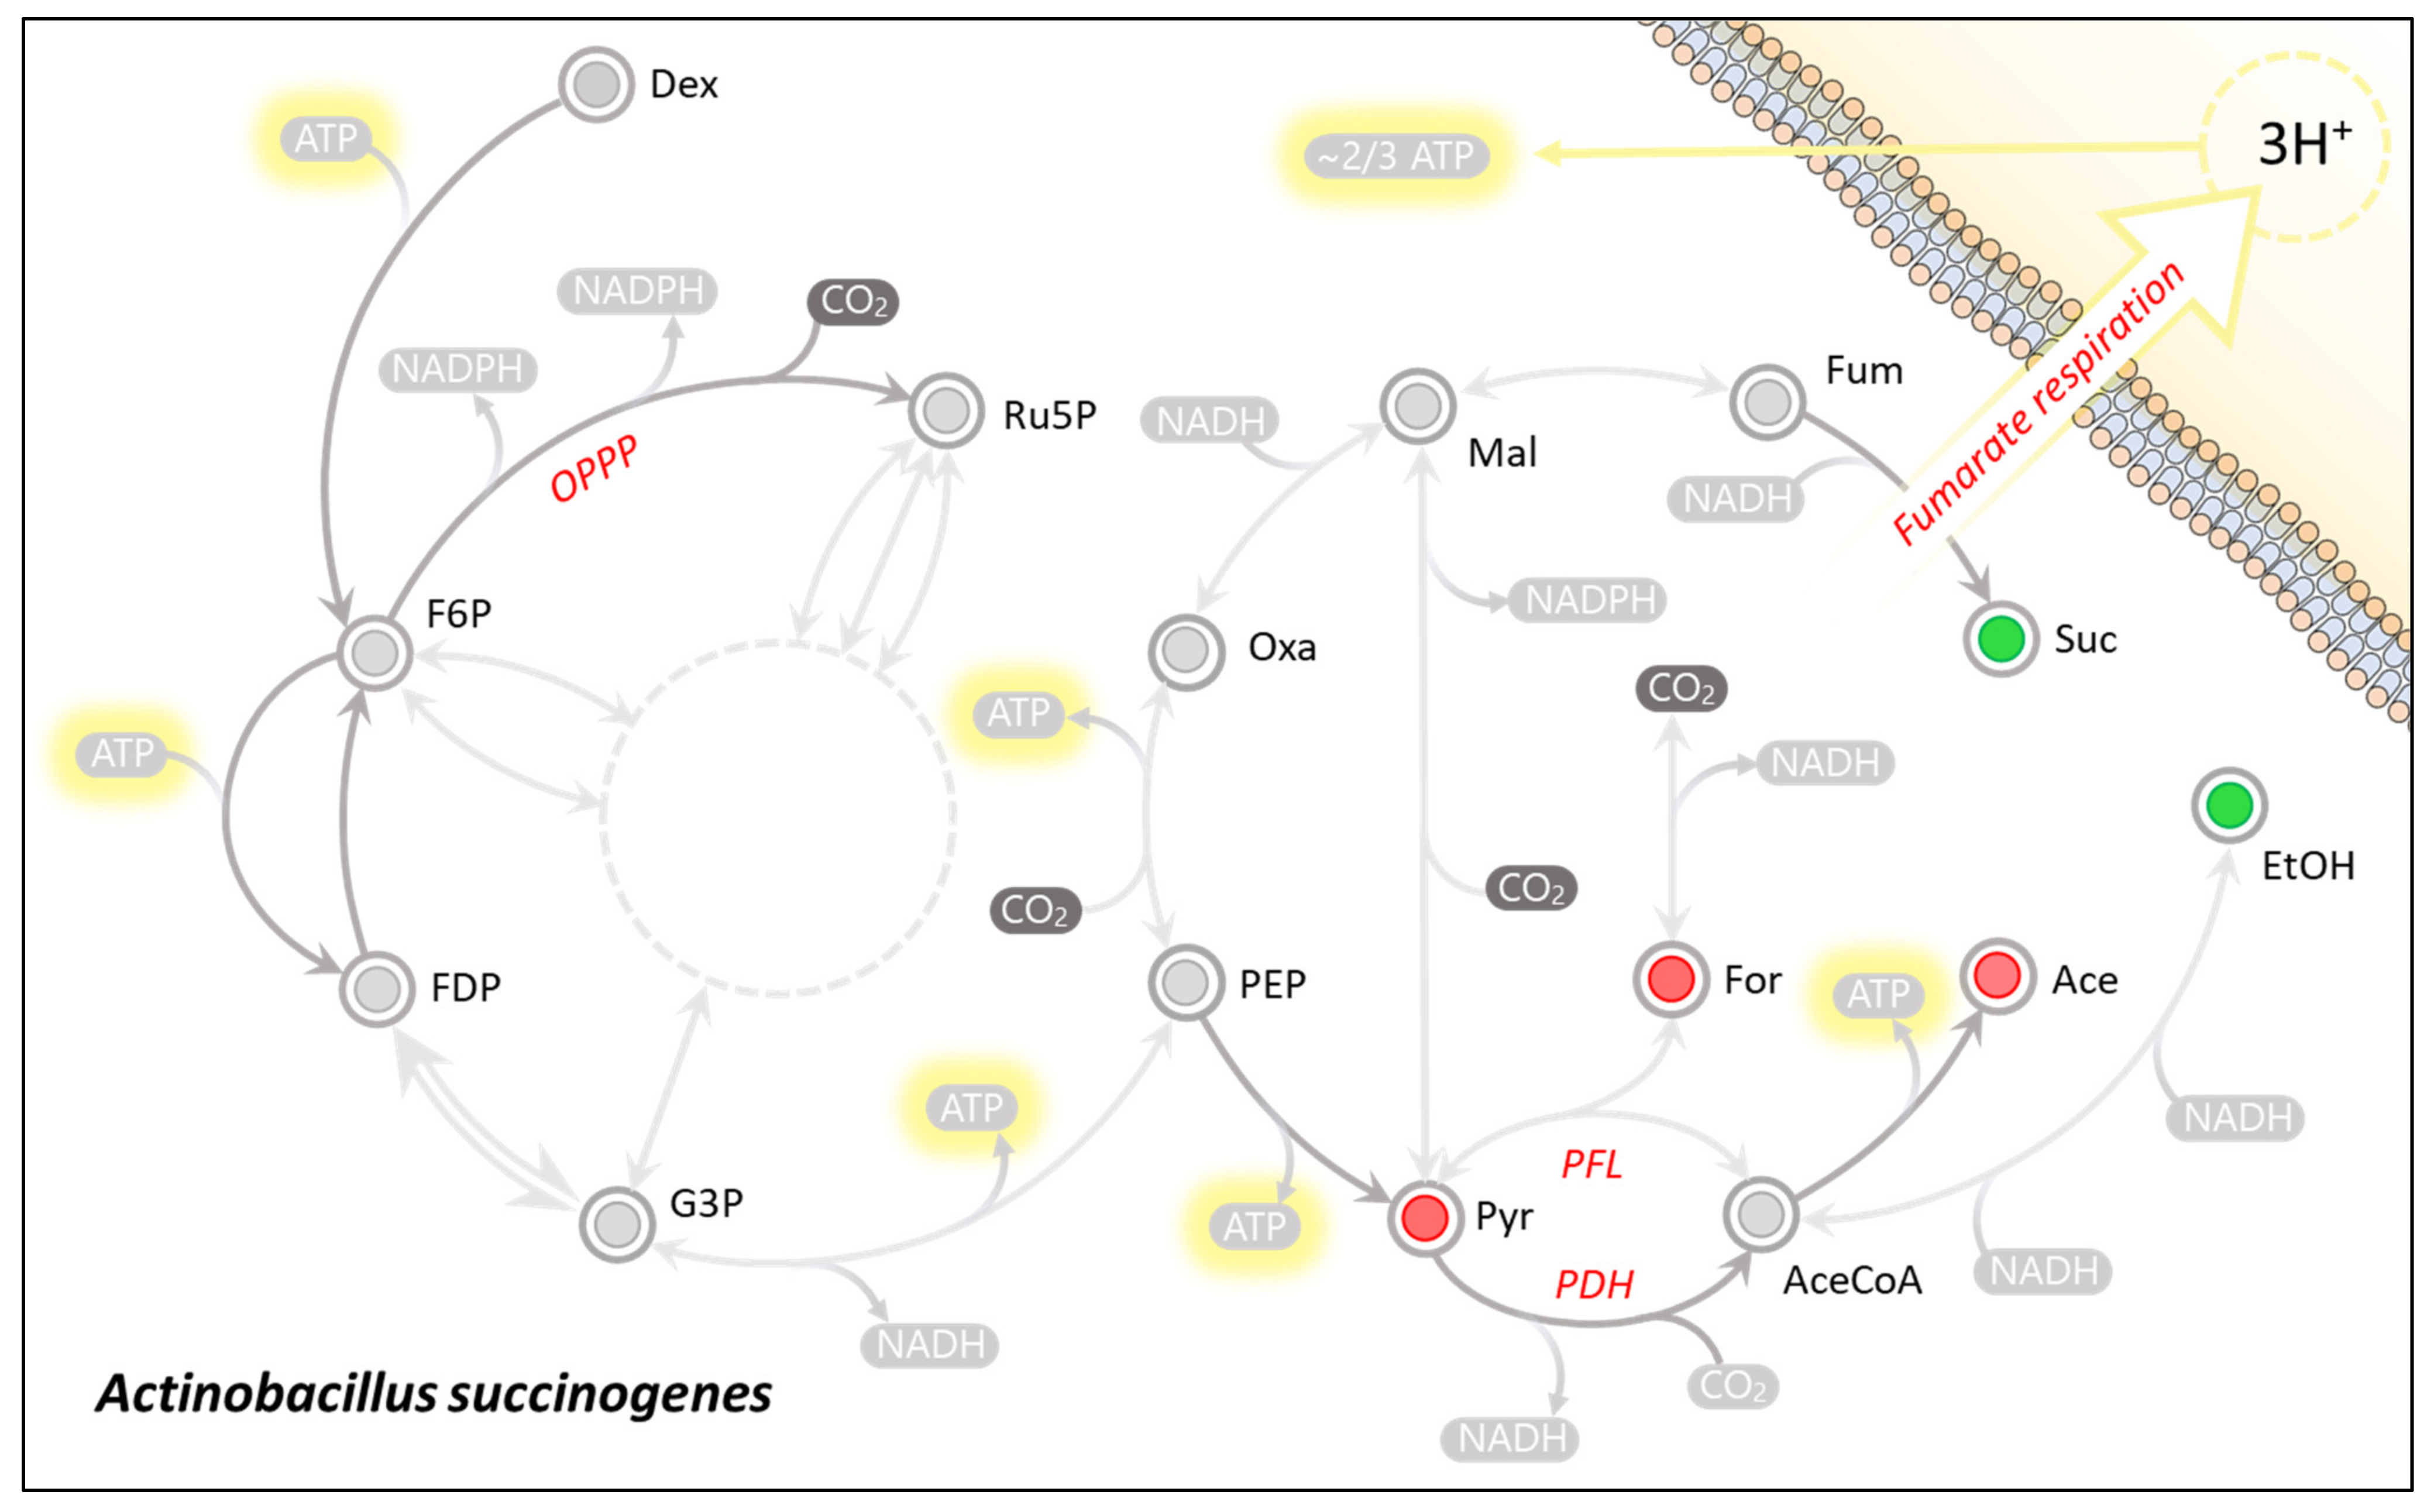
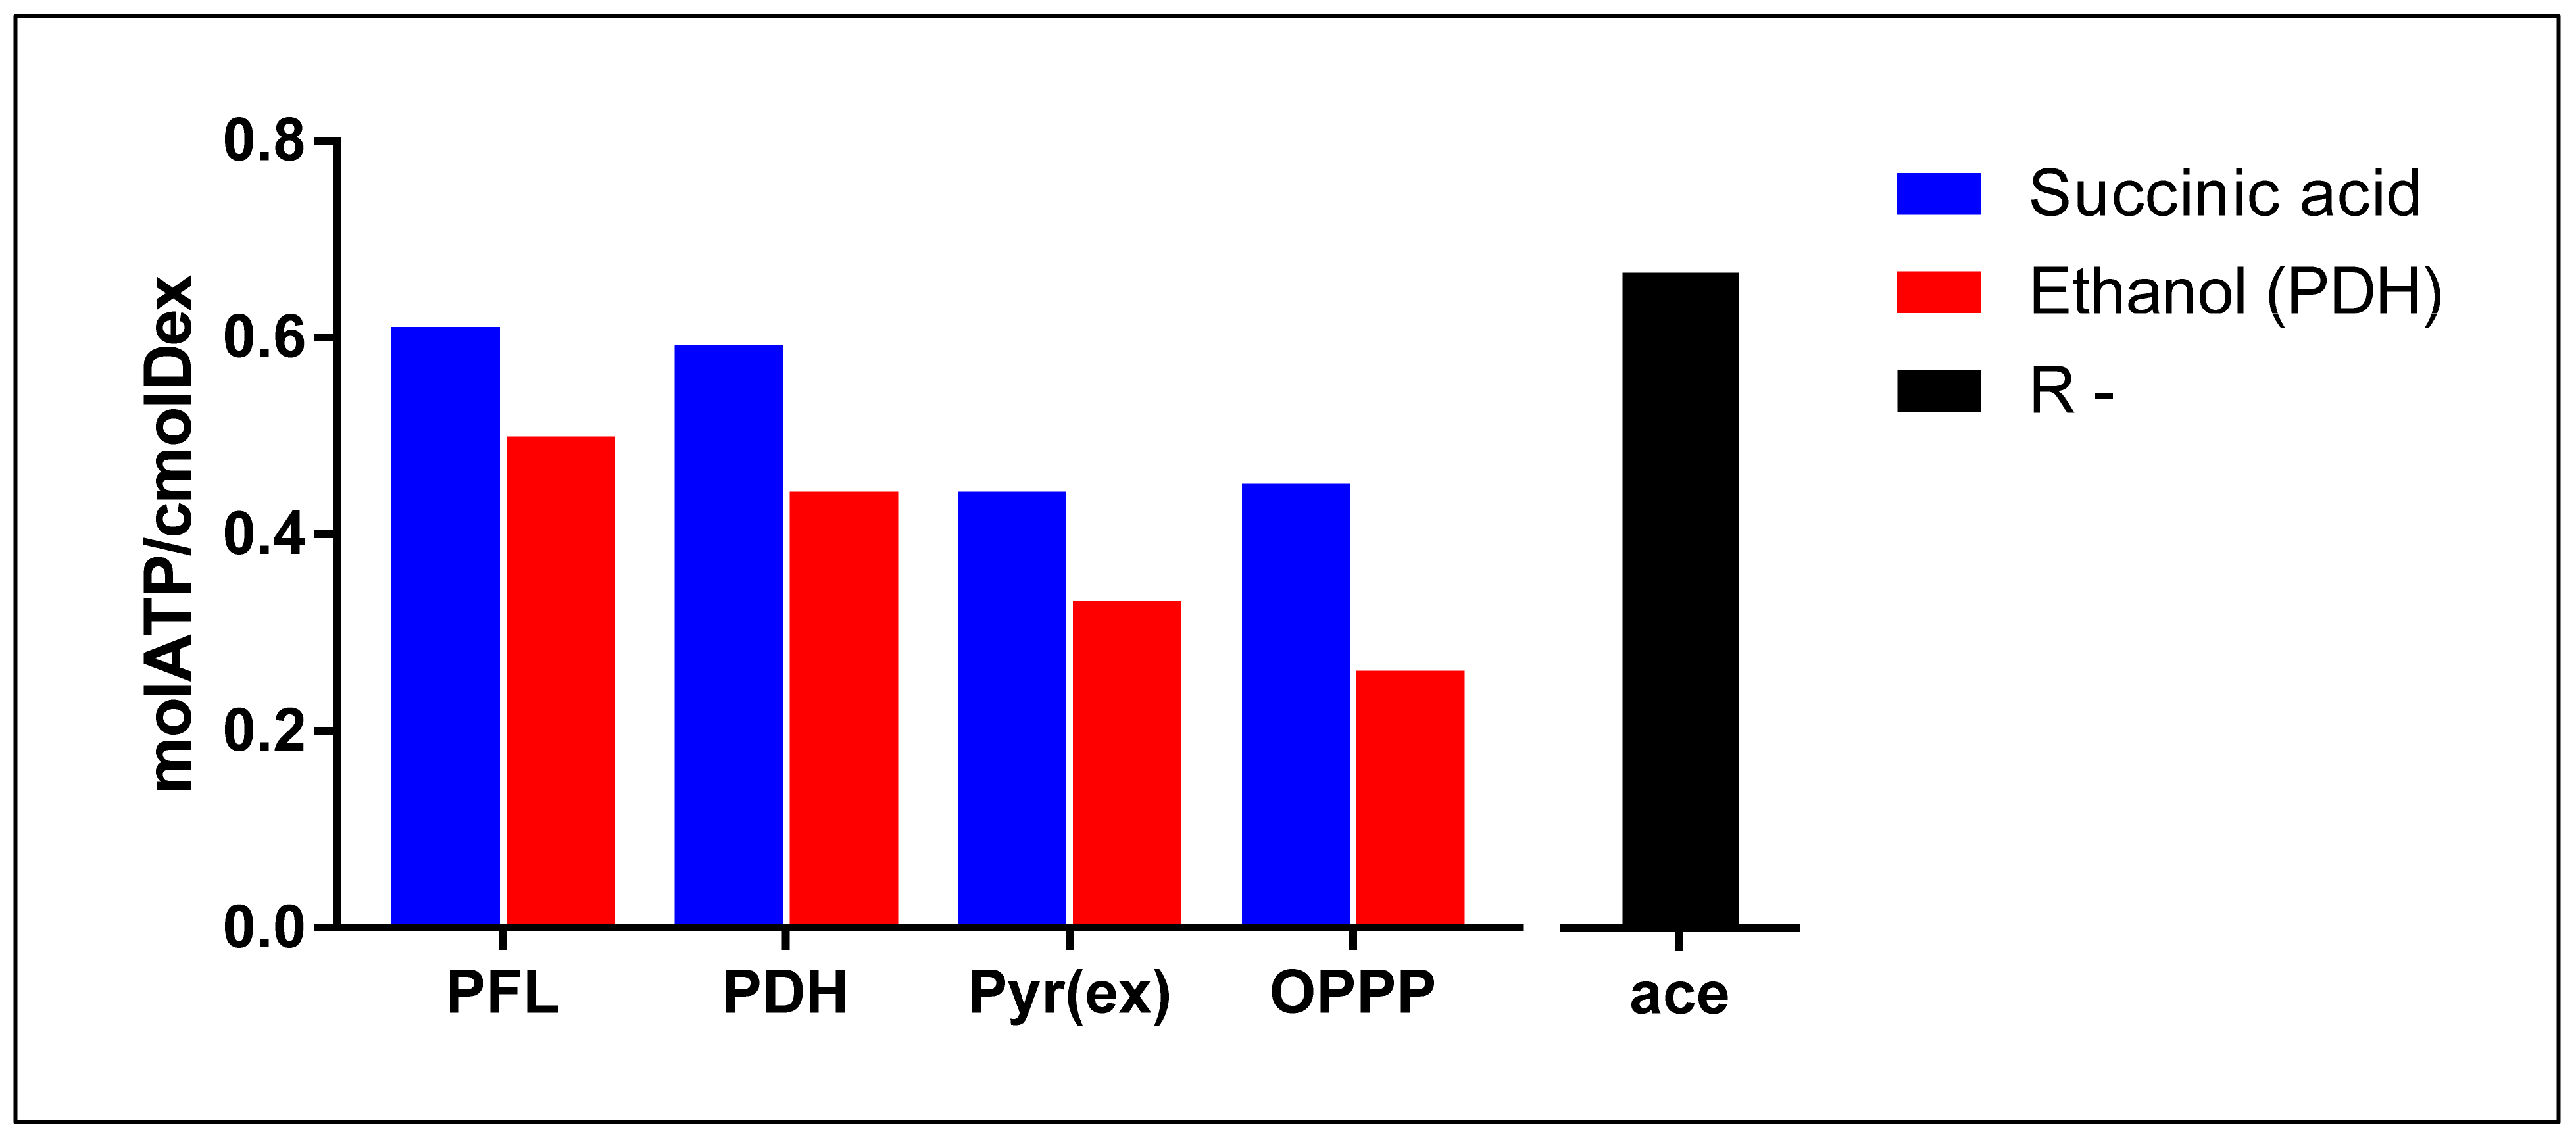
3.1. Theoretical Analysis of Energy Production Strategies
3.2. On Ethanol Production
3.3. Energy Extraction Pathway Relay
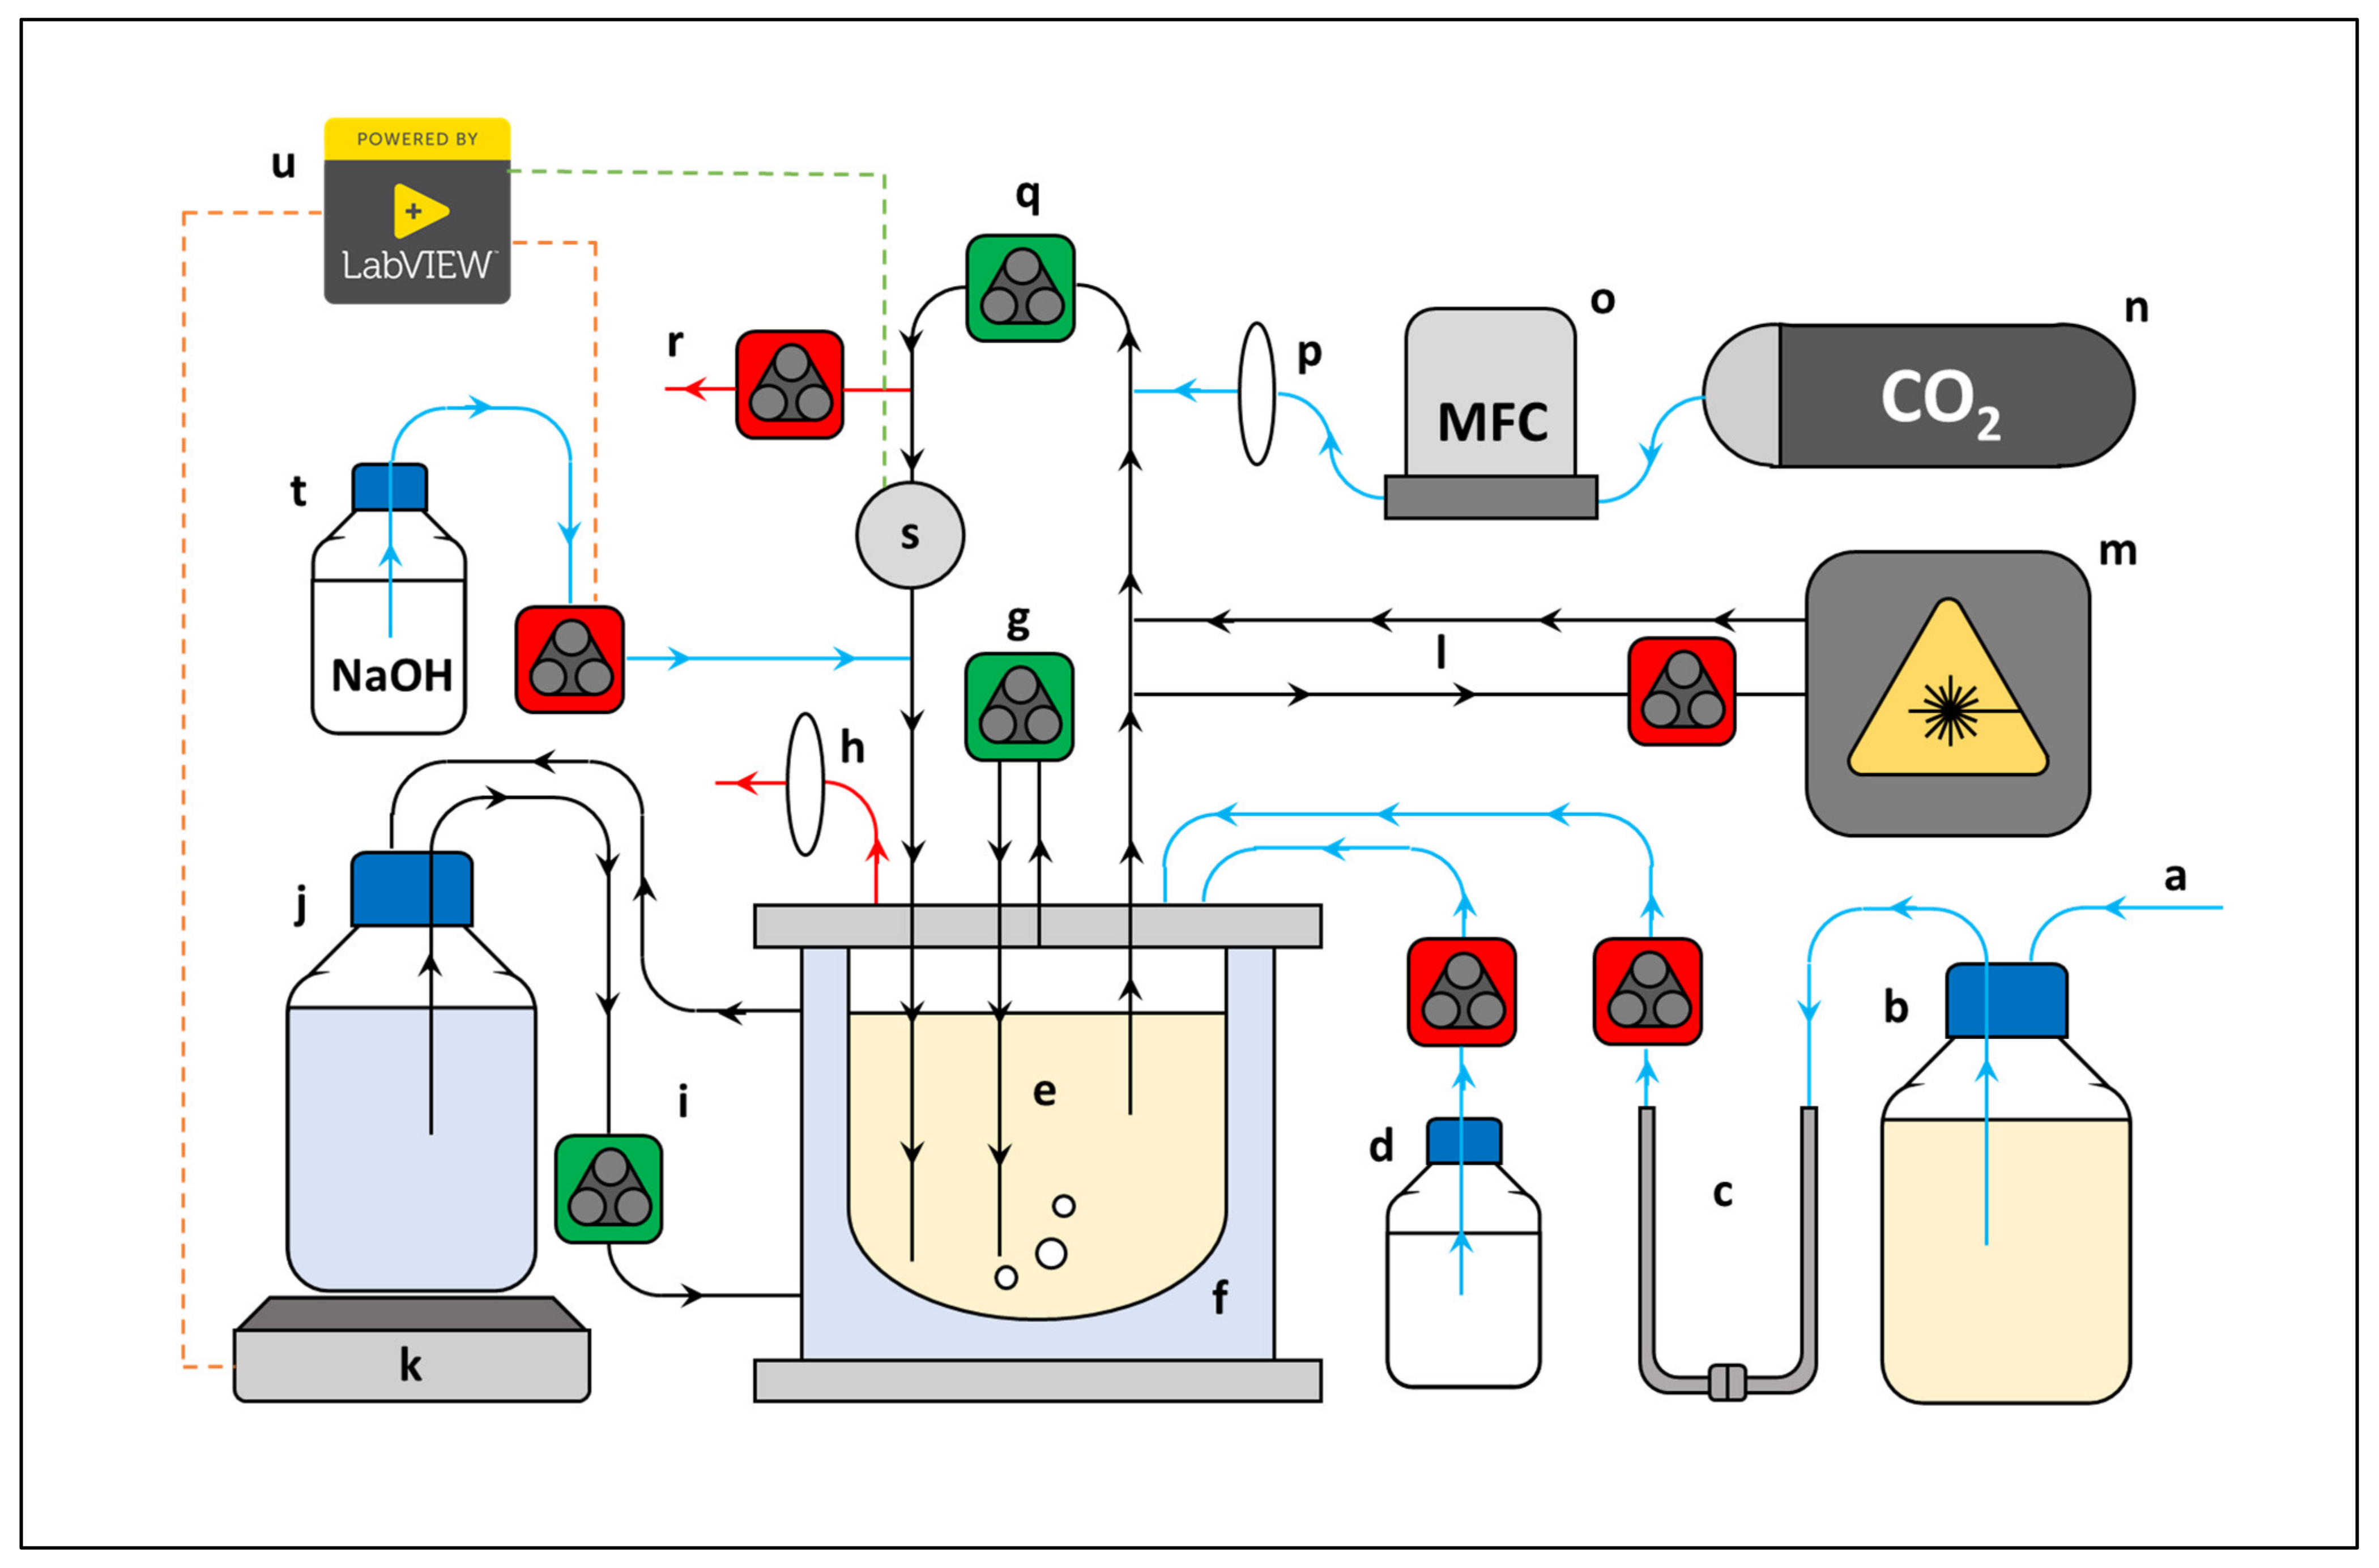
4. Materials and Methods
4.1. Culture
4.2. Growth Medium
4.3. Fermenter
4.4. Analytical Methods
4.5. Data Analysis
5. Conclusions
Author Contributions
Funding
Data Availability Statement
Conflicts of Interest
References
- Guettler, M.; Rumler, D.; Jain, M. Actinobacillus succinogenes sp. nov., a novel succinic-acid-producing strain from the bovine rumen. Int. J. Syst. Bacteriol. 1999, 49, 207–216. [Google Scholar] [CrossRef] [PubMed] [Green Version]
- Lin, S.K.C.; Du, C.; Koutinas, A.; Wang, R.; Webb, C. Substrate and product inhibition kinetics in succinic acid production by Actinobacillus succinogenes. Biochem. Eng. J. 2008, 41, 128–135. [Google Scholar] [CrossRef]
- McKinlay, J.B.; Laivenieks, M.; Schindler, B.D.; McKinlay, A.A.; Siddaramappa, S.; Challacombe, J.F.; Lowry, S.R.; Clum, A.; Lapidus, A.L.; Burkhart, K.B.; et al. A genomic perspective on the potential of Actinobacillus succinogenes for industrial succinate production. BMC Genom. 2010, 11, 680. [Google Scholar] [CrossRef] [PubMed] [Green Version]
- Global Maleic Anhydride Market Size Analysis Report, 2019–2025. Available online: https://www.grandviewresearch.com/industry-analysis/maleic-anhydride-market (accessed on 15 July 2021).
- Werpy, T.; Petersen, G.R. Top Value Added Chemicals from Biomass. Volume 1-Results of Screening for Potential Candidates from Sugars and Synthesis Gas; National Renewable Energy Laboratory: Golden, CO, USA, 2004. [Google Scholar]
- Bozell, J.J.; Petersen, G.R. Technology development for the production of biobased products from biorefinery carbohydrates—the US Department of Energy’s “Top 10” revisited. Green Chem. 2010, 12, 539–554. [Google Scholar] [CrossRef]
- Jiang, Z.; Cui, Z.; Zhu, Z.; Liu, Y.; Tang, Y.; Hou, J.; Qi, Q. Engineering of Yarrowia lipolytica transporters for high-efficient production of biobased succinic acid from glucose. Biotechnol. Biofuels. 2021, 14, 145. [Google Scholar] [CrossRef] [PubMed]
- Li, C.; Yang, X.; Gao, S.; Wang, H.; Lin, C.S.K. High efficiency succinic acid production from glycerol via in situ fibrous bed bioreactor with engineered Yarrowia lipolytica. Bioresour. Technol. 2017, 225, 9–16. [Google Scholar] [CrossRef] [PubMed]
- Yan, Q.; Zheng, P.; Dong, J.; Sun, Z. A finrpus bed bioreactor to improve the productivity of succinic acid by Actinobacillus succinogenes. J. Chem. Technol. Biotechnol. 2013, 89, 1760–1766. [Google Scholar] [CrossRef]
- Indera Luthfi, A.A.; Jahim, J.M.; Harun, S.; Tan, J.P.; Mohammad, A.W. Biorefinery approach towards greener succinic acid production from oil palm frond bagasse. Process Biochem. 2016, 51, 1527–1537. [Google Scholar] [CrossRef]
- Brink, H.G.; Nicol, W. Succinic acid production with Actinobacillus succinogenes: Rate and yield analysis of chemostat and biofilm cultures. Microb. Cell Fact. 2014, 13, 111. [Google Scholar] [CrossRef] [PubMed] [Green Version]
- Bradfield, M.F.A.; Nicol, W. The pentose phosphate pathway leads to enhanced succinic acid flux in biofilms of wild-type Actinobacillus succinogenes. Appl. Microbiol. Biotechnol. 2016, 100, 9641–9652. [Google Scholar] [CrossRef] [PubMed] [Green Version]
- Bradfield, M.F.A.; Nicol, W. Continuous succinic acid production by Actinobacillus succinogenes in a biofilm reactor: Steady-state metabolic flux variation. Biochem. Eng. J. 2014, 85, 1–7. [Google Scholar] [CrossRef] [Green Version]
- McKinlay, J.B.; Shachar-Hill, Y.; Zeikus, J.G.; Vieille, C. Determining Actinobacillus succinogenes metabolic pathways and fluxes by NMR and GC-MS analyses of 13C-labeled metabolic product isotopomers. Metab. Eng. 2007, 9, 177–192. [Google Scholar] [CrossRef] [PubMed]
- Park, D.H.; Zeikus, J.G. Utilization of electrically reduced neutral red by Actinobacillus succinogenes: Physiological function of neutral red in membrane-driven fumarate reduction and energy conservation. J. Bacteriol. 1999, 181, 2403–2410. [Google Scholar] [CrossRef] [PubMed] [Green Version]
- Herselman, J.; Bradfield, M.F.A.; Vijayan, U.; Nicol, W. The effect of carbon dioxide availability on succinic acid production with biofilms of Actinobacillus succinogenes. Biochem. Eng. J. 2017, 117, 218–228. [Google Scholar] [CrossRef] [Green Version]
- Villadsen, J.; Nielsen, J.; Lidén, G. Bioreaction Engineering Principles, 3rd ed.; Springer: New York, NY, USA, 2011; ISBN 978-1-4419-9687-9. [Google Scholar]
- Li, J.; Jiang, M.; Chen, K.-Q.; Ye, Q.; Shang, L.-A.; Wei, P.; Ying, H.-J.; Chang, H.-N. Effect of redox potential regulation on succinic acid production by Actinobacillus succinogenes. Bioprocess Biosyst. Eng. 2010, 33, 911–920. [Google Scholar] [CrossRef] [PubMed]
- Walter, A.; Gutknecht, J. Permeability of small nonelectrolytes through lipid bilayer membranes. J. Membr. Biol. 1986, 90, 207–217. [Google Scholar] [CrossRef] [PubMed]
- McKinlay, J.B.; Zeikus, J.G.; Vieille, C. Insights into Actinobacillus succinogenes fermentative metabolism in a chemically defined growth medium. Appl. Environ. Microbiol. 2005, 71, 6651–6656. [Google Scholar] [CrossRef] [PubMed] [Green Version]


| A–1 | A–2 | B–1 | B–2 | ||
|---|---|---|---|---|---|
| Succinic acid | g L−1 | 44.62 | 39.89 | 27.20 | 24.87 |
| R2 | 0.9978 | 0.9984 | 0.9987 | 0.9977 | |
| Pyruvic acid | g L−1 | 3.870 | 2.766 | 7.363 | 7.252 |
| R2 | 0.9863 | 0.9886 | 0.9980 | 0.9958 | |
| Acetic acid | g L−1 | 10.22 | 9.802 | 3.081 | 3.369 |
| R2 | 0.9645 | 0.9935 | 0.9737 | 0.9590 | |
| Formic acid | g L−1 | 3.604 | 3.145 | 1.312 | 1.577 |
| R2 | 0.9937 | 0.9985 | 0.9933 | 0.9945 | |
| Biomass | g L−1 | 3.272 | 3.300 | 2.640 | 2.700 |
| R2 | 0.9995 | 0.9976 | 0.9848 | 0.9888 | |
| Dextrose | g L−1 | 2.172 | 5.293 | 2.047 | 7.581 |
| R2 | 0.9949 | 0.9991 | 0.9996 | 0.9866 |
Publisher’s Note: MDPI stays neutral with regard to jurisdictional claims in published maps and institutional affiliations. |
© 2021 by the authors. Licensee MDPI, Basel, Switzerland. This article is an open access article distributed under the terms and conditions of the Creative Commons Attribution (CC BY) license (https://creativecommons.org/licenses/by/4.0/).
Share and Cite
Lexow, W.G.; Mokwatlo, S.C.; Brink, H.G.; Nicol, W. Identifying Energy Extraction Optimisation Strategies of Actinobacillus succinogenes. Catalysts 2021, 11, 1016. https://doi.org/10.3390/catal11081016
Lexow WG, Mokwatlo SC, Brink HG, Nicol W. Identifying Energy Extraction Optimisation Strategies of Actinobacillus succinogenes. Catalysts. 2021; 11(8):1016. https://doi.org/10.3390/catal11081016
Chicago/Turabian StyleLexow, Waldo Gideon, Sekgetho Charles Mokwatlo, Hendrik Gideon Brink, and Willie Nicol. 2021. "Identifying Energy Extraction Optimisation Strategies of Actinobacillus succinogenes" Catalysts 11, no. 8: 1016. https://doi.org/10.3390/catal11081016