Article

Modified Red Mud Catalyst for Volatile Organic Compounds Oxidation

by
Gaurav Pande
1,
Subramanian Selvakumar
2,
Carmen Ciotonea
2,
Jean-Marc Giraudon
2,
Jean-François Lamonier
2,* and
Vidya S. Batra
1,3,*
1
TERI School of Advanced Studies, 10 Institutional Area, Vasant Kunj, New Delhi 110070, India
2
Univ. Lille, CNRS, Centrale Lille, Univ. Artois, UMR 8181–UCCS–Unité de Catalyse et Chimie du Solide, F-59000 Lille, France
3
The Energy and Resources Institute (TERI), India Habitat Centre, Lodi Road, New Delhi 110003, India
*
Authors to whom correspondence should be addressed.
Catalysts 2021, 11(7), 838; https://doi.org/10.3390/catal11070838
Submission received: 13 June 2021 / Revised: 30 June 2021 / Accepted: 5 July 2021 / Published: 10 July 2021

Abstract

:
Red mud waste from the aluminium industry was modified by leaching using hydrochloric acid or oxalic acid with additives, followed by precipitation or evaporation. The prepared catalysts were characterized in detail and tested for toluene total oxidation. The samples prepared by precipitation of the leachate by adding a base gave a much better performance in catalytic oxidation than the ones prepared by just evaporating the leachate. These improved performances can be correlated to the enhanced textural and redox properties of the catalysts due to the better dispersion and higher enrichment of Fe oxides at their surface. The best performing catalyst had a light-off temperature of around 310 °C and complete oxidation took place at around 380 °C.

1. Introduction

Origins of outdoor Volatile Organic Compounds (VOCs) can be natural (e.g., forests, oceans) or have anthropogenic sources such as manufacturing and petrochemical industries and vehicular emissions [1]. Indoor sources include solvents, decorative, and building materials [2]. Whatever the source, VOCs removal is essential due to their detrimental effects on environment and human health. Many of them like benzene and toluene are carcinogenic [1]; they act as precursors for photochemical smog and also produce ozone, which is the secondary pollutant responsible for the production of photochemical smog.
Among the different methods of removal of VOCs, its catalytic oxidation has the advantage of being able to be carried out at much lower temperatures than flaring, thus reducing the power costs and also the possibility of production of NOx. The gases at the outlet are CO2 and H2O. One of the disadvantages of this method is the cost of the catalyst, which is often based on noble metals due to their high activity. Many transition metal-based catalysts such as cobalt, nickel, copper oxides, or mixed oxides have been examined for VOC oxidation [3,4]. Transition metal oxide catalysts are less prone to poisoning, deactivation, and are more easily regenerated compared to noble metal catalysts. Mixed metal oxides can be combined to obtain required properties. Ceria catalysts through the participation of lattice oxygen are active for VOC oxidation and have been widely studied; doping with other metals and incorporation of nano precious metals have been studied to improve the properties [5]. The studies on toluene oxidation with manganese oxide based bulk catalysts, supported catalysts, and nano catalysts have been recently reviewed [6]. Iron-based catalysts have also been studied [7,8,9], including those derived from waste sources [10,11].
Red mud is an iron rich waste from the aluminium industry. Due to its iron content, it has been examined in many catalytic reactions [12,13] including for VOC oxidation [14]. The use of red mud for in-situ catalytic fast pyrolysis of woody biomass led to improved bio oil quality [15]. Red mud has been prepared as a honeycomb monolith and was used for selective catalytic reduction of NOx [16]. Red mud has also been used as a support for catalysts such as Mn, Cu, and Ce oxides, where the iron oxide from red mud also contributed to the catalytic activity; Mn loaded on acid treated red mud showed good oxidation of toluene in the presence of ozone [17]. In order to improve the catalytic performance of red mud several treatments have been proposed. Acid treatment of red mud with hydrochloric acid or a mixture of hydrochloric and phosphoric acid has been used in many studies with different red mud compositions to increase surface area, iron content, and to reduce alkali compounds [17,18,19]. Oxalic acid has been used in many studies for iron oxide removal from ceramic materials such as clays, silica due to its efficiency in dissolving iron oxides [20]. Oxalic acid has also been used for iron removal from red mud; the dissolved Fe (III) oxalate could be precipitated as Fe (II) oxalate using UV irradiation [21].
In this study, modified red mud has been examined for VOC catalytic removal. Red mud has been modified by leaching with (a) oxalic acid combined with l-ascorbic acid and (b) hydrochloric acid and compared with unmodified red mud for toluene oxidation. Toluene has been chosen as a VOC model because toluene is a constituent of unleaded gasoline and replaced tetramethyl lead in order to improve the octane rating. As a result, toluene is emitted during the vaporization of gasoline (petrol station, fuel transport, and storage) and is present in the vehicle exhaust gases (unburned products). Toluene is also found in industrial exhaust when used as a solvent or produced in the incineration processes.

2. Results and Discussions

The bulk composition in terms of the major constituents Al and Fe are given in Table 1. RM-500 is the unmodified red mud calcined at 500 °C. The modified samples obtained after leaching, followed by evaporation and calcination at 500 °C are RME1-500 with HCl leaching and RME2-500 with oxalic acid and l-ascorbic acid leaching. The samples modified by leaching, followed by precipitation and calcination, are RMP1-500 with HCl leaching and RMP2-500 with oxalic acid and l-ascorbic acid leaching.
It is observed that compared to the starting red mud, the modified samples have higher content of iron and aluminium. This has been observed in other studies where similar treatment has been done [18]. The exception is RME1-500, where the iron content is low. The precipitated samples have higher content of iron compared to the evaporated samples. During the dissolution in acid, it is expected that in addition to iron, other compounds (with the exception of silica) also go into the solution. During precipitation, iron is preferentially precipitated while other compounds stay in the solution. During evaporation, the other compounds are also incorporated in the solid, which could account for the lower iron content for the evaporated samples in comparison with the precipitated samples. The lower content of iron in RME1-500 appears to be due to a higher amount of aluminium and possible sodium that has gone into the solution in HCl leachate. It has been observed in the process of iron recovery from red mud that washing with HCl removed a considerable amount of sodium, which was more than the sodium released during leaching with oxalic acid [22].
In the first part, the modified red mud obtained by the evaporation method is examined, while in the second part, the modified red mud obtained by the precipitation method is discussed.

2.1. Evaporated Samples

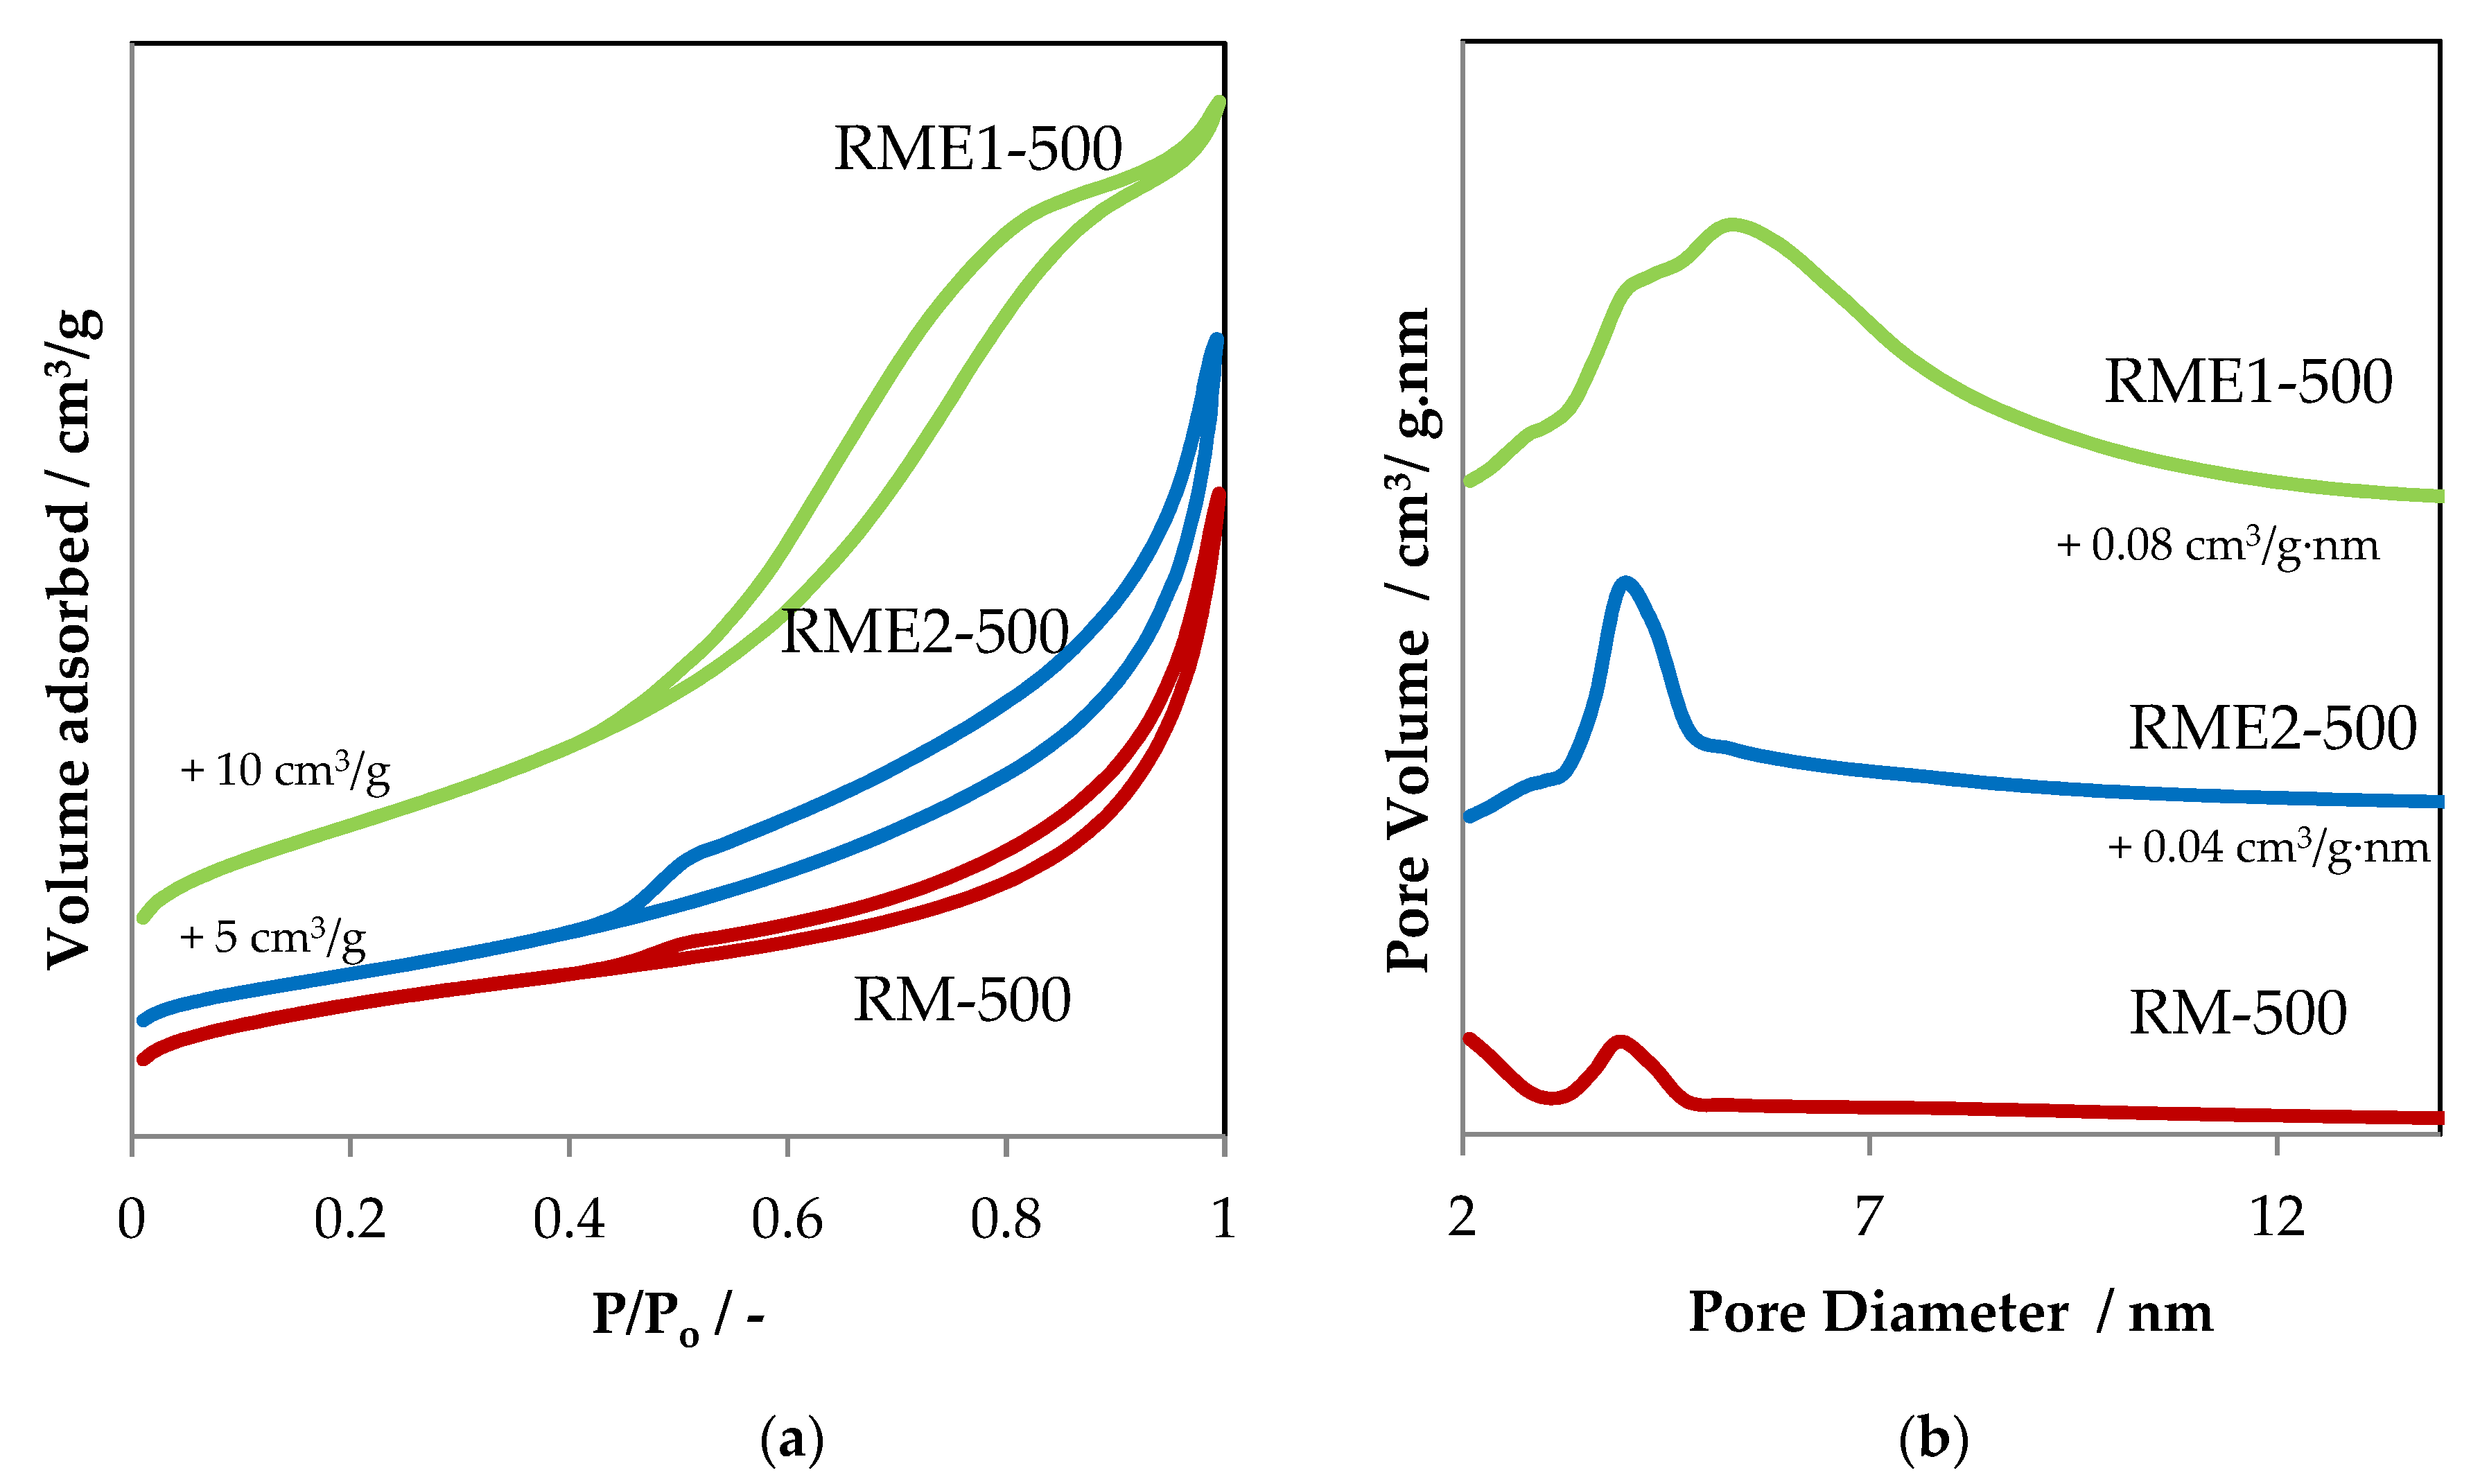
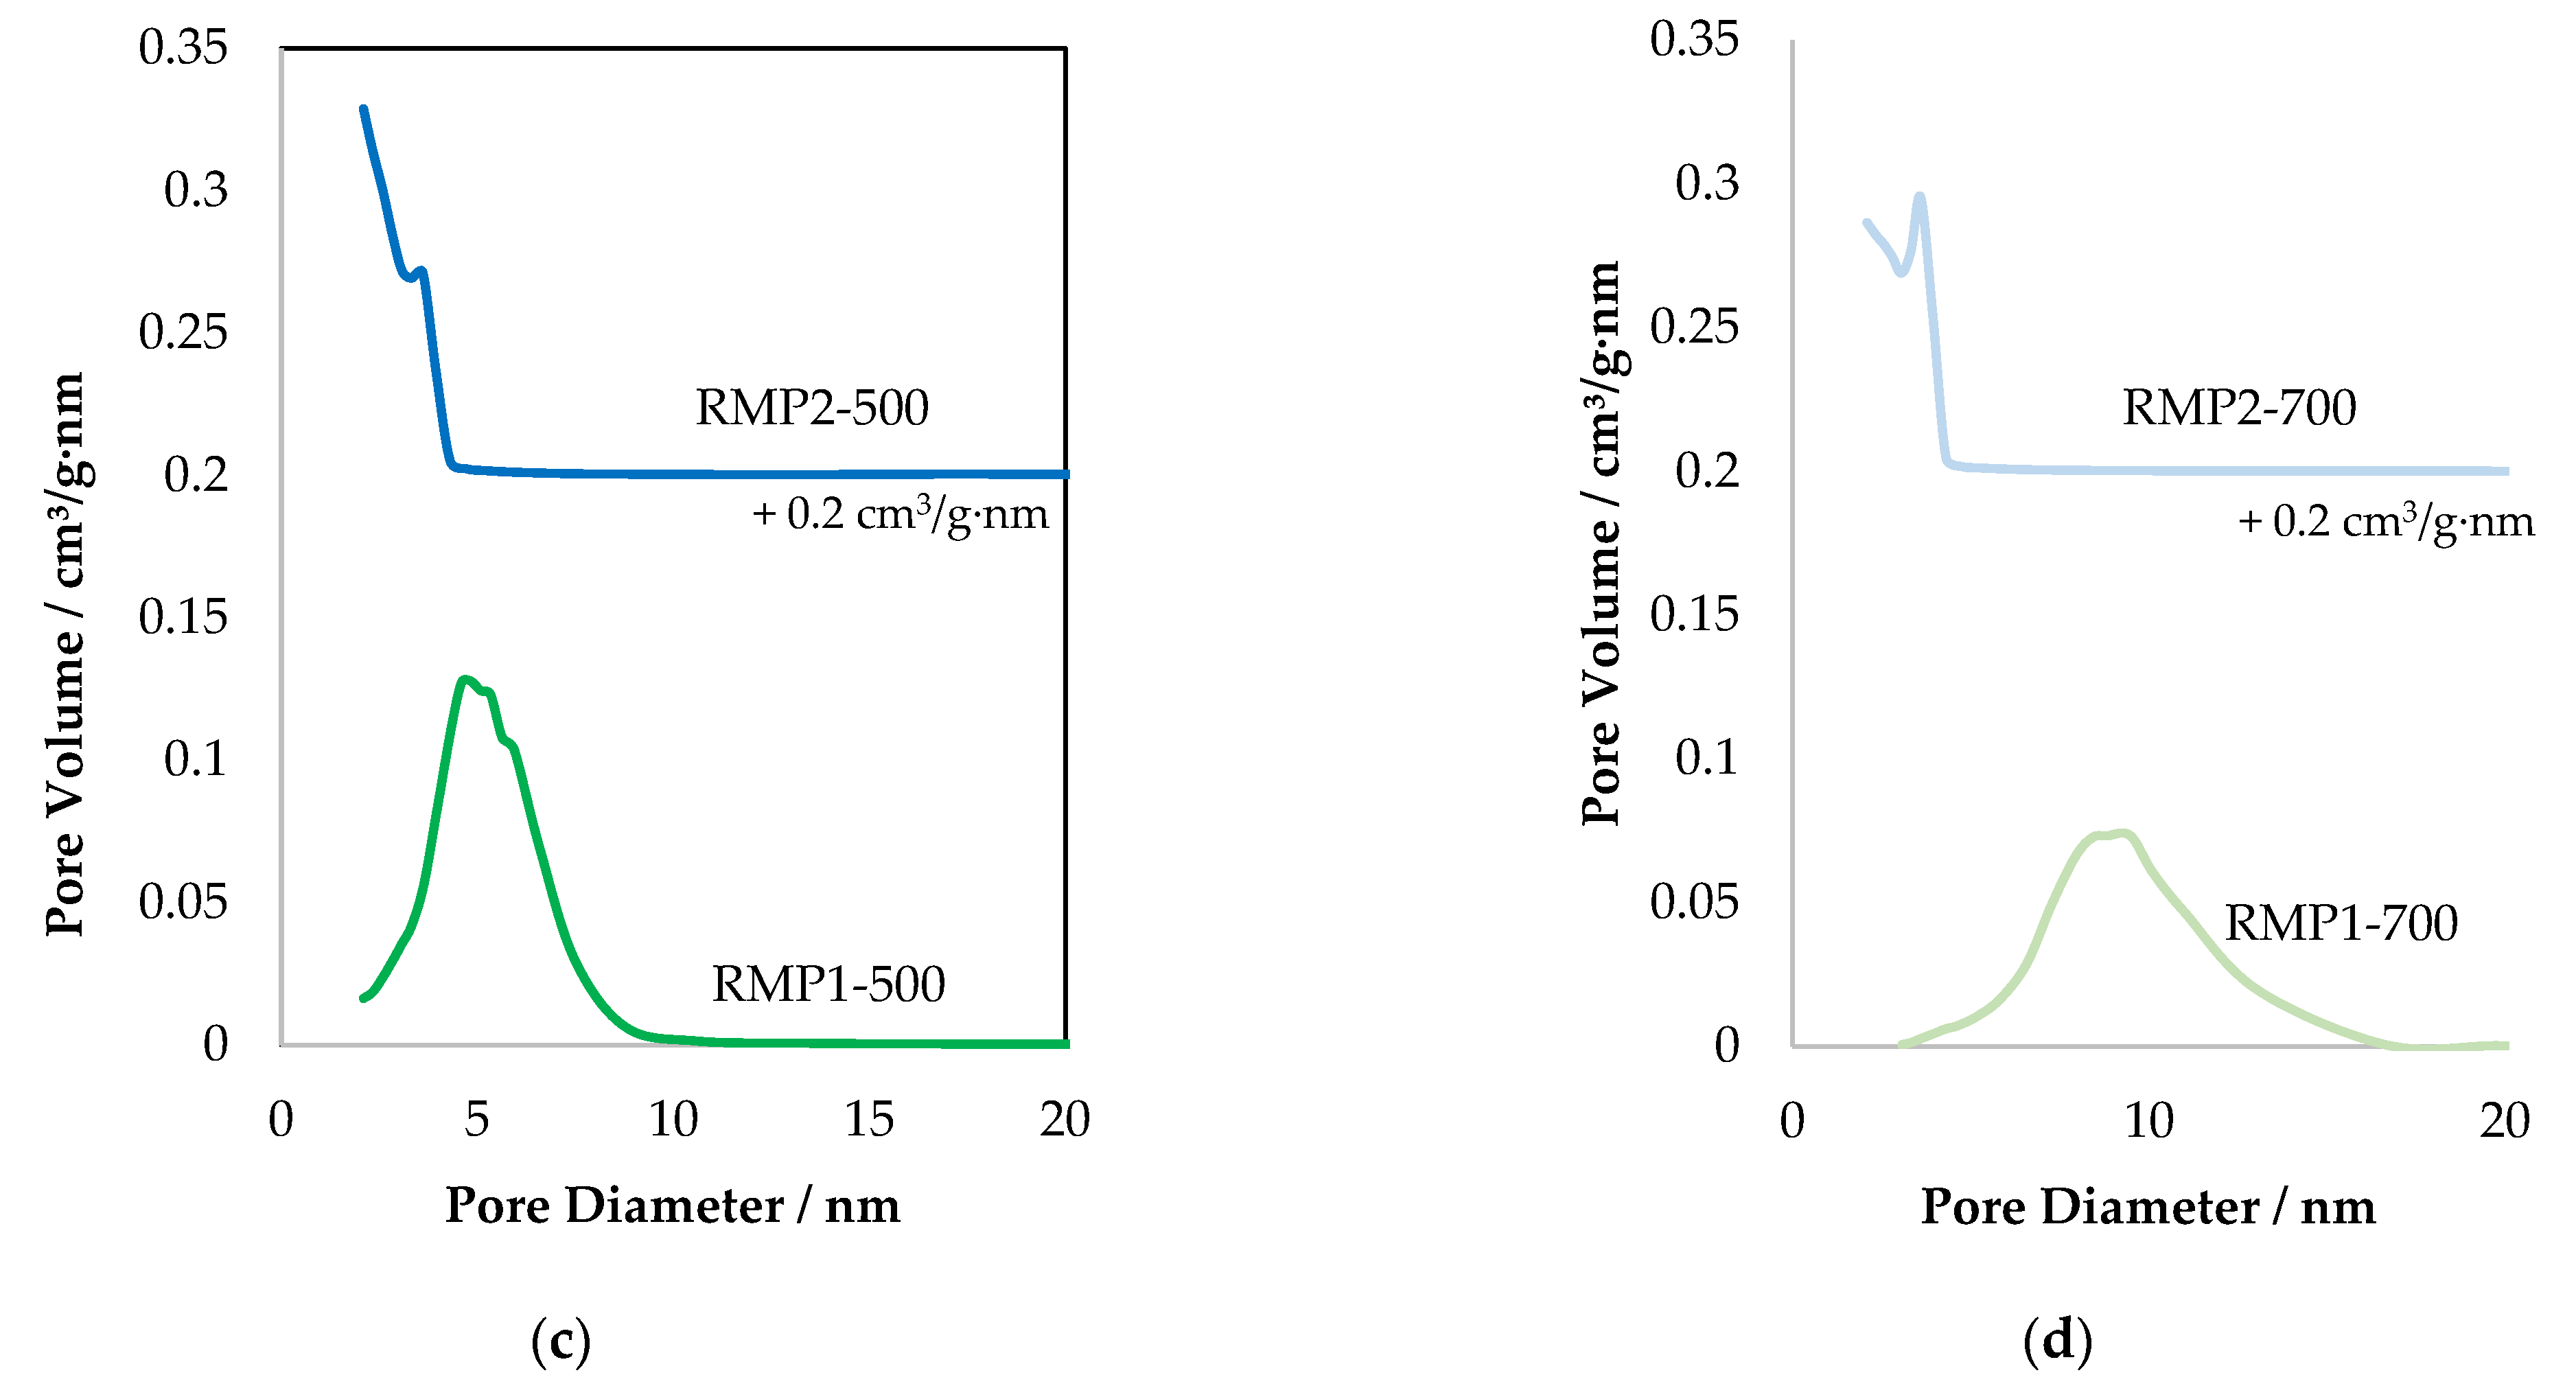
2.1.1. Textural Properties

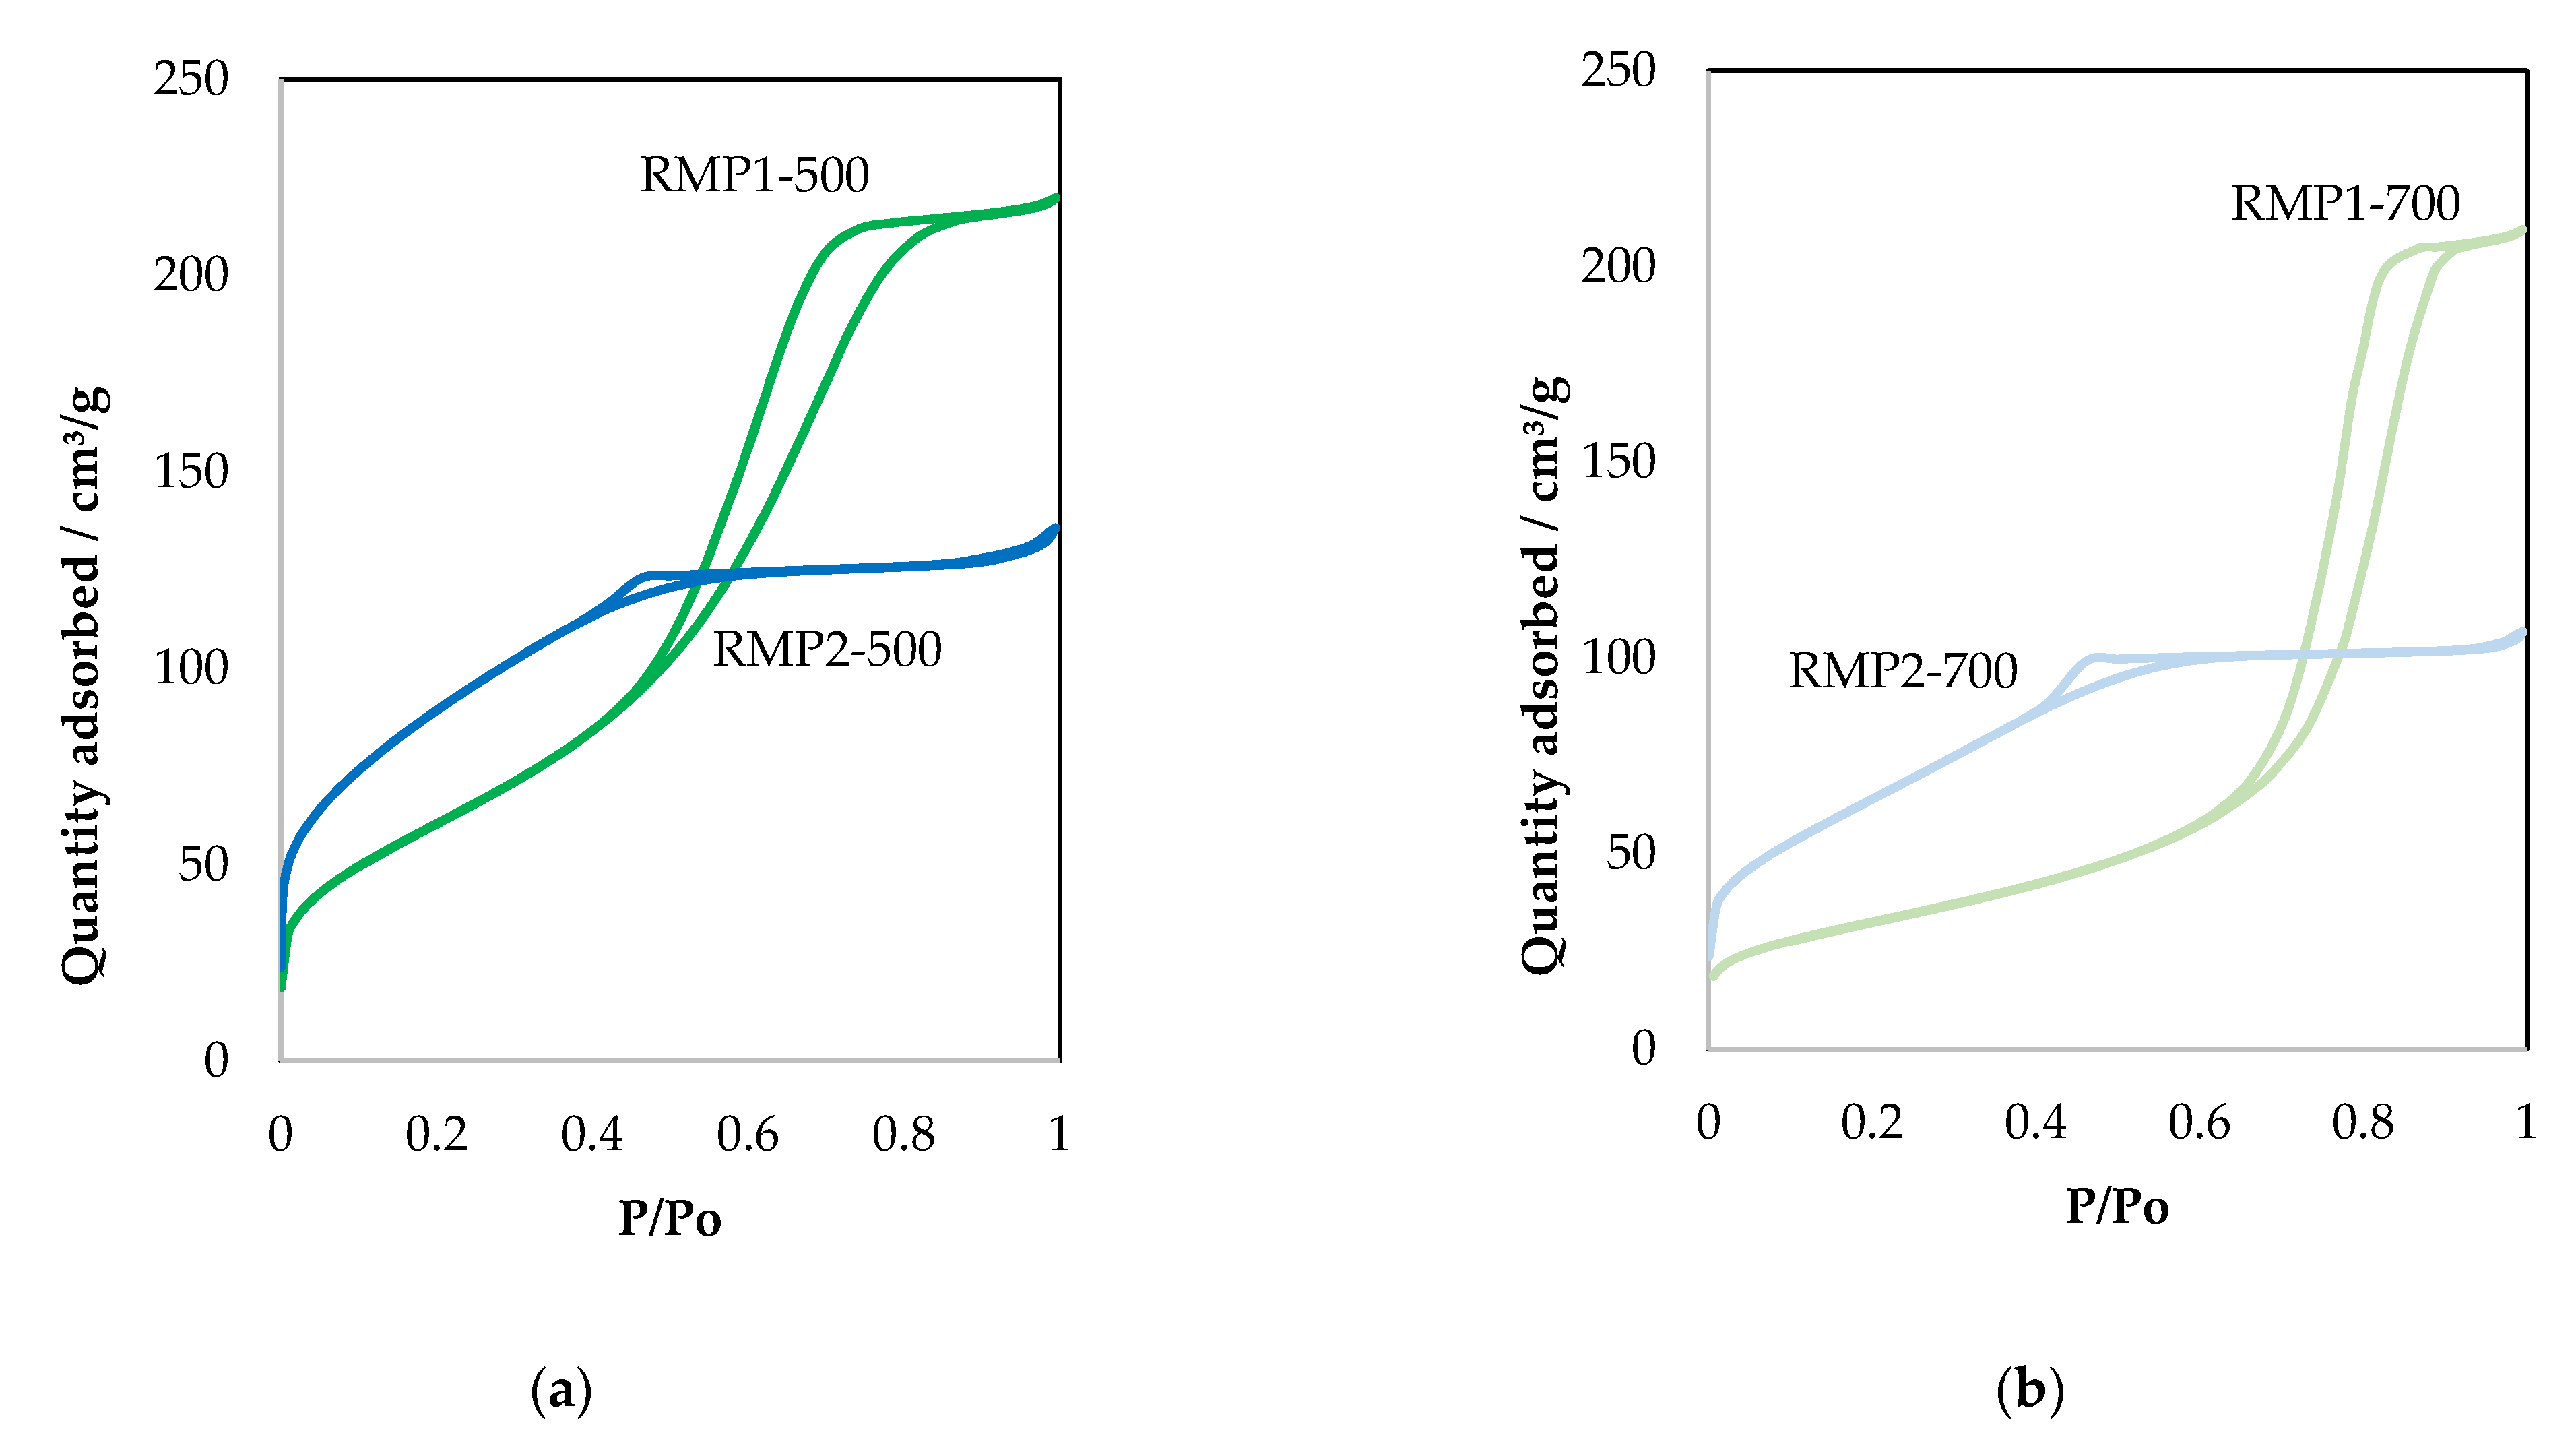
Figure 1a,b show the N2 adsorption–desorption isotherms and the corresponding pore size distributions for the evaporated samples, together with the parent calcined red mud. Data from N2 physisorption analyses are given in Table 2.
RM-500 and RME2-500 samples exhibit similar types of isotherm shape and hysteresis loop. The shape is close to type II isotherm with a slow increase in the first half of the N2 adsorption curve, followed by a sharp increase in the second half of the isotherm. This type is shown by materials which are either non-porous or macro-porous. Additionally, the hysteresis loop matches the H3 hysteresis type, indicating the presence of small amounts of mesopores originating probably from aggregation of particles. The evaporated sample RME2-500 shows a minor decrease in specific surface area (SSA) and increase in total pore volume in comparison to RM-500 (Table 2). The pore size distribution curves exhibit a narrow peak centered at around 4 nm (Figure 1b), indicating the good homogeneous distribution of the mesopores in both samples. The leaching with oxalic acid and l-ascorbic acid, followed by evaporation and calcination steps, do not lead to a profound modification in textural properties. Interestingly the evaporated sample RME1-500 shows a marginal increase in SSA and total pore volume compared to that of RM-500. The isotherm of the RME1-500 material is type IV and when the relative pressure exceeds a certain value, the adsorption isotherm tends to level off. The pore size distribution of the RME1-500 material is broad in comparison with that of the RM-500 and RME2-500 samples. Then the leaching with hydrochloric acid following by evaporation and calcination steps seems to open the porosity of the material. This can be explained by a rearrangement of the aggregates forming the particles.

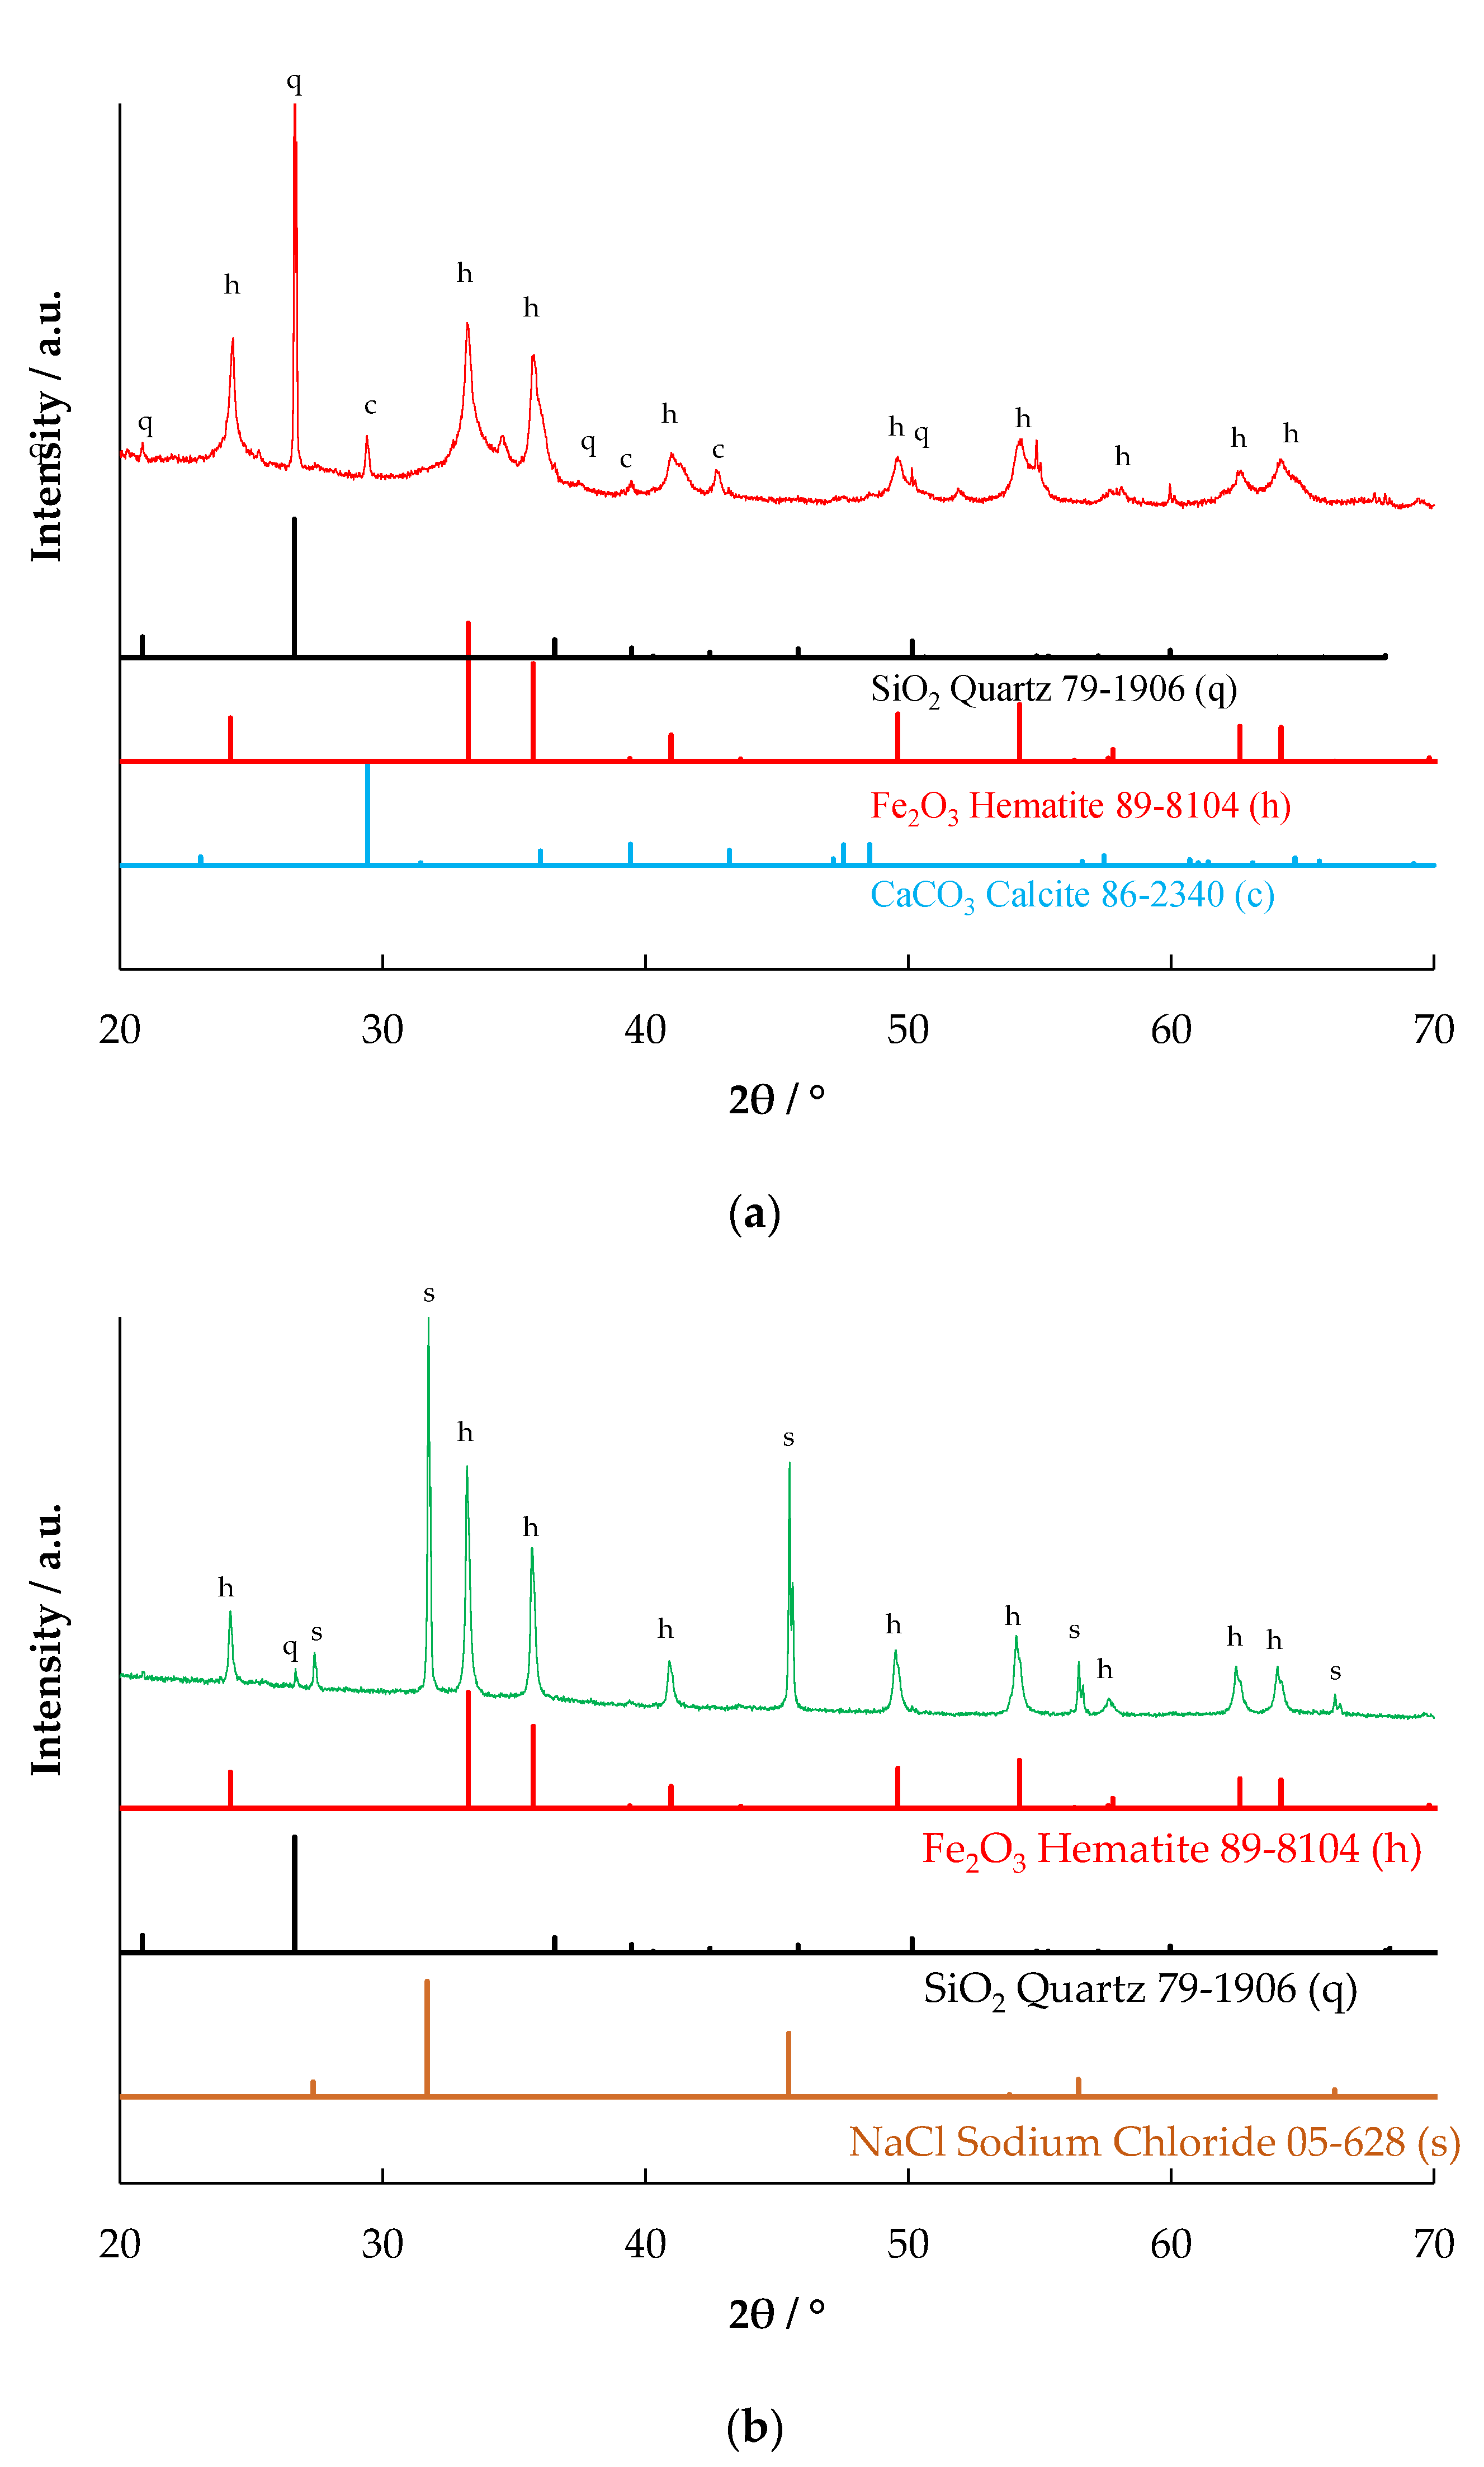
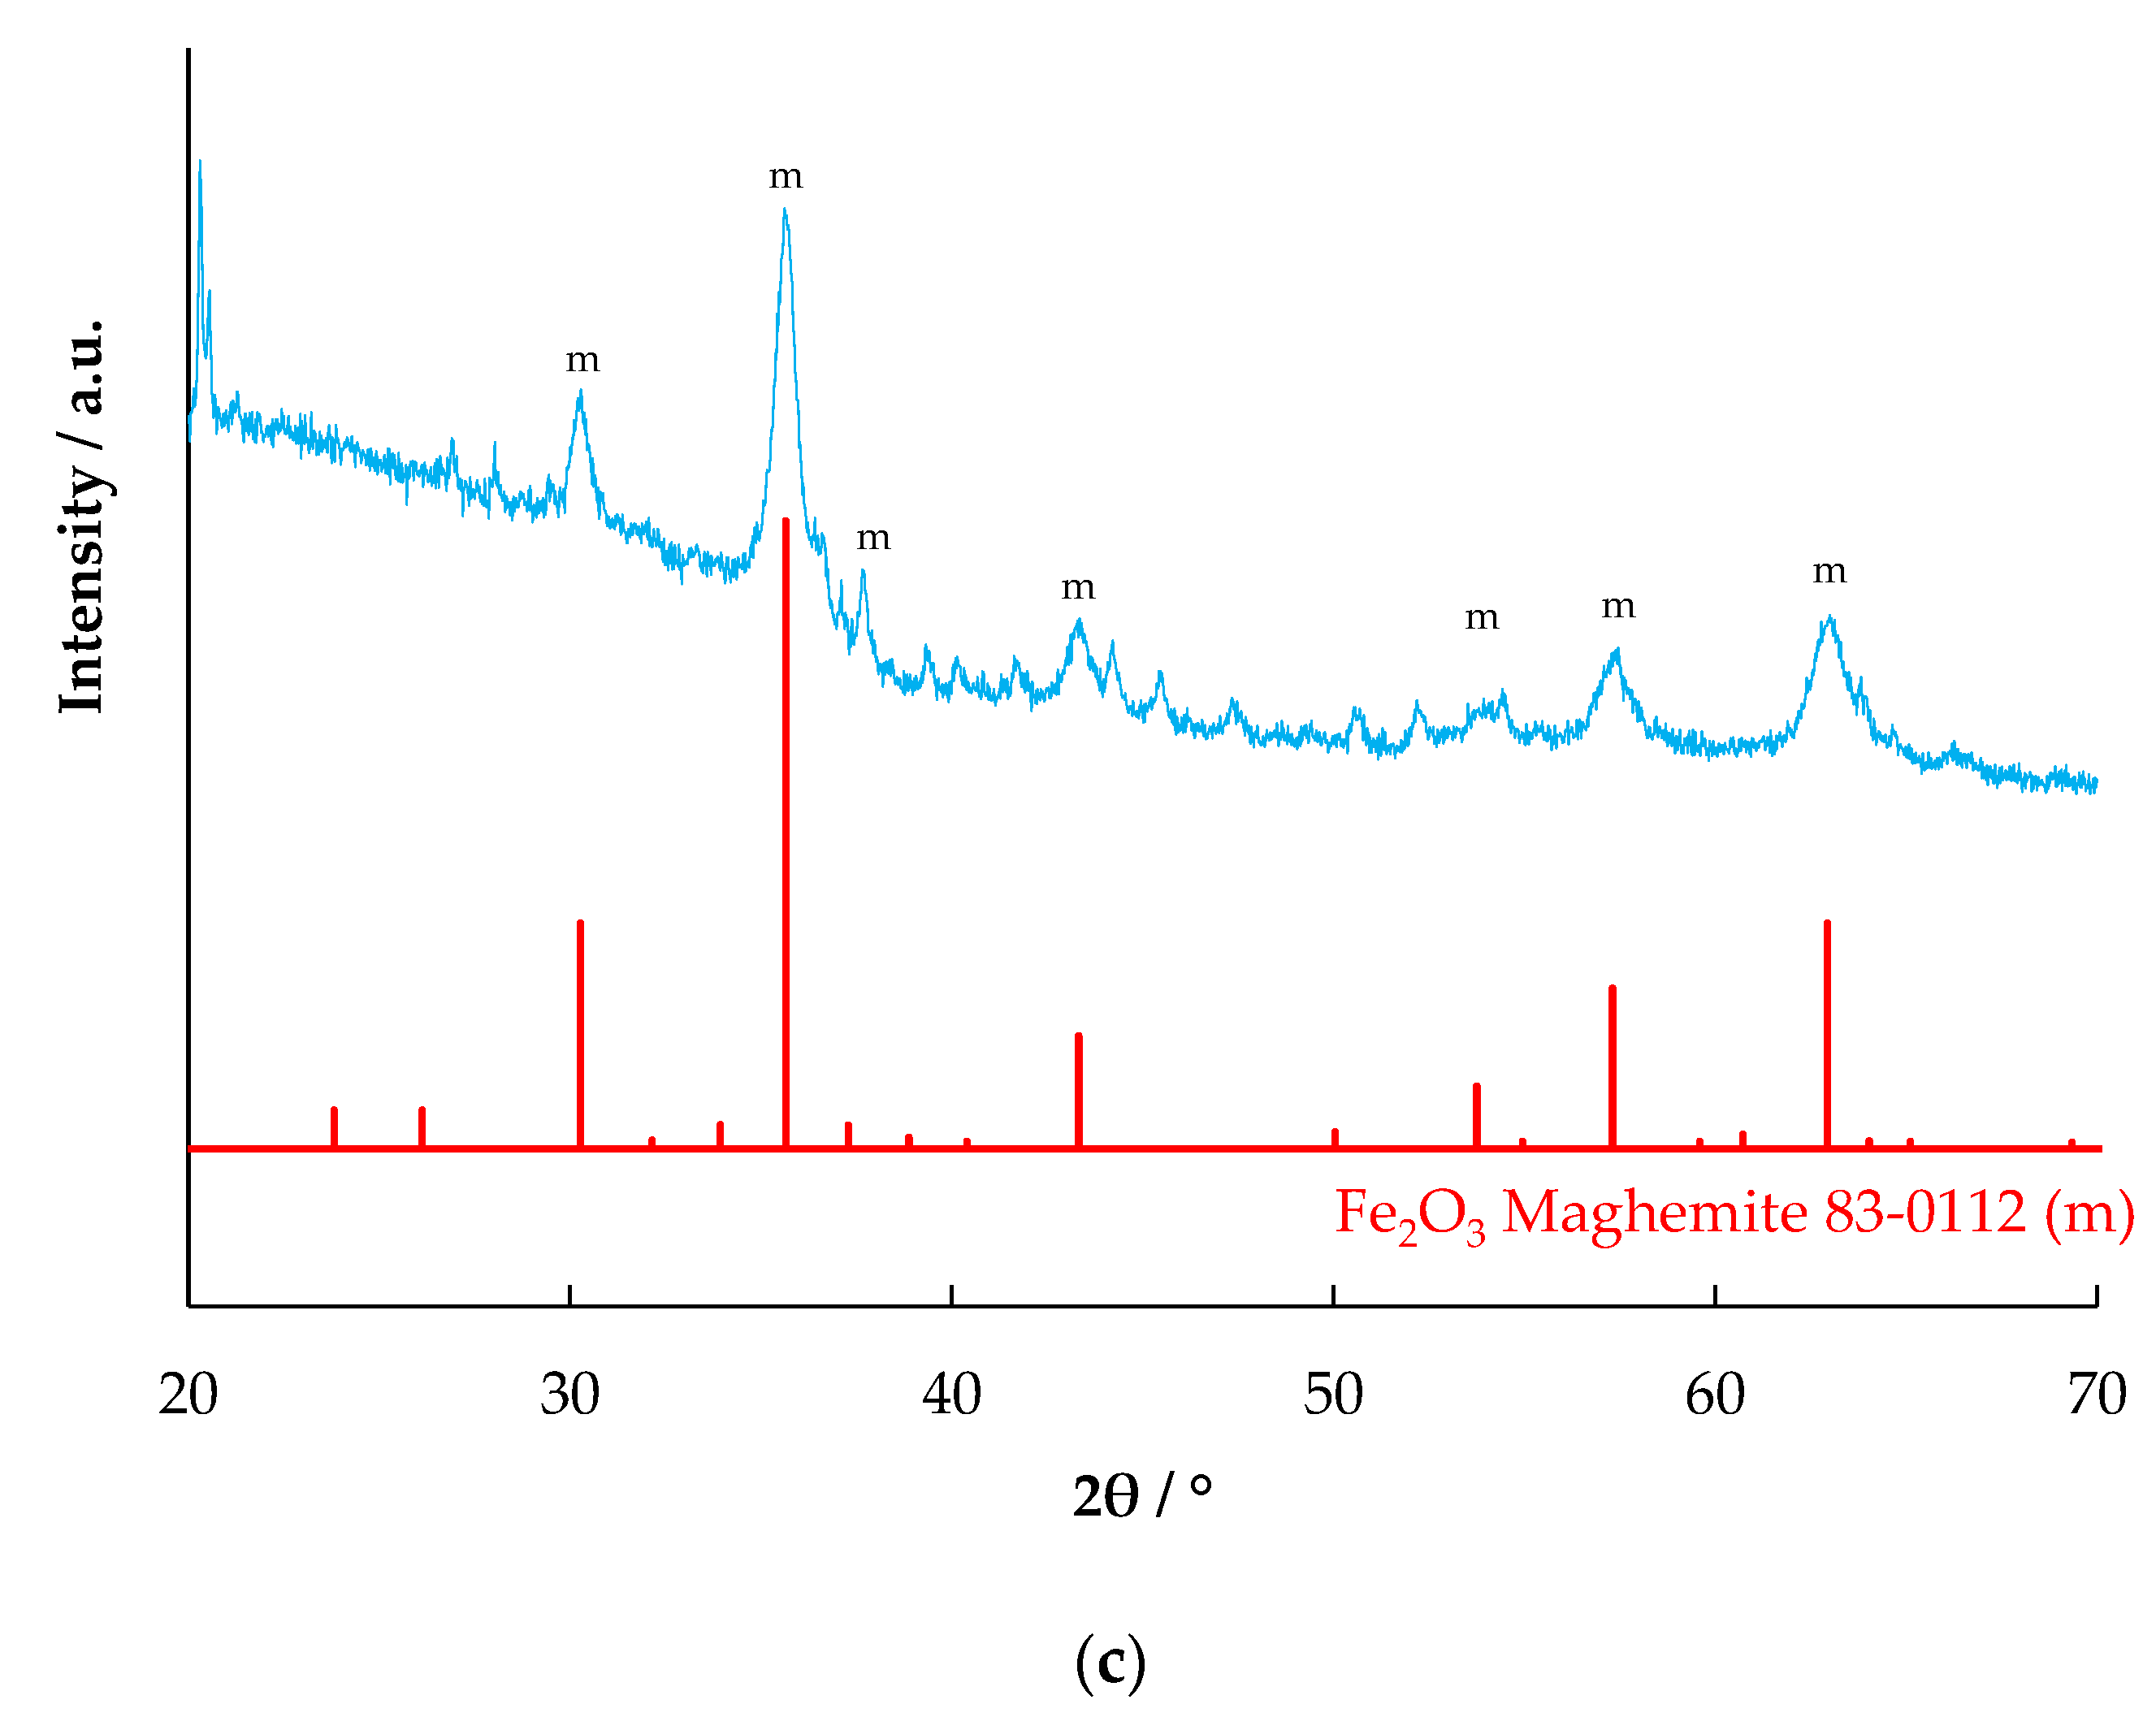
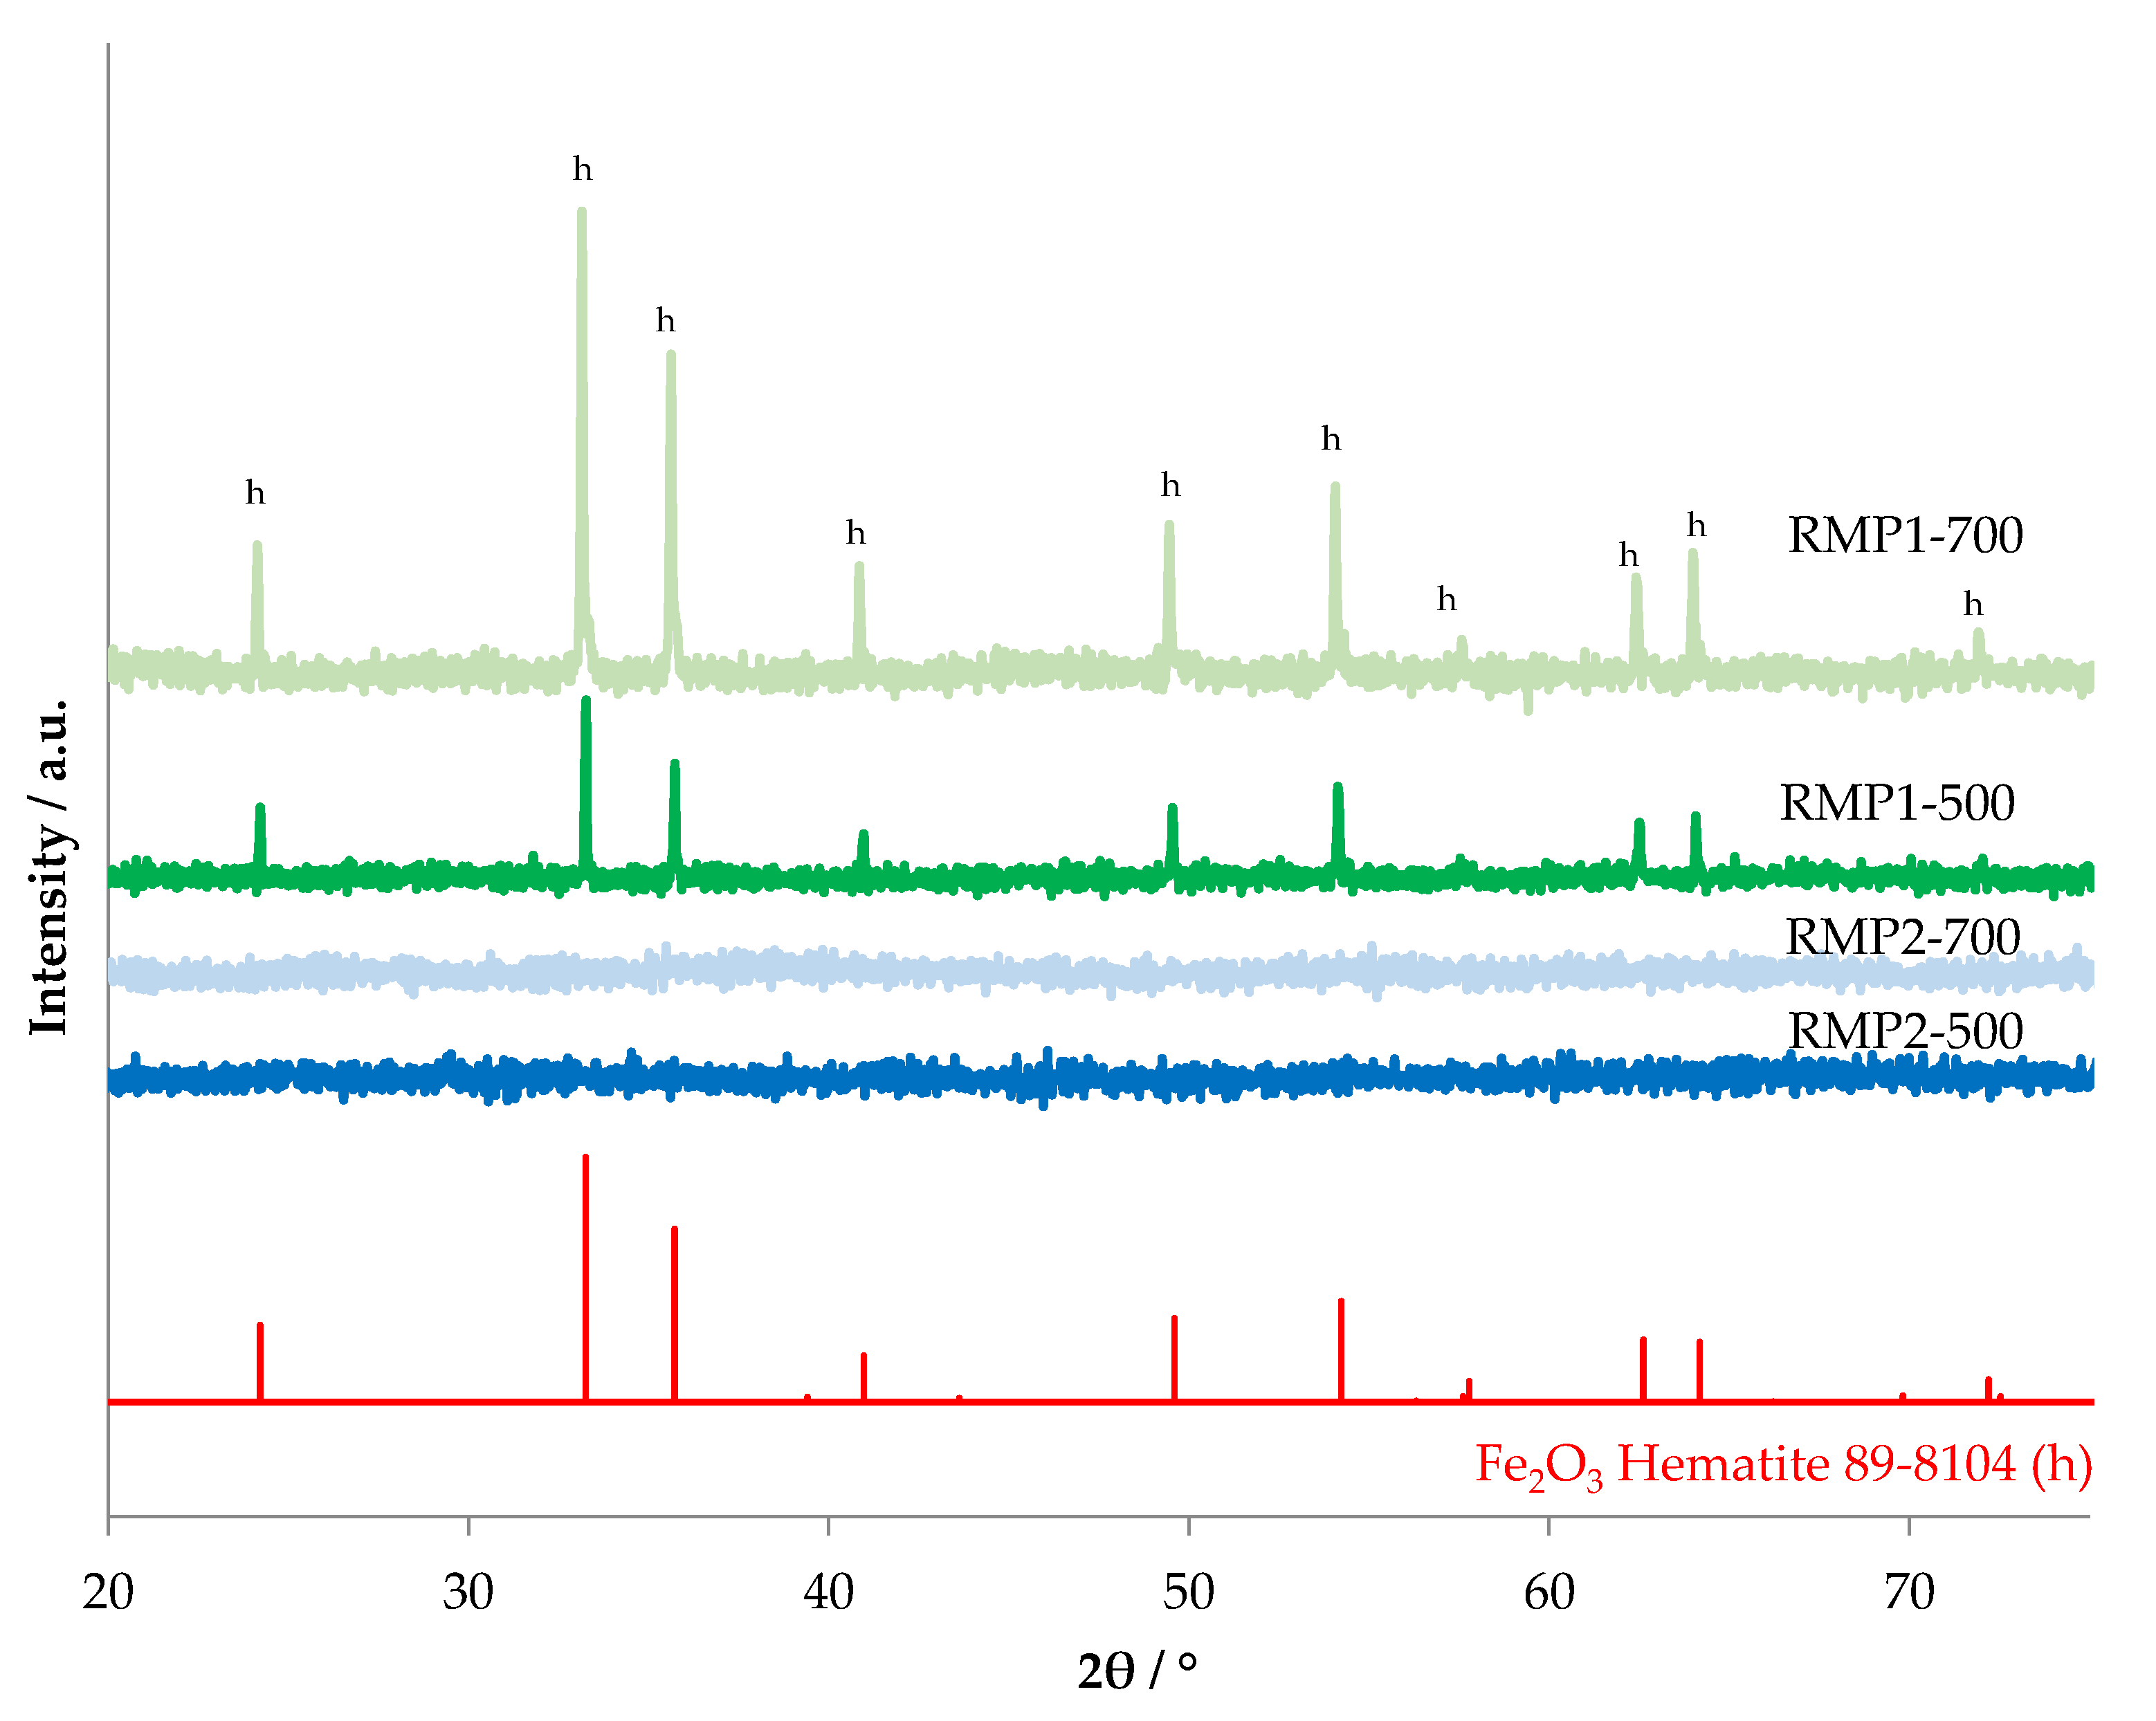
2.1.2. Bulk and Surface Compositions

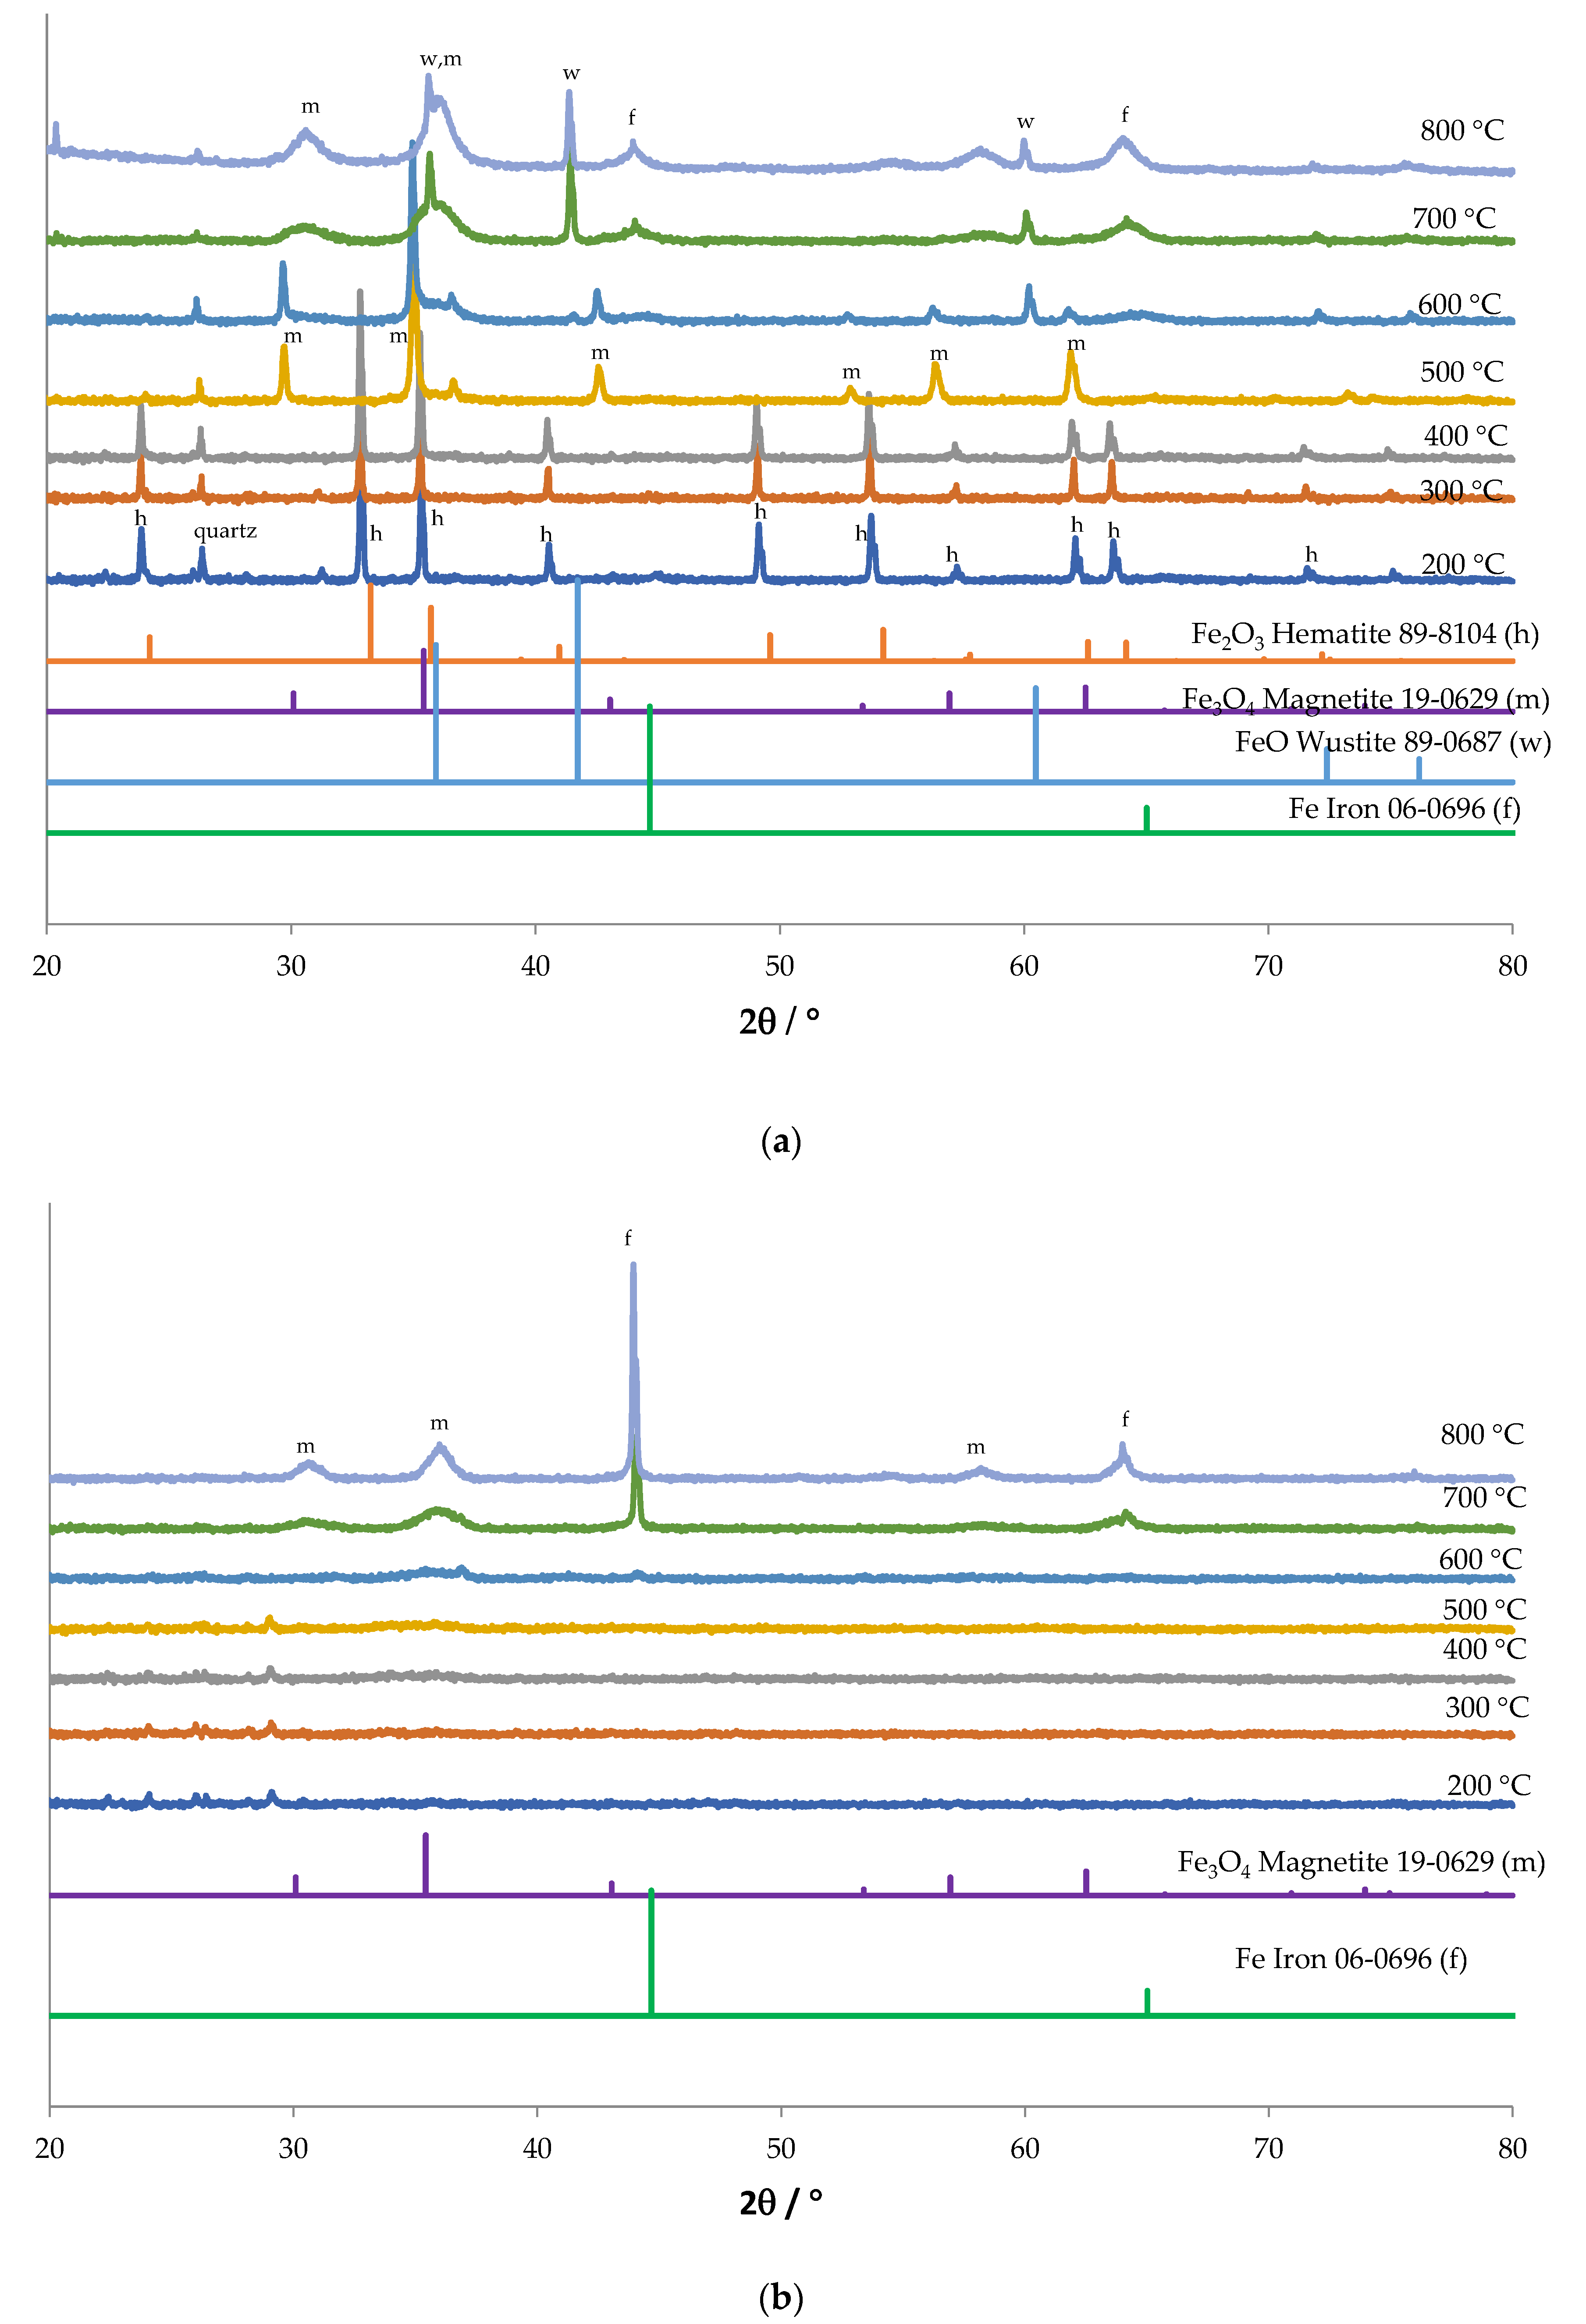
The X-ray diffraction patterns of the red mud and the evaporated samples are shown in Figure 2. The XRD pattern of the RM-500 sample (Figure 2a) matches the main combination of two standard patterns of JCPDS 89-8104 (Hematite α-Fe2O3) and JCPDS 79-1906 (Quartz SiO2). It also has peaks of JCPDS 86-2340 (Calcite, CaCO3). The XRD pattern of the RME1-500 sample (Figure 2b) matches the similar combination of the two previous standard patterns, hematite α-Fe2O3 and quartz SiO2. However, in comparison with α-Fe2O3, the proportion of SiO2 phase is significant lower, which is expected from the leaching. In addition, the sample also appears to have sodium chloride (JCPDS 5-628), which is expected from the leaching of red mud in HCl. The identified major mineral phase in the RME2-500 sample (Figure 2c) is maghemite (γ-Fe2O3) (JCPDS 83-0112). Magnetite also has similar peaks but is not likely to be present under the conditions of leaching of the red mud with oxalic acid and l-ascorbic acid, followed by evaporation and calcination at 500 °C. The presence of l-ascorbic acid reduces Fe (III) to Fe (II) and improves leaching in oxalic acid, leading to the formation of ferrous oxalate [23]. The ferrous oxalate depending on the temperature, atmosphere, and time of calcination, can form magnetite, maghemite, or haematite [24,25]; at 500 °C, magnetite forms only at low oxygen partial pressures [26]. Under the conditions of calcination carried out, haematite is expected. However, due to the presence of reducing conditions from CO arising from oxalate decomposition, maghemite could have formed. No peaks matching with aluminium compounds were observed, which could be due to their small size or amorphous nature.
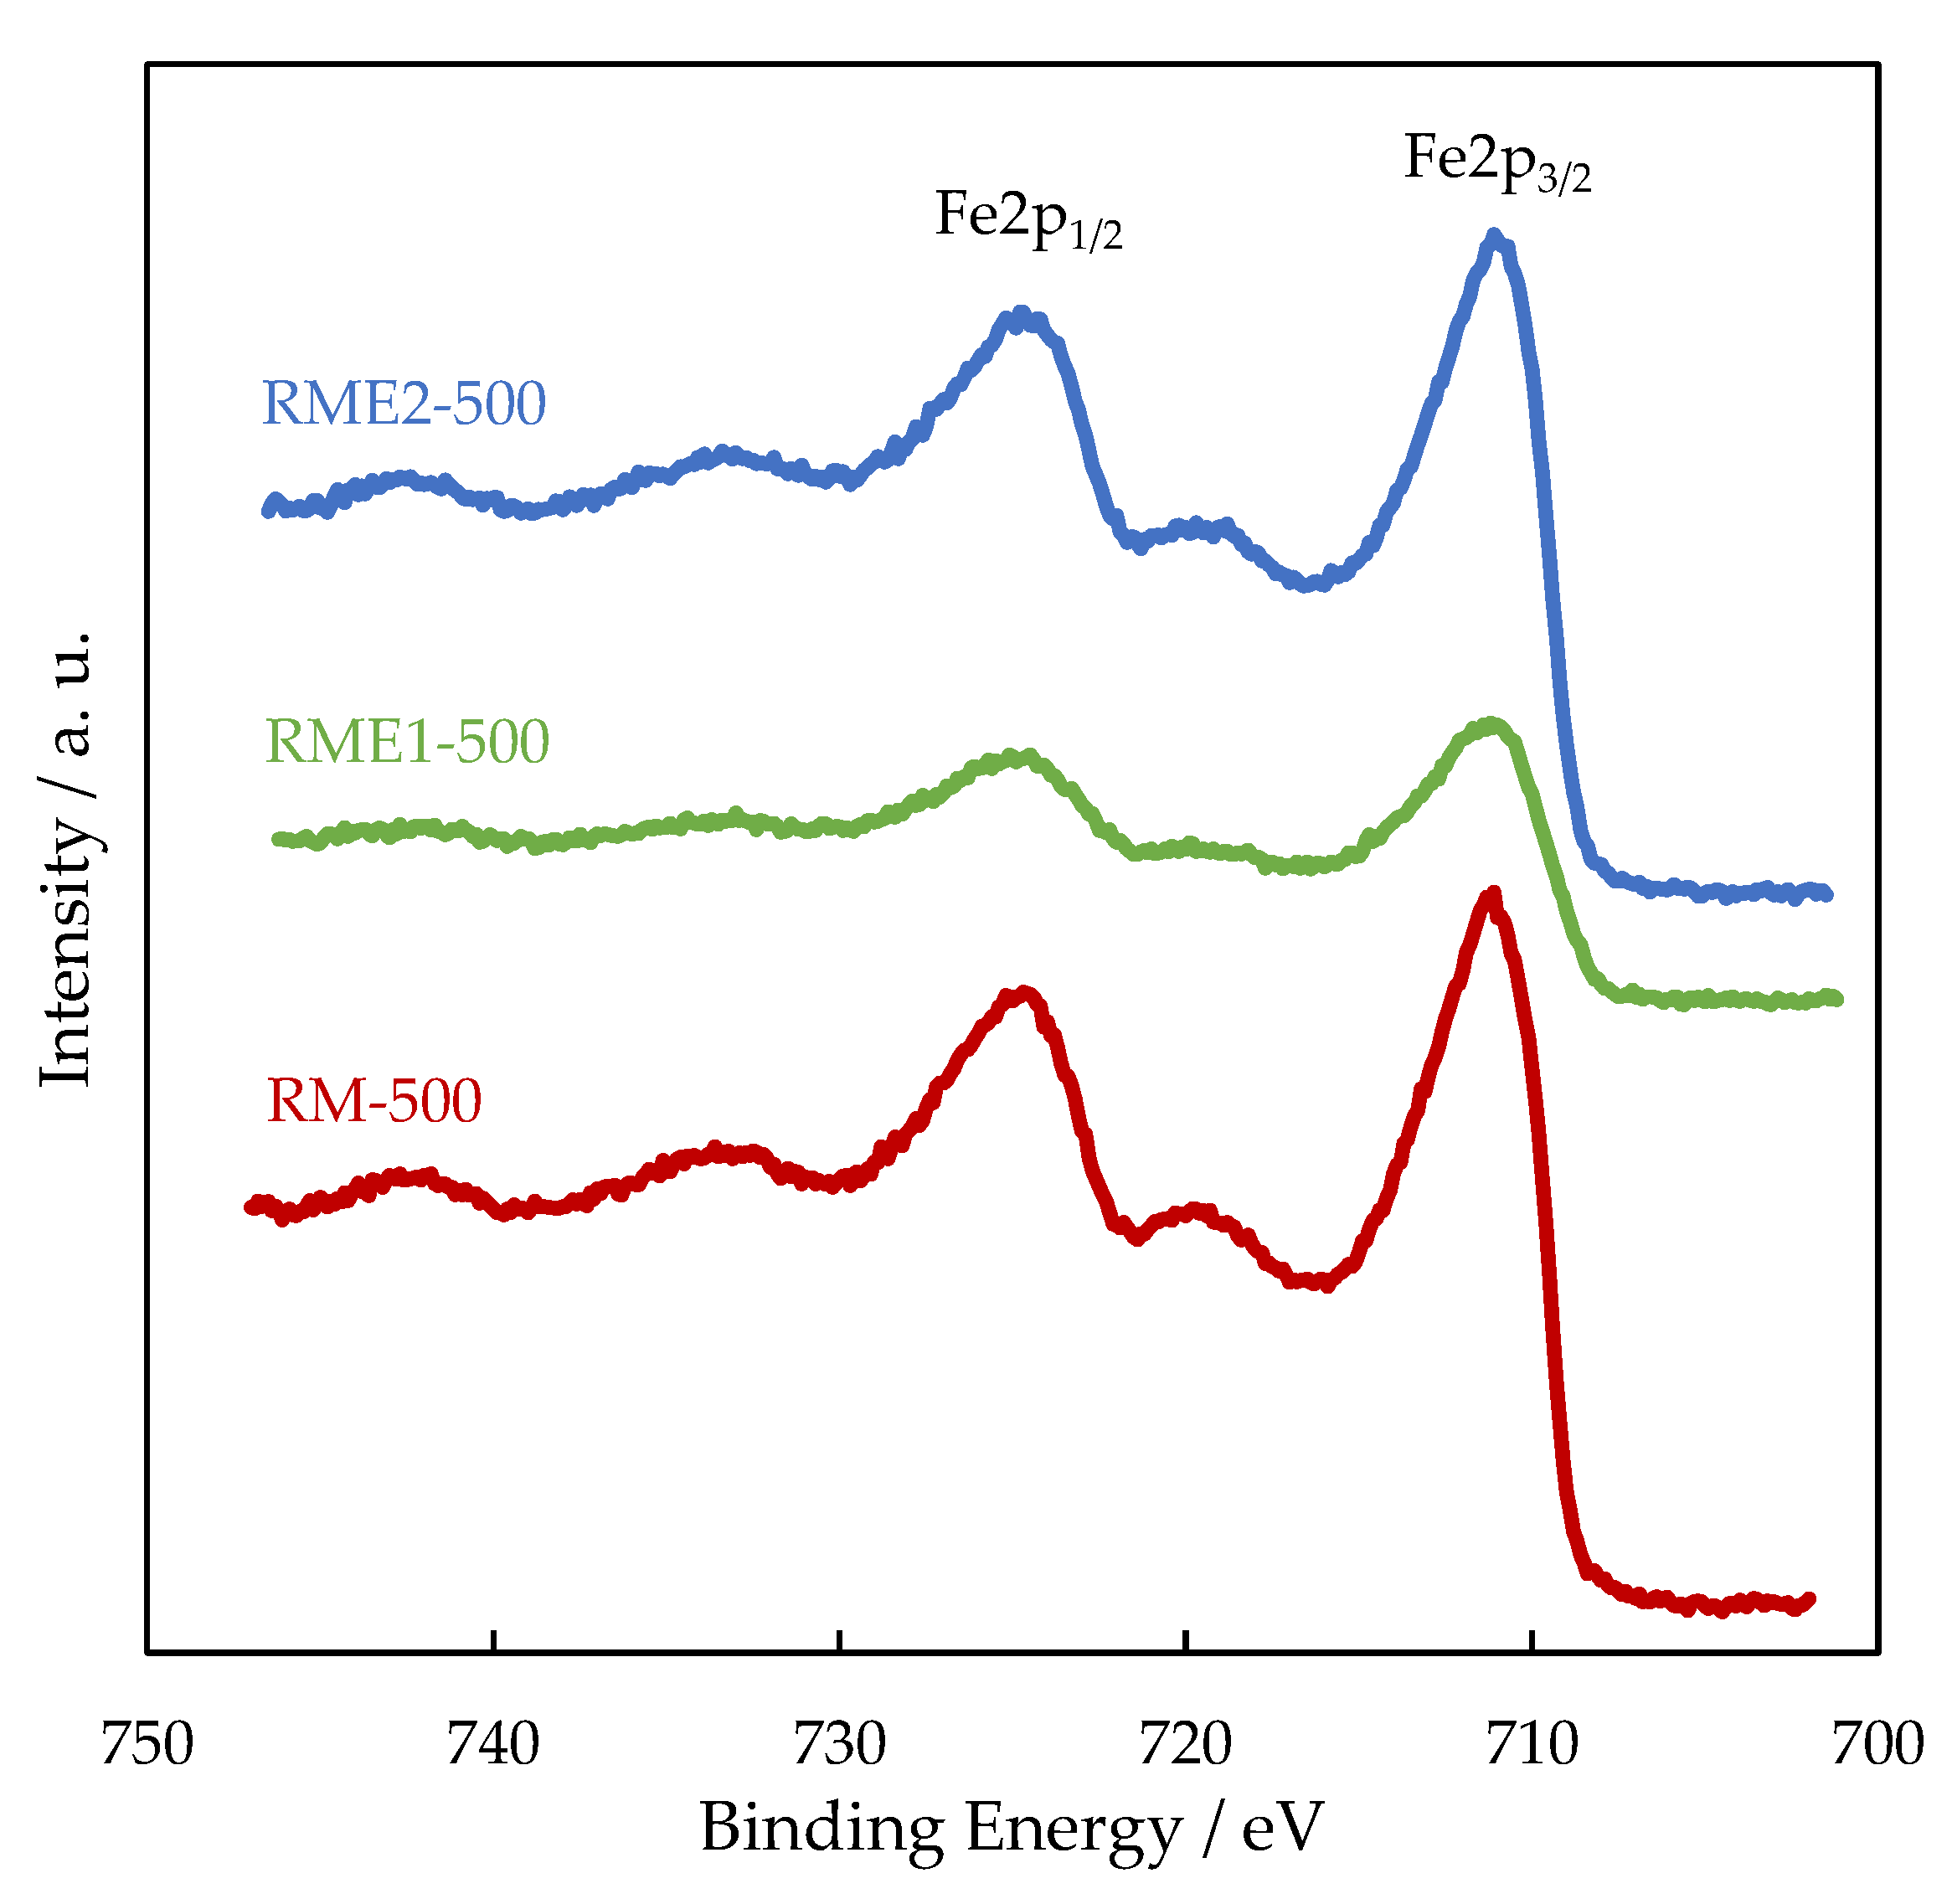
The values of the binding energies (BE) of the electrons coming from different orbitals from XPS analysis are shown in Table 3.
In all the samples, the Al2p and Ca2p BE values are consistent with the presence of Al3+ in Al2O3 and Ca2+ in CaCO3, respectively. Figure 3 shows the high resolution of Fe2p spectra with two prominent photopeaks associated with Fe2p3/2 (711.2 eV) and Fe2p1/2 (720 eV). Broad peaks to higher BE of the main photopeaks (718.8 eV and 733 eV) are the shake-up satellite peaks of Fe2p3/2 and Fe2p1/2, respectively, and indicates the presence of Fe2O3 (maghemite or hematite). While Al2p, Ca2p, and Fe2p BE do not significantly vary from one sample to another, Na1s BE is lowered by 0.8–1 eV for the RME2 sample. The lower Na1s BE is ascribed to the presence of sodium as sodium carbonate from the decomposition of sodium oxalate [27]. 
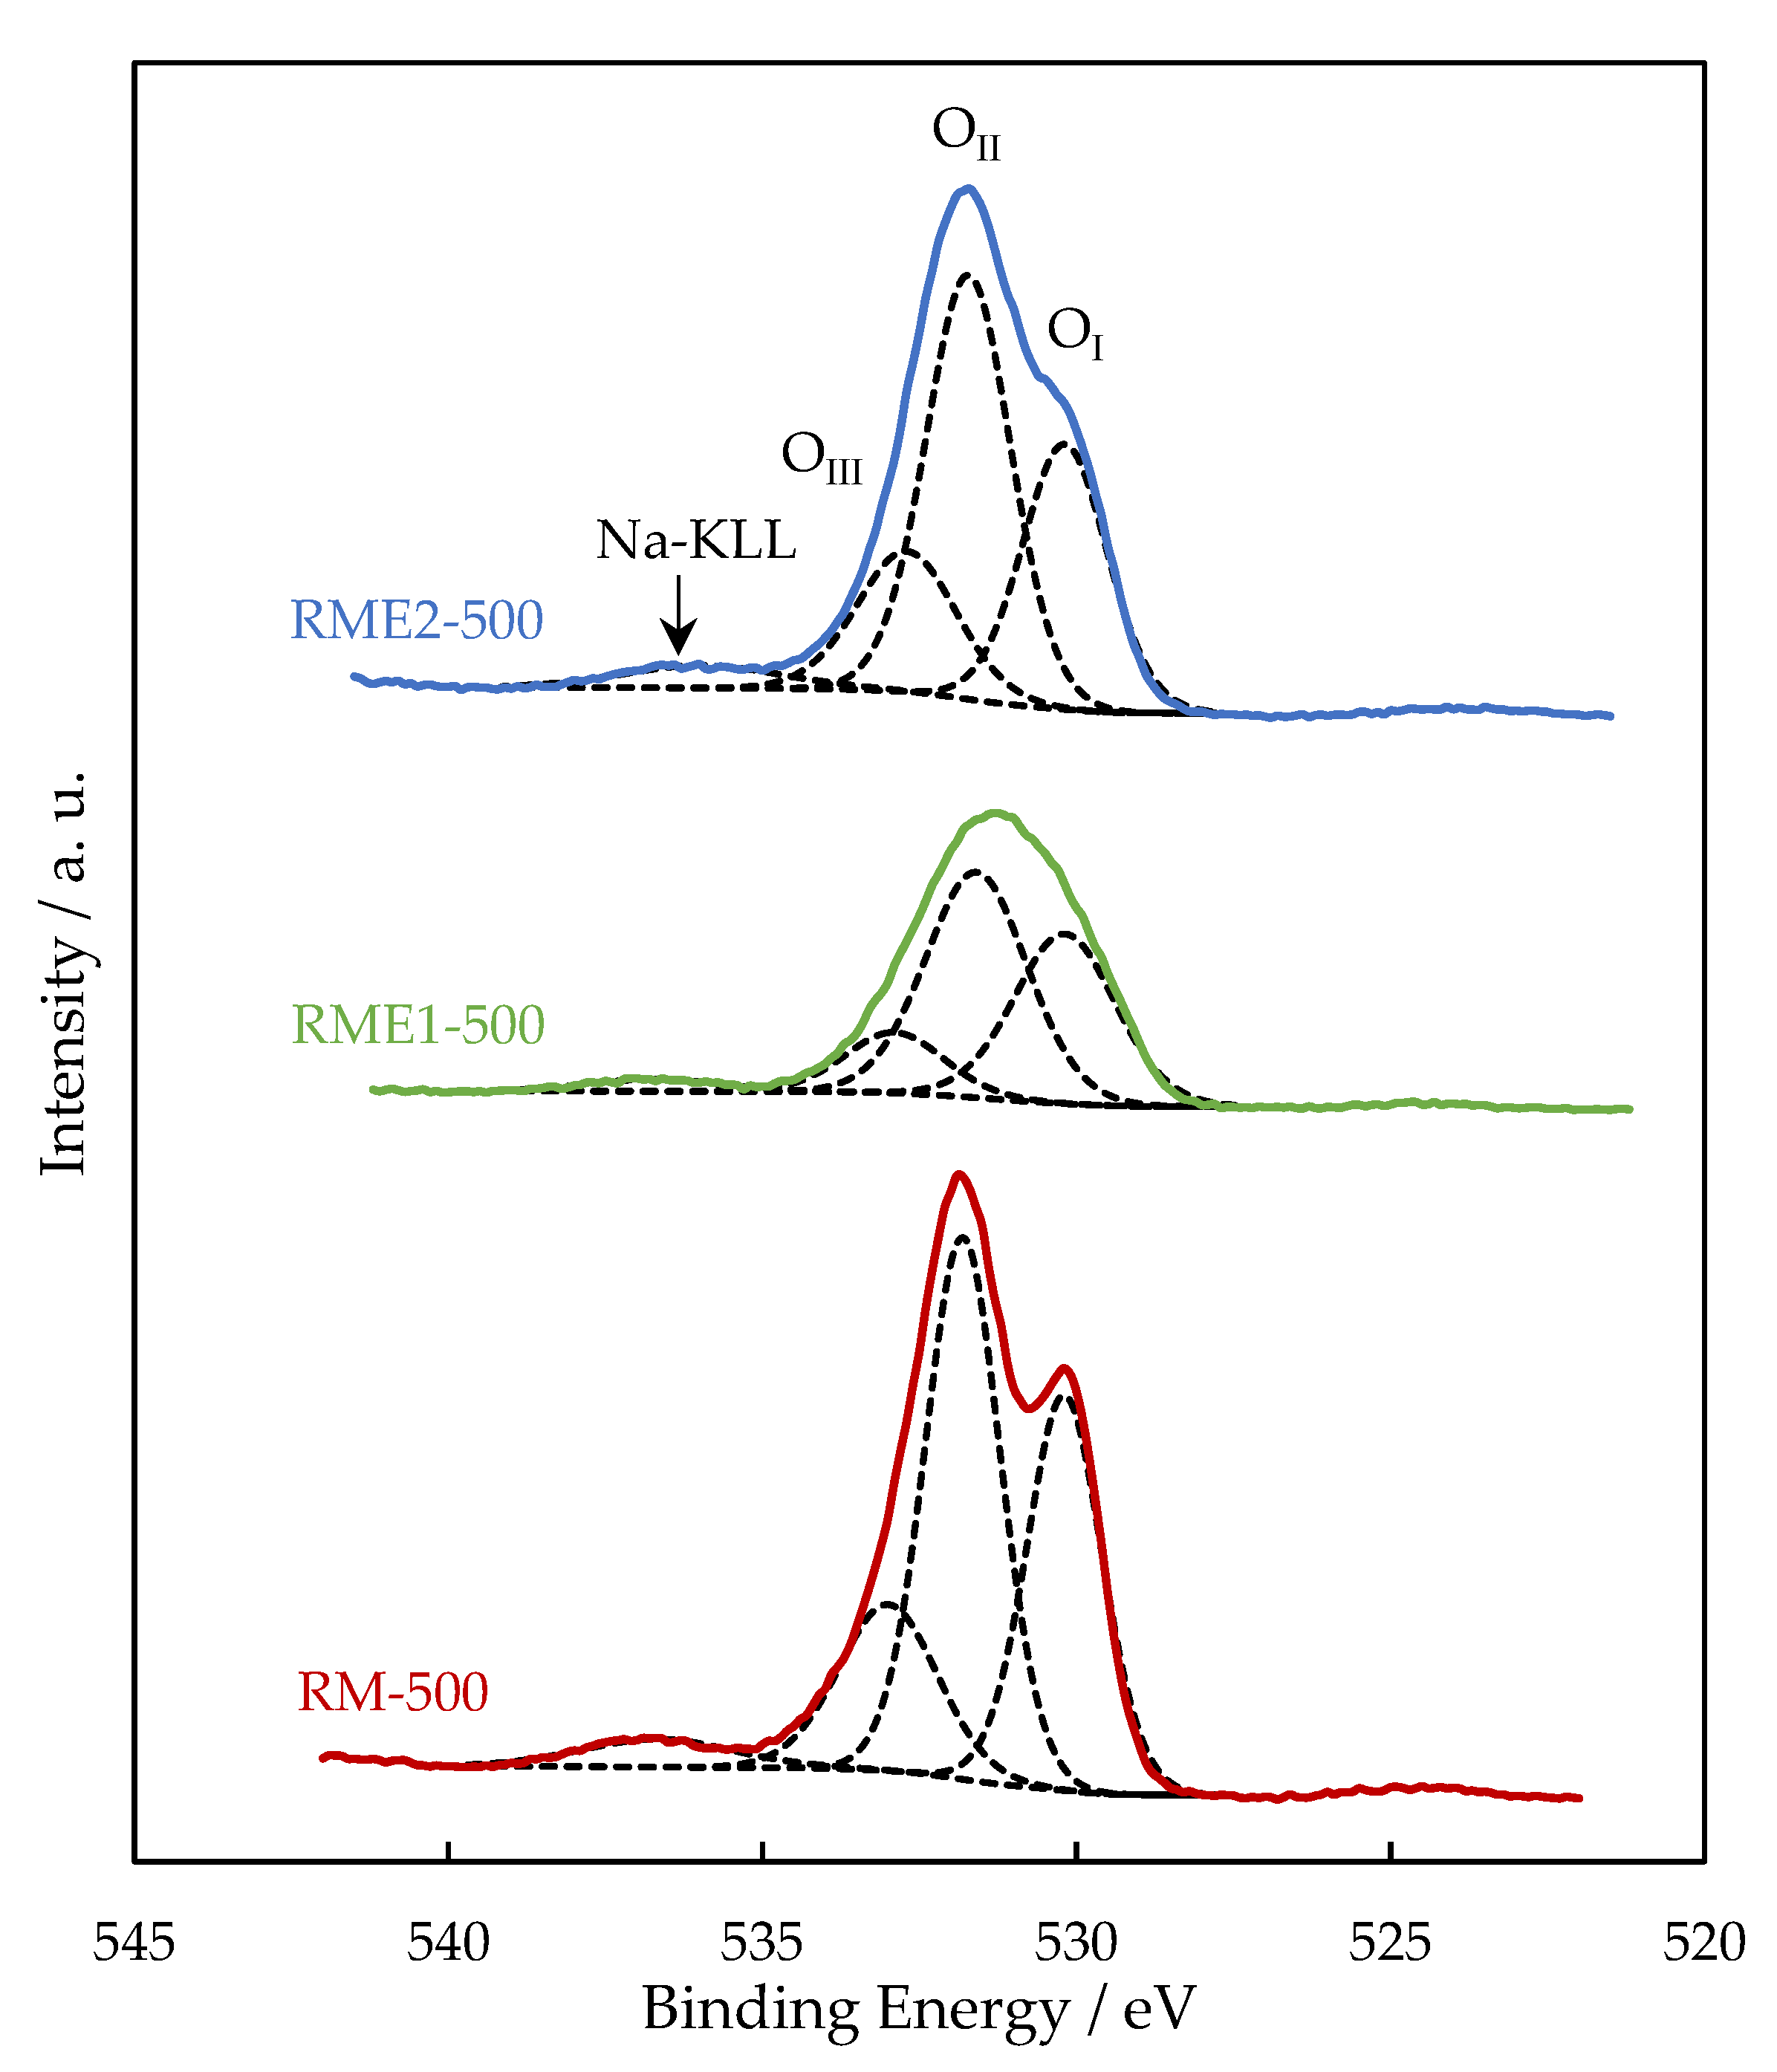
Figure 4 represents the O1s spectra of RM, RME1, and RME2 samples. The O1s signal is well described with three components. The OI at 530.0–530.2 eV is due to the presence of oxygen in transition metal oxides (titanium and iron oxides) and contributed to 45%, 48%, and 47% of total oxygen for RM-500, RME1-500, and RME2-500, respectively. The OII at 531.6–531.8 eV corresponds to oxygen in alumina and metal carbonates contributed to 33%, 36% and 30% of total oxygen for RM-500, RME1-500 and RME2-500, respectively. The OIII at 533 eV can be attributed to hydroxyl groups and its contribution was the lowest at 18%, 13%, and 18% of total oxygen for RM-500, RME1-500, and RME2-500, respectively. The low intensity photopeak observed at 536.7 eV for RM, RME1, and 536 eV for RM2 is ascribed to the Na KLL Auger peak. Owing to the Na1s BE shift previously observed, the Na KLL Auger peak is also shifted for RME2.
Quantitative information is shown in Table 4, along with Fe/Al atomic ratios. The surface iron content increases marginally for RME2-500 compared to RM-500, while in the case of RME1-500, there is a reduction. This is similar to the trend in bulk composition (Table 1). Correspondingly, the Fe/Al atomic ratio is increased for RME2-500 and decreased for RME1-500, compared to RM-500 for both surface composition and bulk composition. The RME1-500 sample shows high Cl content, which corresponds with the presence of NaCl detected in XRD analysis (Figure 2b).

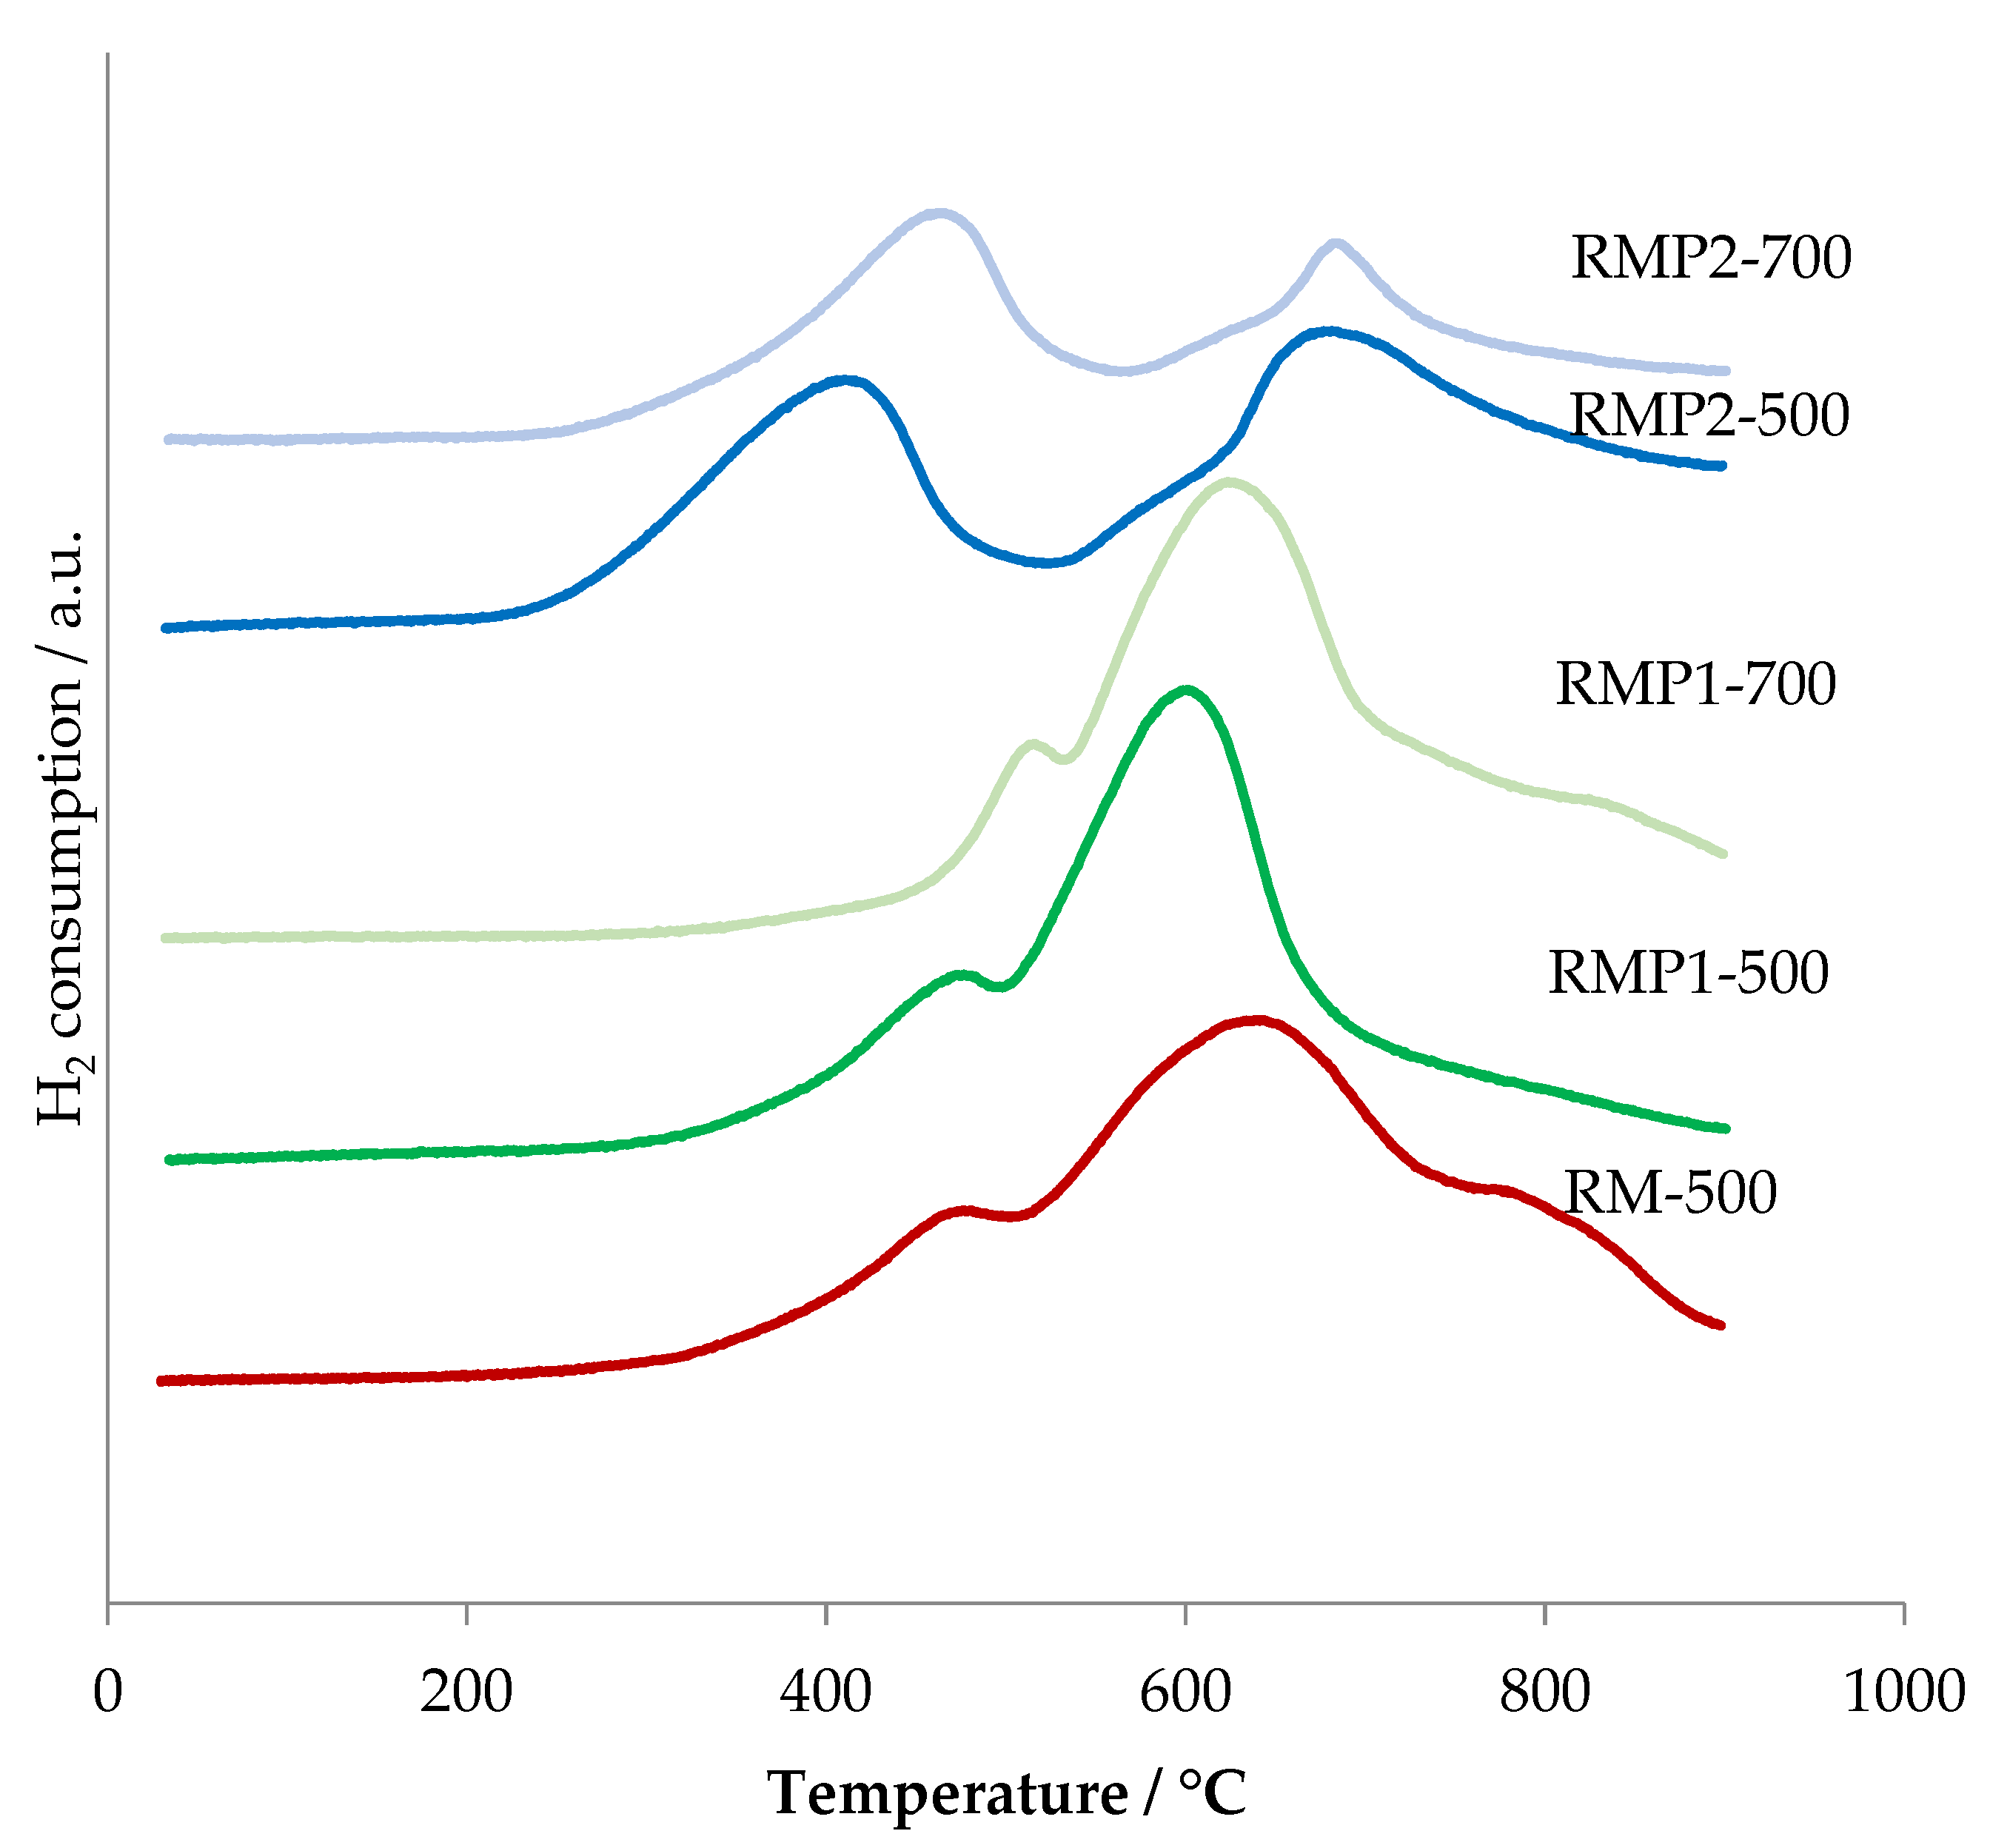
2.1.3. Redox Properties
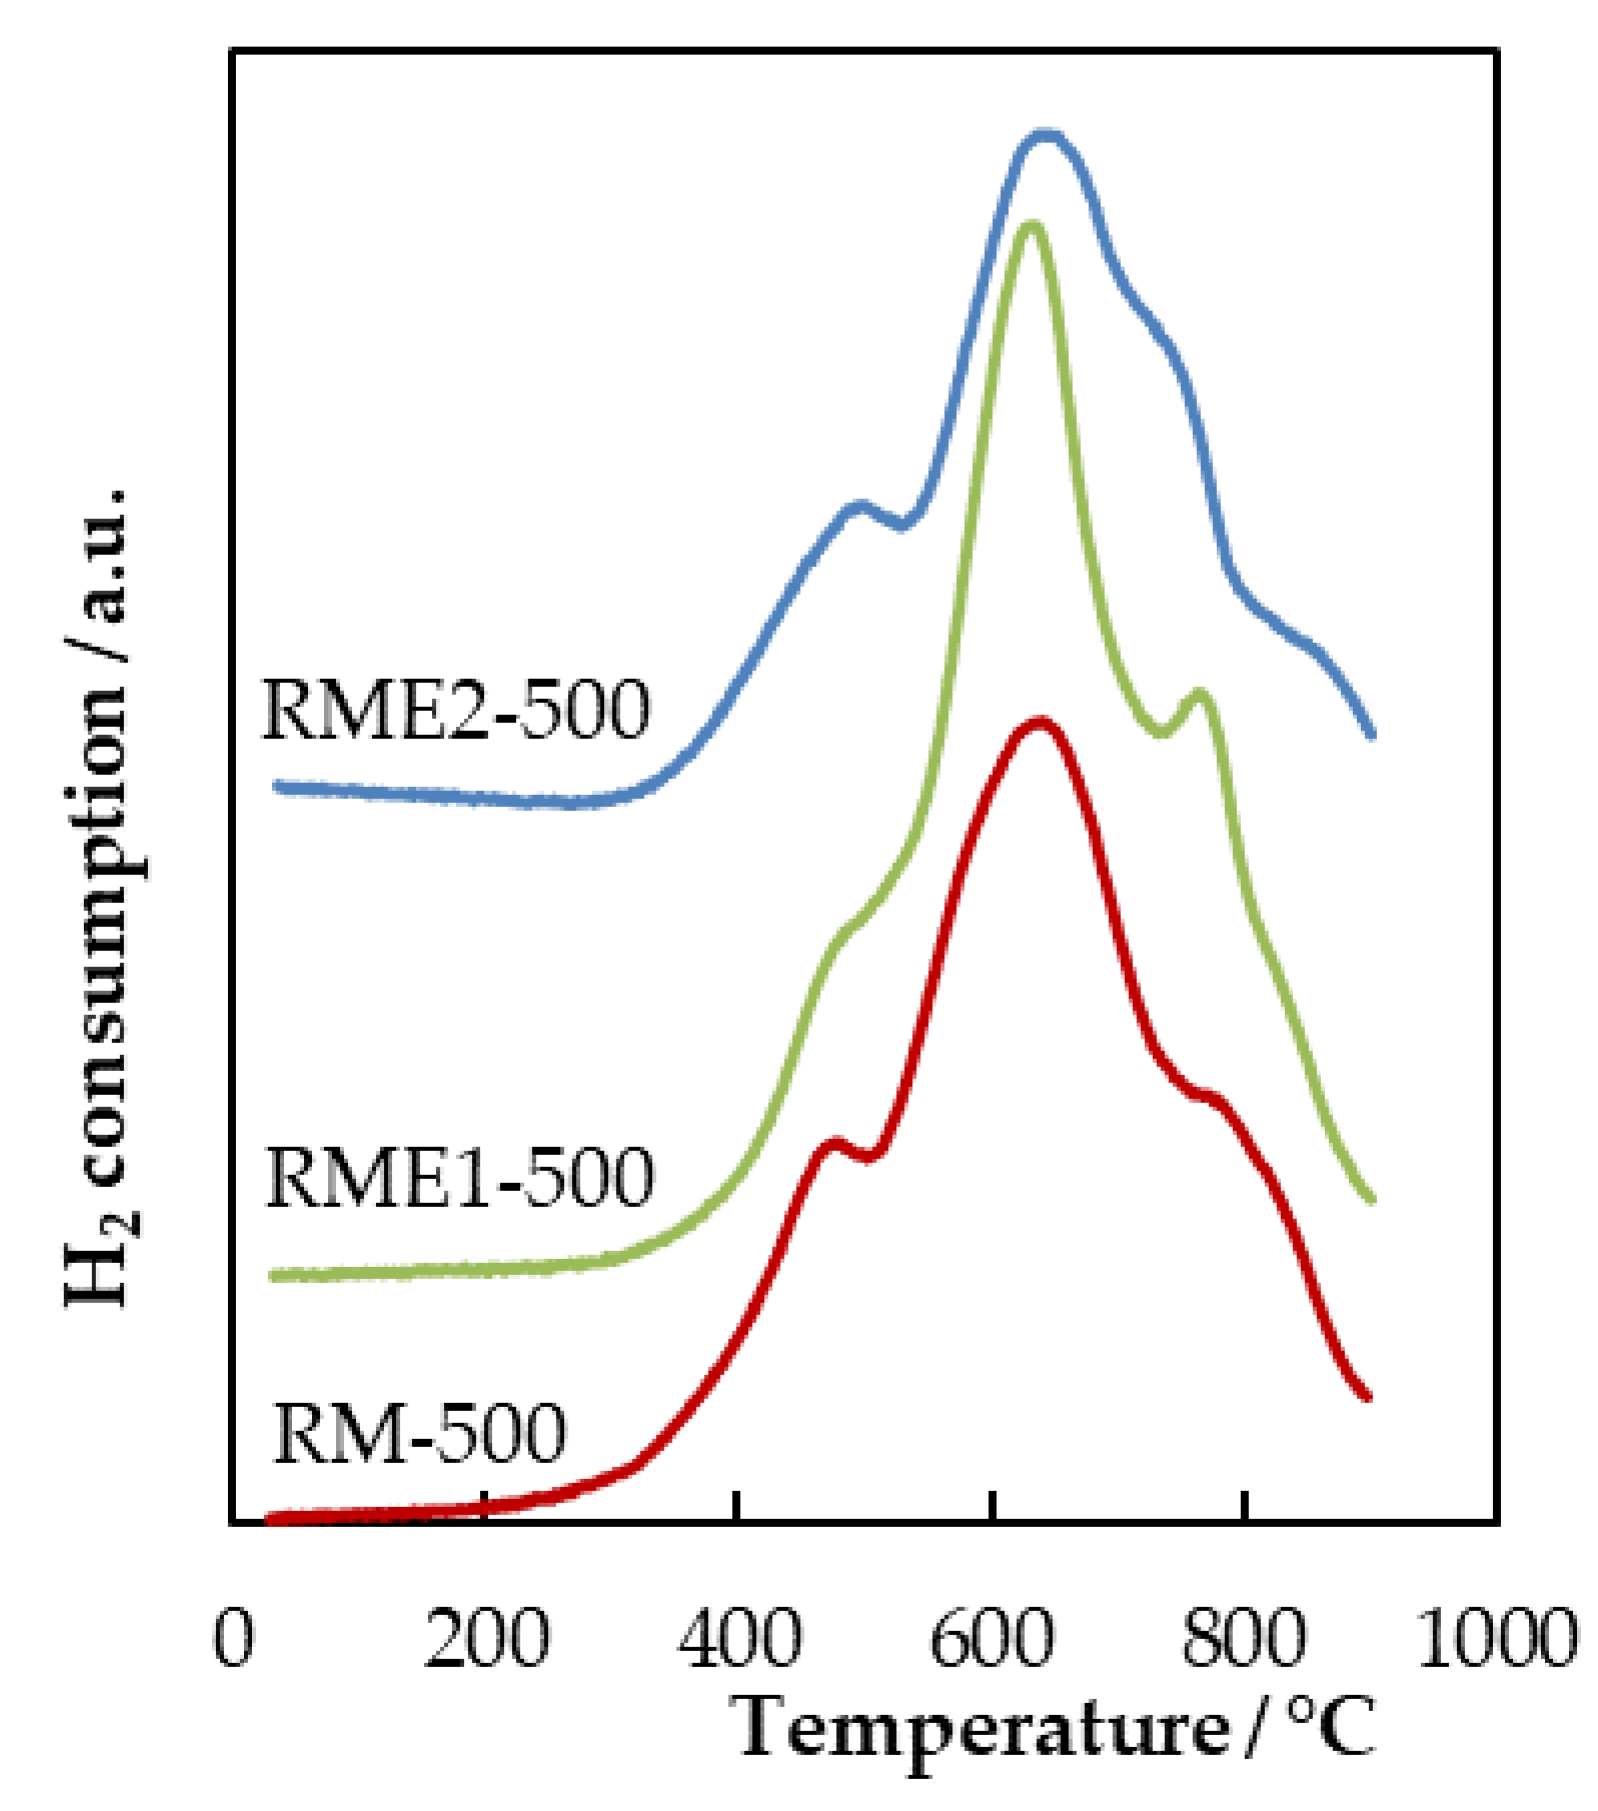
H2-TPR experiments have been performed in order to characterize the redox properties of the different samples (Figure 5). Since the oxidation of VOC over transition metal oxides takes place through a redox mechanism, a correlation between catalytic activity and H2-TPR is expected. The unmodified calcined red mud sample (RM-500) contains hematite (α-Fe2O3), which mainly contributes to the reduction profile. However, the reduction of α-Fe2O3 shows different profiles based on heating rate, moisture content, sample size etc. The red mud sample (RM-500) exhibits three overlapping reduction peaks. The first reduction peak at around 480 °C is usually ascribed to the reduction Fe2O3 to Fe3O4 while the second reduction peak at a higher temperature range (650–900 °C) is ascribed to the reduction of Fe3O4 to Fe. The number of steps involved in the reduction process of pure iron oxide has not been fully clarified. Indeed, this number is highly affected by the quantity of water in the feed [28]. Furthermore, the metastable nature of FeO and its possible disproportion to Fe3O4 and metallic iron according to the reaction 4FeO = Fe3O4 + Fe (T < 619 °C) make the reduction of FeO to metallic iron not readily observable [29].
The evaporated samples also showed reduction peaks in the same temperature range without significant profile modification; however, the onset temperature is higher compared to RM-500.

2.1.4. Catalytic Properties

The light-off curves for catalytic toluene oxidation to CO2 are shown in Figure 6. The unmodified calcined red mud has a better performance compared to the RME1-500 and RME2-500 catalysts. Despite increase of the textural properties of RME1-500, the catalytic activity in toluene oxidation is not improved. This could be due to the presence of NaCl as shown in XRD and confirmed by XPS. The RME2-500 sample catalyses the toluene oxidation at lower temperature in comparison of RME1-500. This could be due to higher iron content in the RME2-500 sample.

2.2. Precipitated Samples

2.2.1. Textural Properties

The nitrogen adsorption/desorption isotherms and the pore size distribution of the RMP samples are given in Figure 7. The textural properties of these materials are summarized in Table 5. The materials prepared by leaching and precipitation show a substantial increase in surface area compared to RM-500 (surface area 52 m2/g) and the evaporated samples (Table 2).
The isotherms of red mud materials prepared from hydrochloric acid using the precipitation method (RMP1 samples) show type IV isotherm with H3 hysteresis, signifying the presence of slit-like pores. The pore size distribution shows a peak with a maximum centered at around 5 nm for the RMP1-500 sample, maximum shifted to around 9 nm when calcined at 700 °C. In the case of oxalic acid, precipitated materials (RMP2 samples), the adsorption isotherm is very different and seems to be related to type I adsorption, which is characteristic of microporous solids with H4 hysteresis. The pore size distribution study indicates the presence of smaller mesopore diameters compared to RMP1 samples. At low relative pressures, N2 adsorption occurs on RMP materials, also indicating the presence of micropores. When calcined at higher temperature (700 °C), the quantity of adsorbed N2 decreases slightly suggesting that less micropores are present. This decrease could be related to the decrease in BET surface area (Table 5).

2.2.2. Bulk and Surface Compositions

The X-ray diffraction patterns for the prepared samples are shown in Figure 8. The samples precipitated from hydrochloric acid show the presence of hematite (JCPDS 89-8104). The samples precipitated from oxalic acid are amorphous for both calcination temperatures.
The values of the binding energies of the electrons coming from different orbitals from XPS analysis are shown in Table 6.
As previously observed in the RM and RME samples, the Fe2p3/2, Al2p, and Ca2p3/2 BE values agree with the presence of Fe2O3, Al2O3, and CaCO3, respectively, and the O1s signal can be described with same three components (i) at 530.0–530.2 eV (OI), (ii) 531.4–531.6 eV (OII), and (iii) at 533 eV (OIII). The surface composition from XPS analyses is shown in Table 7. It is seen that the iron content at the surface is much higher in the case of oxalic acid samples compared to the hydrochloric acid samples. The sodium content is reduced for the acid treated samples and in case of oxalic acid samples, Na and Cl elements are not present.

2.2.3. Morphology

The SEM and TEM images of RMP1-500 and RMP2-500 are given in Figure 9 and Figure 10. RMP1-500 has a rougher surface compared to the oxalic acid sample with some regions containing needle-like morphology. These are more clearly visible in the TEM images and the specific area diffraction (SAD) (inset) shows the crystalline nature of the particles. Symmetrical concentric rings are also seen implying the presence of amorphous phases, which could be silicates. RMP2-500 shows the presence of spherical particles in agglomerated form and the specific area diffraction (SAD) shows only faint concentric rings due to the amorphous nature of the substance.

2.2.4. Redox Properties

The redox properties were studied by high temperature XRD in hydrogen and H2-TPR. High temperature XRD results are shown in Figure 11. In case of the hydrochloric acid precipitate sample (Figure 11a), the hematite shows reduction to magnetite at 500 °C and formation of wustite is seen from 600 °C onwards. Iron peak also starts to appear from 700 °C from reduction of wustite. At 800 °C the presence of magnetite, wustite, and iron are all observed.
The oxalic acid precipitate sample (Figure 11b) shows an amorphous structure till about 600 °C, where peaks of magnetite appear to be forming. At 700 °C, iron peaks are also visible. At 800 °C, the peaks appear to be of magnetite and iron, showing incomplete reduction. Peaks for wustite are not seen at any temperature.
The H2-TPR profiles are shown in Figure 12. The RMP1 samples show a broad peak around 600–620 °C temperature range with a shoulder around 500 °C. The shoulder can be attributed to the reduction of Fe2O3 to Fe3O4 since no hematite is seen at 500 °C in the XRD. The broad peak appears to be a combination of reduction of Fe3O4 to FeO and its final reduction to Fe.
For the oxalic acid precipitated samples (RMP2), the peaks start at a lower temperature and two peaks are visible. The first peak around 400 °C is usually attributed to reduction of Fe2O3 to Fe3O4 [30]. The second peak around 670 °C could be from Fe3O4 reduction to Fe since Fe peaks are visible in XRD from 700 °C but not wustite. The reduction of Fe3O4 to Fe in a similar temperature range has been observed in alumina supported iron oxide catalysts [31]. The lower temperature of reduction compared to RMP1 samples can be attributed to its amorphous nature with high surface area. Indeed, it is plausible that the lack of long-range order to their atomic structure promotes a reduction of the Fe–O bond energy. Besides, by increasing the temperature of calcination, a shift to higher temperatures of reduction compared to the corresponding samples calcined at 500 °C is observed for the samples calcined at 700 °C (RMP1-700 and RMP2-700). This could be related to their increase of crystallinity and lower surface area.

2.2.5. Toluene Oxidation

The light-off curves for toluene conversion to CO2 are shown in Figure 13 and light-off temperatures and specific activity (converted toluene moles/s·gFe) at 320 °C are shown in Table 8. The best performance was obtained with oxalic acid samples with light-off temperatures (T50) of 310 °C for RMP2-500 while the HCl sample had a higher light-off temperature of around 386 °C for RMP1-500. The unmodified sample had a light-off temperature of 360 °C. The specific activity showed the same trend. The samples calcined at 700 °C showed higher light-off temperatures compared to samples calcined at 500 °C, which could be due to lower surface area.
It is seen that the performance of the samples well correlates with the H2-TPR results. The oxalic acid samples have higher surface area, enrichment of iron oxide at the surface, and fine particles, making them active for toluene oxidation. It is believed that the reaction process of VOCs on transition metal oxidation is based on redox mechanism. The easier reduction of Fe3+ species in the RMP2-500 material allows a catalytic oxidation of toluene at a much lower temperature via a redox mechanism in which the Fe3+/Fe2+ redox couple plays a predominant role. The samples precipitated from HCl, on the other hand, have a higher surface area compared to calcined red mud. However, their performance did not show any improvement, which could be due to insufficient enrichment of iron at the surface, some presence of sodium, and agglomerated particles. The performances of oxalic acid precipitated samples are comparable with that reported in literature for toluene oxidation using iron-based catalysts. The T50 temperatures for treated iron-based spent catalyst yielded best results with oxalic acid treatment and led to a T50 of 310 °C [32]. T50 for iron loaded on clay support was around 300 °C [33] and a T80 of 365 °C has been reported for commercial Fe2O3 [34].

3. Materials and Methods

3.1. Samples Preparation from Red Mud

The starting red mud used was RM7, which has been reported earlier [35]. The same batch was used to prepare all the catalysts. The red mud was modified by treating the solid with acid to leach out the iron and other species and to further obtain the iron enriched solid catalyst by precipitation (RMP samples) or evaporation (RME samples). Two different acid combinations were used for leaching the red mud viz. hydrochloric acid (8M) (RME1 and RMP1 samples) and oxalic acid (1M) with l-ascorbic acid (0.01M) (RME2 and RMP2 samples). For treatment with hydrochloric acid, 6.25 g of red mud was mixed with 250 mL of 8M acid solution and maintained at 105 °C for 6 h, stirring at 600 rpm in a round bottom flask fitted with air condenser using a rotamantle with PID and thermocouple to control the temperature. In experiments where oxalic acid (1 mol·L−1) with l-ascorbic acid (0.01 mol·L−1) was used as the leaching acid, the treatment was done at 100 °C for 2.5 h. The duration of the acidic treatment was determined by the time required by the residual solid to turn white, implying complete dissolution of iron. After the end of the pre-decided time of leaching, the reaction was frozen by introducing the flask in ice, followed by centrifugation. The filtrate was made up to 500 mL.
To obtain the solid catalyst by precipitation method, liquor ammonia 13M was added to the leachate drop-wise using a burette with constant stirring till the pH value was comprised between 9.5 to 10. The precipitated solid was separated after centrifugation, washed with water, and then dried in a hot air oven maintained at 105 °C overnight. In the evaporation method, the leachate from acid treatment was left to boil in an open mouth beaker on a hot plate till it dried completely after which the solid was scratched out of the beaker and crushed to form powder. These solid samples from both the methods were calcined at 500 °C for three hours in a tubular fixed bed reactor with an air flow of 0.2 slpm (room temperature to 500 °C at 2 °C/min.). The calcined samples were sieved and powder in the range 50–100 microns was used further for catalytic tests and characterization. Precipitated samples from hydrochloric acid and from oxalic acid with l-ascorbic acid were also calcined at 700 °C. A summary of the samples prepared and the sample codes are given in Table 9.

3.2. Material Characterization

The ICP analysis of the solid samples was done on a Thermo Electron Iris Intrepid II XSP Duo machine. The solid samples were digested by a solution of HNO3, HCl and HF and made up into 100 mL using HPLC grade water. The filtered solution was analyzed with ICP-OES system for Al and Fe content. Only these elements were analyzed since they are the major constituents of starting red mud [35].
N2 adsorption-desorption isotherms were recorded at −196 °C using an automated ASAP2010 apparatus from Micromeritics. Before the adsorption-desorption experiment, the sample was degassed at 150 °C for about 6 h under vacuum. Specific surface areas were calculated from the linear part of the Brunauer-Emmett-Teller line. The pore size distributions were determined from the desorption branch of the isotherms using the BJH method.
X-ray diffraction studies were done with Bruker AXS D8 Advance diffractometer equipped with a copper anode (λ = 1.5406 Å). For high temperature analysis, the attached Anton Paar chamber HTK1200N was used, which allows measurements from ambient to 900 °C in different atmospheres. The 2-theta range was 4° to 80° for all the samples with a step-size of 0.02° and a hold time of 0.5 or 1 min. The diffraction patterns were indexed by comparison with the ICDD files.
Temperature-programmed reduction (Micromeritics AutoChem II 2920) was performed from room temperature to 800 °C using gas composition of 5 vol% H2 in Ar. The sample weight was 0.05 g, the heating rate was 5 °C/min, and the gas flow rate was 50 cm3 STP/min.
X-ray photoelectron spectra (XPS) were recorded using a KRATOS AXIS UltraDLD (RM and RME samples) and VG ESCALAB 220XL (RMP samples) spectrometers, both equipped with an aluminium anode (Kα hν = 1486.6 eV). The spectra obtained were analyzed using CasaXPS processing software. Binding energies were referenced to the Ti2p3/2 core level (Ti4+ in TiO2 lattice at 458.5 eV) for the RM and REM samples, while C1s core level at 285 eV was used as a charge reference for RMP samples. Semiquantitative analysis accounted for a nonlinear Shirley background subtraction.
Scanning electron microscopy was done using a Zeiss EVOMAX10 scanning electron microscope at 20 kV/EHT after coating the samples with 24 nm Au/Pd coating. Transmission electron microscopy (TEM) was done on a Technai G2 20 instrument. The samples were dispersed in ethanol by sonication and were loaded on carbon coated copper grids for the TEM analysis. The ICP analysis of the solid samples was done on a Thermo Electron Iris Intrepid II XSP Duo machine. The solid samples were digested by a solution of HNO3, HCl and HF and made up into 100 mL using HPLC grade water. The filtered solution was analyzed with the ICP-AES system.

3.3. Catalytic Test

The toluene oxidation activity and selectivity of the catalysts (200 mg) were measured in a fixed bed reactor at atmospheric pressure. The reactor temperature was increased from ambient to 450 °C at 2 °C/min in 70 mL/min flow of air. The in-situ calcination of the catalyst was continued at 450 °C for one hour after attaining the temperature and then the flow of air was stopped and the toluene vapours (100 mL/min of about 700 ppm toluene vapours in air) were let in. The flow of the reactant toluene vapours was controlled by an arrangement consisting of a mass flow controller to control the rate of flow of air followed by a glass saturator filled with toluene maintained at constant temperature to obtain the required flow of constant concentration of toluene vapours in air. The reactor was maintained at 450 °C for another hour after letting in the toluene vapours while analysing the exit gases by an Agilent 7890 A gas chromatograph system equipped with an FID for the analysis of the organic reactants and a TCD for the analysis of CO and CO2. After maintaining the temperature at 450 °C for two hours, the reactor temperature was reduced at the rate of 0.5 °C/min to ambient temperature while analysing the exit gases with GC. Since heating rate is low, we can consider that steady state conditions were maintained. The toluene conversion to CO2 was calculated as given below:
Toluene Conversion into CO2 = [CO2] × 100/(7 × [C7H8]in)

4. Conclusions

The modified red mud catalysts characteristics were influenced by the acid used for leaching, the method of obtaining the solid from the leachate and the calcination process. The modified red mud catalysts made from oxalic acid and l-ascorbic acid as the leaching acid show better redox characteristics than those prepared by HCl as the leaching acid or calcined red mud, as shown by the H2-TPR. This is also shown in the catalytic oxidation of toluene. The samples prepared by precipitation of the leachate by adding base give a much better performance in catalytic oxidation than the ones prepared by just evaporating the leachate. The evaporation method is thus not a suitable treatment for improving catalytic properties. The best performing catalyst was obtained by precipitation from oxalic acid and l-ascorbic acid leachate and this can be correlated to high surface area and higher enrichment of Fe at the surface; the iron oxide was amorphous and in the nano range, as showed by XRD and TEM.

Author Contributions

G.P. prepared the red mud materials. G.P., S.S. and C.C. conducted the experiments. V.S.B., J.-M.G. and J.-F.L. supervised the work. V.S.B. and J.-F.L. wrote the first draft of the paper. All authors contributed to the data interpretation, the discussion, and the revision of the paper. All authors have read and agreed to the published version of the manuscript.

Funding

Support from Indo-French Centre for the Promotion of Advanced Research (IFCPAR)/Centre Franco-Indien pour la Promotion de La Recherche Avancée (CEFIPRA) is gratefully acknowledged.

Conflicts of Interest

The authors declare no conflict of interest. The funders had no role in the design of the study; in the collection, analyses, or interpretation of data; in the writing of the manuscript, or in the decision to publish the results. The data presented in this study are available in Pande, G., 2016. Heterogeneous Catalysts for VOC Oxidation from Red Mud and Bagasse Ash Carbon. Ph. D. Thesis.

References

  1. Massolo, L.; Rehwagen, M.; Porta, A.; Ronco, A.; Herbarth, O.; Mueller, A. Indoor–outdoor distribution and risk assessment of volatile organic compounds in the atmosphere of industrial and urban areas. Environ. Toxicol. 2010, 25, 339–349. [Google Scholar] [CrossRef]
  2. World Health Organization. Indoor Air Quality: Organic Pollutants; World Health Organization: Geneva, Switzerland, 1989; pp. 855–858. [Google Scholar]
  3. Li, W.B.; Wang, J.X.; Gong, H. Catalytic combustion of VOCs on non-noble metal catalysts. Catal. Today 2009, 148, 81–87. [Google Scholar] [CrossRef]
  4. Kamal, M.S.; Razzak, S.A.; Hossain, M.M. Catalytic oxidation of volatile organic compounds (VOCs)–A review. Atmos. Environ. 2016, 140, 117–134. [Google Scholar] [CrossRef]
  5. Wang, Q.; Yeung, K.L.; Bañares, M.A. Ceria and its related materials for VOC catalytic combustion: A review. Catal. Today 2019, 356, 141–154. [Google Scholar] [CrossRef]
  6. Lyu, Y.; Li, C.; Du, X.; Zhu, Y.; Zhang, Y.; Li, S. Catalytic removal of toluene over manganese oxide-based catalysts: A review. Environ. Sci. Pollut. Res. 2020, 27, 2482–2501. [Google Scholar] [CrossRef] [PubMed]
  7. Solsona, B.; García, T.; Sanchis, R.; Soriano, M.D.; Moreno, M.; Rodríguez-Castellón, E.; Agouram, S.; Dejoz, A.; Nieto, J.L. Total oxidation of VOCs on mesoporous iron oxide catalysts: Soft chemistry route versus hard template method. Chem. Eng. J. 2016, 290, 273–281. [Google Scholar] [CrossRef]
  8. Sanchis, R.; Alonso-Domínguez, D.; Dejoz, A.; Pico, M.P.; Álvarez-Serrano, I.; García, T.; López, M.L.; Solsona, B. Eco-friendly cavity-containing iron oxides prepared by mild routes as very efficient catalysts for the total oxidation of VOCs. Materials 2018, 11, 1387. [Google Scholar] [CrossRef] [Green Version]
  9. Bonelli, R.; Albonetti, S.; Morandi, V.; Ortolani, L.; Riccobene, P.M.; Scirè, S.; Zacchini, S. Design of nano-sized FeOx and Au/FeOx catalysts supported on CeO2 for total oxidation of VOC. Appl. Catal. A 2011, 395, 10–18. [Google Scholar] [CrossRef]
  10. Sanchis, R.; Dejoz, A.; Vázquez, I.; Vilarrasa-García, E.; Jiménez-Jiménez, J.; Rodríguez-Castellón, E.; Nieto, J.M.L.; Solsona, B. Ferric sludge derived from the process of water purification as an efficient catalyst and/or support for the removal of volatile organic compounds. Chemosphere 2019, 219, 286–295. [Google Scholar] [CrossRef]
  11. Andersen, S.L.; Flores, R.G.; Madeira, V.S.; José, H.J.; Moreira, R.F. Synthesis and characterization of acicular iron oxide particles obtained from acid mine drainage and their catalytic properties in toluene oxidation. Ind. Eng. Chem. Res. 2012, 51, 767–774. [Google Scholar] [CrossRef]
  12. Wang, S.; Ang, H.M.; Tade, M.O. Novel applications of red mud as coagulant, adsorbent and catalyst for environmentally benign processes. Chemosphere 2008, 72, 1621–1635. [Google Scholar] [CrossRef]
  13. Sushil, S.; Batra, V.S. Catalytic applications of red mud, an aluminium industry waste: A review. Appl. Catal. B 2008, 81, 64–77. [Google Scholar] [CrossRef]
  14. Lamonier, J.F.; Wyrwalski, F.; Leclercq, G.; Aboukais, A. Recycling of waste, red mud, as a catalyst for the elimination of volatile organic compounds. Can. J. Chem. Eng. 2005, 83, 737–741. [Google Scholar] [CrossRef]
  15. Santosa, D.M.; Zhu, C.; Agblevor, F.A.; Maddi, B.; Roberts, B.Q.; Kutnyakov, I.V.; Lee, S.J.; Wang, H. In Situ Catalytic Fast Pyrolysis using Red Mud Catalyst: Impact of catalytic fast pyrolysis temperature and biomass feedstocks. ACS Sustain. Chem. Eng. 2020, 8, 5156–5164. [Google Scholar] [CrossRef]
  16. Chen, Q.; Zhang, X.; Li, B.; Niu, S.; Zhao, G.; Wang, D.; Peng, Y.; Li, J.; Lu, C.; Crittenden, J. Insight into the promotion mechanism of activated carbon on the monolithic honeycomb red mud catalyst for selective catalytic reduction of NOx. Front. Environ. Sci. Eng. 2021, 15, 1–10. [Google Scholar] [CrossRef]
  17. Ryu, S.; Lee, J.; Kannapu, H.P.R.; Jang, S.H.; Kim, Y.; Jang, H.; Ha, J.M.; Jung, S.C.; Park, Y.K. Acid-treated waste red mud as an efficient catalyst for catalytic fast copyrolysis of lignin and polyproylene and ozone-catalytic conversion of toluene. Environ. Res. 2020, 191, 110149. [Google Scholar] [CrossRef]
  18. Pratt, K.C.; Christoverson, V. Hydrogenation of a model hydrogen-donor system using activated red mud catalyst. Fuel 1982, 61, 460–462. [Google Scholar] [CrossRef]
  19. Álvarez, J.; Ordóñez, S.; Rosal, R.; Sastre, H.; Díez, F.V. A new method for enhancing the performance of red mud as a hydrogenation catalyst. Appl. Catal. A 1999, 180, 399–409. [Google Scholar] [CrossRef]
  20. Lee, S.O.; Tran, T.; Jung, B.H.; Kim, S.J.; Kim, M.J. Dissolution of iron oxide using oxalic acid. Hydrometallurgy 2007, 87, 91–99. [Google Scholar] [CrossRef]
  21. Yu, Z.L.; Shi, Z.X.; Chen, Y.M.; Niu, Y.J.; Wang, Y.X.; Wan, P.Y. Red-mud treatment using oxalic acid by UV irradiation assistance. Trans. Nonferrous Met. Soc. China 2012, 22, 456–460. [Google Scholar] [CrossRef]
  22. Yang, Y.; Wang, X.; Wang, M.; Wang, H.; Xian, P. Iron recovery from the leached solution of red mud through the application of oxalic acid. Int. J. Miner. Process. 2016, 157, 145–151. [Google Scholar] [CrossRef]
  23. Lahiri, A. Influence of ascorbate and oxalic acid for the removal of iron and alkali from alkali roasted ilmenite to produce synthetic rutile. Ind. Eng. Chem. Res. 2010, 49, 8847–8851. [Google Scholar] [CrossRef]
  24. Zhou, W.; Tang, K.; Zeng, S.; Qi, Y. Room temperature synthesis of rod-like FeC2O4·2H2O and its transition to maghemite, magnetite and hematite nanorods through controlled thermal decomposition. Nanotechnology 2008, 19, 065602. [Google Scholar] [CrossRef]
  25. Rao, V.; Shashimohan, A.L.; Biswas, A.B. Studies on the formation of γ-Fe2O3 (maghemite) by thermal decomposition of ferrous oxalate dihydrate. J. Mater. Sci. 1974, 9, 430–433. [Google Scholar] [CrossRef]
  26. Angermann, A.; Töpfer, J. Synthesis of magnetite nanoparticles by thermal decomposition of ferrous oxalate dihydrate. J. Mater. Sci. 2008, 43, 5123–5130. [Google Scholar] [CrossRef]
  27. Moulder, J.F.; Stickle, W.F.; Sobol, P.E.; Bomben, K.D. Handbook of X-ray Photoelectron Spectroscopy: A Reference Book of Standard Spectra for Identification and Interpretation of XPS Data; Perkin-Elmer: Boca Raton, FL, USA, 1992. [Google Scholar]
  28. Zieliński, J.; Zglinicka, I.; Znak, L.; Kaszkur, Z. Reduction of Fe2O3 with hydrogen. Appl. Catal. A 2010, 381, 191–196. [Google Scholar] [CrossRef]
  29. Perez-Alonso, F.J.; Melián-Cabrera, I.; López Granados, M.; Kapteijn, F.; Fierro, J.L.G. Synergy of FexCe1-xO2 mixed oxides for N2O decomposition. J. Catal. 2006, 239, 340–346. [Google Scholar] [CrossRef] [Green Version]
  30. Wei, X.; Zhou, Y.; Li, Y.; Shen, W. Polymorphous transformation of rod-shaped iron oxides and their catalytic properties in selective reduction of NO by NH3. RSC Adv. 2015, 5, 66141–66146. [Google Scholar] [CrossRef]
  31. Pinilla, J.L.; Utrilla, R.; Karn, R.K.; Suelves, I.; Lázaro, M.J.; Moliner, R.; García, A.B.; Rouzaud, J.N. High temperature iron-based catalysts for hydrogen and nanostructured carbon production by methane decomposition. Int. J. Hydrog. Energy 2011, 36, 7832–7843. [Google Scholar] [CrossRef]
  32. Kim, S.C.; Shim, W.G. Influence of physicochemical treatments on iron-based spent catalyst for catalytic oxidation of toluene. J. Hazard. Mater. 2008, 154, 310–316. [Google Scholar] [CrossRef]
  33. Nogueira, F.G.; Lopes, J.H.; Silva, A.C.; Lago, R.M.; Fabris, J.D.; Oliveira, L.C. Catalysts based on clay and iron oxide for oxidation of toluene. Appl. Clay Sci. 2011, 51, 385–389. [Google Scholar] [CrossRef] [Green Version]
  34. Durán, F.G.; Barbero, B.P.; Cadús, L.E.; Rojas, C.; Centeno, M.A.; Odriozola, J.A. Manganese and iron oxides as combustion catalysts of volatile organic compounds. Appl. Catal. B 2009, 92, 194–201. [Google Scholar] [CrossRef]
  35. Balakrishnan, M.; Batra, V.S.; Hargreaves, J.S.J.; Monaghan, A.; Pulford, I.D.; Rico, J.L.; Sushil, S. Hydrogen production from methane in the presence of red mud–making mud magnetic. Green Chem. 2009, 11, 42–47. [Google Scholar] [CrossRef]
Figure 1. (a) N2 adsorption–desorption isotherms and (b) the corresponding pore size distribution curves of RME and RM samples. The isotherms and the pore size distribution curves have been shifted by 5 and 10 cm3/g and 0.04 and 0.08 cm3/g·nm, respectively, for more clarity.
Catalysts 11 00838 g001
Figure 2. X-ray diffraction pattern of (a) RM-500 (b) RME1-500, and (c) RME2-500.
Catalysts 11 00838 g002aCatalysts 11 00838 g002b
Figure 3. High-resolution Fe2p XPS spectra for the RM and RME samples.
Catalysts 11 00838 g003
Figure 4. High-resolution O1s XPS spectra deconvoluted peaks for the RM and RME samples.
Catalysts 11 00838 g004
Figure 5. H2-TPR profiles obtained for the RM and RME samples.
Catalysts 11 00838 g005
Figure 6. Toluene conversion to CO2 as a function of the temperature in the presence of the unmodified calcined red mud (RM-500) and the evaporated catalysts (RME1-500 and RME2-500).
Catalysts 11 00838 g006
Figure 7. (a,b) N2 adsorption–desorption isotherms and (c,d) the corresponding pore size distribution curves of the RMP samples, shifted by 0.2 cm3/g·nm, for more clarity.
Catalysts 11 00838 g007aCatalysts 11 00838 g007b
Figure 8. X-ray diffraction patterns of RMP samples calcined at 500 °C and 700 °C.
Catalysts 11 00838 g008
Figure 9. SEM images of the RMP1-500 (a,b) and RMP2-500 (c,d) samples.
Catalysts 11 00838 g009
Figure 10. TEM images of the (a) RMP1-500 and (b) RMP2-500 samples.
Catalysts 11 00838 g010
Figure 11. High temperature X-ray diffraction profiles of (a) RMP1-500 and (b) RMP2-500 pattern under reducing atmosphere (3% H2 in N2).
Catalysts 11 00838 g011
Figure 12. H2-TPR profiles of precipitated red mud samples calcined at 500 °C and 700 °C.
Catalysts 11 00838 g012
Figure 13. Toluene conversion to CO2 as a function of the temperature in the presence of the calcined and precipitated catalysts (RM-500, RMP1-500, RMP2-500, RMP1-700, and RMP2-700).
Catalysts 11 00838 g013
Table 1. Bulk composition of red mud and leaching red mud samples from ICP-OES analysis.
Sample CodeAl2O3/wt%Fe2O3/wt%
RM-50015.029.9
RME1-50023.113.4
RME2-50017.537.7
RMP1-50024.643.8
RMP2-50023.843.5
Table 2. Textural properties of the RME and RM samples from the N2 physisorption analyses.
Sample CodeSpecific Surface Area/m2/gTotal Pore Volume/cm3/gAverage Pore Diameter/nm
RM-500520.119.3
RME1-500880.165.8
RME2-500460.138.2
Table 3. Binding energies of electrons coming from different core levels for the RM and RME samples.
SampleBinding Energy/eV
O1sFe2p3/2Al2pCl2p3/2Na1sCa2p3/2Ti2p3/2 *
OIOIIOIII
RM530.2531.8533.0711.274.7-1072.0347.6458.5
RME1530.2531.6532.9711.274.3199.41072.2347.6458.5
RME2530.0531.7533.0711.074.5-1071.2347.4458.5
* Ti2p3/2 used as a charge reference for XPS analysis.
Table 4. Atomic percentage of elements from XPS analysis (at %) for the RM and RME samples.
OFeAlClNaCaFe/Al Ratio
RM-50068.09.213.40.28.90.30.68 (2.63 *)
RME1-50056.06.021.88.86.41.00.28 (0.76 *)
RME2-50069.410.411.00.18.30.70.95 (2.84 *)
* Ratio from bulk composition.
Table 5. Textural properties of the RMP samples from N2 physisorption analysis.
NameBET Surface Area (m2/g)Total Pore Volume (cm3/g)Average Pore Diameter (nm)
RMP1-5002240.344.7
RMP1-7001170.328.4
RMP2-5003110.203.0
RMP2-7002200.163.0
Table 6. Binding energies of electrons coming from different core levels in precipitated red mud samples calcined at 500 °C.
SampleBinding Energy/eV
O1sFe2p3/2Al2pCl2p3/2Na1sCa2p3/2C1s *
OIOIIOIII
RMP1530.0531.4533.0711.374.4199.61072.6347.6285.0
RMP2530.2531.6533.0711.674.4--347.6285.0
* C1s used as a charge reference for XPS analysis.
Table 7. Atomic percentages from XPS analyses of elements in precipitated red mud samples calcined at 500 °C.
OFeAlClNaCaFe/Al Ratio
RMP1-50059.34.628.02.65.00.50.16 (2.34 *)
RMP2-50067.514.816.0--1.70.93 (2.41 *)
* Ratio from bulk composition.
Table 8. Light-off temperature of the RM and RMP samples for toluene oxidation to CO2.
SampleT50 (°C)Specific Activity at 320 °C (Converted Toluene Moles/s·gFe)
RM-5003601.95 × 10−7
RMP1-5003863.90 × 10−8
RMP1-7004252.20 × 10−8
RMP2-5003105.37 × 10−7
RMP2-7003501.62 × 10−7
Table 9. Nomenclature of the prepared samples.
Sample CodeDescription
RM-500Unmodified red mud calcined at 500 °C
RMP1-500Leaching with hydrochloric acid, precipitated, calcined at 500 °C
RMP1-700Leaching with hydrochloric acid, precipitated, calcined at 700 °C
RMP2-500Leaching with oxalic acid + l-ascorbic acid, precipitated, calcined at 500 °C
RMP2-700Leaching with oxalic acid + l-ascorbic acid, precipitated, calcined at 700 °C
RME1-500Leaching with hydrochloric acid, evaporated, calcined at 500 °C
RME2-500Leaching with oxalic acid + l-ascorbic acid, evaporated, calcined at 500 °C
Publisher’s Note: MDPI stays neutral with regard to jurisdictional claims in published maps and institutional affiliations.

