
Effect of Reaction Time and Hydrothermal Treatment Time on the Textural Properties of SBA-15 Synthesized Using Sodium Silicate as a Silica Source and Its Efficiency for Reducing Tobacco Smoke Toxicity

 ,
,
Abstract
:
1. Introduction
2. Results and Discussion
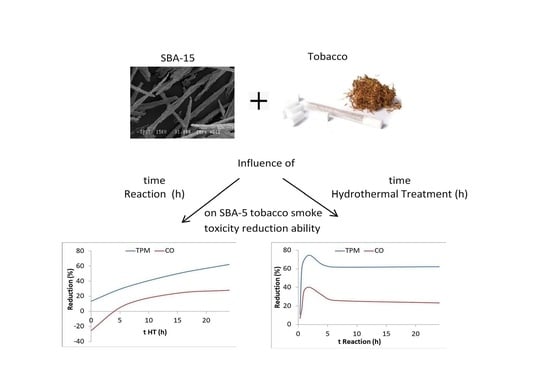
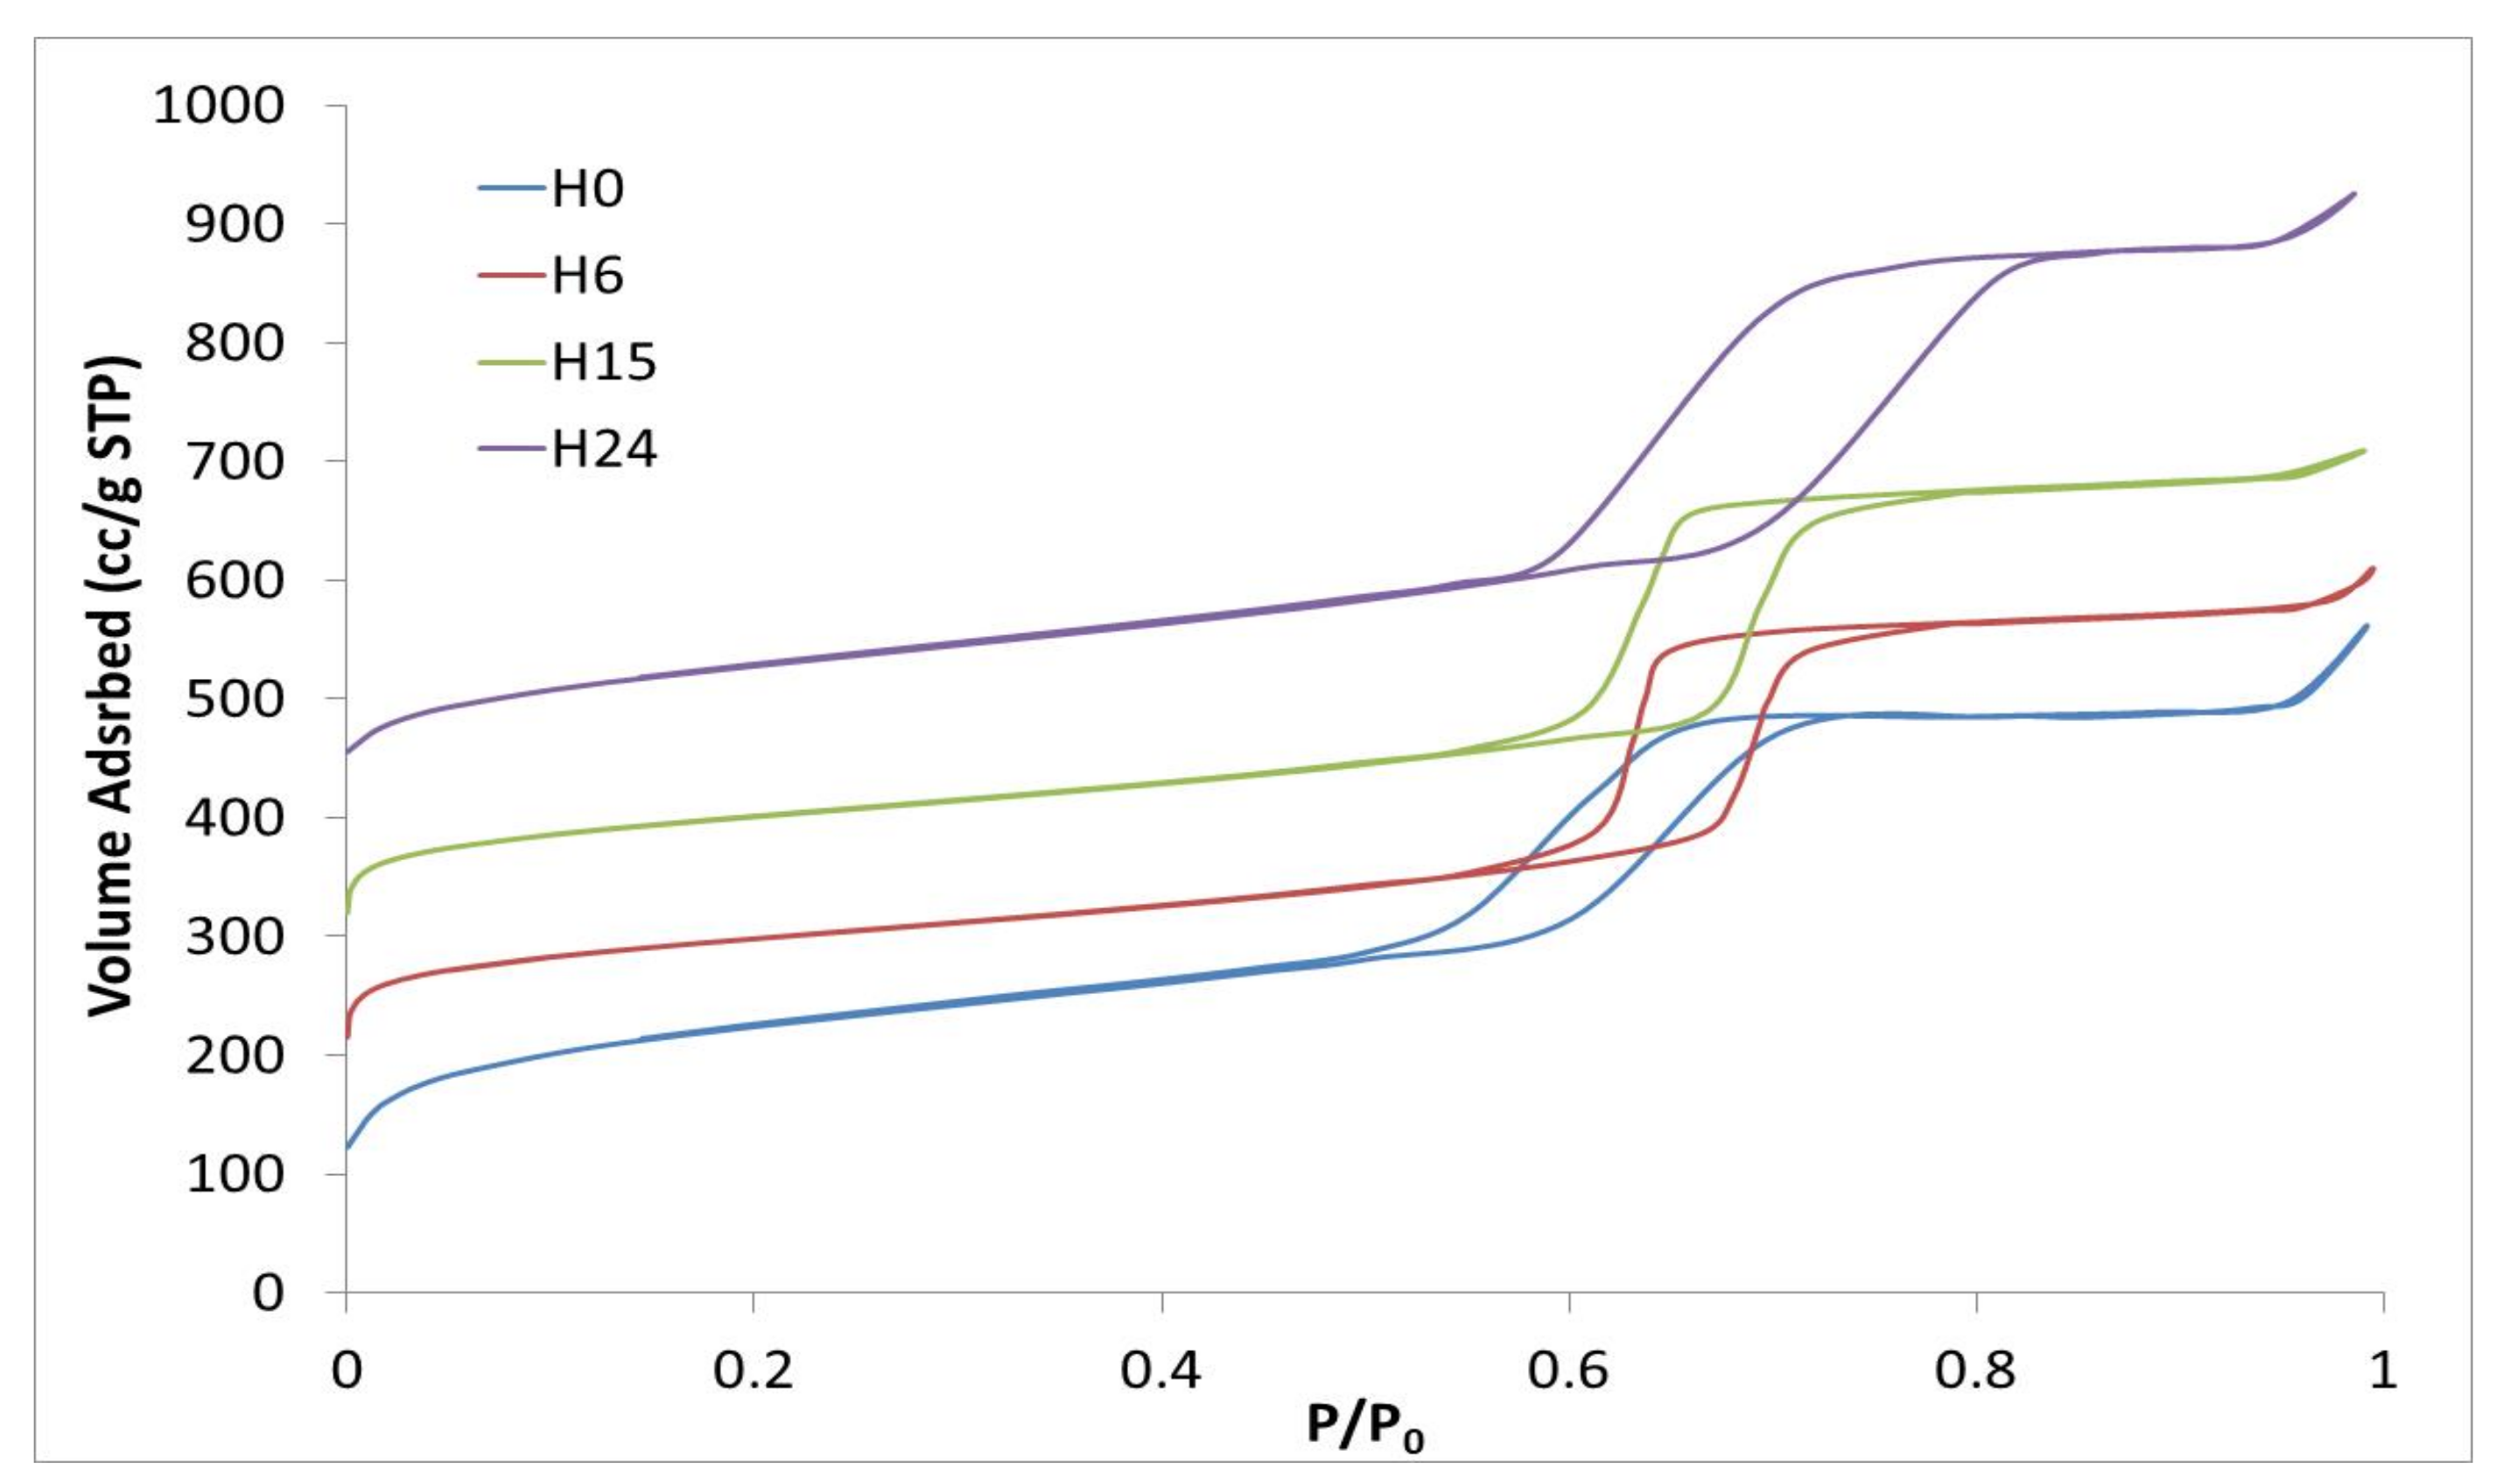
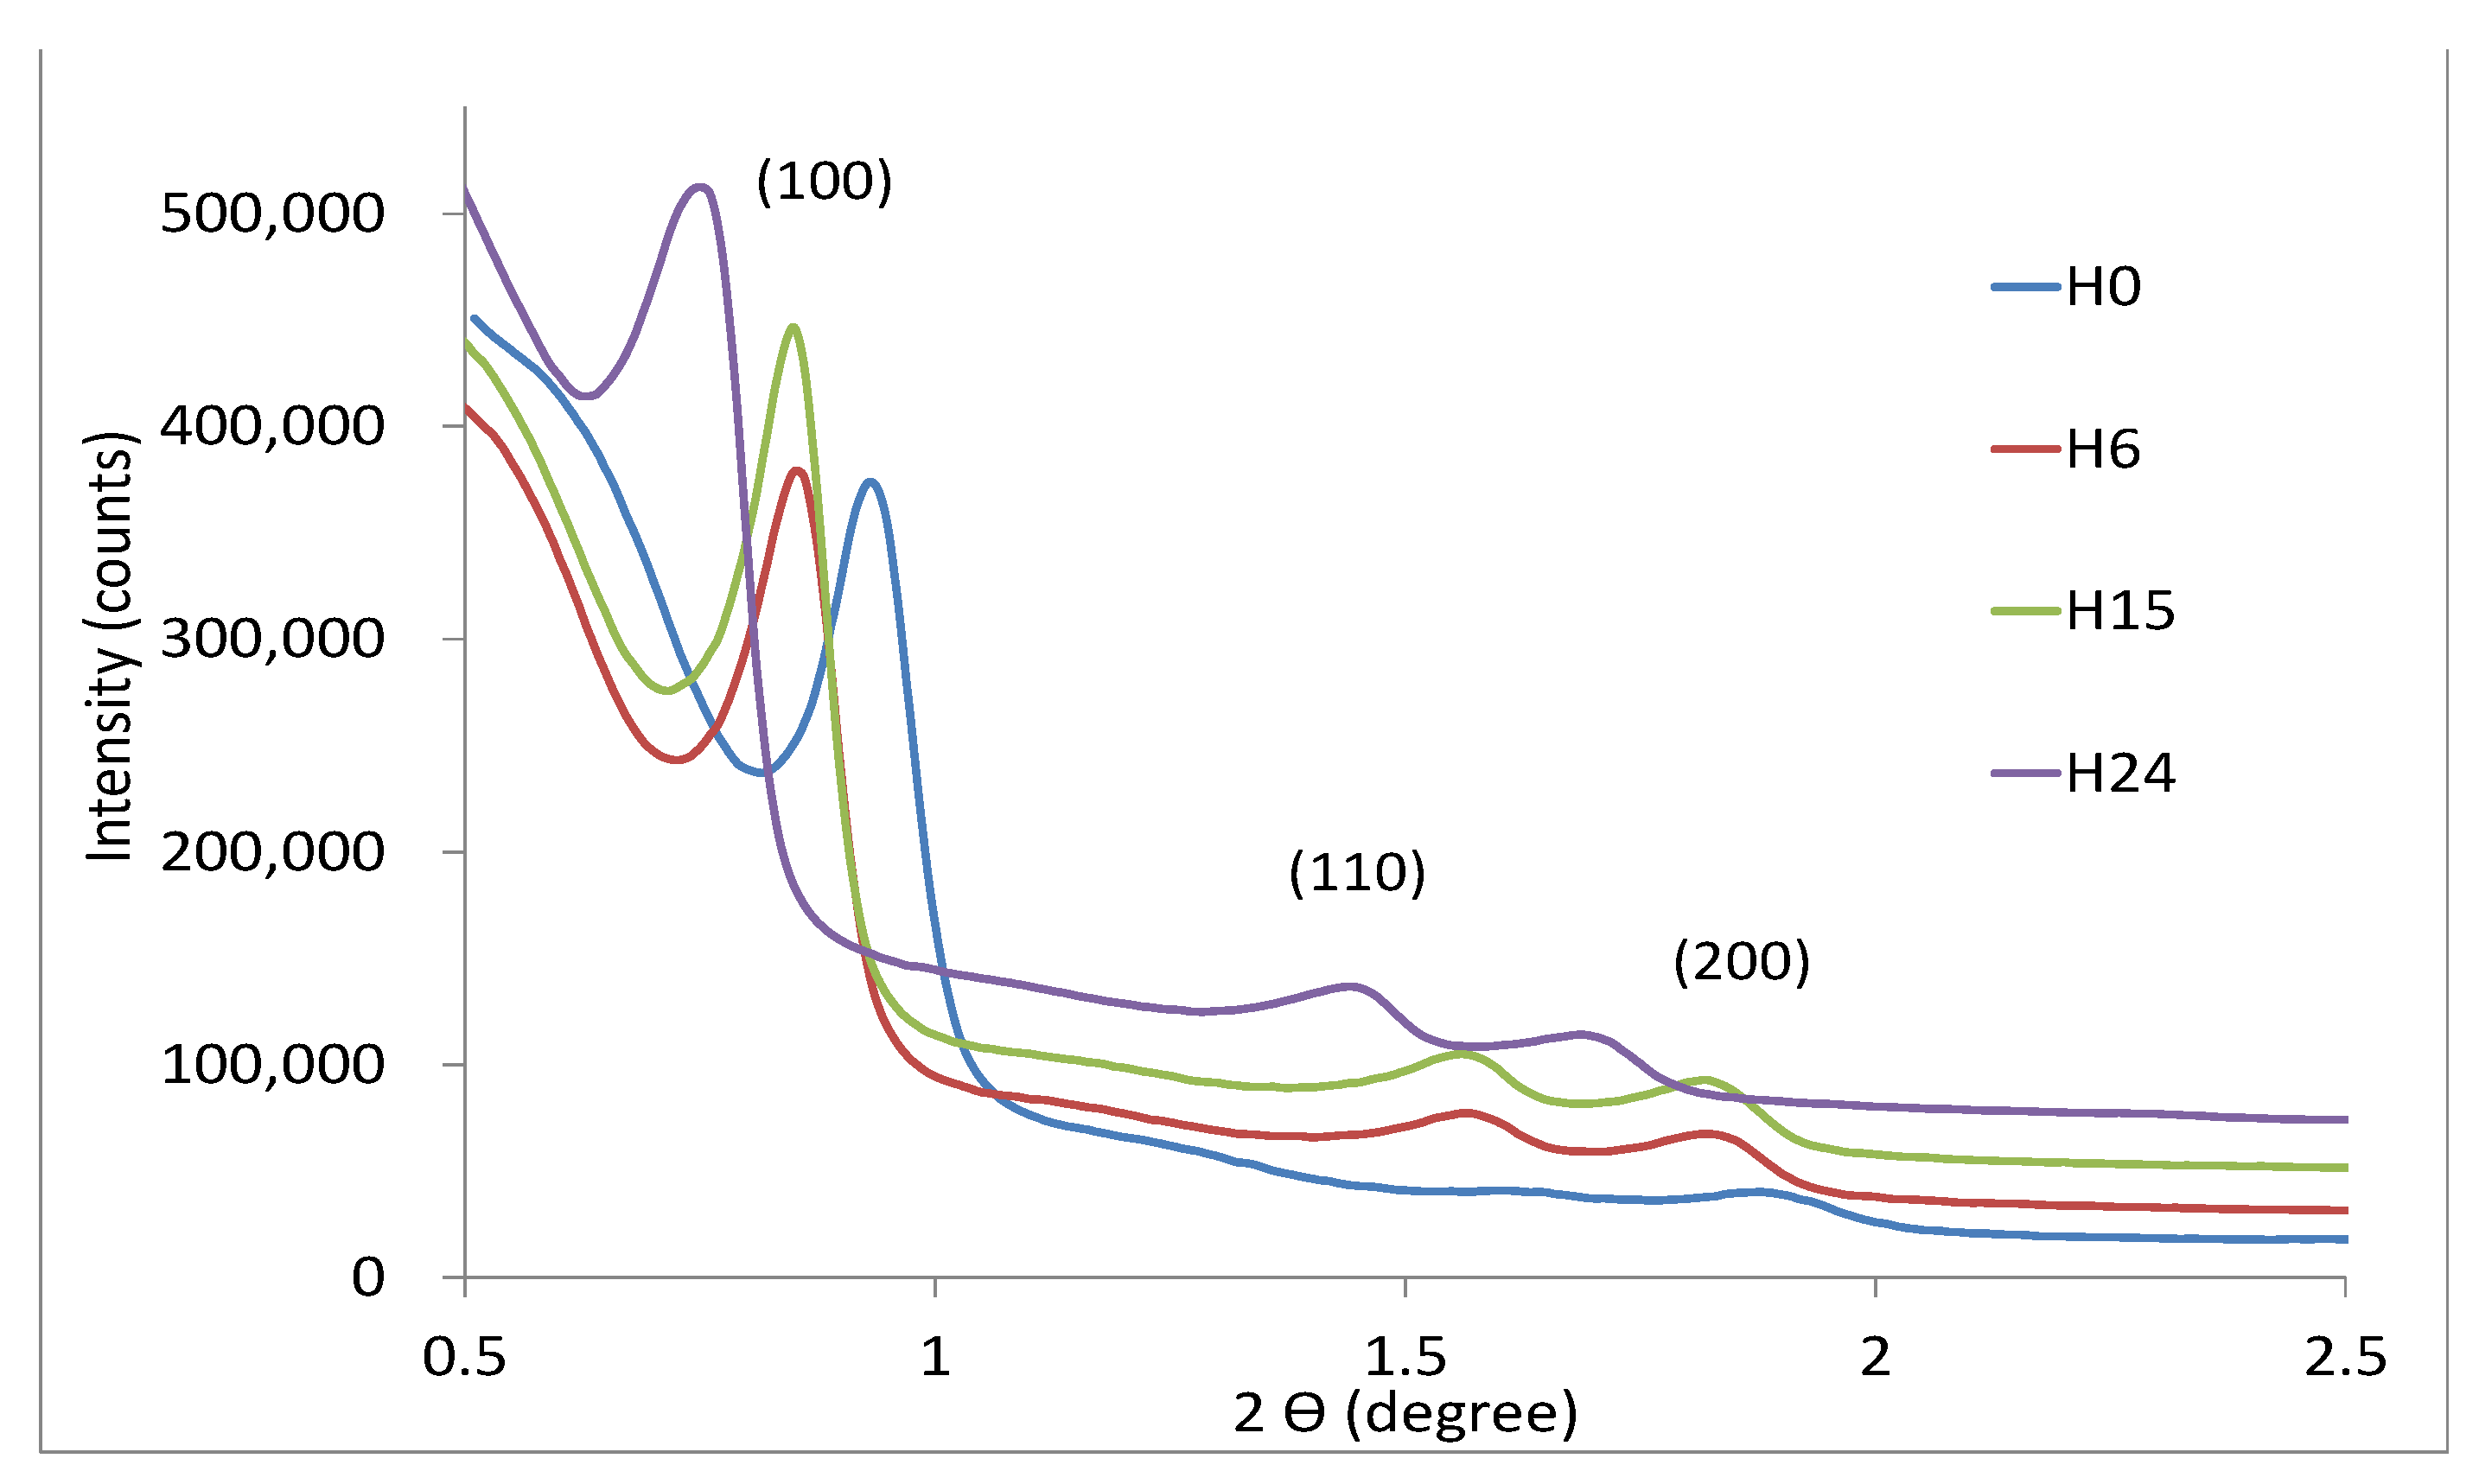
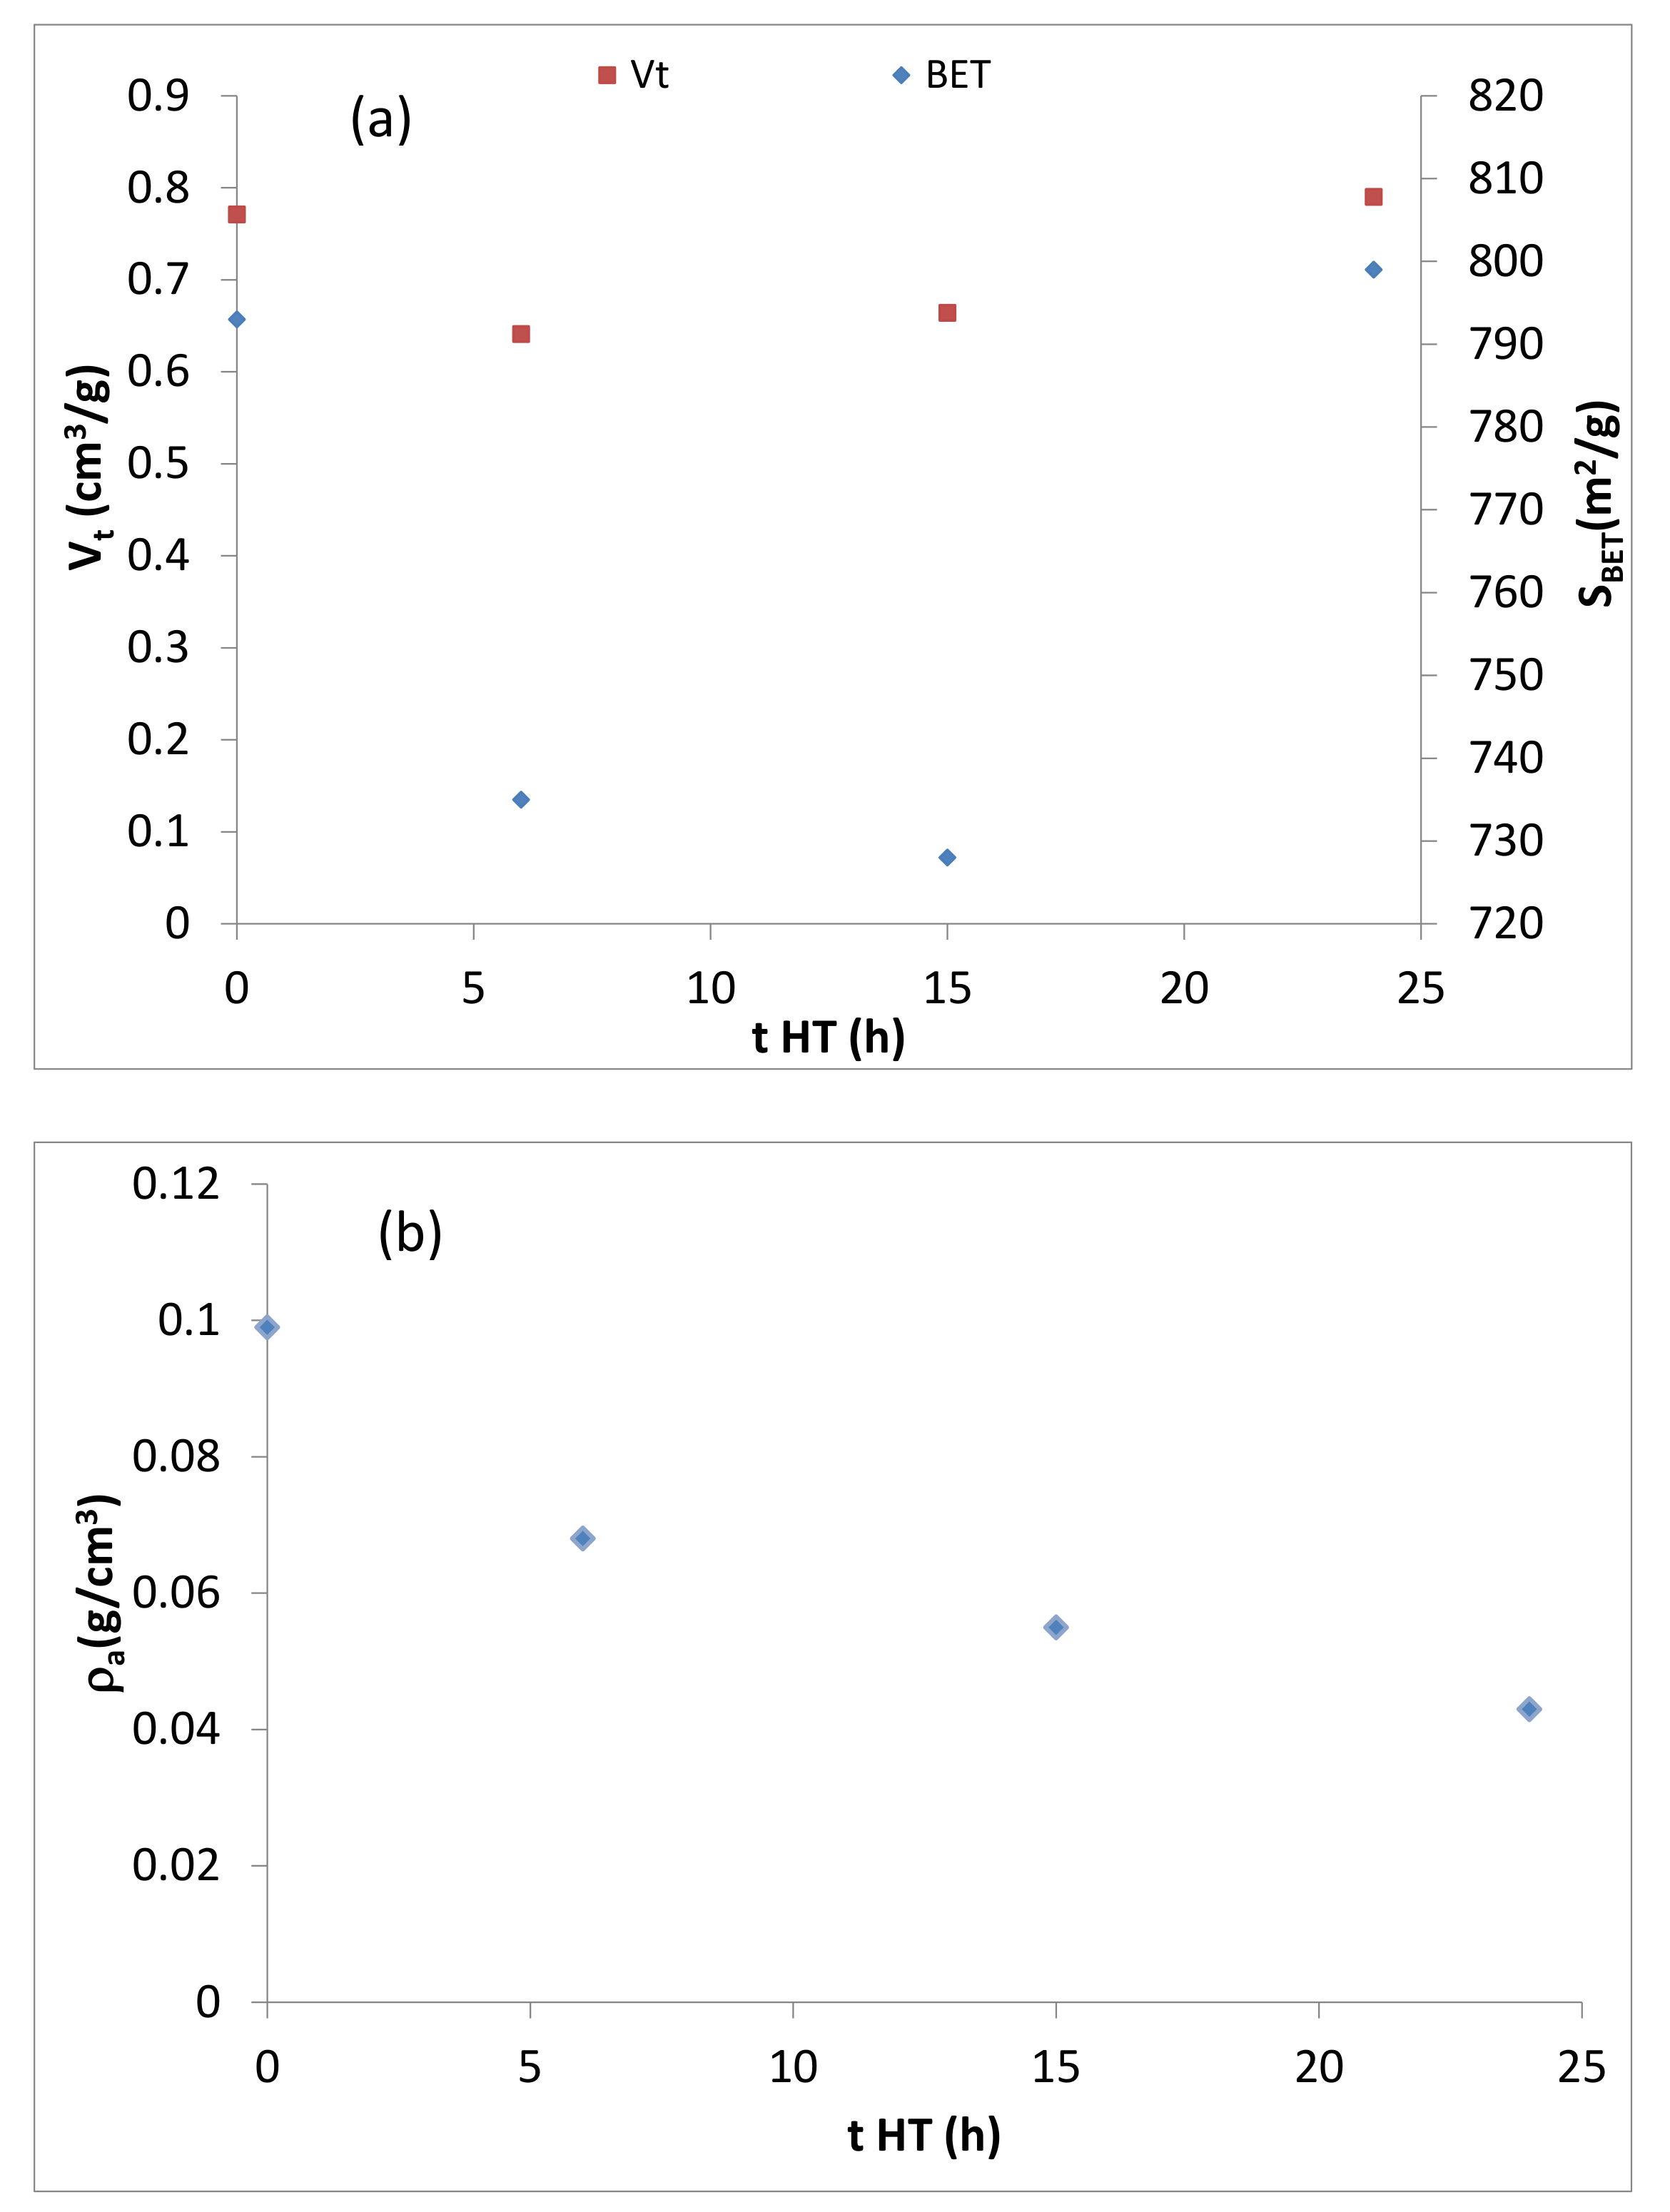
2.1. Study of Hydrothermal Treatment Time
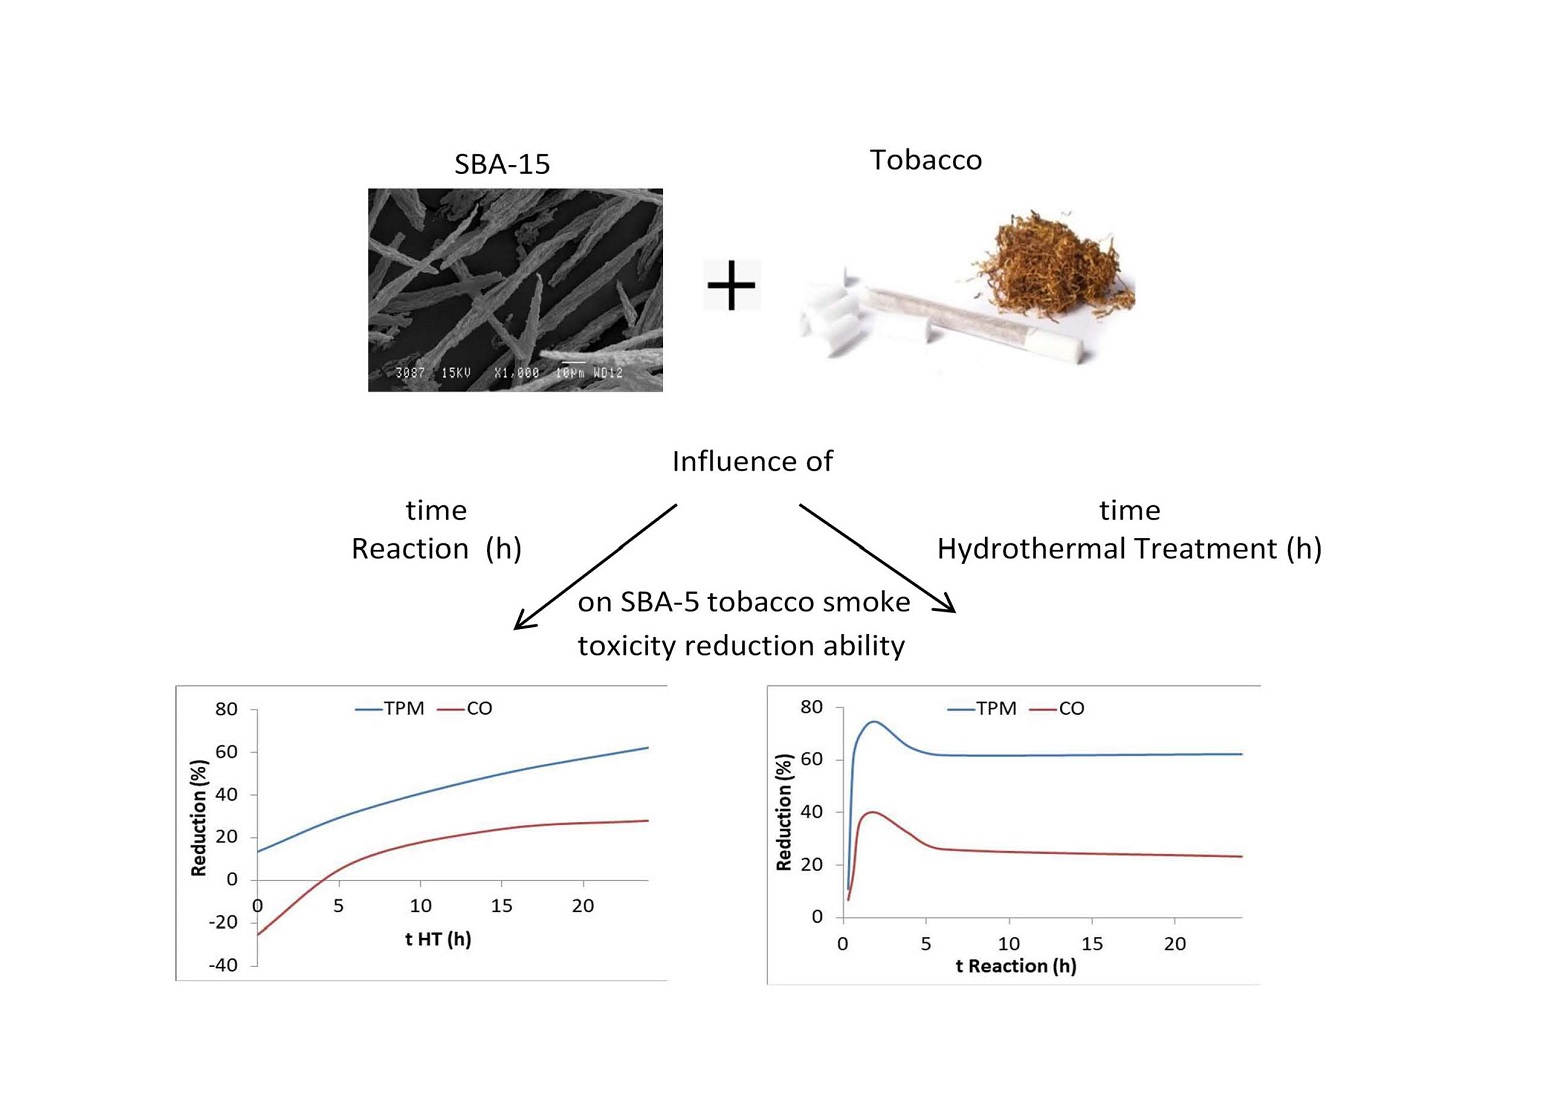
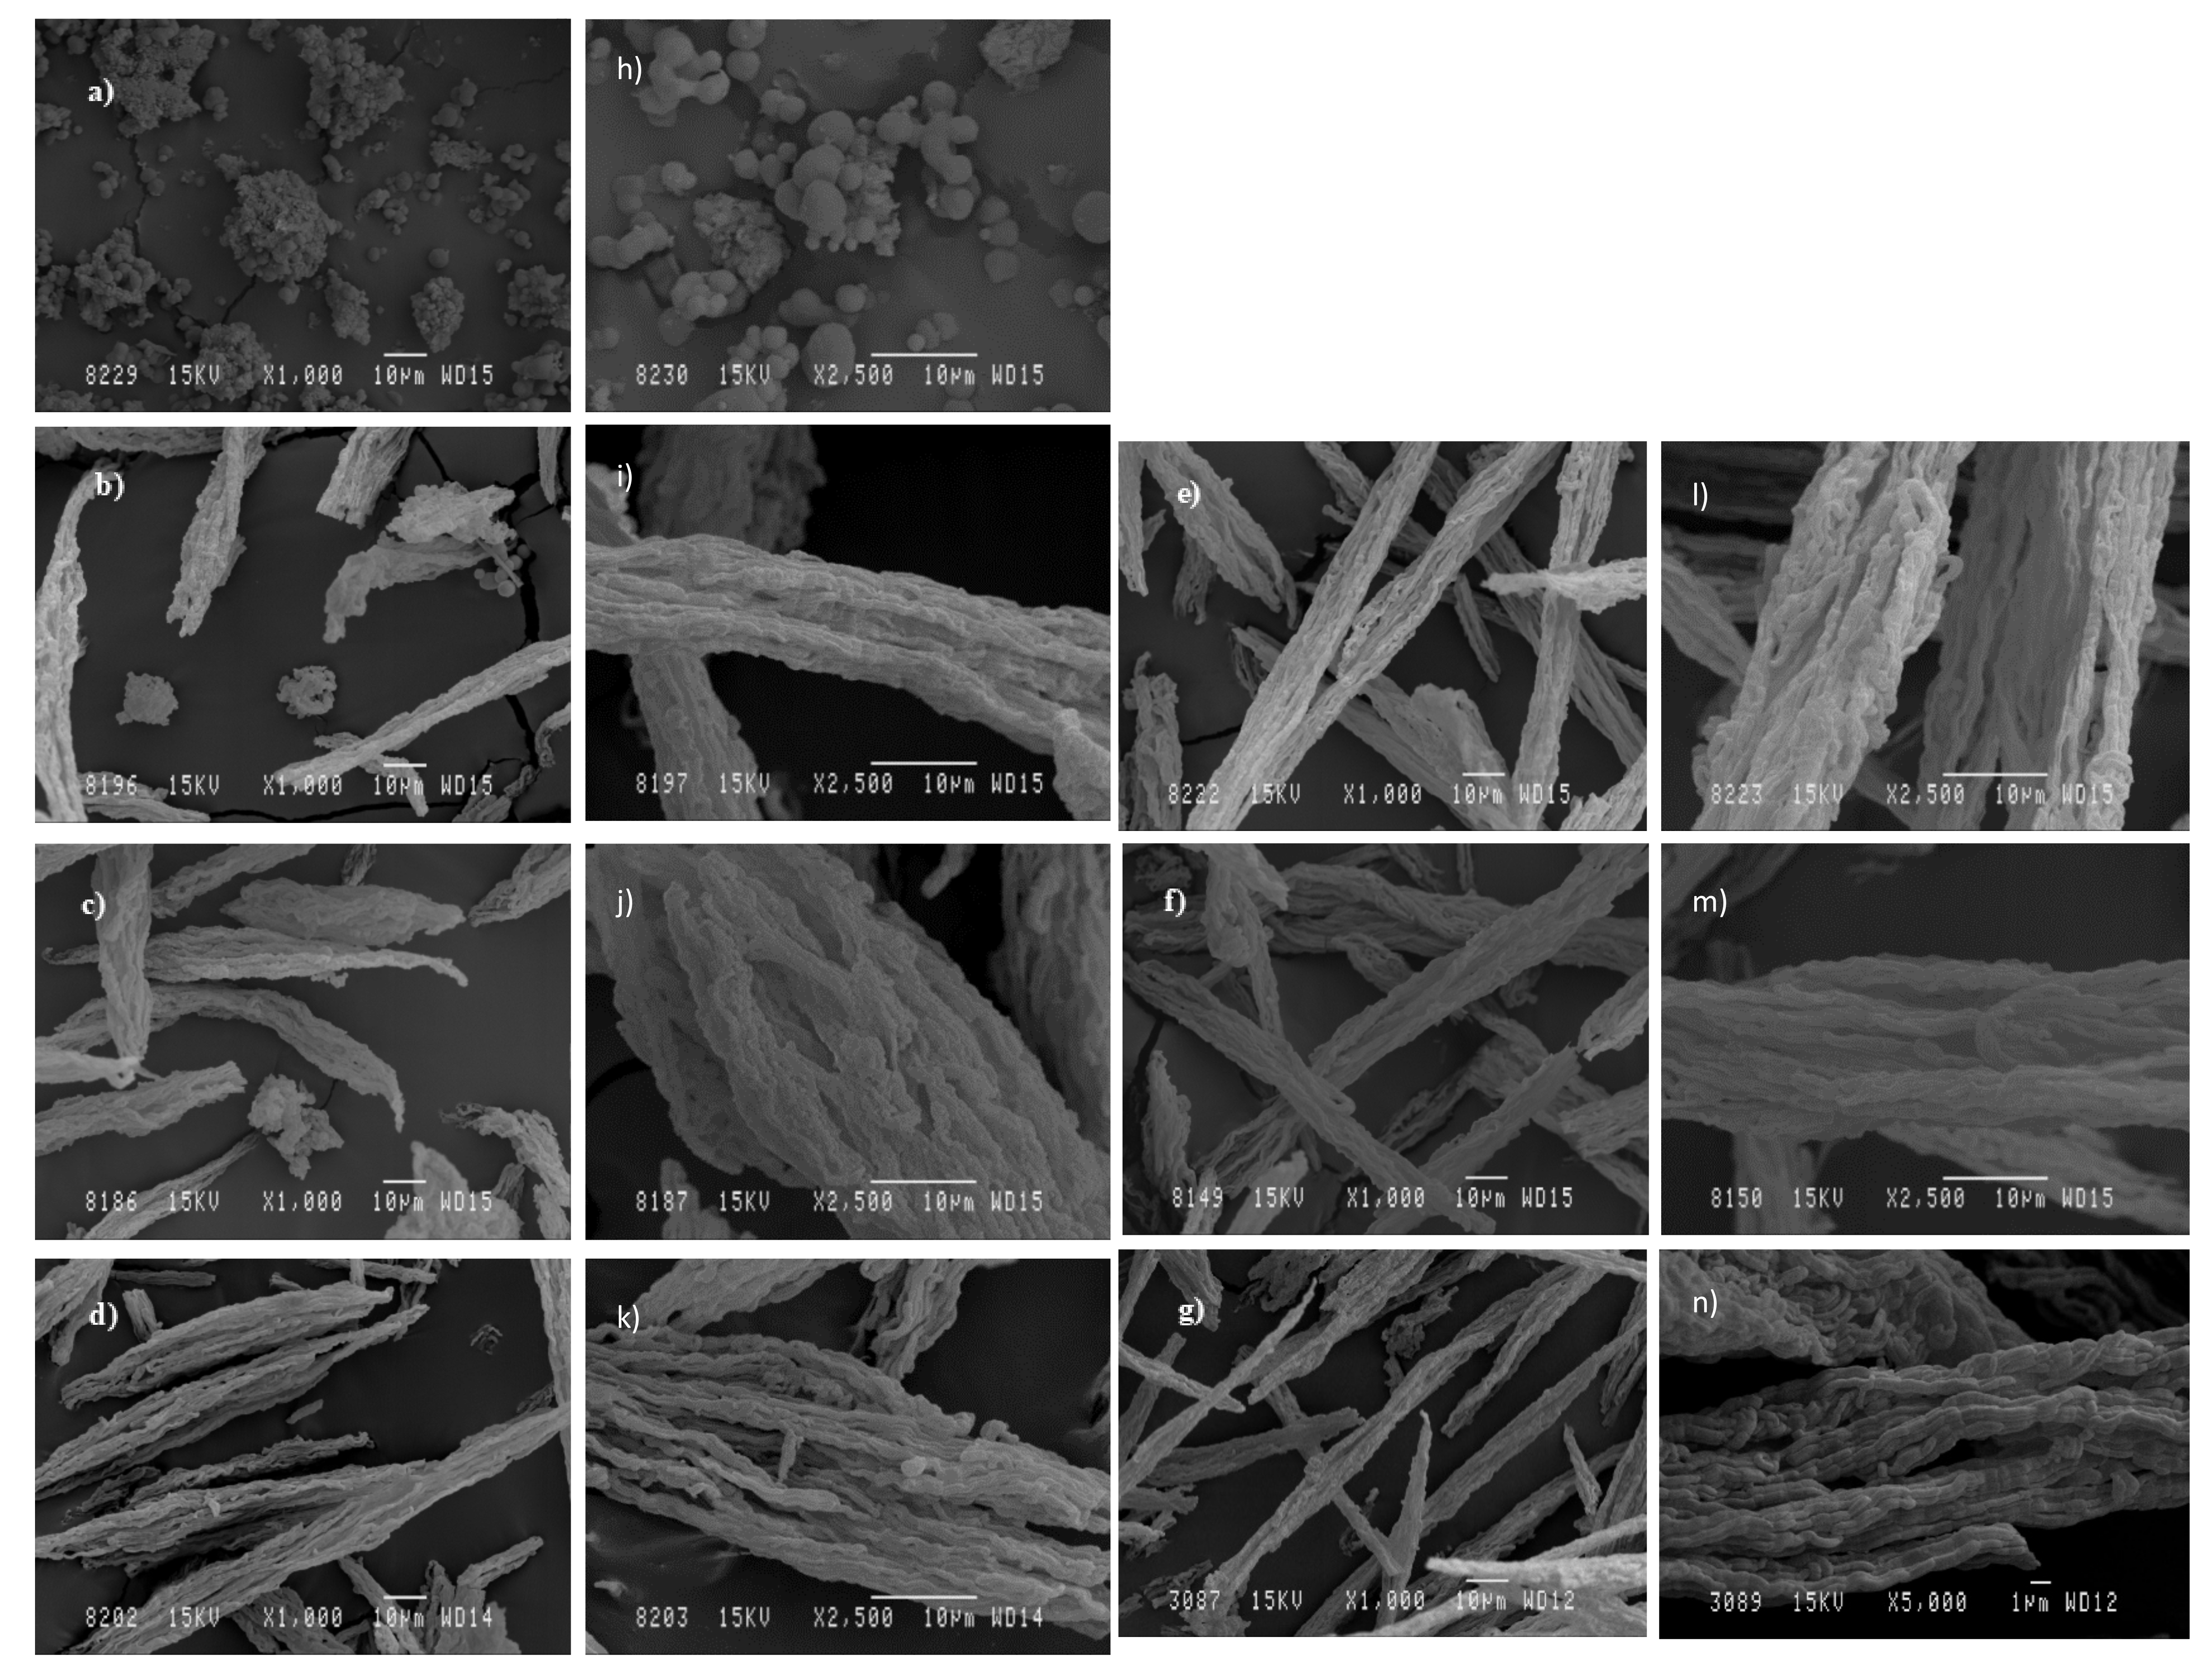
2.1.1. SBA-15 Characterization
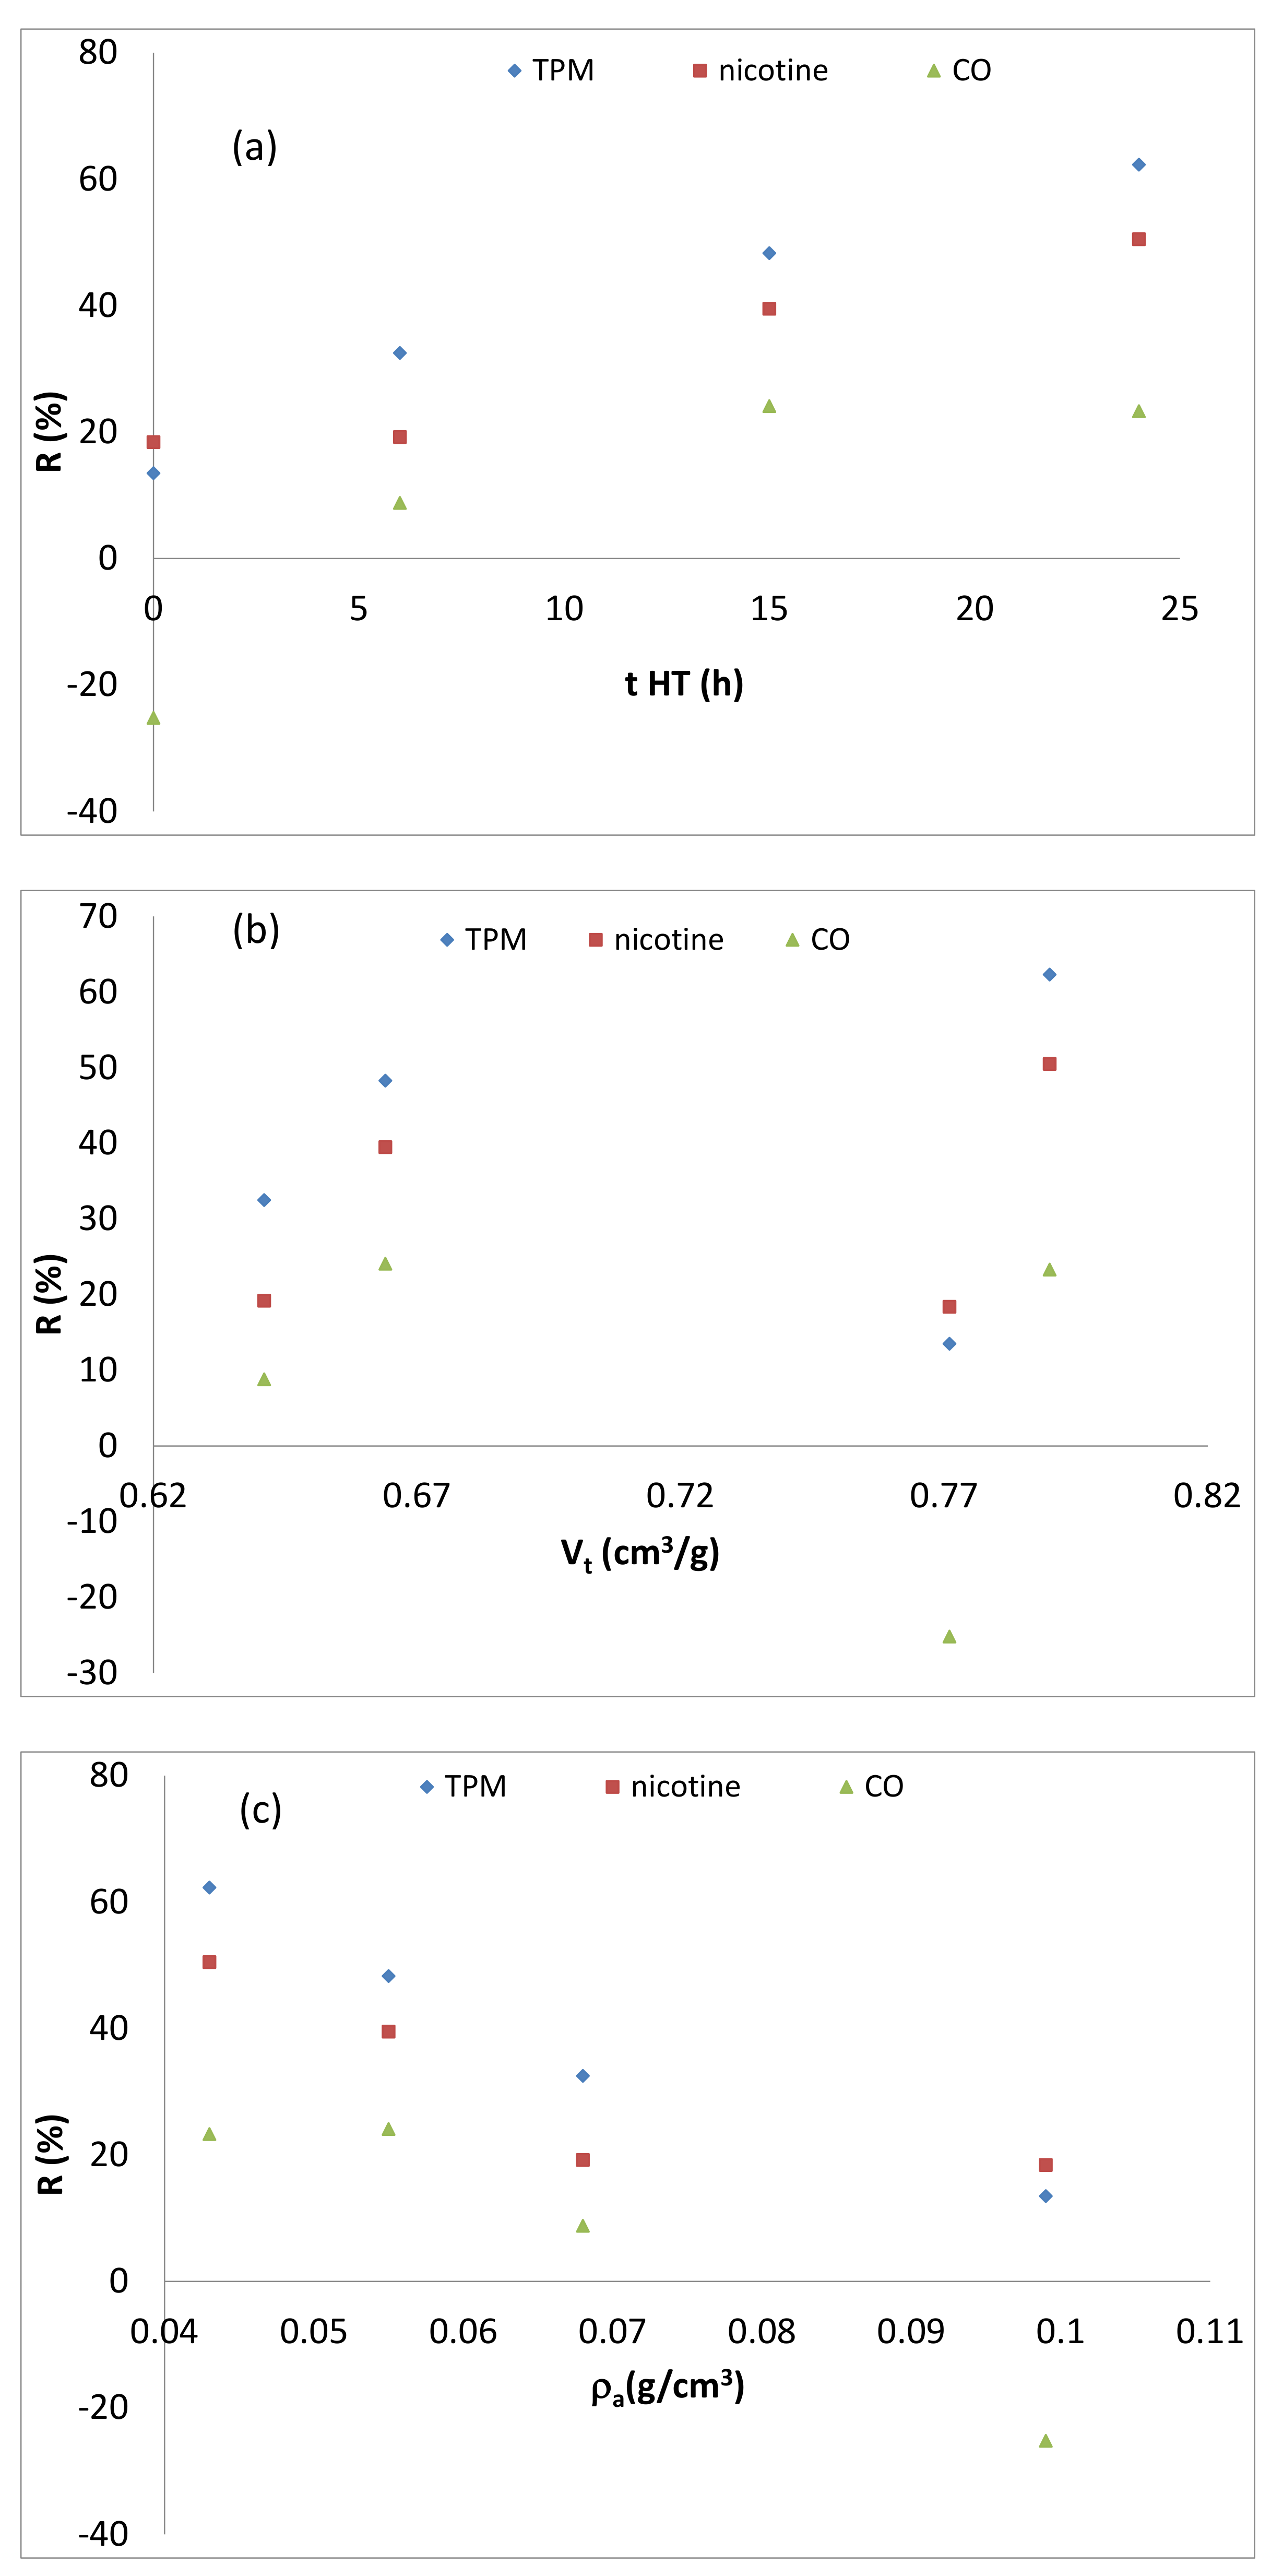
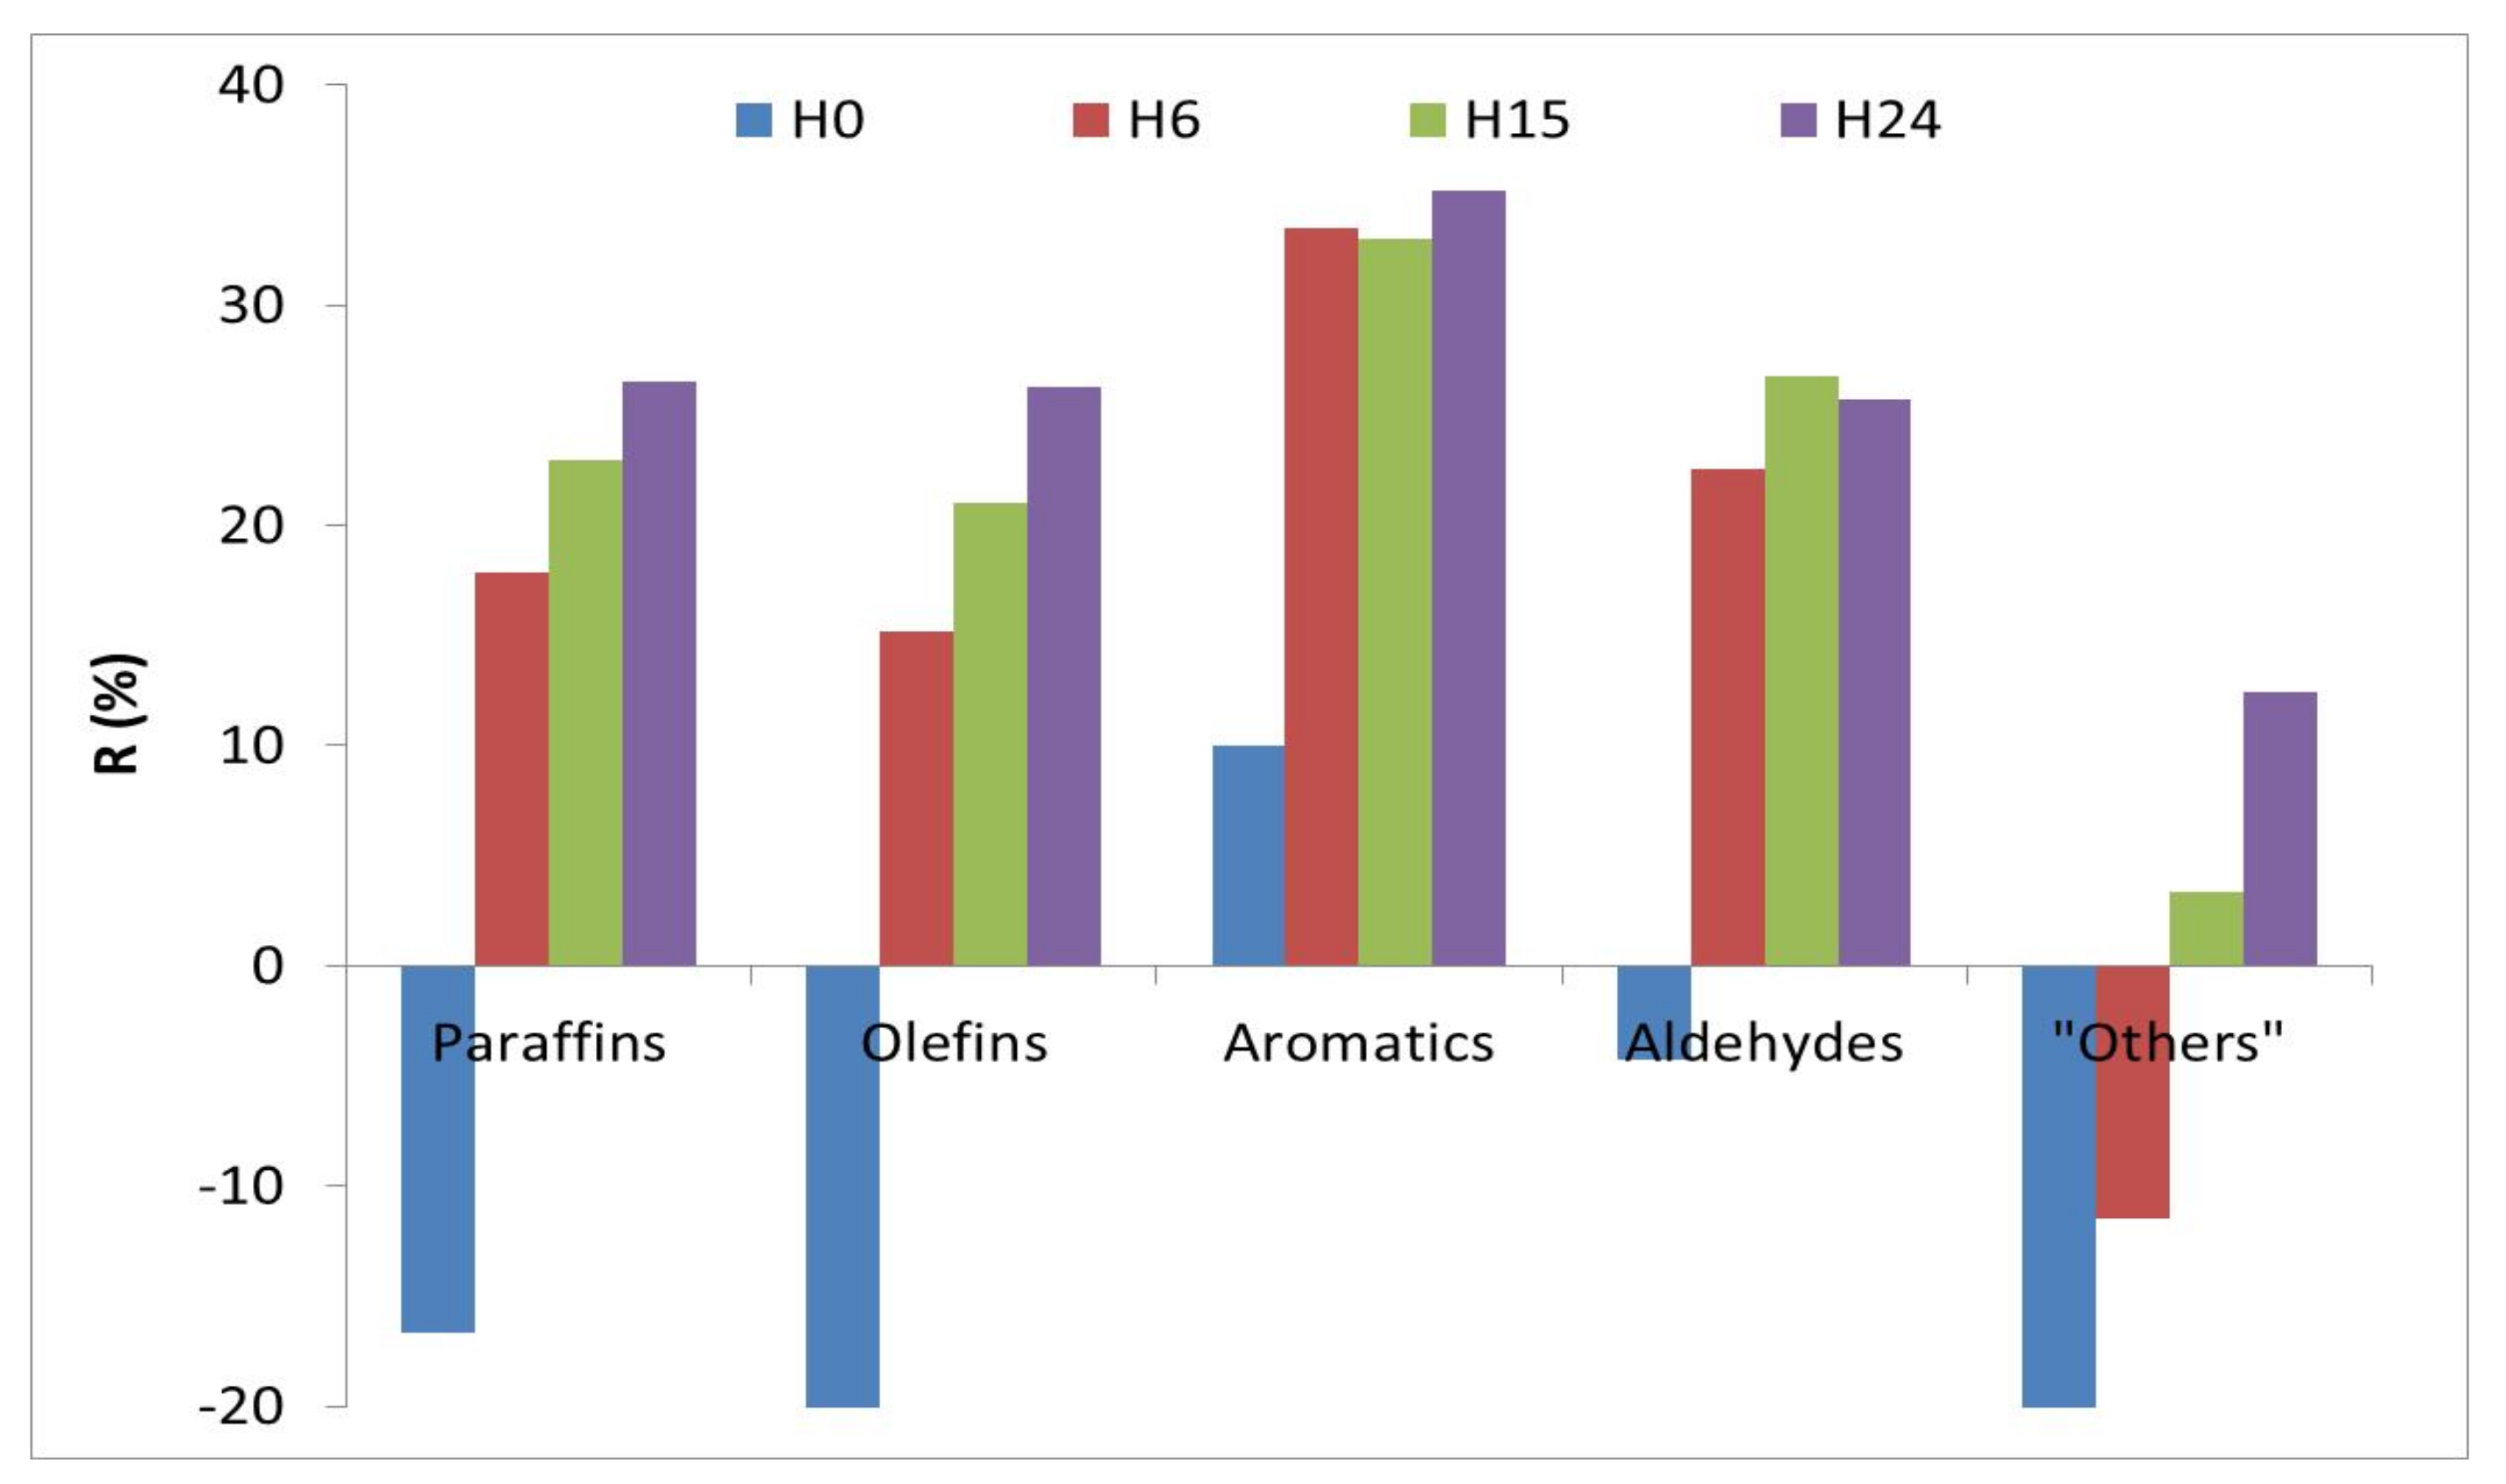
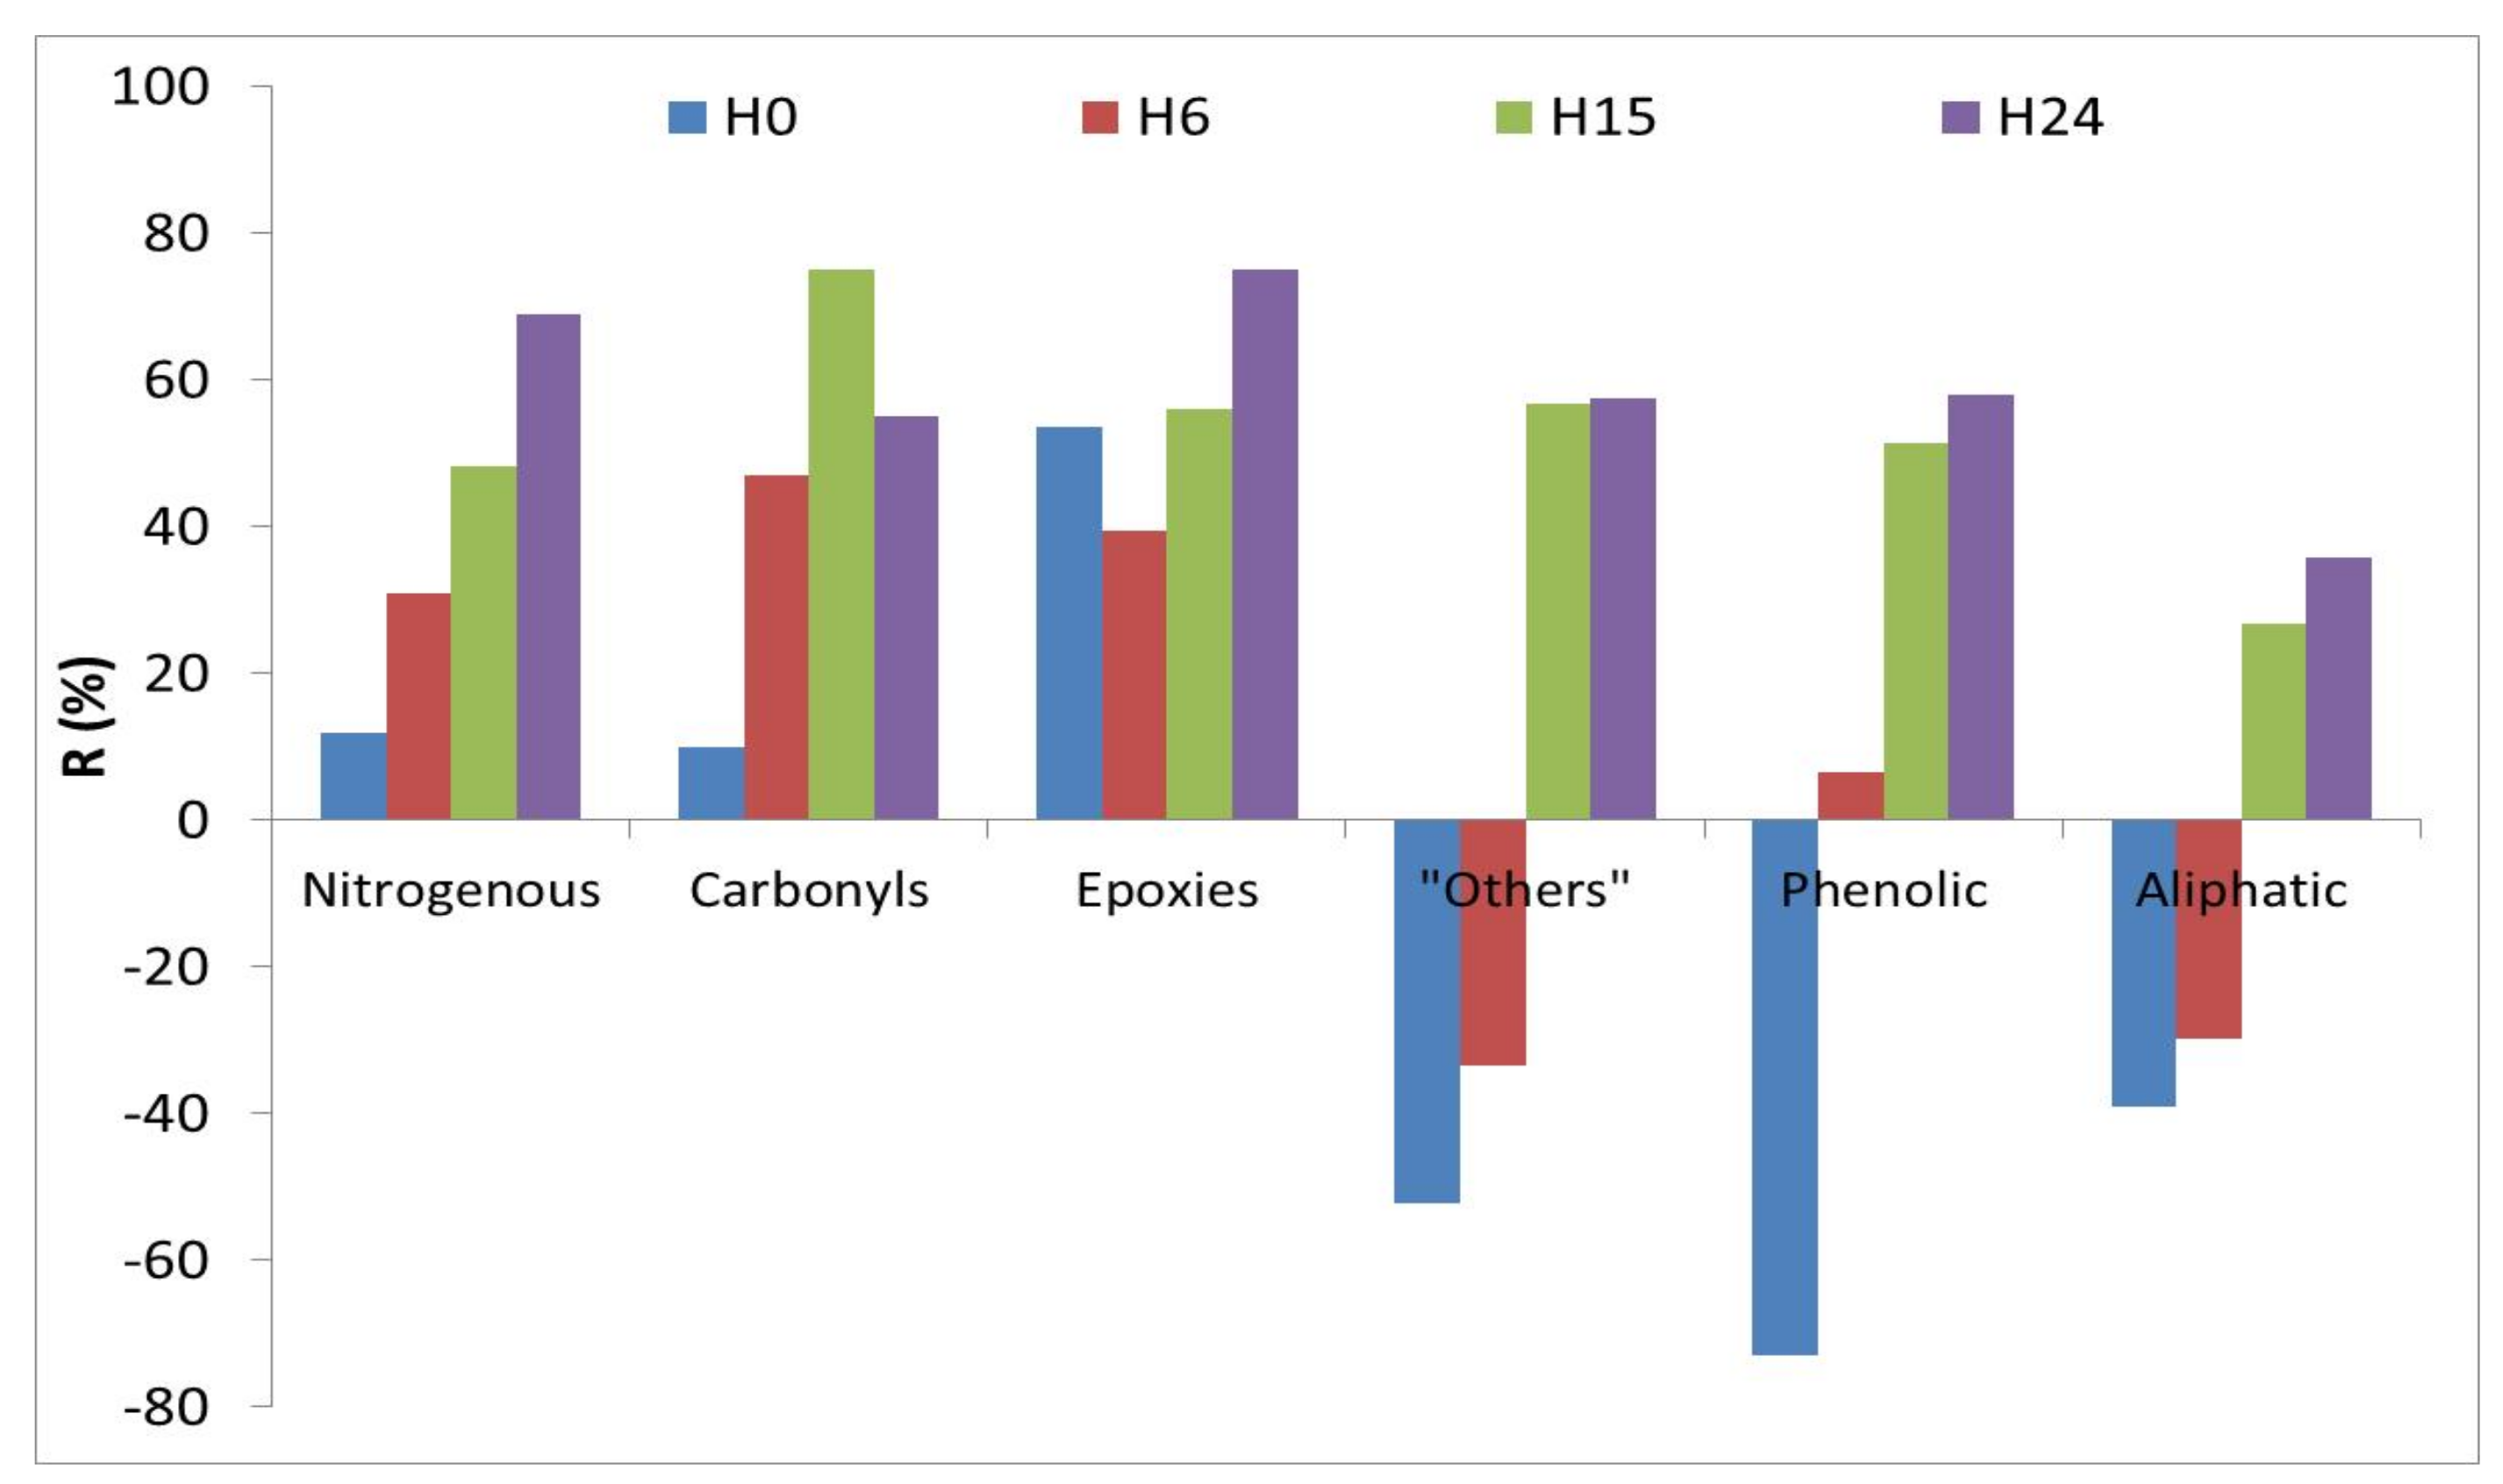
2.1.2. Products Generated during the Smoking Process
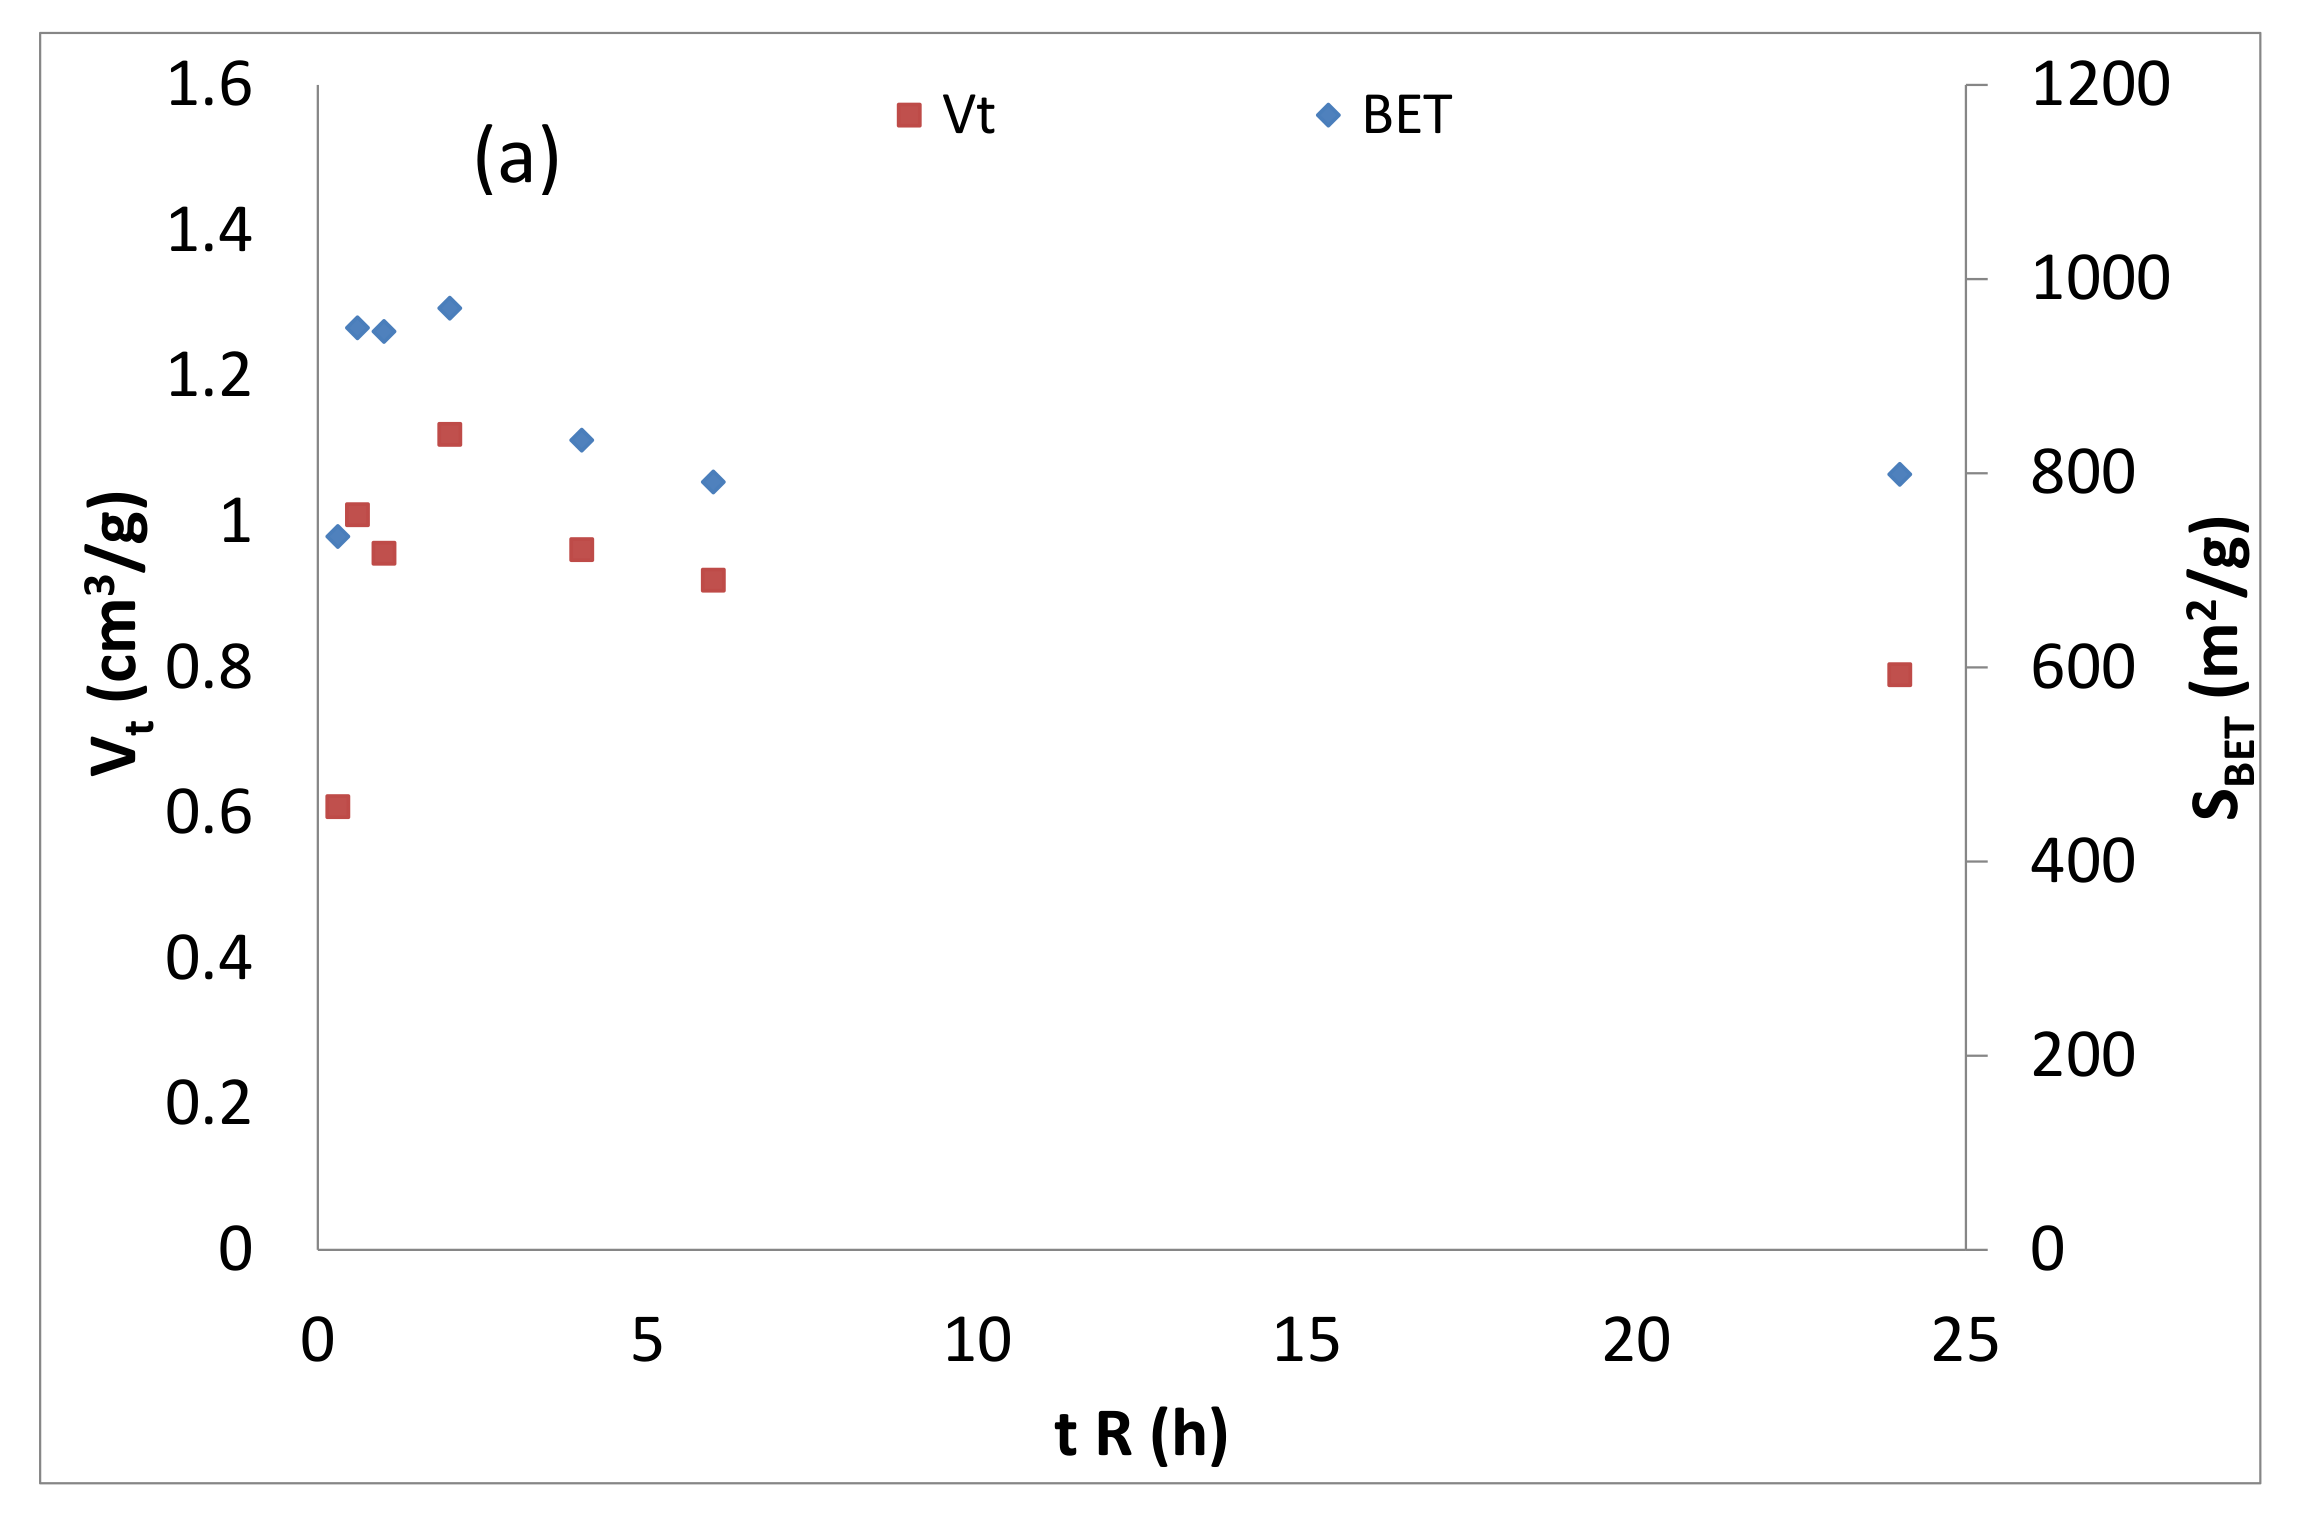
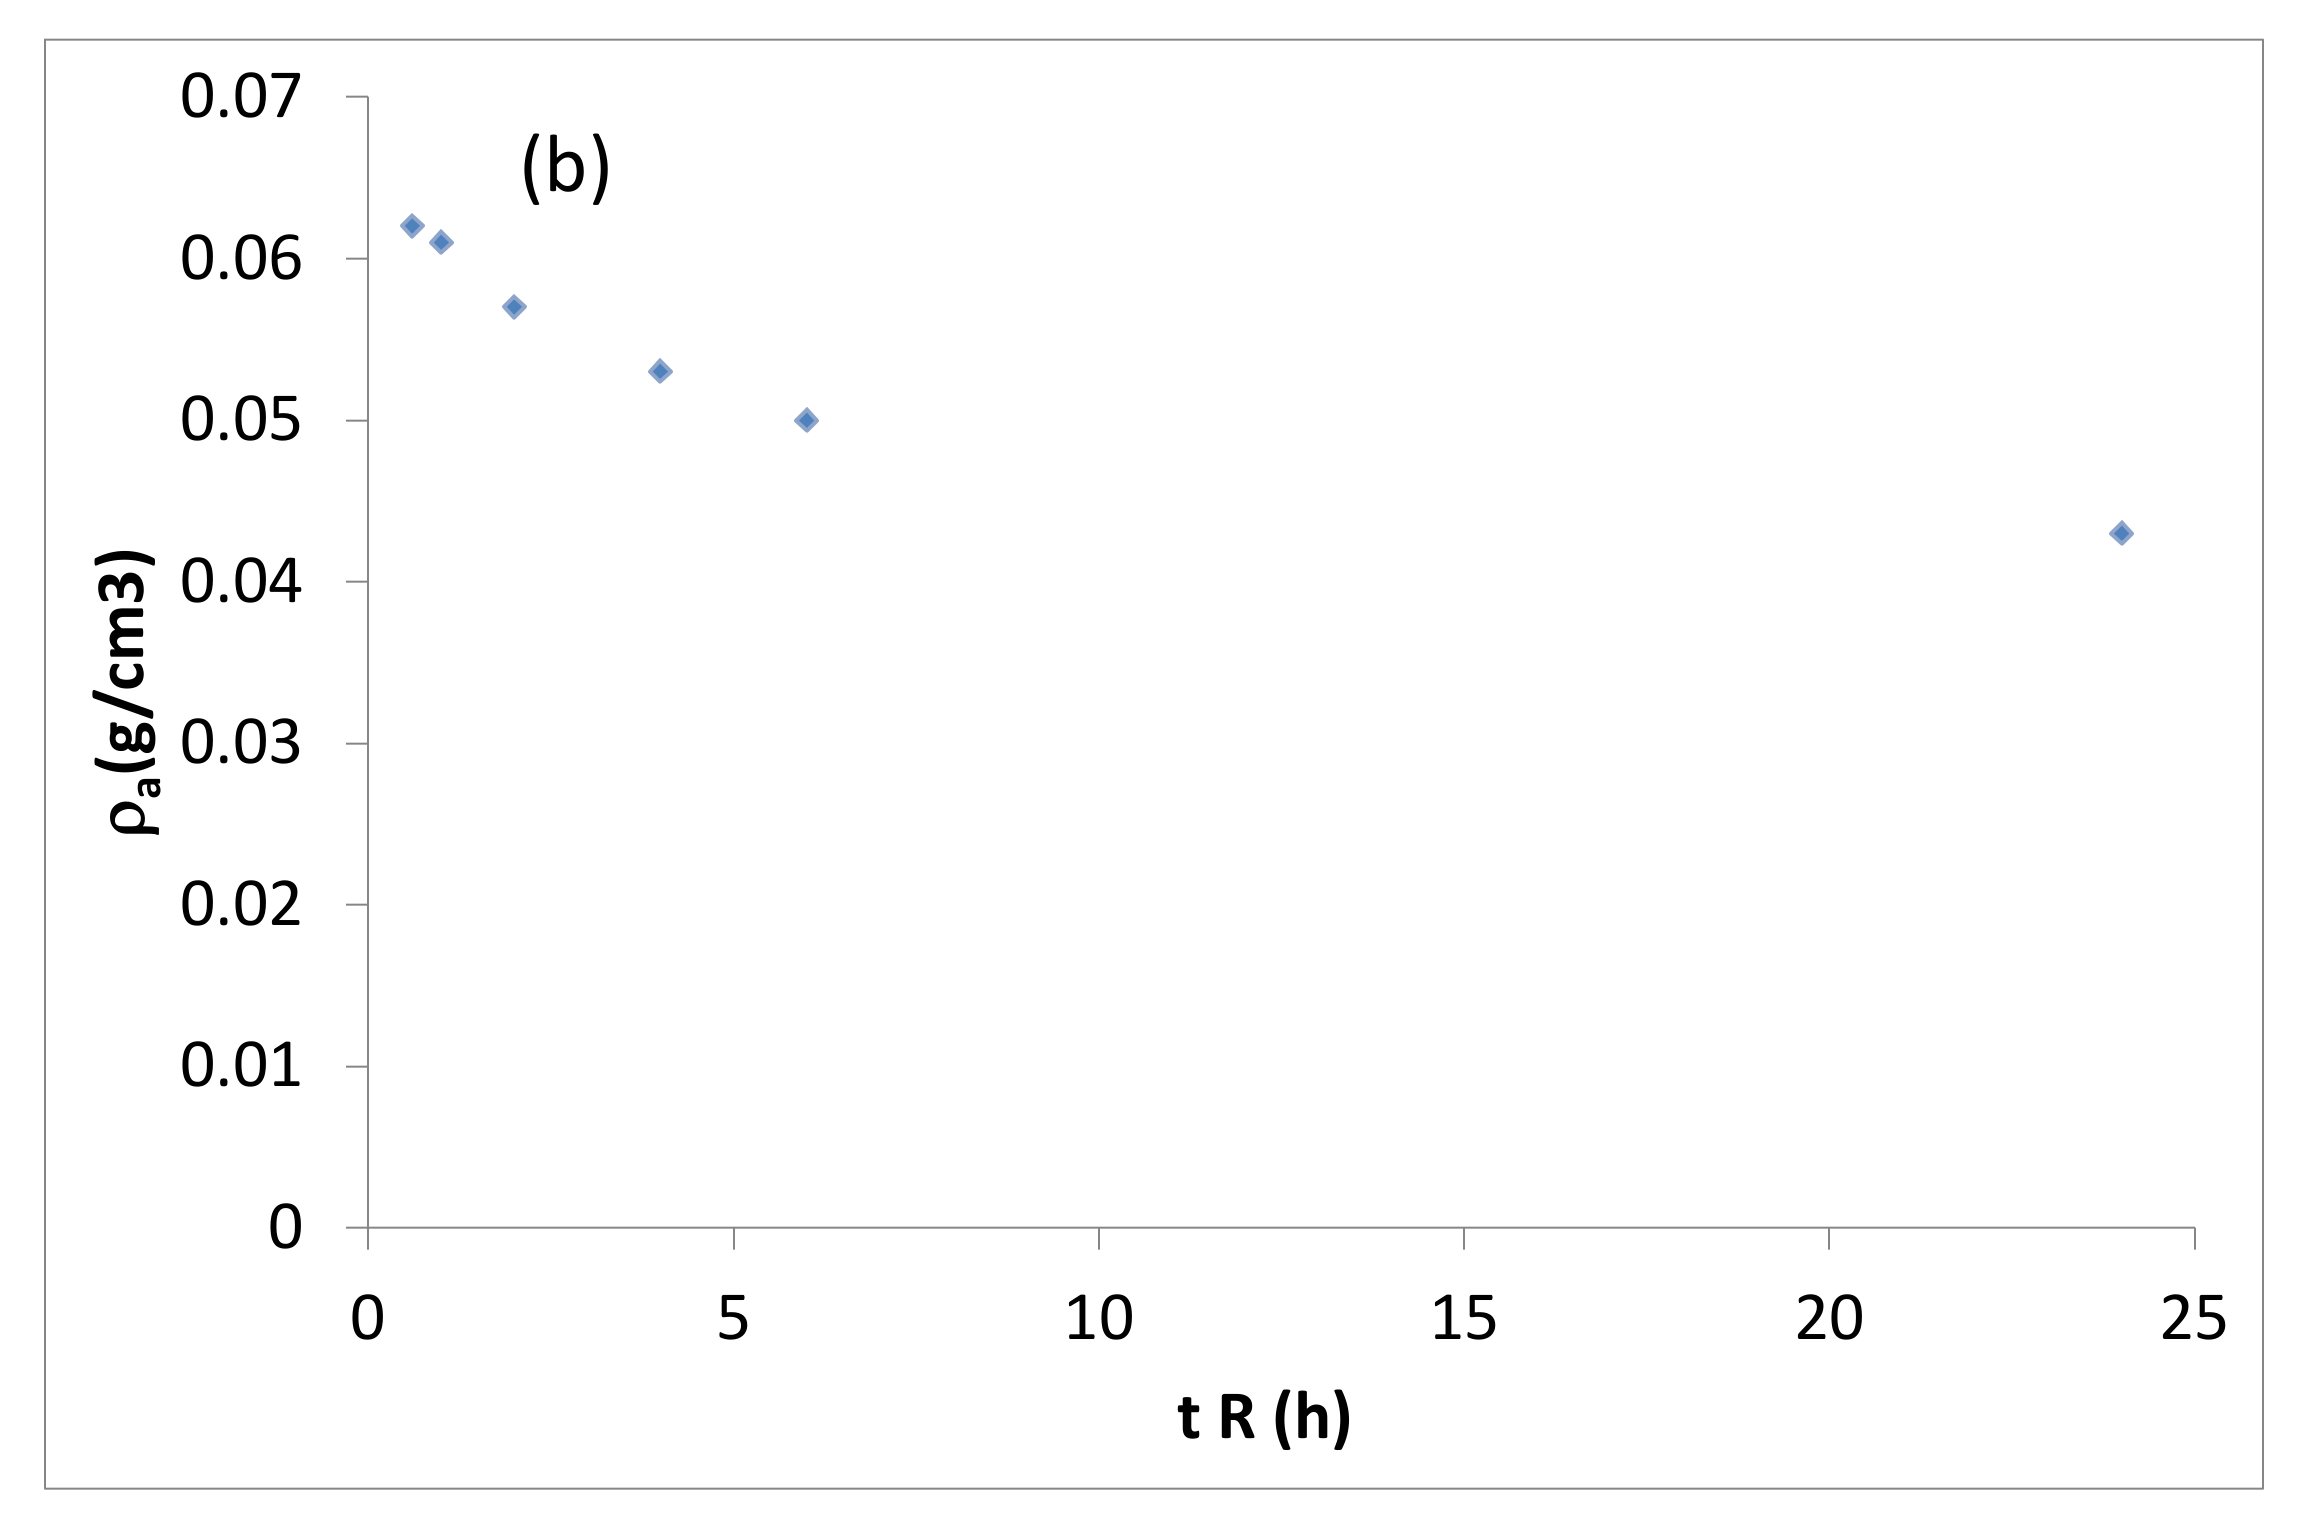
2.2. Study of Reaction Time
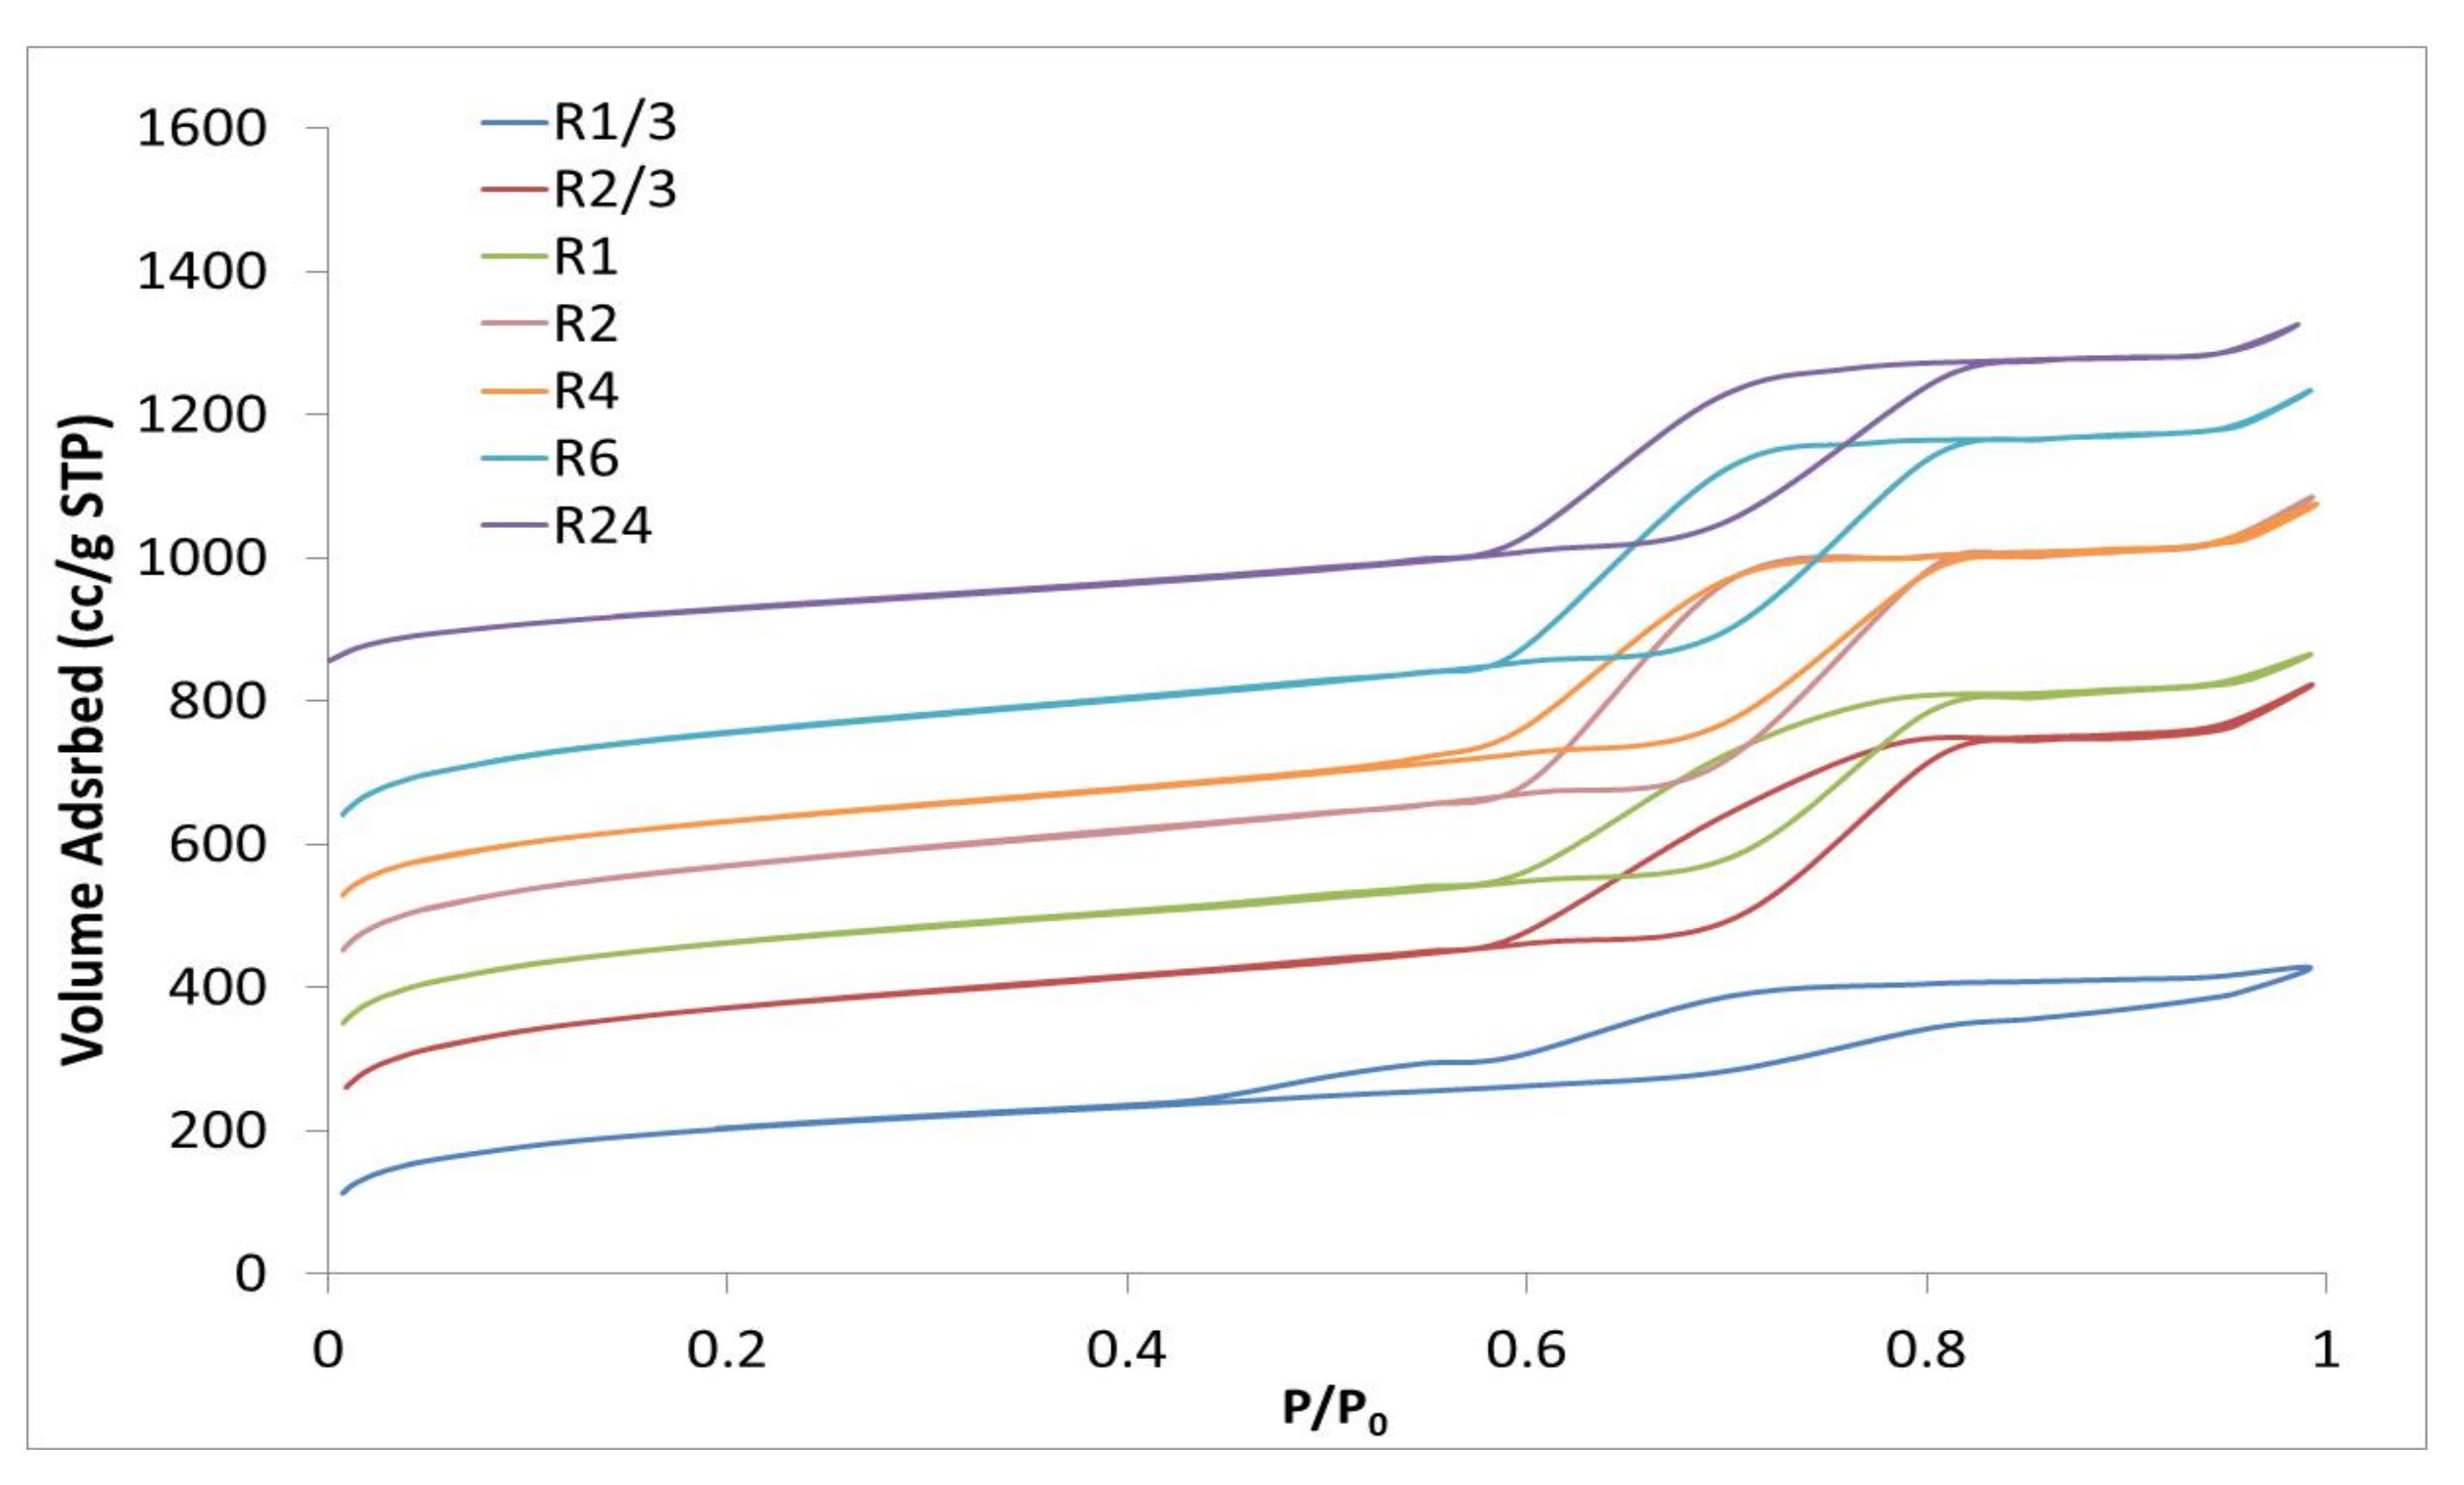
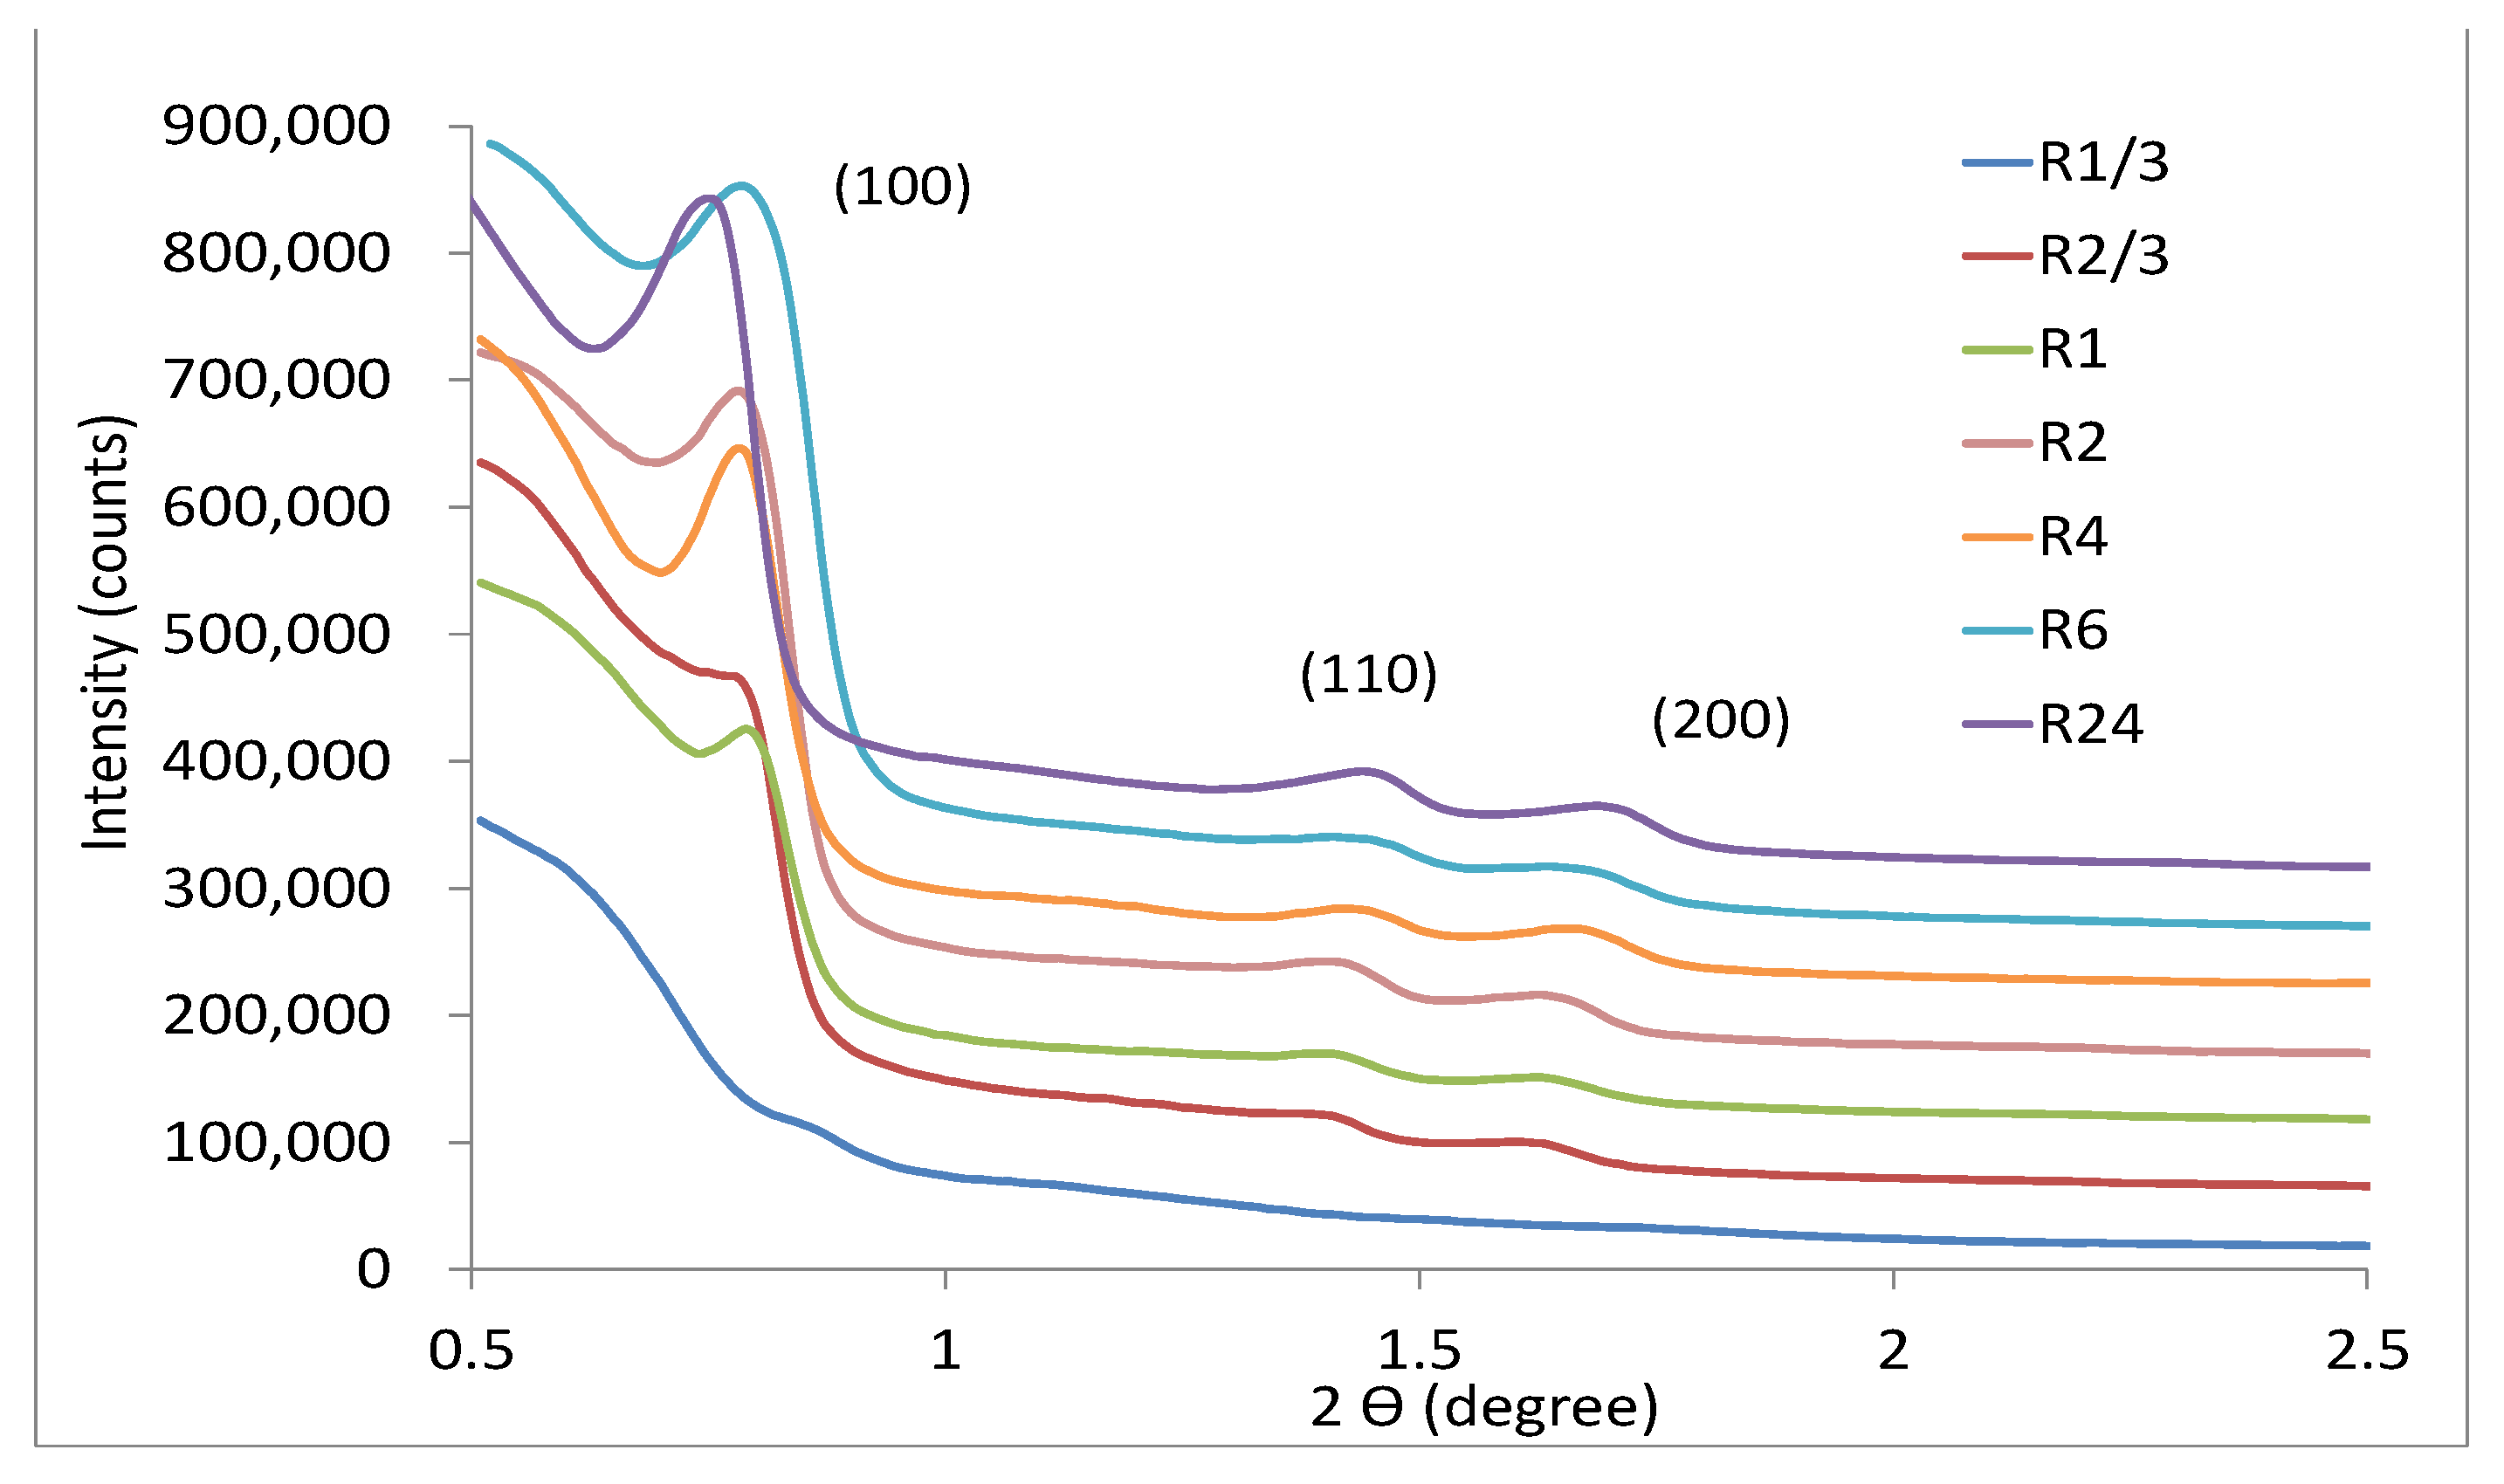
2.2.1. SBA-15 Characterization
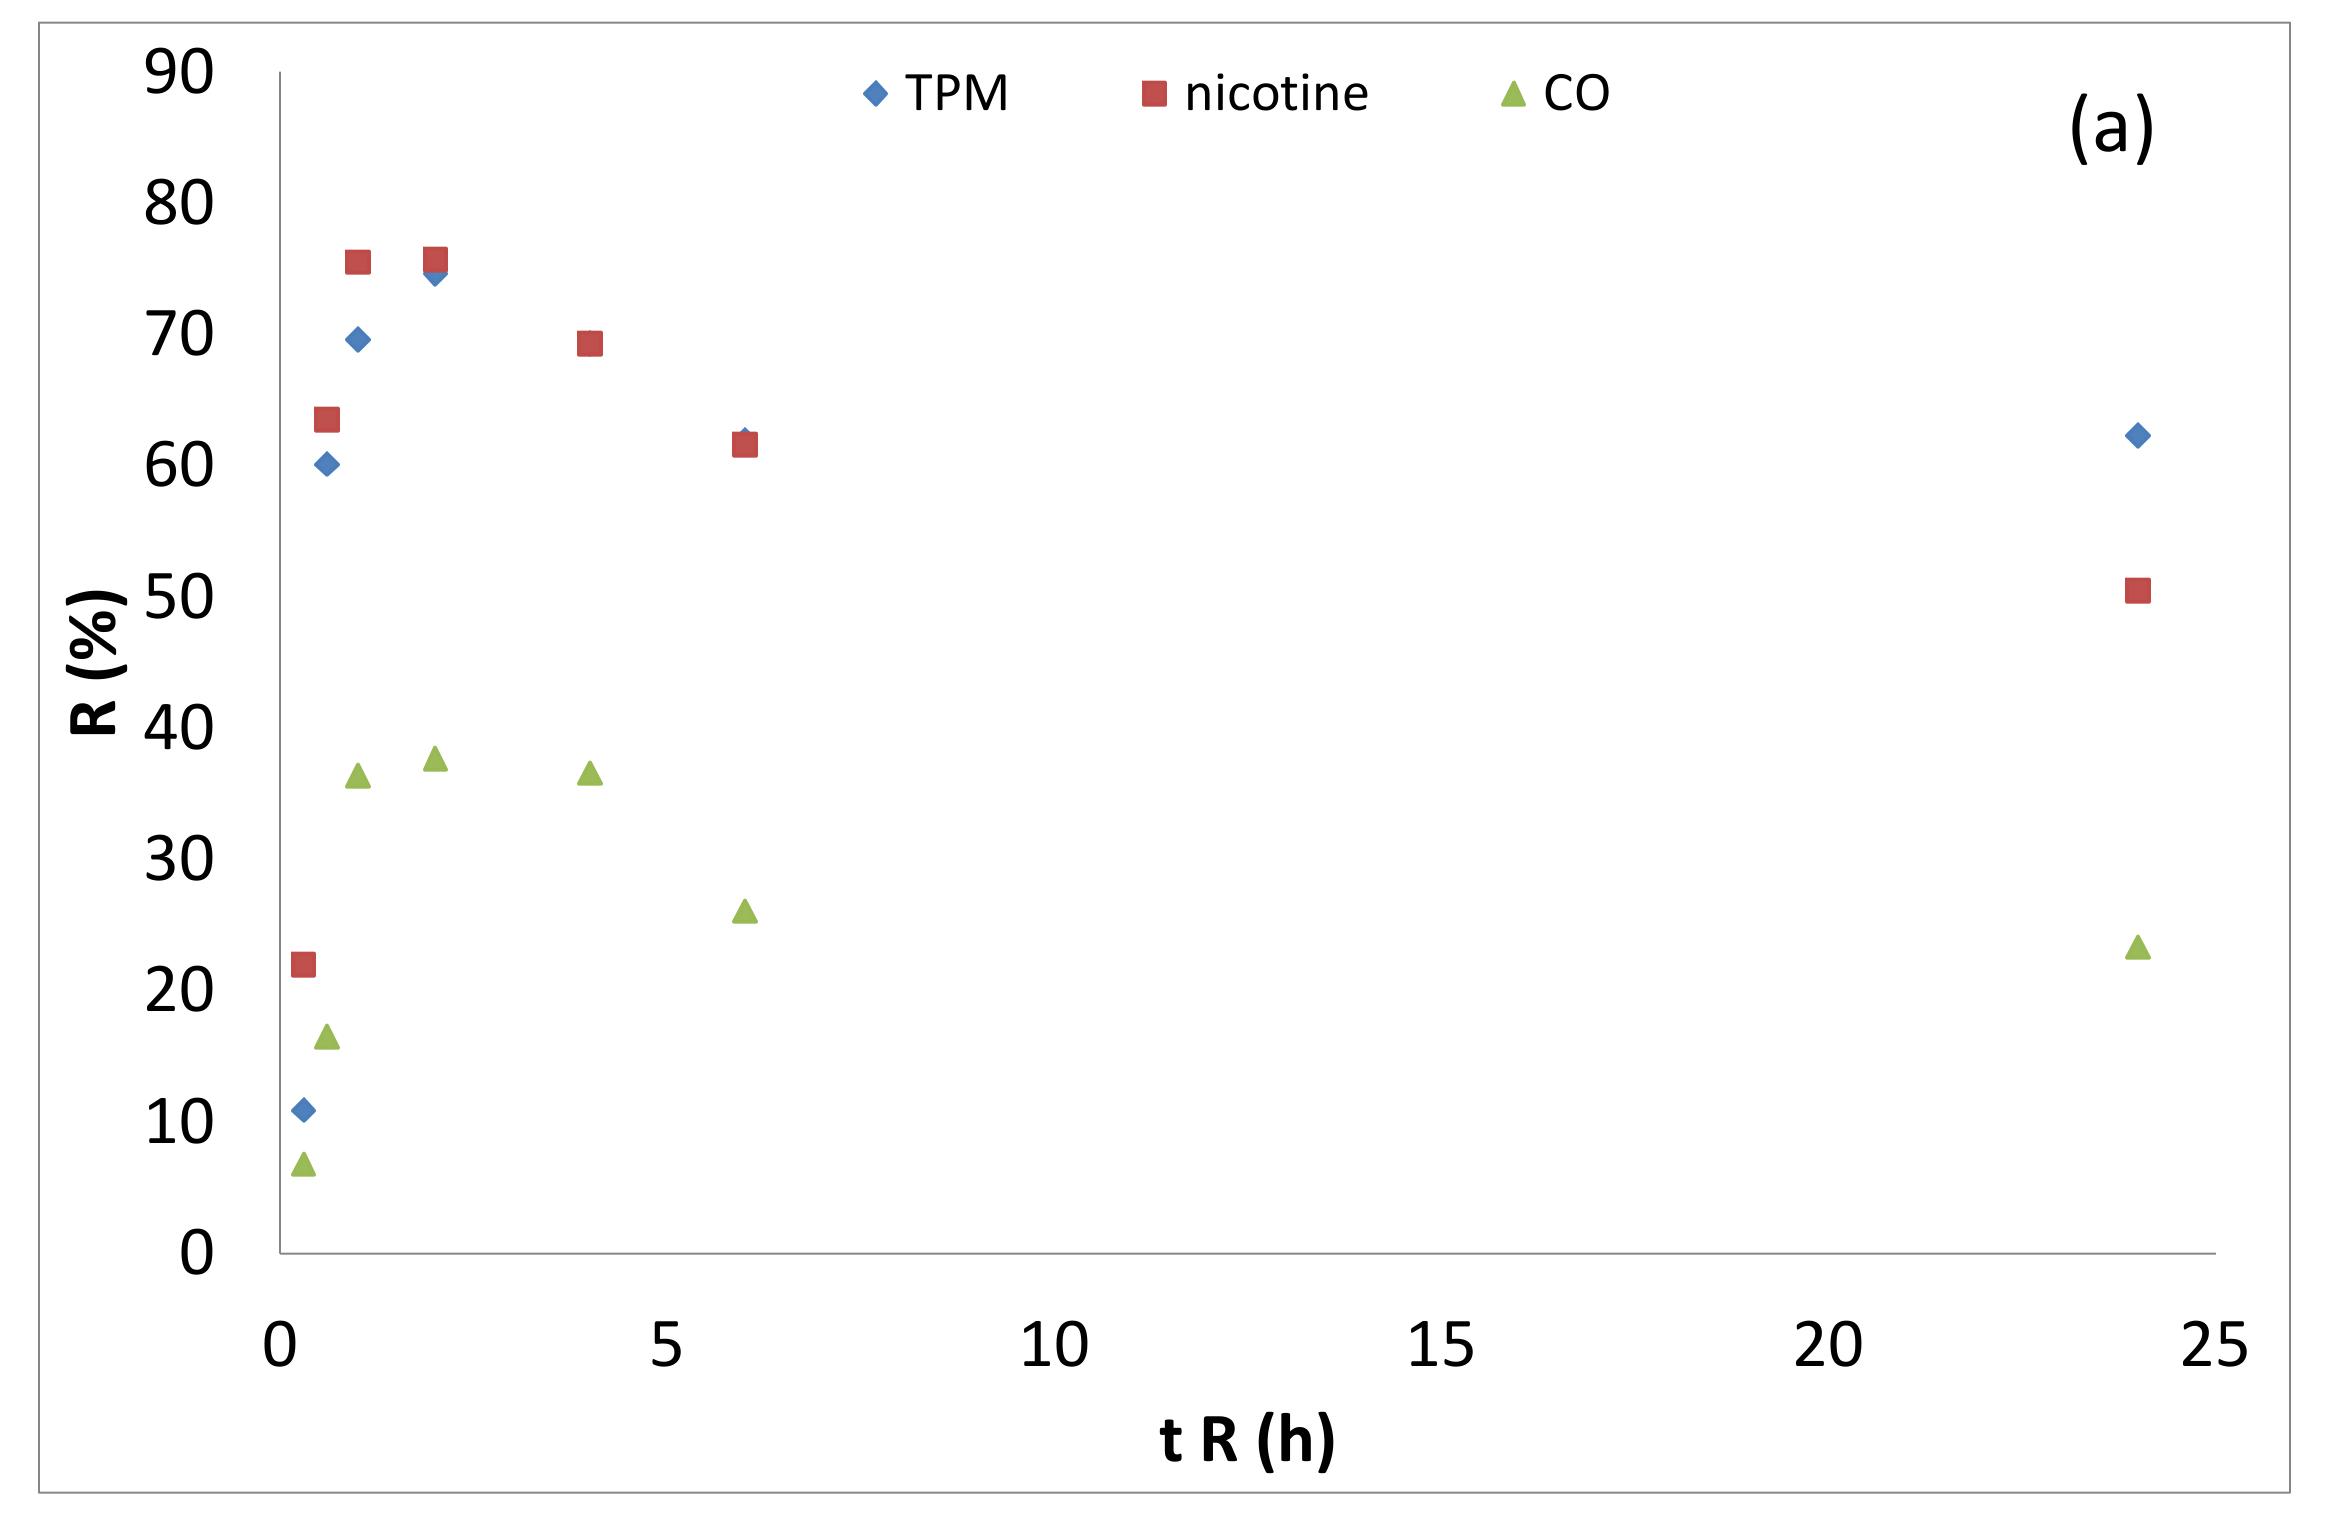
2.2.2. Products Generated during the Smoking Process
2.3. Scaling Up Process
3. Materials and Methods
3.1. Synthesis of Materials
3.2. Catalyst Characterization
3.3. Smoking Experiments
4. Conclusions
Author Contributions
Funding
Acknowledgments
Conflicts of Interest
References
- Sing, K.S.W.; Everett, D.H.; Haul, R.A.W.; Moscou, L.; Pierotti, R.A.; Rouqerol, J.; Siemieniewska, T. Reporting Physisorption data for gas/solid systems with special reference to the determination of surface area and porosity. Pure Appl. Chem. 1985, 57, 603–619. [Google Scholar] [CrossRef]
- Kresge, C.T.; Leonowicz, M.E.; Roth, W.; Vartuli, J.C.; Beck, J.S. Ordered mesoporous molecular sieves synthesized by a liquid-crystal template mechanism. Nature 1992, 359, 710–712. [Google Scholar] [CrossRef]
- Zhao, D.; Feng, J.; Huo, Q.; Melosh, N.; Fredrickson, G.H.; Chmelka, B.F.; Stucky, G.D. Triblock copolymer syntheses of mesoporous silica with periodic 50to 300 angstrom pores. Science 1998, 279, 548–552. [Google Scholar] [CrossRef] [PubMed] [Green Version]
- Zhao, D.; Huo, Q.; Feng, J.; Chmelka, B.F.; Stucky, G.D. Nonionic Triblock and star diblock copolymer and oligomeric surfactant syntheses of highly ordered, hydrothermally stable, mesoporous silica structures. J. Am. Chem. Soc. 1998, 120, 6024–6036. [Google Scholar] [CrossRef]
- Beck, J.S.; Vartuli, J.C.; Roth, W.; Leonowicz, M.E.; Kresge, C.T.; Schmitt, K.D.; Chu, C.T.W.; Olson, D.H.; Sheppard, E.W.; McCullen, S.B.; et al. A new family of mesoporous molecular sieves prepared with liquid crystal templates. J. Am. Chem. Soc. 1992, 114, 10834–10843. [Google Scholar] [CrossRef]
- Marín-Lasheras, E.; Téllez-Ariso, C. Síntesis de Materiales Mesoporosos Ordenados Silíceos con Cafeína Micelada Encapsulada. Master’s Thesis, Universidad de Zaragoza, Zaragoza, Spain, 2011. [Google Scholar]
- Johansson, E.M. Controlling the Pore Size and Morphology of Mesoporous Silica. Licentiatie Thesis, Linköping University, Linköping, Sweden, 2010. [Google Scholar]
- Sierra, I.; Pérez-Quintanilla, D. Heavy metal complexation on hybrid mesoporous silicas: An approach to analytical applications. Chem. Soc. Rev. 2013, 42, 3792–3807. [Google Scholar] [CrossRef]
- Boccardi, E.; Liverani, L.; Beltran, A.M.; Günther, R.; Schmidt, J.; Peukert, W.; Boccaccini, A.R. Mesoporous silica submicron particles (MCM-41) incorporating nanoscale Ag: Synthesis, characterization and application as drug delivery coatings. J. Porous Mater. 2019, 26, 443–453. [Google Scholar] [CrossRef]
- Alamdari, A.; Karimzadeh, R. Faradaic number as a criterion for the promotion effect of external electric field on the heterogeneous oxidative cracking of liquefied petroleum gas on ZSM-5 supported catalyst. React. Kinet. Mech. Catal. 2018, 123, 723–742. [Google Scholar] [CrossRef]
- Eguílaz, M.; Villalonga, R.; Rivas, G. Electrochemical biointerfaces based on carbon nanotubes-mesoporous silica hybrid material: Bioelectrocatalysis of hemoglobin and biosensing applications. Biosens. Bioelectron. 2018, 111, 144–151. [Google Scholar] [CrossRef]
- Hou, Q.; Lin, W.G.; Wei, F.; Yang, J.Y.; Zhu, J.H. Utilizing acid immersion to elevate the performance of zeolite in liquid adsorption of N′-nitrosonornicotine (NNN). Solid State Sci. 2013, 16, 143–151. [Google Scholar] [CrossRef]
- Nguyen, Q.N.K.; Yen, N.T.; Hau, N.D.; Tran, H.L. Synthesis and characterization of mesoporous silica SBA-15 and ZnO/SBA-15 photocatalytic materials from the ash of brickyards. J. Chem. 2020, 2020. [Google Scholar] [CrossRef]
- Niculescu, V.; Aldea, N.; Rednic, V.; Parvulescu, V. Platinum mesoporous silica catalysts for liquid media oxidation. Anal. Lett. 2019, 52, 5–19. [Google Scholar] [CrossRef]
- Fulvio, P.F.; Pikus, S.; Jaroniec, M. Tailoring properties of SBA-15 materials by controlling conditions of hydrothermal synthesis. J. Mater. Chem. 2005, 15, 5049–5053. [Google Scholar] [CrossRef]
- Zhao, D.; Sun, J.; Li, Q.; Stucky, G.D. Morphological control of highly ordered mesoporous silica SBA-15. Chem. Mater. 2000, 12, 275–279. [Google Scholar] [CrossRef]
- Dong, X.; Wang, Y.; Dan, H.; Hong, Z.; Song, K.; Xian, Q.; Ding, Y. A facile route to synthesize mesoporous SBA-15 silica spheres from powder quartz. Mater. Lett. 2017, 204, 97–100. [Google Scholar] [CrossRef]
- Carrero, A.; Moreno, J.; Aguado, J.; Calleja, G. Control of SBA-15 materials morphology by modification of synthesis conditions. Stud. Surf. Sci. Catal. 2008, 174, 321–324. [Google Scholar] [CrossRef]
- Zhou, Y.-Y.; Li, X.-X.; Chen, Z.-X. Rapid synthesis of well-ordered mesoporous silica from sodium silicate. Powder Technol. 2012, 226, 239–245. [Google Scholar] [CrossRef]
- Van Bavel, E.; Cool, P.; Aerts, K.; VanSant, E.F. Plugged hexagonal templated silica (PHTS): An in-depth study of the structural characteristics. J. Phys. Chem. B 2004, 108, 5263–5268. [Google Scholar] [CrossRef]
- Galarneau, A.; Cambon, H.; Di Renzo, F.; Ryoo, R.; Choi, M.; Fajula, F. Microporosity and connections between pores in SBA-15 mesostructured silicas as a function of the temperature of synthesis. New J. Chem. 2003, 27, 73–79. [Google Scholar] [CrossRef]
- Benamor, T.; Vidal, L.; Lebeau, B.; Marichal, C. Influence of synthesis parameters on the physico-chemical characteristics of SBA-15 type ordered mesoporous silica. Microporous Mesoporous Mater. 2012, 153, 100–114. [Google Scholar] [CrossRef]
- Guillet-Nicolas, R.; Bérubé, F.; Thommes, M.; Janicke, M.T.; Kleitz, F. Selectively tuned pore condensation and hysteresis behavior in mesoporous SBA-15 silica: Correlating material synthesis to advanced gas adsorption analysis. J. Phys. Chem. C 2017, 121, 24505–24526. [Google Scholar] [CrossRef]
- Liu, J.; Yang, Q.; Zhao, X.; Zhang, L. Pore size control of mesoporous silicas from mixtures of sodium silicate and TEOS. Microporous Mesoporous Mater. 2007, 106, 62–67. [Google Scholar] [CrossRef]
- Rahmat, N.; Hamzah, F.; Sahiron, N.; Mazlan, M.; Zahari, M.M. Sodium silicate as source of silica for synthesis of mesoporous SBA-15. IOP Conf. Ser. Mater. Sci. Eng. 2016, 133, 012011. [Google Scholar] [CrossRef] [Green Version]
- Kosuge, K.; Sato, T.; Kikukawa, A.N.; Takemori, M. Morphological control of rod- and fiberlike SBA-15 type mesoporous silica using water-soluble sodium silicate. Chem. Mater. 2004, 16, 899–905. [Google Scholar] [CrossRef]
- Koh, M.H.; Azaman, S.A.H.; Hameed, B.H.; Din, A.T.M. Surface morphology and physicochemical properties of ordered mesoporous silica SBA-15 synthesized at low temperature. IOP Conf. Ser. Mater. Sci. Eng. 2017, 206, 012056. [Google Scholar] [CrossRef]
- Marcilla, A.; Siurana, A.G.; Berenguer, D.; Martínez-Castellanos, I.; Beltrán, M. Reduction of tobacco smoke components yield in commercial cigarette brands by addition of HUSY, NaY and Al-MCM-41 to the cigarette rod. Toxicol. Rep. 2015, 2, 152–164. [Google Scholar] [CrossRef] [Green Version]
- Zhou, Y.; Gao, L.; Gu, F.; Yang, J.Y.; Yang, J.; Wei, F.; Wang, Y.; Zhu, J.H. Functional mesoporous material derived from 3D net-linked SBA-15. Chem. A Eur. J. 2009, 15, 6748–6757. [Google Scholar] [CrossRef]
- Xu, Y.; Zhu, J.H.; Ma, L.L.; Ji, A.; Wei, Y.L.; Shang, X.Y. Removing nitrosamines from mainstream smoke of cigarettes by zeolites. Microporous Mesoporous Mater. 2003, 60, 125–138. [Google Scholar] [CrossRef]
- Meier, W.; Siegmann, K. Significant reduction of carcinogenic compounds in tobacco smoke by the use of zeolite catalysts. Microporous Mesoporous Mater. 1999, 33, 307–310. [Google Scholar] [CrossRef]
- Marcilla, A.; Beltrán, M.I.; Siurana, A.G.; Martínez, I.; Berenguer, D. Effect of the concentration of siliceous materials Added to tobacco cigarettes on the composition of the smoke generated during smoking. Ind. Eng. Chem. Res. 2015, 54, 1916–1929. [Google Scholar] [CrossRef]
- Shi, C.L.; Li, S.H.; Sun, X.D.; Wang, Z.P.; Wang, Y.-Z.; Xiong, J.-W.; Gu, W.-B.; Wang, W.-M.; Yao, H.-M.; Wang, Y.; et al. New activated carbon sorbent with the zeolite-like selectivity to capture tobacco-specific nitrosamines in solution. Chem. Eng. J. 2018, 339, 170–179. [Google Scholar] [CrossRef]
- Marcilla, A.; Siurana, A.G.; Berenguer, D.; Martínez-Castellanos, I.; Beltrán, M. Reduction of tobacco smoke components yields by zeolites and synthesized Al-MCM-41. Microporous Mesoporous Mater. 2012, 161, 14–24. [Google Scholar] [CrossRef]
- Li, Y.Y.; Wan, M.M.; Zhu, J.H. Cleaning carcinogenic nitrosamines with zeolites. Environ. Chem. Lett. 2014, 12, 139–152. [Google Scholar] [CrossRef]
- Yong, G.-P.; Jin, Z.-X.; Tong, H.-W.; Yan, X.-Y.; Li, G.-S.; Liu, S.-M. Selective reduction of bulky polycyclic aromatic hydrocarbons from mainstream smoke of cigarettes by mesoporous materials. Microporous Mesoporous Mater. 2006, 91, 238–243. [Google Scholar] [CrossRef]
- Lin, W.G.; Zhou, Y.; Cao, Y.; Zhou, S.L.; Wan, M.M.; Wang, Y.; Zhu, J.H. Applying heterogeneous catalysis to health care: In situ elimination of tobacco-specific nitrosamines (TSNAs) in smoke by molecular sieves. Catal. Today 2013, 52–61. [Google Scholar] [CrossRef]
- Marcilla, A.; Beltrán, M.I.; Gómez-Siurana, A.; Berenguer, D.; Martínez-Castellanos, I. Nicotine/mesoporous solids interactions at increasing temperatures under inert and air environments. J. Anal. Appl. Pyrolysis 2016, 119, 162–172. [Google Scholar] [CrossRef]
- Calabuig, E.; Juárez-Serrano, N.; Marcilla, A. TG-FTIR study of evolved gas in the decomposition of different types of tobacco. Effect of the addition of SBA-15. Thermochimica Acta. 2019, 671, 209–219. [Google Scholar] [CrossRef]
- Gomis, A.M.; Gómez-Siurana, A.; Muñoz, D.B.; Martínez-Castellanos, I.; Beltrán, M. Effect of mesoporous catalysts on the mainstream tobacco smoke of 3R4F and 1R5F reference cigarettes. Am. J. Chem. Eng. 2015, 3, 1. [Google Scholar] [CrossRef] [Green Version]
- Juárez-Serrano, N.; Asensio, J.; Martínez-Castellanos, I.; Beltrán, M.; Marcilla, A. The effect of temperature and time of the hydrothermal treatment in the sba-15 synthesis process on the structure and textural properties and the ability to reduce the evolution of tars in tobacco smoking. Catalysts 2020, 10, 272. [Google Scholar] [CrossRef] [Green Version]
- Juárez-Serrano, N.; Asensio, J.; Blasco, I.; Beltrán, M.; Marcilla, A. Effect of time, temperature and stirring rate used in the first step of the synthesis of SBA-15 on its application as reductor of tars in tobacco smoke. Catalysts 2021, 11, 375. [Google Scholar] [CrossRef]
- Tkachenko, O.P.; Klementiev, K.V.; Löffler, E.; Ritzkopf, I.; Schuth, F.; Bandyopadhyay, M.; Grabowski, S.; Gies, H.; Hagen, V.; Muhler, M.; et al. The structure of zinc and copper oxide species hosted in porous siliceous matrices. Phys. Chem. Chem. Phys. 2003, 5, 4325–4334. [Google Scholar] [CrossRef]
- Thielemann, J.P.; Girgsdies, F.; Schlögl, R.; Hess, C. Pore structure and surface area of silica SBA-15: Influence of washing and scale-up. Beilstein J. Nanotechnol. 2011, 2, 110–118. [Google Scholar] [CrossRef] [Green Version]
- Rodríguez-Reinoso, F. Problemas más habituales en el uso de la adsorción física como técnica de caracterización de sólidos porosos. Rev. Grupo Espec. Adsorción RSEQ 2010, 0, 5–16. [Google Scholar]
- Sing, K.S.; Williams, R.T. Physisorption hysteresis loops and the characterization of nanoporous materials. Adsorpt. Sci. Technol. 2004, 22, 773–782. [Google Scholar] [CrossRef]
- Nagata, H.; Takimura, M.; Yamasaki, Y.; Nakahira, A. syntheses and characterization of bulky mesoporous silica MCM-41 by hydrothermal hot-pressing method. Mater. Trans. 2006, 47, 2103–2105. [Google Scholar] [CrossRef] [Green Version]
- Dhaneswara, D.; Fatriansyah, J.F.; Putranto, D.A.; Utami, S.A.A.; Delayori, F. The structure heterogeneity of silica mesopores of Sba-15 in respect to the pluronic 123 template concentration. In IOP Conference Series: Material Science and Engineering; Institute of Physics Publishing: Bristol, UK, 2018; Volume 285, p. 12032. [Google Scholar] [CrossRef]
- Colilla, M.; Balas, F.; Manzano, M.; Vallet-Regí, M. Novel method to enlarge the surface area of SBA-15. Chem. Mater. 2007, 19, 3099–3101. [Google Scholar] [CrossRef]
- Klimova, T.; Esquivel, A.; Reyes, J.; Rubio, M.; Bokhimi, X.; Aracil, J. Factorial design for the evaluation of the influence of synthesis parameters upon the textural and structural properties of SBA-15 ordered materials. Microporous Mesoporous Mater. 2006, 93, 331–343. [Google Scholar] [CrossRef]
- Van Der Voort, P.; Ravikovitch, P.I.; De Jong, K.P.; Benjelloun, M.; Van Bavel, E.; Janssen, A.H.; Neimark, A.V.; Weckhuysen, B.M.; Vansant, E.F. A new templated ordered structure with combined micro- and mesopores and internal silica nanocapsules. J. Phys. Chem. B 2002, 106, 5873–5877. [Google Scholar] [CrossRef] [Green Version]


| Sample | Reaction Time (h) | HT Time (h) | SBET a (m2/g) | Vt b (cm3/g) | Vmicro c (cm3/g) | Vmeso * (cm3/g) | ρa d (g/cm3) | PD e (nm) | a0 f (nm) |
|---|---|---|---|---|---|---|---|---|---|
| H0 | 24 | 0 | 793 | 0.771 | 0.324 | 0.447 | 0.099 | 4.9 | 11.0 |
| H6 | 24 | 6 | 735 | 0.641 | 0.210 | 0.431 | 0.058 | 6.0 | 11.7 |
| H15 | 24 | 15 | 728 | 0.664 | 0.202 | 0.462 | 0.055 | 6.0 | 12.7 |
| H24 | 24 | 24 | 799 | 0.790 | 0.228 | 0.562 | 0.043 | 6.2 | 13.1 |
| R1/3 | 0.3 | 24 | 735 | 0.609 | 0.289 | 0.320 | 0.281 | 3.8 | 12.1 |
| R2/3 | 0.6 | 24 | 980 | 1.010 | 0.392 | 0.618 | 0.062 | 6.1 | 12.7 |
| R1 | 1 | 24 | 946 | 0.957 | 0.373 | 0.584 | 0.061 | 6.1 | 12.9 |
| R2 | 2 | 24 | 970 | 1.120 | 0.381 | 0.739 | 0.057 | 6.2 | 13.1 |
| R4 | 4 | 24 | 834 | 0.962 | 0.327 | 0.635 | 0.053 | 6.1 | 13.1 |
| R6 | 6 | 24 | 791 | 0.920 | 0.313 | 0.607 | 0.053 | 6.0 | 13.1 |
| R24 (H24) | 24 | 24 | 799 | 0.790 | 0.228 | 0.562 | 0.043 | 6.2 | 13.1 |
| Sample | % RTPM | % RNicotine | % RCO |
|---|---|---|---|
| H0 | 13.5 | 18.4 | −25.2 |
| H6 | 32.5 | 19.2 | 8.8 |
| H15 | 48.3 | 39.5 | 24.1 |
| H24 | 62.3 | 50.5 | 23.3 |
| R1/3 | 10.9 | 22.0 | 6.8 |
| R2/3 | 60.1 | 63.5 | 16.5 |
| R1 | 69.6 | 75.5 | 36.4 |
| R2 | 74.6 | 75.7 | 37.7 |
| R4 | 69.3 | 69.3 | 36.6 |
| R6 | 61.9 | 61.6 | 26.1 |
| R24 (H24) | 62.3 | 50.5 | 23.3 |
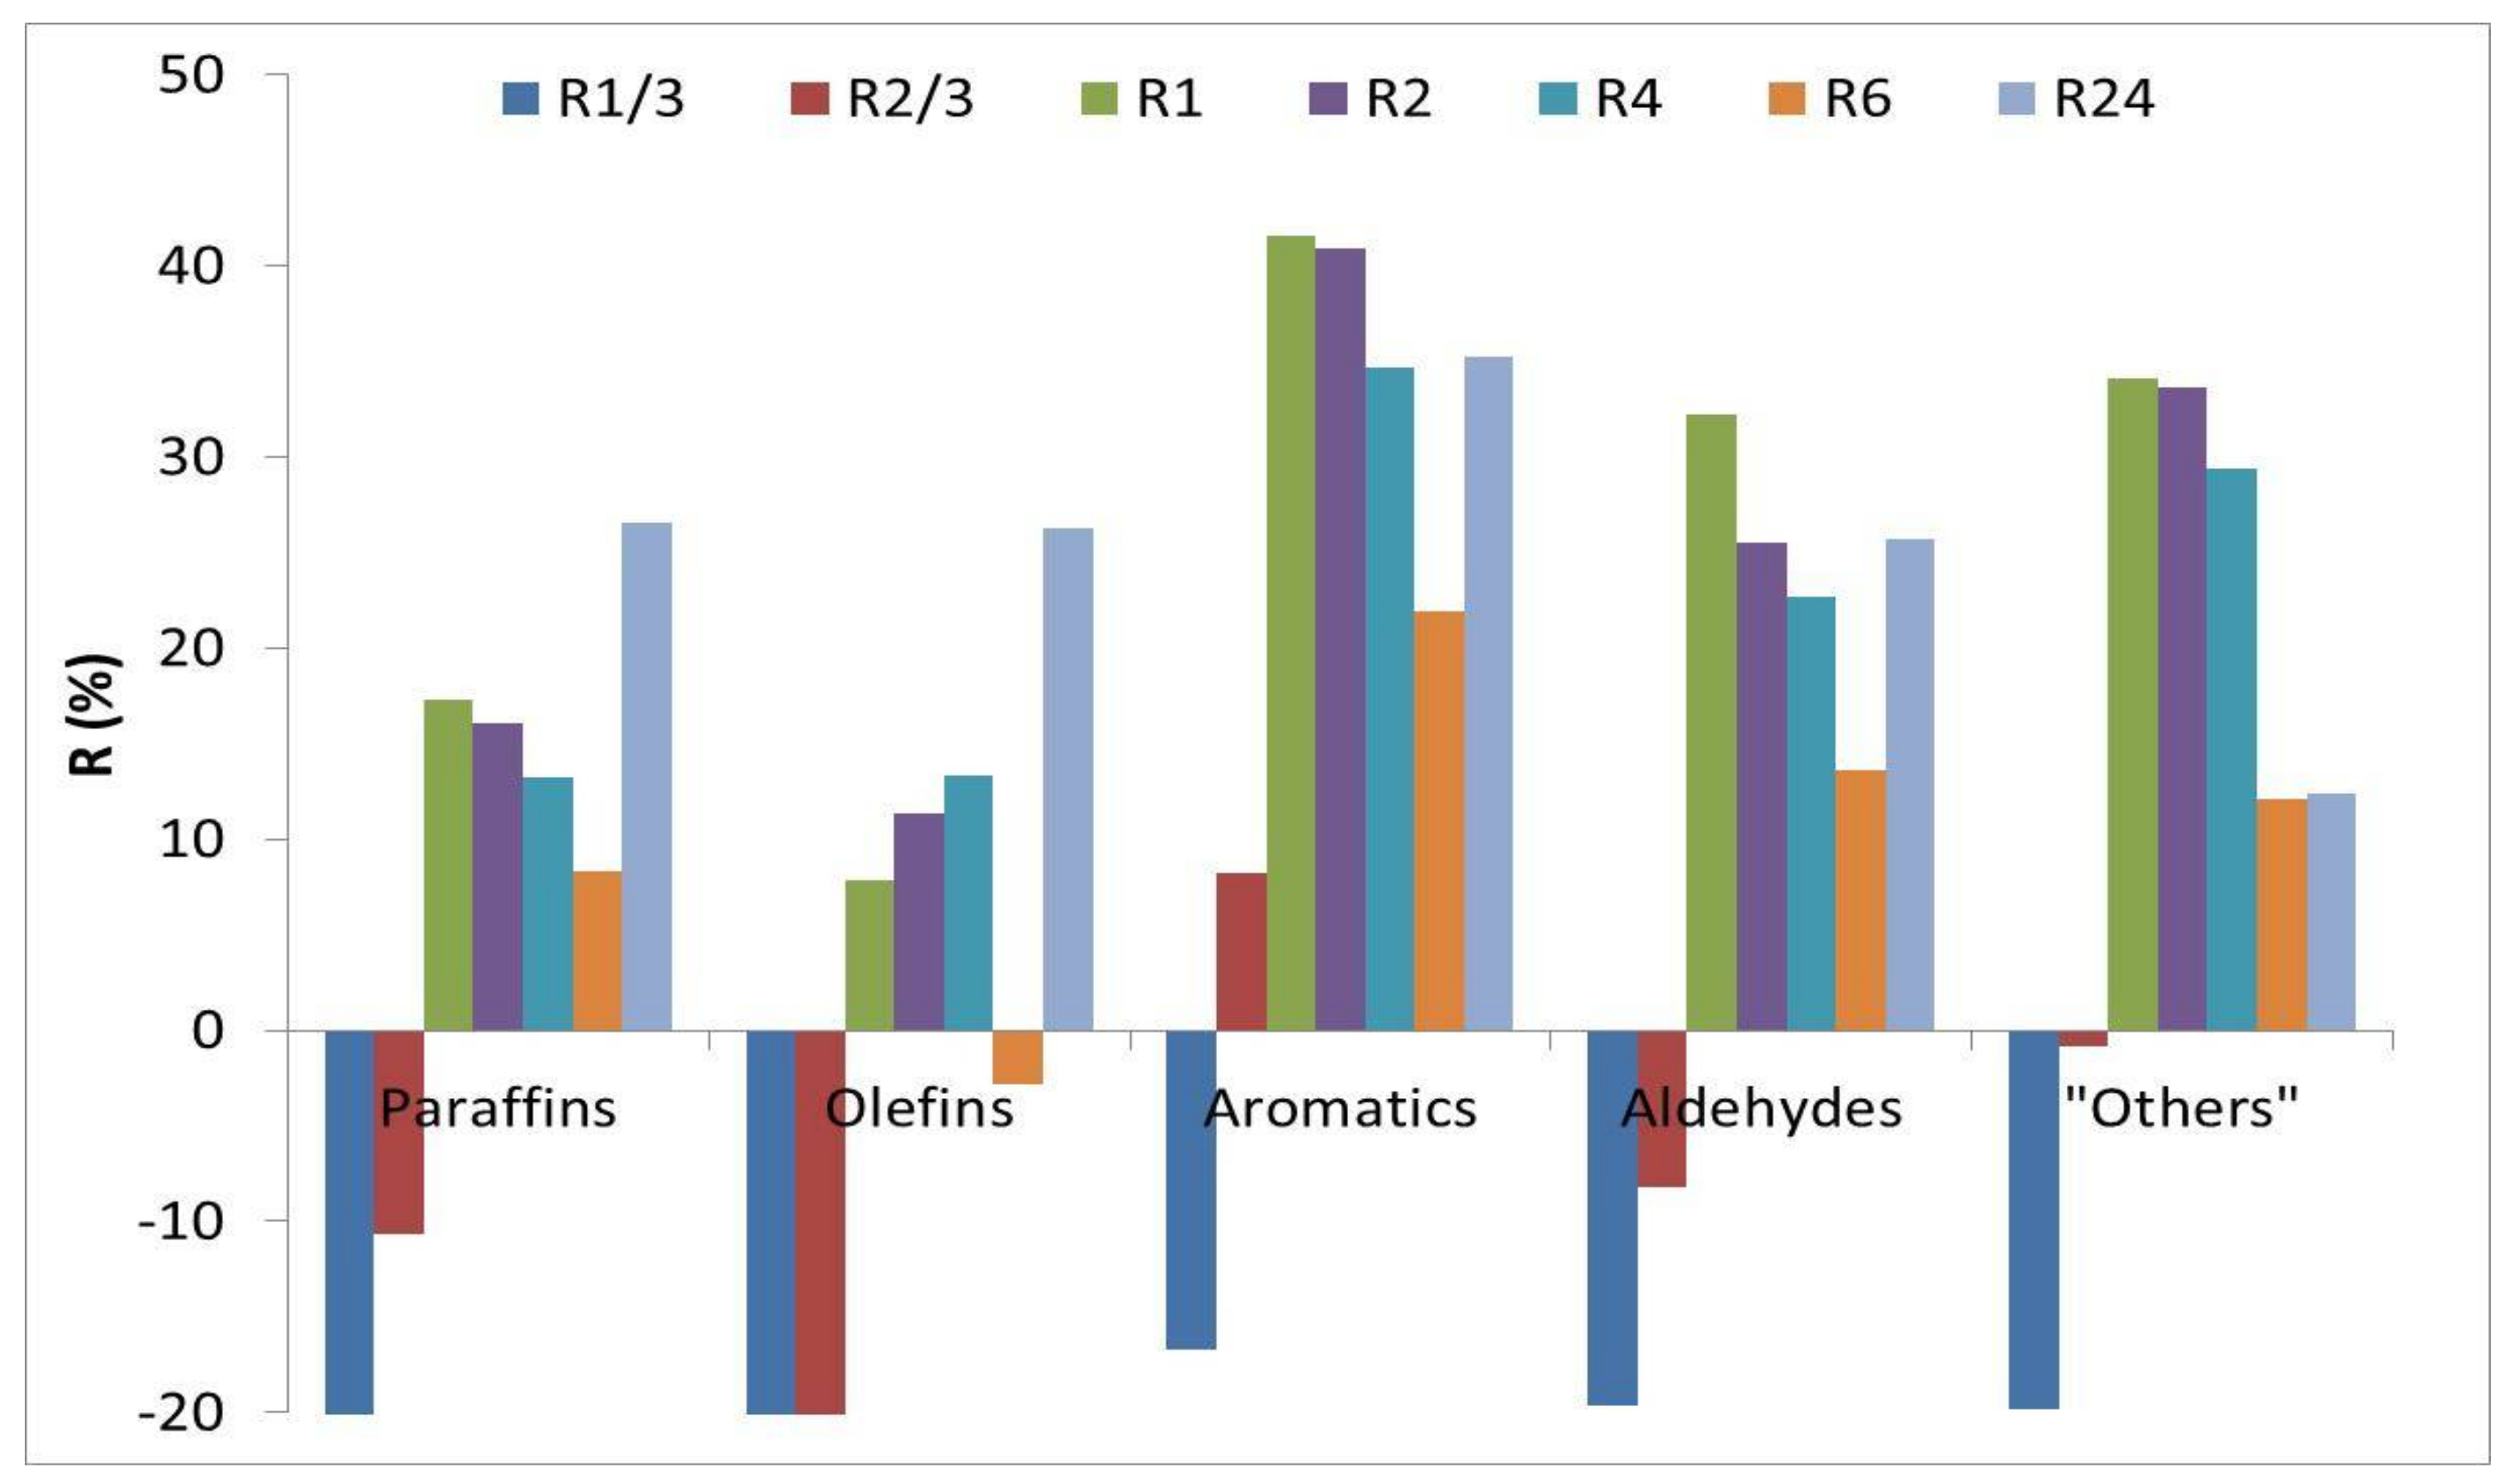
| % Reduction | |||||||||||
|---|---|---|---|---|---|---|---|---|---|---|---|
| Compound | Family | H0 | H6 | H15 | H24(R24) | R1/3 | R2/3 | R1 | R2 | R4 | R6 |
| Methane | Paraffins | −16.5 | 14.3 | 23.6 | 15.3 | −25.2 | −10.0 | 20.9 | 18.7 | 15.8 | 9.3 |
| Ethane | Paraffins | −13.7 | 21.8 | 22.6 | 17.6 | −25.4 | −9.9 | 15.8 | 14.5 | 11.9 | 1.2 |
| Ethylene | Olefins | −23.4 | 18.7 | 24.5 | 26.5 | −24.2 | −13.1 | 16.2 | 16.5 | 15.8 | 8.6 |
| Ethyne | Others | −50.6 | 15.8 | 25.8 | 21.9 | −29.9 | −29.9 | 2.0 | 21.9 | 9.7 | −2.2 |
| Propane | Paraffins | −12.8 | 21.3 | 22.4 | 28.1 | −26.0 | −11.9 | 11.6 | 12.4 | 10.4 | 2.2 |
| Propene | Others | −22.9 | 23.3 | 21.7 | 29 | −24.3 | −10.0 | 14.1 | 14.2 | 14.2 | 13.2 |
| Iso-butane | Paraffins | −86.5 | 61.5 | 14.5 | 38.7 | −67.3 | −1.5 | −3.2 | 13.3 | −3.5 | −6.8 |
| Chloromethane | Others | −13.1 | 22.4 | 14.9 | 27.2 | −18.3 | −2.7 | 18.2 | 19.0 | 17.9 | −7.3 |
| Butane | Paraffins | −23.1 | 24.9 | 17.8 | 26 | −21.5 | −6.0 | 2.6 | 8.3 | 3.6 | −8.4 |
| 1-Butene | Olefins | −11.5 | 26.4 | 25.0 | 11.3 | −35.4 | −7.7 | 5.0 | 12.1 | 7.2 | 1.8 |
| 1,2-Propadiene | Olefins | −8.1 | 21.0 | 28.6 | 30.4 | −34.7 | −0.5 | −2.3 | 27.7 | 12.9 | 7.5 |
| 1,3-Butadiene | Olefins | −8.2 | 13.9 | 17.0 | 20 | −22.7 | −8.8 | 17.5 | 16.5 | 12.6 | 7.2 |
| Isobutene | Olefins | −25.0 | 26.8 | 19.3 | 21.9 | −26.2 | −14.5 | 7.3 | 10.0 | 10.5 | 8.7 |
| cis-2-Butene | Olefins | −11.5 | 28.4 | 23.9 | 21.5 | −26.0 | −6.8 | 11.6 | 16.0 | 16.5 | 12.8 |
| Pentane | Paraffins | 2.8 | 39.5 | 14.7 | 38 | −17.0 | −6.0 | 12.7 | 10.1 | 15.0 | −3.3 |
| Methanethiol | Others | −43.0 | −47.5 | −19.4 | −21.2 | −17.8 | 6.2 | 63.4 | 41.3 | 37.6 | 18.3 |
| Hydrogen cyanide | Others | 1.1 | 15.0 | 14.1 | 34.7 | −27.7 | −23.9 | −10.5 | 3.8 | 6.9 | −6.1 |
| 1-Pentene | Olefins | 0.6 | 23.1 | 12.6 | 30.6 | −42.2 | −13.8 | 8.9 | 4.6 | 8.4 | −6.6 |
| Furan | Aromatics | −2.6 | −54.7 | 15.6 | 34 | −7.5 | 5.0 | 25.0 | 25.1 | 15.0 | 14.1 |
| Isoprene | Olefins | −48.6 | −10.8 | 17.3 | 17.8 | −36.5 | −44.9 | −4.1 | 6.1 | 17.4 | 5.5 |
| Hexane | Paraffins | 22.8 | 34.2 | 29.5 | −6.2 | −78.0 | −87.2 | 4.9 | −9.3 | 32.4 | 26 |
| 1-Hexene | Olefins | −14.4 | 23.4 | 17.9 | 23.8 | −13.1 | −2.6 | 24.6 | 24.8 | 29.0 | −3.3 |
| Benzene | Aromatics | −5.8 | 25.0 | 19.3 | 27.6 | −25.0 | 4.2 | 40.3 | 40.9 | 35.1 | 22.1 |
| Acetaldehyde | Aldehydes | −9.9 | 23.9 | 39.1 | 34.3 | −6.9 | 1.8 | 36.5 | 29.1 | 26.8 | −5.9 |
| Acrolein | Aldehydes | −96.2 | −34.4 | −6.4 | −20.9 | −46.0 | −63.8 | 7.6 | −20.9 | −11.8 | −61.9 |
| Propionaldehyde | Aldehydes | 17.2 | 27.8 | 14.6 | 21.7 | −23.8 | −5.1 | 39.1 | 36.0 | 31.6 | 13.3 |
| Acetonitrile | Others | 43.1 | −55.8 | −13.0 | −6.4 | 8.7 | 42.4 | 84.7 | 77.6 | 72.8 | 57.3 |
| Toluene | Aromatics | 13.1 | 86.6 | 81.2 | 83.5 | −3.8 | 16.0 | 52.3 | 45.6 | 39.9 | 11.4 |
| Crotonaldehyde | Aldehydes | 15.5 | 27.3 | −73.3 | −48.2 | 2.0 | 20.0 | 24.5 | 72.3 | 66.3 | 39.9 |
| Isobutyraldehyde | Aldehydes | −19.9 | −47.7 | 45.5 | 9.9 | −9.3 | −0.3 | 29.3 | 34.3 | 18.0 | −4.7 |
| Total Reductions (%) | −19.9 | 18.1 | 23.2 | 23.5 | −24.1 | −10.8 | 22.4 | 19.9 | 17.9 | 13.6 | |
| % Reduction | |||||||||||
|---|---|---|---|---|---|---|---|---|---|---|---|
| Compound | Family | H0 | H6 | H15 | H24(R24) | R1/3 | R2/3 | R1 | R2 | R4 | R6 |
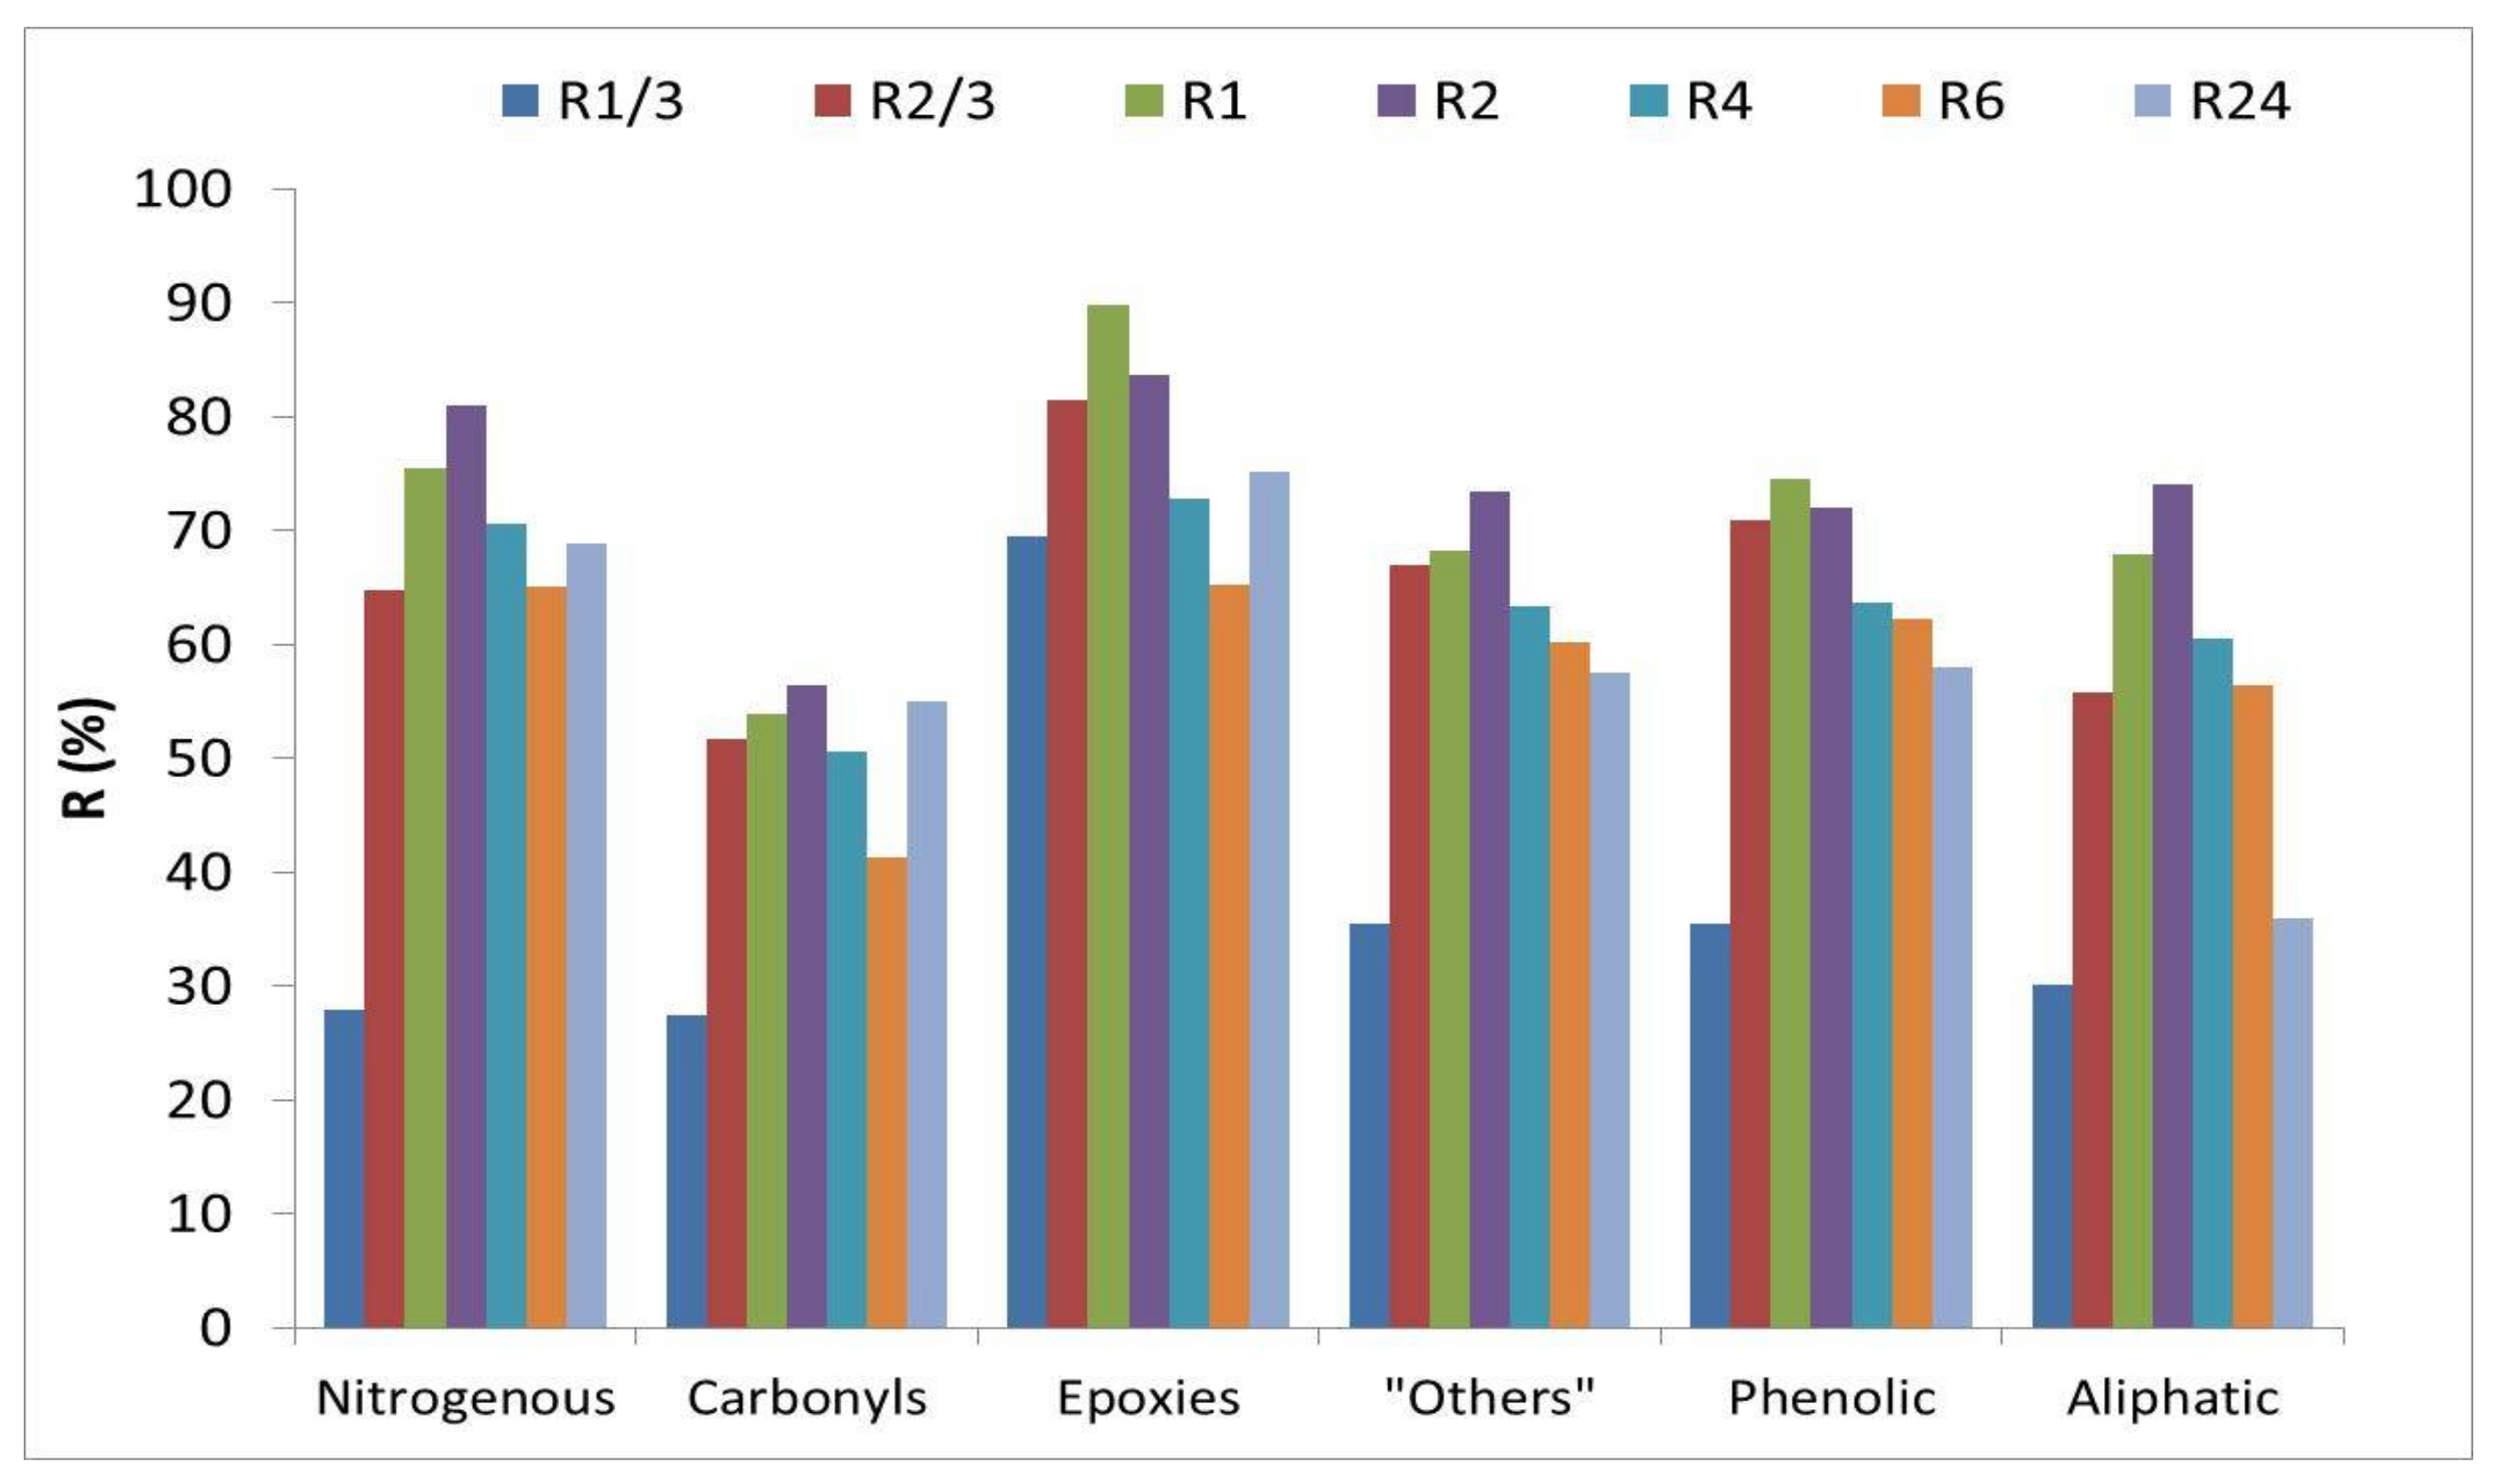
| Ethanol, 2-(1-methylethoxy)- | Epoxy | 40.91 | 18.2 | 35.5 | 45.4 | −2.73 | 49.91 | 59.9 | 72.77 | 73.34 | 88.36 |
| Styrene | Aromatic | −18.02 | 100 | 100 | 100 | 56.3 | 64.56 | 69.88 | 71.58 | 66.96 | 31.3 |
| 2-Cyclopenten-1-one, 2-methyl- | Carbonylic | 85.26 | 72.1 | 100 | 100 | 65.46 | 78.39 | 89.47 | 83.01 | 77 | 47.22 |
| Phenol | Phenolic | 44.13 | 100 | 100 | 100 | −10.75 | 44.24 | 53.72 | 27.16 | 27.32 | 23.34 |
| Limonene | Others | −91.08 | 100 | 77.6 | 88.4 | −19.72 | 67.58 | 66.09 | 66.74 | 53.62 | 79.31 |
| 2,3-Dimethyl-2-cyclopenten-1-one | Carbonylic | 55.34 | 18.2 | 57.3 | 47.3 | 15.42 | 21.84 | 47.67 | 81.31 | 72.51 | 62.79 |
| o-Cresol | Phenolic | 35.5 | 100 | 100 | 100 | 24.31 | 95.38 | 95.98 | 91.46 | 86.17 | 87.23 |
| p-Cresol | Phenolic | 31.05 | 29.8 | 49.9 | 68.5 | 13.33 | 77.29 | 88.4 | 87.74 | 83.02 | 61.11 |
| Phenol, 2-methoxy- | Phenolic | 10.01 | 100 | 100 | 100 | 22.89 | 85.14 | 94.8 | 77.59 | 76.94 | 84.3 |
| 3-Ethyl-2-hydroxy-2-cyclopenten-1-one | Carbonylic | −68.32 | 100 | 100 | 100 | 42.26 | 85.1 | 85.86 | 94.1 | 94.7 | 89.76 |
| 2,3-Dihydro-3,5-dihydroxy-6-methyl-4H-pyran-4-one | Carbonylic | 15.2 | 57.3 | 71.6 | 61.6 | 35.77 | 78.39 | 86.53 | 86.4 | 78.23 | 67.73 |
| Phenol, 2,4-dimethyl- | Phenolic | −16.09 | 100 | 100 | 100 | 43.35 | 88.81 | 98.38 | 90.7 | 91.57 | 72.45 |
| Phenol, 4-ethyl- | Phenolic | 8.66 | 41.4 | 82 | 93.3 | 47.2 | 81.09 | 90.14 | 92.05 | 74.99 | 77.07 |
| Naphthalene | PAH | 42.81 | 53.7 | 57.9 | 64.7 | 72.73 | 69.55 | 64.76 | 63.85 | 61.98 | 76.28 |
| Ethanone, 1-(3-methylphenyl)- | Carbonylic | 57.73 | 47.6 | 56.8 | 6.9 | 74.82 | 93.08 | 92.43 | 82.35 | 79.9 | 75.89 |
| p-cresol 2 methoxy | Phenolic | −79.95 | 100 | 48.8 | 80.8 | 28.29 | 66.36 | 54.46 | 79.13 | 67.18 | 77.65 |
| 2,3-Dihydro-benzofuran | Epoxy | −31.54 | 100 | 100 | 100 | 48.31 | 82.11 | 95.07 | 72.56 | 46.76 | 64.46 |
| Hydroquinone | Phenolic | −99.38 | 100 | 100 | 100 | 15.94 | 40.99 | 41.65 | 39.92 | 27.32 | 33.31 |
| 1H-Indole | Nitrogenous | 92.29 | 100 | 100 | 100 | 28.65 | 58.4 | 74.31 | 82.24 | 67.04 | 44.9 |
| 4-vinyl-2-methoxy-phenol | Phenolic | −56.18 | 44.4 | 61.1 | 81.9 | 1.57 | 70.16 | 79.49 | 77.12 | 57.78 | 68.03 |
| Nicotine | Nitrogenous | 18.49 | 19.2 | 39.5 | 50.5 | 22.19 | 63.61 | 75.8 | 75.99 | 69.77 | 61.79 |
| 1H-Indole, 3-methyl- | Nitrogenous | 50.54 | 100 | 100 | 100 | 12.7 | 65.96 | 71.59 | 82.31 | 64.31 | 75.29 |
| Myosmine | Nitrogenous | 23.89 | 26.1 | 29.7 | 27.5 | 25.4 | 74.95 | 78.3 | 85.23 | 78.74 | 76.09 |
| Phenol, 2-methoxy-4-(2-propenyl)- | Phenolic | 29.51 | 100 | 6.6 | 60.3 | 13.27 | 63.13 | 89.85 | 61.26 | 49.3 | 76.04 |
| Nicotyrine | Nitrogenous | −80.61 | 100 | 56.8 | 90.3 | 51.42 | 77.11 | 83.6 | 86.02 | 80.51 | 77.82 |
| Norsolanadiona | Carbonylic | −32.29 | 100 | 65.6 | 84.2 | 20.72 | 63.76 | 80.9 | 74.34 | 73.29 | 81.78 |
| 2,3-Binitrogenous | Nitrogenous | 17.7 | −18.3 | 40 | 49.8 | 25.23 | 94.88 | 94.03 | 89.62 | 93.54 | 79.49 |
| Megastigmatrienone | Carbonylic | −0.13 | 100 | 72 | 85.7 | 21.78 | 77.74 | 82.41 | 77.05 | 68.3 | 47.97 |
| N-propyl- nornicotine | Nitrogenous | −98.01 | 100 | 87.9 | 96.9 | 9.79 | 33.37 | 35.67 | 55.81 | 42.02 | 38.27 |
| Cotinine | Nitrogenous | 18.27 | −25.1 | 33.9 | 100 | 22.96 | 55.03 | 75.81 | 78.15 | 64.46 | 66.9 |
| 5-Tetradecene | Aliphatic | 8.49 | −10.1 | 24 | 66.3 | 19.6 | 55.82 | 75.75 | 82.18 | 63.51 | 62.75 |
| N(b)-formylnornicotine | Nitrogenous | 23.58 | 100 | 44.6 | 88.7 | 8.95 | 64.12 | 80.64 | 80.62 | 73.99 | 72.1 |
| NEOPHYTADIENE | Aliphatic | −1.03 | 9.4 | 28.5 | 75.4 | 6.11 | 42.97 | 60.11 | 65.57 | 47.01 | 57.36 |
| Farnesol | Others | −96.15 | −30.9 | 36.3 | 43 | 15.35 | 61.09 | 62.99 | 73.59 | 58.8 | 56.82 |
| Hexadecanoic acid, ethyl ester | Carbonylic | −0.81 | −36 | 40.8 | 50 | 14.78 | 14.1 | 1.41 | 9.27 | 2.88 | 8.54 |
| 2,6,10,14,18,22-Tetracosahexaene, 2,6,10,15,19,23-hexamethyl- | Aliphatic | −22.62 | 100 | 37.5 | 74.4 | 1.57 | 38.41 | 54.53 | 63.15 | 46.43 | 47.6 |
| Heptacosane | Aliphatic | −47.39 | −23.7 | 25.3 | 31.5 | 30.2 | 57.41 | 68.03 | 76.22 | 67.09 | 60.5 |
| Triacontane | Aliphatic | −45.8 | −11.7 | 35.3 | 32.3 | 47.07 | 76.54 | 77.98 | 85.2 | 66.53 | 67.18 |
| Octadecane | Aliphatic | −12.46 | 58 | 79.4 | 60.8 | 18.89 | 61.05 | 70.18 | 79.12 | 80.64 | 75.96 |
| Tocopherol | Phenolic | −25.34 | −23.6 | −24.5 | 26 | 25.72 | 75.34 | 70.96 | 83.25 | 73.25 | 80.44 |
| Sample | SBET (m2/g) | Vt (cm3/g) | Vm (cm3/g) | DP (nm) | ρa (g/cm3) | a0 (nm) | TPM (%) | CO2 (%) | CO (%) |
|---|---|---|---|---|---|---|---|---|---|
| Scaling | 532 | 0.677 | 0.207 | 5.6 | 0.072 | 11.2 | 41.9 | 8.4 | 6.3 |
Publisher’s Note: MDPI stays neutral with regard to jurisdictional claims in published maps and institutional affiliations. |
© 2021 by the authors. Licensee MDPI, Basel, Switzerland. This article is an open access article distributed under the terms and conditions of the Creative Commons Attribution (CC BY) license (https://creativecommons.org/licenses/by/4.0/).
Share and Cite
Juárez-Serrano, N.; Berenguer, D.; Martínez-Castellanos, I.; Blasco, I.; Beltrán, M.; Marcilla, A. Effect of Reaction Time and Hydrothermal Treatment Time on the Textural Properties of SBA-15 Synthesized Using Sodium Silicate as a Silica Source and Its Efficiency for Reducing Tobacco Smoke Toxicity. Catalysts 2021, 11, 808. https://doi.org/10.3390/catal11070808
Juárez-Serrano N, Berenguer D, Martínez-Castellanos I, Blasco I, Beltrán M, Marcilla A. Effect of Reaction Time and Hydrothermal Treatment Time on the Textural Properties of SBA-15 Synthesized Using Sodium Silicate as a Silica Source and Its Efficiency for Reducing Tobacco Smoke Toxicity. Catalysts. 2021; 11(7):808. https://doi.org/10.3390/catal11070808
Chicago/Turabian StyleJuárez-Serrano, Nerea, Desiré Berenguer, Isabel Martínez-Castellanos, Inmaculada Blasco, Maribel Beltrán, and Antonio Marcilla. 2021. "Effect of Reaction Time and Hydrothermal Treatment Time on the Textural Properties of SBA-15 Synthesized Using Sodium Silicate as a Silica Source and Its Efficiency for Reducing Tobacco Smoke Toxicity" Catalysts 11, no. 7: 808. https://doi.org/10.3390/catal11070808