Article

Microwave-Catalyzed Conversion of Phenolic Resin Waste to Activated Carbon and Its Applications for Removing Ammonium from Water

1
Department of Safety, Health and Environmental Engineering, Ming Chi University of Technology, New Taipei City 243, Taiwan
2
Chronic Diseases and Health Promotion Research Center, Chang Gung University of Science and Technology, Taoyuan City 333, Taiwan
3
Department of Mechanical Engineering, Ming Chi University of Technology, New Taipei City 243, Taiwan
4
Research Center of Intelligent Medical Devices, Ming Chi University of Technology, New Taipei City 243, Taiwan
5
Water Park Environment Corporation, Hsinchu 300, Taiwan
*
Author to whom correspondence should be addressed.
Catalysts 2021, 11(7), 783; https://doi.org/10.3390/catal11070783
Submission received: 9 May 2021 / Revised: 23 June 2021 / Accepted: 25 June 2021 / Published: 27 June 2021
(This article belongs to the Special Issue Catalysis for Energy and Environmental Applications)

Abstract

:
The influences of reactive and dielectric characteristics of activators were investigated in the microwave-catalyzed conversion of phenolic resin waste to activated carbon (AC). To compare with the dielectric interactions of the microwaves with treated samples, conventional electric heating for AC carbonization was also conducted in parallel. The porosity and chemical features of the prepared AC were examined, and the AC was used to remove ammonium from water through adsorption. The results revealed that KOH-activated wastes developed a highly porous structure, whereas H3PO4 treated wastes were functionalized with surficial phosphate groups. Both of these features were more pronounced in the cases of microwave-catalyzed carbonization than those using conventional electric heating. Because of the intense dielectric interactions of the H3PO4-activated waste with microwave, the abundant phosphate functional groups formed on the phenolic resin waste surface during microwave-catalyzed carbonization. They facilitated the resulting AC as an effective adsorbent for aqueous ammonium.

1. Introduction

Phenolic resins, commonly referred to as phenol-formaldehyde resins, are thermosetting plastics used in various applications. The global phenolic resin market was valued at US$12.63 billion in 2019 and is projected to maintain a compound annual growth rate of 5.4% in the upcoming years because of the versatility, multiple uses, and cost-effectiveness of such resins [1]. The continuous growth of demand has resulted in a rapid increase in waste from phenolic resin–using materials. Such waste is difficult to revert to its original state because of the stability of the cross-link bonds in a thermosetting resin. To achieve the UN’s Sustainable Development Goal of responsible consumption and production and abide by restrictions implemented by zero-waste frameworks [2], the manufacturing sector requires a feasible method for recycling this waste.
Converting waste into activated carbon (AC) is one of the most valuable and practical means of handling carbonaceous residues such as agricultural and industrial waste [3,4]. AC is a porous material employed for many purposes, such as removing pollutants from aqueous or gaseous waste streams [5], concentrating the useful components of mixed fluids [4], carbon sequestration [6], sensing application [7], and supporting catalysis [8]. The conversion process comprises activation and carbonization. Activation refers to the process of activating the surface and the whole matrix of the carbonaceous precursors, and carbonization consequently enables the development of pores in the AC [9]. Chemical activation is an effective method for manipulating the pore size and functionalizing the AC surface for various applications [10]. Carbonization is conventionally performed using electric heating (EH) furnaces. However, microwave heating can offer many advantages over conventional electric heating, such as (i) higher heating rates and efficiencies, (ii) material-selective heating, (iii) volumetric heating, (iv) energy transfer (instead of heat transfer), (v) energy savings and low processing temperatures (150–300 °C), (vi) quick starting and stopping, and (vii) small equipment size and little waste [11,12,13,14]. Therefore, microwave heating has been employed in various fields. Carbonaceous waste pyrolysis through microwave radiation has been confirmed to be an efficient technique for producing AC [15,16,17]. However, more work is necessary to expand the existing understanding of microwave catalysis and the dielectric interactions with targeted samples to fulfill it a commercially viable and environmentally sustainable route for AC production.
Ammonium originating from natural biomass degradation and anthropogenic sources, such as sewage treatment, leather and textile manufacturing, and electroplating, flows into bodies of water, leading to oxygen depletion, eutrophication, and water quality deterioration. Ammonia is particularly toxic to some fish, even at concentrations as low as 3 ppm [18]. Adsorption is an effective approach in terms of its performance–cost ratio and use of waste residue as adsorbents [19]. The use of AC has been steadily increasing because of its highly porous structure and the chemical nature of its surface, which can be modified or functionalized using different treatment processes [20].
This study compared the effects of chemical activators during microwave-catalyzed carbonization and conventional EH carbonization on the characteristics of the prepared AC and its use for ammonium removal from water. Many studies have focused on the conventional EH carbonization of residue. Seldom has research investigated the dielectric interactions between microwave and activators during carbonization or systematically compared the characteristics of AC prepared through the microwave and thermal routes.

2. Results and Discussion

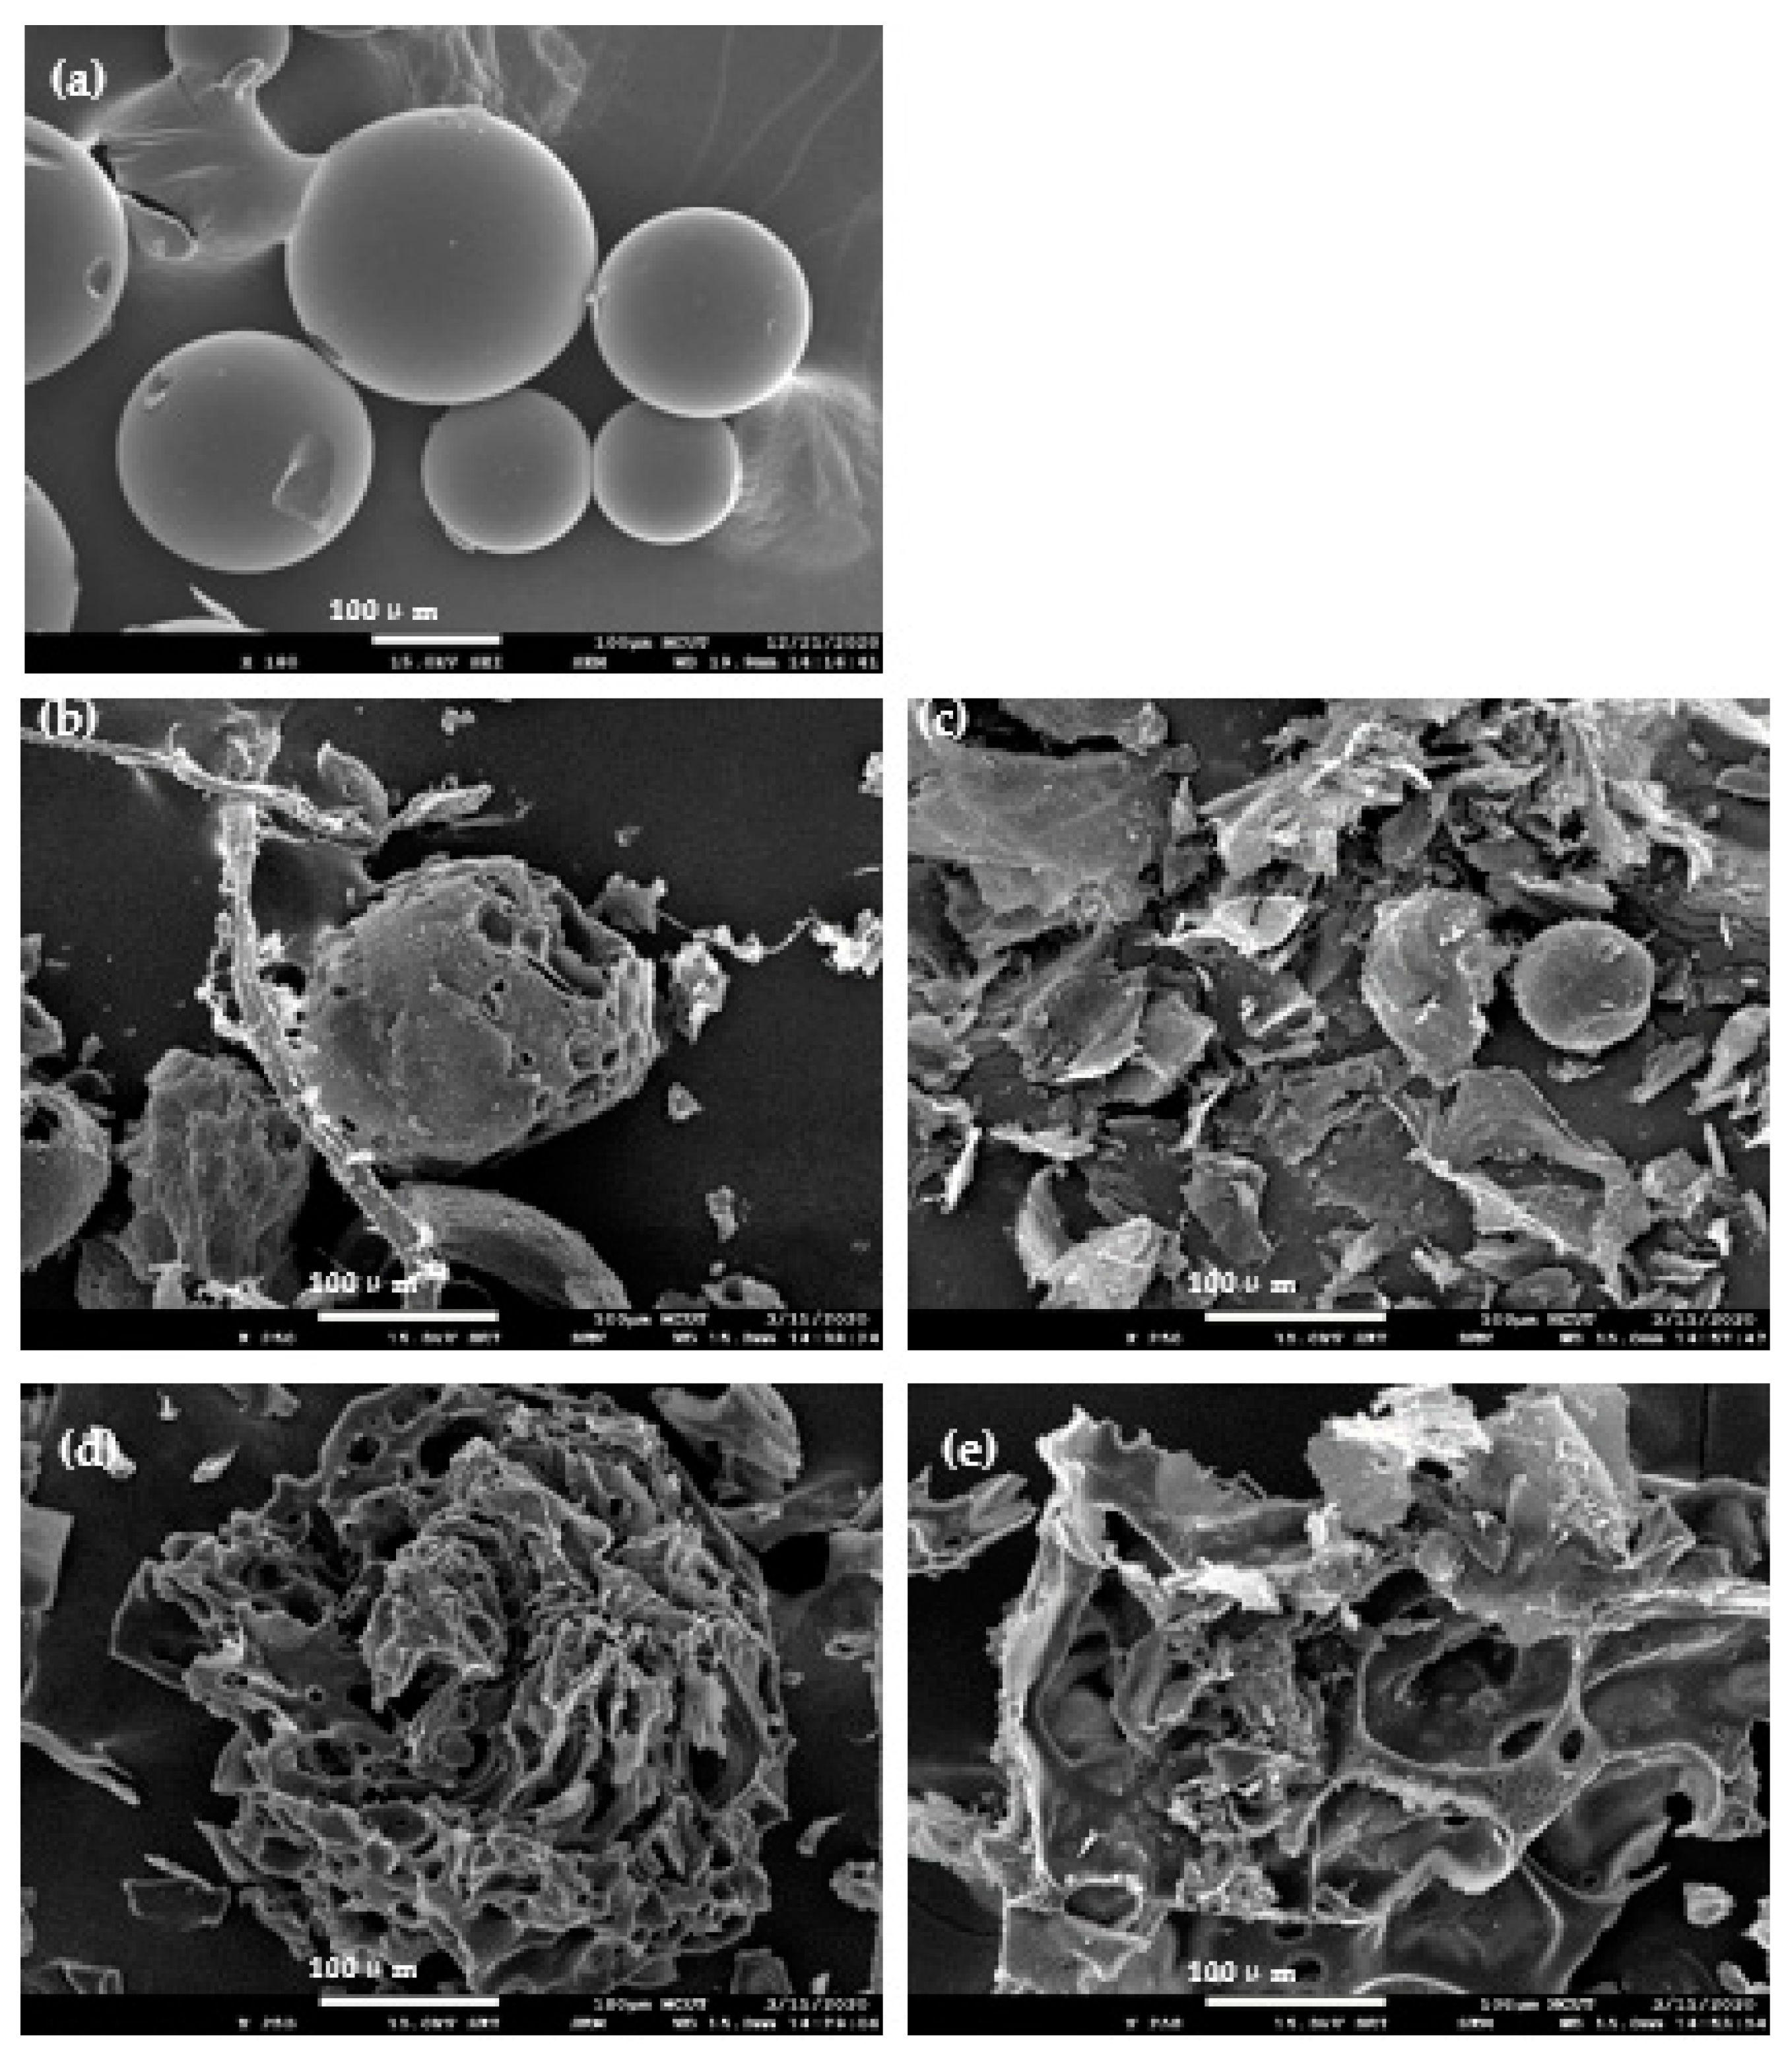
2.1. Topography of AC Derived from Phenolic Resin Waste

The appearance of raw phenolic resin waste was observed using field-emission scanning electron microscopy (FE-SEM) and illustrated in Figure 1a; the waste was composed of spherical particles, each having a 50–300-μm diameter almost nonporous surface. The carbon activated with H3PO4 (denoted by subscript P; Figure 1b,c) exhibited less porosity than activated with KOH (denoted by subscript K; Figure 1d,e). Compared with the relatively full spheres with deep pores on the surface of microwave-catalyzed AC (Figure 1b,d), that prepared through EH exhibited a more fractured structure (Figure 1c,e). With KOH activation, microwave carbonization resulted in AC with finer pores (Figure 1d), which contrasted the AC surficial hollow diameter of approximately up to 50 μm that EH carbonization produced (Figure 1e).
The FE-SEM observations suggested that the activator strongly influenced pore development; KOH created a more porous structure than H3PO4 because the microwaves locally interacted with the raw phenolic resin waste and created narrow and deep pores on the AC surface. KOH has been an effective activator for preparing carbons from phenolic resin because such carbons are susceptible to KOH activation, resulting in considerable microporosity and the disappearance of mesoporosity [8,21]. The interactions of chemicals with phenolic resin and microwaves are discussed in the following sections. The reaction conditions were not optimized to maximize AC production, but the adopted procedure provided a means of comparing the activities of the employed activators and heating sources. Because the reaction time was considerably shorter with microwave heating, it is an efficient method of producing AC.

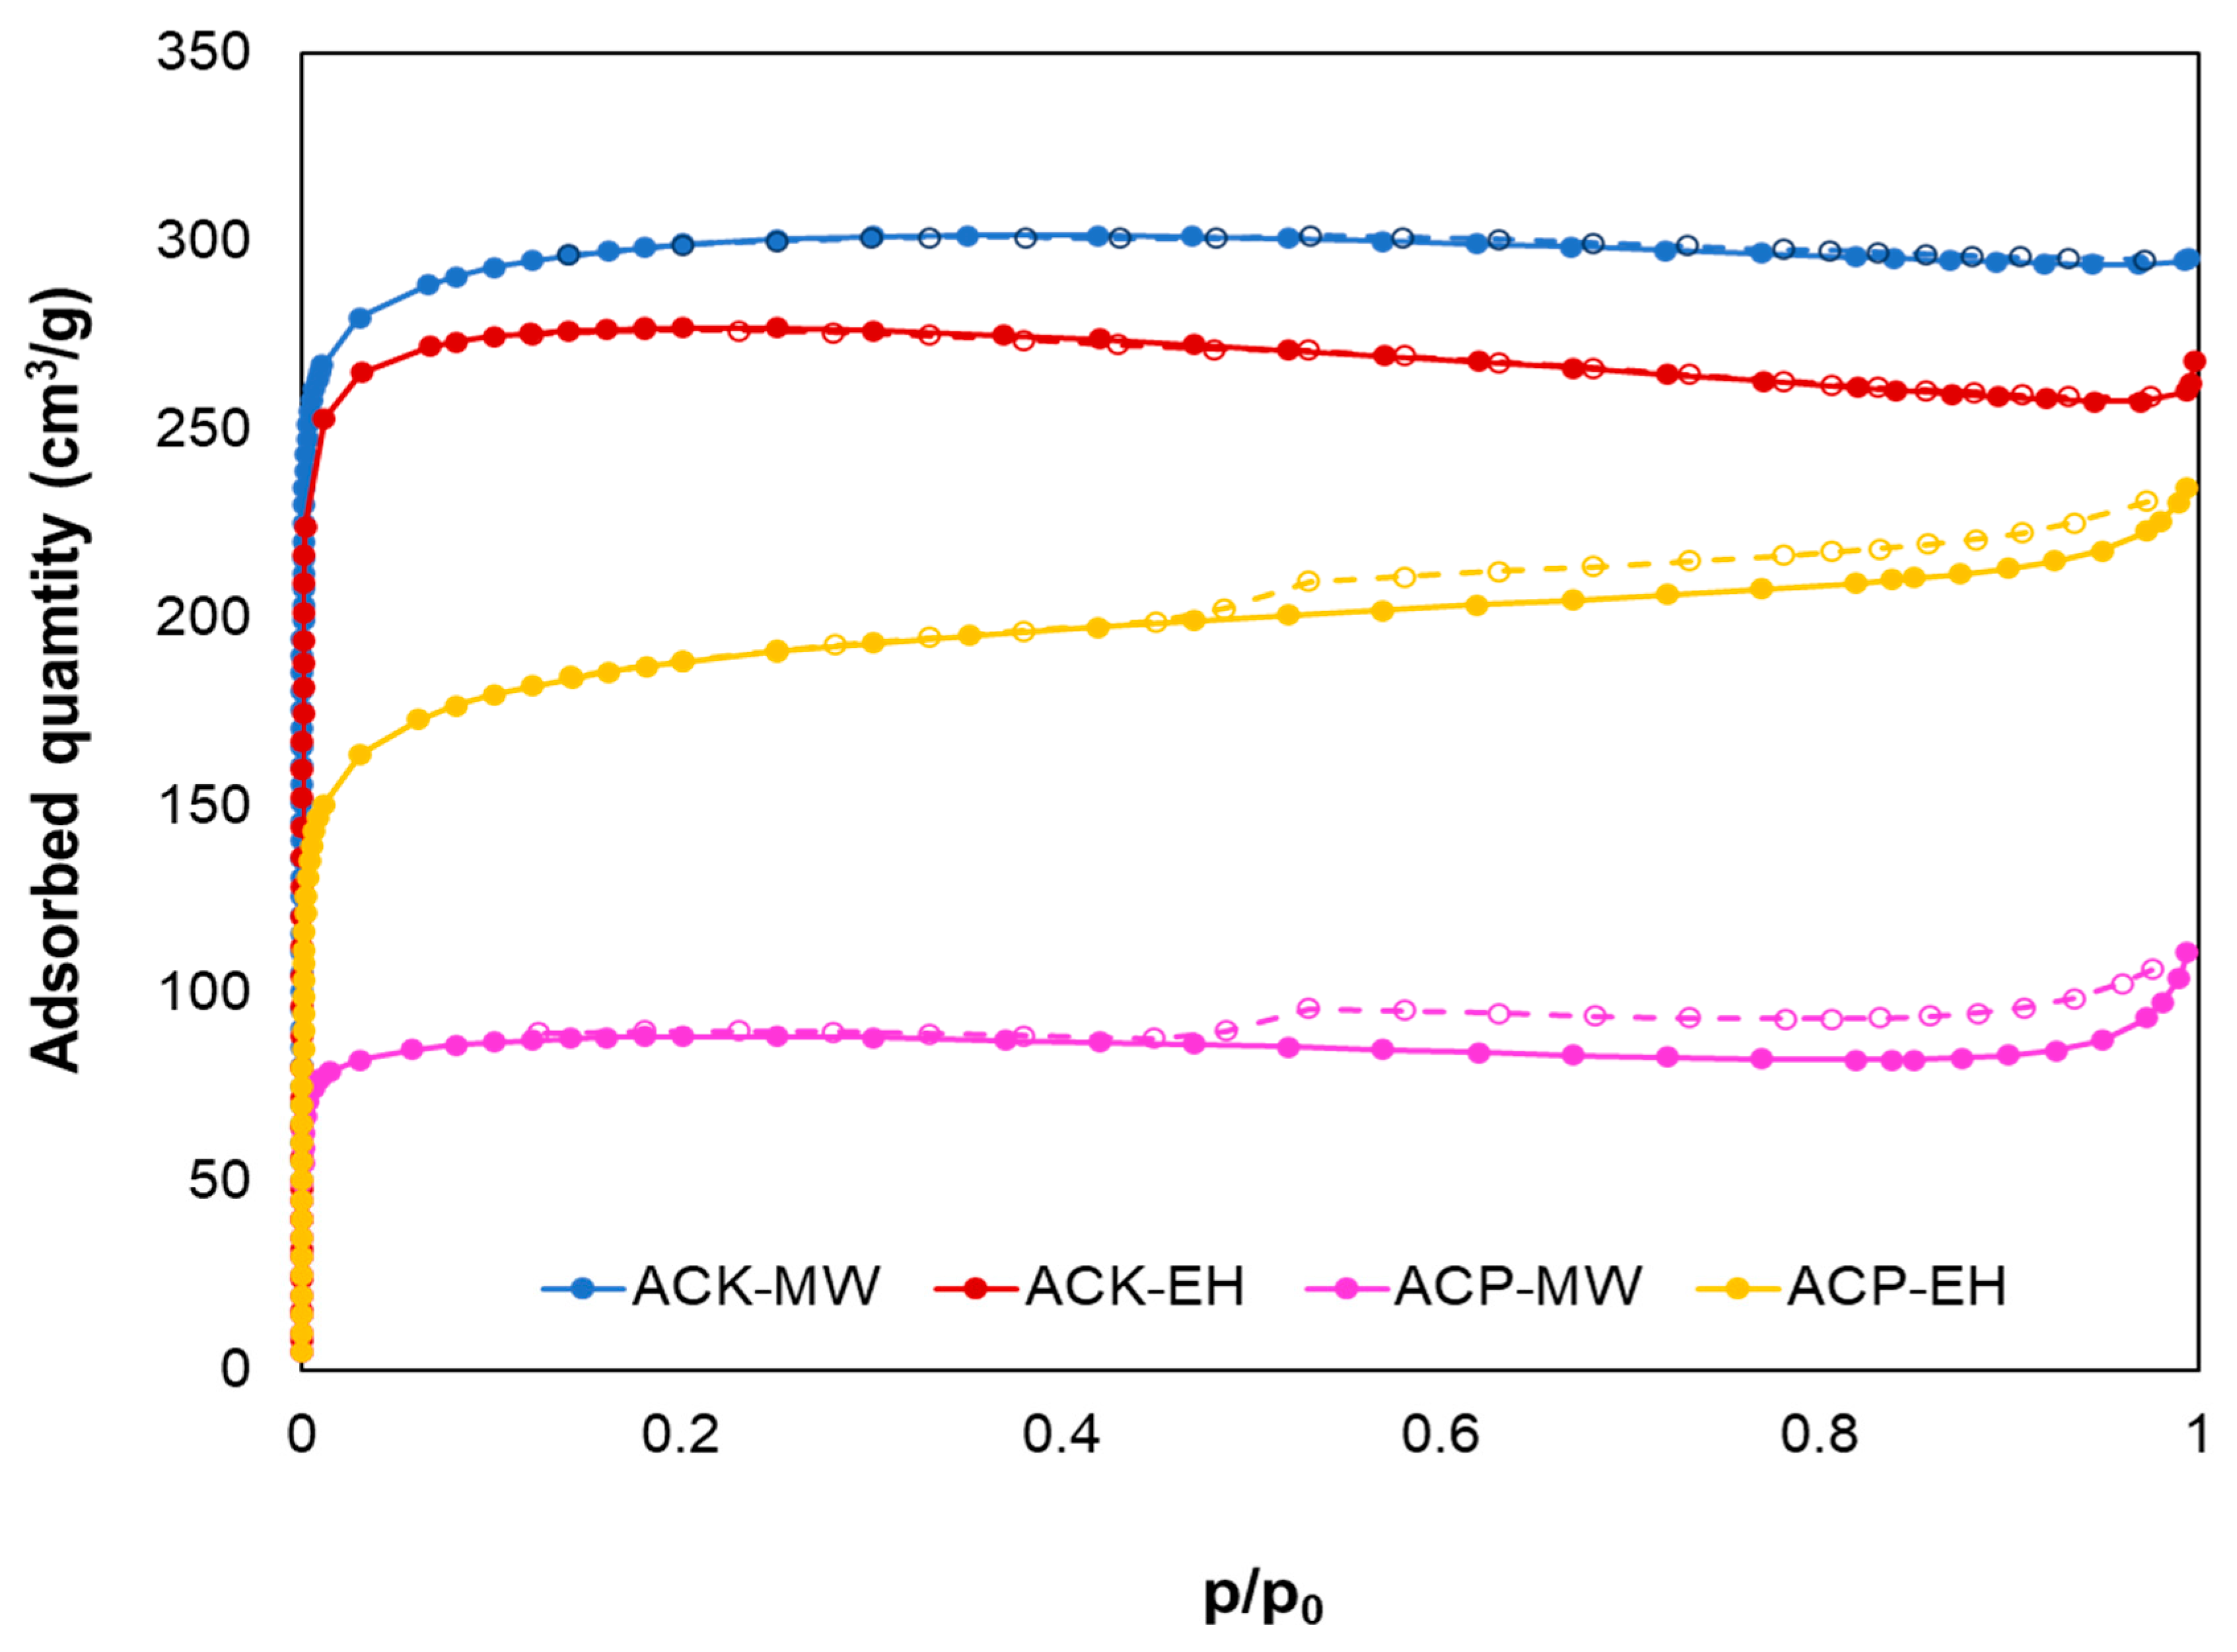
2.2. Specific Surface Area and Micropore Volume of AC

Figure 2 displays the N2 adsorption–desorption isotherms of AC measured at 77 K. According to the International Union of Pure and Applied Chemistry classification [22], the isotherms of KOH-AC (KOH activated AC, i.e., ACK-MW and ACK-EH) are Type I, which is characteristic of microporous materials having low external surface [22]. Therefore, the uptake of adsorbate (nitrogen in the test) was mainly fulfilled with the micropore filling, distinct from the surface coverage on the walls of open macropores or mesopores [23,24]. Consequently, this isotherm type has a limited adsorption capacity, governed by the accessible micropore volume rather than by the internal surface area [22,25]. A steep uptake at extremely low values of p/p0 is due to increased adsorbent–adsorptive interactions in the narrow micropores. In contrast to the reversible isotherm (in which the adsorption and desorption branches almost overlap) observed for KOH-AC, H3PO4-AC exhibited hysteresis loops, which can be attributed to adsorption metastability with respect to the same adsorbate exhibiting on a plane surface or network effects that often occur if wide pores are having narrow necks [22]. The H4-type hysteresis loop, normally associated with slit-shaped pores, was also observed for ACP-MW and ACP-EH. The H4 loop is normally characterized by a nonrigid aggregation of plate-like particles or generally observed with complex materials containing mixed pore sizes [22,26]. The adsorption branch of the ACP-MW and ACP-EH isotherms revealed a composite of Type I and II isotherms corresponding to a mixed microporous and mesoporous structure because a substantial amount of N2 was adsorbed under all pressures. The adsorption increasing without limit at p/p0 = 1 observed on the H3PO4-AC (ACP-MW and ACP-EH) was due to the unrestricted adsorption of multilayers typical of Type II isotherms.
Table 1 presents the porous structural parameters calculated from the N2 adsorption–desorption isotherm of the prepared AC. The specific surface area of the carbon activated with H3PO4 was substantially lower than that of the carbon activated with KOH. Microwave carbonization increased the total specific surface area (Atotal) of the KOH-AC, whereas the opposite was true for the H3PO4-AC. The small difference between the total volume (Vtotal) and micropore volume (Vmicro) of the KOH-AC (both ACK-MW and ACK-EH) indicated that microporosity played a crucial role in its porous structure. By contrast, mesoporosity accounted for 30–45% of H3PO4-AC. The results revealed that the two chemical activators, KOH and H3PO4, primarily governed the porous characteristics, whereas the microwave enhanced the interaction between activator and phenolic resin. The phenolic resin was highly susceptible to KOH etching, the cross-links of the phenolic resin were broken, and the porosity developed during carbonization. However, the H3PO4 did not react with the phenolic resin through the same mechanism, especially during microwave carbonization.

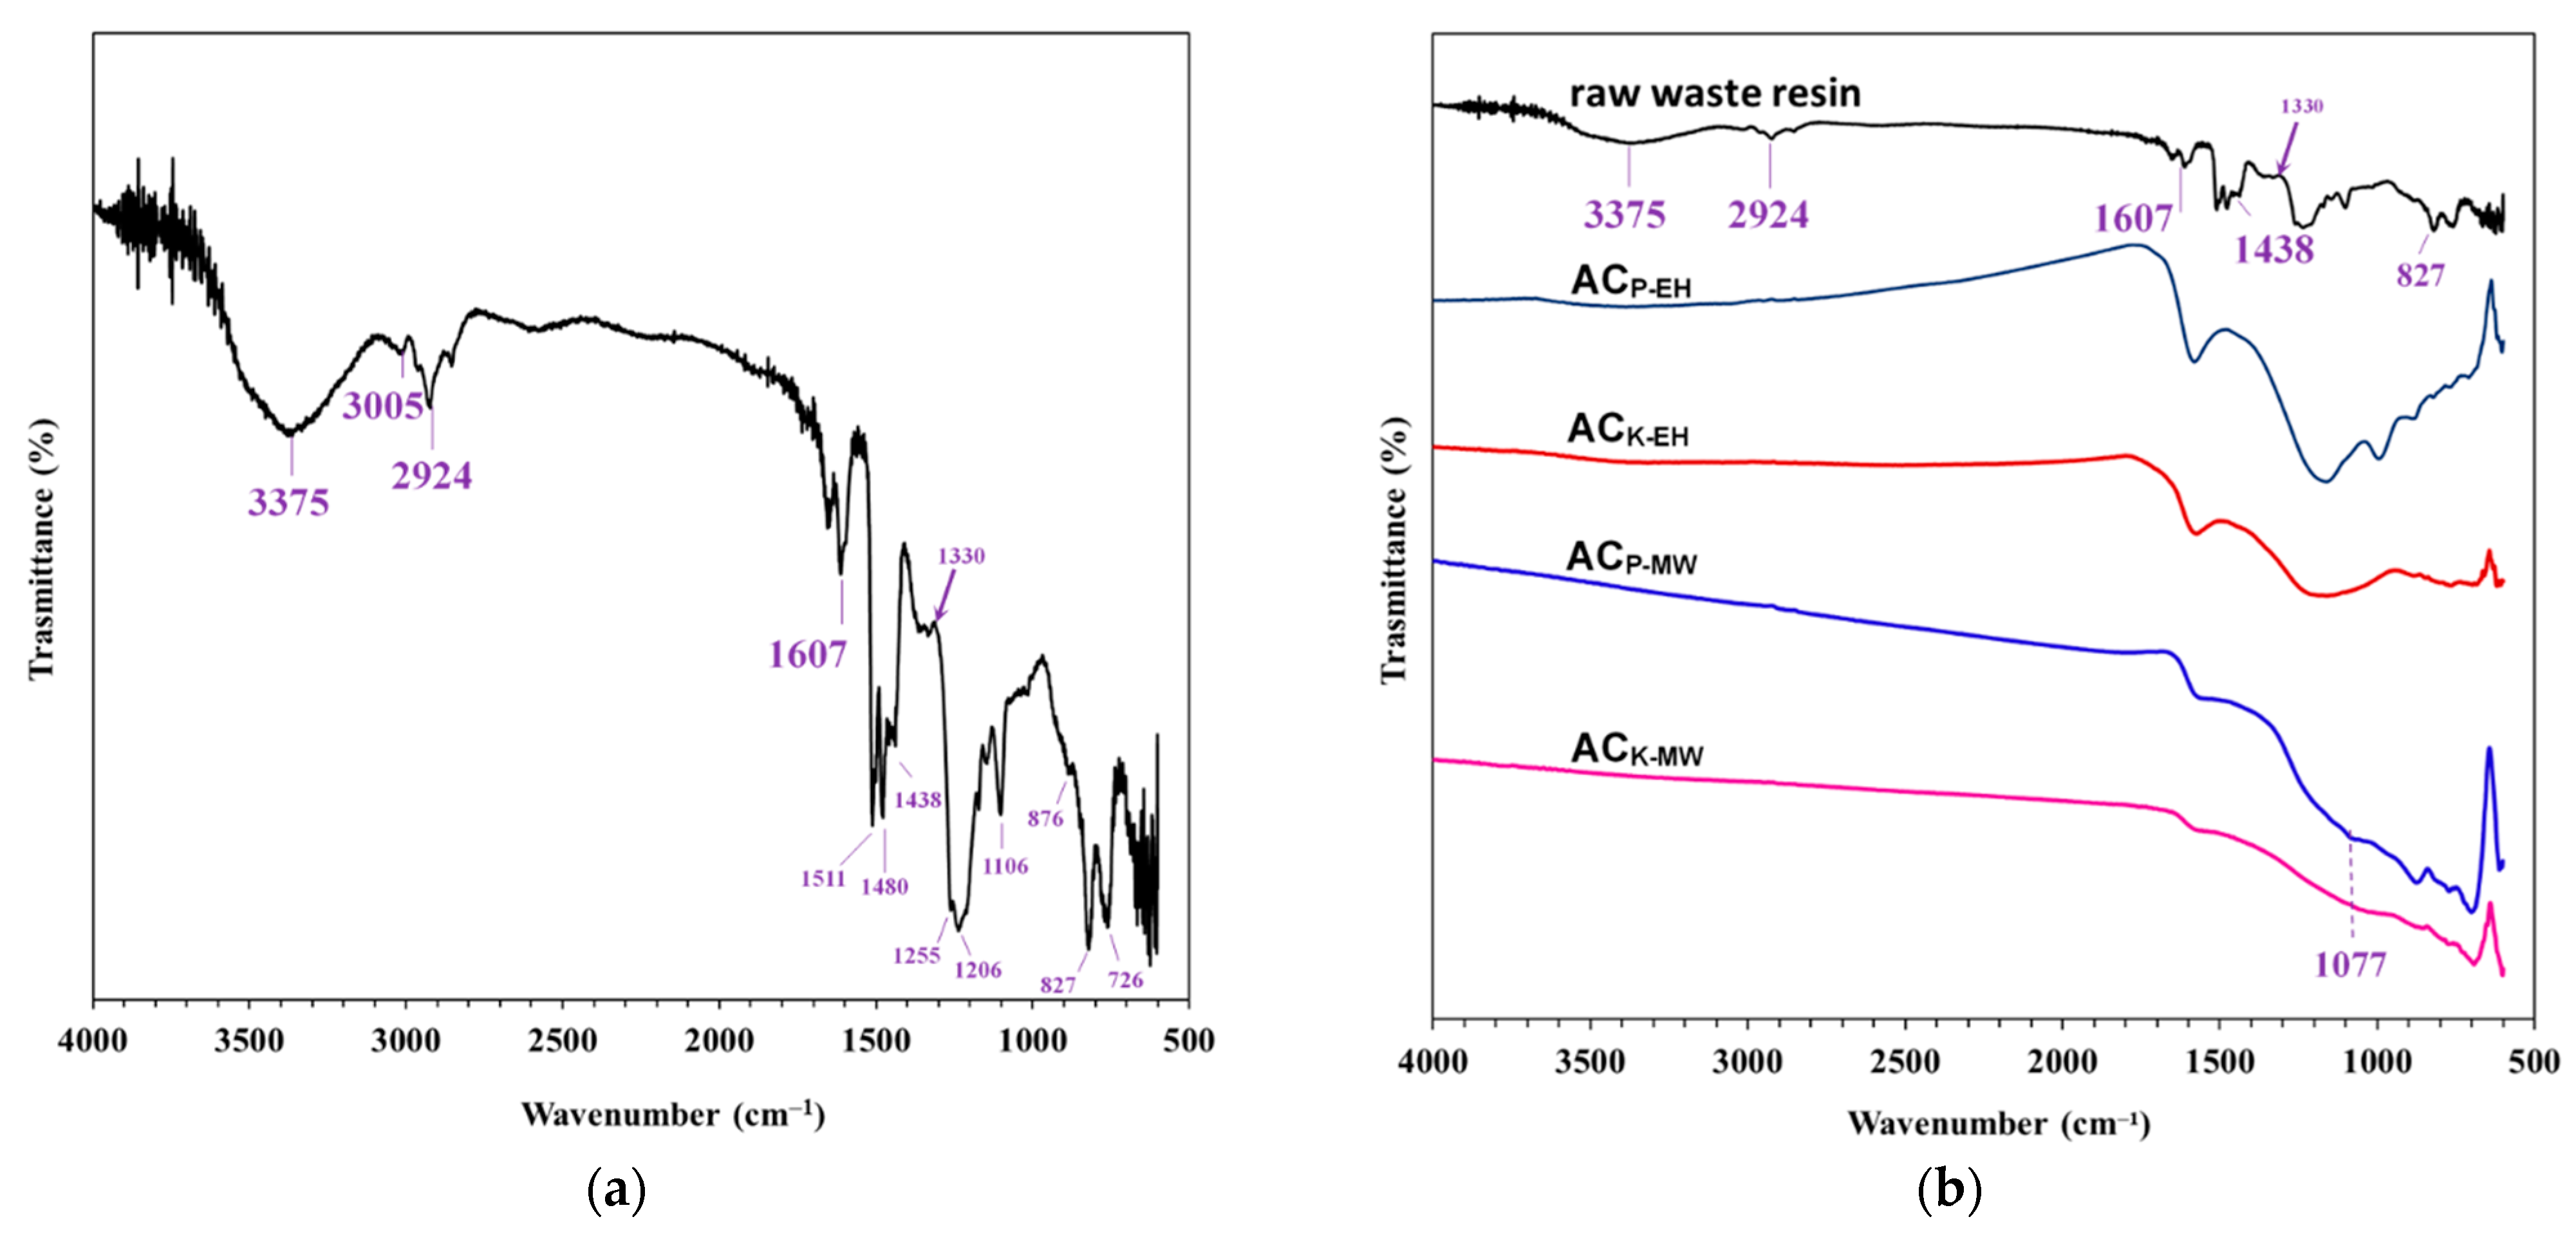
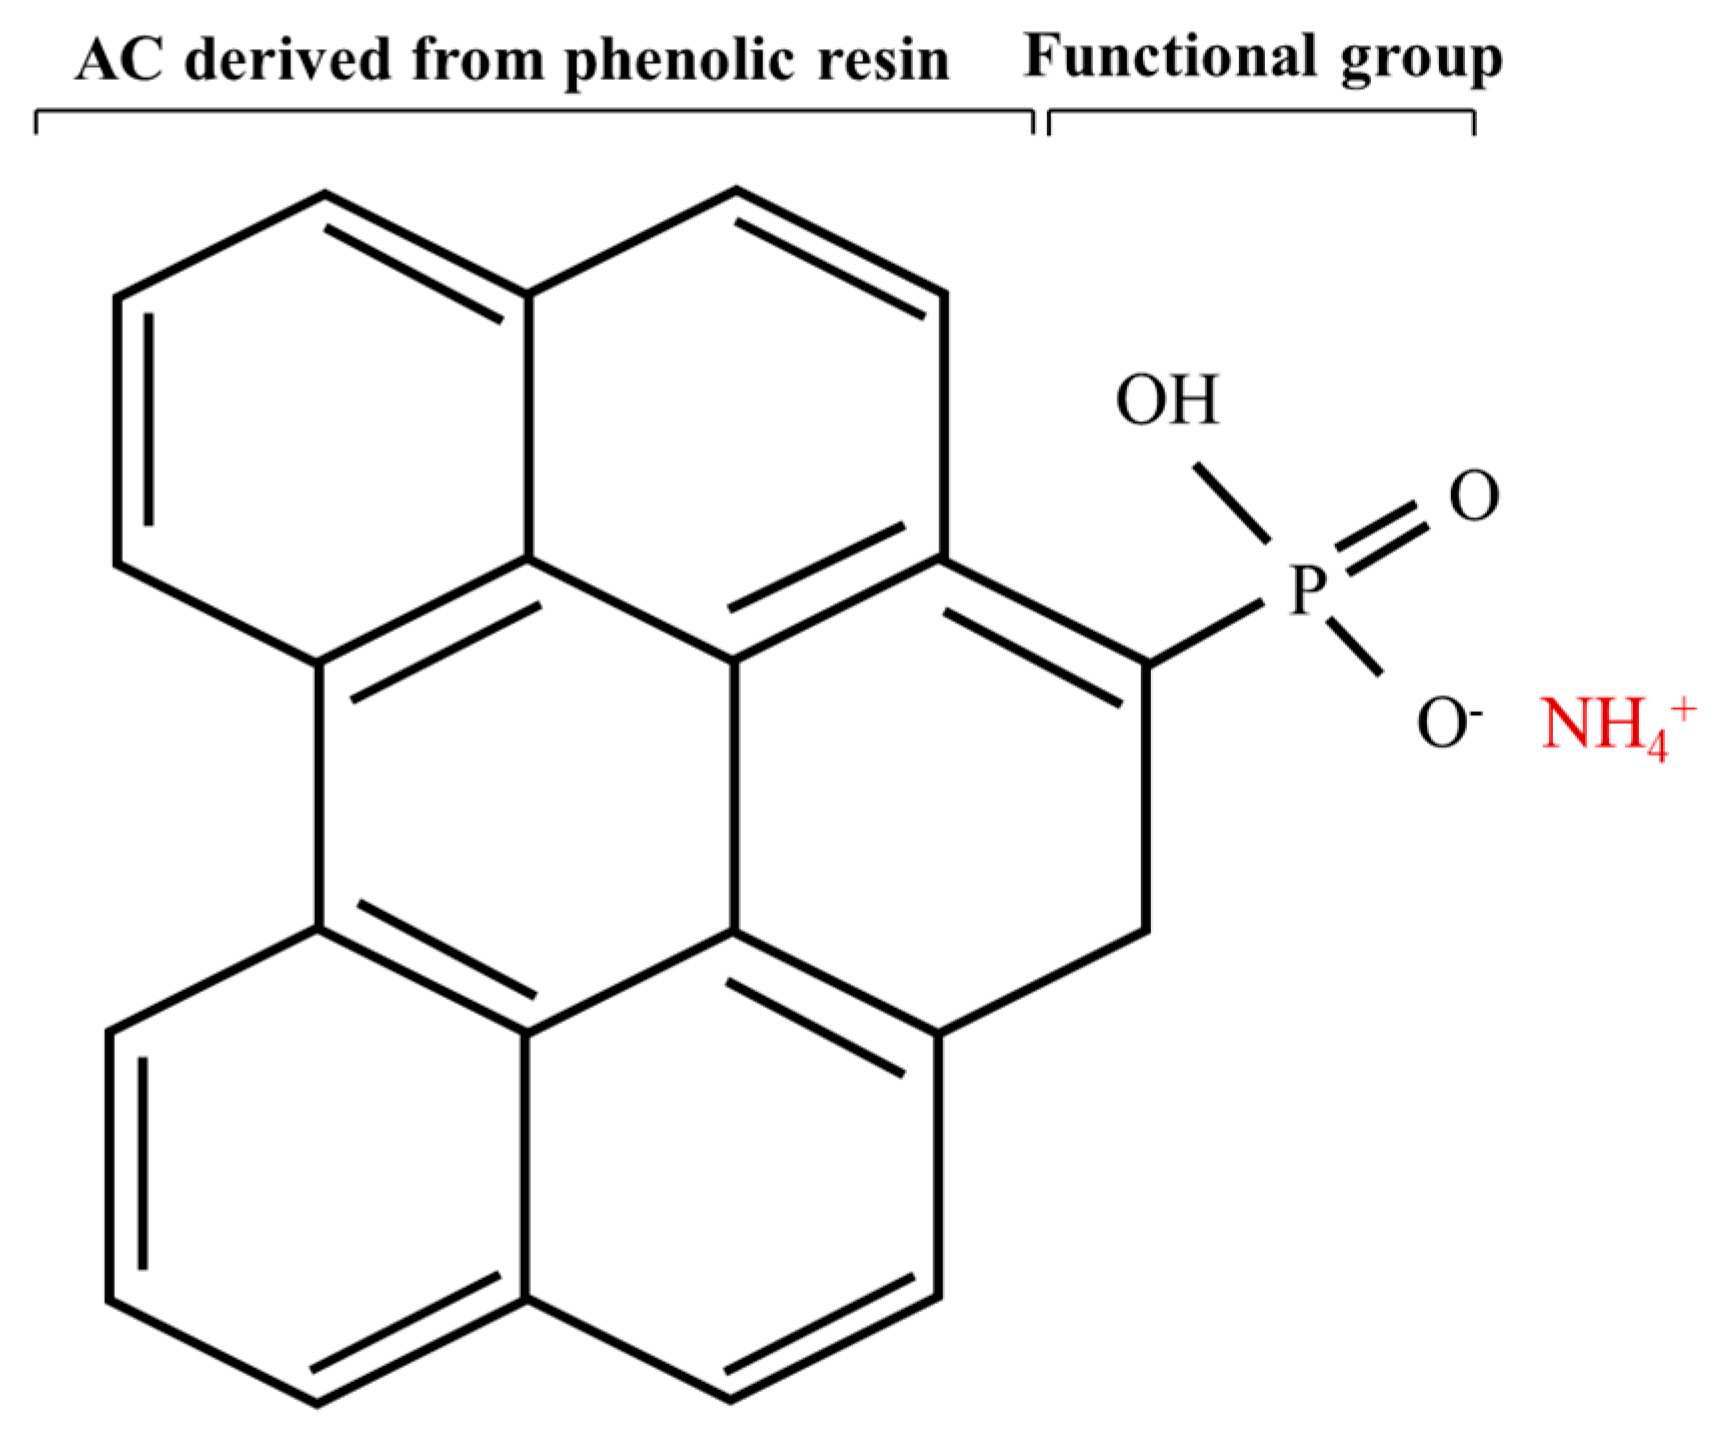
2.3. AC Surface Functional Groups

Figure 3 displays the major absorption peaks of the Fourier transform infrared spectra of the raw resin waste and prepared AC. As Figure 3a reveals, the peak was at 3375 cm−1, corresponding to phenolic and alcohol -OH stretch vibrations, which is consistent with the literature [27,28]. This peak weakened and shifted to higher wavelengths in the AC produced through EH carbonization, regardless of the activator used. This peak shift could be due to cross-linking between phenol and its derivatives [29,30]. During microwave carbonization, the absorption peak at 3375 cm−1 almost faded away. The peaks at 1206 cm−1 indicated alkyl–phenol C–O stretch vibration, and 1607 cm−1 indicated C = C aromatic ring stretch vibration remained during EH carbonization despite weakening considerably under microwave radiation. Moreover, the KOH-AC exhibited more pronounced weakening of its absorption peaks than did the H3PO4-AC under the same carbonization conditions, demonstrating that KOH reacts more strongly with phenolic resin than H3PO4 does. The peak at 3005 cm−1 indicated the aromatic C–H stretch vibration and the peak at 1106 cm−1 indicated the aromatic C–H in-plane deformation vibration weakened in the AC produced through EH but almost disappeared in microwaved AC. The weakening or disappearance of the intensity peak of phenolic and alcohol -OH stretch vibrations, alkyl–phenol C–O stretch vibrations, aromatic C–H stretch vibrations, and aromatic C–H in-plane deformation vibrations implied that the microwaves catalyzed the phenolic compound reaction or volatilization, consequently enhancing carbonization. Moreover, the peak at 1077 cm−1 indicated that polycyclic aromatic ring deformation vibration appeared in the microwaved AC (ACP-MW and ACK-MW) but not in the electric heated AC, supporting the notion that the microwaves enhanced carbonization.
In addition to the differences in the functional groups associated with aromatic rings among the AC preparations, variation in other functional groups against the activator and thermal source was observed. The absorption peaks at 1480, 1438, and 1330 cm−1, associated with -CH3 and -CH2 vibrations, almost disappeared in the AC, regardless of the activator or carbonization method, indicating the reaction and volatilization of the alkyl groups in the raw phenolic resin waste through these processes. Moreover, the band at 2924 cm−1 represented aliphatic -CH2 vibrations and weakened in the H3PO4-AC (ACP-EH and ACP-MW) and almost disappeared in the KOH-AC. This disappearance could be attributed to the alkali enhancing the hydrolysis of the methylene linkages in the phenolic resin, and thus, phenolic resin decomposition [31].

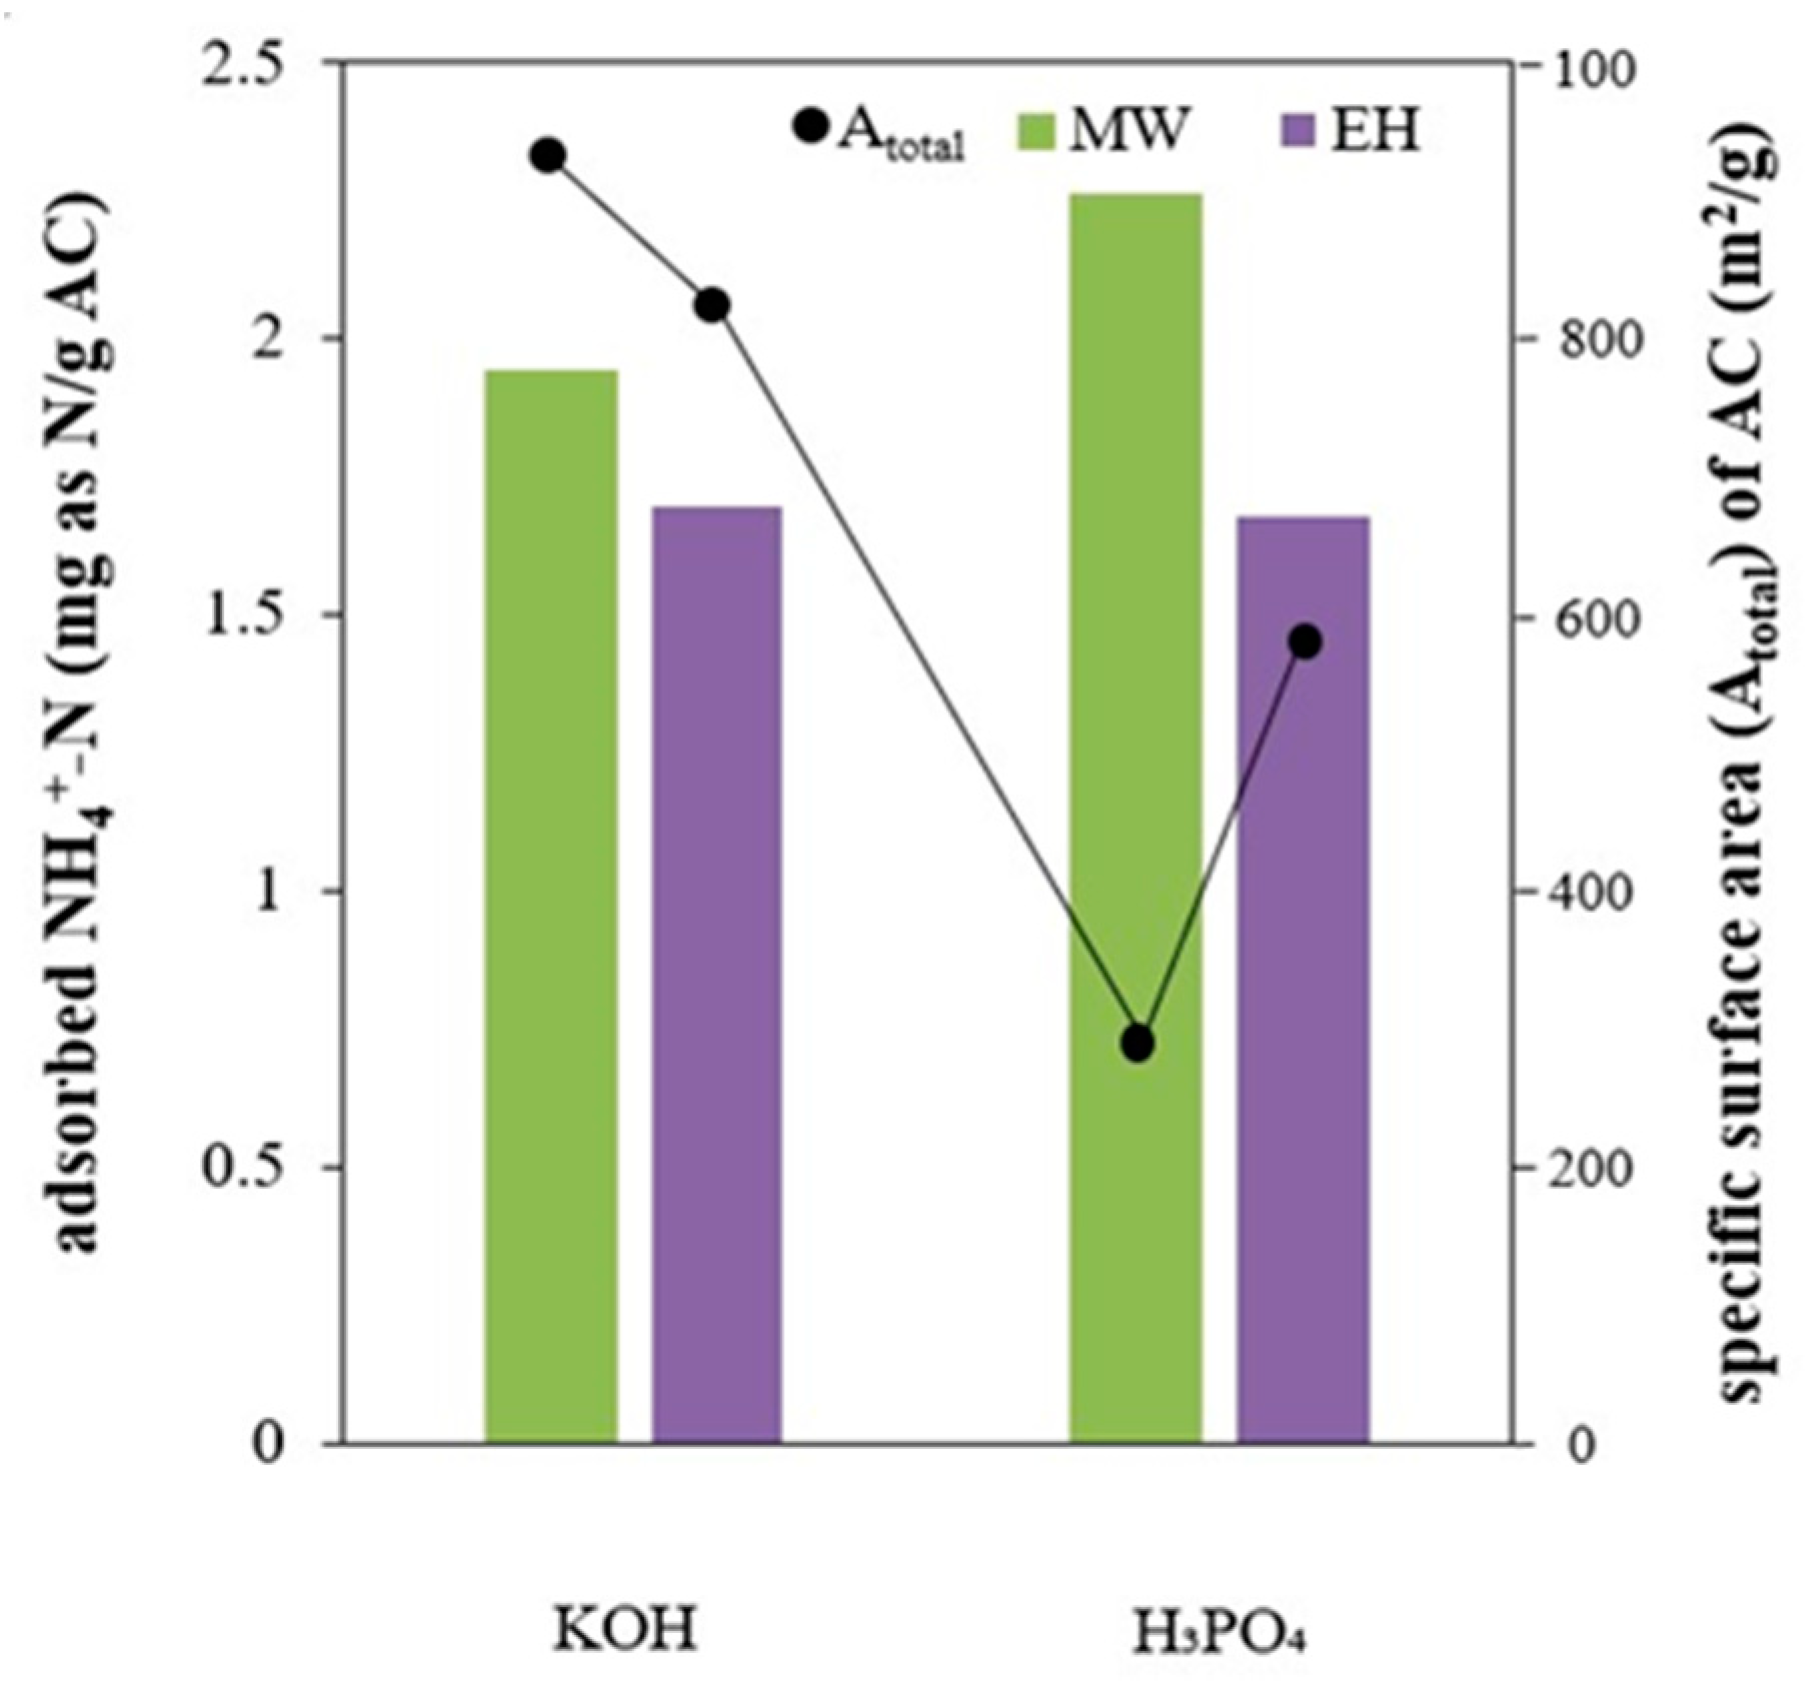
2.4. Ammonium Removal from Water with AC

The distribution of ammonium (NH4+(aq)) and ammonia (NH3(aq)) species depends on the pH and temperature of its solution. For an acidic solution, ammonium is predominant, irrespective of temperature. For a solution with a pH > 7, the ammonium becomes substantially less abundant at increasing temperature, and ammonia partially dissipates in favor of the formation of ammonia gas (NH3(g)) [32]. Ammonium adsorption in this study was conducted at a pH of 6; therefore, the emission of ammonia gas from the reaction solution was not considered to affect the ammonium removal.
Figure 4 presents the adsorption of ammonium by the prepared AC. The AC’s total specific surface area (Atotal, as listed in Table 1) was also shown to highlight activator and thermal source influence. The ammonium adsorbed by the AC produced through microwave carbonization was higher than EH carbonization for the same activator. The activator exerted different influences on microwave and EH carbonization: The ammonium adsorbed by the ACP-MW was substantially higher than that by the ACK-MW, but the ACP-EH adsorbed slightly less ammonium than did the ACK-EH (per gram of AC). As Figure 4 showed, the Atotal of the H3PO4-AC was markedly lower than that of the KOH-AC, but the amount of ammonium adsorbed did not reflect the surface area limitation of the H3PO4-AC. Generally, for adsorbents with similar features, adsorption is highly dependent on and proportional to the specific surface area. Therefore, the surficial nature of H3PO4-AC must be different from that of KOH-AC. As seen in Figure 4, the microwaved H3PO4-AC had the lowest specific surface area among all AC. However, it displayed prominent ammonium adsorption, indicating that a featured surface property for ammonium uptake had formed.
The adsorption of ammonium from water is influenced by both solution conditions and the characteristics of adsorbents. Zhu et al. [33] reported that ammonium adsorption on AC derived from avocado seed reached a maximum value at pH 5 and decreased with increasing pH, probably due to decreasing positively-charged ammonium species that the charged adsorbent could attract. Higher ammonium uptake capacity obtained with increasing biochar dosage and initial ammonium concentration might be ascribed to the higher availability of ammonium ion and stronger driving force to overcome the mass transfer resistance, respectively [5,33]. Takaya et al. [34] compared the chars derived from various wastes. They indicated that chars with high surface areas did not possess better ammonium adsorption capacity, but a positive relationship exists between char oxygen function groups, CEC, and ammonium adsorption. Although the adsorption conditions, for instance, solution pH, initial concentration of ammonium, and temperature, which are significant parameters for adsorption, were variant in literature, the ACP-MW adsorbed 2.26 mg of NH4+ as N/g of AC. The value was comparable to the approximate 1–3 mg/g achieved by AC in other studies at similar adsorptive conditions [19,35,36].

2.5. Discussion of Microwave Effects on Carbonization

To clarify the considerable adsorption of ammonium by the ACP-MW, which had relatively low specific surface area, the surface P and K content of the H3PO4- and KOH-AC, respectively, were measured using wavelength-dispersive spectroscopy (WDS; Table 2). The results revealed that the surface P content on the microwaved AC was approximately five times that on the electric heated AC. In contrast, the K content on the microwaved AC was approximately equal to that on the EH AC (Table 2), indicating that microwave radiation catalyzed the interaction of the activators with the phenolic resin waste and that this effect was more pronounced with H3PO4 activation.
Because of the 2450-MHz microwave frequency adopted in this study, the dielectric properties of the phenolic resin waste samples treated with activators but before carbonization were examined (Table 3). The dielectric constant (ε′) represents the quantity of electric energy that can be stored within the heated sample, and the dielectric loss (ε″) indicates the capacity of the heated sample to dissipate microwave energy [37]. The higher ε′ and ε″ of the resin activated with H3PO4 were associated with its strong microwave absorption and heat conversion, which may have contributed to the phosphate strongly reacting with the phenolic resin [37], thereby forming complexes with the AC surface. Furthermore, the higher P content on the ACP-MW than on the ACP-EH indicated that the microwaves catalyzed the phosphate complex reaction with the phenolic resin surface, resulting in the functionalization of the AC surface.
Figure 5 schematically presents the phosphate-functionalized structure on the H3PO4-AC. The surface phosphate functional groups on the ACP-MW and ACP-EH also explain the highly effective ammonium adsorption of the H3PO4-AC, even at low specific surface areas, because of the strong, complex formation of phosphate and ammonium (Figure 5). The formation of phosphate complexes on the phenolic resin surface might have blocked the pores or formed a passive film on the resin surface that restricts porosity development, possibly leading to the lower specific surface area of the ACP-MW.

3. Materials and Methods

3.1. Materials

Raw phenolic resin waste was collected from a resin production factory in southern Taiwan; the resin was a type of resole resin and was rejected from the quality check. Table 4 displays the properties of the resin waste; the data revealed the resin to be a highly carbonaceous material suitable for AC production. Proximate analysis of the phenolic resin was performed according to the American Society for Testing and Materials standard testing method E1131–08. The elemental content of the resin was determined using an elemental analyzer (Vario EL Cube), and the oxygen content was calculated using the differences.
KOH (85%, Duksan, Gyeonggi, Korea) and H3PO4 (85%, Honeywell FLUKA, UK) were selected as activators. HCl (38%, J. T. Baker, Phillipsburg, NJ, USA) and NaOH (98%, Honeywell FLUKA, UK) were used for washing after resin waste carbonization and for pH adjustment for ammonium adsorption. NH4Cl (99.8%, Macron, Center Valley, PA, USA) was used to prepare the artificial ammonium-containing wastewater.

3.2. Activation and Measurement of Dielectric Properties

Two chemicals (KOH and H3PO4) with activating functions but different dielectric properties were used to pretreat phenolic resin waste. The phenolic resin was impregnated in each activator solution at a 4:1 ratio of activator to raw resin waste. The mixtures were stirred steadily and heated at 80 °C for 2 h and moved into a 105 °C oven for 24 h to dry. Subsequently, the dried mixtures were subjected to carbonization using microwave radiation or conventional EH. Prior to carbonization, the dielectric properties—the dielectric constant (ε′) and dielectric loss (ε″)—of the activated samples were measured using a dielectric assessment kit for thin layers (DAK3.5-TL2: 200 MHz–20 GHz, SPEAG, Zurich, Swiss) connected to a Vector Network Analyzer (R&S ZND, Munich, Germany) [38].

3.3. Experimental Apparatus

Microwave carbonization of phenolic resin waste was conducted in a single-mode 2.45-GHz microwave oven. The layout of the entire microwave reactor system was presented previously [39]. A SiC crucible 4 cm in diameter and 3 cm deep was constructed and used as the sample holder for both microwave and EH carbonization. For microwave carbonization, the sample crucible was placed in a quartz reaction tube 40 cm in length and 10 cm in outer diameter. When the microwave radiated the crucible inside the tube, the reflected microwave power levels were minimized by adjusting a three-stub tuner and a short-circuit plunger. The actual working microwave power level was determined by subtracting the reflected power level from the incident power level. A K-type thermocouple sensor was placed beneath the sample crucible to measure the temperature in real-time during carbonization.
EH carbonization was conducted in a horizontal quartz reactor (40 cm in length and 10 cm in outer diameter) placed in a tubular furnace comprising a gas in-flow and out-flow control device, temperature-controlled cooling water module, and sample reaction chamber. The maximal power of the tubular furnace was 2000 W.

3.4. Carbonization Procedures

After pretreatment, the dried mixtures of the phenolic resin waste and activator were placed into the quartz reaction tube or the reaction chamber for microwave or EH carbonization, respectively. Before the system was powered on, both reaction devices were purged using pure nitrogen gas (99.99%) at a flow rate of 100 mL/min to ensure anoxic conditions. A pretest suggested that the temperature in a microwave system operated at 500 W could reach 500–600 °C in 5 min. Therefore, 500 W was adopted as the carbonization conditions for microwave radiation to compare the EH carbonization at 600 °C.
The activated waste sample was placed in the SiC crucible and then loaded inside the quartz reaction tube. The height of the crucible was adjusted to be located in the path of microwave propagation or the center of the tubular furnace. After purging with N2 gas, the microwave oven power supply was turned on, and the power was adjusted to 500 W. After 30 min of microwave irradiation, the power supply was turned off, and the carrier gas was purged until the reactor cooled to room temperature. For EH carbonization, the heating rate was 20 °C/min, and the sample was maintained at 600 °C for 60 min. After the N2 cooled to room temperature, the solid residue remaining in the crucible was rinsed using 0.1 N HCl solution and KOH solution for KOH and H3PO4 activated AC for 1~2 times, respectively, and washed thoroughly with deionized water until the nearly neutral pH of washing water was reached. The AC was then dried in an oven overnight, weighed, and subsequently stored in a desiccator for further testing. All experiments were performed at least in triplicate to obtain average values of the experimental results.

3.5. Characterization of Prepared AC

The raw phenolic resin waste morphology and prepared AC were observed through FE-SEM (Jeo, JSM-7610F). The microscopic chemical composition of K and P content was examined at three sites on the surface of the KOH- and H3PO4-AC, respectively, using a wavelength-dispersive spectrometer (WDS) equipped to the FE-SEM.
The specific surface area, SBET, was measured (Micrometrics ASAP 2010, Norcross, GA, USA) at 77 K using nitrogen adsorption and calculated with the Brunauer–Emmett–Teller equation. The total (Vt) and micropore (Vmicro) volumes were evaluated using the amounts of nitrogen adsorbed at respective relative pressures of approximately 0.995 and 0.1. The mesopore volume (Vmeso) was calculated as the difference between the total and micropore volumes. Finally, the micropore volume (Vmicro) and external surface area (Aexternal) were calculated using the t-method.
To avoid moisture interference in the sample, the sample pellets were carefully prepared prior to the Fourier transform infrared (FTIR) analysis. KBr powder was firstly pulverized to 200 mesh in maximum, dried at approximately 105 °C overnight, and then stored in a desiccator. Each prepared AC was mixed with the pretreated KBr powder and then finely pulverized and put into a pellet-forming die. A force of approximately 8 tons was applied under a vacuum for several minutes to eliminate air and moisture from the mixture and form transparent pellets. A Fourier transform infrared spectroscope instrument (Vertex 80v, Bruker, CA, USA) with single-bounce attenuated total reflectance was used, and the spectra were recorded for 4000–600 cm−1. Characteristic chemical bonds and stretching vibrations were identified through comparison with standard frequency patterns, from which the surface functional groups could be determined.

3.6. Ammonium Removal with Prepared AC

Aqueous ammonium adsorption was performed using a batch technique in 50-mL amber vials with caps to evaluate the capacity of the prepared AC for pollutant removal. Before the adsorption experiments, the AC was aged at 25 °C in an N2 atmosphere for 2 h. The initial AC and ammonium concentrations were maintained at 5 g/L and 10 mg of N/L, respectively. Next, the reaction solution was adjusted to pH 6 ± 0.05 using KOH and HCl solutions before being shaken at 100 rpm and 25 °C for 24 h. After ammonium adsorption, the samples were filtered through a 0.22-μm filter and analyzed for residual ammonium using an ion chromatograph (Dionex Aquion IC System, Thermo Scientific, Waltham, MA, USA) with the CG12A precolumn and CS12A separation column. All experiments were conducted at least in triplicate to obtain average values for the results.

4. Conclusions

According to our results, microwave radiation substantially influenced the carbonization process through dielectric interactions with the activators, enhancing porosity and surface functional group formation. Additionally, the activator was the dominant factor determining the AC porosity and surface chemical features. Because of the alkali-enhanced hydrolysis of the methylene linkages in the phenolic resin and its subsequent decomposition, the KOH activator strongly etched the resin then developed a pronounced porous structure, yielding AC with a high specific surface area up to 924 m2/g. However, a less developed porous structure but abundant phosphate functional groups, P accounts for 6.08% of surface elemental content, were observed on the microwaved H3PO4-AC. These phenomena are attributed to the high dielectric constant and dielectric loss of the H3PO4-AC. A reaction mechanism involving the complexing of phosphate functional groups with ammonium might explain the high ammonium adsorption despite the low specific surface area of the microwaved H3PO4-AC. The phenolic resin–derived microwaved AC could be removed as 2.26 mg of N/g of AC, consistent with values obtained in other studies.

Author Contributions

Conceptualization, W.-H.K. and S.-S.C.; methodology, W.-H.K., C.-Y.C. and Y.-S.H.; formal analysis, C.-Y.C. and Y.-S.H.; investigation, C.-Y.C. and Y.-S.H.; resources, W.-H.K. and K.-Y.H.; data curation, W.-H.K.; writing—W.-H.K. and C.-Y.C.; writing—review and editing, W.-H.K. and Y.-S.H.; funding acquisition, W.-H.K. and S.-S.C. All authors have read and agreed to the published version of the manuscript.

Funding

This research was funded by WaterPark Environment Corporation (project no. O01107S011) and the Ministry of Science and Technology, Taiwan (MOST 108-2218-009-063).

Acknowledgments

The authors gratefully thank Shan-Feng Wang, who conducted the SEM/WDS analysis and the National Tsing Hua University Instrument Center for FTIR analysis.

Conflicts of Interest

The authors declare no conflict of interest.

References

  1. Narayan, L. Phenolic Resins Market Share, Size, Trends, Industry Analysis Report; Polaris Market Research: New York, NY, USA, 2020. [Google Scholar]
  2. The European Parliament and of the Council. Directive (EU) 2018/850 of the European Parliament and of the Council of 30 May 2018 amending Directive 1999/31/EC on the landfill of waste. Off. J. Eur. Union 2018, 150, 100–108. [Google Scholar]
  3. Ma, Y. Comparison of activated carbons prepared from wheat straw via ZnCl 2 and KOH activation. Waste Biomass Valorization 2017, 8, 549–559. [Google Scholar] [CrossRef]
  4. Rajak, V.; Kumar, S.; Thombre, N.; Mandal, A. Synthesis of activated charcoal from saw-dust and characterization for adsorptive separation of oil from oil-in-water emulsion. Chem. Eng. Commun. 2018, 205, 897–913. [Google Scholar] [CrossRef]
  5. Salimova, A.; Liu, F.; Wang, Y.; Wang, S.; Verichev, K. Ammonia and phosphorus removal from agricultural runoff using cash crop waste-derived biochars. Front. Environ. Sci. Eng. 2020, 14, 1–13. [Google Scholar]
  6. Nanda, S.; Dalai, A.K.; Berruti, F.; Kozinski, J.A. Biochar as an Exceptional Bioresource for Energy, Agronomy, Carbon Sequestration, Activated Carbon and Specialty Materials. Waste Biomass Valorization 2016, 7, 201–235. [Google Scholar] [CrossRef]
  7. Spanu, D.; Binda, G.; Dossi, C.; Monticelli, D. Biochar as an alternative sustainable platform for sensing applications: A review. Microchem. J. 2020, 159, 105506. [Google Scholar] [CrossRef]
  8. Kubota, M.; Hata, A.; Matsuda, H. Preparation of activated carbon from phenolic resin by KOH chemical activation under microwave heating. Carbon 2009, 47, 2805–2811. [Google Scholar] [CrossRef]
  9. Guo, J.; Lua, A. Surface functional groups on oil-palm-shell adsorbents prepared by H3PO4 and KOH activation and their effects on adsorptive capacity. Chem. Eng. Res. Des. 2003, 81, 585–590. [Google Scholar] [CrossRef]
  10. Wei, X.-Q.; Li, Q.-H.; Li, H.-C.; Li, H.-J.; Chen, S.-X. The use of ZnCl2 activation to prepare low-cost porous carbons coated on glass fibers using mixtures of Novolac, polyethylene glycol and furfural as carbon precursors. New Carbon Mater. 2015, 30, 579–586. [Google Scholar] [CrossRef]
  11. Grant, E.; Halstead, B.J. Dielectric parameters relevant to microwave dielectric heating. Chem. Soc. Rev. 1998, 27, 213–224. [Google Scholar]
  12. Jones, D.A.; Lelyveld, T.; Mavrofidis, S.; Kingman, S.; Miles, N. Microwave heating applications in environmental engineering—A review. Resour. Conserv. Recycl. 2002, 34, 75–90. [Google Scholar] [CrossRef]
  13. Appleton, T.; Colder, R.; Kingman, S.; Lowndes, I.; Read, A. Microwave technology for energy-efficient processing of waste. Appl. Energy 2005, 81, 85–113. [Google Scholar] [CrossRef]
  14. Luque, R.; Menendez, J.A.; Arenillas, A.; Cot, J. Microwave-assisted pyrolysis of biomass feedstocks: The way forward? Energy Environ. Sci. 2012, 5, 5481–5488. [Google Scholar] [CrossRef]
  15. Yahya, M.A.; Al-Qodah, Z.; Ngah, C.Z. Agricultural bio-waste materials as potential sustainable precursors used for activated carbon production: A review. Renew. Sustain. Energy Rev. 2015, 46, 218–235. [Google Scholar] [CrossRef]
  16. Ahmed, M.J. Application of agricultural based activated carbons by microwave and conventional activations for basic dye adsorption. J. Environ. Chem. Eng. 2016, 4, 89–99. [Google Scholar] [CrossRef]
  17. Ao, W.; Fu, J.; Mao, X.; Kang, Q.; Ran, C.; Liu, Y.; Zhang, H.; Gao, Z.; Li, J.; Liu, G. Microwave assisted preparation of activated carbon from biomass: A review. Renew. Sustain. Energy Rev. 2018, 92, 958–979. [Google Scholar] [CrossRef]
  18. Dote, Y.; Sekito, T.; Ueda, K.; Sakamoto, R.; Suzuki, T.; Sano, S. Removal of ammonia from aqueous solution for swine wastewater with swine manure compost-based char. Water Pract. Technol. 2015, 10, 409–414. [Google Scholar] [CrossRef]
  19. Jantarakasem, C.; Kasuga, I.; Kurisu, F.; Furumai, H. Temperature-Dependent Ammonium Removal Capacity of Biological Activated Carbon Used in a Full-Scale Drinking Water Treatment Plant. Environ. Sci. Technol. 2020, 54, 13257–13263. [Google Scholar] [CrossRef] [PubMed]
  20. Ternero-Hidalgo, J.J.; Rosas, J.M.; Palomo, J.; Valero-Romero, M.J.; Rodríguez-Mirasol, J.; Cordero, T. Functionalization of activated carbons by HNO3 treatment: Influence of phosphorus surface groups. Carbon 2016, 101, 409–419. [Google Scholar] [CrossRef]
  21. De Souza, L.K.; Wickramaratne, N.P.; Ello, A.S.; Costa, M.J.; da Costa, C.E.; Jaroniec, M. Enhancement of CO2 adsorption on phenolic resin-based mesoporous carbons by KOH activation. Carbon 2013, 65, 334–340. [Google Scholar] [CrossRef]
  22. Thommes, M.; Kaneko, K.; Neimark, A.V.; Olivier, J.P.; Rodriguez-Reinoso, F.; Rouquerol, J.; Sing, K.S. Physisorption of gases, with special reference to the evaluation of surface area and pore size distribution (IUPAC Technical Report). Pure Appl. Chem. 2015, 87, 1051–1069. [Google Scholar] [CrossRef] [Green Version]
  23. Rasmussen, C.J.; Vishnyakov, A.; Thommes, M.; Smarsly, B.M.; Kleitz, F.; Neimark, A.V. Cavitation in metastable liquid nitrogen confined to nanoscale pores. Langmuir 2010, 26, 10147–10157. [Google Scholar] [CrossRef]
  24. Thommes, M. Physical adsorption characterization of nanoporous materials. Chem. Ing. Tech. 2010, 82, 1059–1073. [Google Scholar] [CrossRef]
  25. Lowell, S.; Shields, J.E. Powder Surface Area and Porosity; Springer Science & Business Media: Berlin, Germany, 2013; Volume 2. [Google Scholar]
  26. Sing, K.S.; Williams, R.T. Physisorption hysteresis loops and the characterization of nanoporous materials. Adsorpt. Sci. Technol. 2004, 22, 773–782. [Google Scholar] [CrossRef]
  27. Chen, R.; Xu, X.; Lu, S.; Zhang, Y.; Lo, S. Pyrolysis study of waste phenolic fibre-reinforced plastic by thermogravimetry/Fourier transform infrared/mass spectrometry analysis. Energy Convers. Manag. 2018, 165, 555–566. [Google Scholar] [CrossRef]
  28. Jiang, H.; Wang, J.; Wu, S.; Yuan, Z.; Hu, Z.; Wu, R.; Liu, Q. The pyrolysis mechanism of phenol formaldehyde resin. Polym. Degrad. Stab. 2012, 97, 1527–1533. [Google Scholar] [CrossRef]
  29. Costa, L.; Di Montelera, L.R.; Camino, G.; Weil, E.; Pearce, E. Structure-charring relationship in phenol-formaldehyde type resins. Polym. Degrad. Stab. 1997, 56, 23–35. [Google Scholar] [CrossRef]
  30. Morterra, C.; Low, M. IR studies of carbons—VII. The pyrolysis of a phenol-formaldehyde resin. Carbon 1985, 23, 525–530. [Google Scholar] [CrossRef]
  31. Summers, R. Alkaline hydrolysis of cured phenol–formaldehyde resins at high temperatures. J. Polym. Sci. Polym. Chem. Ed. 1978, 16, 1669–1682. [Google Scholar] [CrossRef]
  32. Clegg, S.L.; Brimblecombe, P. Solubility of ammonia in pure aqueous and multicomponent solutions. J. Phys. Chem. 1989, 93, 7237–7248. [Google Scholar] [CrossRef]
  33. Zhu, Y.; Kolar, P.; Shah, S.B.; Cheng, J.J.; Lim, P.K. Avocado seed-derived activated carbon for mitigation of aqueous ammonium. Ind. Crop. Prod. 2016, 92, 34–41. [Google Scholar] [CrossRef]
  34. Takaya, C.; Fletcher, L.; Singh, S.; Anyikude, K.; Ross, A. Phosphate and ammonium sorption capacity of biochar and hydrochar from different wastes. Chemosphere 2016, 145, 518–527. [Google Scholar] [CrossRef]
  35. Boopathy, R.; Karthikeyan, S.; Mandal, A.B.; Sekaran, G. Adsorption of ammonium ion by coconut shell-activated carbon from aqueous solution: Kinetic, isotherm, and thermodynamic studies. Environ. Sci. Pollut. Res. 2013, 20, 533–542. [Google Scholar] [CrossRef] [PubMed]
  36. Love, C.; Kolar, P.; Classen, J.; Das, L. Adsorption of ammonia on ozonated activated carbon. Trans. ASABE 2011, 54, 1931–1940. [Google Scholar] [CrossRef]
  37. Mishra, R.R.; Sharma, A.K. Microwave–material interaction phenomena: Heating mechanisms, challenges and opportunities in material processing. Compos. Part A Appl. Sci. Manuf. 2016, 81, 78–97. [Google Scholar] [CrossRef]
  38. Zhekov, S.S.; Franek, O.; Pedersen, G.F. Dielectric Properties of Common Building Materials for Ultrawideband Propagation Studies [Measurements Corner]. IEEE Antennas Propag. Mag. 2020, 62, 72–81. [Google Scholar] [CrossRef]
  39. Kuan, W.H.; Huang, Y.F.; Chang, C.C.; Lo, S.L. Catalytic pyrolysis of sugarcane bagasse by using microwave heating. Bioresour. Technol. 2013, 146, 324–329. [Google Scholar] [CrossRef]
Figure 1. Scanning electron microscope view of the topography of (a) raw phenolic resin waste; activated carbon (AC) impregnated in phosphoric acid and subjected to (b) microwaves (ACP-MW) or (c) electric heating (ACP-EH); AC activated using KOH and subjected to (d) microwaves (ACK-MW) or (e) electric heating (ACK-EH).
Catalysts 11 00783 g001
Figure 2. N2 adsorption–desorption isotherms of prepared activated carbon.
Catalysts 11 00783 g002
Figure 3. Fourier transform infrared spectra of (a) raw resin and (b) AC prepared under various conditions.
Catalysts 11 00783 g003
Figure 4. Ammonium (NH4+) adsorption onto activated carbon (AC) at pH 6.0 ± 0.05 for 24 h. The left Y-axis indicates ammonium adsorption in milligrams of N per gram of AC, and the right Y-axis is the specific surface area of AC. EH: electric heating; MW: microwave radiation.
Catalysts 11 00783 g004
Figure 5. Structural schematic of the phosphate-functionalized activated carbon, which formed a complex with ammonium.
Catalysts 11 00783 g005
Table 1. Specific surface areas and pore volumes of prepared activated carbon.
Specific Surface AreaPore Volume
Atotal *
(m2/g)
Amicro +
(m2/g)
Aexternal #
(m2/g)
Vtotal $
(cm3/g)
Vmicro %
(cm3/g)
Vmeso
(cm3/g)
ACP-MW272243290.170.120.05
ACP-EH5954061890.360.210.16
ACK-MW9247931310.460.410.05
ACK-EH822777460.410.400.01
* total specific surface area, calculated using Brunauer–Emmett–Teller equation; + specific surface area of micropores, calculated using the t-plot method; # external specific surface area of the sample, calculated using the t-plot method; $ total pore volume, determined using the maximum adsorbed volume of N2; % micropore volume, calculated using the t-plot method; mesopore volume, calculated as the difference between Vtotal and Vmicro.
Table 2. Elemental content on activated carbon surface with respective activators.
P Content (%)K Content (%)
ACP-MWACP-EHACK-MWACK-EH
6.081.210.210.20
Table 3. Dielectric properties of phenolic resin waste and waste treated with activators.
Dielectric ParametersRaw Waste ResinResin Activated Using H3PO4Resin Activated Using KOH
ε′ *1.687.762.31
ε″ 0.003.750.14
*: dielectric constant; : dielectric loss.
Table 4. Properties of phenolic resin waste.
Approximate Analysis
(wt %)
Elemental Analysis
(wt% on Dry Basis)
BET Specific Surface Area (m2/g)
moistureashvolatilefixed carbonCHON0.12
2.210.356.331.274.96.016.32.7
Publisher’s Note: MDPI stays neutral with regard to jurisdictional claims in published maps and institutional affiliations.

