Article

Synthesis of Gd2O3 Nanoparticles and Their Photocatalytic Activity for Degradation of Azo Dyes

1
Department of Convergence Science, Graduate School of Sahmyook University, Seoul 01795, Korea
2
Department of Animal Life Resources, Chemistry Major, Sahmyook University, 815 Hwarang-ro, Nowon-gu, Seoul 01795, Korea
3
Department of Chemistry, Sahmyook University, Seoul 01795, Korea
*
Author to whom correspondence should be addressed.
Catalysts 2021, 11(6), 742; https://doi.org/10.3390/catal11060742
Submission received: 29 May 2021 / Revised: 13 June 2021 / Accepted: 14 June 2021 / Published: 17 June 2021
(This article belongs to the Section Environmental Catalysis)

Abstract

:
Gadolinium oxide (Gd2O3) nanoparticles were prepared via the reaction of gadolinium nitrate hexahydrate (Gd (NO3)3·6H2O) and ethylamine (C2H5NH2), and their surface morphology, particle size, and properties were examined by using scanning electron microscopy, X-ray diffraction (XRD), Raman spectroscopy, Fourier transform infrared (FT-IR) spectroscopy, and ultraviolet visible (UV-vis) spectroscopy. The Gd2O3 nanoparticles were used as the photocatalyst for the degradation of various azo dyes, such as methyl orange (MO), acid orange 7 (AO7), and acid yellow 23 (AY23) under irradiation with UV light. The effect of the experimental parameters (initial concentration of azo dyes, dosage of catalyst, and wavelength of UV light) on the photocatalytic properties of the Gd2O3 nanoparticles were investigated. At a constant H2O2 concentration, the photocatalytic degradation efficiency of the Gd2O3 nanoparticles for various azo dyes was in the order: methyl orange > acid orange 7 > acid yellow 23. The kinetics study showed that the photocatalytic degradation of azo dyes was followed by a pseudo first-order reaction rate law.

1. Introduction

The use of a metal oxide semiconductor photocatalyst is a common technique for the degradation of organic pollutants [1,2]. The textile industry generates a lot of wastewater, which contains a lot of dyes. Many contaminants in the ecosystem have been problematic due to their stable chemical structure, posing various teratogenic, carcinogenic, and mutagenic risks [3]. As a result, wastewater purification has always received a lot of interest in the scientific field. The combined advanced oxidation process (AOP), which includes heterogeneous photocatalysis and hydrogen peroxide, provides the synergistic effect for degradation of organic dyes in wastewater [3,4,5,6,7]. The dye degradation mechanism of the AOP involves the generation of hydroxyl radicals (·OH) and superoxide anion radicals (·O2) [8,9,10]. Their radicals are unstable and can attack organic pollutants to make harmless products.
Lanthanide compounds have been used in photocatalysis, owing to their unique f-electronic configuration and bandgap energy. Rare earth elements have half-filled 4f-shells with unpaired electrons and often exhibit an empty 5d shell. They are used in a wide range of applications, such as fluorescent materials, high-resolution X-ray medical imaging, ultraviolet (UV) detectors, catalysts, and dopants [11,12,13,14,15,16]. Owing to its high chemical stability, UV absorption, and active photon-to-electron conversion, gadolinium oxide (Gd2O3) is widely used as an n-type semiconductor photocatalyst [12,17,18].
Recently, several papers have been reported on photocatalytic degradation by using lanthanide oxide nanoparticles [11,12,15,16]. However, there are still insufficient studies available on the degradation of lanthanide oxide nanoparticles of organic pollutants.
Gd2O3 nanoparticles can be used for the photocatalytic degradation of organic pollutants and wastewater treatment, and, due to their high photocatalytic activity, they are also used as an additional oxidizing agent along with other agents, such as hydrogen peroxide [19,20,21].
In Gd2O3, the electrons in the valence band move to the conduction band under UV irradiation [22]. Gadolinium oxide nanoparticles effectively produce free radicals and their recombination with holes is avoided because of the presence of half-filled 4f orbitals and an empty 5d shell, which often serve as trapping centers to prevent the combination of carriers [23]. The ·OH radicals generated in water under UV irradiation are responsible for the degradation of azo dyes [19]. The unique 4f orbitals/electrons of rare earth compounds have magnetic, electrical, optical, phosphorus, and catalytic properties [17,24].
AOPs are based on the combination of strong oxidants with a catalyst and radiation; the addition of hydrogen peroxide increases the rate [25]. The photocatalytic degradation efficiency of organic dyes may be enhanced in combination with H2O2 and Gd2O3 nanoparticles under UV irradiation. ln this study, we carried out photocatalytic degradation of various organic dyes, such as methyl orange (MO), acid orange 7 (AO7), and acid yellow 23 (AY23) under different conditions using the Gd2O3 nanoparticles.

2. Results

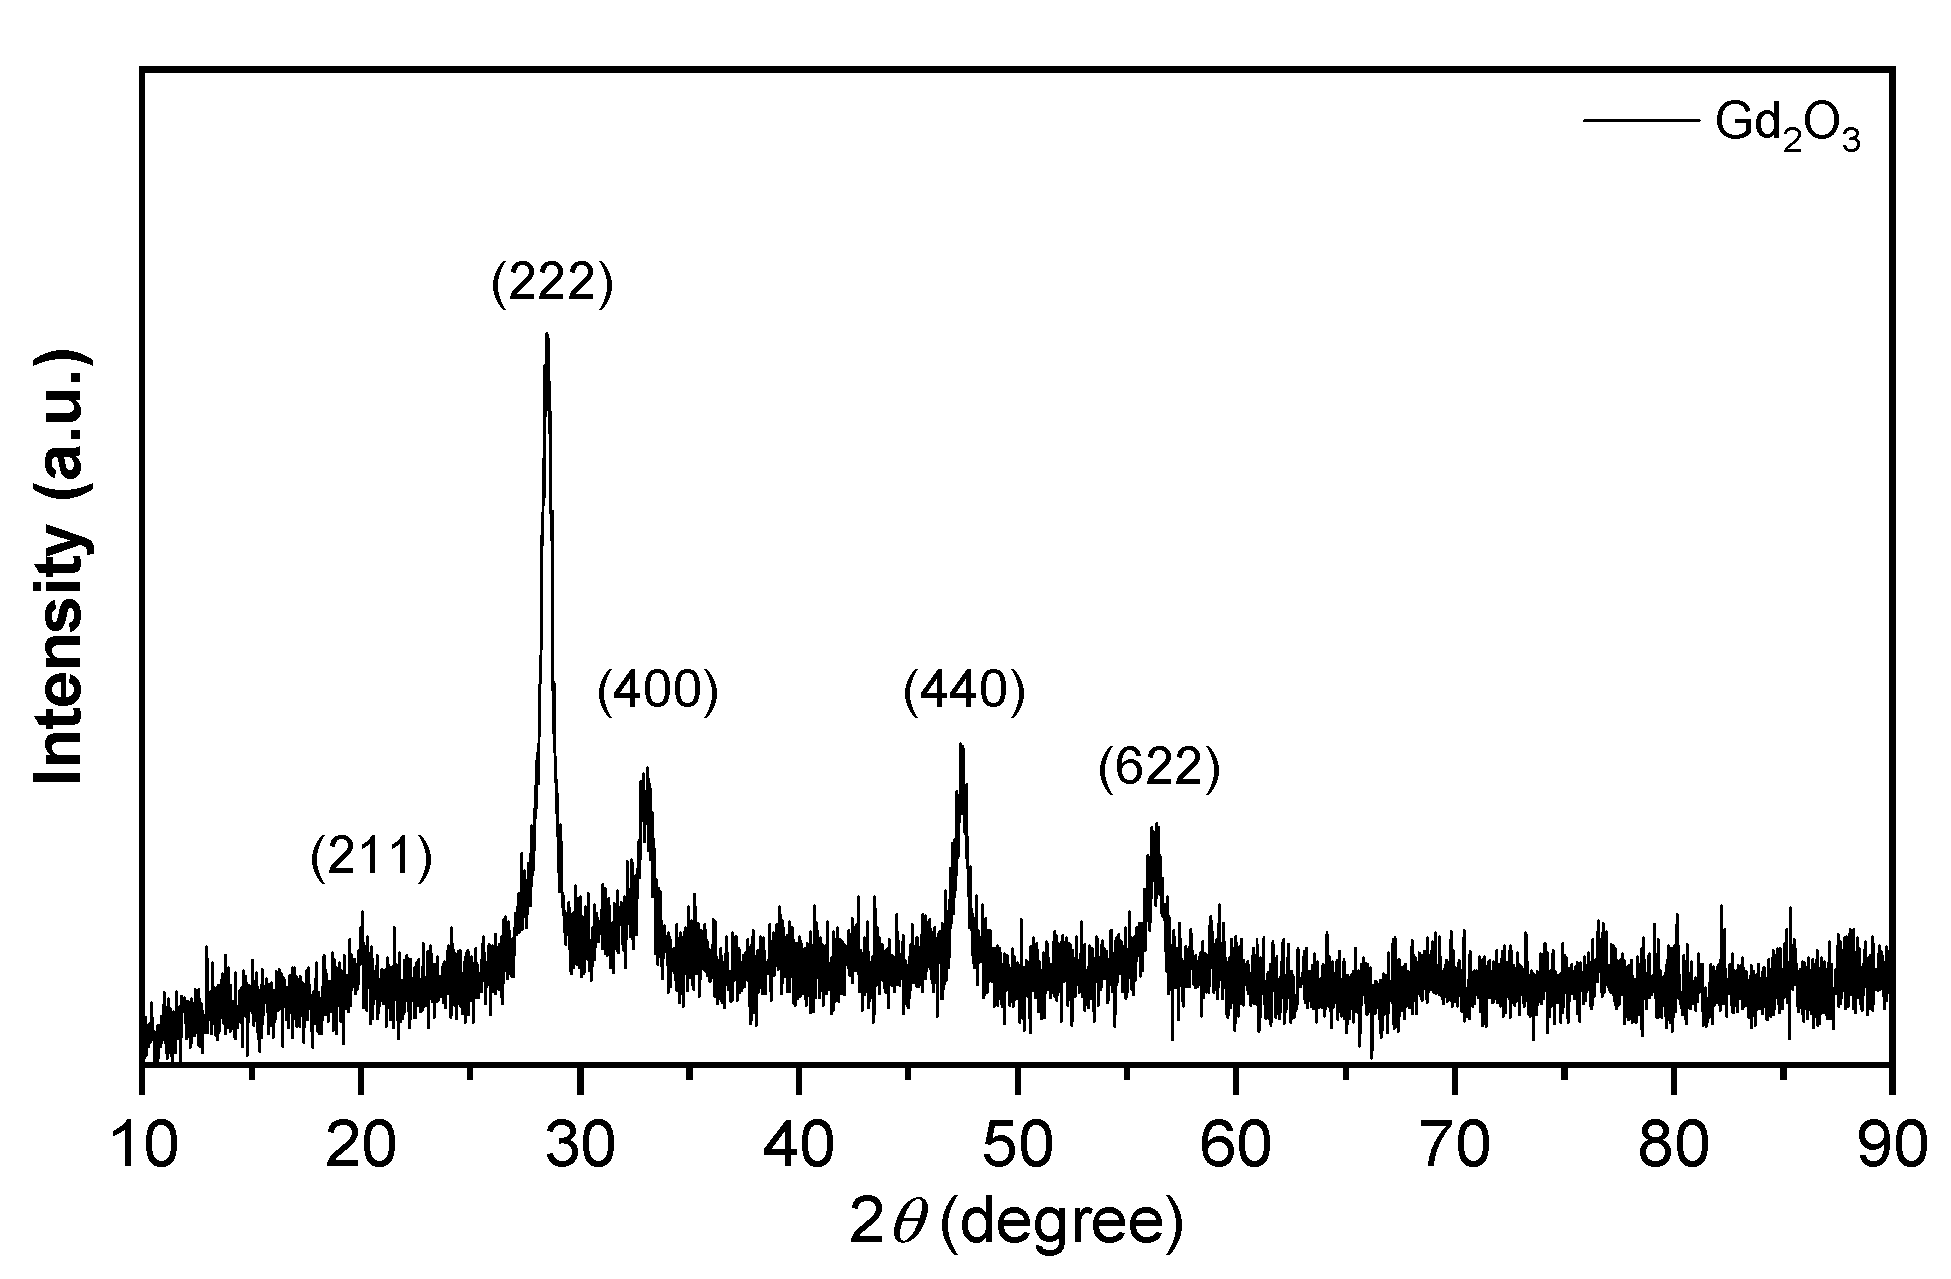
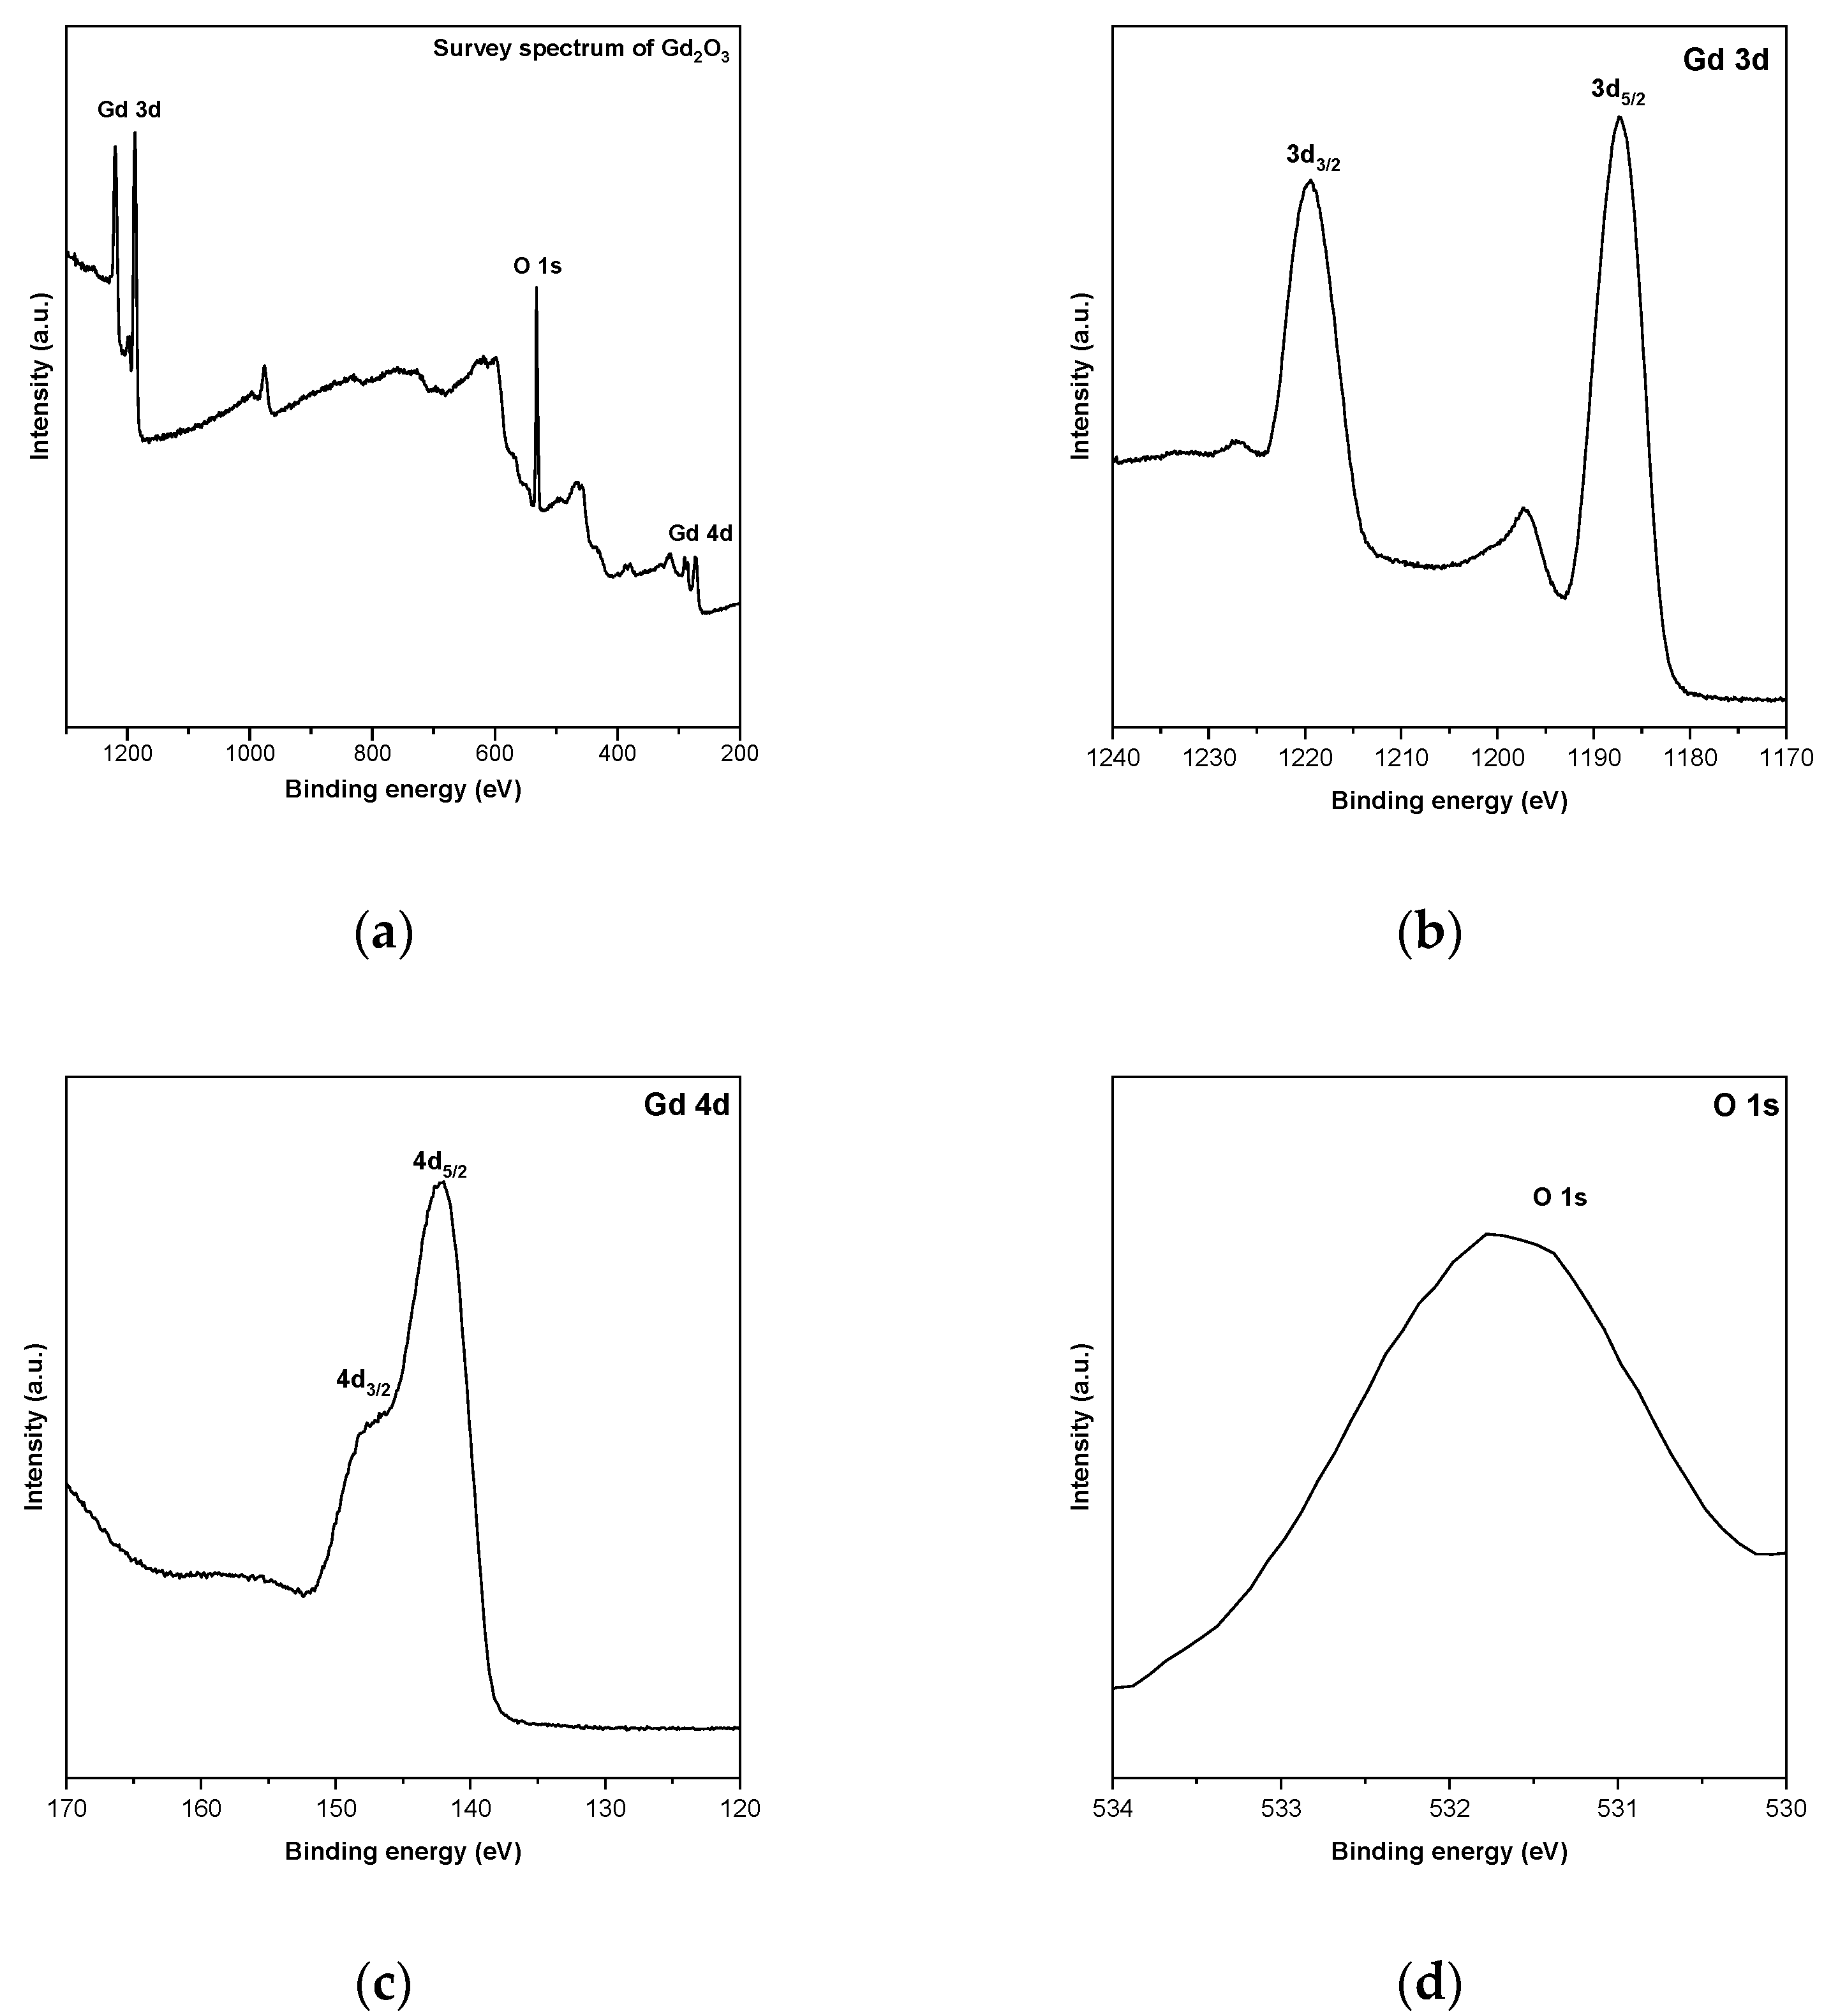
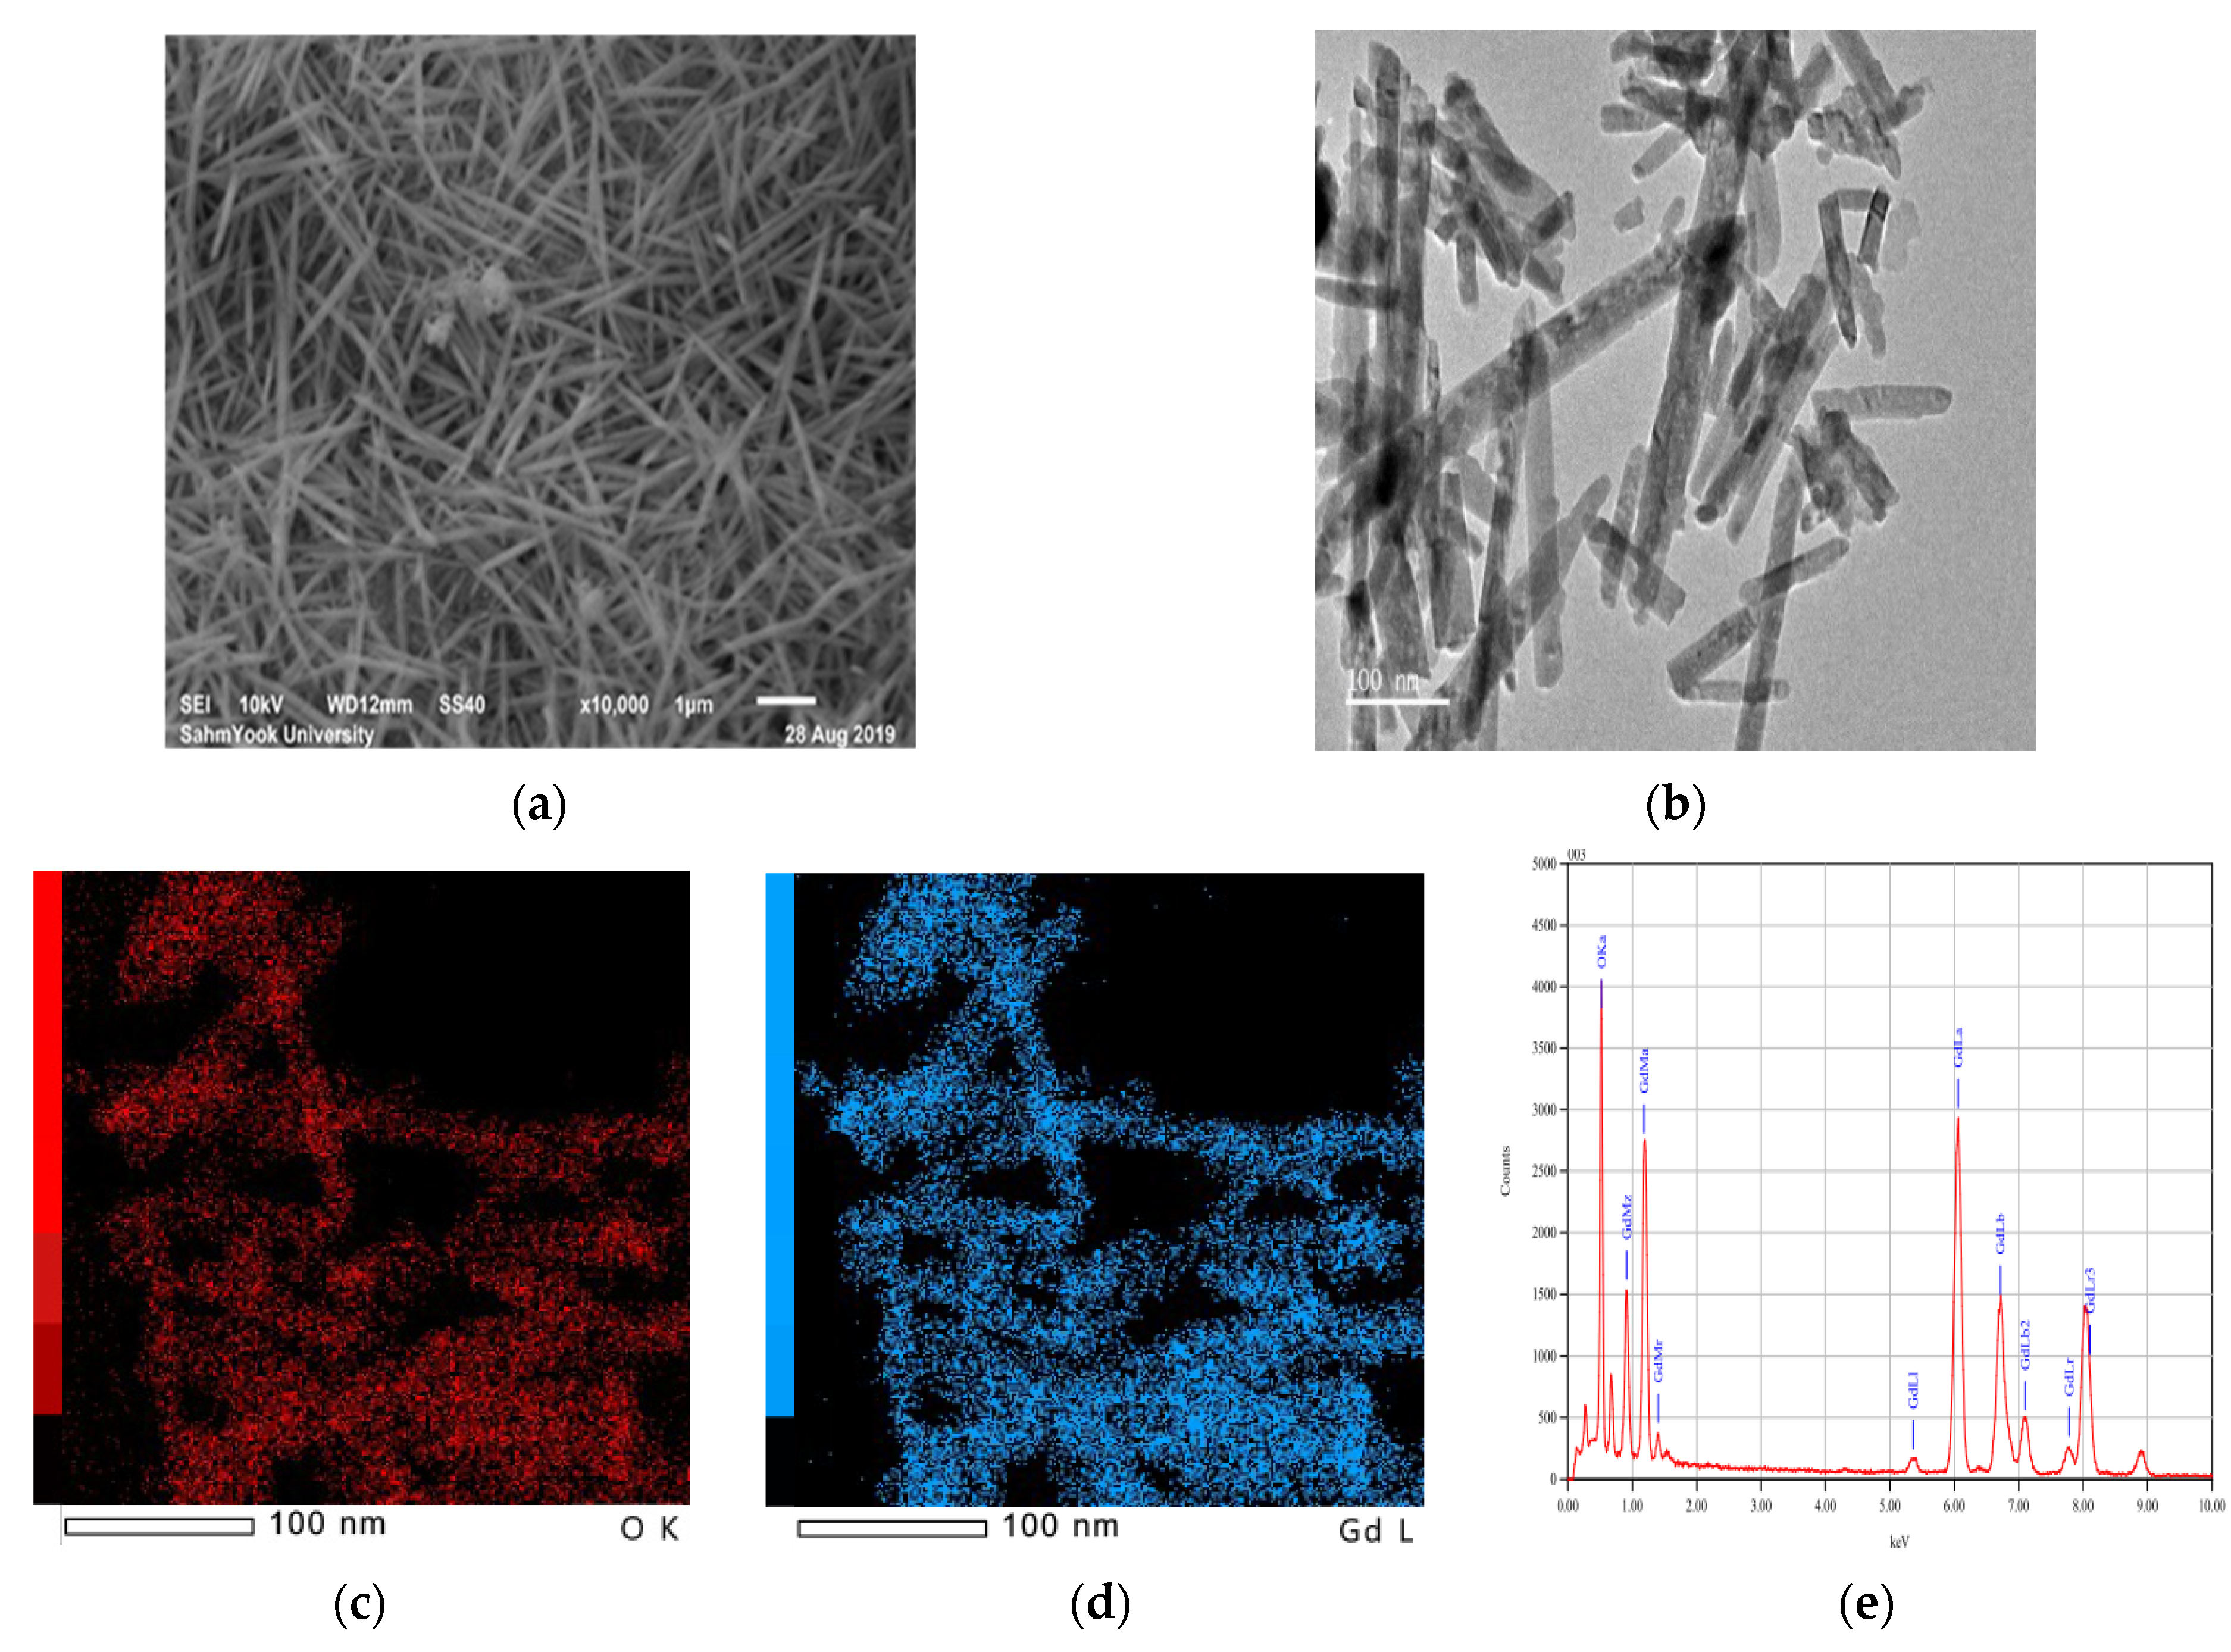
2.1. Characterization of Gd2O3 Nanoparticles

For Gd2O3, the XRD peaks observed at 2θ = 28.64° correspond to the (222) plane of the cubic phase (JCPDS 3-065-3181) [24], and those at 2θ = 20.14°, 33.16°, 47.64°, and 56.53° correspond to the (211), (400), (440), and (622) planes, respectively, of the hexagonal phase (Figure 1). The size of the synthesized Gd2O3 nanoparticles was calculated using the Scherrer formula:
D = K λ β c o s θ
where D is the size of the crystallites, K is the Scherrer constant, λ is the X-ray wavelength, β is the full width at half maximum (in radians) of the XRD peak, and θ is the Bragg angle. The average crystallite size of the Gd2O3 nanoparticles was calculated to be 13.7 nm [24].
XPS analysis determined the surface elemental composition and their ionic states. Figure 2a depicts the appearance of Gd 3d, Gd 4d, and O 1s elements of the Gd2O3 nanoparticles in the XPS survey spectrum. The binding energy at 1187.9 and 1219.3 eV corresponds to the Gd 3d5/2 and Gd 3d3/2, respectively, in Figure 2b [12,18]. Figure 2c demonstrates that the binding energy at 142.2 eV and 147.8 eV were ascribed to the Gd 4d5/2 and Gd 4d3/2 spin-orbits, respectively. As for Figure 2d, the O 1s peak in the Gd2O3 nanoparticles displayed the binding energy at 531.7 eV [19].
The SEM image of Gd2O3 in Figure 3a have a pine needle-like shape. The TEM image of Gd2O3 in Figure 3b shows a rod shape with the length of 100−900 nm. Additionally, in Figure 3c,d, the elemental compositions of the synthesized compounds were determined by EDX mapping/elemental analysis. According to the EDX spectrum, the Gd2O3 nanoparticles contained a gadolinium atom (Gd) of 34.31%, and an oxygen atom (O) of 65.69%, as shown in Figure 3e [15,19].
The vibrational modes of Gd2O3 nanoparticles were observed by Raman spectroscopy in Figure 4a. In the Raman spectrum, three peaks were observed: two at 313 and 443 cm−1, corresponding to the Fg + Eg modes and the Fg mode, respectively, and most importantly, the prominent peak at 358 cm−1 is assigned to the Fg + Ag modes, which mainly corresponds to the cubic phase of the Gd2O3 nanoparticles [26].
The Gd2O3 nanoparticles were investigated by FT-IR spectroscopy. The Gd2O3 nanoparticles show the characteristic peak at 547 cm−1 due to the banding vibration of Gd-O in the FT-IR spectroscopy in Figure 4b [23,24].
The absorbance peak of the Gd2O3 nanoparticles was observed at 228 nm in UV-vis spectroscopy [27]. The optical bandgap energy (Eg) was estimated by the method proposed by Tauc [17]. The optical band gap of Gd2O3 is determined by the following equation:
α h ν = A [ h ν E g ] k
where α is absorption coefficient, h is Plank constant, ν is light frequency, A is a characteristic constant of the semiconductor, Eg is the apparent optical band gap of the material, and k is a constant associated with electronic transition types (for direct allowed transition: k = 1/2, for direct forbidden transitions: k =2/3, for indirect allowed transition: k =2, and for indirect forbidden transitions: k = 3). According to the literature [23,27], gadolinium oxide nanoparticles were characterized by a direct allowed electronic transition, so k = 1/2 was used. The value of Eg was evaluated by extrapolating the linear portion of the curve in Figure 5b. This was found to be 5.04 eV for the Gd2O3 nanoparticles.
When aqueous solutions of azo dyes were irradiated by UV light without adding a catalyst, the azo dye degradation process was very slow. The addition of the Gd2O3 nanoparticles, i.e., the catalyst, accelerated the azo dye degradation process.
The aqueous solution of MO containing the H2O2 and Gd2O3 nanoparticles showed an absorbance peak at 480 nm (Figure 6a). During the photocatalytic degradation reaction, no other absorbance peak was observed. The absorbance peak in the visible region faded away after UV irradiation at 254 nm for 100 min. The absorption peak appeared at 480 nm, and the intensity of this peak decreased with UV light irradiation. With time, this peak shifted to a lower absorbance in the visible region. The MO showed a degradation of 79.68% (Figure S1c) and 26.62% (Figure S1a) in the presence and absence of the catalyst, respectively.
The absorbance peak of AO7 appeared at 485 nm (Figure 6b). After 100 min of UV irradiation in the absence of the catalyst, only 6.11% (Figure S2a) of the AO7 dye was degraded. On the other hand, a 79.92% (Figure S2c) degradation was achieved in the presence of the Gd2O3 catalyst.
AY23 showed an absorption peak at 428 nm (Figure 6c). The AY23 was the active site for an oxidative attack. The AY23 showed a degradation of 59.14% (Figure S3c) and 3.81% (Figure S3a) in the presence and absence of Gd2O3 catalyst, respectively.
The adsorption of H2O2 onto Gd2O3 particles can modify their surface [28,29,30]. The dye adsorption capacity on metal oxides is an important parameter for surface reactions; it depends on the surface area and other surface-related parameters, such as the surface density, pore size distribution, and morphology of the particle surface. If the adsorption of dye molecules increases, the rate of photocatalytic degradation increases. The photocatalytic degradation efficiency of semiconductor oxides under UV irradiation is related to the electronic band structure of the semiconductor.
The histograms of photocatalytic degradation efficiency (MO, AO7, AY23) under various conditions (UV/H2O2, H2O2/Gd2O3, UV/H2O2/Gd2O3, and UV/Gd2O3 for 100 min) are shown in Figure 7. It can be observed from the spectra that the Gd2O3 nanoparticles accelerated the degradation of the azo dyes. The photocatalytic degradation efficiency was the highest when both Gd2O3 and H2O2 were used under UV irradiation conditions.
The photocatalytic degradation efficiency of azo dyes using Gd2O3 is calculated by the following equation:
Photocatalytic   degradation   efficiency   ( % ) = ( C 0 C t ) C 0   ×   100
where C0 is the concentration of azo dye at the adsorption-desorption equilibrium in the dark (t = 0) and Ct is the concentration of azo dye at reaction time t (min).

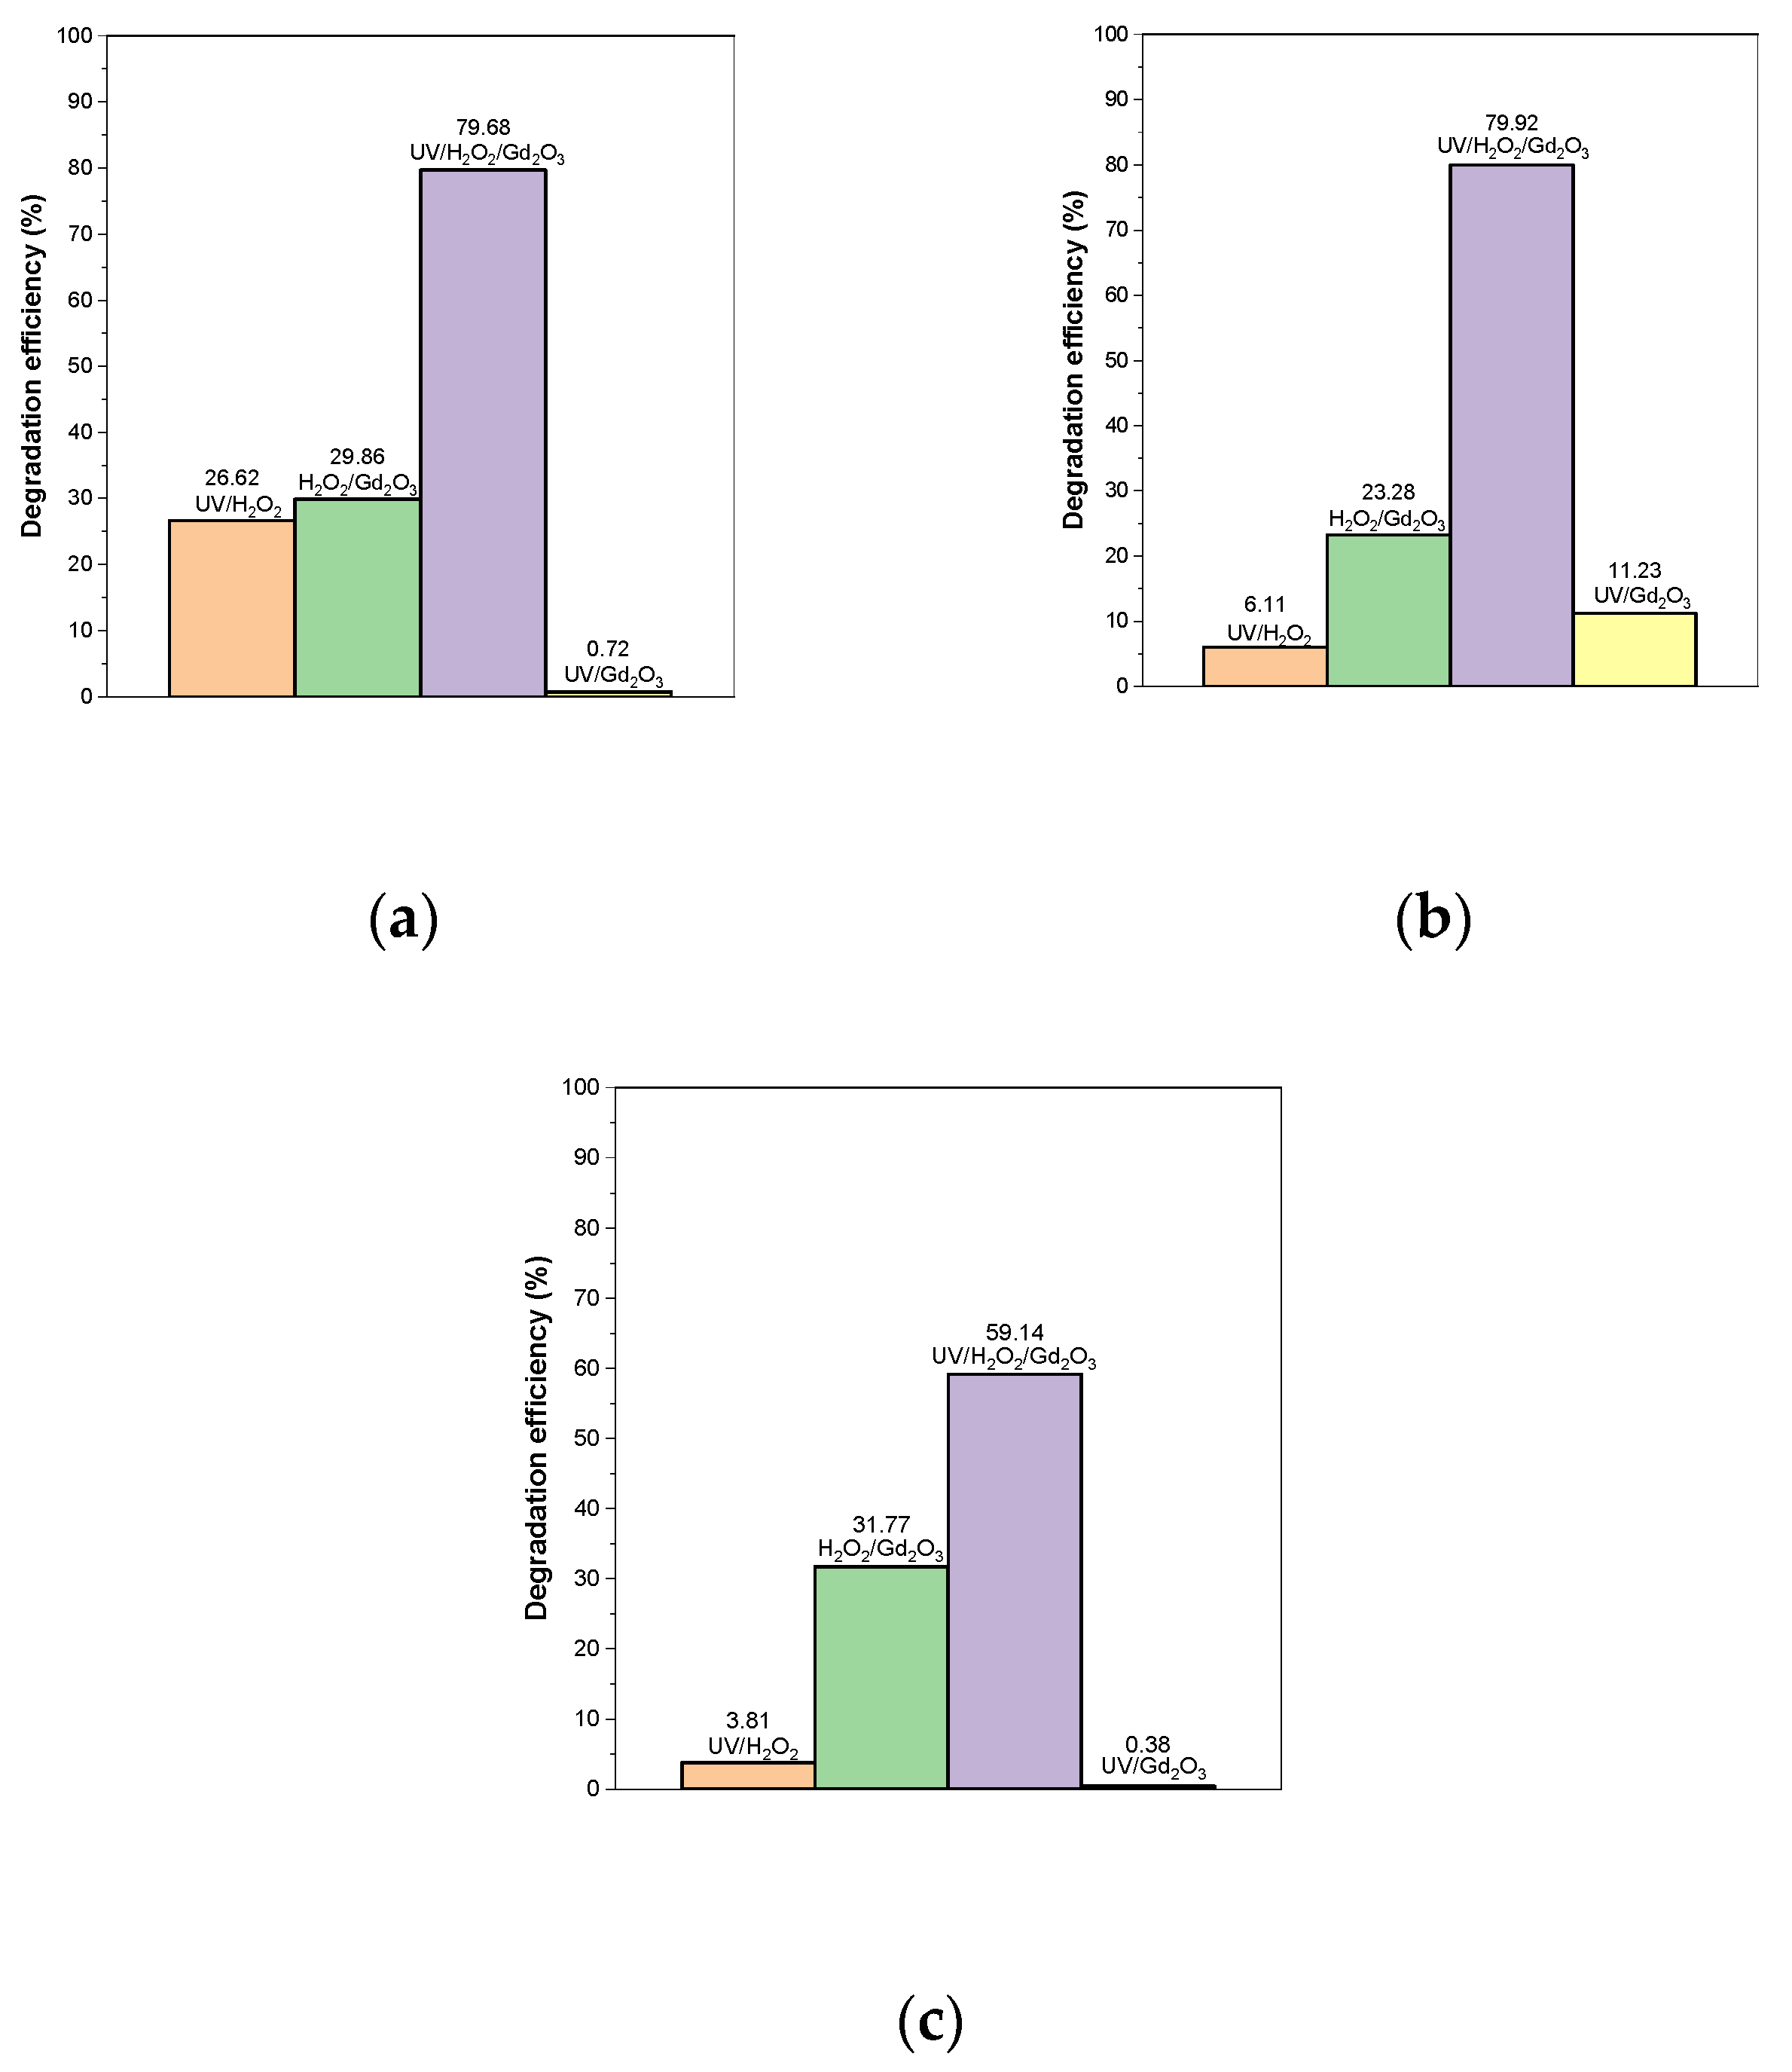
2.2. Mechanism of Photocatalytic Degradation of Azo Dyes by Gd2O3 Nanoparticles

Upon UV irradiation, the electrons in the valence band of the catalyst moved into the conduction band. This resulted in the continuous generation of holes (h+) in the valence band and electrons (e) in the conduction band. The generation of electron-hole pairs contributed to the activity of the photocatalyst. The holes with a high oxidative ability can oxidize OH to ·OH radicals. The holes in the valence band and electrons in the conduction band were generated and combined with a hydroxide ion and oxygen to generate ·OH and ·O2− radicals. The photocatalytic degradation of the organic dyes occurred on the surface of the catalyst. The ·OH and ·O2 radicals act as oxidizing agents for azo dye molecules [19].
The azo dye degradation mechanism under the UV/H2O2/Gd2O3 condition is as follows (Figure 8) [12,15,19]:
Gd 2 O 3 + h ν     e cb + h vb +
H 2 O 2 + h ν     2 · OH
O2 + Gd2O3(ecb) → ·O2
H2O2 + Gd2O3(ecb) → ·OH + OH
Gd2O3(hvb+) + (H2O) → ·OH + H
O2 + H2O2 → ·OH + OH + O2
Azo dye + ·OH → Products of photocatalytic degradation
The synergetic behavior is understandable considering the electron-capturing role of the hydrogen peroxide as an external electron hole recombined with the gadolinium oxide surface. However, it can also improve the hydroxyl radical introduction in the reaction [6,31].

2.3. Kinetics Study for Photocatalytic Degradation of Azo Dyes

In a first-order reaction, the rate ( ν ) of the reaction
c[A] → products (A is reactant: azo dye)
the rate is expressed as follows:
ν = d C d t = k t
where c is the concentration of reactant A, k is the first-order rate constant, and t is time. The rate depends on the concentration of the reactant A present at time, t. In photocatalytic degradation of azo dyes, the integrated form of rate Equation (12) may be written as in Equation (16). Separating variables of Equation (12) and taking an integral calculus,
ν = 1 C d C = k t
ln C = k t + Integration   constant
The value of the integration constant is determined when time is zero (t = 0) of the following expression:
ln C 0 = Integration   constant   ( at   t   =   0 )
Therefore, by Equations (14) and (15), we can obtain Equation (16) [32].
ln C C 0 = k t
where C0 is the concentration of the reactant (azo dye) at an initial time, t = 0, C is the concentration of the reactant (azo dye) at a specific time t, and k is the first-order rate constant [33]. The linear behavior of the curves confirms that the photocatalytic degradation of azo dyes, which were MO, AO7, and AY23, followed a pseudo first-order reaction rate law. As it can be observed from Figure 9, the values of R2 (coefficient of determination) for the pseudo first-order reaction kinetics were (a) 0.99888, (b) 0.99867, (c) 0.99555.

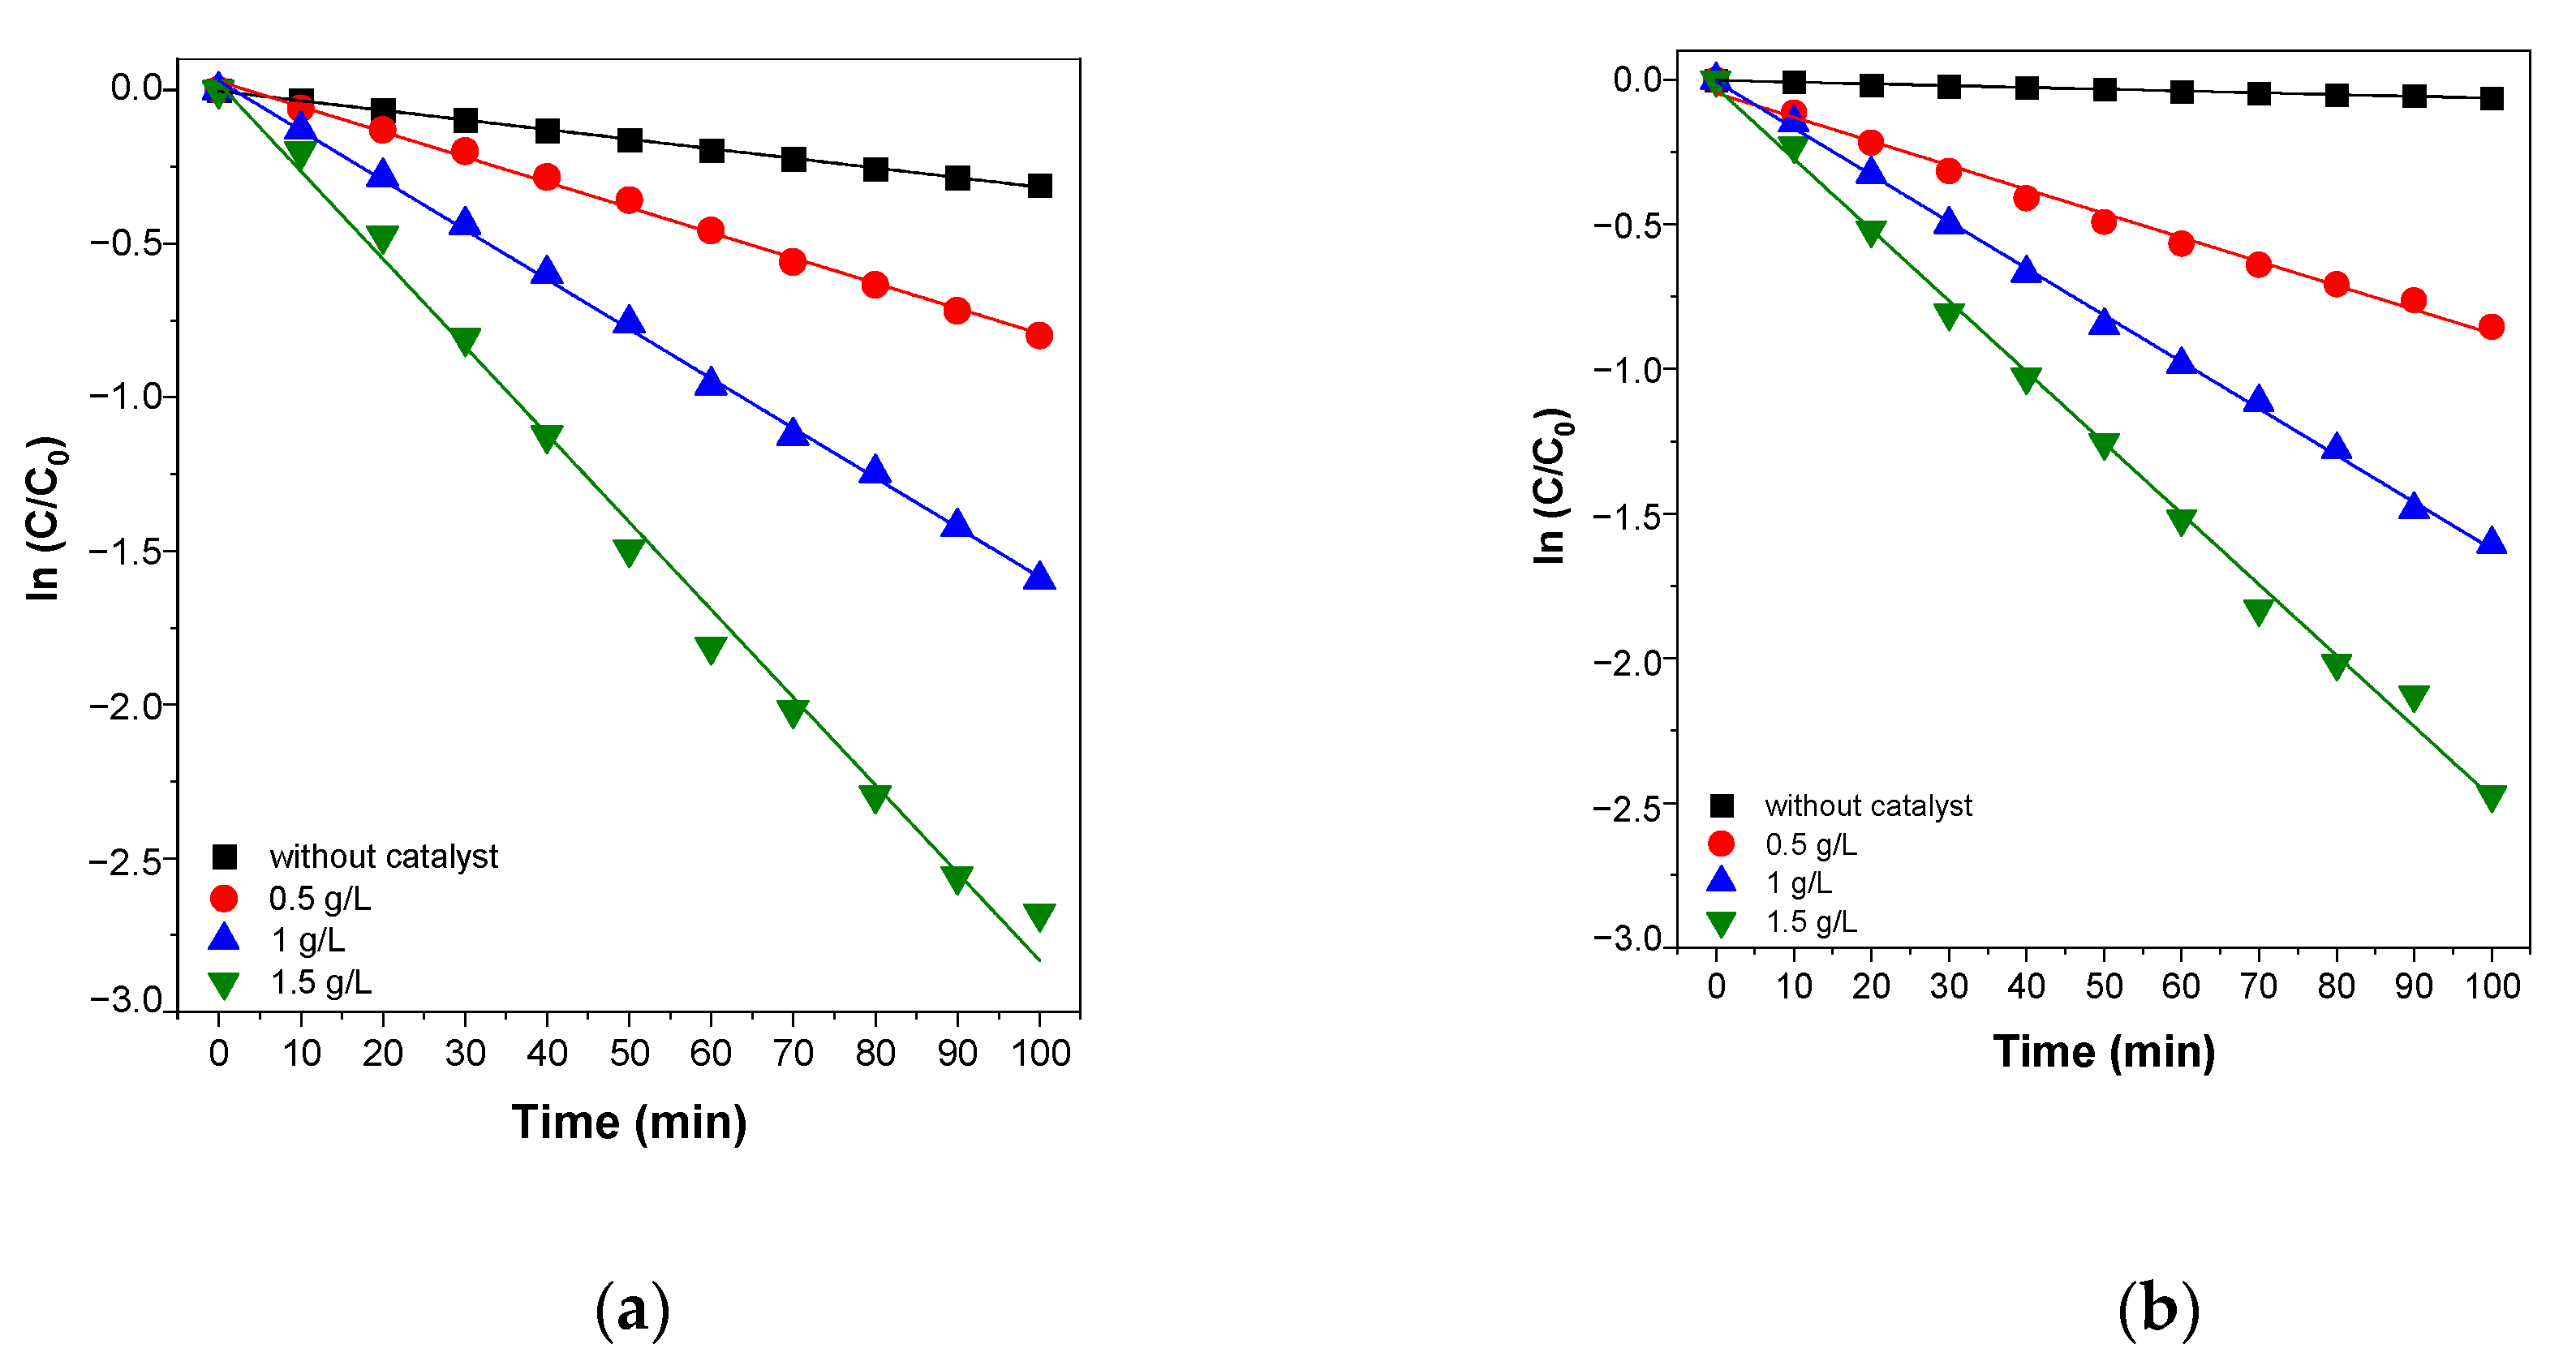
2.4. Effect of Gd2O3 Nanoparticle Dose for Photocatalytic Degradation of Azo Dyes

The effect of the Gd2O3 dose on the photocatalytic degradation of azo dyes was investigated. An increase in the dose of the catalyst increased the photocatalytic efficiency and generated a large number of electron-hole pairs. A large number of hydroxyl radicals were available for azo dye degradation. Under the same conditions, the photocatalytic degradation of MO by Gd2O3 nanoparticles improved the reaction rate constant from −0.00379 to −0.02855 min−1 by increasing the catalyst dose from 0 to 1.5 g/L after a 100 min degradation reaction. Under the same conditions, the photocatalytic degradation of AO7 by Gd2O3 nanoparticles improved the reaction rate constant from −0.00060 to −0.02454 min−1 by increasing the catalyst dose from 0 to 1.5 g/L after a 100 min degradation reaction. The photocatalytic degradation of AY23 by Gd2O3 nanoparticles improved the reaction rate constant from −0.00030 to −0.03712 min−1 by increasing the catalyst dose from 0 to 1.5 g/L after a 100 min degradation reaction. The photocatalytic degradation rate and removal% of the aqueous azo dye solution increased when the catalyst dose also increased. Under the same conditions, the degradation rate of azo dyes increased when the adsorption of the dye molecules on the catalyst surface was increased (Figure 10, Table 1).

2.5. Effect of Initial Dye Concentration on the Photocatalytic Degradation of Azo Dyes

The effect of the initial azo dye concentration on the photocatalytic degradation of azo dyes was investigated. The photocatalytic degradation experiments were carried out at different azo dye concentrations and at a constant H2O2 concentration. The initial azo dye concentration varied from 0.042 to 0.126 mM. At high initial dye concentrations, the path length of the photons entering the solution decreased and the number of ·OH radicals generated in the solution also decreased (Figure 11, Table 2).

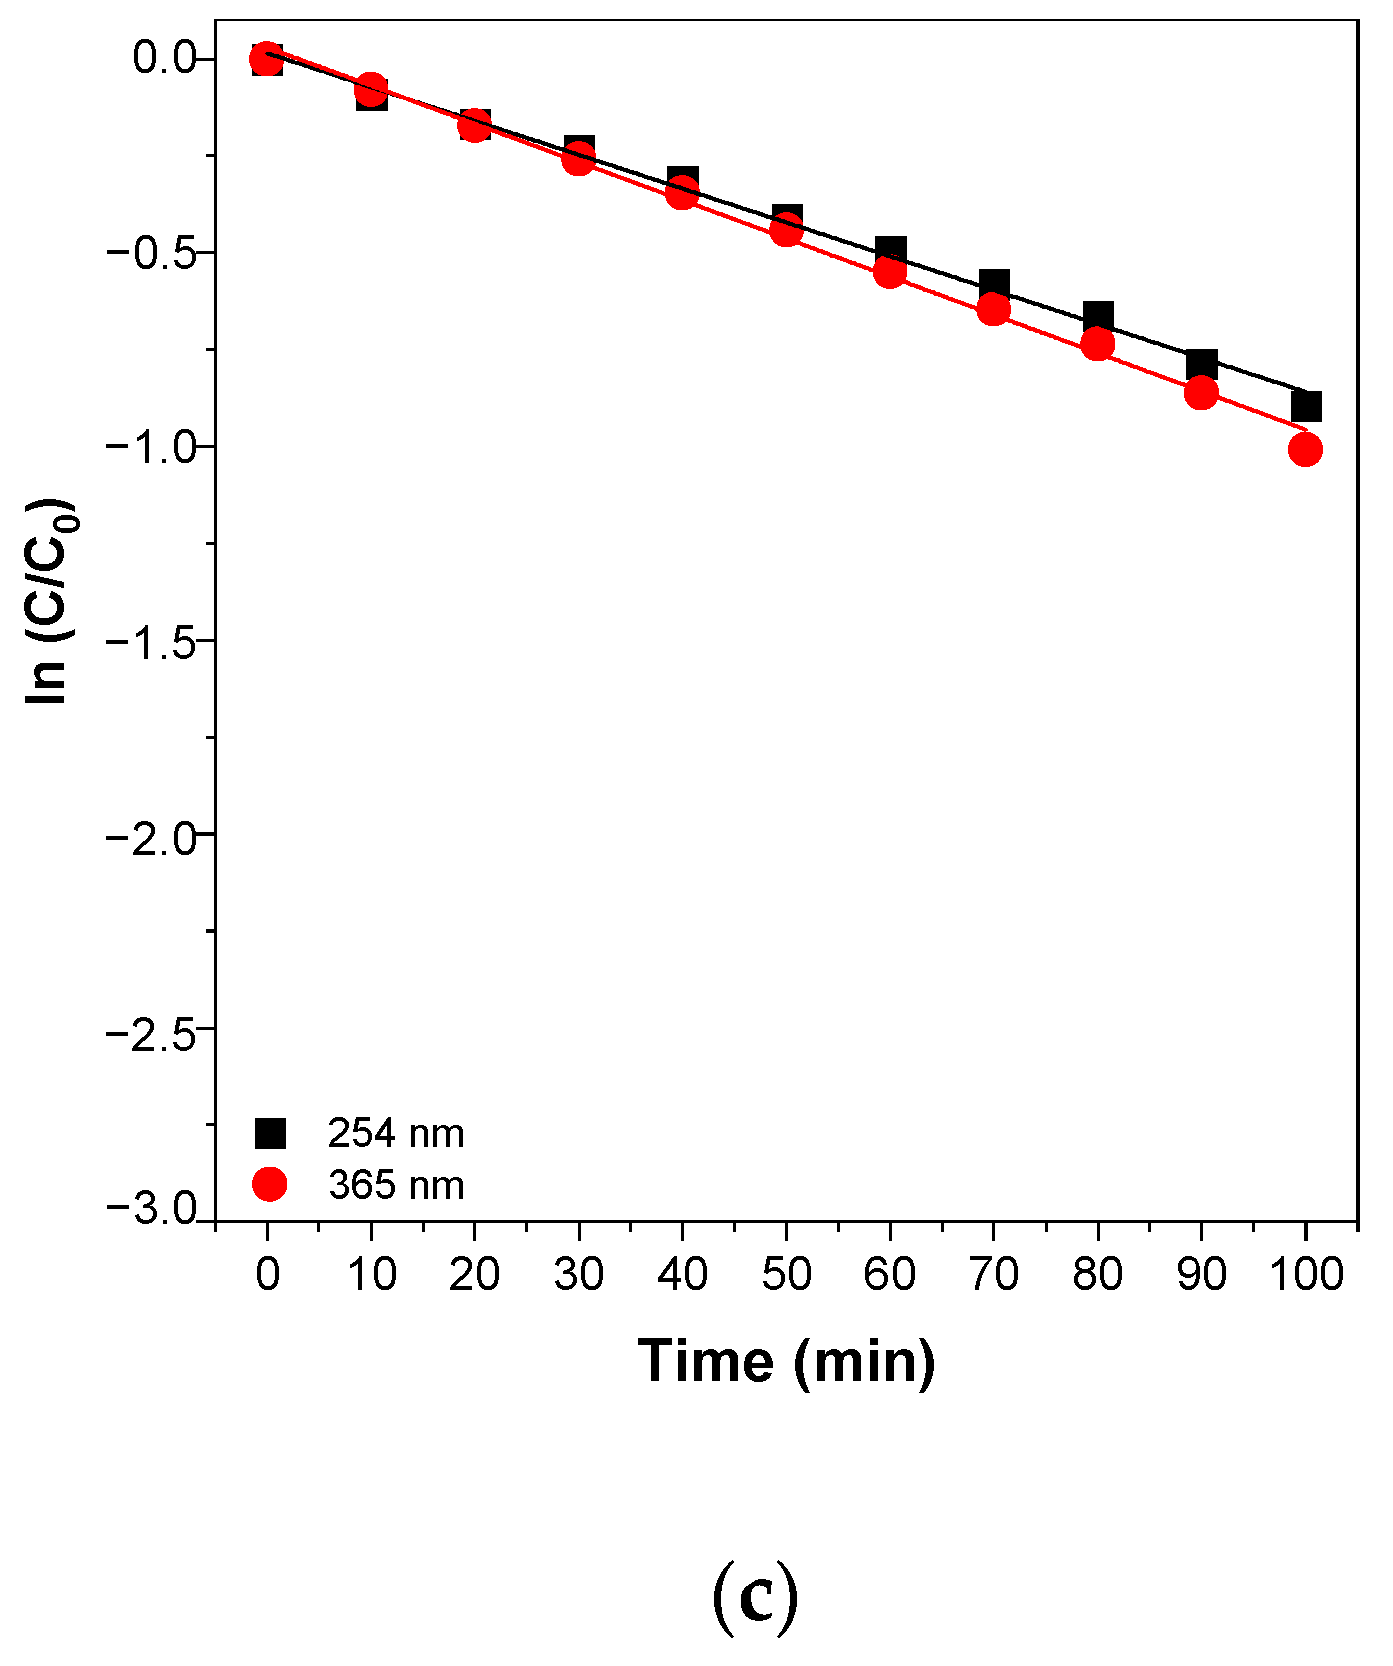
2.6. Effect of UV Light Wavelength on Azo Dye for Photocatalytic Degradation

In the presence of the Gd2O3 photocatalyst, UV irradiation at 365 nm (UV-A) caused higher degradation of the azo dyes than that at 254 nm (UV-C) with reduced energy consumption. For the same amount of photocatalyst, the photocatalytic degradation efficiency of MO, AO7, and AY23 obtained with UV-A radiation was higher than that obtained with UV-C [25,34,35]. This can be attributed to the higher generation rate of ·OH radicals and, consequently, the higher reaction rates at 365 nm [36]. UV-A photons penetrate much deeper into the solution and degrade a large number of dye molecules on the surface of Gd2O3 [37]. It was found that the percentage of absorbance for UV light increased significantly in the UV-A and visible regions, which favored the photocatalytic performance of the catalyst (Figure 12, Table 3) [38].

2.7. Reusability of Gd2O3 Nanoperticles as Photocatalyst for Degradation of MO

The recyclability of the photocatalyst is a significant factor in its industrial application [39,40]. The recyclability of the Gd2O3 nanoparticles was studied by repeating the experiment five times for the photocatalytic degradation of MO solution (Figure 13). The recyclability of the Gd2O3 photocatalyst demonstrates a little decrease in the photodegradation of MO dye solution for each cycle, but no apparent Gd2O3 photocatalyst deactivation after five cycles [2,18]. This is because, after the photocatalytic degradation of MO dye, the photocatalyst was rinsed with distilled water, but a little bit of the MO dye remained on the photocatalyst’s surface. As a result, the reusability of photocatalyst efficiency for the MO dye degradation was reduced, as shown in Figure 13.

3. Materials and Methods

3.1. Materials

Methyl orange (MO), acid orange 7 (AO7), acid yellow 23 (AY23), gadolinium nitrate hexahydrate (Gd(NO3)3·6H2O), ethylamine (C2H5NH2), and hydrogen peroxide (H2O2, 30%, w/w) were purchased from YAKURI PURE CHEMICAL, Tokyo, Japan), Sigma-Aldrich (St. Louis, MO, USA), Merck (KGaA, Darmstadt, Germany), and DAEJUNG CHEMICALS (Siheung, Korea). All of the chemicals were used as received, without further purification.

3.2. Methods

The photocatalytic degradation of the azo dyes was carried out using a UV lamp (4 W, 254 nm; 4 W, 365 nm) and was confirmed by ultraviolet-visible (UV-Vis) spectroscopy (Shimazu UV-1601 PC, Tokyo, Japan). The morphology of the catalyst was observed by using scanning electron microscopy (SEM, JEOL Ltd., JSM-6510, Tokyo, Japan) at an acceleration voltage of 10 kV. The vibrational state of the catalyst was investigated by Raman spectroscopy at 532 nm wavelength (BWTEK i-Raman Plus, Newark, DE, USA). Fourier-transform infrared (FT-IR) spectroscopy (Thermo Scientific Nicolet iS10, Madison, WI USA) was used to obtain information on the functional groups in the catalyst. The surface elemental composition and their ionic states was analyzed using X-ray photoelectron spectroscopy (XPS) (NEXSA, Thermo Fisher Scientific USA). The crystal structures and average crystallite size of the catalysts were analyzed using powder XRD (Bruker, D8 Advance, Karlsruhe, Germany). The morphology and elemental composition of the catalyst were measured using a transmission electron microscope (TEM) (NEO ARM, JEOL, Japan) with energy dispersive X-ray spectroscopy (EDX), respectively.

3.2.1. Synthesis of Gd2O3 Nanoparticles

The Gd2O3 nanoparticles were synthesized using the following hydrothermal procedure. First, 0.5 mL of C2H5NH2 was added slowly to a beaker containing an aqueous solution of 0.08 M Gd(NO3)3·6H2O under a vigorous stirring solution. The white precipitate solution obtained was heated at 120 °C for 12 h in an oven. The resulting mixture solution was centrifuged several times and then washed with deionized water to obtain gadolinium hydroxide, which was dried at 80 °C in an oven. Gd(OH)3 was annealed in an electric furnace at 700 °C for 4 h in an Ar atmosphere to obtain Gd2O3 [24].

3.2.2. Photocatalytic Activity of Gd2O3 Nanoparticles for Degradation of Azo Dyes Such as MO, AO7, and AY23

Stock dye solutions were prepared using 2 mM of the azo dye powders. Next, 0.5 g/L of Gd2O3 was used for the photocatalytic degradation of each 0.042–0.126 mM azo dye aqueous solution containing H2O2. The pH of the dye solutions was fixed at 5.5.
The solution was stirred with a magnetic bar for 30 min in the absence of light to attain an adsorption-desorption equilibrium between the dye molecules and the catalyst.
The photocatalytic degradation process was monitored by using UV-vis spectroscopy. Equation (3) was used to calculate the percentage of photocatalytic degradation of azo dyes. Additionally, the reaction kinetics and factors affecting the photocatalytic degradation of azo dyes were examined.

3.2.3. Photocatalytic Activity of Degradation of Azo Dyes Uner UV Irradiation at 254 nm and 365 nm

The photocatalytic degradation of MO, AO7, and AY23 by Gd2O3 nanoparticles was carried out in aqueous dye solutions under UV irradiation at 254 nm and 365 nm. The initial concentration of azo dye solutions was 0.042 mM and the initial H2O2 concentration was 4.8 M. The Gd2O3 nanoparticles were added to the azo dye solutions, which were irradiated with UV light (output power: 4 W–254 nm, 4 W–365 nm) for 10, 20, 30, and 100 min.

3.2.4. Reusability of Gd2O3 Nanoperticles as Photocatalyst for Degradation of MO

The photocatalytic degradation of MO with Gd2O3 nanoparticles was performed by repeating the experiments five times. The photocatalytic experiment was carried out under the following conditions: a 0.042 mM initial MO concentration; a 4.8 M H2O2 concentration; a 1.0 g/L photocatalyst dose; and a 100 min reaction time. After the photocatalytic degradation of MO using the Gd2O3 nanoparticles as a catalyst, the photocatalyst of the Gd2O3 nanoparticles was separated from the reaction mixture by centrifugation, washed with distilled water, and dried in an oven. Experiments on recycling were also carried out under the same conditions. To compensate for the catalyst loss during the washing process, a constant amount of catalyst concentration was maintained in each cycle test, and numerous degradation tests were conducted simultaneously at each recycle test, resulting in adequate catalysts being collected.

4. Conclusions

Under UV light irradiation, photocatalytic degradation of azo dyes such as MO, AO7, and AY23 was conducted in aqueous solutions with the Gd2O3 nanoparticles and H2O2. The generation of ·OH and ·O2 radicals, which can oxidize the azo dye molecules, causes photocatalytic degradation of the azo dyes on the catalyst surface. The degradation rate of the azo dyes increased when the initial dye concentration decreased and when the catalyst dose increased. For the degradation of azo dyes, the photocatalytic effectiveness of the Gd2O3 nanoparticles declined in the following order: MO > AO7 > AY23. The photocatalytic degradation of the azo dye solutions under UV irradiation at 365 nm was higher than that under UV irradiation at 254 nm and was found to follow the pseudo first-order reaction rate law. The photocatalytic degradation of azo dye aqueous solutions was increased by increasing the UV irradiation time. More hydroxyl radicals are generated when Gd2O3/H2O2/UV light is combined, which improves the photocatalytic degradation of azo dyes. The reusability results demonstrate a small decrease in photocatalytic degradation of the azo dye solution for each cycle, with no apparent decrease in photocatalytic degradation after five cycles, demonstrating the stability of the Gd2O3 nanoparticles.

Supplementary Materials

The following are available online at https://www.mdpi.com/article/10.3390/catal11060742/s1, Figure S1: UV-vis absorption spectra of photocatalytic degradation of the MO dye (a) UV/H2O2 (b) H2O2/Gd2O3 (c) UV/H2O2/Gd2O3 (d) UV/Gd2O3 methods within the time period of 100 min. (Experimental conditions: initial dye concentration 0.042 mM; wavelength of UV irradiation: 254 nm; H2O2 concentration: 500 mM; photocatalyst concentration: 1.0 g/L.), Figure S2: UV-vis absorption spectra of photocatalytic degradation of the AO7 dye (a) UV/H2O2 (b) H2O2/Gd2O3 (c) UV/H2O2/Gd2O3 (d) UV/Gd2O3 methods within the time period of 100 min. (Experimental conditions: initial dye concentration 0.042 mM; wavelength of UV irradiation: 254 nm; H2O2 concentration: 500 mM; photocatalyst concentration: 1.0 g/L.), Figure S3: UV-vis absorption spectra of photocatalytic degradation of the AY23 dye (a) UV/H2O2 (b) H2O2/Gd2O3 (c) UV/H2O2/Gd2O3 (d) UV/Gd2O3 methods within the time period of 100 min. (Experimental conditions: initial dye concentration 0.042 mM; wavelength of UV irradiation: 254 nm; H2O2 concentration: 500 mM; photocatalyst concentration: 1.0 g/L.), Figure S4: UV-vis absorption spectra of the (a) MO, (b) AO7, (c) AY23 under 254 nm irradiation and (d) MO, (e) AO7, (f) AY23 under 365 nm irradiation within the time period of 100 min. (Experimental conditions: initial dye concentration 0.042 mM.) Figure S5: UV-vis absorption spectra of photocatalytic degradation of the (a) MO, (b) AO7, (c) AY23 by UV/H2O2 methods under 254 nm irradiation and (d) MO, (e) AO7, (f) AY23 under 365 nm irradiation within the time period of 100 min. (Experimental conditions: initial dye concentration 0.042 mM; H2O2 concentration: 4.8 M)

Author Contributions

Conceptualization, W.-B.K.; methodology, S.J., J.-W.K.; writing—original draft preparation, S.J., J.-W.K.; writing—review and editing, W.-B.K. All authors have read and agreed to the published version of the manuscript.

Funding

This research was supported by research foundation of Sahmyook University.

Data Availability Statement

In the data presented in this study are available in article.

Conflicts of Interest

The author declare that they have no conflict of interest.

References

  1. Saravanan, T.; Anandan, P.; Shanmugam, M.; Jayakumari, T.; Arivanandhan, M.; Azhagurajan, M.; Hayakawa, Y.; Jayavel, R. Impact of graphene on the enhancement of electrochemical and photocatalytic performance of Gd2O3-Graphene nanocomposites. Solid State Sci. 2018, 83, 171–180. [Google Scholar] [CrossRef]
  2. Karthikeyan, C.; Arunachalam, P.; Ramachandran, K.; Al-Mayouf, A.M.; Karuppuchamy, S. Recent advances in semiconductor metal oxides with enhanced methods for solar photocatalytic applications. J. Alloys Compd. 2020, 828, 154281–154295. [Google Scholar] [CrossRef]
  3. Liu, H.; Wang, C.; Wang, G. Photocatalytic advanced oxidation processes for water treatment: Recent advances and perspective. Chem. Asian J. 2020, 15, 3239–3253. [Google Scholar] [CrossRef] [PubMed]
  4. O’Shea, K.E.; Dionysiou, D.D. Advanced oxidation processes for water treatment. J. Phys. Chem. Lett. 2012, 3, 2112–2113. [Google Scholar] [CrossRef]
  5. Mu, M.; Gu, B.S.; Liu, Y.Y.; Yang, P.Y.; Zhang, Q.F.; Zhao, H.Q. Photocatalytic degradation of Methyl Orange by H2O2 Cooperated with Graphene Oxide Under Visible Light Irradiation. DEStech Trans. Environ. Energy Earth Sci. 2018. [Google Scholar] [CrossRef]
  6. Marandi, R.; Mahanpoor, K.; Sharif, A.A.M.; Olya, A.E.; Moradi, R. Photocatalytic degradation of azo dye acid yellow 23 in water using NiFe2O4 nanoparticles supported on clinoptilolite as a catalyst in a circulating fluidized bed reactor. J. Basic Appl. Sci. Res. 2013, 3, 347–357. [Google Scholar]
  7. Ghoreishian, S.M.; Badii, K.; Norouzi, M.; Rashidi, A.; Montazer, M.; Sadeghi, M.; Vafaee, M. Decolorization and mineralization of an azo reactive dye using loaded nano-photocatalysts on spacer fabric: Kinetic study and operational factors. J. Taiwan Inst. Chem. Eng. 2014, 45, 2436–2446. [Google Scholar] [CrossRef]
  8. Tijani, J.O.; Fatoba, O.O.; Madzivire, G.; Petrik, L.F. A review of combined advanced oxidation technologies for the removal of organic pollutants from water. Water Air Soil Pollut. 2014, 225, 2102. [Google Scholar] [CrossRef] [Green Version]
  9. Kansal, S.K.; Sood, S.; Umar, A.; Mehta, S.K. Photocatalytic degradation of Eriochrome Black T dye using well-crystalline anatase TiO2 nanoparticles. J. Alloys Compd. 2013, 581, 392–397. [Google Scholar] [CrossRef]
  10. Cuerda-Correa, E.M.; Alexandre-Franco, M.F.; Fernandez-Gonzalez, C. Advanced Oxidation Process for the removal of Antibiotics from Water. An Overview. Water 2020, 12, 102. [Google Scholar] [CrossRef] [Green Version]
  11. Lu, D.; Fang, P.; Ding, J.; Yang, M.; Cao, Y.; Zhou, Y.; Peng, K.; Kondamareddy, K.K.; Liu, M. Two-dimensional TiO2-based nanosheets co-modified by surface-enriched carbon dots and Gd2O3 nanoparticles for efficient visible-light-driven photocatalysis. Appl. Surf. Sci. 2017, 396, 185–201. [Google Scholar] [CrossRef]
  12. Surendra, T.V.; Roopan, S.M.; Khan, M.R. Biogenic approach to synthesize rod shaped Gd2O3 nanoparticles and its optimization using response surface methodology-Box–Behnken design model. Biotechnol. Prog. 2019, 35, 2823–2834. [Google Scholar] [CrossRef]
  13. Mekuria, S.L.; Debele, T.A.; Tsai, H.C. Encapsulation of gadolinium oxide nanoparticle (Gd2O3) contrasting agents in PAMAM dendrimer templates for enhanced magnetic resonance imaging in vivo. ACS Appl. Mater. Interfaces 2017, 9, 6782–6795. [Google Scholar] [CrossRef] [PubMed]
  14. Chávez, D.H.; Contreras, O.E.; Hirata, G.A. Synthesis and Upconversion Luminescence of Nanoparticles Y2O3 and Gd2O3 Co-doped with Yb3+ and Er3+. Nanomater. Nanotechnol. 2016, 6, 7–16. [Google Scholar] [CrossRef] [Green Version]
  15. Eprasatya, A.; Yulizar, Y.; Yunarti, R.T.; Apriandanu, D.O.B. Fabrication of Gd2O3 nanoparticles in hexane-water system using Myristica fragrans Houtt leaves extract and their photodegradation activity of malachite green. Mater. Sci. Eng. 2020, 902, 012004. [Google Scholar] [CrossRef]
  16. He, Y.W.; Wang, Q.; Yan, X.; He, L.Q.; Zhang, G.Q.; Li, X.L. Ultrafast degradation of common organic dyes in presence of gadolinium oxide/graphene oxide in water. Fuller. Nanotub. Carbon Nanostr. 2019, 27, 478–481. [Google Scholar] [CrossRef]
  17. Almeida, M.S.D.; Santos, M.A.B.D.; Gonçalves, R.D.F.; Santos, M.R.D.C.; Marques, A.P.D.A.; Longo, E.; La Porta, F.D.A.; Pinatti, I.M.; Silva, M.D.P.; Godinho, M.J. Novel Gd(OH)3, GdOOH and Gd2O3 Nanorods: Microwave-Assisted Hydrothermal Synthesis and Optical Properties. Mater. Res. 2016, 19, 1155–1161. [Google Scholar] [CrossRef] [Green Version]
  18. Majeed, S.; Shivashankar, S.A. Rapid, microwave-assisted synthesis of Gd2O3 and Eu: Gd2O3 nanocrystals: Characterization, magnetic, optical and biological studies. J. Mater. Chem. B 2014, 2, 5585–5593. [Google Scholar] [CrossRef]
  19. Dhanalakshmi, S.; Kumar, P.S.; Karuthapandian, S.; Muthuraj, V.; Prithivikumaran, N. Design of Gd2O3 nanorods: A challenging photocatalyst for the degradation of neurotoxicity chloramphenicol drug. J. Mater. Sci. Mater. Electron. 2019, 30, 3744–3752. [Google Scholar] [CrossRef]
  20. Freyria, F.S.; Compagnoni, M.; Ditaranto, N.; Rossetti, I.; Piumetti, M.; Ramis, G.; Bonelli, B. Pure and Fe-doped mesoporous titania catalyse the oxidation of acid orange 7 by H2O2 under different illumination conditions: Fe doping improves photocatalytic activity under simulated solar light. Catalysts 2017, 7, 213. [Google Scholar] [CrossRef]
  21. Zhang, Q.; Li, C.; Li, T. Rapid photocatalytic decolorization of methylene blue using high photon flux UV/TiO2/H2O2 process. Chem. Eng. J. 2013, 217, 407–413. [Google Scholar] [CrossRef]
  22. Wu, D.; Li, C.; Zhang, D.; Wang, L.; Zhang, X.; Shi, Z.; Lin, Q. Enhanced photocatalytic activity of Gd3+ doped TiO2 and Gd2O3 modified TiO2 prepared via ball milling method. J. Rare Earths 2019, 37, 845–852. [Google Scholar] [CrossRef]
  23. Jiang, X.; Yu, L.; Yao, C.; Zhang, F.; Zhang, J.; Li, C. Synthesis and characterization of Gd2O3 hollow microspheres using a template-directed method. Materials 2016, 9, 323. [Google Scholar] [CrossRef]
  24. Kang, J.G.; Min, B.K.; Sohn, Y. Synthesis and characterization of Gd(OH)3 and Gd2O3 nanorods. Ceram. Int. 2015, 41, 1243–1248. [Google Scholar] [CrossRef]
  25. Pablos, C.; Marugán, J.; Grieken, R.V.; Serrano, E. Emerging micropollutant oxidation during disinfection processes using UV-C, UV-C/H2O2, UV-A/TiO2 and UV-A/TiO2/H2O2. Water Res. 2013, 47, 1237–1245. [Google Scholar] [CrossRef]
  26. Hazarika, S.; Paul, N.; Mohanta, D. Rapid hydrothermal route to synthesize cubic-phase gadolinium oxide nanorods. Bull. Mater. Sci. 2014, 37, 789–796. [Google Scholar] [CrossRef] [Green Version]
  27. Chen, F.; Zhang, X.H.; Hu, X.D.; Zhang, W.; Zeng, R.; Liu, P.D.; Zhang, H.Q. Synthesis and characteristics of nanorods of gadolinium hydroxide and gadolinium oxide. J. Alloys Compd. 2016, 664, 311–316. [Google Scholar] [CrossRef]
  28. Sakthivel, S.; Neppolian, B.; Shankar, M.V.; Arabindoo, B.; Palanichamy, M.; Murugesan, V. Solar photocatalytic degradation of azo dye: Comparison of photocatalytic efficiency of ZnO and TiO2. Sol. Energy Mater. Sol. Cells 2003, 77, 65–82. [Google Scholar] [CrossRef]
  29. Ahmed, S.; Rasul, M.G.; Brown, R.; Hashib, M.A. Influence of parameters on the heterogeneous photocatalytic degradation of pesticides and phenolic contaminants in wastewater: A short review. J. Environ. Manag. 2011, 92, 311–330. [Google Scholar] [CrossRef] [PubMed] [Green Version]
  30. Alahiane, S.; Sennaoui, A.; Sakr, F.; Qourzal, S.; Dinne, M.; Assabbane, A. A study of the photocatalytic degradation of the textile dye Reactive Yellow 17 in aqueous solution by TiO2-coated non-woven fibres in a batch photoreactor. J. Mater. Environ. Sci. 2017, 8, 3556–3563. [Google Scholar]
  31. Soleymani, A.R.; Chahardoli, R.; Kaykhaii, M. Development of UV/H2O2/TiO2–LECA hybrid process based on operating cost: Application of an effective fixed bed photo-catalytic recycled reactor. J. Ind. Eng. Chem. 2016, 44, 90–98. [Google Scholar] [CrossRef]
  32. Romanias, M.N.; Zein, A.E.; Bedjanian, Y. Heterogeneous interaction of H2O2 with TiO2 surface under dark and UV light irradiation conditions. J. Phys. Chem. A 2012, 116, 8191–8200. [Google Scholar] [CrossRef] [PubMed]
  33. Singh, N.K.; Saha, S.; Pal, A. Methyl red degradation under UV illumination and catalytic action of commercial ZnO: A parametric study. Desalin. Water. Treat. 2015, 56, 1066–1076. [Google Scholar] [CrossRef]
  34. Gupta, V.K.; Saravanan, R.; Agarwal, S.; Gracia, F.; Khan, M.M.; Qin, J.; Mangalaraja, R.V. Degradation of azo dyes under different wavelengths of UV light with chitosan-SnO2 nanocomposites. J. Mol. Liq. 2017, 232, 423–430. [Google Scholar] [CrossRef]
  35. Akyol, A.; Bayramoğlu, M. The degradation of an azo dye in a batch slurry photocatalytic reactor. Chem. Eng. Process. 2008, 47, 2150–2156. [Google Scholar] [CrossRef]
  36. Yatmaz, H.C.; Dizge, N.; Kurt, M.S. Combination of photocatalytic and membrane distillation hybrid processes for reactive dyes treatment. Environ. Technol. 2017, 38, 2743–2751. [Google Scholar] [CrossRef] [PubMed]
  37. Ljubas, D.; Ćurković, L.; Dobrović, S. Photocatalytic Degradation of an azo dye by UV Irradiation at 254 and 365 nm. Trans. FAMENA 2010, 34, 19–28. [Google Scholar]
  38. Lee, K.M.; Lai, C.W.; Ngai, K.S.; Juan, J.C. Recent developments of zinc oxide based photocatalyst in water treatment technology: A review. Water Res. 2016, 88, 428–448. [Google Scholar] [CrossRef]
  39. Kumar, P.S.; Karuthapandian, S.; Umadevi, M.; Elangovan, A.; Muthuraj, V. Light induced synthesis and synergistic effects of Sr/CdSe nanocomposite on the photodegradation of methylene blue dye solution. Mater. Focus 2016, 5, 128–136. [Google Scholar] [CrossRef]
  40. Kumar, P.S.; Prabavathi, S.L.; Indurani, P.; Karuthapandian, S.; Muthuraj, V. Light assisted synthesis of hierarchically structured Cu/CdS nanorods with superior photocatalytic activity, stability and photocatalytic mechanism. Sep. Purif. Technol. 2017, 172, 192–201. [Google Scholar] [CrossRef]
Figure 1. XRD pattern of the synthesized Gd2O3 nanoparticles.
Catalysts 11 00742 g001
Figure 2. XPS spectra of the Gd2O3 nanoparticles (a) full scan survey spectrum, (b) Gd 3d, (c) Gd 4d and (d) O 1s.
Catalysts 11 00742 g002
Figure 3. Morphological analysis (a) SEM images and (b) TEM images of the Gd2O3 nanoparticles. Elemental analysis (c) and (d) EDX mapping composition of the Gd2O3 nanoparticles, (e) EDX spectrum of the Gd2O3 nanoparticles, they are kind of elements such as Gd, O.
Catalysts 11 00742 g003
Figure 4. (a) Raman spectrum and (b) FT-IR spectrum of the Gd2O3 nanoparticles.
Catalysts 11 00742 g004
Figure 5. (a) UV-vis spectrum and (b) Tauc’s plot for the bandgap energy of the Gd2O3 nanoparticles.
Catalysts 11 00742 g005
Figure 6. UV-vis absorption spectra of photocatalytic degradation of the azo dyes (a) MO, (b) AO7, and (c) AY23 by the Gd2O3/H2O2/UV method for 100 min. (Experimental conditions: initial dye concentration: 0.042 mM; photocatalyst concentration: 1.0 g/L; H2O2 concentration: 4.8M; wavelength of UV irradiation: 254 nm).
Catalysts 11 00742 g006aCatalysts 11 00742 g006b
Figure 7. Histograms of photocatalytic degradation efficiency of (a) MO, (b) AO7, and (c) AY23 under different conditions after 100 min. (Experimental conditions: initial dye concentration: 0.042 mM; photocatalyst concentration: 1.0 g/L; H2O2 concentration: 4.8M; wavelength of UV irradiation: 254 nm).
Catalysts 11 00742 g007
Figure 8. Mechanism of photocatalytic degradation of azo dyes by Gd2O3 nanoparticles.
Catalysts 11 00742 g008
Figure 9. Kinetic study of the photocatalytic degradation of the azo dyes (a) MO, (b) AO7, (c) AY23 by the oxidation process. (Experimental conditions: initial dye concentration 0.042 mM; wavelength of UV irradiation: 254 nm; H2O2 concentration: 4.8 M; photocatalyst concentration: 1.0 g/L.).
Catalysts 11 00742 g009aCatalysts 11 00742 g009b
Figure 10. Effect of catalyst dose on the photocatalytic degradation of the azo dyes (a) MO, (b) AO7, and (c) AY23 by Gd2O3 nanoparticles in the presence of H2O2 at pH 5.5. (Experimental conditions: initial dye concentration 0.042 mM; wavelength of UV irradiation: 254 nm; H2O2 concentration: 4.8 M; photocatalyst concentration: 0–1.5 g/L.).
Catalysts 11 00742 g010aCatalysts 11 00742 g010b
Figure 11. Effect of initial dye concentration on the photocatalytic degradation of the azo dyes: (a) MO, (b) AO7, and (c) AY23 by Gd2O3 nanoparticles in the presence of H2O2 at pH 5.5. (Experimental conditions: initial dye concentration 0.042-0.126 mM; wavelength of UV irradiation: 254 nm; H2O2 concentration: 4.8 M; photocatalyst concentration: 1.0 g/L.).
Catalysts 11 00742 g011
Figure 12. The effect of UV radiation wavelength on kinetics of the photocatalytic degradation of the azo dyes: (a) MO, (b) AO7, and (c) AY23 by Gd2O3 nanoparticles in the presence of H2O2 at pH 5.5. (Experimental conditions: initial dye concentration 0.042 mM; wavelength of UV irradiation: 254 nm or 365 nm; H2O2 concentration: 4.8 M; photocatalyst concentration: 1.0 g/L.).
Catalysts 11 00742 g012aCatalysts 11 00742 g012b
Figure 13. Reusability of photocatalytic degradation for MO using Gd2O3 nanoparticles as a catalyst.
Catalysts 11 00742 g013
Table 1. Reaction rate constant (k) and photocatalytic degradation efficiencies (%) of Gd2O3 nanoparticles for the degradation of the azo dyes MO, AO7, AY23 in the presence of H2O2 at different catalyst doses.
Azo DyeDose of Catalyst (g/L)Reaction Rate Constant k (min−1)Photocatalytic Degradation Efficiency (%)
Methyl Orange0−0.0037923.62
0.5−0.0082155.03
1−0.0161579.68
1.5−0.0285593.14
Acid Orange 70−0.000606.11
0.5−0.0083157.48
1−0.0161779.91
1.5−0.0245491.57
Acid Yellow 230−0.000303.81
0.5−0.0022921.11
1−0.0087459.14
1.5−0.0371288.97
Experimental conditions: initial dye concentration 0.042 mM; wavelength of UV irradiation: 254 nm; H2O2 concentration: 4.8 M; photocatalyst concentration: 0–1.5 g/L.
Table 2. Reaction rate constant (k) and photocatalytic degradation efficiencies (%) of Gd2O3 nanoparticles for the degradation of the azo dyes MO, AO7, AY23 in the presence of H2O2 at different initial dye concentrations.
Azo DyeInitial Concentration (mM)Reaction Rate Constant k (min−1)Photocatalytic Degradation Efficiency (%)
Methyl Orange0.042−0.0161579.68
0.084−0.0121469.75
0.126−0.0085457.28
Acid Orange 70.042−0.0161779.91
0.084−0.0137974.14
0.126−0.0108965.56
Acid Yellow 230.042−0.0087459.14
0.084−0.0017616.67
0.126−0.000908.92
Experimental conditions: initial dye concentration 0.042–0.126 mM; wavelength of UV irradiation: 254 nm; H2O2 concentration: 4.8 M; photocatalyst concentration: 1.0 g/L.
Table 3. Reaction rate constant (k) and photocatalytic degradation efficiencies (%) of Gd2O3 nanoparticles for the degradation of the azo dyes MO, AO7, AY23 in the presence of H2O2 at different UV wavelengths.
Azo DyeWavelength of UV Lamp (nm)Reaction Rate Constant k (min−1)Photocatalytic Degradation Efficiency (%)
Methyl Orange254−0.0161579.68
365−0.0242790.9
Acid Orange 7254−0.0161779.91
365−0.0238981.05
Acid Yellow 23254−0.0087459.14
365−0.0098663.49
Experimental conditions: initial dye concentration 0.042 mM; wavelength of UV irradiation: 254 nm or 365 nm; H2O2 concentration: 4.8 M; photocatalyst concentration: 1.0 g/L.
Publisher’s Note: MDPI stays neutral with regard to jurisdictional claims in published maps and institutional affiliations.

